Seismically and geodetically determined nondouble-couple ...
International Journal of Technical Innovation in Modern Engineering
& Science (IJTIMES),(UGC APPROVED)
Impact Factor: 5.22 (SJIF-2017),e-ISSN:2455-2585
"International Conference on Modern Trends in Civil Engineering"(ICMTCE-2019)
(Towards Sustainable Development Goals)
Volume 5, Special Issue 02, Feb.-2019
Organized By: Faculty of Civil Engineering, Shri Ramswaroop Menorial University, Lucknow-Deva Road. 1
SEISMICALLY INDUCED DEFORMATION STRUCTURES AND
LOCATION OF THE ASSOCIATED FAULT OF THE 1993 KILLARI
EARTHQUAKE, SOUTH-CENTRAL INDIA
Balaji Bhosle*1
Shrijib Patra2, Naveen Shukla
3 and Ravi Kumar Saini
4
1 Advanced Geological Consulting Services Private Limited, Pune-411057, Maharashtra, India 2 Consulting Geophysicist, Mulund, Mumbai-400080, Maharashtra, India
3 U P Jal Nigam, Rana Pratap Marg, Lucknow-226001, Uttar Pradesh, India 4 National Institute Hydrology Roorkee, Roorkee-247667, Uttarakhand, India
Abstract: Evidence of earthquake-induced sedimentary structures formed by the devastating 1993 Killari earthquake
has been scarcely documented and studied. The evidence found in the Terna River valley in the form of well-preserved
soft-sediment deformation structures are presented here. The structures include slumps, convoluted bedding, folds,
flame structures, dykes and faults. The structures formed are favoured by the water-saturated state of the sediments
combined with several earthquake shocks.
The structures are studied within the twenty kilometer zone of the identified epicenter of the earthquake because it is
believed through studies that more conspicuous structures will be found in close proximity of the epicenter.
These features are interpreted as having been triggered by the recent series of earthquakes, thus providing a
paleoseismic record of the Terna Fault System. A three dimensional digital elevation model drawn from elevation data
using remote sensing-GIS techniques and two dimensional profiles gives indication of topographic breaks and
location of the inferred fault.
Keywords: Deformation Structure, Faults, 3-D Digital Elevation, GIS modeling
1. INTRODUCTION
The 1993 Killari earthquake is a widely renowned phenomenon throughout the research arena. Research has been carried
out and published concerning the origin of the event (Baumach et al. 1994; Gupta et al. 1998b), the after effects
(Rajendran et al. 1996a; Rajendran et al. 1996b; Jain et al. 1994), and seismic wave modelling (Mishra et al. 1998;
Mukhopadhyay et al. 2002; Srinagesh et al. 2000). Babar et al. 2012 studied the Quaternary sediments and
geomorphology of the Terna River Basin. They also attempted to document some of the soft-sediment deformation
structures related to the earthquake in the Terna River valley along with dating of the sediments. The present paper attempts to locate the inferred fault using remotely sensed data and processing the data using GIS techniques to document
the seismites preserved in the deposits of the Terna River and its tributaries (Fig.1). Since the near-surface sediments
have contrasting granulometric properties (e.g., alternating sands and argillaceous beds interlaminated with clay
horizons), they are thought to have a high preservation potential (Ringrose 1989; Obermeier et al. 1989, 1993; Seth et al.
1990; Alfaro et al. 1997; Alfaro et al. 2002; Rossetti & Santos 2003; Singh & Jain 2007; Fortuin & Dabrio 2008; Perucca
et al. 2009).
In conjunction with the study of sedimentary deposits, remote sensing-GIS studies including but not limited to extracting
data from the area of interest (AOI), geo-referencing both the image and topographic map to the same projection,
drainage digitization from the geo-referenced topographical map, superposing the image, topographic map and drainage
to cross validate and check for accuracy of the data. 2-D profiles created along and across the fault to indicate the
elevation differences, calculate the amount of throw and to check the changes in river morphology in the fault zone. Three dimensional model has been generated to create panoramic view of the area to appreciate the contrast in
geomorphology close to the earthquake epicenter. These types of studies are significant in determining regional
seismicity and syn-depositional tectonic activities in an area once considered tectonically stable. This study includes the
use of remote sensing-GIS techniques, in combination with field studies to identify and characterize soft sediment
deformation, to locate small-scale changes in surface geomorphology as evidence of faults/discontinuities.
2. GEOLOGICAL SETTING
The study area is characterized by undulating topography with small incepted hills acting as water divides. Although the
lithology is uniform throughout the study area, the drainage pattern appears to be structurally controlled. Tributaries join
the trunk streams at high angles especially the tributaries joining Terna at almost right angles (Fig. 2). Geologically it
International Journal of Technical Innovation in Modern Engineering & Science (IJTIMES) “International Conference on Modern Trends in Civil Engineering"(ICMTCE-2019)
(Towards Sustainable Development Goals) Volume 5, Special Issue 02, Feb.-2019
Organized By: Faculty of Civil Engineering, Shri Ramswaroop Menorial University, Lucknow-Deva Road. 2
forms eastern part of Deccan Volcanic Province (DVP) and lies northwest of the Godavari Basin. There are many flows
recognized in DVP (Deshmukh 1988) with thickness varying from 10m to 160m. The trap starts thinning from west to
east and the cover is largest near the coast reaching to more than 2000m while only a few hundred meters (Kaila 1989)
on the eastern fringe. The combined total thickness of flows in the study area is about 100m as envisaged by the local
bore wells drilled for irrigation. The region is characterized by shallow (10-12 km) seismic activities with several pre and
post shocks of intensity approximately 4.0 as compared to the 1993 major shock having an intensity of 6.3 on Richter
scale (Baumbach et al. 1994; Gupta et al. 1998b).
Although the epicenter of the Killari earthquake is close to the inferred fault, the cause of the earthquake by reactivation
of the pre-existing fault is a matter of debate (Rajendran et al. 1996a, b; Seeber et al. 1996). Preliminary studies by
trenching indicated displacement of the soil-rock interface with a reverse sense of throw (Seeber et al. 1996) resulting in
the Killari earthquake. Radiogenic helium emanations observed in the affected area also points to the faulting activity
(Gupta et al. 1998b). Quaternary deformation in the study area is widespread but mainly exposed along the river sections where the sections
are not covered with vegetation. After the earthquake, several secondary effects such as fissures, liquefaction phenomena,
and small scale sedimentary faults were identified in the vicinity of the epicenter (Seeber et al. 1996; Babar et al. 2012;
Rajendran & Rajendran 1999).
3. METHODOLOGY
DEM (digital elevation modeling) is a representation of the terrain elevation as a function of geographic location
(Burrough 1996), and it provides the basic information required to characterize the topographic attributes of the terrain.
In the present study topographical maps (1:25,000 scale) published by Survey of India in the year 1971 were acquired
and geo-referenced to geographic (lat/long) projection system with sixteen ground control points using ERDAS (Earth Resources Data and Analyzing System) IMAGINE 8.5 software. Drainage pattern was digitized in a vector theme and the
file is saved as arc coverage shape file. This theme was later superposed on the DEM image file to cross validate the
surface generated through spot height data using the flicker and/or blend technique available in ERDAS. Elevation data
from the topographical maps was not used to generate the DEM due to the limited number of contour and spot height
data. Initially it was planned to compare the DEM of the study area acquired through the old topographical maps
published before the earthquake with the one published after the earthquake but unfortunately the latter was not available.
Elevation data in the form of TIFF file was acquired from Shuttle Radar Topography Mission (SRTM), 30 Arc Second
scene SRTM_u03_n008e004, Global Land Cover Facility. The SRTM data was acquired by the satellite during 2000 has
a spatial resolution of 90m. The downloaded file was imported in ERDAS, converted to image file and geometric
corrections were applied to align with the geometric attributes of the topographical map. From the larger area DEM, area
of interest was extracted using the subset image option. Spot height data was extracted from the AOI image file and exported in ASCII format. 3-D surface model was generated of the AOI by rubber stretching interpolation technique in
Surfer 8 software. Since the spot heights obtained are irregularly spaced, rubber stretching interpolation technique is
found to be best suited for the current study. This interpolation technique attempts to connect the high points in the form
of a ridge rather than isolated bulls eyes. Surfer 8 was used for generating the 3-D surface model because they look more
appealing and Surfer give more controls on the final output in terms of colour, shading and source illumination.
The applicability and validity of the SRTM data was checked against the topographical maps for example by checking
the river bends and other geomorphological features through image drape option in ERDAS by superposing AOI image
file, digitized drainage and topographical map. The use of the SRTM data of 90m resolution that is used for the current
type of studies has been discussed in great details by Badura & Przybyski (2005). The 3-D surface model was used to
locate the subtle breaks in topography using various settings in Surfer software including the number of nodes, grid
spacing, position of the illumination source and vertical exaggeration that are thought to have been created by the
earthquake (Fig.3). Two-dimensional (2-D) topographic profiles were drawn from the DEM image file using profile tool in ERDAS to determine change in slopes across the inferred fault and the morphology of the river valley on either side of
the inferred fault (Fig.4). A profile across fault also provided approximate value of fault throw. The method, validity,
type of interpolation used and its applicability is discussed in detail by Bhosle et al. (2009).
Field studies were carried out along the exposed outcrop sections of the Terna River and its tributaries in the area within
20km of the epicenter of the 1993 earthquake where the probability of finding soft sediment deformation structures is
thought to be high (Scott & Price 1988). The field work was carried out during November 2014. A trench of about 30m
long created as a result of both erosion and sand mining in the Terna River west of Killari was located and used to study
the sedimentological structures; these were sketched, measured and photographed in the field (Figs. 5 and 6). Similar
trenches/natural outcrop sections were located in the tributaries and were studied in detail (Figs. 7, 8 and 9).
4. PALEOSEISMIC FEATURES
Soft sediment deformation structures are widespread throughout the Terna River valley and its tributaries within the
20 km radius of the earthquake epicenter. The features are at various scales and are not restricted to any specific
lithofacies. Four sections were studied in detail out of which one is along the Terna River on the western part of the

International Journal of Technical Innovation in Modern Engineering & Science (IJTIMES) “International Conference on Modern Trends in Civil Engineering"(ICMTCE-2019)
(Towards Sustainable Development Goals) Volume 5, Special Issue 02, Feb.-2019
Organized By: Faculty of Civil Engineering, Shri Ramswaroop Menorial University, Lucknow-Deva Road. 3
earthquake epicenter and the other sections are exposed in the tributaries. Convoluted bedding, flame structures, sand
dykes, pipes, dish structures, and faults are the main sedimentary deformation structures.
4.1 Convolutions/Distortions
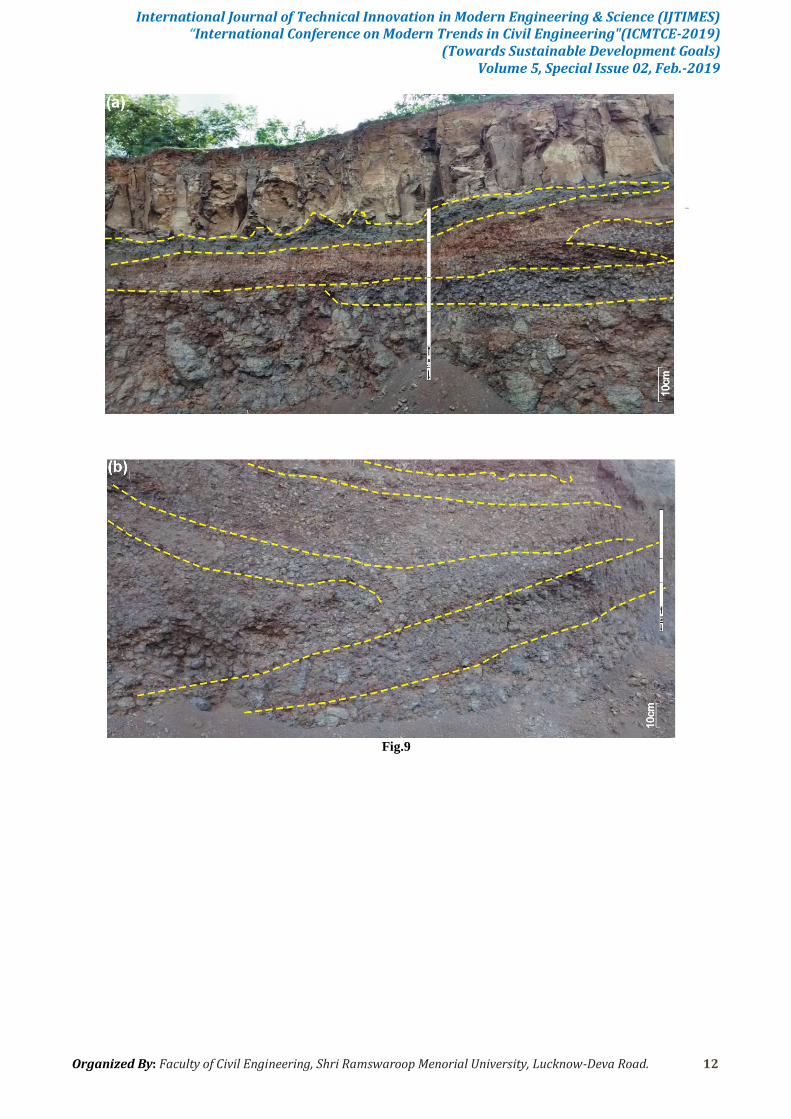
Convolutions and slump structures occur at locations L-1 and L-4 in the study area which has been interpreted as related
to the seismic activity. The convolutions occur in conjunction with dykes and faults which suggest that they were
triggered by tectonic event (Figs. 5, 6 and 9). Slumps and convolutions are commonly occurring seismic structures and
widely studied in both subaqueous and subaerial environments (Gibert et al. 2005). Slumps in general are associated with
small scale faults (Alsop & Marco 2011). This is not the case in the study area and the most likely reason is that the
sediments were too aqueous to preserve at the time of the activity. The upper contacts of these layers with the overlying
strata are nearly flat, indicating that it was an internal flow within the sand layers that caused the convolutions (Figs. 5a and 6b). In some sections the convolutions show uneven contacts with sags and sharp crested peaks. Towards the top of
the succession in some sections dish structures occur together with irregular pseudonodules floating in a sand matrix
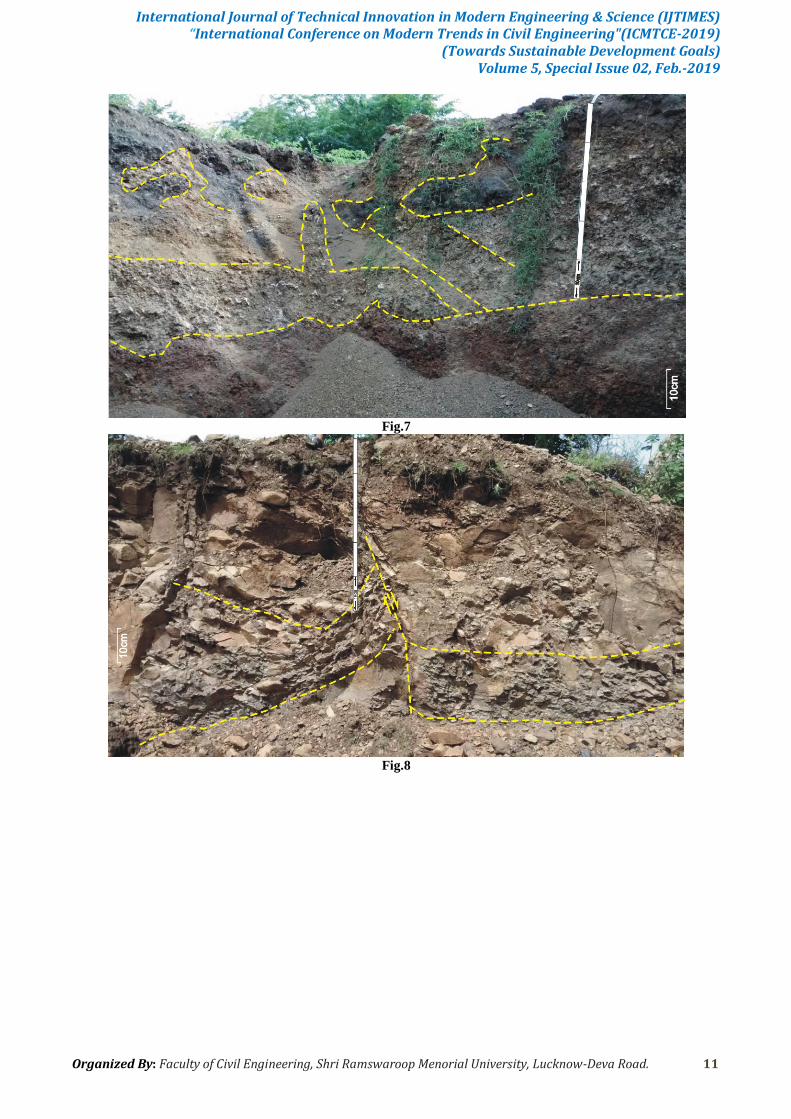
detached from the underlying parent bed (Fig. 7). The plausible reasons for the formation of these structures can be
earthquake tremors but simple sedimentary processes can produce such structures. Deformation appears to result from
the combined effects of liquefaction and shear stress, generated by seismic activities.
4.2 Faults
Several faults have been discovered at locations L-1, L-2 and L-3 (Fig. 1) in the study area. Intrastratal faults were
regarded as a direct evidence of the past seismic activities (Chevelet et al. 2011). The fault occurring at study site L-3 is
the largest and most prominent intrastratal normal fault with a displacement of more than 40cm (Fig. 8). The fault is bounded at the top and the bottom by horizontal beds and the dislocation is restricted to a particular stratum. The fault
shows a dragging effect on the footwall side as the beds are curled up. Another good example of a fault with a
displacement of about 20cm occurs at the site L-1 (Fig. 5b). An abrupt change in the lithology from sandy concretion-
rich to silty clay was observed. The fault is a normal fault where the sandy layer on the hanging wall has gone down.
Dragging effect of the sandy layer can be visualized with the horizontal top and bottom bounding lithological units. A
third prominent example of the fault was identified at the site L-2 (Fig. 7). The strata has been completely churned giving
rise to a pipe, pseudonodules, and detached patches of sedimentary beds. The fault shows the sudden abutment of stratum
and significant bedding disruptions. Beds on one side of the fault are completely churned.
4.3 Load/flame/flower structures
Sediment deformation structures often occur in combinations, forming complex, composite structures (Chevelet et al.
2011). Load structures especially occur along with the flame structures, the flower structures, and sometimes with
convoluted bedding and minor faults/kinked bedding in the study area (Fig. 5a). These complex structures indirectly
indicate their genetic relationship and development sequence as described by Chevelet et al. (2011). These structures are
common in silty calcrete and clay-rich horizons. The driving force for the formation of one structure could be attributed
to density separation, but the occurrence of a combination of structures which are restricted to particular horizons
indicate the effect of seismic shock. Given the limitations of the data set, creating a genetic sequence of the structures is
beyond the scope of the present work.
4.4 Soft sediment clastic dykes
Soft sediment clastic dykes and diapirs occur prominently at sites L-1 and L-2. Their presence at other sites is not discernable clearly because of the nature of the sediments and weathering/erosion patterns. Dykes composed of large
sand intrusions have sharp contacts with the host rocks and are in some instances linked with the smaller dykes (Figs. 6a
and 7). Liquefaction is probably the driving force for the formation of dykes, and is believed to have been triggered by
seismic events. Water saturated sediments tend to move upward due to high pore water pressure, and this sediment slurry
can intrude through the overlying strata as dykes (Obermeier et al. 1993). The dyke occurring at site L-1 are thick and
linear (Fig. 6a), whereas those identified at site L-2 are thin, irregular and discontinuous.
5. SUMMARY AND CONCLUSIONS
The Killari region lies in what was previously termed as a shield area of the crust, where tectonic activity seldom
occurred as major earthquake events. The 1993 Killari earthquake led to thorough investigations of geological past (Sukhija et al. 2006) in the study area. It has been established that the earthquake activity occurred in 190BC and 410AD
(Sukhija et al. 2006) in the close vicinity of the study area. The results were based on the paleoseismic evidence and
radiocarbon dating of the sediments. Sukhija et al. (2006) reported that no paleoseismic evidence for the 1993 earthquake
was found in the Ter, Halki, and Shivoor areas, which is about 35km to 40km on the east and west side of Killari.

International Journal of Technical Innovation in Modern Engineering & Science (IJTIMES) “International Conference on Modern Trends in Civil Engineering"(ICMTCE-2019)
(Towards Sustainable Development Goals) Volume 5, Special Issue 02, Feb.-2019
Organized By: Faculty of Civil Engineering, Shri Ramswaroop Menorial University, Lucknow-Deva Road. 4
Remote sensing and GIS techniques were used to locate the larger scale of fault evidence which proved useful in the
present study. Digital elevation model of the entire area indicate the presence of a large scale fault trending NW-SE.
Longitudinal profiles along the river enable us to locate the minor change in elevation as the fault approaches. From the
DEM it is evident that the western block moved down, and that the river is cutting across the fault and flowing towards
the upthrown block. The valley floor on the northwestern side of the fault is wider and shallower, whereas it is narrow,
with deeper and steeper banks on the southeastern part of the fault.
Deformation mechanisms for the formation of seismically induced sedimentary structures have been investigated by
many researchers (Owen 1987; Moretti & Sobato 2007; Mills 1983; Allen 1977). The driving forces for the soft sediment
deformations include reverse density with slope failure due to liquidisation, slumping, or shear stresses (Allen 1977) and
an external effect such as artesian flow, groundwater fluctuations, earthquakes, sediment loading and gravity (Owen
1987; Owen 1996; Lowe 1975). There is a close observed relationship between the soft sediment deformation structures and the earthquake magnitude
(Scott & Price 1988; Obermeier et al. 2002). Some researchers (Marco & Agnon 1995) propose that the earthquake
magnitude should be >4.5 for liquefaction, whilst Scott & Price (1988) pointed out that there is no liquefaction observed
between 4 and 20km from an epicenter for earthquake magnitudes lower than 5 and 7, respectively. Sediment loading
appears to be of minor importance in the Terna River basin, since no such large flooding events have been reported. The
observed deformational features identified in the study area are within a range of 10 to 15 km from the earthquake
epicenter. It is known that the basin has been subject to several minor earthquakes both before and after the major
earthquake. The sedimentary deposits of Terna River close to the present study area have been dated by radiocarbon
dating by Babar et al. (2012) and the established dates are found to be around 590 to 595 Years BP. Since there was no
recorded earthquake in the study area except the two during 190BC and 410AD (Sukhija et al. 1996) this clearly
indicates that the seismites are the results of 1993 earthquake activity. All the above mentioned points indicate that the deformation structures observed in the study area are clear indicators of the 1993 earthquake activity, as the other
triggering mechanism are minor and rare phenomenon. In addition historical studies in this area also support these
conclusions.
6. ACKNOWLEDGEMENTS
The authors would like to thank Dr. Douglas Schultz for critical comments and fruitful discussions that helped us to
improve the manuscript significantly.
7. REFERENCES
Alfaro, P., Moretti, M. & Sofia, J.M. (1997): Soft-sediment deformation structures induced by earthquakes (seismites) in Pliocene lacustrine deposits (Guadix-Baza Basin, Central Betic Cordillera), Eclogae Geologicae Helvetiae. 90: 531-540.
Alfaro, P., Delgado, J., Estevez, A, Molina, J.M., Moretti, M. & Sofia, J.M. (2002): Liquefaction and fluidisation
structures in Messinian storm deposits (Bajo Segura Basin, Betic Cordillera, Southern Spain), Int. J. of Earth Sciences.
91, pp. 505-513.
Allen, J.R.L., (1977): The possible mechanics of convolute lamination in graded sand beds, Journal of the Geological
Society. 134(1): 19–31.
Alsop, G.I. & Marco, S. (2011): Soft-sediment deformation within seismogenic slumps of the Dead Sea Basin. J.
Structural Geology, 33: 433-457.
Babar, M., Chunchekar, R., Yadava, M.G. & Ghute, B. (2012): Quaternary Geology and Geomorphology of Terna River
Basin in West Central India. Quat. Sci. Journal 61(2): 156-167.
Badura, J. & Przybyski, B., 2005, Application of digital elevation models to geological and geomorphological studies–
some examples. Przeglad Geologiczny, 53: 977–983.
Baumbach, M., Grosser, H., Schmidt, H.G., Paulat, A., Rietbrock, A., Rao, C.V., Raju, P., Sarkar, D. & Mohan, I.
(1994): Study of the foreshocks and aftershocks of the intraplate Latur earthquake of September 30, 1993, India. Mem.
Geol. Soc. India. 35: 33–63.
Bhosle, B., Parkash, B., Awasthi, A.K. & Pati, P. (2009): Use of digital elevation models and drainage patterns for locating active faults in the Upper Gangetic Plain, India. Int. J. Remote Sensing, 30(3), pp-673-691.
Burrough, P.A. (1986): Principles of Geographical Information Systems for Land Resources Assessment. OUP, Oxford,
Ch.8, Methods of interpolation. pp. 320.

International Journal of Technical Innovation in Modern Engineering & Science (IJTIMES) “International Conference on Modern Trends in Civil Engineering"(ICMTCE-2019)
(Towards Sustainable Development Goals) Volume 5, Special Issue 02, Feb.-2019
Organized By: Faculty of Civil Engineering, Shri Ramswaroop Menorial University, Lucknow-Deva Road. 5
Deshmukh, S.S. (1988): Petrographic variation in compound flows of Deccan traps and their significance. Mem. Geol.
Soc.India. 10: 305-319.
Fortuin, A.R. & Dabrio, C.J. (2008): Evidence for Late Messinian seismites, Nijar Basin, south-east Spain.
Sedimentology, 55(6): 1595-1622.
Gilbert, L., Sanz de Galdeano, C., Alfaro, P., Scott, G. & Lopez Garrido, A.C. (2005): Seismic-induced slump in early
Pleistocene deltaic deposits of the Baza Basin (SE Spain). Sedimentary Geology, 179: 279-294.
Gupta, H.K., Rastogi, B.K., Indra Mohan, Rao, C.V.R.K., Sarma, S.V.S. & Rao, R.U.M. (1998b): An investigation of the
Latur earthquake of September 29, 1993 in southern India. Tectonophysics, 287: 299-318.
Jain, S.K., Murty, C.V.R., Chandak, N., Seeber , L. & Jain, N.K. (1994): The September 29, 1993, M6.4 Killari,
Maharashtra Earthquake in Central India. EERI Special Earthquake Report, EERI Newsletter, vol. 28, no. 1.
Kaila, K.L. (1989): Mapping the thickness of the Deccan Traps flows in Indian from DSS studies and inferences about a
hidden Mesozoic, Basin in the Narmada-trapti region. Geol. Soc. India. Spec. Pub. 10: 91-116.
Lowe, D.R. (1975): Water escape structures in coarse-grained sediments. Sedimentology, 22: 157-204.
Marco, S. & Agnon, A. (1995): Prehistoric earthquake deformations near Massada, Dead Sea Graben, Geology, 23(8):
695-698.
Martín-Chivelet, J., Palma, R.M., López-Gómez, J. & Kietzmann, D.A. (2011): Earthquake-induced soft-sediment deformation structures in Upper Jurassic open-marine microbialites (Neuquén Basin, Argentina). Sedimentary Geology
SCI, 235(3-4): 210-221.
Mills, P.C. (1983): Genesis and diagnostic value of soft-sediment deformation structures–a review. Sedimentary
Geology, 35(2): 83-104.
Mishra, D.C., Tiwari, V.M., Gupta, S.B. & Rao, V.M.B.S. (1998): Anomalous mass distribution in the epicentral area of
Latur earthquake, India. Current Sci. 74: 469-472.
Moretti, M. & Sabato, L. (2007): Recognition of trigger mechanisms for soft-sediment deformation in the Pleistocene
lacustrine deposits of the Saint’ Arcangelo Basin (Southern Italy): seismic shocks vs. overloading. Sed. Geo., 196: 31-45.
Mukhopadhyay, S., Mishra, O.P., Zhao, D. & Kayal, J.R. (2002): 3-D Seismic structure of the source area of the 1993
Latur, India, earthquake and its implications for rupture nucleations. Tectonophysics, 415:1-16.
Obermeier, S.F., Jacobson, R.E., Smott, J.P., Weems, R.E., Gohn, G,S., Monroe, J.E. & Powards, D.S. (1989):
Earthquake-induced liquefaction features in the coastal setting of South carolina and the fluvial setting of the New
Madrid seismic zone: United States Geological Survey Professional Paper 1504: 44.
Obermeier, S.F., Martin, J.R., Frankel, A.D., Youd, T.L., Munson, P.J., Munson, C.A. & Pond, E.L. (1993): Liquefaction
evidence for one or more strong Holocene earthquakes in the Wabash Valley of Southern Indiana and Illinois, with a
preliminary estimate of magnitude: United States Geological Survey Professional Paper 1536: 27.
Obermaier, S.F., Pond, E.C., Olson, S.M. & Green, R.A. (2002): Paleoliquefaction studies in continental settings, in
Ancient Seismites, F. R. Ettensohn, N. Rast, and C.E. Brett, Eds., Geological Society of America Special Papers,
Boulder, Colo, USA, 359: 13-27.
Owen, G. (1987): Deformation processes in unconsolidated sands, in Deformation of Sediments and Sedimentary Rocks,
M. E. Jones and R. M. F. Preston, Eds., Geological Society of London, 29: 11-24.
Owen, G. (1996): Experimental soft-sediment deformation: Structures formed by the liquefaction of unconsolidated
sands and some ancient examples. Sedimentology, 43(2): 279-293.
Perucca, L.P., Bracco, A.I. & Moreiras, S.M. (2009): Determination of seismogenic structures and earthquake magnitude from seismites in the Acequion river, Precordillera Range, central-western Argentina. J. Iberian Geology, 35(1): 5-18.
Rajendran, C.P., Rajendran, K., Unnikrishnan, K.R. & John, B. (1996a): Paleoseismic indicators in the rupture zone of
the 1993 Killari (Latur) earthquake. Current Sci., 70, 385-390.
International Journal of Technical Innovation in Modern Engineering & Science (IJTIMES) “International Conference on Modern Trends in Civil Engineering"(ICMTCE-2019)
(Towards Sustainable Development Goals) Volume 5, Special Issue 02, Feb.-2019
Organized By: Faculty of Civil Engineering, Shri Ramswaroop Menorial University, Lucknow-Deva Road. 6
Rajendran, C.P., Rajendran, K. & John, B. (1996b): The 1993 Killari (Latur), Central India earthquake: An example of
fault reactivation in the Precambrian crust. Geology, 24: 651-654.
Rajendran, C.P. & Rajendran, K. (1999): Geological investigations at Killari and Ter central India and implications for
palaeoseismisity in the shield region. Tectonophysics, 308: 67-81.
Ringrose, P.S. (1989): Palaeoseismic liquefaction event in late Quaternary lake sediment at Glen Roy, Scotland. Terra
Nova, 1: 57-62.
Rossetti, D.F. & Santos jr., A.E. (2003): Events of sediment deformation and mass failure in Upper Cretaceous estuarine
deposits (Cameta Basin, northern Brazil) as evidence for seismic activity. Sedimentary Geology, 161: 107-130.
Scott, B. & Price, S. (1988): Earthquake-induced structures in young sediments. Tectonophysics, 147(1-2): 165-170.
Seeber, L., Ekstrom, G., Jain, S.K., Murthy, C.V.R., Chandak, N. & Armbruster, J.G. (1996): The 1993 Killari
earthquake in central India: a new fault in Mesozoic basalt flows. J. Geophys. Res., 101: 8543-8560.
Seth, A., Sarkar, S. & Bose, P.K. (1990): Synsedimentary seismic activity in an immature passive margin basin (Lower
Member of the Katrol Formation, Upper jurassic, Kutch, India). Sedimentary Geology, 68: 279-291.
Singh, S. & Jain, A.K. (2007): Liquefaction and fluidization of lacustrine deposits from Lahaul-Spiti and Ladakh
Himalaya: geological evidences of paleoseismicity along active fault zone. Sedimentary Geology, 196: 47-57.
Srinagesh, D., Singh, S.K., Reddy, S., Prakasamand, K.S. & Rai, S.S. (2000): Evidence for high velocity in Koyna
Seismic Zone from P-wave Teleseismic Imaging. Geo. Res. Lett., 27(17): 2737-2740.
Sukhija B.S., Laxmi, B.V., Rao, M.N., Reddy, D.V., Nagabhshnam, P., Hussain, S. & Gupta, H.K. (2006): Wide spread
geologic evidence of a large paleoseismic event near the Meizoseismal area of the 1993 Latur earthquake, Deccan shield.
India. Jour. Indian Geophys. Union, 10: 1-14.
Figure Captions
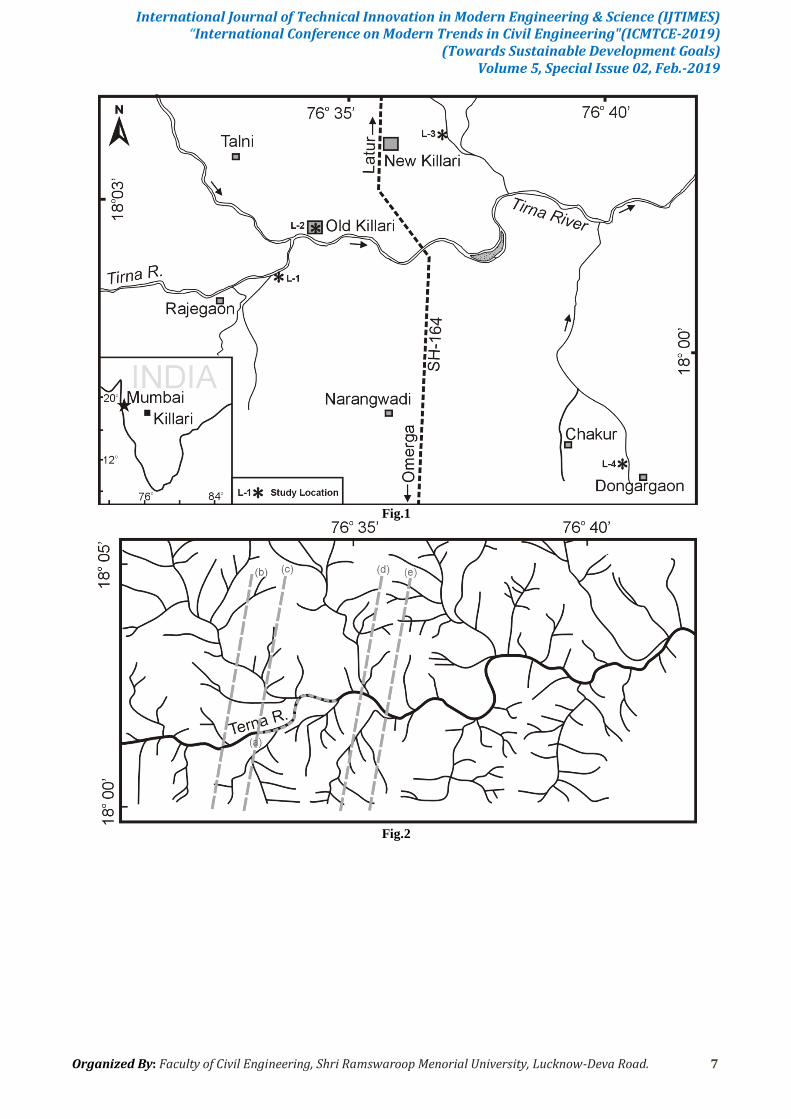
Fig.1 Location map of the study area.
Fig.2 Drainage map of the study area. (a) to (e) represents location of the 2-d profiles.
Fig.3 Digital Elevation Models of the study area with dotted line representing the inferred fault. The yellow lines represent the locations and orientation of the 2-d profiles and star symbols are the field study locations.
Fig.4 (a) 2-d profile along the river indicate break in the topography after reaching the inferred fault. (b) and (c) 2-d
profiles across the river taken on western part of the inferred fault (d) and (e) 2-d profiles across the river taken on the
eastern part of the inferred fault.
Fig.5 Field photograph at location (L-1) (a) Alternating calcrete rich silty sand and dark coloured silty muds forming
load structures along with bedding disruptions at the bottom and convolute bedding. (b) Photograph showing fault with
coarse grained calcrete rich light coloured sandy bed terminating against the finer grained dark coloured calcrete poor
bed. The measured throw of the fault is about 20cm.
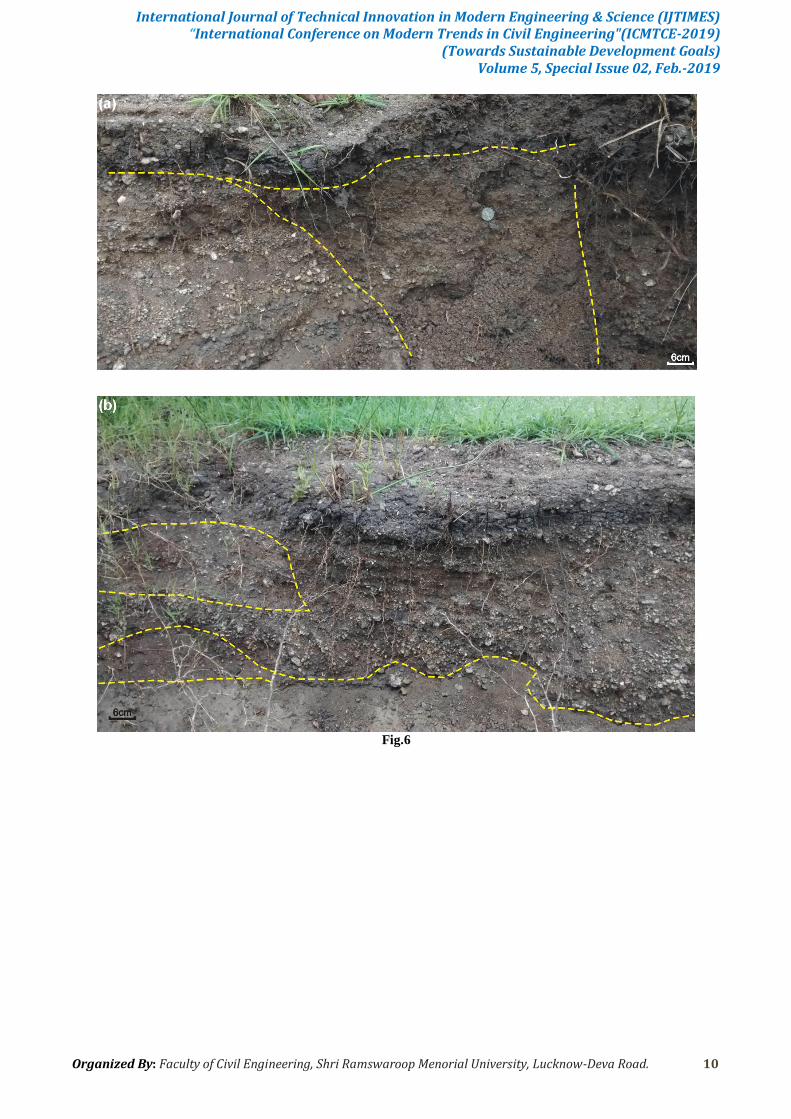
Fig.6 (a) A large scale slump structure with host sediments on either side are calcrete rich silty sands and the central
part appearing dark massive with few calcrete nodules. (b) Calcrete rich silty sand bed overlying fine grained calcrete
poor sandy horizon. Note the convolute bedding and flame structures on the lower contact. The upper dark coloured
organic rich laminated silty mud horizon is unaffected. Fig.7 The photograph shows a prominent vertical fault with sediments on one side of the fault are completely churned
whereas on the other side the sediments are consistent. Sandy calcrete rich sand are intruded into overlying cleaner
sands and carbonaceous silty sands at the top of the section. Pseudonodules and detached patches can be clearly seen.
Fig.8 Fault activity can be clearly seen where the darker organic rich silty clay bed is disrupted by the fault activity. The
overlying and underlying beds are not affected by the fault. The measured throw of the fault is about 40cm.
Fig.9 A close photograph of slump structure at location L-4. The section is fining- upward with sag at the centre. Note
the overlying stratum is unaffected. Bedding disruption can be seen at the lower part of the section.
International Journal of Technical Innovation in Modern Engineering & Science (IJTIMES) “International Conference on Modern Trends in Civil Engineering"(ICMTCE-2019)
(Towards Sustainable Development Goals) Volume 5, Special Issue 02, Feb.-2019
Organized By: Faculty of Civil Engineering, Shri Ramswaroop Menorial University, Lucknow-Deva Road. 7
Fig.1
Fig.2

International Journal of Technical Innovation in Modern Engineering & Science (IJTIMES) “International Conference on Modern Trends in Civil Engineering"(ICMTCE-2019)
(Towards Sustainable Development Goals) Volume 5, Special Issue 02, Feb.-2019
Organized By: Faculty of Civil Engineering, Shri Ramswaroop Menorial University, Lucknow-Deva Road. 8
Fig.3
Fig.4

International Journal of Technical Innovation in Modern Engineering & Science (IJTIMES) “International Conference on Modern Trends in Civil Engineering"(ICMTCE-2019)
(Towards Sustainable Development Goals) Volume 5, Special Issue 02, Feb.-2019
Organized By: Faculty of Civil Engineering, Shri Ramswaroop Menorial University, Lucknow-Deva Road. 9
Fig.5
International Journal of Technical Innovation in Modern Engineering & Science (IJTIMES) “International Conference on Modern Trends in Civil Engineering"(ICMTCE-2019)
(Towards Sustainable Development Goals) Volume 5, Special Issue 02, Feb.-2019
Organized By: Faculty of Civil Engineering, Shri Ramswaroop Menorial University, Lucknow-Deva Road. 10
Fig.6
International Journal of Technical Innovation in Modern Engineering & Science (IJTIMES) “International Conference on Modern Trends in Civil Engineering"(ICMTCE-2019)
(Towards Sustainable Development Goals) Volume 5, Special Issue 02, Feb.-2019
Organized By: Faculty of Civil Engineering, Shri Ramswaroop Menorial University, Lucknow-Deva Road. 11
Fig.7
Fig.8
International Journal of Technical Innovation in Modern Engineering & Science (IJTIMES) “International Conference on Modern Trends in Civil Engineering"(ICMTCE-2019)
(Towards Sustainable Development Goals) Volume 5, Special Issue 02, Feb.-2019
Organized By: Faculty of Civil Engineering, Shri Ramswaroop Menorial University, Lucknow-Deva Road. 12
Fig.9