Seismic Stations
17
THE NEW ENGLAND SEISMIC NETWORK Award Number 01HQAG0022 John E. Ebel Weston Observatory Department of Geology and Geophysics Boston College Weston, MA 02493 (617) 552-8300 Fax: (617) 552-8388 [email protected] Program Element : Seismic Ne twork Operations Final Report Submitted June, 2004 "Research supported by the U.S. Geological Survey (USGS), Department of the Interior, und er USGS award nu mber 01HQAG00 22. The views an d conclusions contained in this document are those of the authors and should not be interpreted as necessarily representing the official policies, either expressed or implied, of the U.S. government."
-
Upload
arts-place -
Category
Documents
-
view
216 -
download
0
Transcript of Seismic Stations

8/4/2019 Seismic Stations
http://slidepdf.com/reader/full/seismic-stations 1/17
THE NEW ENGLAND SEISMIC NETWORK
Award Number 01HQAG0022
John E. EbelWeston Observatory
Department of Geology and GeophysicsBoston College
Weston, MA 02493(617) 552-8300
Fax: (617) [email protected]
Program Element: Seismic Network Operations
Final Report
Submitted
June, 2004
"Research supported by the U.S. Geological Survey (USGS), Department of the Interior, under USGS award number 01HQAG0022. The views andconclusions contained in this document are those of the authors and should not beinterpreted as necessarily representing the official policies, either expressed or implied, of the U.S. government."

8/4/2019 Seismic Stations
http://slidepdf.com/reader/full/seismic-stations 2/17
2

8/4/2019 Seismic Stations
http://slidepdf.com/reader/full/seismic-stations 3/17
THE NEW ENGLAND SEISMIC NETWORK
Award Number 01HQAG0022
John E. EbelWeston Observatory
Department of Geology and GeophysicsBoston College
Weston, MA 02493(617) 552-8300
Fax: (617) [email protected]
Abstract
From February 1, 2001 to January 31, 2004 Weston Observatory operated an 11-stationregional seismic network to monitor earthquake activity in New England (Connecticut, Maine,Massachusetts, New Hampshire, Rhode Island, and Vermont) and vicinity. The purpose of thismonitoring is to compile a complete database of earthquake activity in New England to as low amagnitude as possible in order to understand the causes of the earthquakes in the region, toassess the potential for future damaging earthquakes, and to better constrain the patterns of strong ground motions from earthquakes in the region. The NESN also coordinates earthquakemonitoring in the northeastern U.S. (NEUS) with the Earth Resources Laboratory of theMassachusetts Institute of Technology (MIT) and the Lamont Cooperative Seismic Network (LCSN) of Lamont-Doherty Earth Observatory as part of the Advanced National Seismic Network (ANSS) northeast center for earthquake monitoring (ANSS-NE).
At all of the Weston Observatory stations the sensors were CMG-40T feedback geophones with a flat response to ground velocity between roughly 30 Hz and 30 sec. Initially,all of the stations had Nanometrics, Inc. 16-bit digitizers with gain-ranging, digitized at a rate of 100 samples per second per channel. The software controlling the stations stored the signalsfrom the sensor in a continuous disk loop at the remote site, preserving approximately 21 days of continuous data. In 2003 the digitizers at five stations were replaced with new Reftek, Inc. 130-01 broadband 24-bit digitizers sampled at 40 samples/second. Telemetry to Weston Observatoryfrom these new stations as well as most of the older stations was through the internet using theEarthworm software package. Event detection at all stations is carried out using an STA/LTAthreshold detector. A new effort to implement a wavelet-transform (WT) based automated event
detector and identifier was developed for the Earthworm datastream. This system has been tunedso that it successfully detects and identifies many quarry blasts, most teleseisms, and some localearthquakes.
There were 69 local and regional earthquakes with magnitudes from 1.9 to 5.1 that weredetected and located by the NESN stations from February 1, 2001 to January 31, 2004, alongwith some microearthquakes and some other signals that were possible earthquakes. The largestrecorded earthquake from the region was an ML 5.1 earthquake on April 20, 2002 that caused
3

8/4/2019 Seismic Stations
http://slidepdf.com/reader/full/seismic-stations 4/17
minor damage in New York near the epicenter and was felt across most of New England. Therewere 36 earthquakes centered in (or offshore of) New England proper. From 2001 to 2004 theannual rate of earthquake activity in New England at all magnitude levels was only about 50% of that from 1975 to 1982. The seismicity of New England was found to have a non-Poissoniantemporal pattern with more short-term pairs of mLg≥2.7 earthquakes than would be expected
from a Poisson process. This information is used to make short-term earthquake probabilityforecasts on the Weston Observatory web site (http://www.bc.edu/westonobservatory).
4

8/4/2019 Seismic Stations
http://slidepdf.com/reader/full/seismic-stations 5/17
Investigations
Weston Observatory continued to operate its regional seismic network from February 1,2001 to January 31, 2004 to monitor earthquake activity in New England (Connecticut, Maine,Massachusetts, New Hampshire, Rhode Island, and Vermont) and vicinity. The purpose of this
monitoring is to compile a complete database of earthquake activity in New England to as low amagnitude as possible in order to understand the causes of the earthquakes in the region, toassess the potential for future damaging earthquakes, and to better constrain the patterns of strong ground motions from earthquakes in the region. The New England Seismic Network (NESN) is cooperatively operated by Weston Observatory of Boston College and the EarthResources Laboratory of the Massachusetts Institute of Technology (MIT). The NESN alsocoordinates earthquake monitoring in the northeastern U.S. (NEUS) with the LamontCooperative Seismic Network (LCSN) of Lamont-Doherty Earth Observatory as part of theAdvanced National Seismic Network (ANSS) northeast center for earthquake monitoring(ANSS-NE).
Network History through the Report Period
At the beginning of the period of this report (February 2001) Weston Observatory wasoperating 11 seismic stations in New England. The number and locations of the NESN seismicstations did not change during the period of this report, although there were changes in theequipment at a number of the stations. Also, a station TRY at Troy, NY was prepared but wasnot made operational during this reporting period. All of the Weston Observatory stationsoperating in February 2001 were PC-based with on-site recording, three-component broadbandsensors, and dial-up telephone telemetry or direct internet links to the central station at WestonObservatory. The sensors were CMG-40T feedback geophones with a flat response to groundvelocity between roughly 30 Hz and 30 sec. The digitizers were Nanometrics 16-bit with gain-
ranging, yielding effectively 136 db dynamic range. The sensor signals were digitized at a rateof 100 samples per second per channel. The output from the digitizer was sent to a PC computer running OS/2, a multitasking operating system, at the recording site. The software controllingthe stations stored the signals from the sensor in a continuous disk loop, preservingapproximately 21 days of continuous data. Also examining the data stream from the digitizer was a program that uses a filter and STA/LTA scheme to test for possible events. When theSTA/LTA threshold is exceeded, a notation of the time and duration of the exceedance is addedto a text file on the recording computer.
Using software developed by Nanometrics, Inc., seismic data from most of the NESNstations was being transferred via the internet to the USGS National Earthquake Information
Center (NEIC) for incorporation into the U.S. National Seismic Network (USNSN) data stream.Throughout the period of this report, nine of the sites (BCX, BRY, EMMW, HNH, PQI, QUA2,WES, WVL, and YLE) were available via internet connections to Weston Observatory, seven of which (BRY, EMMW, HNH, PQI, QUA2, WES, WVL) were also sending their data to theUSGS NEIC in Golden, Colorado. In 2003 an internet connection was established at stationFFD, and those data also began being fed to the NEIC and Weston Observatory.
5

8/4/2019 Seismic Stations
http://slidepdf.com/reader/full/seismic-stations 6/17
In the summer of 2003 Weston Observatory received from the USGS five new Reftek,Inc. 130-01 broadband digitizers to replace the older Nanometrics equipment at some of the NESN stations. These digitizers were installed in September 2003 at the following stations:BRY, FFD, HNH, QUA2 and WES. The Reftek 130-01 units are 24-bit digitizers that transmitdata sampled at 40 samples/second through the internet using the Earthworm software package.
Routine event detections are carried out using an STA/LTA detector. The stations with the newReftek equipment were configured to transmit their data directly to the USGS NEIC, which thenretransmits the data via Earthworm to Weston Observatory as well as to all other interestedusers. Plans were being made at the end of this report period to replace the outdated Nanometrics digitizers at more of the remote NESN stations later in 2004.
In 2001 a computer with the Earthworm software was installed at Weston Observatory toreceive USNSN data. During the period of this grant, the number of data streams from thenortheastern U.S. was increased as experience was gained with the operation and capabilities of the Earthworm system. Initially, data from six stations were being delivered to WestonObservatory via Earthworm, and in 2003 this number was increased to twelve. By the end of this reporting period, the stations that were being received via Earthworm at Weston Observatory
were the NESN stations BRY, EMMW, FFD, HNH, PQI, QUA2, WES and WVL along withUSNSN stations BINY, HRV, LBNH and NCB. In all cases, the data streams from the seismicstations were sent directly to NEIC, from which they were returned to Weston Observatorythrough the Earthworm system.
The NESN station configuration as of January 2004 is shown in Figure 1 (including thesites of the former MIT NESN stations). The MIT stations ceased operation sometime in 2002and were not restarted through the end of this reporting period. The magnitude threshold abovewhich earthquakes can be completely detected and located by the NESN shown in Figure 1 isestimated to be about mLg 2.7 throughout New England. Smaller earthquakes can be detectedand located in southern New England (from central New Hampshire and Vermont to the
southern border of New England), although it is likely that not all earthquakes with mLg < 2.7are being detected and recorded in this region. In northern New England, the capabilities for earthquake detection and location are augmented by a number of seismic stations operated inQuebec and New Brunswick provinces of Canada by the Canadian Geological Survey.
To decrease the magnitude of the completeness level for event detection and location,Weston Observatory began investigating several sites in New England for the installation of newseismic stations. In one effort, Weston Observatory personnel were working with the MaineGeological Survey to site a USNSN national backbone station in central Maine. An acceptablesite has not yet been confirmed, although a possible candidate was being investigated as of theend of this reporting period. Possible new station sites in southwestern New Hampshire, western
Maine and east-central Maine were also being negotiated. It is the long-term goal of WestonObservatory to approximately double the number of regional seismic network stations that it isoperating in the region. If this goal can be met, the completeness threshold for event detectionand location should be reduced to between mLg 2.3 and 2.0.
One important development in the routine analysis of regional seismic network data atWeston Observatory is a new effort to implement a wavelet-transform (WT) based automatedevent detector and identifier. Such a system was initially created and tested by Gendron et al.(2000) for the PC-based regional seismic network stations operated by Weston Observatory.
6

8/4/2019 Seismic Stations
http://slidepdf.com/reader/full/seismic-stations 7/17
Unfortunately, the operation of that system had to be halted due to unresolveable conflicts withthe data acquisition systems on the computers at the remote field sites, where the WT softwarefor event detection and identification had been installed. With the implementation of theEarthworm system at Weston Observatory, a new effort was started to adapt and improve theGendron et al. (2000) system to make use of the triggered and continuous data arriving via
Earthworm. It was decided to implement this new system using Matlab, making it relatively platform independent (i.e., any computer running Earthworm and Matlab can run this system).An initial version of a wavelet-based automated event detector and identifier began being testedunder routine operating conditions in August 2003. A number of programming bugs and systemconfiguration problems were worked out during the fall and early winter of 2003-2004, and bythe end of this reporting period the system was being used on a daily basis to assist with eventdetection and identification. The system has been tuned to the point where it successfully detectsand identifies many quarry blasts, most teleseisms, and some local earthquakes detected by thenetwork stations.
A research effort is currently under way to improve the reliability of the WT eventidentifications. This new identifier is based on an analysis of the frequency spectra deduced
from the WT transforms of detected events (Zhu and Ebel, 2004; Ebel, 2004). Further development, improvement and testing of this new system will take place during the comingyear. It is the long-term goal of this project to use the WT system not only for automated eventdetection and identification, but also for the determination of event locations and magnitudes innear real-time. The added information provided by the wavelet transform over that from simpleSTA/LTA systems is necessary to overcome the inherent limitations of a sparse, widely scatteredregional seismic network such as that being operated by Weston Observatory in New Englandand vicinity.
Data Analysis, Archiving and Availability
During the grant period, scanning of the seismic data for possible earthquakes was donemanually by an analyst, who would then determine the locations and magnitudes for all detectedearthquakes. Due to manpower cutbacks resulting from limited funding, the routine scanning of the seismic data for earthquakes took place only between 1 and 3 times each week when our part-time seismologist was available. At the beginning of the period covered by this report, theanalyst used a PC computer as the master computer for routine scanning for earthquakes and for network data collection, analysis and archiving. From this computer, the remote stations werecontacted for event detection lists and to extract the waveforms for times of suspected events.The waveform data arrived at Weston Observatory from the remote stations in Nanometrics, Inc.“Y-file” format, where the waveform data were scanned, arrival times were read, and archiving
was carried out. The waveform data were archived on hard disk and floppy disk in Nanometrics“Y-file” format. Nanometrics has provided a routine to convert data from their format to SEEDand to SAC format. Unfortunately, the SEED files generated so far that have been sent to theIRIS DMC have not been acceptable for that archive because of some bad header data. We areworking on this problem and intend to solve it, which would allow all Weston Observatory NESN waveforms to be archived at the IRIS DMC. Weston Observatory maintains an archive of all of its waveform data for local and regional earthquakes, and it also saves the first few minutesof teleseismic arrivals. These data are available upon request from Weston Observatory.
7

8/4/2019 Seismic Stations
http://slidepdf.com/reader/full/seismic-stations 8/17
With the development of the Earthworm data transmission system and the WT event
detector and identifier in 2003, changes were made in the routine scanning procedures. Stationwaveforms from the Earthworm system for WT event detections that were identified as possibleteleseisms, regional earthquakes, local earthquakes, or local blasts were examined individually
by an analyst using the Waveviewer program accessing the Earthworm data streams. For localearthquakes, arrival times of the P and S waves were read from all possible stations, and thesereadings were augmented with arrival time, amplitude and period measurements made from theolder Nanometrics-style NESN stations that could only be accessed by remote dial-up or directinternet connection. Computations of the locations and magnitudes of local events were carriedout as before, using a modified version of HYPO78.
Weston Observatory produces a quarterly seismic network bulletin for the New Englandarea that summarizes the detected earthquake activity within the New England region. This bulletin is posted on the Weston Observatory web site. Weston Observatory contributeshypocentral data to the CNSS composite catalog on a routine basis. It also maintains web pageswith lists of recent earthquakes, and other information pertinent to the earthquakes of the region.
The Weston Observatory main web site with links to information about local earthquakes is:
• http://www.bc.edu/westonobservatory
8

8/4/2019 Seismic Stations
http://slidepdf.com/reader/full/seismic-stations 9/17
Figure 1. Locations of seismic stations in New England and vicinity as of January 2004. TheMIT stations had not been operational since 2002, but the locations of the station sites are shownfor reference.
9

8/4/2019 Seismic Stations
http://slidepdf.com/reader/full/seismic-stations 10/17
Seismicity
Figure 2 shows the epicenters of local and regional earthquakes recorded by WestonObservatory from February 1, 2001 to January 31, 2004. A total of 69 local and regionalearthquakes with magnitudes from 1.9 to 5.1 were detected and located by the NESN stations,
some of which were felt by those living near the epicenters. Also recorded throughout the time period of this report were some microearthquakes or other events that were possible earthquakes but with insufficient data to compute a location. Of the seismicity shown in Figure 2, there were36 earthquakes centered in (or offshore of) New England. Five of the New England earthquakeswere aftershocks, one was a foreshock, and one was part of a pair of similar-sized earthquakes.
The largest earthquake that took place in the northeastern U.S. and southeastern Canadaduring the time period of this report was an ML 5.1 earthquake on April 20, 2002. This eventwas centered near Au Sable Forks, NY, and caused some minor damage in the epicentral area(http://www.ldeo.columbia.edu/LCSN/NYQuake_2002/damage.html,http://neic.usgs.gov/neis/eq_depot/2002/). It was felt throughout most of New England, themiddle Atlantic states, and the southern parts of Quebec and Ontario provinces in Canada (the
CIIM web page for this earthquake can be linked from http://pasadena.wr.usgs.gov/shake/ne/).The Au Sable Forks mainshock was followed by a number of aftershocks ranging in magnitudeup to 4.0 (Seeber et al., 2002). The ground motions from this earthquake at the NESN stations of Weston Observatory were comparable to those predicted by published ground-motionattenuation relations for the region (Atkinson and Sonley, 2003; Ebel, 2003).
Of the events shown in Figure 2, the largest earthquake in New England proper took place on July 22, 2003. This mLg 3.6 event was centered about 58 km ENE of Gloucester, MA.Ground shaking from this earthquake was felt in northeastern Massachusetts, southeastern NewHampshire and southernmost Maine, and it was also felt by a number of residents along the coastsouth of Boston (see the CIIM web page for this earthquake at
http://pasadena.wr.usgs.gov/shake/ne/archives.html). There were almost no felt reports from thecity of Boston or adjacent suburbs from this earthquake. The epicenter of this event (offshoreeast of Cape Ann) was located in an area where about a dozen earthquakes have been detectedsince 1975. Ebel (2002) argued that this offshore area was the probable epicenter of the M6 1/4Cape Ann earthquake of 1755, the largest damaging earthquake in New England history.Following the “paleoseismicity” model of Ebel et al. (2000), the 2003 earthquake may have beenan aftershock of the 1755 event or of perhaps an even larger, earlier earthquake.
Another interesting sequence of events took place at Bethlehem, NH in October 2001.On October 2 there was a magnitude 2.6 earthquake that was felt noticeably at Bethlehem andnearby communities. During the next week or so, a number of residents contacted Weston
Observatory reporting that they had heard and sometimes felt what they thought were smallearthquakes. Examinations of the seismic data from the nearby USNSN station LBNHconfirmed that many of the residents’ reports were indeed small earthquakes. These were verylikely very small aftershocks (magnitude 1.7 or less, including several below magnitude 1.0) of the 2.6 mainshock. The Bethlehem residents were probably very close to the earthquakehypocenters of these aftershocks since events of such small magnitudes cannot be felt or heardvery far from their epicenters. This observation confirms that the epicenter of this earthquakesequence was under the town of Bethlehem.
10

8/4/2019 Seismic Stations
http://slidepdf.com/reader/full/seismic-stations 11/17
Bethlehem, NH, 10/2/2001
Cape Ann, MA,7/22/2003
Au Sable Forks,4/20/2002
Figure 2. Seismicity of New England and vicinity from February 1, 2001 to January 31, 2004 asrecorded by the seismic stations of Weston Observatory of Boston College.
11
8/4/2019 Seismic Stations
http://slidepdf.com/reader/full/seismic-stations 12/17
Discussion
The rate of seismicity during this reporting period was quite comparable to that of the prior three-year period of network monitoring. During this six-year time period, the seismicityin the region was stable both in its temporal rate and in its spatial distribution. However, the rate
of earthquake activity in New England during this period was significantly lower than it wasduring the late 1970’s and early 1980’s, a time when several earthquakes above magnitude 4.0affected the region. According to Ebel (1984), from 1975 to 1982 New England averaged about15 earthquakes per year of M≥2 and about 2 earthquakes per year of M≥3. For the three-year time period of this report, there were 22 earthquakes of M≥2 and 3 earthquakes of M≥3. Thus,from 2001 to 2004 the annual rate of earthquake activity in New England was only about 50% of that from 1975 to 1982.
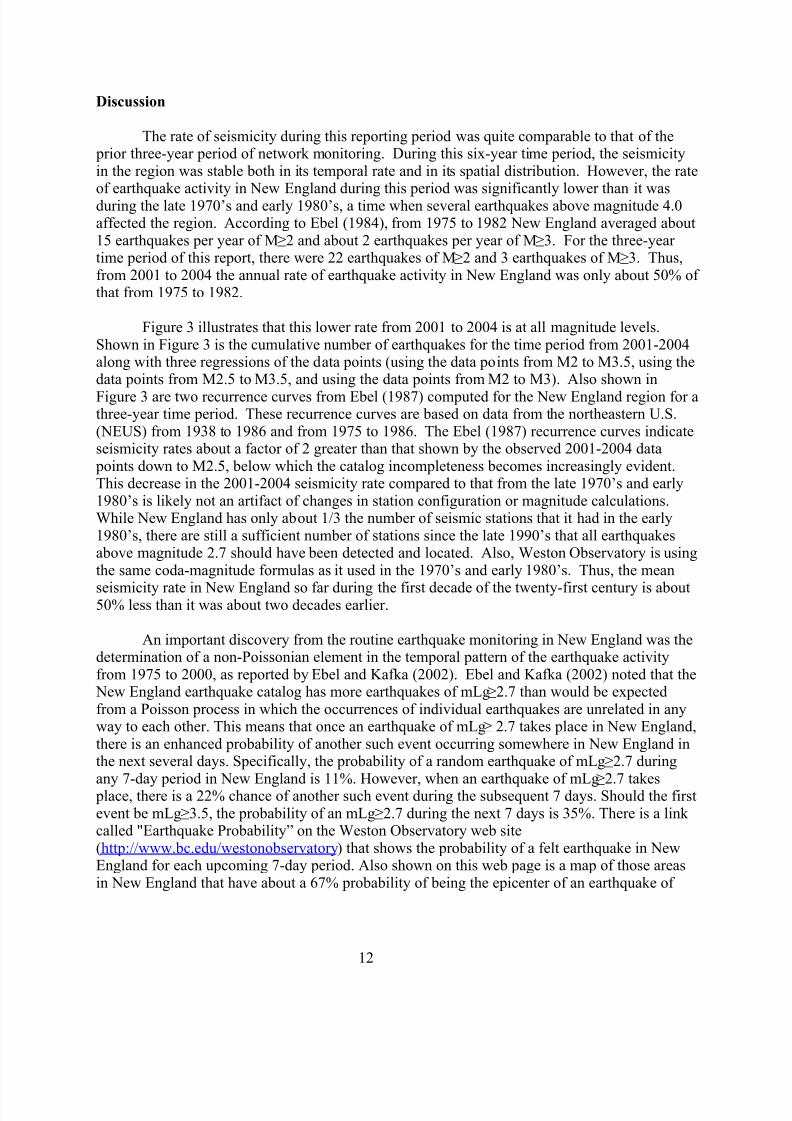
Figure 3 illustrates that this lower rate from 2001 to 2004 is at all magnitude levels.Shown in Figure 3 is the cumulative number of earthquakes for the time period from 2001-2004along with three regressions of the data points (using the data points from M2 to M3.5, using thedata points from M2.5 to M3.5, and using the data points from M2 to M3). Also shown in
Figure 3 are two recurrence curves from Ebel (1987) computed for the New England region for athree-year time period. These recurrence curves are based on data from the northeastern U.S.(NEUS) from 1938 to 1986 and from 1975 to 1986. The Ebel (1987) recurrence curves indicateseismicity rates about a factor of 2 greater than that shown by the observed 2001-2004 data points down to M2.5, below which the catalog incompleteness becomes increasingly evident.This decrease in the 2001-2004 seismicity rate compared to that from the late 1970’s and early1980’s is likely not an artifact of changes in station configuration or magnitude calculations.While New England has only about 1/3 the number of seismic stations that it had in the early1980’s, there are still a sufficient number of stations since the late 1990’s that all earthquakesabove magnitude 2.7 should have been detected and located. Also, Weston Observatory is usingthe same coda-magnitude formulas as it used in the 1970’s and early 1980’s. Thus, the mean
seismicity rate in New England so far during the first decade of the twenty-first century is about50% less than it was about two decades earlier.
An important discovery from the routine earthquake monitoring in New England was thedetermination of a non-Poissonian element in the temporal pattern of the earthquake activityfrom 1975 to 2000, as reported by Ebel and Kafka (2002). Ebel and Kafka (2002) noted that the New England earthquake catalog has more earthquakes of mLg≥2.7 than would be expectedfrom a Poisson process in which the occurrences of individual earthquakes are unrelated in anyway to each other. This means that once an earthquake of mLg≥ 2.7 takes place in New England,there is an enhanced probability of another such event occurring somewhere in New England inthe next several days. Specifically, the probability of a random earthquake of mLg≥2.7 during
any 7-day period in New England is 11%. However, when an earthquake of mLg≥
2.7 takes place, there is a 22% chance of another such event during the subsequent 7 days. Should the firstevent be mLg≥3.5, the probability of an mLg≥2.7 during the next 7 days is 35%. There is a link called "Earthquake Probability” on the Weston Observatory web site(http://www.bc.edu/westonobservatory) that shows the probability of a felt earthquake in NewEngland for each upcoming 7-day period. Also shown on this web page is a map of those areasin New England that have about a 67% probability of being the epicenter of an earthquake of
12

8/4/2019 Seismic Stations
http://slidepdf.com/reader/full/seismic-stations 13/17
mLg 2.7 during the 7-day period. This map is based on the work of Kafka and Levin (2000) andKafka (2002).
One goal of the NESN regional seismic monitoring in New England is to identifyseismically active structures and to assess the probabilities of future occurrences of strong
earthquakes on those structures. This long-term goal of the seismic monitoring is starting to paydividends. Ebel (2000) reported on a study of the main shock and aftershocks of the 1727 M5.5earthquake that probably was centered near Newburyport in northeastern Massachusetts. Thestudy by Ebel (2000) stimulated some field investigations in nearby coastal New Hampshire thathave uncovered evidence of liquefaction features and a suspected tsunami deposit from one or more strong earthquakes that took place in the area just over 2000 years ago (Tuttle, 2001; Tuttleet al., 2003). Further research is planned on investigating these geologic features to better document the size, location and dates of the past earthquakes in this area. This research supportsthe argument that regional seismic network monitoring provides important data for understanding the seismic hazard in northeastern North America.
2/2001-1/2004 New England
0.1
1
10
100
1000
0.5 1.5 2.5 3.5
Magnitude
Figure 3. Gutenberg-Richter recurrence data for New England earthquakes from February 2001through January 2004. Regression lines through the data points from magnitude 2.0 to 3.5, 2.5 to3.5 and 2.0 to 3.0 are shown, as are recurrence curves for a three-year time period from Ebel(1987) from NEUS data from 1938 to 1986 and 1975 to 1986. For the Ebel (1987) recurrencecurves, it was assumed that New England has half the spatial area of the entire northeastern U.S.
Continued regional earthquake monitoring by the NESN is planned by WestonObservatory to acquire new data for research into the seismotectonics and seismic hazard in NewEngland and vicinity. As new earthquakes are detected and located, new information will be
13

8/4/2019 Seismic Stations
http://slidepdf.com/reader/full/seismic-stations 14/17
gathered concerning the active tectonic structures in the region. Attention will be paid to anychanges in the rates of earthquake occurrence in the region. The efforts described earlier toinstall more regional seismic monitoring stations in the region are intended to reduce themagnitude threshold and increase the number of earthquakes detected routinely by the NESN.Efforts are also planned to initiate the installation of strong-motion seismic stations in the region
to better document the excitation and propagation of strong ground motions as well as to enablethe computation of ShakeMaps for the region.
References
Atkinson, G.M. and E. Sonley (2003). Ground Motions from the M5.0 2002 Au Sable Forks, New York Earthquake, Seism. Res. Lett., 74, 67.
Ebel, J.E. (1984). Statistical Aspects of the Recent Seismicity in New England and Implicationsfor Past and Future Activity, Bull Seism. Soc. Am., 74, 1311-1329.
Ebel, J.E. (1987). The Seismicity of the Northeastern United States, in Seismic Hazards, Ground Motions, Soil-Liquefaction and Engineering Practice in Eastern North America, K. Jacob, ed. NCEER symposium proceedings, NCEER-87-0025, 178-188.
Ebel, J.E. (2000). A reanalysis of the 1727 earthquake at Newbury, Massachusetts, Seism. Res. Lett. 71, 364-374.
Ebel, J.E. (2002). A new look at the 1755 Cape Ann, Massachusetts earthquake, Seism. Res. Lett. 73, 418-419.
Ebel, J.E. (2003). Ground Motions in New England from the 20 April 2002 Au Sable Forks, NY
Earthquake, Seism. Res. Lett., 74, 67.
Ebel, J.E. (2004). Update on a wavelet-based event detector and identifier at WestonObservatory, Seism. Res. Lett. 75, in press.
Ebel, J.E., K.-P. Bonjer and M.C. Oncescu (2000). Paleoseismicity: Seismicity evidence for pastlarge earthquakes, Seism. Res. Lett. 71, 283-294.
Ebel, J.E., and Kafka A.L., (2002). A Non-Poissonian Element in the Seismicity of the Northeastern United States, Bull. Seism. Soc. Am., 92, 2040-2046.
Gendron, P., J.E. Ebel, and D. Manolakis (2000). Rapid joint detection and classification withwavelet bases via Bayes theorem, Bull. Seism. Soc. Am. 90, 764-774.
Kafka, A.L. (2002). Statistical analysis of the hypothesis that seismicity delineates areas wherefuture large earthquakes are likely to occur in the Central and Eastern United States, Seism. Res. Lett., 73, 992-1003.
14

8/4/2019 Seismic Stations
http://slidepdf.com/reader/full/seismic-stations 15/17
Kafka, A.L. and S.Z. Levin (2000). Does the spatial distribution of smaller earthquakes delineateareas where larger earthquakes are likely to occur?, Bull. Seism. Soc. Am. 90, 724-738.
Seeber, L., W.-Y. Kim, J.G. Armbruster, W.-X. Du, A. Lerner-Lam, and P. Friberg (2002). The20 April 2002 Mw 5.0 earthquake near Au Sable Forks, Adirondacks, New York; A first glance
at a new sequence, Seism. Res. Lett. 73, 480-489.
Tuttle, M.P. (2001). Re-evaluation of earthquake potential and source in the vicinity of Newburyport, Massachusetts, USGS External Project No. 01HQGR0163 Report , USGS NEHRPExternal Research Program Reports, volume 43.
Tuttle, M.P., A. Witkowski, G. Daniszewska, J. Ebel and E. Myskowski, (2003). Evidence for aLarge Earthquake near Newburyport, Massachusetts about 2,000 Years Ago, Seism. Res. Lett.,74, 253.
Zhu, L. and J.E. Ebel (2004). Automated seismic signal identification algorithm for the NewEngland seismic network based on a seismic signal/noise (SNR) spectral model, Seism. Res. Lett.
75, in press.
Publications Using Data from the New England Seismic Network
Ebel, J.E. (2003). Seismologists Must Begin Forecasting Earthquakes, Opinion, Seism. Res. Lett., 74, 3-5.
Ebel, J.E. (2003). When Will the Earth Move?, Comment and Analysis, NewScientist , 177, no.2388, p. 29.
Ebel, J.E. (2002). Watching the Weather Using a Seismograph, Eduquakes column, Seism. Res. Lett., 73, 930-932.
Ebel, J.E. and K.A. Hart (2001). Observational Evidence for Amplification of EarthquakeGround Motions in Boston and Vicinity, Civil Engineering Practice, 16, no. 2, 5-16.
Ebel, J.E., and A.L. Kafka (2002). A Non-Poissonian Element in the Seismicity of the Northeastern United States, Bull. Seism. Soc. Am., 92, 2040-2046.
Ebel, J.E. and M.P. Tuttle (2002). Earthquakes in the Eastern Great Lakes Basin from a regional
perspective, Tectonophysics, 353, 17-30, 2002.
Ebel, J.E., A. Urzua and J. Britton (2003). The Expected Effect of Local Surficial Geology onthe Ground Motions of Future Earthquakes in Boston, Massachusetts, Proceedings Volume 1,Soil and Rock America 2003, 12
thPanamerican Conference on Soil Mechanics, 39
thU.S. Rock
Mechanics Symposium,221-228, 2003.
15

8/4/2019 Seismic Stations
http://slidepdf.com/reader/full/seismic-stations 16/17
Ebel, J.E., and D.J. Wald (2003). Bayesian Estimations of Peak Ground Acceleration and 5%Damped Spectral Acceleration from Modified Mercalli Intensity Data, Earthquake Spectra, 19,511-529.
Hayles, K.E., J.E. Ebel and A. Urzua (2001). Microtremor Measurements to Obtain Resonant
Frequencies and Ground Shaking Amplification for Soil Sites in Boston, Civil Engineering Practice, 16, no. 2, 17-36.
Kafka, A.L. (2002). Statistical analysis of the hypothesis that seismicity delineates areas wherefuture large earthquakes are likely to occur in the Central and Eastern United States, Seism. Res. Lett., 73, 992-1003.
Published Abstracts Using Data from the New England Seismic Network
Atkinson, G.M. and E. Sonley (2003). Ground Motions from the M5.0 2002 Au Sable Forks, New York Earthquake, Seism. Res. Lett., 74, 67.
Britton, J.M., J.E. Ebel and A. Urzua (2002). Seismic Microzonation of the Boston Area, Seism. Res. Lett., 72, 126.
Chambers D., J.E. Ebel, A.L. Kafka and J. Baglivo (2003). A Hidden Markov Approach toModeling Interevent Earthquake Times, Eos Trans. AGU, 84 (46), Fall Meet. Suppl. AbstractS52F-0178.
Cramer, C.H. ad J.E. Ebel (2003). How Might New England Liquefaction Features AffectSeismic Hazard Maps?, Seism. Res. Lett., 74, 72.
Ebel, J.E. (2004). Update on a wavelet-based event detector and identifier at WestonObservatory, Seism. Res. Lett. 75, in press.
Ebel, J.E. (2003). Ground Motions in New England from the 20 April 2002 Au Sable Forks, NYEarthquake, Seism. Res. Lett., 74, 67.
Ebel, J.E. (2003). Implications of the Paleoseismicity Model for Earthquake Recurrence Ratesin the Central and Eastern United States, Seism. Res. Lett., 74, 244.
Ebel, J.E. (2003). Ground Motions in New England from the 20 April 2002 Au Sable Forks, NYEarthquake, Seism. Res. Lett., 74, 67.
Ebel, J.E. (2003). Using Chimney Damage to Estimate Earthquake Ground Motions in Bostonfrom the 1755 Cape Ann, Massachusetts Earthquake, Seism. Res. Lett., 74, 72.
Ebel, J.E. (2002). A new look at the 1755 Cape Ann, Massachusetts earthquake, Seism. Res. Lett. 73, 418-419.
16

8/4/2019 Seismic Stations
http://slidepdf.com/reader/full/seismic-stations 17/17
17
Ebel, J.E. (2002). A new look at the 1755 Cape Ann, Massachusetts earthquake, Seism. Res. Lett. 73, 418-419.
Ebel, J.E. (2001). Bayesian estimations of 5% damped spectral accelerations from MMI data,Seism. Res. Lett. 72, 234.
Ebel, J.E. (2001). A new look at the 1755 Cape Ann, Massachusetts earthquake, Eos, Trans. Am.Geophys. U. 82, S271.
Ebel, J.E. and A.L. Kafka (2001). Evidence for nonrandom clustering of seismicity inearthquake catalogs, IAGA-IASPEI 2001 Abstracts, 298.
Ebel, J.E. and A.L. Kafka (2001). Probabilities of Felt Earthquakes for the New EnglandRegion, Seism. Res. Lett., 72, 128.
Ebel, J.E. and A. Urzua (2001). The expected effect of local surficial geology on the groundmotions of future earthquakes in Boston, Massachusetts, GSA Annual Meeting and Exposition
Abstracts, 33, A-284.
Kafka, A.L. (2003). Statistical analysis of the hypothesis that seismicity delineates areas wherefuture large earthquakes are likely to occur in the central and Eastern United States, Seism. Res. Lett., 74, 70.
Kafka, A.L. (2002). Seismicity as an indicator of where future large earthquakes are likely tooccur in the central and Eastern United States, Seism. Res. Lett., 73, 425.
Kafka, A.L. (2001). Cellular seismology; does the spatial distribution of seismicity delineatewhere future large earthquakes are likely to occur? , Seism. Res. Lett., 72, 129.
Quitoriano, V., D.J. Wald, M.F. Hattori and J. Ebel (2002). Magnitude, Location, and GroundMotion Estimates Derived from the Community Internet Intensity, Eos, Trans. Am. Geophys. U. 83, F1072, supplement.
Rasmusson, K. and A.L. Kafka (2003). Probabilistic analysis of social and economic losses dueto large earthquakes in New England, Seism. Res. Lett., 74, 71-72.
Tuttle, M.P., A. Witkowski, G. Daniszewska, J. Ebel and E. Myskowski (2003). Evidence for aLarge Earthquake near Newburyport, Massachusetts about 2,000 Years Ago, Seism. Res. Lett.,74, 253.
Zhu, L. and J.E. Ebel (2004). Automated seismic signal identification algorithm for the NewEngland seismic network based on a seismic signal/noise (SNR) spectral model, Seism. Res. Lett. 75, in press.


![Soviet Seismographic Stations and Seismic Instruments, Part Imotion instruments usually used at the base stations are the SMR-2, an improved version--the SMTR, and the SSS [1-3]. Regional](https://static.fdocuments.in/doc/165x107/5e302c1dce0a7208dd7013bd/soviet-seismographic-stations-and-seismic-instruments-part-i-motion-instruments.jpg)