Seismic Demands for Performance-Based Design of...
29
Seismic Demands for Performance-Based Design of Bridges Kevin Mackie Bozidar Stojadinovic University of California, Berkeley Department of Civil and Environmental Engineering PEER Annual Meeting January 25-26th, 2001 Project #: 3122000
Transcript of Seismic Demands for Performance-Based Design of...

Seismic Demands forPerformance-Based Design of
Bridges
Kevin Mackie
Bozidar Stojadinovic
University of California, BerkeleyDepartment of Civil and Environmental Engineering
PEER Annual MeetingJanuary 25-26th, 2001
Project #: 3122000

Project Objective
Develop a probabilistic demand model fortypical new bridges in California
0 5 10 15 20 25 30 35-0.1
-0.05
0
0.05
0.1
0.15
time [sec]
acce
lera
tion
[g]
DemandModel
IntensityMeasures
DamageMeasures
CapacityModel
Hazard Performance
DecisionVariables
This project

Seismicity: Intensity Measures• Structure Independent Measures
• Magnitude• Distance• Arias intensity (acceleration & velocity)• Cumulative absolute velocity• Cumulative absolute displacement• Frequency ratios• Strong motion duration• RMS acceleration• Characteristic intensity• PGA, PGV, PGD
• Structure Dependent Measures• Sa, Sv, Sd• Sd,inelastic
Demand: Damage Measures
• Steel strain es
• Concrete strain ec
• Curvature ductility• Displacement ductility• Drift ratio• Residual displacement index• Plastic rotation• Hysteretic energy• Normalized hysteretic energy• Maximum column curvature

OpenSees Bridge Model
Ground level
Soil springs
Abutmentsprings and gaps
Elastic deck
Fiber RC column

Ground Motion Portfolio
Ground Motion Bins
5.6
5.8
6.0
6.2
6.4
6.6
6.8
7.0
0.0 10.0 20.0 30.0 40.0 50.0 60.0 70.0
Distance R (km)
SMSR
LMSR LMLR
SMLR

Bridge Portfolio
• Skew degree of skewness 0-50º• L span length 60-180 ft• L/h span to column height ratio 1.2-2.0• fy steel strength 68-95 ksi• f’c concrete strength 3-8 ksi• rs,long column longitudinal reinforcement 1-4%• Dc/Ds column to superstructure dimensions 0.67-1.33• Ksoil NEHRP soil group B,C,D• Wt additional superstructure weight 0.1-50%• rs,trans column transverse reinforcement 0.4-1.0%
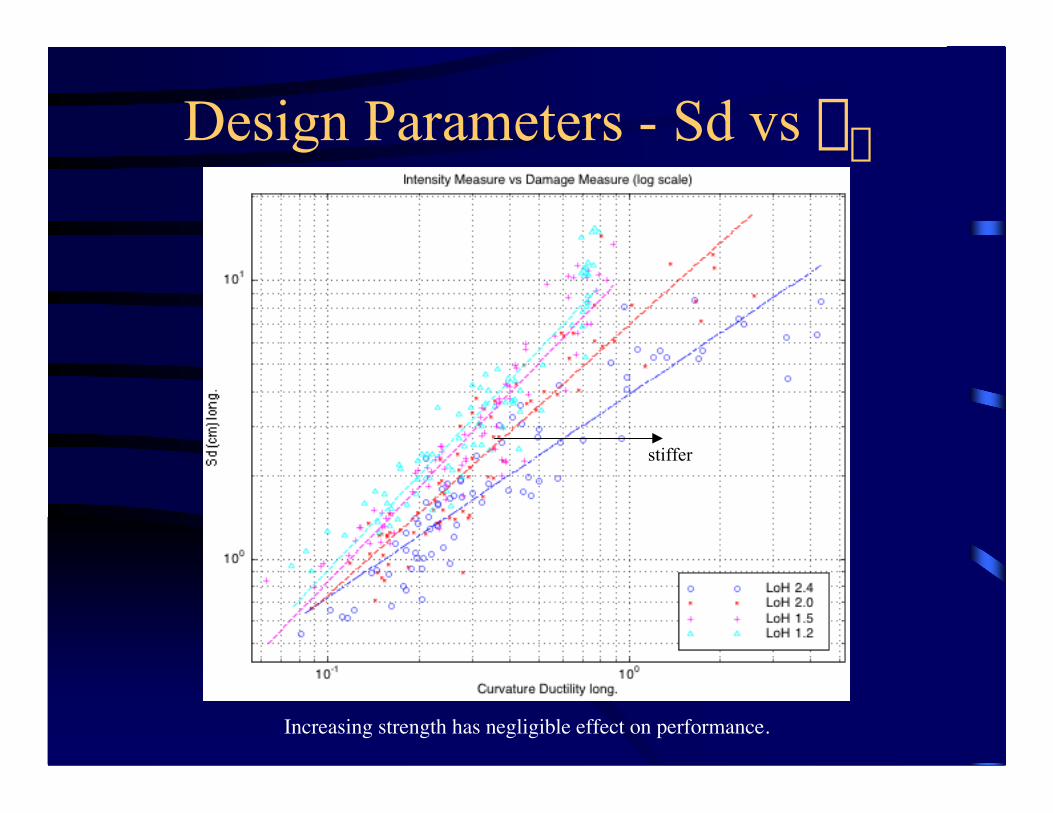
Design Parameters - Sd vs mf
stiffer
Increasing strength has negligible effect on performance.

Seismicity - Sd vs mf
LoH

Design Parameters - Sd vs RDI
Poor DM choice

Seismicity - Sd vs RDI
LoH - Poor DM choice

Design Parameters - Sd vs mf
Design parameter does not affect performance

Design Parameters - Sd vs mf
stiffer
Increasing strength lowers demand. Slope similar for linear case

Design Parameters - Sd vs mf
stiffer
Increasing strength lowers demand. Slope increases with strength for nonlinear case
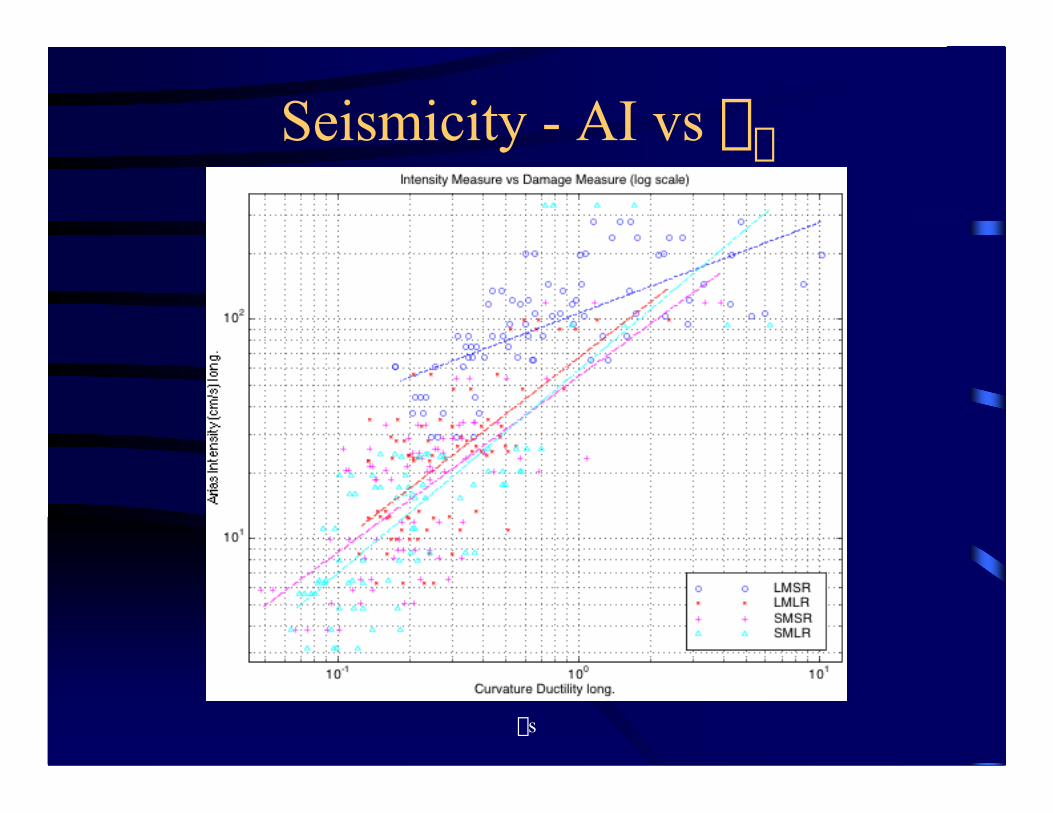
Seismicity - AI vs mf
rs

Design Parameters - AI vs mf
stiffer
Increasing strength lowers demand

Seismicity - VI vs mf
rs

Design Parameters - VI vs mf
stiffer
Increasing strength lowers demand, high scatter

Seismicity - PGA vs mf
rs

Design Parameters - PGA vs mf
stiffer
Increasing strength lowers demand

Seismicity - PGD vs mf
rs - poor IM choice

Design Parameters - PGD vs mf
stiffer
Poor IM choice

Seismicity - CAV vs mf
rs

Design Parameters - CAV vs mf
stiffer
Increasing strength lowers demand

Seismicity - CAD vs mf
rs - poor IM choice

Design Parameters - CAD vs mf
stiffer
Poor IM choice

Current Status
• All ground motions and all bridgeparameters successfully run
• Specific bridge has complete database of allIM-DM combinations
• Abutment dominated performance for shortbridge creates long/trans data discrepancy

Immediate Future
• Evaluate all DM-IM combinations andtrends
• Refine abutment model
• Address other bridge configurations withselect few DM-IM pairs
• M, R dependence of DM
• Comparison with SDOF and simpleranalysis techniques

Conclusion
• Formulate a demand model that fits intoPEER performance-based designframework
• Allow designers to see the effects of:
– seismicity
– design parameters
on seismic performance of a bridge