Seismic assessment of guyed towers: A case study … fileSeismic assessment of guyed towers: A case...
7
Seismic assessment of guyed towers: A case study combining field measurements and pushover analysis A. Ismail HBRC, Structure and Metallic Institute, Egypt Received 9 June 2014; revised 28 June 2014; accepted 29 June 2014 KEYWORDS Guyed tower; Ambient vibration; Seismic assessment; Pushover analysis Abstract Telecommunication structures are essential components of communication and post-disaster networks that must remain operational after a designlevel of earthquake. This study provides dynamic field measurements of 138 m guyed tower located at Qussia city, Upper Egypt. In situ measurements of ambient tower vibrations are used to determine the dominant natural frequencies of the tower. The measurements were made using a LMS SCADAS system and four wireless vibration sensors for recording the ambient vibrations of the mast. The tension in the guy wires was measured by mechanical equipment. The dynamic properties of the guyed mast (natural frequencies and mode shapes) were extracted from these measurements. Results of the eigenvalue analysis of numerical models of the tower were compared with the natural frequencies and mode shapes extracted from the in situ measurements. The field measurements were used to update the finite element model. The nonlinear static analysis based on the updated finite element model was carried out. Seismic assessment and comparison between the original and updated models taking into account the deterioration in elements are presented. ª 2014 Production and hosting by Elsevier B.V. on behalf of Housing and Building National Research Center. Introduction Guyed towers are characterized by their light weight, flexibility and often large size. All these characteristics make them very sensitive to time dependent loading such as wind and earth- quake loadings. In emergency situations like especially after a severe earthquake, the access to telecommunication and broadcast services is one of the main advantages of using tele- communication masts. Several published studies have used detailed nonlinear dynamic analysis of tall guyed masts using finite element mod- els, either to predict the response of specific structures or to develop simplified analysis procedures more amenable to design practice. Amiri [1] applied three-dimensional compo- nents of the El Centro, Parkfield, and Taft earthquakes to eight guyed telecommunication masts with heights varying E-mail address: [email protected] Peer review under responsibility of Housing and Building National Research Center. Production and hosting by Elsevier HBRC Journal (2016) 12, 47–53 Housing and Building National Research Center HBRC Journal http://ees.elsevier.com/hbrcj http://dx.doi.org/10.1016/j.hbrcj.2014.06.014 1687-4048 ª 2014 Production and hosting by Elsevier B.V. on behalf of Housing and Building National Research Center.
Transcript of Seismic assessment of guyed towers: A case study … fileSeismic assessment of guyed towers: A case...

HBRC Journal (2016) 12, 47–53
Housing and Building National Research Center
HBRC Journal
http://ees.elsevier.com/hbrcj
Seismic assessment of guyed towers: A case
study combining field measurements and pushover
analysis
E-mail address: [email protected]
Peer review under responsibility of Housing and Building National
Research Center.
Production and hosting by Elsevier
http://dx.doi.org/10.1016/j.hbrcj.2014.06.014
1687-4048 ª 2014 Production and hosting by Elsevier B.V. on behalf of Housing and Building National Research Center.
A. Ismail
HBRC, Structure and Metallic Institute, Egypt
Received 9 June 2014; revised 28 June 2014; accepted 29 June 2014
KEYWORDS
Guyed tower;
Ambient vibration;
Seismic assessment;
Pushover analysis
Abstract Telecommunication structures are essential components of communication and
post-disaster networks that must remain operational after a designlevel of earthquake. This study
provides dynamic field measurements of 138 m guyed tower located at Qussia city, Upper Egypt.
In situ measurements of ambient tower vibrations are used to determine the dominant natural
frequencies of the tower. The measurements were made using a LMS SCADAS system and four
wireless vibration sensors for recording the ambient vibrations of the mast. The tension in the
guy wires was measured by mechanical equipment. The dynamic properties of the guyed mast
(natural frequencies and mode shapes) were extracted from these measurements. Results of the
eigenvalue analysis of numerical models of the tower were compared with the natural frequencies
and mode shapes extracted from the in situ measurements. The field measurements were used to
update the finite element model. The nonlinear static analysis based on the updated finite element
model was carried out. Seismic assessment and comparison between the original and updated
models taking into account the deterioration in elements are presented.ª 2014 Production and hosting by Elsevier B.V. on behalf of Housing and Building National Research
Center.
Introduction
Guyed towers are characterized by their light weight, flexibilityand often large size. All these characteristics make them very
sensitive to time dependent loading such as wind and earth-quake loadings. In emergency situations like especially aftera severe earthquake, the access to telecommunication andbroadcast services is one of the main advantages of using tele-
communication masts.Several published studies have used detailed nonlinear
dynamic analysis of tall guyed masts using finite element mod-
els, either to predict the response of specific structures or todevelop simplified analysis procedures more amenable todesign practice. Amiri [1] applied three-dimensional compo-
nents of the El Centro, Parkfield, and Taft earthquakes toeight guyed telecommunication masts with heights varying

48 A. Ismail
from 150 m to 607 m. The base shear, vertical force in themast, and guy tensions were examined. Amiri et el. [2] analyzeda 342 m-tall mast with seven guy levels, and a 607 m-tall mast
with nine levels. A single horizontal component from the 1978Tabas earthquake in Iran was applied. The study included thespatial effect of the distances between the anchorage points
(multiple-support excitation). Time histories of lateral tip dis-placement, axial force in the mast, mast base shear and cabletension were presented. Guevara and McClure [3] considered
a 24 m-tall mast with two guy levels, and a 107 m-tall mastwith six guy levels. A scaled horizontal component from theEl Centro earthquake and one from the Parkfield earthquakewere applied. The time delay between the excitations at differ-
ent anchorage points of the guys and the mast was included inpart of the study. Time histories of guy tensions, shear forces,vertical forces, and displacements were presented. Madugula
et al. [4] determined the natural frequencies of guyed mastsby modelling the mast as truss elements in one model and asbeam-column elements in another model. Guys were modeled
as cable elements in both the cases. For verifying the models,two triangular steel latticed scale-modeled guyed masts werefabricated and tested on a shake table specially designed to test
guyed masts. The experimental results were compared with theresults from the finite element analysis. Then, the finite elementmodeling was applied to six existing towers. Meshmesha et al.[5] introduced an equivalent beam-column analysis based on
an equivalent thin plate approach for lattice structures. Afinite-element modeling, using ABAQUS software, is used toinvestigate the accuracy of utilizing the methods in determin-
ing the static and dynamic responses of a guyed tower of364.5 m subjected to static and seismic loading conditions.Then, the results are compared to those obtained from a
finite-element modeling of the actual structure using 3-D trussand beam elements. Fantozzi [6] studied the nonlinear analysisof a 607 m guyed tower, located in California region, with and
without mass irregularities. The analysis considered both in-phase and out-of-phase base motion for comparison. Theresults of the nonlinear analyses were compared to thoseobtained using the equivalent lateral force method introduced
by codes. Hensley [7], developed a finite element model of a120-m tall mast using ABAQUS. The three-dimensionalresponse of the mast was modeled when subjected to two
ground motion records, Northridge, and El Centro, with threeorthogonal components. Hensley conducted a parametricstudy on the dominant structural parameters, and the results
were used to characterize the trends in the structural responseof guyed masts. The recent work of Oskoei Ghafari and McC-lure [8,9] proposed a simplified seismic analysis procedurebased on the evaluation of the equivalent horizontal dynamic
stiffness of guy clusters supporting the mast.In recent years, nonlinear static analyses (pushover analy-
sis) have received a great deal of research attention within
the earthquake engineering community. Their main goal is todescribe the nonlinear capacity of a structure when subjectto horizontal loading with a reduced computational effort with
respect to nonlinear dynamic analysis. Pushover methods areparticularly indicated for assessing existing structures (Ferra-cuti et al. [10]).
Mara [11] compared the capacity estimates obtained usingthe incremental dynamic analysis (IDA) and nonlinear staticpushover (NSP) procedures. The analyses consider both geo-metric and material nonlinearities. The NSP analysis is used
to estimate the capacity of the tower under various wind pro-files for the transverse and longitudinal wind directions. Zhang[12] presented a detailed study of the post-elastic response of
latticed towers combining advanced (highly nonlinear) finiteelement analysis and full-scale dynamic testing of four towersection prototypes. He performed the nonlinear static and
transient dynamic analysis of transmission towers and com-pared the results with results obtained from the dynamic tests.
Qian et al. [13] checked common software SAP2000 in non-
linear static analysis of complex large span steel structures. Theresults showed that it is possible to get a good accuracy of thehighest load that a complex steel structure can reach throughthe pushover analysis in SAP2000 [14].
Ambient vibration measurements (AVM) have been widelytouted as a practical modal identification technique, mainlydue to the easy and relatively inexpensive setup required to
perform them, as well as the fact that the dynamic propertiesare obtained under the actual operating conditions of thestructure. Many methods have been developed over the years
to extract the dynamic properties of structures from their mea-sured ambient response. It is a simple yet robust technique,known as Frequency Domain Decomposition (FDD), which
has gained wide popularity in the last decade (Brincker et al.[15,16]; Brownjohn [17]; Gentile and Saisi [18]; Lamarcheet al. [19]). Refinements of this method have led to the devel-opment of the Enhanced Frequency Domain Decomposition
method (EFDD).Although the ambient vibration measurements (AVM)
have recently been extensively applied to large civil structures
such as bridges, dams, high rise buildings and large grand-stands, there are a few works concerning dynamic assessmentof guyed towers using field measurements. Oskoei Ghafari et
el. [20] provide a case study of experimental validation usingambient vibration measurement (AVM) tests for evaluatingthe accuracy of numerical studies. These tests were done on
a 111.2-m tall mast owned by Hydro-Quebec and located atSt. Hyacinthe, Quebec, Canada. The dynamic properties ofthe guyed mast extracted from AVM records are comparedwith those obtained from nonlinear finite element analysis
models. The first few natural frequencies of the structureobtained from adjusted finite element models are comparedwith those obtained by AVM identification. A series of earth-
quake simulations on the ‘‘verified’’ model explore the influ-ence of cable tension variability on a few salient towerresponse indicators.
In this study, a full scale dynamic test using AVM of a138 m guyed tower was conducted. An updated 3D finite ele-ment model was then built taking into consideration the struc-ture’s parameters and atmospheric corrosion of the steel
sections. Finally, the pushover analysis was carried out forthe tower models, the updated models and the initial designmodel according to manufactured requirements. The compar-
ison of the results is presented.
Tower geometry
The latticed steel tower was constructed in 1966. It is squaredwith panel dimensions of 1.15 m · 1.15 m. It is supported lat-erally at five stay levels attached at three ground anchor groups
at distances 18.0 m, 76.8 m and 136.6 m from the tower axis(Fig. 1a). Each level is held by four guys with interval of 90

Fig. 1 Geometrical details of Qussia guyed tower.
Seismic assessment of guyed towers 49
degree in plan between them. The tower supports two commu-
nication antennas with 1.2 m in diameter at different elevationsand transmission lines that carry the antenna signal to the tele-communication base station located in the equipment shelteradjacent to the tower.
The tower is built-up using two steel UPN sections of size120 · 7 mm back-to-back as vertical legs. Steel angles of sizeL 70 · 7 mm constitute the inclined bracing at 120 cm spacing
on all faces (Fig. 1b). The steel section is made of mild steelhaving a Young’s modulus E = 2 · 1011 N/m2, Poisson’s ratiom = 0.3 and density q = 7850 kg/m3. The structure is modeled
as pinned at the base of the mast. This pinned connection pro-vides translational restraints (three degrees of freedom), whileit allows rotations.
Urban sprawl near communication installations worsensthe atmospheric climate around the steel towers whichincreases the corrosion process with time. Pedro and Hall[21] suggest a range of loss per surface for steel section about
0.005 mm/year for rural environments. The loss for tower’ssteel sections was calibrated according to the AVM in therange of 0–0.24 mm. These values are essential to get accurate
FEM update.Fig. 2 shows the general layout of the structure and the sup-
porting element’s details.
Table 1 shows the structural properties of the cables. Thetension forces in cables were measured using a mechanicalinstrument (Tensitron instrument).
Ambient vibration testing procedure
The test was carried out using a LMS SCADAS system and
four wireless vibration sensors attached to the mast only. Aseries of measurements was taken in the morning with arecorded temperature of 24 �C. Another series was taken witha recorded temperature of 32 �C.
The LMS Test Lab PolyMAX software was used for trans-
ferring the collected data from the sensors to the laptop com-puters and carrying out data truncation and synchronizationbased on the time stamps in the individual data files. Identify-ing the dynamic characteristic of the structure (natural fre-
quencies and mode shapes) was done using PolyMAXparameter estimation method. PolyMAX operates on spectraor half spectra (i.e. the Fourier transform of the positive time
lags of the correlation functions). The main advantage of Poly-MAX is that it yields extremely clear stabilization diagrams,making an automation of the parameter identification process
rather straightforward. This enables a continuous monitoringof the dynamic properties of a structure (Peters et al. [22]).
Fig. 3 shows the recorded time history obtained by AVM.
Using LMS polymax automatic option, the natural frequenciesof the guyed tower were obtained. Due to the limited numberof sensors, the torsion mode and cable natural frequenciescould not be accurately determined. The mode shapes of the
best three lower frequencies of the guyed tower are shown inFig. 4. As there are two sets of AVM with different tempera-tures, the corresponding natural frequencies of the guyed
tower were obtained accordingly. The variation of values ofthese natural frequencies was not significant, it was in therange 0.5–1%. In practice, temperature records would not be
available at various positions in the tower and of each cable.So, the average temperature between the two records wastaken equal to 28 �C when evaluating FEM model.
Finite element model
The finite element analysis software SAP2000 [14] was adapted
to perform the analysis of the guyed tower. The mast is mod-eled as a three-dimensional truss and the cables as pretensioncable elements. Three cases were carried out: (1) initialdesigned stage with initial designed cable tension To (at start
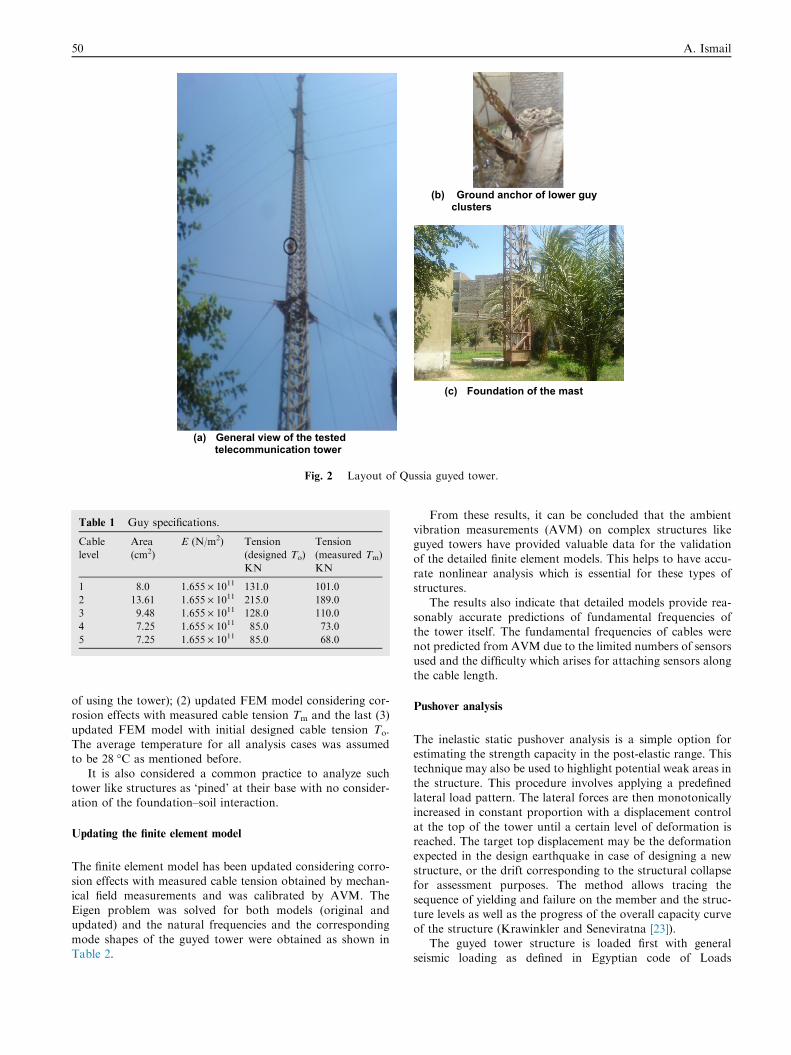
(a) General view of the tested telecommunication tower
(b) Ground anchor of lower guy clusters
(c) Foundation of the mast
Fig. 2 Layout of Qussia guyed tower.
Table 1 Guy specifications.
Cable
level
Area
(cm2)
E (N/m2) Tension
(designed To)
KN
Tension
(measured Tm)
KN
1 8.0 1.655 · 1011 131.0 101.0
2 13.61 1.655 · 1011 215.0 189.0
3 9.48 1.655 · 1011 128.0 110.0
4 7.25 1.655 · 1011 85.0 73.0
5 7.25 1.655 · 1011 85.0 68.0
50 A. Ismail
of using the tower); (2) updated FEM model considering cor-rosion effects with measured cable tension Tm and the last (3)
updated FEM model with initial designed cable tension To.The average temperature for all analysis cases was assumedto be 28 �C as mentioned before.
It is also considered a common practice to analyze suchtower like structures as ‘pined’ at their base with no consider-ation of the foundation–soil interaction.
Updating the finite element model
The finite element model has been updated considering corro-
sion effects with measured cable tension obtained by mechan-ical field measurements and was calibrated by AVM. TheEigen problem was solved for both models (original andupdated) and the natural frequencies and the corresponding
mode shapes of the guyed tower were obtained as shown inTable 2.
From these results, it can be concluded that the ambient
vibration measurements (AVM) on complex structures likeguyed towers have provided valuable data for the validationof the detailed finite element models. This helps to have accu-
rate nonlinear analysis which is essential for these types ofstructures.
The results also indicate that detailed models provide rea-
sonably accurate predictions of fundamental frequencies ofthe tower itself. The fundamental frequencies of cables werenot predicted from AVM due to the limited numbers of sensorsused and the difficulty which arises for attaching sensors along
the cable length.
Pushover analysis
The inelastic static pushover analysis is a simple option forestimating the strength capacity in the post-elastic range. Thistechnique may also be used to highlight potential weak areas in
the structure. This procedure involves applying a predefinedlateral load pattern. The lateral forces are then monotonicallyincreased in constant proportion with a displacement control
at the top of the tower until a certain level of deformation isreached. The target top displacement may be the deformationexpected in the design earthquake in case of designing a new
structure, or the drift corresponding to the structural collapsefor assessment purposes. The method allows tracing thesequence of yielding and failure on the member and the struc-ture levels as well as the progress of the overall capacity curve
of the structure (Krawinkler and Seneviratna [23]).The guyed tower structure is loaded first with general
seismic loading as defined in Egyptian code of Loads

Fig. 3 LMS recorded data and corresponding evaluated natural frequencies.
Fig. 4 Mode shapes of the best three lower frequencies.
Table 2 Comparison of guyed tower natural frequencies.
Vibration mode Natural frequency (Hz)
Measured Original FE model Updated FE model
1 1.32 1.68 1.35
2 1.56 1.97 1.61
3 1.92 2.25 1.97
Fig. 5 Risk indicator curve.
Seismic assessment of guyed towers 51
(ECP201-2012) [24] and then pushover load is applied mono-tonically on its deformed configuration. ECP201 states thedesign horizontal acceleration as 0.15 g for this site zone.
The footings of the guyed tower are located on medium tocoarse sand, which can be classified as the class type ‘‘C’’according to the ECP201.
After yielding, plastic hinges will form at different locationsindicating the risk of occupancy as shown in Fig. 5. The per-formance point is calculated from the guidelines defined in
ATC-40 [25] and FEMA-356 [26] which are well known docu-ments used to perform pushover analysis. In SAP2000, hinges
will be added at each stage when the cross section yields to theprescribed level defined in FEMA-356 and ATC-40. The per-formance of the structure is determined by hinges formation.
The main goal of the upcoming analysis is to develop acomplete pushover analysis up to collapse for the structuralconfigurations representing the updated FEM for the guyed

6a. First step 6b. 6th step 6c. Last step (11th)
Fig. 6 Plastic hinge formation of the updated FEM with Tm.
Fig. 7 Capacity/demand spectrum.
Fig. 8 Base shear versus top displacement.
52 A. Ismail
tower. Then a comparison of the pushover capacity curve forthe updated FEM and the initial FEM will be discussed.
Results and discussion
The deformed shapes and plastic hinges of the guyed towershown in Fig. 1 are presented in Fig. 6 for the updated FEM
with Tm. The capacity–demand curve is plotted as shown inFig. 7. The behavior of the structure is observed, with uniqueindicator until the failure occurs.
The base shear-top displacement relationships obtained bypushover analysis for the three cases considered are presentedin Fig. 8. It is noted that the maximum base shear for updated
FEM with measured Tm is about 65% of values of initialdesign case with initial cable tension To. The top displacementof updated FEM with initial cable tension To is 15% lower
than the displacement of same point of initial design case withTo. The process of re-tensioning cables to their initial tensionwith considering the corrosion of the steel elements with timeenhances the response of the guyed tower to seismic force.
The base shear in this case will be about 50% greater than thatof updated FEM with measured Tm. But the effect of corrosionof steel elements reduces the seismic base shear by about 15%
of the designed values. These results suggest that initially cabletensions are a very influential parameter on the guyed towerseismic response.
Conclusions
The ambient vibration measurements (AVM) on complex
structures like guyed towers have provided valuable data forthe validation of the detailed finite element models. Dynamicfield measurements of 138 m guyed tower located at Qussiacity, Upper Egypt have been used to determine the dominant
natural frequencies of the tower. However, there are some lim-itations in the field measurements. One of them is related to thelimited number of sensors especially for the cable element and
the difficulty of attaching sensors along the cable length.The finite element model has been updated considering cor-
rosion effect and calibrated by AVM with the measured cable
tension obtained by mechanical field measurements. The
Seismic assessment of guyed towers 53
detailed models provide reasonably accurate predictions offundamental frequencies of the tower itself. Cable tensionsare a very influential parameter on the dynamic characteristic
of the mast. The ambient vibration measurements (AVM) havea good benefit to perform accurate nonlinear analysis which isessential for these types of structures.
A complete pushover analysis up to collapse for the struc-tural configurations representing the updated FEM for theguyed has been performed. The updated finite element model
leads to evaluate the exact ultimate behavior of seismic resis-tance. The corrosion of tower’s steel elements has a significanteffect on tower’s seismic resistance. Also, the study proves theimportance of the variability in cable tension on the seismic
response of the structure.
Conflict of interest
None.
References
[1] G.G. Amiri, Seismic sensitivity indicators for tall guyed
telecommunication towers, Comput. Struct. 80 (2002) 349–364.
[2] G.G. Amiri, M. Zahedi, R.S. Jalali, Multiple-support seismic
excitation of tall guyed telecommunication towers, in:
Proceedings of the 13th World Conference on Earthquake
Engineering, 2004. Paper No. 212.
[3] E.I. Guevara, G. McClure, Nonlinear seismic response of
antenna-supporting structures, Comput. Struct. 47 (4/5) (1993)
711–724.
[4] M.K.S. Madugula, Y.M.F. Wahba, G.R. Monforton, Dynamic
response of guyed masts, Eng. Struct. 20 (12) (1998) 1097–1101.
[5] H. Meshmesha, K. Sennah, J.B. Kennedy, Simple method for
static and dynamic analyses of guyed towers, Struct. Eng. Mech.
23 (2006) 635–649.
[6] M.W. Fantozzi, Seismic design of communication towers,
ASCE Report, 2006.
[7] G.M. Hensley, Finite element analysis of the seismic behavior of
guyed masts (Master thesis), Virginia Polytechnic Institute and
State University, USA, 2005.
[8] S.A. Oskoei Ghafari, G. McClure, A novel approach to evaluate
the equivalent dynamic stiffness of guy clusters in
telecommunication masts underground excitation, Eng. Struct.
33 (2011) 1764–1772.
[9] S.A Oskoei Ghafari, G. McClure, A new robust linearized
seismic analysis method for tall guyed telecommunication masts,
ASCE J. Struct. Eng. 138 (4) (2012) 502–513.
[10] B. Ferracuti, R. Pinho, M. Savoia, R. Francia, Verification of
displacement-based adaptive pushover through multi-ground
motion incremental dynamic analyses, Eng. Struct. 31 (2009)
1789–1799.
[11] Thomas G. Mara, Capacity assessment of a transmission tower
under wind loading (Ph.D. thesis), The School of Graduate and
Postdoctoral Studies, the University of Western Ontario
London, Ontario, Canada, 2013.
[12] Xiaohong Zhang, Dynamic post-elastic response of transmission
towers (Ph.D. thesis), Department of Civil Engineering and
Applied Mechanics, McGill, Montreal, Quebec, Canada, 2009.
[13] J.R. Qian, W.J. Zhang, X.D. Ji, Application of pushover
analysis on earthquake response predication of complex large-
span steel structures, The 14th World Conference on
Earthquake Engineering, Beijing, China, October 12–17, 2008.
[14] SAP2000, Integrated Software for Structural Analysis and
Design, V. 16.0, Computers & Structures, Inc., Berkeley,
California, USA, 2013.
[15] R. Brincker, P. Andersen, Ambient response analysis modal
analysis for large structures, Sixth International Congress on
Sound and Vibration, Copenhagen, Denmark, 1999.
[16] R. Brincker, L. Zhang, P. Anderson, Modal identification of
output-only systems using frequency domain decomposition,
Smart Mater. Struct. 10 (2001) 441–445.
[17] J.M.W. Brownjohn, Ambient vibration studies for system
identification of tall buildings, Earthquake Eng. Struct.
Dynam. 32 (2003) 71–95.
[18] C. Gentile, A. Saisi, Ambient vibration testing of historic
masonry towers for structural identification and damage
assessment, Constr. Build. Mater. 21 (2007) 1311–1321.
[19] C.P. Lamarche, P. Paultre, J. Proulx, S. Mousseau, Assessment
of the frequency domain decomposition technique by forced-
vibration tests of a full-scale structure, Earthquake Eng. Struct.
Dynam. 37 (2008) 487–494.
[20] M. Osgoie Ghafari, G. McClure, X. Hong Zhang, D. Gagnon,
Assessing the variability of seismic response analysis of tall
guyed telecommunication tower with ambient vibration
measurement, in: Proceedings of the 15th World Conference
Earthquake Engineering (15WCEE), Lisbon, Portugal,
September 24–28, 2012. Paper No. 0733.
[21] Albrecht Pedro, T.T. Hall, Atmospheric corrosion resistance of
structural steels, J. Mater. Civil Eng. (2003) 2–24, January/
February.
[22] B. Peters, F. Vanhollebeke, P. Guillaume, H. Van der Auweraer,
Operational modal analysis for estimating the dynamic
properties of a stadium structure during a football game, J.
Shock Vibr. 14 (2007) 283–303.
[23] Helmut Krawinkler, G.D.P.K. Seneviratna, Pros and cons of a
pushover analysis of seismic performance evaluation, Eng.
Struct. 20 (1998) 452–464.
[24] The Egyptian Code of Loads, ECP-201, HBRC 5 (2012) 108–
158.
[25] Applied Tech Council (ATC), Seismic Evaluation and Retrofit
of Concrete Building, ATC 40, 1996.
[26] Federal Emergency Management Agency, FEMA-356, Pre-
standard and Commentary for Seismic Rehabilitation of
Buildings, Washington DC, 2000.

![Guidelines for Telecommunications Structures · PDF fileladders – design, construction and installation [7] ... Terrain category for lattice towers and guyed masts shall be determined](https://static.fdocuments.in/doc/165x107/5aa90c277f8b9a90188c5250/guidelines-for-telecommunications-structures-design-construction-and-installation.jpg)