SEGMENTATION OF THE LEATHER FOOTWEAR MARKET FOR …
228
SEGMENTATION OF THE LEATHER FOOTWEAR MARKET FOR BUSINESS WEAR AS DETERMINED BY PRODUCT INVOLVEMENT AND PRODUCT ATTRIBUTES OF FEMALE AND MALE CONSUMERS by LESLIE ERNST EVERSON, B.S. A THESIS IN CLOTHING, TEXTILES, AND MERCHANDISING Submitted to the Graduate Faculty of Texas Tech University in Partial Fulfillment of the Requirements for the Degree of MASTER OF SCIENCE Approved May, 2002
Transcript of SEGMENTATION OF THE LEATHER FOOTWEAR MARKET FOR …
SEGMENTATION OF THE LEATHER FOOTWEAR MARKET
FOR BUSINESS WEAR AS DETERMINED BY PRODUCT
INVOLVEMENT AND PRODUCT ATTRIBUTES
OF FEMALE AND MALE CONSUMERS
by
LESLIE ERNST EVERSON, B.S.
A THESIS
IN
CLOTHING, TEXTILES, AND MERCHANDISING
Submitted to the Graduate Faculty
of Texas Tech University in Partial Fulfillment of the Requirements for
the Degree of
MASTER OF SCIENCE
Approved
May, 2002
ACKNOWLEDGEMENTS
This research project would not have been possible without the guidance and
support of several individuals. In particular, I would like to extend special thanks to
Dr. Shelley Harp, chairperson of my committee, for her hard work, professionalism
and continuing dedication in advancing research in the field of Merchandising.
I would like to thank Dr. Patricia Horridge for her insightful suggestions and
never ending patience in helping me complete my mission and I greatly appreciate
the help of Dr. Randall Russ as a member of my committee.
I would also like to extend my sincere gratitude to the exceptional support
staff, Linda Gambles, Carlene Leatherwood, and Adrienne Trimble, in the
Department of Merchandising, Environmental Design, & Consumer Economics at
Texas Tech University.
The Leather Research Institute at Texas Tech University provided invaluable
support and guidance in researching leather products and footwear, and I thank Dr.
Dennis Shelly for allowing me the opportunity to use their facilities.
I show appreciation to Doug Hubbard for his help in my statistical analysis
and to Andrea Ernst for her continual support and encouragement.
I want to give special recognition to my two wonderful children, Jake and
Juliet-Danielle, and to my Mom and Dad, who without their love and faith in me,
none of this would be possible.
TABLE OF CONTENTS
ACKNOWLEDGEMENTS ii
ABSTRACT viii
LIST OF TABLES x
LIST OF FIGURES xli
CHAPTERS
I. INTRODUCTION 1
Statement of the Problem 3
Significance of the Study 4
Assumptions 5
Research Questions 5
Limitations of the Study 5
II. LITERATURE REVIEW 7
Market Segmentation 7
Segmentation Concept 8
Segmentation Bases 11
Segmentation Measurement Scales 13
Apparel Segmentation Studies 15
Product Involvement 27
Antecedents of Involvement 27
Measures of Involvement 30
Levels of Involvement 31
Apparel Product Involvement Studies 32
Product Attributes 41
Attribute Concept 41
Measures of Product Attributes 42
Attribute Categories 43
Apparel Attributes and Stimuli 45
Apparel Product Attribute Studies 46
Leather Footwear Industry 64
Leather Products Industry Structure 64
Leather Footwear Industry Overview 65
Domestic Footwear Market 67
Footwear Market Trends 68
Summary of Review of Literature 71
METHODOLOGY 74
Conceptual Framework 74
Selection of the Sample 76
Research Instrument 77
Development of the Questionnaire 77
Description of the Questionnaire 79
Collection of Data 82
Variables of the Study 83
IV

Statistical Analysis of Data 90
Research Questions 91
IV. RESULTS 93
Description of the Sample 93
Working Females 93
Working Males 95
Footwear Opinion Leadership 96
Working Females 97
Working Males 97
Footwear Preferences 100
Working Females 100
Working Males 107
Footwear Involvement 117
Working Females 117
Working Males 123
Footwear Purchase Criteria 126
Working Females 127
Working Males 127
Footwear Consumption Patterns 130
Working Females 130
Working Males 132
Footwear Characteristics 132
Working Females 132
Working Males 136
Personal Characteristics 137
Working Females 137
Working Males 146
Scale Reliability and Tree Validation 147
Analysis of Research Questions 147
Research Question 1 147
Purchase Criteria 147
Footwear Characteristics 149
Research Question 2 151
Purchase Criteria 151
Footwear Characteristics 155
Summary of Findings of Research Questions 158
Research Question 1 158
Research Question 2 158
V. SUMMARY, CONCLUSIONS, AND RECOMMENDATIONS 160
Summary of the Study 160
Summary of the Findings 162
Personal Characteristics 162
Footwear Opinion Leadership 164
VI
Footwear Preferences 165
Footwear Involvement 167
Footwear Purchase Criteria 168
Footwear Consumption Patterns 169
Footwear Characteristics 170
Research Question 1 171
Research Question 2 171
Conclusions and Implications 174
Research Question 1 175
Research Question 2 178
Recommendations for Further Research 179
Sample 179
Data Collection 179
Instrument Design 180
REFERENCES 181
APPENDICES
A. AMERICAN CONSUMERS'QUESTIONNAIRE 193
B. U.S. SAVINGS BONDS ENTRY FORM 203
C. PRELIMINARY POSTCARD 205
D. REMINDER POSTCARD 207
E. ANSWERTREE® SOFTWARE 209
VII
ABSTRACT
Footwear has become a complex, competitive, and global industry.
Successful manufacturers and retail organizations are placing increased
emphasis on market segmentation to maintain market share. The purpose of this
study was to (a) segment a nationwide random sample of working female
(n=139) and male (n=116) consumers on High Involvement (HI) and Low
Involvement (LI) and (b) identify extrinsic and intrinsic product attributes that
influence their evaluation and purchase of leather footwear for business wear.
Data was collected using a mail survey method via a self-administered
questionnaire. Respondents were classified as HI (n=101) and LI (n=100) using
a footwear involvement scale. AnswerTree® software was used to answer the
research questions.
Findings indicated that differences existed between HI and LI consumers
on purchase criteria and footwear characteristics. Segment characteristics
indicated that HI consumers considered quality, color, durability, and construction
important to very important, and brand and latest fashion important to not
important In their purchase criteria for leather dress shoes for business wear. LI
consumers rated quality and construction as important to very important, and
color, brand, latest fashion, and shoes In wardrobe important to not Important.
HI consumers considered footwear characteristics as natural, well
constructed, comfortable, and expensive. LI consumers considered footwear
characteristics as not natural, poorly constructed, comfortable, and inexpensive
viii
and expensive. An understanding of consumer involvement and the Importance
of product attributes utilized in the evaluation and purchase of footwear has the
potential to benefit both the manufacturer and retailer in developing effective
marketing strategies to Increase customer satisfaction and increase market share
in the leather footwear market for business wear.
IX
LIST OF TABLES
4.1. Fashion Opinion Leadership by Working Females 98
4.2. Fashion Opinion Leadership by Working Males 99
4.3. Footwear Preferences by Working Females 101
4.4. Favorite and Purchased Footwear Brands
by Working Females 108
4.5. Stores Shopped for Footwear by Working Females 110
4.6. Footwear Preference by Working Males 112
4.7. Favorite and Purchased Footwear Brands
by Working Males 118
4.8. Stores Shopped for Footwear by Working Males 119
4.9. Footwear Involvement by Working Females 121
4.10. Footwear Involvement by Working Males 124
4.11. Footwear Purchase Criteria by Working Females 128
4.12. Footwear Purchase Criteria by Working Males 129
4.13. Footwear Consumption Patterns by Working Females 131
4.14. Footwear Consumption Patterns by Working Males 133
4.15. Footwear Characteristics by Working Females 134
4.16. Footwear Characteristics by Working Males 135
4.17. Personal Characteristics by Working Females 138
4.18. Personal Characteristics by Working Males 142
4.19. High Involvement Leather Footwear Purchase Criteria: Gain Summary 152
4.20. Low Involvement Leather Footwear Purchase Criteria: Gain Summary 154
4.21. High involvement Leather Footwear Characteristics: Gain Summary 156
4.22. Low Involvement Leather Footwear Characteristics: Gain Summary 157
5.1 Research Question 1: Summary 171
XI
LIST OF FIGURES
4.1. Footwear Purchase Criteria: decision tree 148
4.2. Footwear Characteristics: decision tree 150
XII
CHAPTER I
INTRODUCTION
The scope of leather footwear operations has grown steadily since the
early 1980s (Ballance, Robyn, & Forstner, 1993). About 65% of the world
production of leather is estimated to go into leather footwear ("Perspective of
Leather," 2000). World shoe output was estimated at more than 11.8 billion pairs
in 1999 worth an estimated $150 billion at wholesale prices (Bulrski, 1999).
Therefore, footwear is recognized as a major sector of the leather industry and
considered of great economic importance on an International scale ("Global
Shoemaking Grows," 2001).
Developing countries now produce over 60% of the worid's leather, and
this proportion continues to grow. An increasing proportion of footwear is
manufactured in emerging markets, leading to greater global movement of
finished products. This trend should continue over the next 10-15 years as
global trading companies have little allegiance to individual countries or source of
products. Southeast Asia is expected to continue to play a dominant role in
footwear production with China currently responsible for 40% of production and
likely to continue growth. However, this projected growth in footwear production
will depend on a combination of economic factors, political relations, social
influences, and consumer preference for greater comfort and quality products
with increased demand for footwear with greater fitting tolerances (Buirski, 1999).
Per capita consumption of footwear varies widely throughout the world
and appears to give a reasonable indication of a country's general standard of
living ("Global Shoemaking Grows," 2001). The United States (U.S.) has been
seen for many years as the largest open footwear market in the worid with a
consumption of over 1700 million pair of shoes annually or 15% of the worid
market. With such large retail and consumer markets, American footwear
companies have stayed Important as specifers, controlling design, materials,
quality, and marketing even though manufacturing has moved primarily to foreign
operations ("Footwear Market Grows," 2000)
Consumer trends will continue to be important as predictors of lower per
capita consumption due to longer lasting footwear, an aging population, less
formal business dress, and consumer demand for value for money spent on
footwear (Buirski, 1999). The main drivers of change at the retail level include
clothing and footwear sold together, less footwear sold through specialty stores,
growth in catalog sales and the Internet, decrease in stock levels, and availability
of custom-made footwear. On the technical front, change will be influenced by
environmental legislation and the need to develop methods to provide high
product performance ("Best Footwear FonA/ard," 2000).
Due to the increasing effects of globalization, consumer demands, retail
structure, and technology, retailers are identifying market opportunities through
intensified gathering of data on consumer footwear purchase behavior and
shopping orientations via loyalty cards ("Best Footwear Forward," 2000). In turn.
to remain competitive, U.S. footwear sourcing companies and manufacturers will
need to develop a global vision of the industry with a thorough understanding of
the market, monitor major influences on the worldwide footwear industry, create
marketing alliances with members In the entire supply chain including design and
specification, and be knowledgeable of consumer and fashion trends (Buirski,
1999). The bottom line Is that both retailers and manufacturers are after the
same thing: customer loyalty. Market segmentation provides a way to
understand and enhance customer loyalty by enabling marketers to tailor
products and efforts to the needs of particular groups of customers (Kelly, 1998).
Statement of the Problem
The study was designed to (a) segment the female and male leather
footwear market within a set of U.S. consumers by their footwear involvement
and (b) identify product attributes (extrinsic and intrinsic) that influence their
purchase decisions and consumption behavior for leather dress shoes for
business wear. The specific steps undertaken to accomplish the research goals
were:
1. Determine High involvement (HI) consumers and Low Involvement (LI)
consumers based on beliefs and attitudes regarding shoes for business
wear,
2. identify group membership of HI consumers and LI consumers on
footwear purchase criteria and footwear characteristics, and
3. develop guidelines to classify HI and LI consumers on their purchase
behavior regarding leather dress shoes for business wear.
Included in the analysis were footwear opinion leadership, footwear preferences,
footwear involvement, footwear purchase criteria, footwear consumption
patterns, footwear characteristics, and personal characteristics.
Significance of the Study
This study extended the research in the area of market segmentation with
respect to product involvement and product attributes associated with a fashion
related product category. Marketers who base products and promotion on the
results of market segmentation as determined by product involvement and
product attributes can narrow their focus in targeting specific consumers.
The findings of this study will help leather footwear manufacturers and
retailers better identify marketing opportunities, develop the right product for each
target market, and subsequently adjust their prices, advertising, and sales
promotion to reach the target market efficiently. In addition, the study contributes
to the body of knowledge in apparel shopping behavior with a nationwide random
sample of female and male consumers with respect to the effect of product
involvement and product attributes on the evaluation of leather footwear
purchased and consumed for business wear usage situations.
Assumptions
There were several assumptions made for this study. The first
assumption was that subjects were representative of employed male and female
consumers in the U.S. Second, it was assumed that subjects understood written
instructions and answered Items on the questionnaire based on specificity,
action, target, context, and time. Third, subjects would report information
honestly and accurately.
Research Questions
Based on the purpose of the study and pertinent findings in the reported
literature, the following research questions were asked:
RQ1. Can HI and LI consumers be grouped by their assessment of the footwear
purchase criteria and footwear characteristics of leather dress shoes for
business wear?
RQ2. Can HI and LI consumers be classified on their leather footwear purchase
behavior, thus benefiting the retailer selling leather shoes to HI and LI
consumers in footwear purchase criteria and footwear characteristics?
Limitations of the Study
Several limitations to this research were identified. Participants were
employed male and female consumers from the entire U.S. who wore leather
dress shoes to work at least one day a week. A randomized national mailing list
of consumers was purchased from National Demographics & Lifestyles Inc.
(NDL). Subjects Included in the sampling frame were categorized as to working
males and working females. Footwear opinion leadership, preferences regarding
footwear worn for business wear, favorite and purchased footwear brands, stores
shopped for footwear, footwear involvement, footwear purchase criteria, footwear
consumption patterns, footwear characteristics, and soclodemographic
characteristics focused on classifying consumers by High or Low Involvement.
Additionally, results are only applicable to leather dress shoes purchased and
consumed for business wear. The consumers were surveyed during the summer
of 1998. Information was limited to that drawn by the responses on the
questionnaire. Therefore, caution should be employed in generalizing results to
other types of consumers, usage situations, and product categories.
CHAPTER II
LITERATURE REVIEW
The effectiveness of marketing strategy depends, in part, on how
accurately channel members define target consumers and develop product
assortments based on distinct purchase behavior. This review of related
research and literature focuses on market segmentation, product involvement,
product attributes, and the leather footwear industry.
Market Segmentation
Segmentation has evolved from an academic concept (Smith, 1956) into a
key marketing planning tool (Sheth, Sisodia, & Sharma, 2000). In this context,
segmentation provides a strategic marketing approach to understanding a
particular group of consumers' purchasing behavior (Kelly, 1998). In turn, the
accuracy of a firm's use of segmentation is an important criterion of competitive
market advantage (Sauerman, 1998). In order for segmentation to be
successful, the population must be described in measurable terms, be accessible
to promotional activities, be divided into homogeneous groups, and be potentially
profitable (Cross, 1999).
Market segmentation is the process used to break diverse markets into
smaller groups of potential consumers with similar characteristics who might
purchase products in the same way (Danneels, 1994). By selecting one or more
subgroups as targets for marketing activities, companies can determine the best
marketing mix or diversity of products needed to increase profitability in today's
marketplace (Sauerman, 1998). An effective segmentation program provides a
systematic approach for controlling market coverage resulting In higher sales
than mass-market approaches (Kelly, 1998). Thus, the objective of
segmentation research is to analyze markets, find unique opportunities, and
increase market share (Cross, 1999).
Recent changes in the market environment and advances in information
technology present new challenges and opportunities for market segmentation
(Sheth, Sisodia, & Sharma, 2000). Published segmentation research has
expanded to encompass a variety of application areas (Grier & Brumbaugh,
1999). Currently, marketing practitioners and researchers are focusing on topics
such as, micro marketing segmentation, global market segmentation, direct
marketing segmentation, retail segmentation, geodemographic segmentation,
segmentation for optimizing service quality, segmentation for customer
satisfaction evaluation, segmentation for new product development,
segmentation using single-source data, and so on (Myers, 1996; Wedel &
Kamakura, 1998; Weinstein, 1994; Wensley, 1995;).
Segmentation Concept
Smith (1956) first defined the market segmentation concept as viewing a
heterogeneous market as a number of smaller homogeneous markets, in
8
response to differing preferences; attributable to the desires of consumers for
more precise satisfaction of varying wants. Frank, Massy, and Wind (1972)
defined market segmentation as the recognition of the existence of multiple
demand functions and development of a marketing plan to match one or more of
the demand functions. This definition views market segmentation as a tool of
marketing.
Mahajan and Jain (1978) referred to market segmentation as a form of
research analysis directed at identification and allocation of resources among
market segments. Market segmentation, in this perspective, is seen as a way of
viewing the market rather than defined as a management strategy (Dickson &
GInter, 1987). In the most general of terms, market segmentation is a way to
break down a large group of consumers into smaller, more easily defined groups
that can be directly targeted based on distinct buying behavior (Kotler, 1988).
The way in which market segmentation is viewed leads to how market
segmentation is approached. The conceptual framework of market segmentation
that a company uses determines the way in which data is collected and utilized
(Wyner, 1999/2000). Therefore, researchers' or corporations' findings regarding
the quantity and properties of market segments will change with the conceptual
and analytical approaches to segment categorization (Dickson & GInter, 1987).
Methods employed in segmentation research can be classified in a variety
of ways. A segmentation approach is called a pn'on when the type and number
of segments are determined in advance by the researcher and post hoc when the
type and number of segments are determined by the results of data analysis
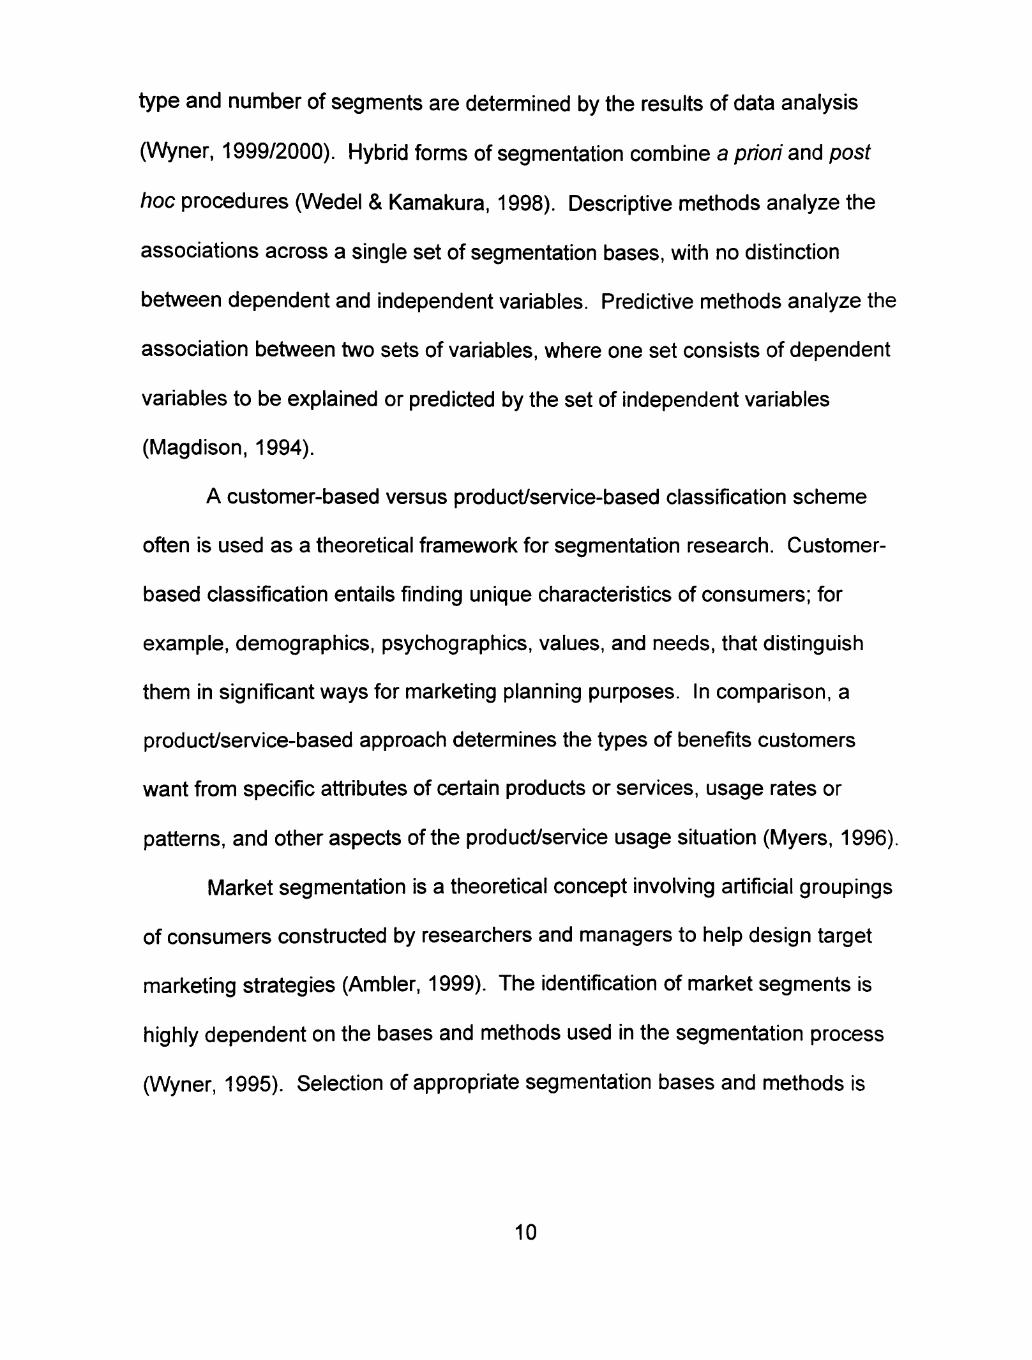
(Wyner, 1999/2000). Hybrid forms of segmentation combine a priori and post
hoc procedures (Wedel & Kamakura, 1998). Descriptive methods analyze the
associations across a single set of segmentation bases, with no distinction
between dependent and Independent variables. Predictive methods analyze the
association between two sets of variables, where one set consists of dependent
variables to be explained or predicted by the set of independent variables
(Magdison, 1994).
A customer-based versus product/service-based classification scheme
often is used as a theoretical framework for segmentation research. Customer-
based classification entails finding unique characteristics of consumers; for
example, demographics, psychographics, values, and needs, that distinguish
them in significant ways for marketing planning purposes. In comparison, a
product/service-based approach determines the types of benefits customers
want from specific attributes of certain products or services, usage rates or
patterns, and other aspects of the product/service usage situation (Myers, 1996).
Market segmentation is a theoretical concept involving artificial groupings
of consumers constructed by researchers and managers to help design target
marketing strategies (Ambler, 1999). The identification of market segments is
highly dependent on the bases and methods used In the segmentation process
(Wyner, 1995). Selection of appropriate segmentation bases and methods is
10
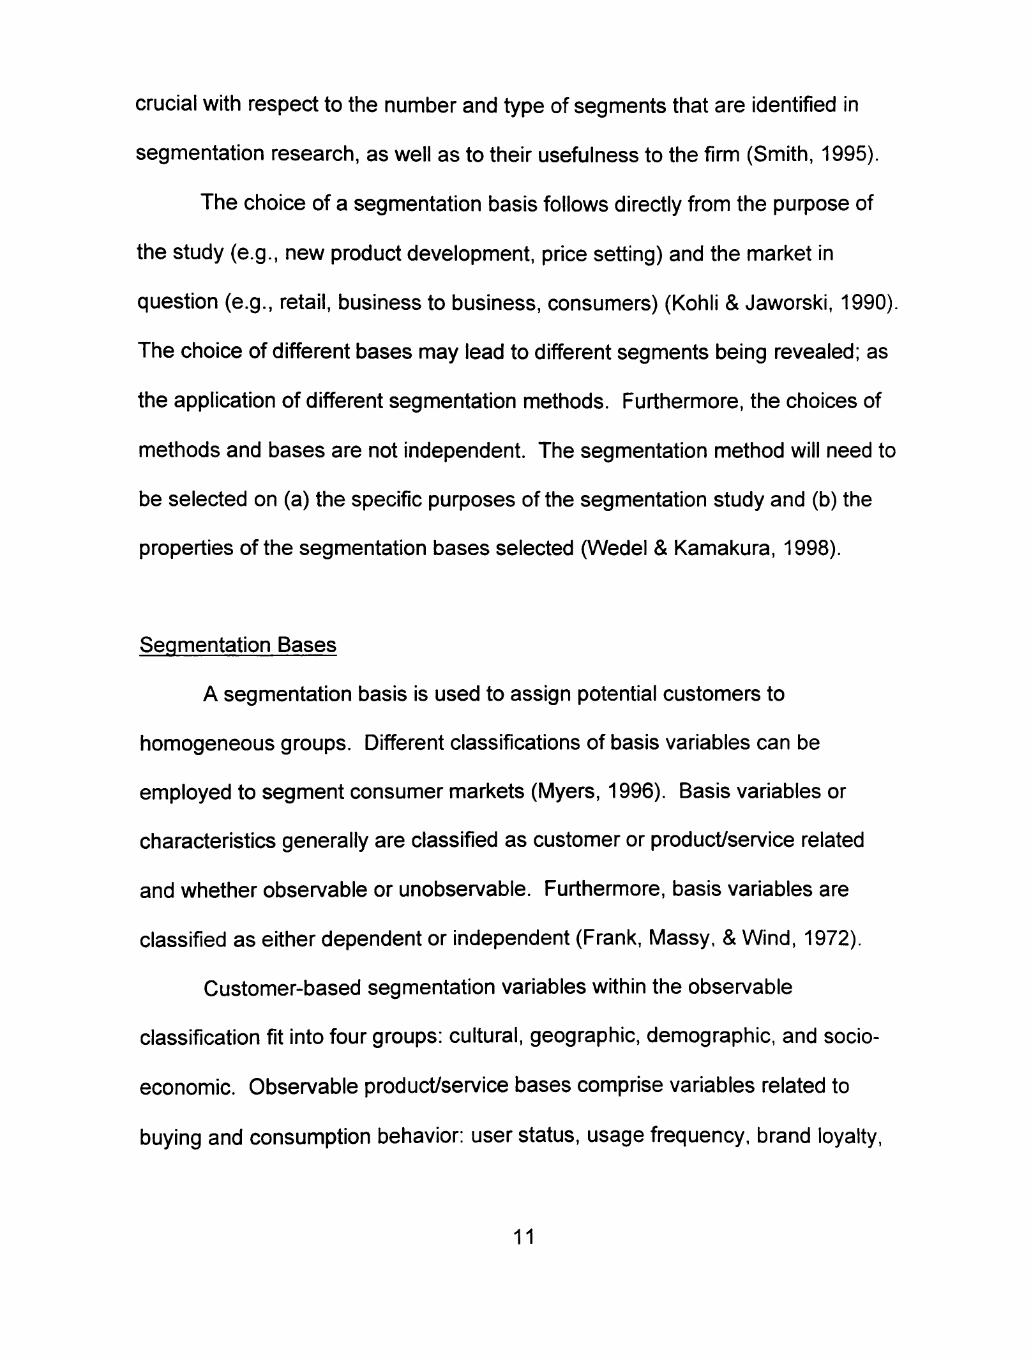
crucial with respect to the number and type of segments that are identified in
segmentation research, as well as to their usefulness to the firm (Smith, 1995).
The choice of a segmentation basis follows directly from the purpose of
the study (e.g., new product development, price setting) and the market in
question (e.g., retail, business to business, consumers) (Kohli & Jaworski, 1990).
The choice of different bases may lead to different segments being revealed; as
the application of different segmentation methods. Furthermore, the choices of
methods and bases are not independent. The segmentation method will need to
be selected on (a) the specific purposes of the segmentation study and (b) the
properties of the segmentation bases selected (Wedel & Kamakura, 1998).
Segmentation Bases
A segmentation basis is used to assign potential customers to
homogeneous groups. Different classifications of basis variables can be
employed to segment consumer markets (Myers, 1996). Basis variables or
characteristics generally are classified as customer or product/service related
and whether observable or unobservable. Furthermore, basis variables are
classified as either dependent or independent (Frank, Massy, & Wind, 1972).
Customer-based segmentation variables within the observable
classification fit into four groups: cultural, geographic, demographic, and socio
economic. Observable product/service bases comprise variables related to
buying and consumption behavior: user status, usage frequency, brand loyalty,
11
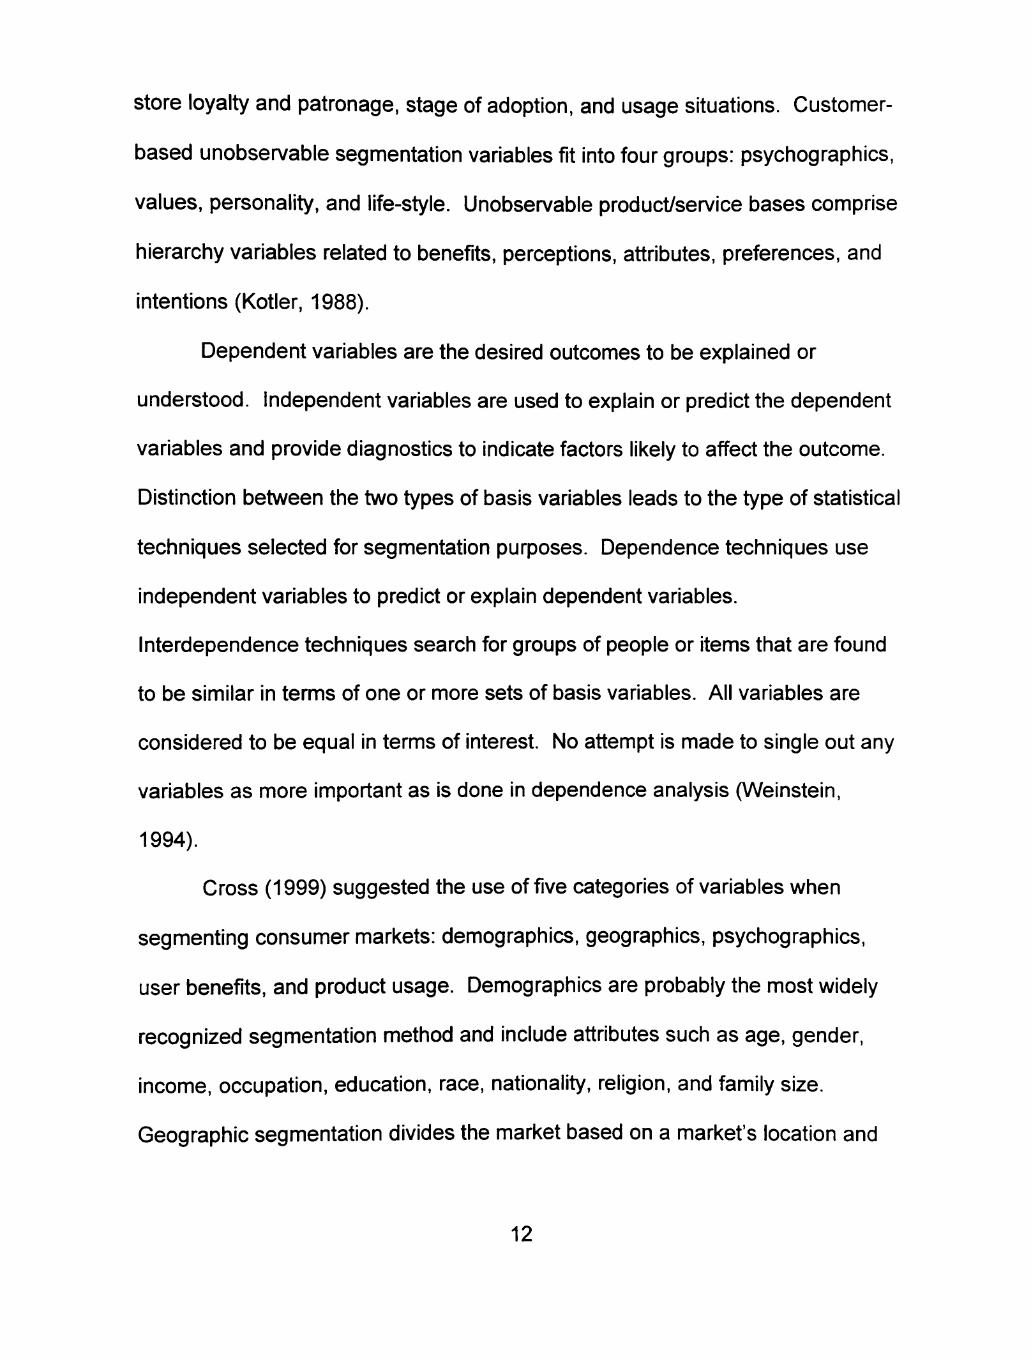
store loyalty and patronage, stage of adoption, and usage situations. Customer-
based unobservable segmentation variables fit into four groups: psychographics,
values, personality, and life-style. Unobservable product/service bases comprise
hierarchy variables related to benefits, perceptions, attributes, preferences, and
Intentions (Kotier, 1988).
Dependent variables are the desired outcomes to be explained or
understood. Independent variables are used to explain or predict the dependent
variables and provide diagnostics to indicate factors likely to affect the outcome.
Distinction between the two types of basis variables leads to the type of statistical
techniques selected for segmentation purposes. Dependence techniques use
independent variables to predict or explain dependent variables.
Interdependence techniques search for groups of people or items that are found
to be similar in terms of one or more sets of basis variables. All variables are
considered to be equal in terms of interest. No attempt is made to single out any
variables as more important as Is done in dependence analysis (Weinstein,
1994).
Cross (1999) suggested the use of five categories of variables when
segmenting consumer markets: demographics, geographies, psychographics,
user benefits, and product usage. Demographics are probably the most widely
recognized segmentation method and include attributes such as age, gender,
income, occupation, education, race, nationality, religion, and family size.
Geographic segmentation divides the market based on a market's location and
12

include population density and climate as well as subcultural values affecting
consumer's product needs, preferences, and purchasing behavior.
Psychographics segmentation divides the market by social class, lifestyle
descriptors, and personality traits. User benefits classify segments by what
consumers deem most important about the product (i.e., quality, service, speed,
and price). Product usage defines segments as regular users, potential users,
nonusers, ex-users, and first-time users.
Segmentation approaches using different types of basis variables yield
more actionable results on which to plan marketing decisions in contrast to the
theory that implies a single best basis for segmenting a market (Wilkie & Cohen,
1977). Attempts to use a single basis for segmentation such as demographics,
psychographics, brand preference, or product usage often result in incorrect
marketing decisions as well as a waste of resources. Within a diverse basis
variables framework, researchers have wide latitude in selecting specific factors
on which to focus and methodologies to use to segment a market. In addition, a
multiple basis variable approach provides a greater amount of information along
with Insights and understanding of the market that would not otherwise be
available (Dhalla & Mahatoo, 1976).
Segmentation Measurement Scales
The type of measurement scale selected to assess each basis variable is
determined by the kind of information to be collected and the objectives to be
13
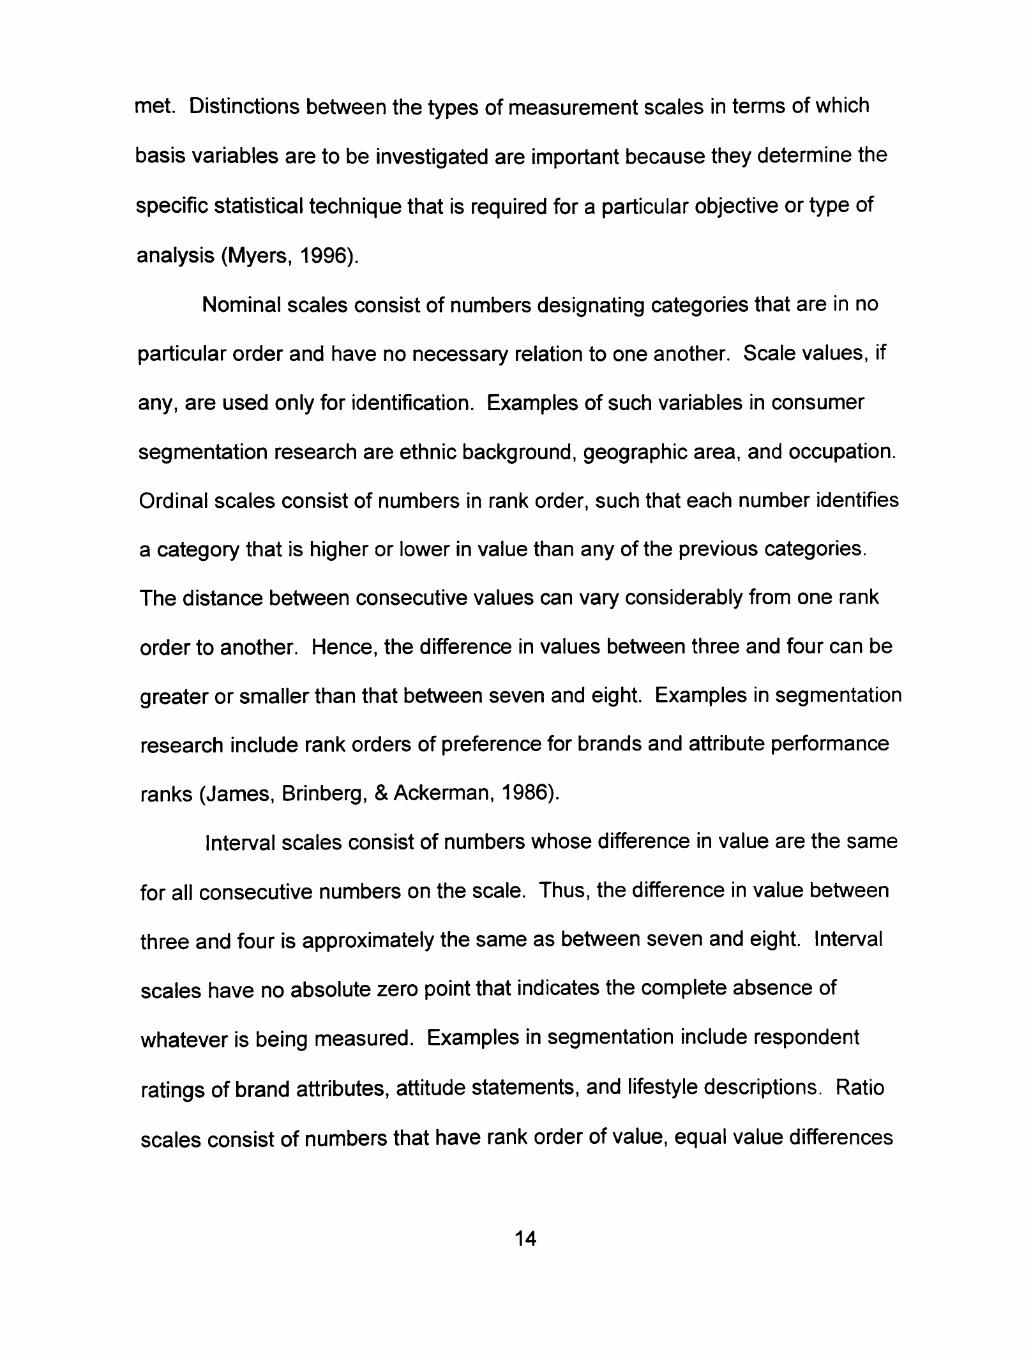
met. Distinctions between the types of measurement scales in terms of which
basis variables are to be investigated are Important because they determine the
specific statistical technique that is required for a particular objective or type of
analysis (Myers, 1996).
Nominal scales consist of numbers designating categories that are in no
particular order and have no necessary relation to one another. Scale values, if
any, are used only for identification. Examples of such variables in consumer
segmentation research are ethnic background, geographic area, and occupation.
Ordinal scales consist of numbers in rank order, such that each number identifies
a category that is higher or lower in value than any of the previous categories.
The distance between consecutive values can vary considerably from one rank
order to another. Hence, the difference in values between three and four can be
greater or smaller than that between seven and eight. Examples in segmentation
research include rank orders of preference for brands and attribute performance
ranks (James, Brinberg, & Ackerman, 1986).
Interval scales consist of numbers whose difference in value are the same
for all consecutive numbers on the scale. Thus, the difference in value between
three and four Is approximately the same as between seven and eight. Interval
scales have no absolute zero point that indicates the complete absence of
whatever is being measured. Examples in segmentation include respondent
ratings of brand attributes, attitude statements, and lifestyle descriptions. Ratio
scales consist of numbers that have rank order of value, equal value differences
14
between consecutive numbers, and a zero point indicating no amount of what is
being measured. Segmentation examples include dollar amounts, frequency of
usage, and demographics such as age, income, and number of persons in a
family (Wind, 1978).
Apparel Segmentation Studies
Cassill and Drake (1987) investigated the relationship of life style and
evaluative criteria for apparel using a cross-national mailing list of female
consumers (n=842). Principal Components Factor Analysis was used to reduce
the number of lifestyle and evaluative criteria variables to 12 factors (eight
lifestyle, three social apparel evaluative criteria, and one employment apparel
evaluative criterion). Nineteen significant relationships existed between the
lifestyle and evaluative factors, suggesting that consumers choose apparel items
that fit into lifestyles. The results produced distinct market segments with variant
benefits sought from the use of apparel. The consumer segment that scored
high on Appropriateness emphasized the importance of clothing being attractive,
comfortable, suitable to individual, appropriate for occasion, good fit, and of good
quality fabric and construction. These consumers are self-confident, satisfied
with life, want to be physically attractive in fashionable clothing, and concerned
with price. The consumer segment scoring high on an Economic factor,
emphasized price, ease of care, and durability, and is characterized by traditional
values, purchasing American products, support of education, and above all.
15
concern for economy. The consumer segment that scored high on Other-
People-Directed emphasized apparel, which is fashionable, sexy, and conveys
an air of prestige. These consumers purchase American goods, value education,
and tend to move less frequently than the other two consumer groups.
Cassill (1990) examined female consumers' (n=383) employment
orientation on apparel decisions and evaluation of Imported apparel to more
closely define consumer profiles. Employment orientations were found to
significantly influence apparel decisions and the evaluation of imported apparel.
Results grouped the female consumer Into four distinct classifications, Career-
Oriented Working Women (53%), Just-a-Job Working Women (24%), Plan-to-
Work Housewives (19%), and Stay-at-Home Housewives (4%). Significant
differences were found among the different classifications. Employed women
were more likely to purchase brand name apparel and were willing to pay more
for branded apparel. Career-Oriented women placed more importance on the
fiber content In a garment and preferred a durable product to a fashion product.
Non-employed women indicated that apparel care was very important and
preferred to purchase apparel that did not require dry cleaning. Non-employed
women were more likely to prefer imported apparel and when priced lower than
domestic apparel, imported apparel is more acceptable. Plan-to-work women
were more likely to notice country of origin labels and found styling, appearance,
fit, and color selection of imported apparel very acceptable.
16
Shim and Kotsiopulos (1991) studied the segmentation of the big and tall
men's apparel market by clothing involvement and the relationship to consumer
characteristics and clothing shopping behavior. Participants (n=172) were
grouped into three classifications: low (n=45), medium (n=76), and high (n=51)
involvement in clothing purchases. The groups were compared on customer
characteristics such as clothing orientations, lifestyle activities, and
demographics, and on shopping behavior dimensions such as satisfaction with
clothing shopping experiences and clothing buying practices. Principal
components factor analysis with varimax rotation was utilized to develop
constructs of clothing orientation, lifestyle activities, and clothing buying
practices. Age, marital status, education, race, employment status, occupation,
and household total yearly income were Included in demographics.
The three groups were different in both instrumental usage of clothing and
the degree of fashion interest. The higher usage of clothing as a tool of
impression management and higher interest In fashion reflect high clothing
involvement. Among lifestyle activities factors, high clothing-involved consumers
indicated they frequently engaged in Cultural/Social activities. There were no
differences among the three groups in Sports Activities, Home/Family Activities,
and Club/Business Activities. Demographics did not influence the level of
clothing involvement among the big and tall men (Shim & Kotsiopulos, 1991).
The high-involved consumers were least satisfied with the general quality
of sale personnel. The higher the involvement with clothing, the more interest in
17
shopping, the more patronage to a particular store, and the more confidence in
putting together a professional wardrobe or in choosing the right clothes. The
amount of money spent on wardrobe per year appeared to be significantly
related to the level of involvement. Higher clothing-involved consumers were
clearly the heavy buyers in terms of dollars per year. High and low involved
consumers were not as concerned with the practical evaluative criteria (such as
construction features, care required, and fiber content) or price so much as those
who were in the middle of the involvement scale. None of the groups were
significantly different in terms of the infiuence of mass media and personal
sources such as friends or colleagues or In shopping around in different stores
for alternative sources (Shim & Kotsiopulos, 1991).
May, Shim, and Kotsiopulos (1992) researched tuxedo customers (n=90)
using criterion variables consisting of purchasers and renters classified as light or
heavy users. Predictor variables for the study included information search
patterns, clothing Involvement, product characteristics, clothing behaviors, and
consumer demographics. Results found six predictors to discriminate
purchasers from renters of tuxedos. The individual who purchased a tuxedo was
willing to pay significantly more than a renter was. Tuxedo owners spent more
time than renters in searching various media before making a purchase decision.
Purchasers tended to use some type of bank credit (e.g., MasterCard) while
renters tended to use cash or checks. The tuxedo purchasers tended to be
older, married, and has higher levels of education than renters.
18
Three factors appeared to discriminate heavy and light tuxedo users.
Heavy users were more concerned with the practical aspects of the tuxedo:
comfort, fabric types and quality, quality of construction, and value for the price.
The light tuxedo user relied more on the fashion advice and guidance of sales
personnel. The heavy tuxedo user spent more time seeking information before
making a decision on tuxedo usage. Heavy users were more likely to use some
form of bank credit to pay for purchases while light users tended to use cash or
checks. No significant differences were found with respect to consumer
demographics (May, Shim, & Kotsiopulos, 1992).
Summers, Belleau, and Wozniak (1992) investigated female customer
(n=598) psychographics dimension of perceptions of fashion and perceptions of
apparel shopping that was related to store patronage as well as demographic
characteristics. Twenty consumer perceptions were reduced to five factors by
factor analysis: Shopping Involvement, Importance of Clothing Image, Fashion
Commitment, Quality Conscious, and Fashion Aversion. Respondent's factor
scores were used as the dependent variables with patronage behavior and
demographic characteristics as the independent variables. Results revealed that
rural (n=320) and urban (n=278) consumers held similar perceptions of fashion
and of apparel shopping as measured by the five factors. Significant differences
in the factor scores were noted with type of stores patronized, shopping locales
favored, time spent shopping for apparel, ethnicity, age, martial status,
education, work status, and total family income.
19
Shopping Involvement, Fashion Commitment, and Quality Conscious were
significantly greater for individuals who shopped for themselves or family
members at clothing specialty stores than for respondents who shopped in
discount stores. Scores of respondents who shopped for apparel for themselves
or family members in discount or department stores were significantly higher on
Fashion Aversion than were the scores of respondents who shopped in clothing
specialty stores. As women spent more time shopping. Shopping Involvement,
Importance of Clothing Image, Fashion Commitment, and Quality Conscious
increased. Respondents who spent three hours or less shopping for apparel had
significantly higher scores on Fashion Aversion than did respondents who spent
more than three hours shopping (Summers, Belleau, & Wozniak, 1992).
Shopping Involvement and Fashion Commitment were higher for non-
whites than whites. Whites scored higher on Importance of Clothing Image than
non-whites. Younger respondents scored highest on Shopping Involvement and
Fashion Commitment while the oldest respondents scored the lowest. Older
respondents had significantly higher scores on Quality Conscious than did
younger respondents. The youngest respondents scored significantly lower on
Fashion Aversion than respondents in any of the other age categories.
Unemployed women scored significantly higher on Shopping Involvement and
Fashion Commitment than homemakers and retired women. Retired
respondents had a Quality Conscious score significantly higher than all other
respondents. Homemakers and retired respondents had significantly higher
20
scores on Fashion Aversion than did employed and unemployed respondents
(Summers, Belleau, & Wozniak, 1992).
Respondents who were not married had a significantly higher Fashion
Commitment than did married respondents. Married respondents had a
significantly higher score on Fashion Aversion than respondents who were not
married. Respondents with the least education had the highest scores on
Fashion Aversion while respondents with graduate study had the lowest scores.
Respondents with the highest total family Incomes had the highest scores on
Importance of Clothing Image, Fashion Commitment, and Quality Conscious
while respondents with the lowest family incomes had the lowest scores
(Summers, Belleau, & Wozniak, 1992).
Shim and Kotsiopulos (1992) examined the comprehensive relationships
among key variables, that impacted patronage behavior of apparel shopping with
female consumers (ri=482). Variables Included patronage behavior, store
attributes, shopping orientations, information sources, and personal
characteristics. Results suggested patronage profiles for discount stores,
specialty stores, department stores, and catalogs. Also, predictor of store
attributes, shopping orientations, and information sources were identified.
Based on the findings regarding prediction of patronage behavior, a profile
of apparel shopping patronage was developed. Respondents who patronized
discount stores for shopping apparel products were more likely to: place
importance on frequent special sale prices, price levels, or return policies; be
21
economic shoppers; use media information; be lower In social class; not be
concerned with clothing quality or variety of style; not be appearance managers;
not use credit cards; not read fashion publications; not be engaged in cultural
activities; and not be In the first stage of the family life cycle. The respondents
who patronized specialty stores for shopping apparel products were more likely
to: place Importance on clothing quality or variety of style; be concerned with
brand names or new fashion that stores carry; be appearance managers; be
fashion conscious; be heavily engaged in grooming activities; not be concerned
with frequent special sale prices, price levels, or return polices; and not be
economic shoppers. Respondents who patronized department stores for
shopping apparel products were more likely to be: mall shoppers and in the first
stage of the family life cycle. The respondents who used catalogs for shopping
apparel products were more likely to: have a catalog shopping orientation; not be
concerned with easy access of the stores; not be fashion conscious; not be
apathetic toward "Made-in-U.S.A"; not be mall shoppers; and not be local store
shoppers (Shim & Kotsiopulos, 1992).
The Infiuence of each of three sets of factors (shopping orientations,
information sources, and personal characteristics) on seven factors of store
attributes was investigated. Shopping orientations appeared to be most
Important, followed by information sources, and personal characteristics as
determinants of the importance of store attributes. In terms of shopping
orientations, appearance managers tended to place high importance on store
22
attributes such as visual image of store, quality/variety, brand/fashion, easy
access, and sale personnel. Brand or fashion conscious consumers placed
importance on brand name of store, customer services, or visual image of the
store. Shoppers who had convenience/time conscious shopping orientation
placed importance on easy access, while economic shoppers placed high
importance on frequent sales prices or on low price level and excellent return
policies (Shim & Kotsiopulos, 1992).
In terms of information sources, respondents who frequently used store
fashion promotional activities tended to think that sales personnel, customer
service, and visual image of store were Important. The respondents that
frequently read fashion publications tended to think that brand/fashion and
quality/variety were Important. Also, the respondents who rely on fashion
publications and less social interaction tended to be more self-confident in their
apparel decision-making (Shim & Kotsiopulos, 1992). In terms of personal
characteristics, respondents who stressed the importance of personal visual
image were concerned with a store's visual image.
Information sources and personal characteristics appeared to be of
relatively equal importance in predicting shopping orientations. Economic
shoppers and local store shoppers tended to use media while mall shoppers
used personal sources. The confident, brand and fashion conscious, less
convenience/time conscious, catalog-oriented shoppers, appearance managers,
and credit users tended to use fashion publications. Social class appeared to be
23
most important in predicting confident, brand conscious, catalog-oriented
shoppers, credit users, and less economically concerned shoppers. Grooming
activities appeared to be the most important predictor of the appearance
manager and fashion conscious shopper (Shim & Kotsiopulos, 1992).
Different personal characteristics tended to predict different types of
information sources for making apparel purchase decisions. Respondents who
were frequently engaged in cultural and grooming lifestyle activities tended to
use store fashion promotion and fashion publications while respondents who
were frequently involved with community projects and respondents who were in
the first stage of the family life cycle tended to use personal sources. Single
under 35 consumers were primarily mall shoppers, less convenience/time
conscious, and less apathetic toward "Made-in-U.S.A.". Shoppers under the age
of 35 were likely to be in good physical condition and were willing to expend
energy and time in shopping in a mall environment (Shim & Kotsiopulos, 1992).
Shim and Bickle (1994) completed a twofold consumer investigation
(n=610) designed to: (a) segment the female apparel market based on
descriptive clothing benefits sought by female consumers and (b) develop a
profile of each segment concerning psychographics, shopping orientations,
patronage behavior, and demographics. Using cluster analysis on benefits
sought factors; three groups were identified and classified as (a)
Symbolic/Instrumental Users of Clothing (51%), (b) Practical/Conservative Users
of Clothing (35%), and (c) Apathetic Users of Clothing (14%).
24
Results illustrated important differences among the three benefit segments
on 10 psychographics factors; Creative/Innovative, Independent/Opinion Leader,
City Prone, Friends-Oriented, Religious, Health/Exercise-Oriented, Education-
Oriented, Pessimistic-Finance Outlook, Overseas Travel Dreamer, Optimistic
Career Viewpoint, three shopping orientation factors; Shopping Enjoyment,
Fashion-Oriented Shopper, and Credit User, one patronage behavior variable;
stores shopped at most frequently, and seven demographic factors; education,
occupation, age, marital status, geographic region, residential area, and income
(Shim & Bickle, 1994).
Symbolic/Instrumental Users of Clothing were characterized by actively
using clothing as a means to enhance self-esteem, career advancement,
reputation, social status or prestige, femininity, sex appeal, fashion image, role
and appearance. In terms of psychographics, this group was innovative,
independent, socially oriented, exercise-health oriented, and optimistic about
education, career, and finance. Women in this category enjoyed shopping at
upscale stores, were fashion-conscious shoppers, and credit users. As
compared to other groups, this group was younger and represented a higher
social class in terms of education, occupation, income, and residential area.
Practical/Conservative Users of Clothing were characterized as
practicality-, individuality-, comfort-, and function-oriented. In terms of
psychographics, this group was independent and tended to be pessimistic about
financial outiook. Women in this category were not likely to enjoy shopping and
25
tended to be department store shoppers. As compared to other groups, this
group tended to be older, and represented a middle social class in terms of
education, income, and residential area (Shim & Bickle, 1994).
Apathetic Users of Clothing were characterized by the belief that clothing
was of no significance or did not provide them any means to assist themselves.
In terms of psychographics, this group was less likely to be independent or
creative/innovative, health-conscious or education oriented, and had pessimistic
views concerning finance and career outiook. Women in this category were not
likely to enjoy shopping or be fashion-conscious shoppers and tended to
patronize discount stores. As compared to other groups, this group was
divorced, separated, or widowed and represented a lower social class in terms of
education, occupation, and income (Shim & Bickle, 1994).
Kim and Lee (2000) examined segmentation of professionals (n=493)
based on benefits sought. Using cluster analysis, three distinct segments of
catalog shoppers were identified: Convenience Seekers (40.5%), Product
Seekers (27.1%), and Inactive Shoppers (25.9%). Full profiles of the benefit
segments were developed based on personal (demographics and lifestyle) and
situational (purchase for self versus for others; gifts versus non-gifts) variables.
Results indicated that Convenience Seekers, who tended to use catalogs out of
convenience, were more likely to be married professionals with highest levels of
self-confidence and fashion-consciousness, and to use clothing catalogs most
frequently for both themselves and others. Product Seekers, who exhibited
26
interest in product-related benefits (e.g., quality, variety, price and ease of
return), tended to be married professionals and most price-conscious. Inactive
Shoppers, displayed the lowest importance level for all identified benefits, tended
to be married male professional with lowest levels of fashion-consciousness and
self-confidence, and tend to use catalogs less frequently.
Product Involvement
The theory of consumer Involvement has had a major impact on the study
of consumer behavior in the last 30 years (Thomas, Cassill, & Forsythe, 1991).
While researchers agree that the study of involvement is important to explaining
and predicting behavior of the consumer there is little consensus on how to best
define and measure the construct of involvement (Zaichkowsky, 1985). The
reasons for the diversity in definitions and measures of involvement have been
attributed to different conceptualizations and operational indicators researchers
have applied to the term "Involvement" (Kahle & Homer, 1990).
Antecedents of Involvement
Previous research has examined the construct of consumer involvement
across a variety of marketing contexts (Lai, 1991). Involvement is generally
considered to be a function of three factors: (a) individual characteristics; (b)
situational factors Including purchase situation and the degree of risk perceived
in the purchase; and (c) physical characteristics of the product (Zaichkowsky,
27

1985). Researchers and practitioners tend not to use the term "Involvement"
alone but rather imply a distinction between types of involvement (Laurent &
Kapferer, 1985). The literature reveals involvement can be related to ego,
product, situation, values, brand, interest, and purchase.
Ego involvement happens when an issue or object is connected to a
person's distinctive set of likes or dislikes and their personal value system.
Product involvement refers to the degree in which a certain product class is
important to a person's highly held values or beliefs (Warrington & Shim, 2000).
Two areas of product involvement occur and can be classified as either
situational or enduring. Warrington and Shim (2000) defined situational
involvement as a short-term high degree of Involvement in a certain product
based on the situation in which the product may be purchased. Enduring
involvement reflects a consumer's continuing notice in a product category (Bei &
Widdows, 1999). In theory, enduring and situational involvement is specific to a
consumer's situation or value system (Warrington & Shim, 2000).
Brand commitment Is defined as an emotional or psychological
commitment to a brand (Beatty, Kahle, & Homer, 1988). General levels of
interest with a brand can lead to different levels of involvement. High and low
involvement deals with the importance that consumers place on certain
purchases (Celsl & Olson, 1988). High and low involvement can change over
product classes and among consumers. Therefore, much research has been
done on classifying high and low involvement consumers. Purchase-decision
28
involvement is the degree of involvement or concern that consumers have when
making purchasing decisions (Mittal, 1989).
Generally Involvement researchers agree that for consumers as a group,
products will vary in their ability to arouse involvement (Bloch, 1981). Andrews,
Durvasula, and Akhter (1990) described product involvement as it relates to the
degree of arousal that is generated in the consumer. Three major properties of
arousal were found: Intensity, direction and persistence (Flynn & Goldsmith,
1993). Intensity refers to the person's degree of involvement or motivation.
Levels of involvement range from low to high and vary across product or
situational lines. Direction refers to the object or issue to which a person is
motivated and persistence is defined as the time in which intense Involvement is
found.
In theory, involvement is considered an individual motivating difference
variable and depending on their level of involvement, consumers will differ in the
extensiveness of their purchase decision process (Laurent & Kapferer, 1985). In
this context, Involvement with products has been hypothesized to lead to greater
perception of attribute differences, perception to greater product importance, and
greater commitment to brand choice (Zaichkowsky, 1985). Researchers often
use the resulting behaviors as indicators of the level of involvement. Level of
involvement also has been measured as Independent of the behavior that results
from involvement (Zaichkowsky. 1985).
29
Measures of Involvement
The involvement literature suggests that no single scale (Vaughn, 1980) or
single-item measure of perceived importance (Traylor, 1981) can satisfactorily
describe, explain, or predict involvement. Involvement studies have
demonstrated that consumers differ not only in level of involvement but also in
type of involvement. Therefore, involvement can be classified in terms of
multiple facets, that need to be measured simultaneously to provide a full picture
of the type of involvement of a specific target group (Laurent & Kapferer, 1985).
Previous research has measured consumer involvement with products by
several methods; single and multiple item measures, instruments developed and
tested for one product category, and personal involvement levels (Traylor &
Joseph, 1984; Zaichkowsky, 1986). Involvement measures employed to
products have been composed of semantic differential scales, Likert statements,
and concentric scales, rank-ordering, and rating. These diverse measures pose
several problems for researchers. If conflicting results are obtained, discrepancy
may be due to different measures or to different behaviors. Single-item
measures may not capture the total involvement concept and may have low
reliability. Multiple-Item measures may not have been tested for internal
reliability, stability, or validity.
Involvement researchers have addressed development of standardized,
general, valid, and multiple-item measures of involvement that can be applied
across product categories (Traylor & Joseph, 1984; Laurent & Kapferer, 1985;
30
Zaichkowsky, 1985; Zaichkowsky, 1986). In total over the last 40 years, 23
measures have been developed to assess Involvement. Existing measures
conceptualize involvement in different ways from state of involvement with
products, advertisements, or situations in The Personal Involvement Inventory
(Zaichkowsky, 1985) to the antecedents of product involvement in The Consumer
Involvement Profile (CTP) (Kapferer and Laurent, 1985). Scales were generally
based on a semantic differential or Likert type formats, with the number of items
in instruments ranging from 3 to 33 and scale points ranging from 5 to 7
commonly used In measures (O'Cass, 2000).
Levels of Involvement
A consumer's level of Involvement with an object, situation, or action can
be determined by the level to which one has perceived it to be personally
relevant (Celsl & Olson, 1988). Consumers vary in the degree of Involvement
and effort they put Into shopping (Slama & Taschian, 1985). Such variations are
important to marketers because they effect consumers' reactions to different
marketing strategies. Kassarjian (1985) reported that consumers' connection
with shopping influences buying behavior and that different consumer types can
be Identified based on involvement. Products, themselves also can create high
and low Involvement Inherent to the product (Bloch, 1981). Thus, high and low
product Involvement among consumer groups can create significant market
groups.
31
Among researchers, there is some agreement on what constitutes the
differences between high or low involvement in a certain product category
(Zaichkowsky, 1985). Generally, low involvement consumers are perceived as
having (a) small amount of active Information seeking about brands, (b) small
amount of comparison shopping, (c) perceived similarity among different brands,
and, (d) no partiality for a particular brand (Zaichowsky, 1985). High involvement
consumers have been described as (a) engaging In more complex purchasing
decisions, (b) more brand loyal, (c) more likely to be opinion leaders, and, (d) are
more likely to generate negative cognitive responses to product-related
messages.
High involvement consumers want product information, personal attention,
and customer service (Warrington & Shim, 2000). Additionally, when high
involvement consumers are satisfied, they are more likely to develop store
loyalties (Warrington & Shim, 2000). Marketers can respond successfully to high
Involvement consumers' needs by targeting specific consumer characteristics,
purchase behavior, and product attributes to create and maintain market share.
Potentially, retailers, by segmenting high involvement consumers, can increase
sales and more effectively tailor product assortments and advertising messages.
Apparel Product Involvement Studies
Thomas, Cassill, and Forsythe (1991) using a sample (n=177) of female
apparel consumers from three Southern malls studied (a) if apparel involvement
32
is composed of more than one dimension and, if composed of more than one
dimension, (b) to determine if variation In apparel involvement dimensions is
explained by fiber information sources and demographics. Two involvement
factors emerged from the factor analysis (Dress to Express Personality and
Dress as a Signaling Device). The Dress to Express Personality factor was
defined as purchasing clothing to serve as an expression of a person's
psychological state or personality. The Dress as a Signaling Device factor was
defined as purchasing clothing to serve as a signaling device or means of
communication.
Analysis of covariance (ANCOVA) was used to determine if variation in
apparel involvement dimensions was explained by fiber information sources.
Principal components factor analysis with varimax rotation was used to Identify
dimensions of apparel involvement. Analysis of variance (ANOVA) was used to
test whether there were significant differences between the levels of the
demographic variables (age, education, occupation, income) and apparel
involvement factors (Thomas, Cassill, & Forsythe, 1991).
Results indicated that apparel involvement was multi-dimensional and
variation in apparel Involvement dimensions was partially explained by fiber
information sources. While the Dress to Express Personality factor was not
significantly infiuenced by fiber information sources, the apparel involvement
factor Dress as a Signaling Device was significantly influenced by one marketer-
33
dominated source (media) and one nonmarketer-domlnated source
(Interpersonal) (Thomas, Cassill, & Forsythe, 1991).
Additional analyses found that marketer-dominated sources worked
together to influence one apparel involvement factor. Dress as a Signaling
Device. When clothing served as a signaling device or as a means of
communication, clothing selection was significantly infiuenced by the combination
of various personal sources (retailer/Interpersonal) including sales associates,
family, friends, and reference groups. In addition, the Dress as a Signaling
Device factor was significantly infiuenced by the combined use of advertisements
and personal sources (media/interpersonal), indicating the importance of written
and verbal communication (Thomas, Cassill, & Forsythe, 1991).
Results from ANOVA indicated that there were significant differences
between the levels of three demographic variables (education, occupation.
Income) and one apparel involvement factor; Dress as a Signaling Device. Age
was not significant for this factor, and there were no significant differences
between the levels of the four demographic variables and the Dress to Express
Personality factor (Thomas, Cassill, & Forsythe, 1991).
Haynes, Pipkin, Black, and Cloud (1994) attempted to (a) identify decision
styles (number of stores known, considered, visited) with a sample of pregnant
consumers (n=100) using variables based on their choice set sizes at three
stages of the choice sets model (awareness, consideration, action) and (b) profile
the consumers within each decision style on variables descriptive of each major
34
type of patronage variable. Included in the analysis were consumer
demographics, shopping motivation, shopping process involvement, shopping
orientations (product, brand, price, non-store shopping, planning, time and
product), and desired retailer attributes.
Factor analysis was used to (a) confirm the existence of the proposed
constructs and (b) provide composite measures (factor scores) for use in
subsequent analyses. Six decision styles: narrowers (highest knowledge of
stores), shoppers (have the largest choice sets), apathetics (unlnvolved
shoppers), loyals (low to moderate choice set size), late bloomers (systematically
have larger choice set sizes), and avoiders (extremely low choice sets) were
profiled. The six decision styles were then outlined with a series of shopper and
retailer characteristics, with discriminant analysis used to identify the
differentiating variables from the set of all variables. The descriptive variables
consisted of (a) demographics (age, educational level, total household income),
(b) shopping dimensions (functional, symbolic, and experiential), (c) shopping
process involvement, and (d) career orientation level (Haynes, Pipkin, Black, &
Cloud, 1994).
Results showed that distinct decision styles were identified to reflect
consistent choice patterns through the decision process. The narrowers showed
less interest in the shopping process than other consumer types and consumers
in this group were the most homogeneous. The shoppers consider all retailer
attributes Important at the time to decide which store to patronize. The
35
apathetics, younger consumers. Indicated a high level of product Involvement,
but factors, such as their economic situation and lack of knowledge, may have
impacted their engagement in shopping. The loyals showed more interest in
obtaining high product variety and value for their money. This group indicated
high involvement with limited market participation. The late bloomers placed
more importance on convenience and value for their money when deciding which
store to patronize. Finally, the avoiders, who view shopping as a necessity,
showed low choice sets and low process involvement, due in part to an apparent
lack of time for shopping (Haynes, Pipkin, Black, & Cloud, 1994).
Eckman (1997) explored how male and female consumers (n=168) use
aesthetic attributes in their evaluations of the attractiveness of clothing with
respect to (a) use and relative importance of design elements and (b) effect of
consumer characteristics. To address age and fashion preferences, three years
marking the peak of distinctive fashion trends (1955 "Edwardian Dandy," 1967
"Peacock Revolution," and 1980 "Return of Conservatism") were Identified.
The sample was to be composed of 20 females and 20 males in each of
four age groups: 20 to 24 years of age, 31 to 35, 44 to 48, and 56 to 60. The
older three age groups were selected to include Individuals who were In their
early twenties, the age suggested as the critical period for development of
aesthetic preferences, during peaks of previous distinctive fashion trends. The
youngest group, composed of Individuals 20 to 24 years old at the time of the
study, was chosen to test the aesthetic preferences of young adults and to
36

explore aesthetic preferences that may form when individuals are In their early
twenties. Females were Included In the sample because it is generally believed
that women make or influence purchase of men's clothing (Eckman, 1997).
Current trends in men's suit styles were the basis for levels of the design
elements chosen. Eight design elements and corresponding levels were jacket
silhouette (narrow/wide), jacket length (short/long), drop or distance between
base of the neck and first button (high/low), neckline (without lapel/with lapel),
jacket color (olive/blue) and pant color (olive/blue). Individual subject ANOVAs
identified attributes and interactions that were significant in each subject's
aesthetic evaluations. A 4 (Age) X 2 (Sex) X 3 (Fashion Involvement) X 2
(Design elements) post hoc ANOVA was performed on the dependent variable
(average omega-squared values) to assess the effect of age, sex, and fashion
involvement on the subjects' use of design elements in their aesthetic
evaluations (Eckman, 1997).
Results showed interactions of one design element with six other
elements. The interaction of jacket silhouette and jacket pattern (78 significant
Interactions) affected the evaluations of more subjects than any main effect.
Interaction of jacket silhouette and jacket color (16 significant Interactions) and
jacket silhouette and pant color (12 Interactions) were significant for fewer
subjects. Interactions that influenced the fewest subjects were jacket silhouette
and neckline drop, and pant silhouette. Jacket length showed the most main
effects, followed by jacket pattern, drop, and neckline. Jacket length was the
37
dominant design element. The post hoc ANOVA show the design elements
differed in their effect on aesthetic evaluations. Moreover, the significant two-
way design by age interaction indicated the effect of the design elements differed
by age groups. The post hoc ANOVA also showed the Interaction of age, sex,
and fashion Involvement influenced subjects' use of design elements (Eckman,
1997).
Jin and Koh (1999) (a) proposed a model of clothing brand loyalty
formation considering five brand loyalty-related variables: consumer knowledge,
product involvement, perceived risk, information search, and consumer
satisfaction and (b) examined gender differences in the process of clothing brand
loyalty formation. The sample consisted of Korean male and female (n=505)
consumers. The amount of brand loyalty. Information search, and consumer
satisfaction were proposed to be influenced by the degree of consumers'
involvement with and knowledge about clothing, and perceived risk during
purchasing. Thus, brand loyalty, information search, and consumer satisfaction
were considered dependent variables and consumer knowledge, product
involvement, and perceived risk were considered independent variables.
Principal component factor analysis with varimax rotation was performed
on items relating to brand loyalty, consumer satisfaction, information search,
product involvement, consumer knowledge, and demographics. Results
indicated that the greater the consumer's knowledge and product involvement,
the greater the Information search. Also, the greater the consumer's product
38
involvement, customer satisfaction, and consumer's Information search, the
greater the brand loyalty. However, the greater the consumer's perceived risk
did not increase the information search (Jin & Koh, 1999).
Significant differences were found In the formation process of clothing
brand loyalty according to gender. The major difference between the females
and males was that the most influential variable in information search was
perceived risk for men, whereas product involvement was the most influential
variable for women. Overall, the results supported the proposed model as,
clothing brand loyalty formation developed along four paths: (1) Consumer
knowledge -^ Information search -^ brand loyalty, (2) Product involvement -^
infonnation search -> brand loyalty, (3) Perceived risk -^ Information search -^
brand loyalty, and (4) Product Involvement -^ consumer satisfaction -^ brand
loyalty. Therefore, it was concluded that brand loyalty was developed directly
from information search and consumer satisfaction. Consumer knowledge,
product Involvement, and perceived risk Indirectly influenced brand loyalty
through mediating variables of information search and consumer satisfaction (Jin
&Koh, 1999).
Warrington and Shim (2000) hypothesized that (a) product involvement
and brand commitment may not be highly correlated and if so, (b) product
involvement and brand commitment will differentiate a product category market
into four distinct consumer groups: high product involvement/strong brand
commitment (HP/SB), high product involvement/weak brand commitment
39
(HPAA/B), low product involvement/strong brand commitment (LP/SB), low
product involvement/weak brand commitment (LP/WB). Given the classification
model proved to be successful with the college student sample (n=615), it was
further postulated the four groups would display different consumption attitudes
or behavior for a specific clothing product category, jeans.
A Pearson correlation test performed between product Involvement and
brand commitment showed that the correlation between the two was not
significant. Respondents were classified by an examination of means and
standard deviations of the two constructs. ANOVA tests indicated that high-
product-involvement group differed significantly from the low-product-involvement
group and that strong-brand-commitment group differed from the weak-brand-
commitment group. ANCOVA revealed that the four involvement groups were
significantly different on three of the five factors; high price orientation, brand
consciousness, and fashion consciousness (Warrington & Shim, 2000).
HP/SB consumers were more Interested in both market and personal
sources of information and the importance placed on functional as well as
nonfunctional product attributes. HP/WB consumers significantly differed from
HP/SB on price sensitivity, fashion orientation, and brand consciousness, but
market and personal sources of brand information was Important to both
consumer groups. HP/WB consumers were less concerned with nonfunctional
product attributes. LPl\NB and LP/SB consumers were less likely to engage in
large amounts of decision-making relative to product category. The LP/WB
40
consumers were apathetic while LP/SB consumers tended to be habitual
(Warrington & Shim, 2000).
Product Attributes
Why consumers buy particular products has been an Issue addressed in
empirical and conceptual studies (Vriens & Hofstede, 2000). Market research
often aims at understanding the reasons underlying consumers' product
preferences. Most methods for Investigating product preference assume that
preferences are based on combinations of utilities consumers get from separate
product cues or attributes (Creusen & Schoormans, 1997). Differences in
consumer preferences are thus expected to be related to differences in product
attributes.
Attribute Concept
According to consumer behavior theories, the purchase of a product is
guided by consumers' assessment and evaluation of the attributes defining the
product. Consequently, consumers are infiuenced in product evaluations and
buying decisions by factors such as brand, price, and color. Consumer
researchers are interested not only In which cues are used and the relative
impact of each cue, but also with the ways the cues are combined to arrive at
judgments and choices (Liefeld, Wall, Ji, & Xu, 1993).
41
Eariy studies of consumer decision-making generally examined only one
cue at a time and frequently reported that the cue had considerable influence on
the perceptions of the product (Olson, 1977; Szybillo & Jacoby, 1974; Will &
Hasty, 1971). Researchers have suggested that consumer decision process
studies employing single cues over-estimate the size of the cue effects (ZeithamI,
1988). In multi-attribute studies, researchers have reported that the cue effects
diminish in magnitude when more cues are present in the choice or evaluation
situation (Abraham-Murali & Littrel, 1995a; Liefeld et al., 1993; Sinclair & Stalling,
1990).
Measures of Product Attributes
The majority of studies, which examined the effects of product attributes
on product evaluations and the purchase decision process, have focused on
rating or rankings of product attributes (Liefeld et al., 1993; Tull & Hawkins,
1990). However, the rating and ranking approaches cannot capture consumers'
willingness to compromise. Ranking can provide some measure of trade-offs
between attributes. Also rating and ranking measurements do not effectively
handle attribute levels in order to allow the determination of how much of one
attribute will compensate for a deficiency in another attribute (Liefeld et al.,
1993). The range of attributes is limited to the specific preselected cues included
on the rating and ranking measurement scales (Sinclair & Stalling, 1990).
42
To elicit a wider range of attributes used by consumers In the evaluation
process, researchers have used an open-ended discussion approach for data
collection via quantitative and qualitative research designs (Abraham-Murali &
LIttrell, 1995a). A disadvantage of free response data is that subliminally used
criteria for product evaluation may not be recognized by the naive consumer who
is unaware of the importance of the criteria (Nisbett & Ross, 1980). As with
predetermined lists, social desirability may have some effect if the respondent is
embarrassed to acknowledge Influence of some criteria.
Conjoint analysis was developed as a different measurement approach to
avoid the biases of explicit measurement of attribute importance (Liefeld et al.,
1993). The conjoint approach derives the importance individual consumers
attach to each attribute by observing consumers' preferences for or choices of
various combinations of product attributes and then decomposes these
judgments to estimate the respondent's utilities for each attribute and each level
of each attribute (Aaker & Day, 1990; Green & Tull, 1978; Lehmann, 1989).
Attribute Categories
Several researchers have attempted, through empirical and theoretical
papers, to distinguish among the assortment of product attributes and to propose
conceptual categories for the attributes (Abraham-Murali & LIttrell, 1995a).
Categories have been demonstrated using consumer products In general, a
product type such as clothing, or specific products such as blankets. Categories
43
have been proposed based on the type of attribute (Olson & Jacoby, 1972;
O'Neal, Hines, & Jackson, 1990) or on the relationships among attributes
(Geistfeld, Sproles, & Badenhop, 1977; Swan & Combs, 1976).
From an information theory perspective, a product can be perceived as an
array of cues, that are either intrinsic or extrinsic in nature (Olson & Jacoby,
1972). Intrinsic cues are product attributes, which are intrinsic to the product in
the sense that they cannot be changed or experimentally manipulated without
also changing the physical characteristics of the product. Extrinsic cues are
product attributes, which, while product-related, are not part of the physical
product, but added by retailers and manufacturers. Sweetness of a soft drink,
density of a garment's fiber, color of a gemstone, and sound clarity of a
stereophonic system are examples of Intrinsic attributes, while brand, price, type
of package, and country-of-origin are examples of extrinsic cues (Wheatley,
Chlu, & Goldman, 1981).
Extrinsic cues, when compared to intrinsic cues, are more general and
applicable to a wider range of products, whereas intrinsic cues are specific only
to a particular product (Lee & Yung-Chien, 1995/1996). Hence, it is believed that
consumers are generally more familiar with extrinsic cues than intrinsic cues, and
thus tend to rely more heavily on extrinsic attributes when evaluating products
(Dodds, Monroe, & Grewal, 1991; Han & Terpstra, 1988). Existing literature also
suggests that the extrinsic cue effects are not universal, but moderated by
consumer Individual differences (Lee & Yung-Chien, 1995/1996).
44
Researchers have postulated that, theoretically, intrinsic cues are likely to
have a higher "predictive" value (Cox, 1962; Olson, 1977). Attribute interaction
has been proposed as an Important area for investigation to gain a clearer
understanding of how multiple criteria, both intrinsic and extrinsic, are combined
in the product evaluation and purchase decision process. The majority of recent
attribute-based segmentation studies have utilized both extrinsic and intrinsic
cues.
Apparel Attributes and Stimuli
Previous research related to apparel has used intrinsic and extrinsic
product attributes to investigate overall judgments made by consumers. The
effects of extrinsic cues on overall judgment have been investigated more
frequently than the effects of intrinsic cues (Eckman, Damhorst, & Kadolph,
1990). Among the extrinsic cues, price and brand name have been studies most
extensively, both In isolation and in conjunction with other cues (Davis, 1985;
Forsythe, 1991; Hatch & Roberts, 1985; Lambert, 1972; Norum & Clarke, 1989;
Wheatley & Chlu, 1977). The intrinsic cues most frequently examined include
style, fit, design, fiber content, color, care, and appearance. Intrinsic and
extrinsic cues have been related to perceived usefulness, performance, and
quality (Eckman, Damhorst, & Kadolph, 1990; Flore & Damhorst, 1992; Szybillo
& Jacoby, 1974).
45
Application of a variety of stimuli and methods in the examination of
product attributes has been suggested as desirable to counteract the indigenous
forms of bias associated with any stimuli, measure, and data collection situation.
Stimuli used to assess clothing have included actual products, photographs of
products, illustrations of products, written product category descriptions and,
product names or lists. Attributes have been measured by rating and ranking
scales as well as open-ended questions eliciting free response data. Data
collection generally has been approached via structured in-depth interviews,
discussion guided focus groups, and structured self-administered questionnaires
(Eckman, Damhorst, & Kadolph, 1990).
Apparel Product Attribute Studies
Davis (1987) formulated two studies to investigate the acquisition and use
of objective information by female consumers in making subjective judgments of
clothing quality, judgments of clothing fashionability, and clothing purchase
decisions. A behavioral process approach using decision simulation tasks was
used for both studies to identify how much and just what information consumers
used in making clothing judgments.
In Study 1, female college students (n=65) participated in a "shopping"
task where they were asked to judge the quality of four white blouses and then
state which one they would "buy." In Study 2, female college students (n=55)
participated in a similar "shopping" task situation but they were asked to judge
46
the fashionability of four white blouses and then state which one they would
"buy." For both studies, information about each blouse was presented to the
subjects via an information display board, arranged In a matrix array with four
brands (brands A, B, C, and D) as columns of the matrix and 10 clothing
attributes (care label, department in store, fabric, fit, general construction,
manufacturer neck label, price, salesperson's opinion, store, and style) as rows.
In order to make their judgments, subjects were asked to select the Information
they would need from the information display board (Davis, 1987).
Content analysis of the attributes selected by the subjects revealed that, in
general, subjects in both studies disregarded approximately half of the available
information. On the average subjects selected only five (in Study 1) or six (in
Study 2) of the 10 attributes available for each brand. The two most heavily
accessed attributes in both studies were style and price with fabric, store, and fit
also selected by most subjects (Davis, 1987).
Although all brands were said to be of equally high construction and of
similar styling, brand D, the 100% cotton designer label blouse, was rated
significantly higher In quality and fashionability than the other blouses. However,
fabric and price were more important than quality and fashionability as criteria for
subjects' "purchase decision" (Davis, 1987).
Heisey (1990) determined (a) if consumers perceive quality differences as
a result of the "minimum information environment" (MIE) cues (care
requirements, country of origin, fiber content, and store type/prestige), (b) price
47
differences as a result of MIE cues, and (c) the relationship between perceived
quality and predicted price and any effect of store type/prestige on this
relationship. Female junior and senior Retail and Textiles and Clothing majors,
enrolled in an apparel course at a Midwestern university (n=40) were asked to
evaluate the quality and to estimate the price paid for four identical "fatigue type"
sweaters. Different hypothetical profiles of the MIE cues were attached to the
sweaters and all other labels were removed. Two levels were used for each MIE
cue. The levels for each variable were chosen to represent the extremes of that
variable's range for sweaters on the market at that time.
The sweaters were obtained from mass merchandise and outdoor
specialty stores and catalogs. The name of the stores that offered the lowest-
and highest-priced sweaters were used as the two levels for vendor. The care
procedures used represented the most restrictive and the least restrictive labels
found in the product assortments from which the sweaters were selected. The
fiber content levels used were the two most commonly found on "cotton" type
sweaters. One level for country-of-origIn was domestic, and the other was a high
volume Asian exporter to the U.S (Heisey, 1990).
Differences in perceived price were analyzed using analysis of variance
with subject as the blocking factor. Quality ratings for sweaters that were labeled
100% cotton averaged 14% higher than for sweaters labeled cotton/acrylic;
however, predicted prices for the all cotton sweater averaged only 5.8% higher
than for those bearing the blend label. Predicted prices for sweaters that were
48
labeled as having been purchased from the specialty store averaged 23.4%
higher than those from the mass merchandiser; however the quality ratings for
the same sweater averaged only 6.0% higher than those from the mass
merchandiser. No interactions of care with other MIE cues were significant
(Heisey, 1990).
Significant differences in perceived quality were detected for fiber content
and vendor prestige/type. Differences were detected in perception of quality and
prediction of price related to MIE cues. A direct, positive relationship between
price and quality was found, with store type/prestige and fiber content appearing
to influence predicted price through modifying effects on the perception of quality.
No effects due to the country-of-origin and care procedures could be detected on
either predicted price or perception of quality (Heisey, 1990).
Eckman, Damhorst, and Kadolph (1990) invesfigated the importance of (a)
intrinsic and extrinsic criteria in purchase decisions for women's apparel, and (b)
criteria in both rejecting and accepting garments for purchase. Female
consumers (n=80) were Interviewed at two apparel specialty stores using a
combination of three procedures: (a) free response or open-ended interviews to
obtain descriptions of salient evaluative criteria in consumers' own words, (b)
garments personally selected by the respondents were the product stimuli
evaluated by the respondents, and (c) interviews conducted at polnt-of-purchase
or rejection. Attributes categories related to (a) aesthetic criteria, (b) "usefulness"
49
criteria relating to utilitarian concerns as to how usable the garments would be,
(c) performance and quality criteria, and (d) extrinsic criteria.
Fifty-two of the 80 respondents were purchasers and 28 were non-
purchasers. Overall, intrinsic criteria were used more often than extrinsic criteria
for clothing evaluation. Styling, color/pattern, fit, fabric, appearance, and price, in
that order, were the most frequently mentioned criteria for evaluating specific
garments. Almost 55% of these responses pertained to aesthetic factors. The
70 responses in the performance and quality categories indicated substantial
concern among subjects about performance, especially fit. The total of 30
responses among the usefulness categories Indicated less concern about
selecting garments to make maximum use of the wardrobe. Appropriateness,
utility, uniqueness, brand, and competifion were mentioned so infrequentiy that
these criteria may be of minimal concern to the consumer (Eckman, Damhorst, &
Kadolph, 1990).
Purchasers gave 175 responses; they used 147 responses to describe
what they liked and 28 responses to describe what they did not like about the
garments purchased. The majority of the purchasers' positive responses were in
the color/pattern, styling, fit, fabric, and price categories. Styling, fit, and
workmanship contained 60.7% of the negative responses from purchasers.
However, 29 of the 51 purchasers stated that there was nothing they did not like
about their garments (Eckman, Damhorst, & Kadolph, 1990).
50
Non-purchasers gave 121 responses; they used 76 responses to describe
what they liked and 45 responses to describe what they did not like about the
gamients. Styling, color/pattern, fabric, and comfort categories contained 70.7%
of the positive responses from non-purchasers. A majority of non-purchasers'
negative responses related to the styling, appearance, and fit categories.
For purchasers and non-purchasers, the most often-used category for
descriptions of what purchasers did not like about their garments was styling;
likewise, the most often-used category for descriptions of what non-purchasers
liked and did not like was styling. Many of the negative style comments were
about specific features such as collar length and garment length. Fabric ranked
fourth among criteria mentioned positively by purchasers and third among criteria
liked by non-purchasers. About 30% of these responses included specific
mention of cotton.
Overall, four major types of criteria emerged as important to respondents
(aesthetic, usefulness, performance and quality, and extrinsic criteria). The
aesthetic set of intrinsic criteria included directly observable compositional
characteristics. I.e., the criteria of style, color and pattern, fabric, and
appearance. Visual criteria seemed to have the greatest impact on selection of
garments for trial in the dressing room and subsequent purchase of a garment.
Visual characteristics fulfilled several implicit expectations, such as fashionability
or popularity, aesthetic appeal, and self-expression (Eckman, Damhorst, &
Kadolph, 1990).
51
Both purchasers and non-purchasers mentioned more criteria when
describing what they liked than what they disliked about the garments, probably
because respondents found the garments appealing or they would not have tried
them on. However, overall non-purchasers had proportionately more to say
about the garments (Eckman, Damhorst, & Kadolph, 1990).
Johnson and Workman (1990) investigated whether (a) care instructions
as a separate cue affected perceptions of garment quality, future performance,
estimated retail price, and likelihood of purchase, (b) subjects intended to follow
the recommended care instructions when caring for a garment, and (c) particular
store type Is associated with certain care Instructions. Undergraduate female
students (n=84) received a sketch of a garment along with one of two care
instructions (hand wash and dry flat or professionally dry-clean), recorded their
perceptions of garment quality and price, predicted the garments future
performance, and indicated the likelihood of purchasing the garment.
MANOVA was performed to determine the overall effect of the
independent variable, care Instructions, on the dependent variables (quality,
future performance If care instructions were followed, confldence that the
garment would retain its appearance, likelihood of purchase, and retail price)
(Johnson & Workman, 1990).
Results showed that care instructions did not significantly influence
perceptions of garment quality, retail price, confidence that the garment would
retain its appearance, or likelihood of purchase. However, predictions of the
52
garment's future performance did vary significantly by care instructions.
Instructions to professionally dry-clean resulted in more favorable predictions
about the garment's future performance than did hand wash and dry flat care
instructions (Johnson & Workman, 1990).
Of the 37 subjects who received the care instructions "professionally dry-
clean," 22 indicated that the garment would be sold in specialty stores, and 15 in
department stores. Of the 46 who received the care instructions "hand wash and
dry flat," 25 indicated that the garment would be sold in specialty stores, 19 In
department stores, one in discount stores, and one in an off-price store (Johnson
& Workman, 1990).
Of the 38 subjects that received the care instructions indicating that the
garment should be professionally dry-cleaned; only 17 said this was how they
actually would care for the garment. Five subjects would "hand wash, dry flat,"
seven would "machine wash, dry flat," and one would "machine wash, tumble
dry." In addition, of the 46 who received the "hand wash, dry flat" care
instructions; only 21 indicated they would actually care for the garment as
recommended (Johnson & Workman, 1990).
Subjects did not use care instructions in evaluating garment quality, price,
or likelihood of purchase. These results suggest that care instructions are cues
in which consumers lack confidence or find difficult to evaluate, or that cues do
not have predictive value in evaluations of apparel quality, price, or likelihood or
purchase (Johnson & Workman, 1990).
53
Forsythe (1991) examined (a) the effect of one extrinsic cue (brand name)
and intrinsic cues (actual product characteristics) on evaluations of the quality
and price of private, designer, and national brand products, and (b) the mediating
effect of consumer decision-making style on evaluations of quality and price for
designer and national brand products. A field experiment with shoppers in a
large urban mall (n=164) was used to examine the influence of brand name on
consumers' perceptions of apparel quality and price. Men's shirts were selected
as the stimulus product as a product category with which most consumers are
familiar and because both brand name and actual product characteristics could
be used by consumers In evaluating shirts. National, private, and designer
brands, which had high name recognition among consumers, were chosen for
this study in order to maximize the usefulness of the findings.
Each subject was asked to examine only one of the three shirts and to
rate the shirt examined on five 5-point Items of a bipolar scale measuring
perceptions of fabric quality, quality of notions, construction quality, design
quality, and overall quality. Each scale item has endpoints labeled high and low.
Consumer decision-making style was identified through a two-step process using
the Consumer Styles Inventory measure developed by Sproles and Kendall
(1986) principal components factor analysis Isolated independent measures of
key decision-making constructs from statements regarding shopping attitudes.
Second, cluster analysis was used to group shoppers into either brand or quality
conscious scores (Forsythe, 1991).
54
Results of the ANOVA showed that brand name (the Independent
variable) did not affect perception of garment quality (the dependent variable).
The finding of no significant differences in perceived quality among the three
brands supports the hypothesis that perception of apparel quality will not vary as
a function of brand name when evaluating the actual product. Therefore,
consumers appear to rely primarily on intrinsic cues (actual garment
characteristics) rather than brand name when evaluating the quality of apparel
items. These findings show that actual garment characteristics are more
important than brand name in evaluating garment quality and suggest that the
assumption that consumers associate quality in apparel with brand name may be
erroneous (Forsythe, 1991).
Brand name did appear to influence shoppers' perception of price. The
designer brand was perceived to be signiflcantly more expensive than national
and private brands; however, price perceptions for national and private brands
did not differ. Brand and quality conscious shoppers differed with respect to the
price attributed to the shirts but not the quality. Overall, brand conscious
shoppers attributed significantly higher prices to the shirts than did quality
conscious shoppers (Forsythe, 1991).
Results also showed that brand conscious shoppers perceived private
brand shirts similar to designer brand shirts whereas quality conscious shoppers
perceived private brand shirts to be more like the national brand with respect to
price. Brand conscious shoppers priced the private brand similar to the mean
55
price for designer brands whereas quality conscious shoppers priced the private
brand similar to the mean price for national brands. Thus, consumer decision
making style does appear to be a mediating factor in the perception of apparel
price, but not quality, when both brand name and the actual product are available
for evaluation (Forsythe, 1991).
Brand and quality conscious shoppers did not differ with respect to
gender, shopping frequency, education, martial status income level, type of store
shopped, or purchase of men's shirts within the last two years. Also, brand
conscious shoppers were no more likely than quality conscious shoppers to
indicate that brand was an important criterion in selecting apparel. This suggests
that brand conscious shoppers may be unaware of the importance of brand
name in clothing purchase decisions or they may be reluctant to admit the
Importance of brand to them. Quality conscious shoppers, on the other hand,
rated construction quality as more important than did brand conscious shoppers,
which suggests that quality conscious shoppers are more concerned than brand
conscious shoppers with intrinsic cues such as actual garment characteristics
(Forsythe, 1991).
Hines and O'Neal (1995) evaluated the underlying meaning of attributes
used by female consumers (n=25) to judge clothing quality by the cognitive
structure that exists between the evaluative criteria used to judge quality and
personal values. The means-end chain model provided the framework for the
study. Means-end theory assumes that (a) values play a dominant role in
56
guiding choice patterns, (b) all consumer actions have consequences, and (c)
consumers learn to associate a particular consequence to a particular action.
The "means" are identified as product attributes and the "end" as values
important to the consumer.
Fabric was the only attribute Identified by the majority of the subjects for
evaluating quality. At the inference level, subjects identified motives for selecting
attributes. These motives included expectation concepts and perception of
Image concepts that a high quality garment would create. As a group, subjects
expected the smooth fabric would not pick up lint or pill, would hold its shape,
and be durable. They also thought that fabric helped to create perceived images
of what a quality garment should look like in creating a good overall appearance.
Fabric was also Important for economic reasons. Fabric was perceived to have
had a salient effect on overall appearance and performance of the garment and
therefore, a major influence on evaluation of the quality (Hines & O'Neal, 1995).
Results indicated that consumers judge clothing quality for more than its
economic benefits. Social and psychological benefits were at least equally as
important. Social consequence concepts were mentioned in 77.5% of the chains
and psychological consequences in 78.5%. Consumers identified quality based
on attributes that they evaluated for performance, perceptual image,
workmanship, and expectations of the attributes. The social, psychological,
economic, physiological, and aesthetic consequences of the attributes selected
were factors that influenced use/avoidance of an attribute to evaluative quality.
57
Personal values also affected consequences that the subjects desired or
avoided. The findings indicate high quality garments play an Important role in
how women feel about themselves, how they perceive others to view them, and
how they assess economic value for money spent (Hines & O'Neal, 1995).
Abraham-Murali and LIttrell (1995a) attempted to: (a) generate a
comprehensive list of apparel attributes grounded in consumer vocabulary, (b)
arrange the attributes in conceptual themes and dimensional levels, and (c)
examine the attributes in ways that would be useful to different types of retailers.
Three objectives guided this research. A comprehensive list of apparel attributes
would be useful to researchers who sought to be inclusive of a broad range of
apparel attributes and for those who want to explore, in depth, a smaller group of
related attributes. Unidimensional attributes encompass a single characteristic,
often related to the composition or construction of a product. Multidimensional
attributes are a function of, or result from, two or more unidimensional attributes.
Five focus groups interviews were conducted with female consumers
(n=31) in four midwestern towns. The focus groups were designed in a three-
part format to parallel some of the evaluation process in different types of retail
settings. Four conceptual themes and a comprehensive list of 79 attributes were
developed. Words, phrases, and sentences used by the participants to describe
an experience, observation, or opinion about a clothing attribute that influenced
their clothing purchase decisions were regarded as units of data (Abraham-
Murali & Littrell, 1995a).
58

A coding guide was prepared by grouping similar attributes into broad
themes that would best describe them. Categories were Identified to make finer
distinctions within the themes. Data was content analyzed independently by two
trained judges. Percentages for each of the three parts of the discussion were
computed by dividing the number of units of data corresponding to a category of
attributes in a specific part of the discussion by the total number of units of
analysis in that part of the discussion (Abraham-Murali & LIttrell, 1995a).
Results showed that the attributes represented a multiplicity of product
characteristics that play a role in product choice and evaluation. Responses
were consistent in that four common themes (physical appearance (37%),
physical performance (24%), expressive (20%), and extrinsic (19%) emerged
across the five interviews. The four common themes were composed of
unidimensional and multidimensional attributes which were intrinsic and extrinsic
in nature. The 79 apparel attributes included concrete, tangible features of
clothing such as dress length, color, and fabric structure, as well as abstract and
Intangible attributes such as durability and whether the garment looked good on
the wearer (Abraham-Murali & Littrell, 1995a).
In addition, results showed that consumers are able to distinguish
between the physical appearance of the product and its instrumental and
expressive functions. Both unidimensional and multidimensional attributes were
used In cognitive processing of clothing attributes. The unidimensional attributes
are combined to form a prediction of, or inferences about, multidimensional
59
attributes. Both types of attributes appear to be important to consumers In
decision-making (Abraham-Murali & Littrell, 1995a).
Abraham-Murali and Littrell (1995b) researched apparel quality to: (a)
identify conceptual dimensions among a large set of apparel attributes at
expectation and post-purchase evaluation stages, and (b) ascertain how these
conceptual dimensions and other variables, such as patronage benefits,
demographics, and years of experience shopping with an mail-order company,
explained variance in perceptions of overall quality at the two evaluation stages,
and (c) propose a model for consumers' perceptions of apparel quality. Female
consumers (n=300) who had placed orders for one of three dresses from Land's
End, Inc. formed the sample for the study.
The data was analyzed in three stages. The first stage involved using t-
tests to assess whether there were differences in the responses between
consumers who had filled out the purchase questionnaire before receiving the
garment and those who had completed It after receiving the garment. Analysis
indicated no significant differences between the two groups (Abraham-Murali &
LIttrell, 1995b).
In the second stage, the expectation, post-purchase evaluation, and
perceived patronage benefit measures were analyzed using principal component
analysis. The expectation measure was consumers' responses to 61 attributes
in the purchase questionnaire. Consumers' responses to the same 61 attributes
in the post-purchase questionnaire were the post-purchase evaluation measure.
60
The benefit measure included 26 pre-purchase criteria that are related to
consumers' decisions to buy. In the final stage of data analysis, regression
models were used to Identify the "best" estimators of overall quality at the
expectation and post-purchase stages (Abraham-Murali & Littrell, 1995b).
Results showed that consumers' conceptualization of garments' quality
changes over time as a garment is purchased and used. In the expectation
analysis, 29 items factored into four factors (Care, Value, Style, and Product and
Services) but in the post-purchase evaluation analysis 39 items were Included
into four factors (Fabric, Care, Expressive, and Individuality). After using the
actual product the respondents' conceptualization included more attributes.
Through actual usage consumers became more informed about the garment and
the importance of attributes may have become clearer. More multidimensional
attributes emerged in the factors after consumers used the product than before
consumers had actual access to the dress (Abraham-Murali & Littrell, 1995b).
Findings also showed some difference in perception or salient factors of
quality at the two stages. In the expectation stage. Fabric and Garment
Construction were useful In predicting quality. The factors containing care items
emerged as important dimensions of quality at both expectation and post-
purchase evaluation stages. Appearance on the Body, Individuality and
Expression, Expressive, and Individuality factors did not contribute to
assessment of quality at either stage of evaluation (Abraham-Murali & Littrell,
1995b).
61
Actual garments were evaluated at two points in time, at the expectation
stage and at the post-purchase evaluation stage. Consumers' conceptualization
of Fabric, Care, and Individuality became more focused; however, the Expressive
factor broadened in meaning. Consumers seemed to need experience with the
product to completely conceptualize some complex, mullticomponent attributes
that are important and meaningful to them (Abraham-Murali & Littrell, 1995b).
Beaudoln, Moore, and Goldsmith (2000) investigated if fashion leaders
(n=72) and fashion followers (n=569) differed (a) in the importance they give to
12 selected apparel attributes (good fit, durability, ease of care, good price,
comfort, quality, color, attractiveness, fashlonableness, brand name,
appropriateness for occasion, and choice of style), and (b) in attitudes toward
buying domestic and imported apparel. A random list of 3000 women living in
Florida purchased from a commercial mailing list comprised the population for
the study. FIshbein's (1967) attitude model was used as the conceptual
framework. The model was used to measure attitudes toward buying domestic
and imported apparel. The questionnaire had three sections: the construct of
fashion leadership, attitudes toward buying domestic and Imported apparel
products, and apparel behavior and demographic questions. Goldsmith and
Hofacker's (1991) Domain Specific Innovativeness Scale (DSI) was used to
measure the construct of fashion leadership.
Results indicated that fashion leaders accorded more importance than
fashion followers to six of the 12 apparel attributes: color, attractiveness.
62
fashlonableness, brand name, appropriateness for occasion, and choice of
styles. These six attributes are associated with the image, the symbolic, the
glamorous, and the extrinsic aspects of the product. In contrast, the six other
attributes are associated with the intrinsic aspects and the "functional aspects" of
apparel (Beaudoln, Moore, & Goldsmith, 2000).
Fashion leaders and followers had a significantly more positive attitude
toward domestic apparel than toward imported products. However, among
fashion leaders, domestic and imported apparel were not significantly related to
the image or symbolic aspects of clothing. Therefore, more favorable attitudes of
leaders toward domestic apparel were associated with the functional aspects of
apparel. Fashion leaders gave significantly higher evaluafions than followers for
imported apparel on 8 of the 12 apparel attributes: good fit, quality, color,
attractiveness, fashlonableness, brand name, appropriateness for occasion, and
choice of styles. Although fashion leaders gave higher evaluations than followers
to the other four attributes (durability, ease of care, good price, and comfort),
differences were not large enough to be significant. However, both groups gave
a clear advantage to domestic made apparel, regarding durability, ease of care,
good price, and comfort, over imported apparel (Beaudoln, Moore, & Goldsmith,
2000).
No difference was found between the two groups regarding attributes
associated with the functional aspects of apparel. Considering that fashion
leaders are impulsive buyers, attributes such as color, fashlonableness, or
63
attractiveness may represent more determinant buying factors in the retail store.
Given the positive evaluation given by fashion followers toward domestic apparel
over imports, followers may be affected by social desirability when asked to
evaluate domestic versus imported apparel (Beaudoln, Moore, & Goldsmith,
2000).
Leather Footwear Industry
The leather footwear industry has continued to grow and maintain market
share even though new materials are being developed for footwear. However,
thoughts on how the footwear market will evolve are split. Some believe that
footwear is a global market that can be standardized, perpetuating mass
production of high volume uniform styling (Charlesworth, 2001). Others see
different countries and markets having their own specific needs, encouraging a
move away from volume production (Chariesworth, 2001). In either view, future
success in the footwear industry will depend on efficient global resourcing to
ensure that the right quantities of shoes in the right sizes are in the right retailers
at the right time ("Development In Footwear," 2000).
Leather Products Industry Structure
The leather industry consists of three stages; production of raw materials,
transformation of the raw materials into various types of leather, and the
manufacture of finished products. Links between the three stages are rather
64
unique in comparison with other manufacturing Industries. Hides and skins are a
by-product of the much larger meat and wool industries. Leather tanners and
finishers are the sole market for the raw materials, and the entirety of the off-take
is converted into leather
The leather industry produces about 18 billion square feet of leather per
year, and the total value is estimated at about $40 billion ("Perspective on
Leather," 2000). Price of the raw materials Is of overriding concern for users
although the supply is determined by conditions outside the leather Industry.
Hide and skin supply has increased by an average of only 1.5% annually in
recent decades ("The Up Down," 2001). Real pressure on cattle hide availability
in the US comes from export activity. Developing countries now produce over
60% of the world's leather, and this proportion Is growing ("Perspective on
Leather," 2000). Generally, leather demand exceeds supply and experts do not
believe this is likely to change ("The Up Down," 2001).
Leather Footwear Industn/ Overview
The leather footwear sector is a major part of the leather and leather
products industry, which is defined to include all aspects of tanning and finishing
as well as the production of finished products made from leather (Ballance,
Robyn, & Forstner, 1993). About 65% of the worid's production of leather is
estimated to go into leather footwear. Leather footwear as defined by shoes with
leather uppers Is estimated to account for 43% of total worid production. This
65
accounts for nearly 5000 million pairs of leather shoes consuming well over 11
billion square feet of upper leather including linings ("Global Shoemaking Grows,"
2001). Global production of footwear is estimated at around 11.8 billion pairs
(worth an estimated $150 billion at wholesale) ("Look of Leather," 2001) showing
an increase of 4.1% compared with previous annual increases of .03 In 1998,
5.0% in 1997, and 5.3% In 1996 ("Global Shoemaking Grows," 2001).
Overall, the global footwear market has remained static throughout the
90s, despite variations in production by region ("Worid Leather Markets," 1998).
However, new countries are now rising to prominence as shoemakers have
largely moved to Asia ("Global Shoemaking Grows," 2001). Production In Asia
continues to grow, increasing by 600 million pairs per year to bring its share of
worid production to 73.9%. China has contributed 400 million pairs towards this
increase and remains the dominant country in the footwear industry with a 51.4%
share of global production. The next largest producer is India at an estimated
700 million pairs followed by Indonesia and Brazil ("Global Shoemaking Grows,"
2001).
Legislation is forcing shoe companies to modify how products are made,
what they are made from, and how they can be recycled ("Components Go
Ecological," 2001). Significant steps have been made in the global leather
industry with regard to environmental issues. The bought-in items that have the
most significant impact on the environment are hides and skins and the leather
processing chemicals ("Components Go Ecological," 2001). Materials
66
development research Is addressing environmental concerns. Overall, chemical
and water use has been reduced In the manufacturing stages and a high level of
quality control ensures that the best use is made of hides and skins and the
chemicals required in their conversion into leather ("Perspective on Leather,"
2000). Product design and different material choices that address environmental
sustainability and product life cycle have become important alternatives to the
leather shoe industry and are now being explored by manufacturing companies.
Domestic Footwear Market
An increasing proportion of footwear is being manufactured in developing
countries, leading to greater global movement of finished products (Buirski,
1999). More exporters, offering merchandise at cheaper prices has had a
significant impact on the domestic market in terms of sheer volume ("Footwear
Market Grows," 2000). According to the Leather Industries of America (U.S.
Leather Industry Statistics, 2000), China currently accounts for nearly 984 million
pairs of shoes being imported to the U.S., ten times the volume of any other
importing country accounting for over 50% of U.S. footwear consumpfion
("Footwear Market Grows," 2000).
In the early 1980s, the U.S. was still manufacturing over 400 million pairs
of shoes a year. By 1986, and through the end of the decade, production was
fluctuating around the 300 million mark and the industry employed around 90,000
people. Exports started climbing strongly, rising from under 10 million pairs in
67
1984 to over 16 million pairs In 1989. Production again took a downturn in 1994
to 243 million pairs and exports had more than doubled to over 34 million pairs.
By 1998, production had further decreased to 165 million pairs while exports
flattened out at around 34 million pairs ("Footwear Market Grows," 2000). The
Shoe and Allied Trades Research Association (SATRA) has forecasted that U.S.
footwear production will continue to fall, dropping to 122 million pairs by 2005
(Buirski, 1999).
No footwear market in the world compares to the U.S. in size, value, and
variety with an apparent consumption of some 1600 million pairs of shoes
annually. Nevertheless, in the last two decades, domestic shoemaking has
declined ("Footwear Market Grows," 2000). Pressure from importers combined
with the free trade opportunities created by NAFTA for Mexico have increased
imports to 93% of the total domestic market, forcing U.S. manufacturers to locate
manufacturing offshore, seek new export opportunities, and serve niche markets
as the best route to their continuing survival ("Footwear Market Grows," 2000).
Many U.S. shoe companies have moved to specifiers, controlling design,
materials, quality, and marketing to maintain market share and profitability
("Footwear Market Grows," 2000).
Footwear Market Trends
Footwear is much more than simply a functional item to keep the feet
warm and dry. Footwear Is part of a person's overall attire and appearance and
68
is perceived by the wearer to refiect their individuality and status ("Growth of
Branding," 2001). Shoes are essentially a fashion item subjected to periods of
fluctuating demand throughout the year ("The Up Down," 2001). Success with
product development is directly proportional to understanding current and future
product and consumer trends.
Currently, consumer confidence is at an eight year low and the footwear
industry is predicted to be flat in 2002 (Boettge, 2002). In the present
manufacturer to retailer supply chain, if a shoe sells well and the retailer cannot
secure a quick repeat order sales are lost. Equally, if the shoe does not sell well,
its price is reduced and again profit is lost (Charlesworth, 2001). Trends in color
from companies that produce dyes for tanners. Information on new shoe
components, and styling are Important for the leather shoe industry in developing
potentially profitable commercial products (McCallin, 1995).
Other factors that now affect the footwear industry are: extension of
branding in clothing to footwear, less footwear sold through specialty footwear
retailers, growth In home shopping though catalogs and the Internet, availability
of custom-made footwear, 3D visualization of footwear, less stock being carried
at retail, and intensified gathering of data on shopping habits through loyalty and
similar product differentiations techniques ("Best Footwear Fon /ard," 2000).
Emerging trends Important to retailers are: lower per capita consumption due to
longer lasting footwear, an aging population, less formal dress, and consumer
demand for value for money goods (Buirski, 1999).
69
The aging population, will have a significant effect on the types and
ranges of footwear products sold because of an increased demand for footwear
with greater fit tolerance and comfort (Buirski, 1999). Consumers also will want
more quality products and guarantees of workmanship when purchasing
footwear. The recent rise of the Internet has created different ways in which
footwear companies are meeting consumer needs. E-business varies from
traditional retail stores by allowing the business to become 'customer-centric' as
opposed to 'product-centric' (Smart, 2001). Instead of focusing on the production
of a range of products or services and then offering them to customers, the
company focuses on a partnership with customers to identify their needs and
then provide specialized products (Smart, 2001).
Mass customization in which the customer plays an active role in the
design of products and services now is being marketed on the Internet and in
retail stores (Martin, 1997). Mass customization Is a hybrid technique by which a
company produces mass merchandise yet can add unique features to individual
orders (Martin, 1997). Customers can mix and match design components such
as style, color, texture, sole options, and leather type. For example, the Custom
Foot Company has 10,000 variations available in women shoes alone. This
merchandising strategy provides consumers the option to customize footwear
without the expense of handmade shoes.
U.S. shoemakers and apparel manufacturers are now working together in
brand extension and diversification (Buirski, 1999). Branding is an important
70

aspect in the success of shoe companies branching into apparel production,
sports footwear manufacturers diversifying into other footwear classifications,
and apparel manufacturers expanding Into footwear production. In turn,
consumers like the ability to buy a full product package from a brand. For
example, Fila actually started as an apparel company and U.S. shoe sales
accounted for 40% of Fila's 1.2 billion sales in 1995 (Henricks, 1997).
Overall, how the footwear market will continue to develop is open for
debate. Consumers are still likely to buy shoes but lower per capita spending is
foreseen. The needs of the shoe manufacturer and the shoe retailer based on
future consumer trends are different. The manufacturer needs long production
runs and uncomplicated styling to maximize profits and the retailer needs low
volume supplies, a variety of styles, and quick restocking (Charlesworth, 2001).
Summary of Review of Literature
The U.S. footwear industry is facing many challenges with the decline of
domestic footwear production and the progressive movement to foreign
manufacturing. For example, China currently accounts for nearly 984 million
pairs of shoes being imported to the US ("Global Shoemaking Grows," 2001).
The future growth and prosperity of the footwear market will depend, in part, on
how accurately the target market is defined and on the development of product
assortments based on distinct purchase behavior. Segmentation based on
71
consumers' product involvement and their perceptions of product attributes can
contribute to successful targeting of specific profitable markets.
In order for segmentation to be successful, the market must be described
in measurable terms, be accessible, be divided into homogeneous groups, and
be potentially profitable (Cross, 1999). By segmenting the market, companies
can determine the best marketing mix or products needed to target particular
consumers (Sauerman, 1988). Current changes affecting marketers such as,
micro marketing segmentation, global market segmentation, direct marketing
segmentation, retail segmentafion, geodemographic segmentation, segmentation
for optimizing service quality, segmentation for customer satisfaction evaluafion,
segmentation for new product development, segmentation using single-source
data, and so on (Wedel & Kamakura, 1998; Myers, 1996; Wensley. 1995;
Weinstein, 1994) will all impact footwear retailers and manufacturers. An
effective segmentation program based on product Involvement and product
attributes will help analyze markets, find unique opportunities, and increase
market share (Cross, 1999).
Consumer behavior has been explained in part by the theory of consumer
involvement (Thomas, Cassill, & Forsythe, 1991). Customers will differ in the
extensiveness of their purchase decision process (Laurent & Kapferer, 1985) and
researchers agree that the study of Involvement is important to explaining and
predicting their behavior. Consequently, product involvement can lead to a
greater perception of attribute differences, product importance, and brand
72
commitment (Zaichkowsky, 1985). Variations In consumers' level of involvement
are important to marketers because they effect consumers' reactions to different
marketing strategies. Therefore, high and low Involvement with a product can
create significant market segments.
Differences in consumer preferences can be explained in part by
differences in product attributes. Why consumers buy particular products has
been an issue addressed in empirical and conceptual studies (Vriens & Hofstede,
2000). Previous research related to apparel has used intrinsic and extrinsic
product attributes to investigate overall judgments made by consumers.
The leather footwear industry has continued to grow and maintain market
share. However, the future profitability of the footwear industry depends in part
on how well marketers can continue to provide consumers with the right mix of
products and effectively target consumers based on their footwear preferences.
Segmentation based on product Involvement and product attributes can become
an effective tool to this end.
73
CHAPTER III
METHODOLOGY
The purpose of this study was to determine If High Involvement (HI)
consumers and Low Involvement (LI) consumers differed in their purchase of
leather dress shoes for business wear by (a) Identifying group membership of HI
and LI on footwear purchase criteria and footwear characteristics and (b) building
guidelines to classify HI and LI on their purchase behavior regarding leather
dress shoes for business wear. Specific objectives focused on (a) identifying
predictor (I.e., independent) variables from footwear purchase criteria and
footwear characteristics using AnswerTree® to create decision trees, (b)
identifying nodes from decision trees having the highest proportion of HI and LI
consumers (i.e., HI and LI that are most likely to purchase leather dress shoes
for business wear), (c) calculating percentage of HI and LI consumers that
leather dress shoe retailers can reach by targeting a certain percentage of the
market, and (d) identifying HI and LI consumer characteristics in regard to their
ratings of footwear purchase criteria and footwear characteristics.
Conceptual Framework
The conceptual framework underlying this research is the relationship
between product involvement and product attributes that impact consumer
74
purchase behavior. Consumer involvement is defined as a person's perceived
relevance of a product or service based on inherent needs, values, and interests
(Zaichkowsky, 1985). Engel, Blackwell, and MIniard (1986) stated that clothing
was one of a few high involvement products, because clothing is perceived as
refiecting on one's self-image, clothing Is costly, the risks of a wrong decision are
high, and/or when the act of purchase or consumption takes place. It is of high
personal importance or relevance to the decision maker. However, the level and
risks may vary with the type of clothing. Consumer involvement with a particular
product is important because different levels of Involvement may lead to different
perceptions of attributes and to different choices (Howard & Sheth, 1969).
A basic premise underlying consumer behavior is that when making
purchase and consumption decisions, consumers search for product information
in order to discriminate between comparable products and make efficient
decisions (Assael, 1984; Bloch, 1981). The information-processing paradigm
suggests that in evaluating products, consumers seek and process Information
about alternative products and multiple product attributes (Anderson, 1981;
Chaiken, 1980). In turn, product characteristics, including intrinsic and extrinsic
attributes, are cues used by the consumer to develop perceptions of a product
and have an influence on the purchase decision and consumption process
(Baugh & Davis, 1989; Forsythe, 1988; Huddleston, Cassill, & Hamilton, 1993).
75
The concept of involvement appeared to be useful to segment consumers
by the degree and level of product involvement and then to investigate product
attributes used in the evaluation of a product that might result from different
levels of involvement. Based on the purpose of the study and the review of
literature, the following research questions were asked:
RQ1. Can HI and LI consumers be grouped by their assessment of the footwear
purchase criteria and footwear characteristics of leather dress shoes for
business wear?
RQ2. Can HI and LI consumers be classifled on their leather footwear purchase
behavior, thus benefiting the retailer selling leather shoes to HI and LI
consumers in footwear purchase criteria and footwear characteristics?
The procedure that was followed is divided into the following sections: (a)
Selection of the Sample, (b) Research Instrument, (c) Collection of the Data, (d)
Variables of the Study, and (e) Statistical Analysis of Data.
Selection of the Sample
The target population for this study was employed female and male
consumers from the entire U.S. who wear leather dress shoes to work at least
one day a week. A national cross-section of 1,000 female and 1,000 male
consumers was drawn for the study sample. National Demographics & Lifestyles
Inc. (NDL) selected subjects through a random sampling technique using a
76
752,357 female database and a 3,327,143 male database. All subjects had an
equal and independent chance of being selected for the sample. NDL complies
a list of consumer names from purchasers of a variety of retail products via a
questionnaire composed of demographic and life style Interest area items.
Research Instrument
Development of the Questionnaire
A questionnaire was utilized for data collection. The instrument was
designed to elicit responses from females and males age 25 to 65 years in the
U.S. who wear leather dress shoes to work at least one day a week. A self-
administered mail questionnaire was constructed regarding the respondent's (a)
footwear opinion leadership, (b) preferences regarding footwear worn for
business wear, (c) favorite and purchased footwear brands, (d) stores shopped
for footwear, (e) footwear Involvement, (f) footwear purchase criteria, (g)
footwear consumption patterns, (h) footwear characteristics, and (i)
soclodemographic characteristics.
Information elicited in Items related to footwear: preferences, purchase
criteria, consumption patterns, and characteristics were Identified from a review
of related literature (Davis, 1985; Eckman, et al., 1990; Fiore & Damhorst, 1992;
Forsythe, 1991; HIavaty, Harp, & Horridge, 1997) and a series of focus group
interviews (Harp, Moore, & Horridge, 2001). The literature examined attributes
77
used in the information search and purchase decision for clothing. The focus
group discussions centered on attributes that influenced consumers' purchase
and satisfaction with leather dress shoes worn for business activities.
Footwear opinion leadership was measured with Items that focused on a
person's desire to own clothing of the latest style and the situation-specific
relevance of an object to a person that were adapted from previous instruments
(Hawes & Lumpkin, 1984; Salma & Taschian, 1987). Measures adopted from
Hawes and Lumpkin's study had internal consistency (Cronbach alpha of .60)
and adequate discriminant validity. Measures adopted from Slama and
Tashchian's study had internal consistency (Cronbach alpha of .61) and
adequate discriminant validity.
Footwear involvement was measured with items that focused on a
person's perceived importance/risk of a product, symbolic value, hedonic value,
and interest with a product that were adapted from previous instruments (Jain &
Srinivassan, 1990; Laurent & Kapferer, 1985). Measures adopted from Laurent
and Kapferer's study had internal consistency (Cronbach alphas ranging from
.72 to .90) and good discriminant validity. Measures adopted from Jain and
Srinivassan's study had internal consistency (Cronbach alphas ranging from .72
to .82) and good discriminant validity. The questionnaire was pretested with a
convenience sample of 30 consumers, 15 females and 15 males who were not
78
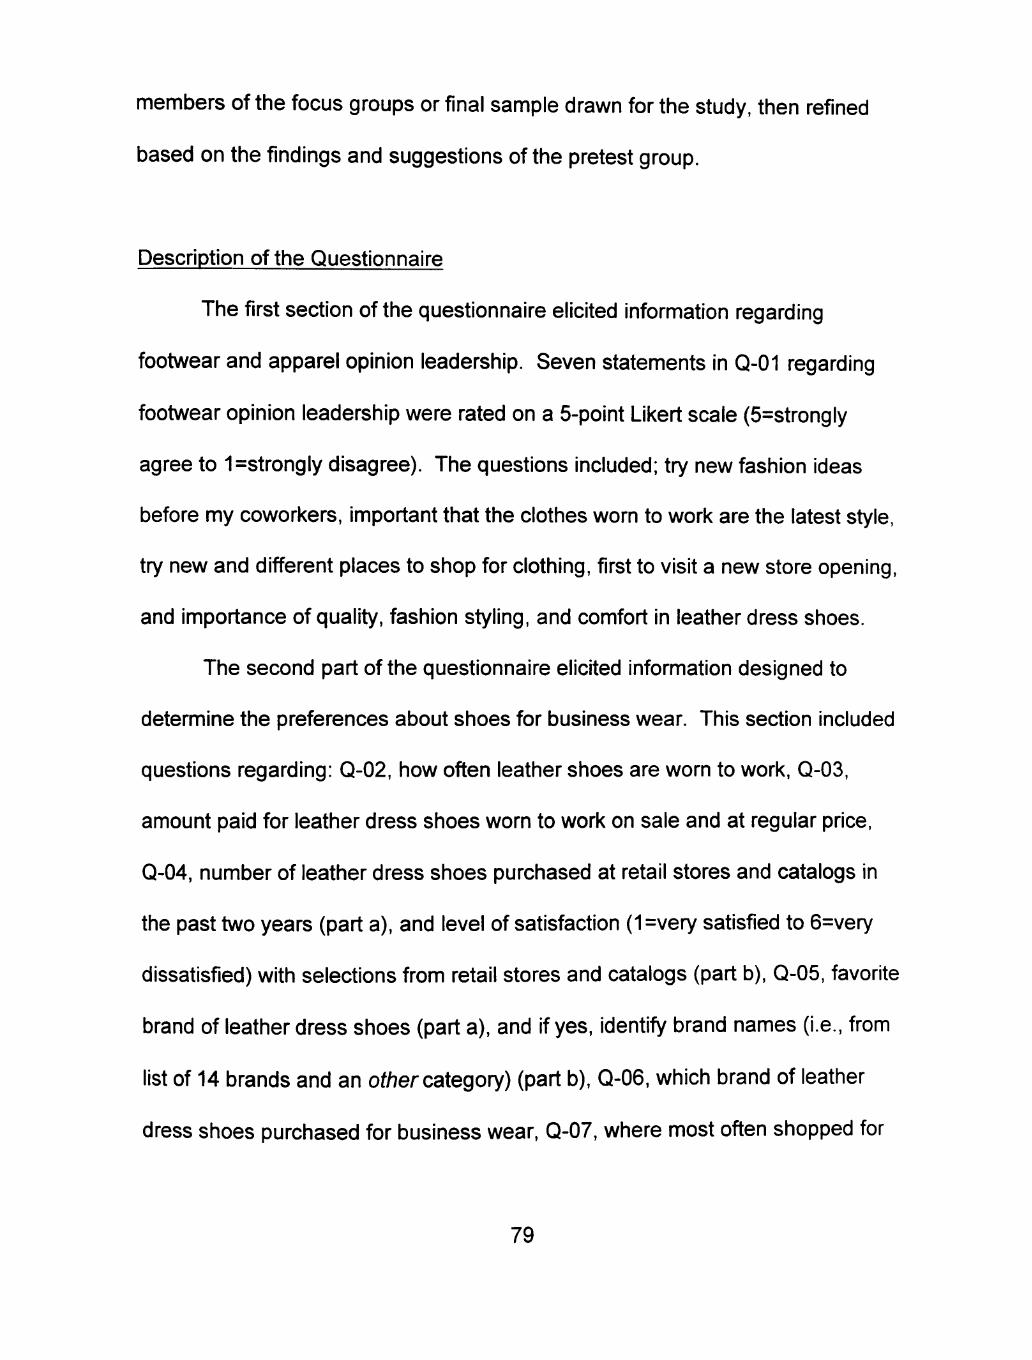
members of the focus groups or final sample drawn for the study, then refined
based on the findings and suggestions of the pretest group.
Description of the Questionnaire
The first section of the questionnaire elicited information regarding
footwear and apparel opinion leadership. Seven statements In Q-01 regarding
footwear opinion leadership were rated on a 5-polnt Likert scale (5=strongly
agree to 1=strongly disagree). The questions included; try new fashion ideas
before my coworkers, important that the clothes worn to work are the latest style,
try new and different places to shop for clothing, first to visit a new store opening,
and Importance of quality, fashion styling, and comfort in leather dress shoes.
The second part of the questionnaire elicited information designed to
determine the preferences about shoes for business wear. This section included
questions regarding: Q-02, how often leather shoes are worn to work, Q-03,
amount paid for leather dress shoes worn to work on sale and at regular price,
Q-04, number of leather dress shoes purchased at retail stores and catalogs in
the past two years (part a), and level of satisfaction (1=very satisfied to 6=very
dissatisfied) with selections from retail stores and catalogs (part b), Q-05, favorite
brand of leather dress shoes (part a), and if yes, identify brand names (i.e., from
list of 14 brands and an of/?ercategory) (part b), Q-06, which brand of leather
dress shoes purchased for business wear, Q-07, where most often shopped for
79
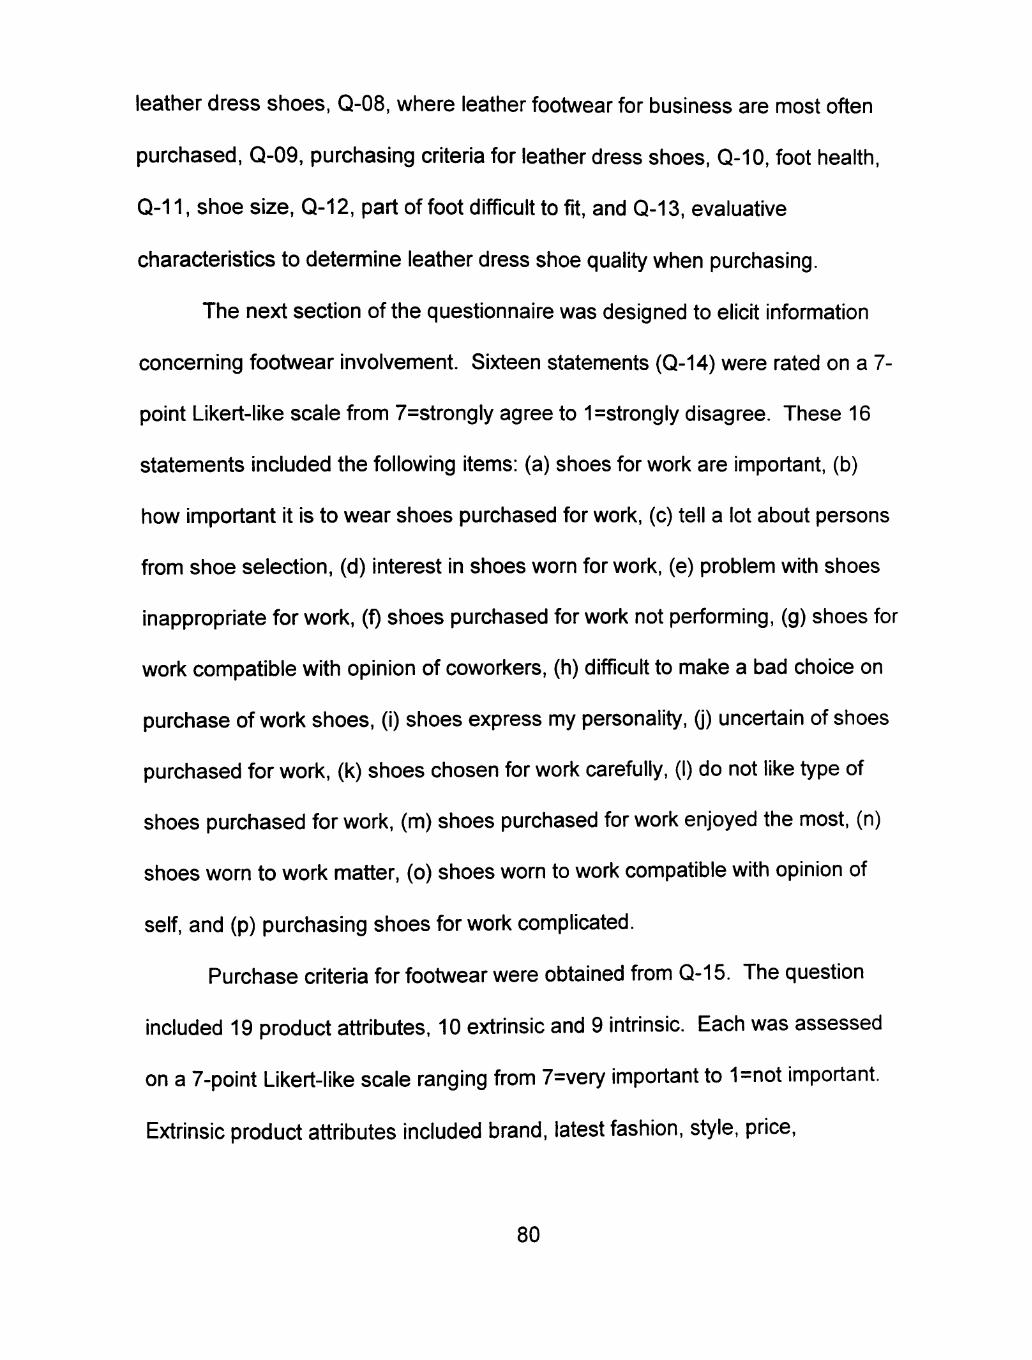
leather dress shoes, Q-08, where leather footwear for business are most often
purchased, Q-09, purchasing criteria for leather dress shoes, Q-10, foot health,
Q-11, shoe size, Q-12, part of foot difficult to fit, and Q-13, evaluative
characteristics to determine leather dress shoe quality when purchasing.
The next section of the questionnaire was designed to elicit information
concerning footwear Involvement. Sixteen statements (Q-14) were rated on a 7-
polnt LIkert-like scale from 7=strongly agree to 1=strongly disagree. These 16
statements included the following items: (a) shoes for work are important, (b)
how important it is to wear shoes purchased for work, (c) tell a lot about persons
from shoe selection, (d) Interest In shoes worn for work, (e) problem with shoes
inappropriate for work, (f) shoes purchased for work not performing, (g) shoes for
work compatible with opinion of coworkers, (h) difficult to make a bad choice on
purchase of work shoes, (1) shoes express my personality, (j) uncertain of shoes
purchased for work, (k) shoes chosen for work carefully, (I) do not like type of
shoes purchased for work, (m) shoes purchased for work enjoyed the most, (n)
shoes worn to work matter, (o) shoes worn to work compatible with opinion of
self, and (p) purchasing shoes for work complicated.
Purchase criteria for footwear were obtained from Q-15. The question
included 19 product attributes, 10 extrinsic and 9 intrinsic. Each was assessed
on a 7-point LIkert-like scale ranging from 7=very Important to 1=not important.
Extrinsic product attributes included brand, latest fashion, style, price.
80
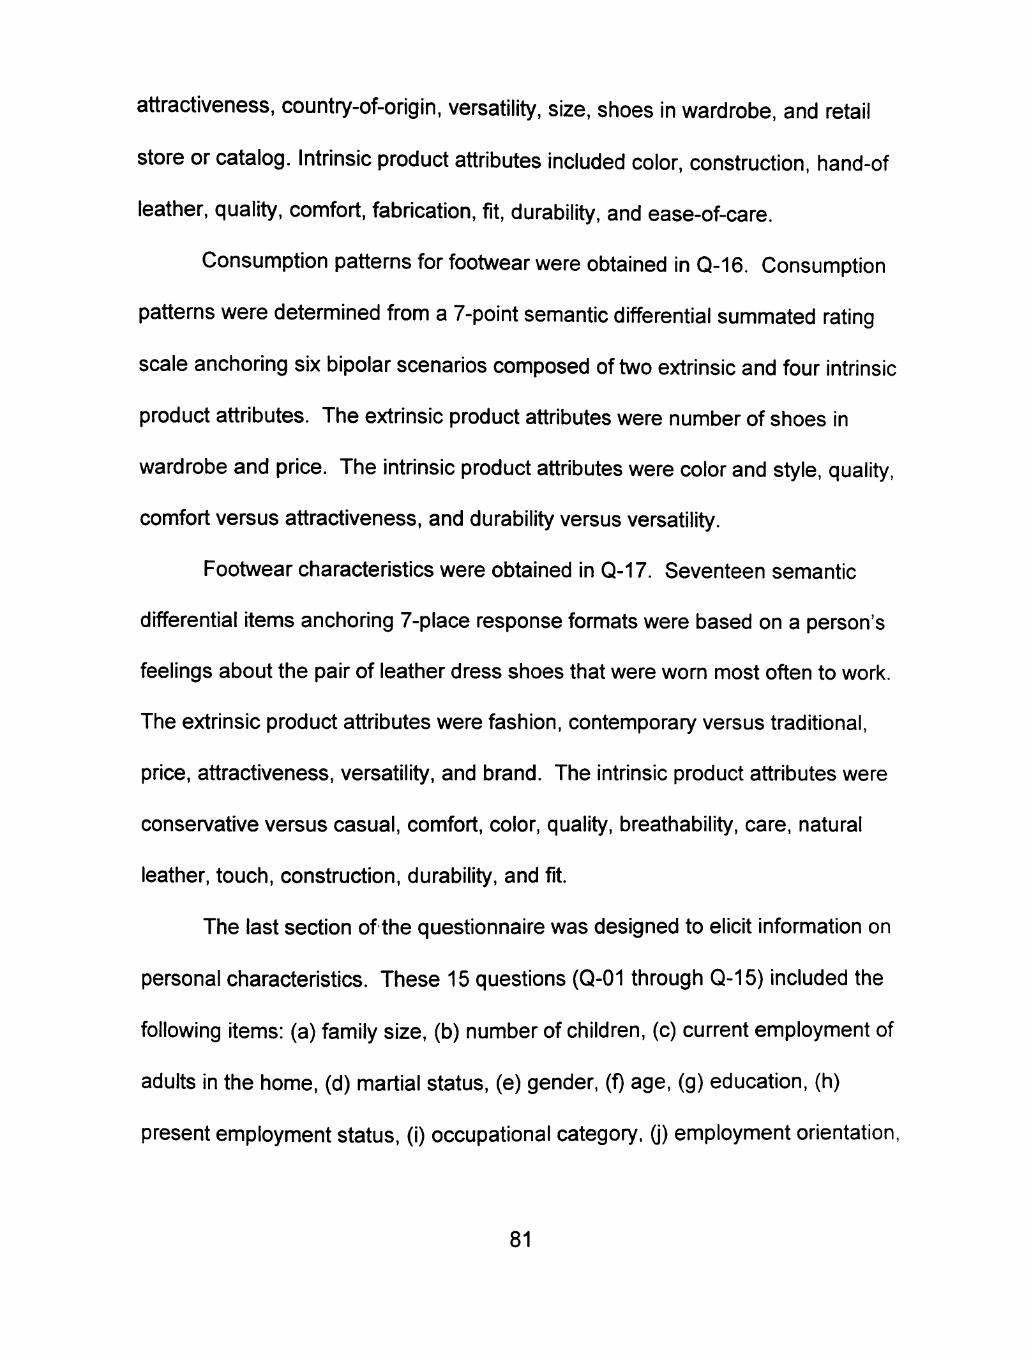
attractiveness, country-of-origin, versatility, size, shoes in wardrobe, and retail
store or catalog. Intrinsic product attributes Included color, construction, hand-of
leather, quality, comfort, fabrication, fit, durability, and ease-of-care.
Consumption patterns for footwear were obtained in Q-16. Consumption
patterns were determined from a 7-point semantic differential summated rating
scale anchoring six bipolar scenarios composed of two extrinsic and four intrinsic
product attributes. The extrinsic product attributes were number of shoes in
wardrobe and price. The intrinsic product attributes were color and style, quality,
comfort versus attractiveness, and durability versus versatility.
Footwear characteristics were obtained in Q-17. Seventeen semantic
differential items anchoring 7-place response formats were based on a person's
feelings about the pair of leather dress shoes that were worn most often to work.
The extrinsic product attributes were fashion, contemporary versus traditional,
price, attractiveness, versatility, and brand. The intrinsic product attributes were
conservative versus casual, comfort, color, quality, breathabllity, care, natural
leather, touch, construction, durability, and fit.
The last section of the questionnaire was designed to elicit information on
personal characteristics. These 15 questions (Q-01 through Q-15) included the
following items: (a) family size, (b) number of children, (c) current employment of
adults in the home, (d) martial status, (e) gender, (f) age, (g) education, (h)
present employment status, (1) occupational category, (j) employment orientation,
81
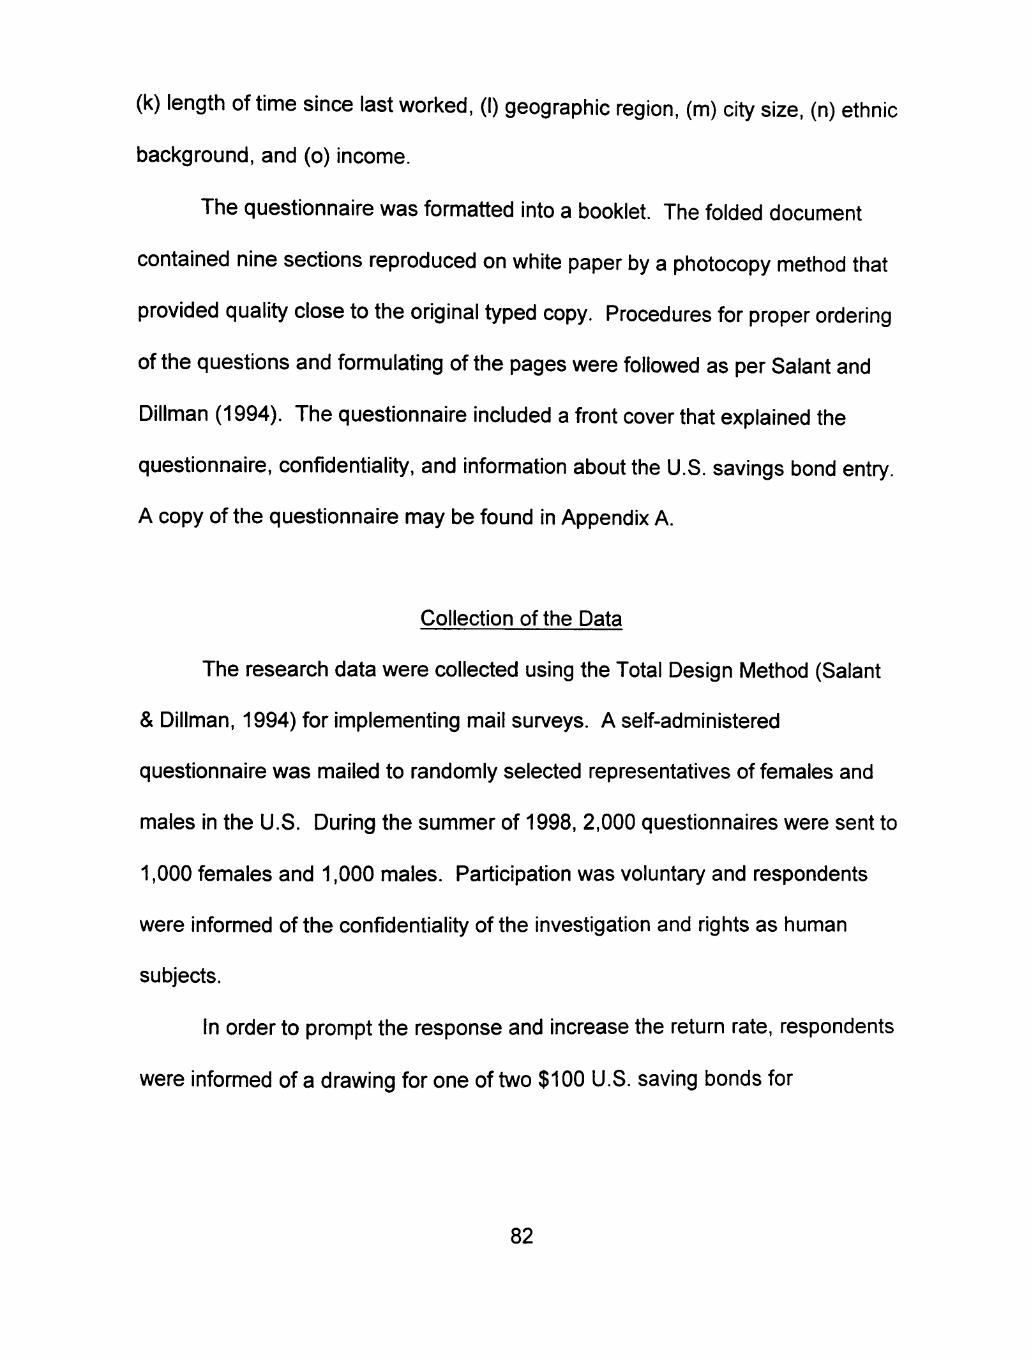
(k) length of time since last worked, (I) geographic region, (m) city size, (n) ethnic
background, and (o) income.
The questionnaire was formatted Into a booklet. The folded document
contained nine sections reproduced on white paper by a photocopy method that
provided quality close to the original typed copy. Procedures for proper ordering
of the questions and formulating of the pages were followed as per Salant and
Dillman (1994). The questionnaire included a front cover that explained the
questionnaire, confidentiality, and information about the U.S. savings bond entry.
A copy of the questionnaire may be found in Appendix A.
Collection of the Data
The research data were collected using the Total Design Method (Salant
& Dillman, 1994) for implementing mail surveys. A self-administered
questionnaire was mailed to randomly selected representatives of females and
males In the U.S. During the summer of 1998, 2,000 questionnaires were sent to
1,000 females and 1,000 males. Participation was voluntary and respondents
were Informed of the confidentiality of the investigation and rights as human
subjects.
In order to prompt the response and Increase the return rate, respondents
were informed of a drawing for one of two $100 U.S. saving bonds for
82
participants who returned a completed questionnaire. See Appendix B for a
copy of the entry form.
A complete Implementation theme was followed for collection of the
research data. Correspondence was personalized, and all questionnaires were
numbered so that non-respondent, follow-up procedures could be efficienfly and
economically implemented. A preliminary postcard was mailed to Inform
subjects of the forthcoming questionnaire, research purpose, and to request
participation. See Appendix C for the preliminary postcard. The initial mailing;
including the questionnaire with a front cover Introducing the project and
instructions, savings bond entry form, and business reply envelope, was
executed one week after the preliminary postcard was sent. Twelve days after
the initial mailing, a follow-up postcard was sent to all non-respondents from the
first mailing. See Appendix D for the follow-up postcard. A second mailing
consisting of a front cover, questionnaire, and return envelope was mailed to ail
non-respondents three weeks after the initial mailing. Eight weeks after initiating
data collection, 245 questionnaires, 139 female and 116 male, were processed,
data tabulated, and subjected to statistical analysis.
Variables of the Study
The variables of the study were as follows:
1. Footwear opinion leadership data were summated by a
83
response to Q-01 of the questionnaire. Footwear opinion leadership was
analyzed to determine the level of leadership. Subjects responded to a 5-
point Likert scale ranging from strongly agree (5) to strongly disagree (1),
with a mid-point of Indifferent (3). Opinion leadership was treated as a
continuous variable.
2. Footwear preferences were measured by responses to Q-02 through
Q -13 in Section 2 of the questionnaire. Shopping preference data of the
respondents were analyzed to determine shopping preferences toward leather
dress shoes for business wear.
3. Footwear Involvement was measured by response to Q-14 in Section
3 using a Likert-like scale. Involvement data were analyzed to determine beliefs
and attitudes of participants regarding shoes for business wear. Subjects
responded to a 7-point Likert-type scale ranging from strongly agree (7) to
strongly disagree (1), with a mid-point of indifferent (4). Footwear Involvement
was treated as a continuous variable.
4. Purchase criteria were measured by responses to Q-15 in Section 4 of
the questionnaire. Purchase criteria were product specific: leather dress shoes
for business wear. Data were analyzed to determine the importance of product
attributes in the purchase evaluation. The 19-product cues included
attributes of product image in two categories: extrinsic and intrinsic. Extrinsic
attributes were defined as Indicators of quality originating from outside the
84
product, not inherent parts of the product. Intrinsic attributes were defined as
product characteristics created during product manufacturing. Extrinsic product
attributes included brand, latest fashion, style, price, attractiveness, country-of-
origln, versatility, shoes in wardrobe, size, and retail store or catalog. Intrinsic
attributes Included color, durability, construction, hand-of-leather, quality,
comfort, fabrication, ease-of-care, and fit. Subjects responded to a 7-point
Likert-type scale ranging from very important (7) to not important (1), with a mid
point of Important (4). Purchase criteria were treated as
a continuous variable.
5. Footwear consumption patterns were measured by responses to Q-16
in Section 5 of the questionnaire. Consumption patterns were product specific:
preferences with regard to leather dress shoe wardrobe. Consumption pattern
data of the respondents were analyzed to determine consumption motivation as
an act toward extrinsic and intrinsic product attributes (Kim, Laroche, & Joy,
1990). Consumption patterns were obtained from a 7-point semantic differential
summated rating scale anchoring six bipolar scenarios composed of two extrinsic
and four intrinsic product attributes. The extrinsic product attributes were
number of shoes in wardrobe and price. The intrinsic product attributes were
color and style, quality, comfort versus attractiveness, and durability versus
versatility. Each respondent rated the extent to which each of the scenarios
85
described their consumption of footwear used for business wear. Consumption
pattern was treated as a continuous variable.
6. Footwear characteristics were measured by response to Q-17 in
Section 6 of the questionnaire. Footwear characteristics were product specific:
feelings about the pair of leather dress shoes most often worn to work. Footwear
characteristic data of the respondents were analyzed to determine feelings as a
motivation toward extrinsic and intrinsic product attributes (Kim, Laroche, & Joy,
1990). Subjects used a semantic differential scale anchoring 7-place response
fomnats. The feeling measure was composed of 6 extrinsic and 11 intrinsic
product attributes used in the purchase criteria measure. The extrinsic product
attributes were fashion, contemporary versus traditional, price, attractiveness,
versatility, and brand. The intrinsic product attributes were conservative versus
casual, comfort, color, quality, breathabllity, care, natural leather, touch,
construction, durability, and fit. Q-17 was treated as a continuous variable.
7. Personal characteristics were measured by responses to Q-01 through
Q-15 in the last section of the questionnaire. Personal characteristics were
defined as family size, number of children, current employment of adults in the
home, martial status, sex, age, education, present employment status,
occupational category, employment orientation, length of time not employed,
geographic region, city size, ethnic background, and income.
86
Family size-The household size was measured by the response to Q-01
in section 9 (Ownbey & Horridge, 1997). This variable was treated as a
continuous variable.
Family life cycle-Family life cycle was measured by responses to Q-02,
Q-03, and Q-04 In section 9. Marital status and children related data of
the respondents were analyzed to determine life cycle categories. The life
cycle variable was composed of three components: marital status, number
of children, and presence of children in the household (Schiffman &
Kanuk, 1991, p. 39). Marital status was established on single, married or
cohabiting, and separated or divorced or widowed. This variable was
treated as a nominal variable.
Sex-The sex variable was measured by the response to Q-05 in section
9. This variable was treated as a nominal variable.
Age-The age variable was measured by the response to Q-06 in section
7 (Ownbey & Horridge, 1997). This variable was treated as a continuous
variable.
Educational attainment-The educational attainment variable was
measured by the response to Q-07 In section 9. The educational variable
consisted of (a) some high school, (b) high school graduate, (c) vocational
or technical school, (d) some college, (e) college graduate, (f) some
87
graduate work, (g) graduate degree, (h) other. This variable was treated
as a continuous variable.
Employment profile-Employment profile was measured by responses to
Q-08, Q-09, and Q-10 in section 9. Employment data of the respondents
were analyzed to determine employment categories. The employment
profile variable was composed of three components: employment status,
occupation, and career anchorage (Bartos, 1982; Cassill, 1990; Ericksen
& Sirgy, 1985). Employment status was established on full-time
employee, part-time employee, and full-time homemaker. Full-time
students, retired Individuals, and unemployed respondents were dropped.
Occupation was classified Into four categories; professionals, non
professionals, homemakers, and students, according to the occupation
designated by the respondents (Mitchell, 1983). Professionals were
classified as professional or technical, manager or administrator, and
sales worker. Non-professionals were classified as clerical worker, craft
worker or machine operator, service worker, and government or military
worker. Homemakers were classified as full-time homemaker. The other
category was assessed by the researcher and assigned to one of the four
employment status classifications. Students were classified as part-time
student or part-time employee. Career anchorage was defined as stay-at-
88
home, plan-to-work, just a job, and career oriented. This variable was
treated as a nominal variable.
Non-working status-The non-working status variable was measured by
the response to Q-11 In section 9. The non-working variable consisted of
(a) 1-6 months, (b) 7-12 months, (c) 1-2 years, (d) 3-5 years, and (e) Over
5 years. This variable was treated as a nominal variable.
Geographic region-The geographic location variable was measured by
the response to Q-12 In section 9. States were assigned to one of six
regions: (a) Northeast (ME, VT, NH, CT, PA, MA, NJ, NY, DE, Rl, MD.
OH, WV, IN, Ml, IL, and Wl), (b) Southeast (VA, KY, NO. SO. TN, GA, FL,
AL, and MS), (c) Midwest (MN, ND, SD, lA, NE, KS, and MO), (d) South
(AR, LA, OK, TX, NM, and AZ), (e) Rocky (WY, CO, MT, ID. UT, and NV),
and (f) Pacific (WA, OR, CA, AK, and HI). This variable was treated as a
nominal variable.
City size-The city population variable was measured by the response to
item 13 in section 9. The city population variable was consisted of less
than 2,500, 2,500 to 9,999, and 10,000 to 49,999, 50,000 to 74,999,
75,000 to 99,999. 100,000 to 199,999, 200,000 to 499,999. 500,000 or
more. The population figures were collapsed into three categories: (a)
rural with less than 2,500, 2,500 to 9, 999, 10,000 to 49,999; (b) urban
50,000 to 74,999; and (d) metropolitan 75,000 to 99,999, 100,000 to
89
199,999, 200,000 to 499,999, and 500,000 or more (Bureau of the
Census, 1993; Lavin, 1996). This variable was treated as a continuous
variable.
Ethnic background—The race or ethnic background variable was
measured by a response to Q-14 in section 9. The categories consisted
of (a) American Indian or Native American, (b) Asian or Pacific Islander,
(c) African American or Non Hispanic, (d) Hispanic, (e) Caucasian or Non
Hispanic, (f) Other. This variable was treated as a nominal variable.
Income-The annual household income variable was measured by the
response to Q-15 in section 9. The annual household income variable
consisted of (a) under $15,000, (b) $15,000 to $19,999, (c) $20,000 to
$24,999, (d) $25,000 to $29,999, (e) $30,000 to $34,999, (f) $35,000 to
$49,999, (g) $50,000 to $74,999, (h) $75,000 to $100,000, (1) Over
$100,000 (Ownbey & Horridge, 1997). This variable was treated as a
continuous variable.
Statistical Analysis of Data
Before respondents from two mailings were combined for statistical
analysis, demographics for females and males were compared between
mailings, respectively. Females and males were compared on age, marital
status, family income, education completed, region currently resided in, and size
90
of city or town. No differences were found between the two mailings for females
and for males.
As a preliminary assessment, frequency and percentage distributions of
footwear opinion leadership, footwear preferences, footwear involvement,
footwear purchase criteria, footwear consumption patterns, footwear
characteristics, and personal characteristics, were determined. Cronbach's
alpha coefficient was calculated to measure internal consistency for the footwear
opinion leadership, footwear Involvement, footwear purchase criteria, footwear
consumption patterns, and footwear characterisfics. Cronbach's alpha levels
were deemed acceptable at 0.60.
Research Questions
To answer the research questions, respondents were classified as High
Involvement (HI) or Low Involvement (LI) using the footwear involvement scale,
Q-14. Subsequent to analysis, five questions (2, 8, 10, 12, and 16) were reverse
coded. The procedure included (a) calculating each participants mean score for
Q-14 and listing the means from low to high, (b) selection of the first 40% (n =
100) of the total sample as low involvement participants (M = 3.19 to M = 4.69.
(c) selecting the next 20% (n = 54) of the total sample as medium involvement
(M = 4.70 to M = 5.13), and (d) selecting the remaining 40% (n = 101) of the total
sample as high involvement (M = 5.14 to M = 6.63). To ensure that there were
91
distinct groupings of HI and LI participants, the middle 20% was eliminated from
further testing. Following the groupings by footwear Involvement, AnswerTree®
analysis was used on footwear purchase criteria (Q-15) and footwear
characteristics (Q-17). For the footwear characteristics scale, 10 Items (3, 6, 7,
9, 11, 12, 13, 14, 16, and 17) were reverse coded.
Data obtained from the footwear purchase criteria and characteristics
scales were analyzed statistically using AnswerTree® algorithm software to build
decision trees for each scale (Statistical Package for the Social Sciences
(SPSS), 1998). Decision trees were constructed using the likelihood ratio chi-
square statistic method. This was done by the CHAID (Chi-square Automatic
Interaction Detection) method. The analysis begins with a root node containing
all the cases in the sample data. In the current study, the root node was
composed of data from 100 High Involvement respondents and 101 Low
Involvement respondents. As the tree Is generated, the data branch into
mutually exclusive subsets based on some pattern of predictor variables.
Classification of the data was stopped when the number of cases in a subset
dropped below 20. The predicative value of each decision tree was verified by
cross-validation. In addition, gain scores as probability of response were
computed for the HI and LI samples for both decision trees. See Appendix E for
a description of the AnswerTree® 2.0, including definition of terms and
procedure. The level of significance was set at 0.05.
92
CHAPTER IV
RESULTS
The overall purpose of this study was to determine If HI consumers and LI
consumers differed in their purchase of leather dress shoes for business wear.
Information regarding respondents' selected footwear opinion leadership,
footwear preferences, footwear involvement, footwear purchase criteria, footwear
consumption patterns, footwear characteristics, and personal characteristics was
obtained through responses to a self-administered questionnaire. The
questionnaire for the study can be found in Appendix A.
Data were examined using descriptive statistics (i.e., frequency
distributions and means) and AnswerTree® algorithm software. The results of
the study are reported in four sections: (a) description of the sample, (b)
reliability of the scales, (c) analysis of research questions, and (d) summary of
findings of research questions.
Description of the Sample
Working Females
The population for this study was females in the U.S age 25 to 65 years.
The sample (N = 752,357) for the females consisted of a subsample (n = 1,000)
randomly drawn from a subject list obtained from National Demographics &
93
Lifestyles Inc. (NDL). Questionnaires were distributed to the sample group in
summer of 1998. A total of 1,000 questionnaires were sent to the sample in the
first mailing, of which 87 were returned undeliverable, a total of 179
questionnaires were returned by respondents, of which 114 were usable. Of the
65 questionnaires that were deemed unusable, 21 were not employed, 39 did
not wear leather dress shoes to work, and 5 were incomplete. Following the
second mailing 17 were returned undeliverable, a total of 87 questionnaires were
returned by respondents, of which 25 were usable. Of the 62 questionnaires that
were deemed unusable, 9 were not employed, 46 did not wear leather dress
shoes to work, and 7 were incomplete. Eight weeks after the Initial mailing, 266
questionnaires were returned of which 139 questionnaires were deemed usable,
yielding a 18% response rate.
The working female participants were compared to U.S. females (U.S.
Department of Commerce, 1997) on four demographics: age, education,
household income, and marital status. Differences were noted between female
groups on 3 of the 4 demographics. The exception was marital status. The
largest percentage of females, participants and U.S., were married. As to mean
age, participants were older (43.9 years) than U.S. females (37.8 years).
However, no difference was found between participants and U.S. females in the
distribution by age categories. The highest percentage of female (40.0%)
participants were college graduates and had household incomes of $50,000 to
94
$74,999 (31.2%), while the highest percentage of U.S. females (40.8%) were
high school graduates and had incomes of $35,000 to $49,999 (31.4%).
Working Males
The population for this study was males in the U.S. age 25 to 65 years.
The sample (N = 3,327,143) for the males consisted of a subsample (n = 1,000)
randomly drawn from a subject list obtained from National Demographics &
Lifestyles Inc. (NDL). Questionnaires were distributed to the sample group in
summer of 1998. Participation was voluntary and the male subjects were
informed of rights as human subjects. A total of 1,000 questionnaires were sent
to the sample In the first mailing, of which 107 were returned undeliverable, a
total of 177 questionnaires were returned by respondents, of which 91 were
usable. Of the 86 questionnaires that were deemed unusable, 17 were not
employed, 56 did not wear leather dress shoes to work, and 13 were incomplete.
Following the second mailing 42 were returned undeliverable, a total of 121
questionnaires were returned by respondents, of which 25 were usable. Of the
96 questionnaires that were deemed unusable, 9 were not employed, 64 did not
wear leather dress shoes to work, and 23 were Incomplete. Eight weeks after
the initial mailing, 298 questionnaires were returned of which 116 questionnaires
were deemed usable, yielding a 17.3% response rate.
95
The working male participants were compared to U.S. males (U.S.
Department of Commerce, 1997) on four demographics: age, education,
household income, and marital status. Differences were noted between male
groups on 3 of the 4 demographics. The exception was marital status. The
largest percentage of males, participants and U.S., were married. As to mean
age, participants were older (43.3 years) than U.S. males (35.3 years).
However, no difference was found between participants and U.S. males in the
distribution by age categories. The highest percentage of male (36.2%)
participants were college graduates and had household incomes of $50,000 to
$74,999 (32.1%), while the highest percentage of U.S. males (37.9%) were high
school graduates and had Incomes of $35,000 to $49,999 (29.2%).
Footwear Opinion Leadership
Footwear opinion leadership data were collected using the footwear
opinion leadership section of the research questionnaire. Seven statements
were used for the purpose of describing the footwear opinion leadership of
working females and males in regard to their clothing and shoe purchasing
practices for business wear.
96
Working Females
Table 4.1 summarizes the working females' response to footwear opinion
leadership. The largest percentage of females, regarding two statements
referring to the workplace, was Indifferent to trying new fashion ideas before co
workers (35.3%) and wearing clothes to work that were of the latest styles
(41.7%). When considering stores, the females agreed (33.1 %) that they liked to
try new and different places to shop for clothing but were indifferent (31.7%) to
visiting a new clothing store first. The remaining three statements referred to the
purchase of leather dress shoes using intrinsic criteria (I.e., quality, styling, and
comfort). The females strongly agreed that quality (53.2%) and comfort (77.7%)
were highly Important to the purchase of shoes, and agreed (44.6%) that styling
was highly important.
Working Males
Table 4.2 summarizes the working males' response to footwear opinion
leadership. Males, regarding their workplace, were either indifferent (36.2%) or
strongly disagreed (27.6%) to trying new fashion ideas before co-workers. As to
wearing clothes to work that were of the latest styles, 41.4% were indifferent and
19.8% agreed. When considering stores, males were indifferent (35.3%) or
agreed (28.4%) to trying new and different places to shop for clothing but
97
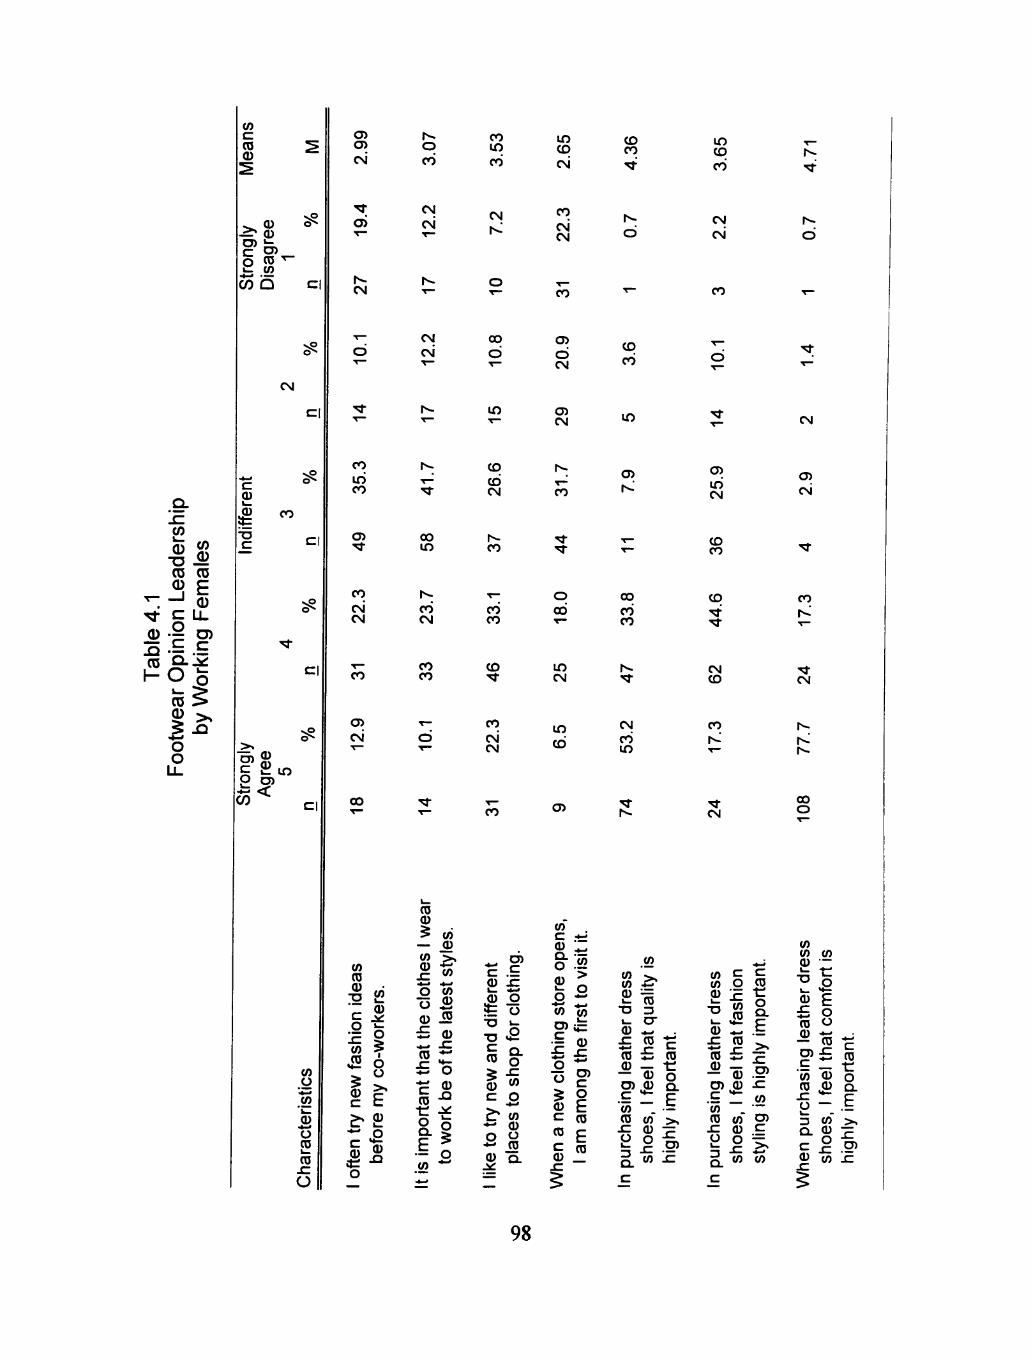
( 0
m ^ -D ^ (0 CD
'T —' CD 'SJ- C LL 0 •§ D)
H O S
o o
(0 0)
o ro
55 b
CM
c
(D
I CO
C I
r 0) -^ P O) i= < CO
o w 0 o CD
o
Gi
csi
CM
C O
iri C O
C35
C O
csi CM
CO
CM
00
(A CQ (U
:g 52
^ 6
c fc
c 'S
o CO
CM
CM
CM
CM
00
C O CM
C O C O
(0
(D
(0 0)
(/) (D
JC
o
£ (D
B o
11
CO
CO
CNJ
h*:
CO
in
CO
CO CM
co
CO CO
CO
CO
CM CM
CO
<1) o
o (/) c 2
— a)
^ Q .
l O CD
CM
CO
CM CM
CO
C35
CD CM
C35 CM
co
o 00
IT) CM
l O
CO
<3J
c o E (0
E CD
O O
c (D c
SI
CO CO
o
CO CO
lO
C3)
00 CO CO
CM
CO ir>
{0
I - CT
<u *- . (D £ (D i? -S t^ — <D O 0 ) 0 ) Q.
• - £ to . — 2 w >,
. C 0) 7=
in CO CO
CM
CM
CO
C3)
iri CM
CO CO
CO
CM CO
CO
CM
<« ^ s (0 O CO
I - «ii: c
(D £ ^ •S^-O) o) O) m .c .E r w ( 0 . • "
(D (0 en
Q. W to
CM
C3) CM
CO
CM
t ^ r^
00
o
to to (U
T3 i _
(D '4.^
ra 0
C3)
c to
o ^ 3 CL
c (U .c
to *—"
ort
«»— £ o o ^ M *
the
_ tu il? ^^
— to
hoe
to
ant
t o E
_>» ^ O)
x:
98
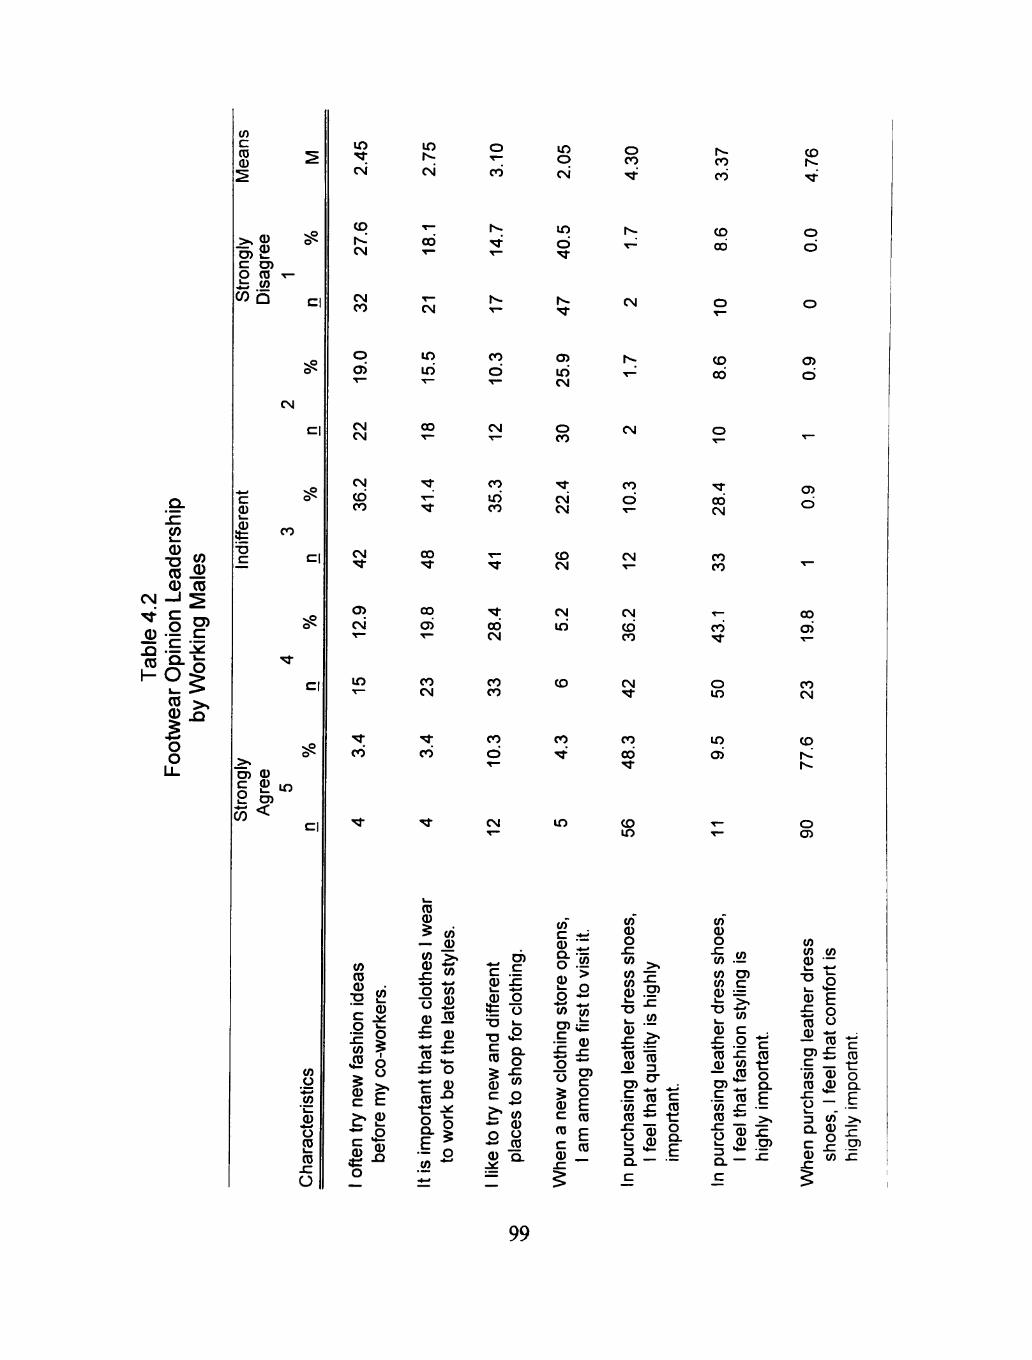
(0 (D
CD CO CM - J ^
^ O ^
CD Q ->^
g .£5
o o
to c re 0
o ) 2 o re
CO i5
CM
Cl
c (U
I C
CO
C I
O) (D
to o to
.2 "o re k. re
sz O
in
CM
CD
CM
CM CO
O CJ>
CM CM
CM
CD CO
CM
<3>
CM
i n
CO
</> re <u
.•s ^
S -
to f ^ 6 (U E^ c c
c ^ cu it: o
in
CM
00
CM
in in
00
00
00 tJ>
CO CM
CO
re <u
to 0)
to _0 ^^ to
o tu
to 0 re
0
i= 0
£ o "c ^ re -o
11 to -^
o CO
CO CD
CM
CO in CO
00 CM
CO CO
CO CD
CM
c .E ^ 4 - 0 J=
0 o ! o •D £ S care o
c o ^ to *- 0 2 ^ —• _ro 0 Q.
in o csi
in c=>
C3)
iri CM
o CO
CM CM
CD CM
CM
iri
CO
CO
i n
o CO
CM
CM
CO
d
CM
CM
CO CO
CM
CO 00
CD in
CO CO
CD
OC)
00
00 CM
CO CO
CO
o in
i n ci>
open
s.
ig s
tore
^ ^. o o $ 0 c re c 0
.t-i
'to '> o
first
0 ^ 4 . ^
c OLU
re £ re
to 0 o .c to
ess
erdr
j r ^m*
re O) c to re
purc
h
>» x: O)
Ic to
^
re CT
re ^ • 4 - *
Ifee
l
c re tr
impo
to 0 o sz V)
ess
erdr
sz 4 . ^
re O) c: to re
purc
h
to
ling
n st
y
o to
^
re ^
Ifee
l
c
rta
o <->
E >*
high
l;
CO
o d
CJ> tD
CD
00 ci>
CO CM
CO
o c:
to to 0 k-
• D L_
0 ^ "re
igle
( "to re
^ o i -3 Q.
c 0
to *^ 4 . ^
o v»—
£ o o
that
^_ 0
^ *^ ^ • ~
— to
hoe
to
ant.
tr o Q. LU!
_>» .c CT i :
99
strongly disagreed (40.5%) or disagreed (25.9%) to visiting a new clothing store
first. The remaining three statements referred to the purchase of leather dress
shoes using intrinsic criteria (I.e., quality, styling, and comfort). A majority of
males (77.6%) considered comfort highly important when purchasing leather
dress shoes, while the highest percentage of males strongly agreed (48.3%) that
quality and agreed (43.1%) that styling were also highly important.
Footwear Preferences
Footwear preferences data were collected using the footwear preferences
section of the research questionnaire. Twelve quesfions were used for the
purpose of describing the preferences of working females and males in regard to
leather dress shoes for business.
Working Females
Table 4.3 provides a summary of the females' responses to footwear
preferences. Females paid from $10 and less to $299 at regular price, with the
majority (55.4%) paying between $50 and $99. As to sale price, the amount paid
was from $10 and less to $199, with the highest percentage paying $40 to $99.
Females (48.2%) had not purchased shoes from a catalog in the past two years
had purchased one pair (10.1%). As to satisfaction with catalog selections, the
largest percentage (12.2%) of the 51 who did purchase from catalogs were
100
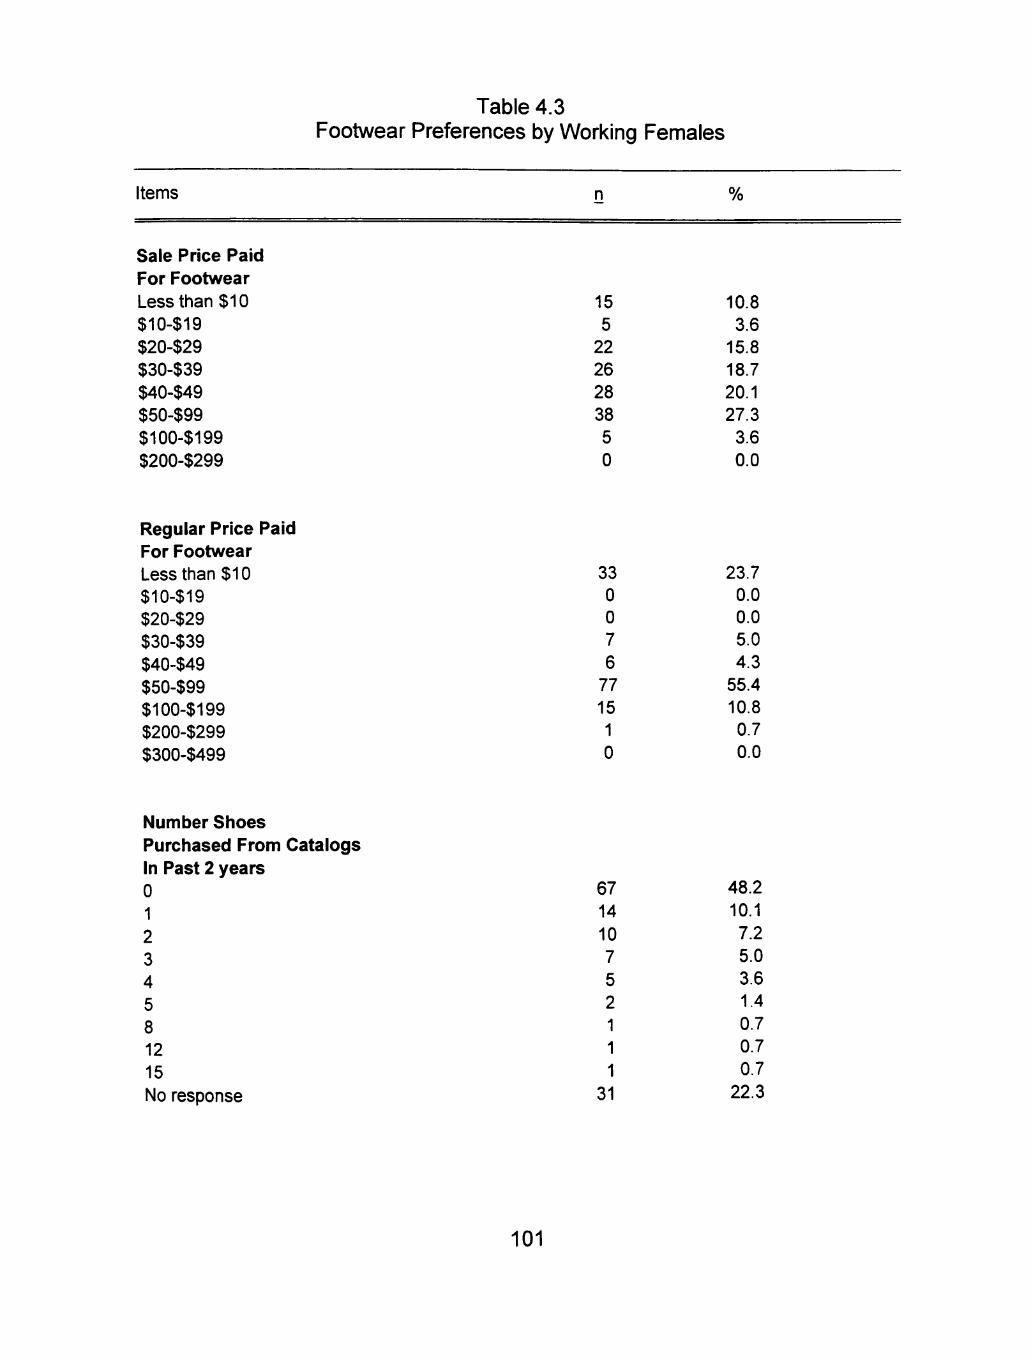
Table 4.3 Footwear Preferences by Working Females
Items n %
Sale Price Paid For Footwear Less than $10 $10-$19 $20-$29 $30-$39 $40-$49 $50-$99 $100-$199 $200-$299
Regular Price Paid For Footwear Less than $10 $10-$19 $20-$29 $30-$39 $40-$49 $50-$99 $100-$199 $200-$299 $300-$499
Number Shoes Purchased From Catalogs In Past 2 years 0 1 2 3 4 5 8 12 15 No response
15 5 22 26 28 38 5 0
10.8 3.6 15.8 18.7
20.1 27.3 3.6 0.0
33 0 0 7
6 77 15 1 0
23.7 0.0 0.0 5.0 4.3 55.4 10.8 0.7 0.0
67
14
10 7
5 2 1 1
1
31
48.2
10.1 7.2 5.0
3.6 1.4 0.7 0.7 0.7
22.3
101
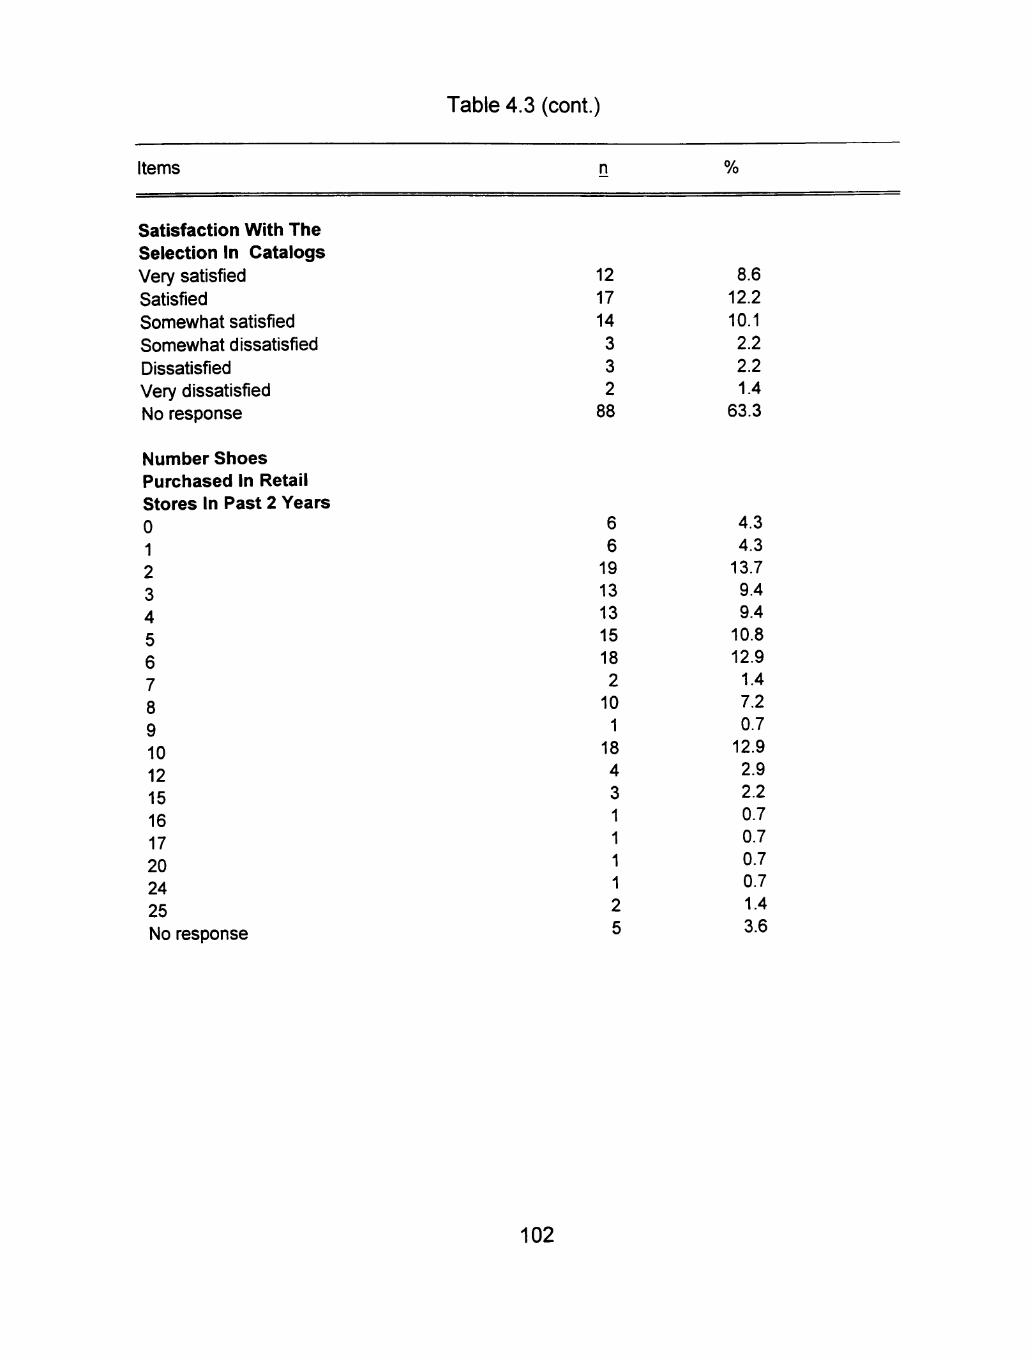
Table 4.3 (cont.)
Items n %
Satisfaction With The Selection In Catalogs Very satisfied Satisfied Somewhat satisfied Somewhat dissatisfied Dissatisfied Very dissatisfied No response
12
17 14
3
3 2 88
8.6
12.2
10.1 2.2 2.2 1.4
63.3
Number Shoes Purchased In Retail Stores In Past 2 Years 0 1 2 3 4 5 6 7 8 9 10 12 15 16 17 20 24 25 No response
6 6 19 13 13 15 18 2 10 1 18 4
3 1 1 1 1
2 5
4.3 4.3 13.7 9.4 9.4 10.8 12.9 1.4 7.2 0.7
12.9 2.9 2.2 0.7 0.7 0.7 0.7 1.4
3.6
102
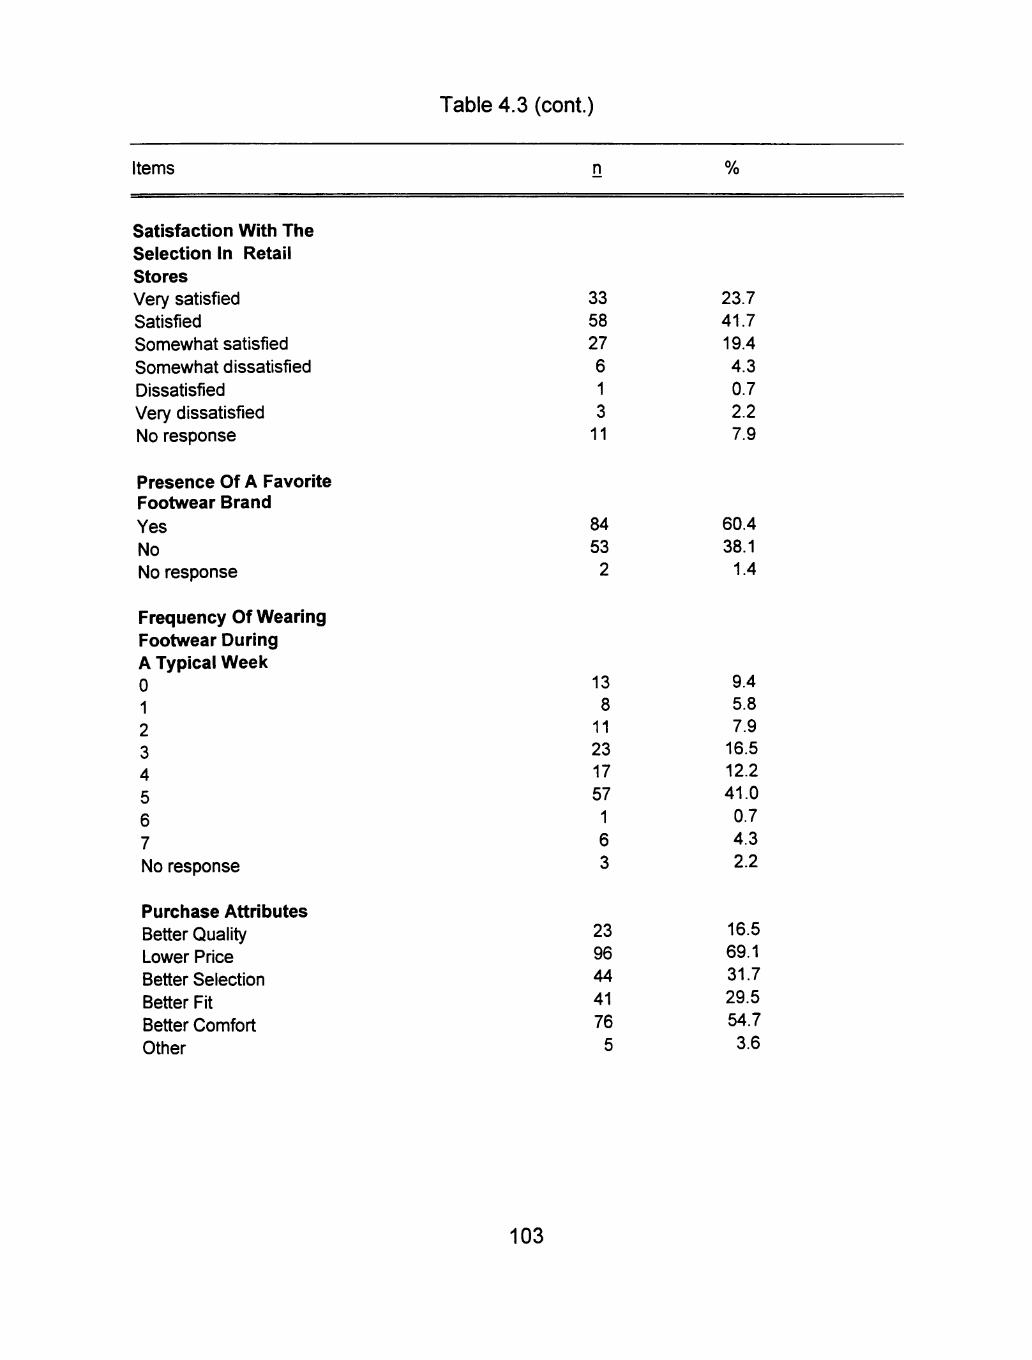
Table 4.3 (cont.)
Items n %
Satisfaction With The Selection In Retail Stores Very satisfied Satisfied Somewhat satisfied Somewhat dissatisfied Dissatisfied Very dissatisfied No response
Presence Of A Favorite Footwear Brand Yes No No response
Frequency Of Wearing Footwear During A Typical Week 0 1 2 3 4 5 6 7 No response
Purchase Attributes Better Quality Lower Price Better Selection Better Fit Better Comfort Other
33 58 27
6 1
3 11
23.7 41.7 19.4
4.3 0.7 2.2 7.9
84
53 2
60.4
38.1 1.4
13 8 11 23 17 57
1
6 3
23 96 44
41
76
5
9.4 5.8 7.9 16.5 12.2 41.0 0.7
4.3 2.2
16.5 69.1 31.7
29.5 54.7
3.6
103
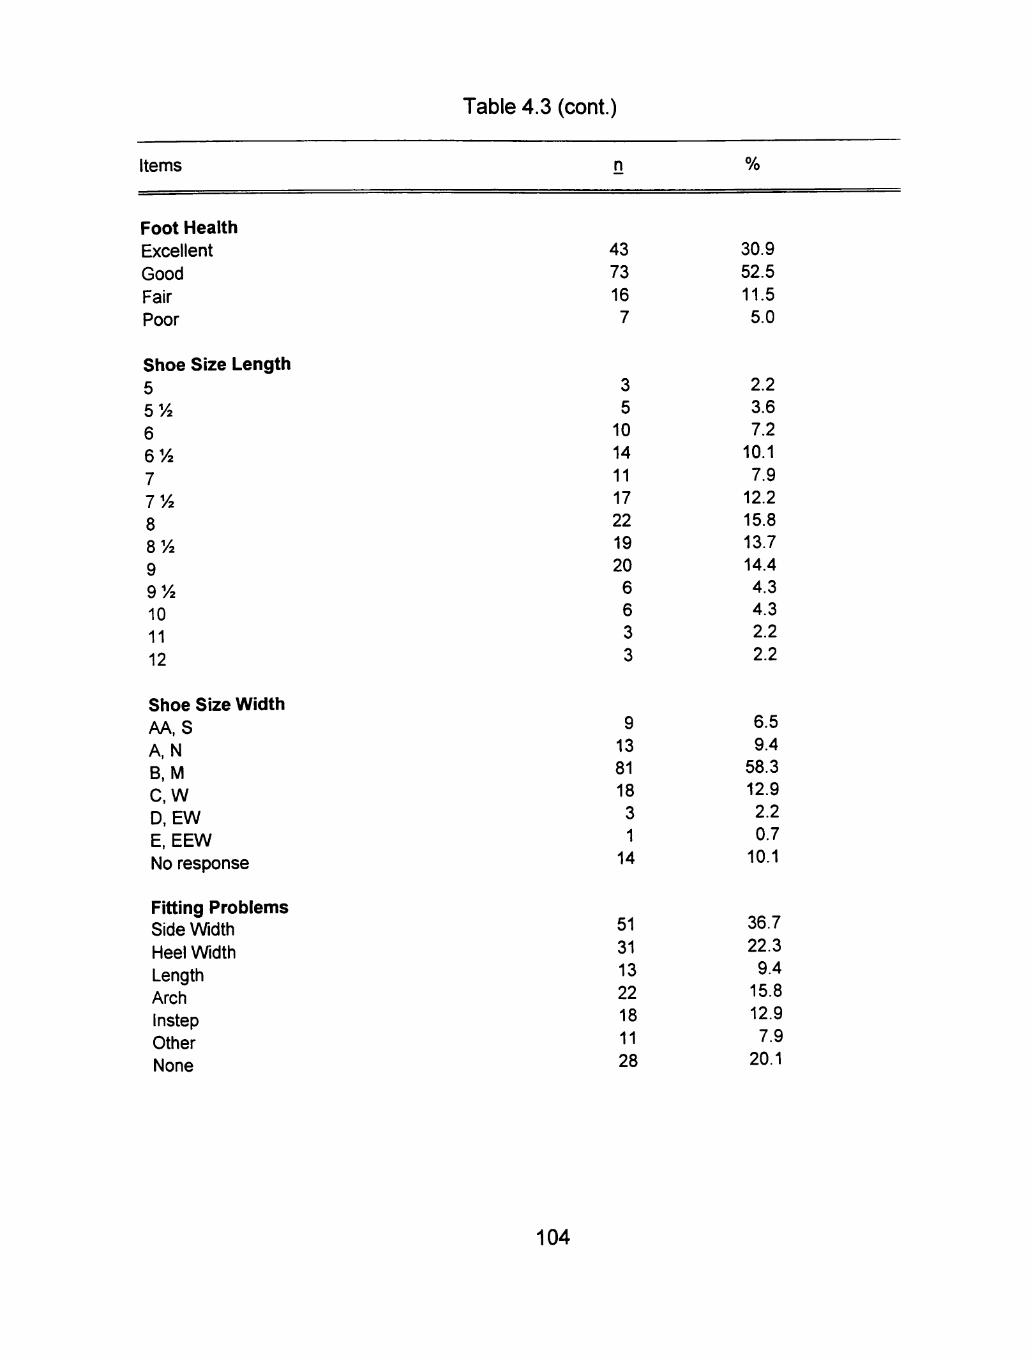
Table 4.3 (cont.)
Items n %
Foot Health Excellent Good Fair Poor
Shoe Size Length 5 5'A 6 6 72 7 IVz 8 8 72
9 9 72
10 11 12
Shoe Size Width AA, S A, N B, M C,W D, EW E, EEW No response
Fitting Problems Side Width Heel Width Length Arch Instep Other None
43
73 16 7
3 5 10 14
11 17 22 19 20 6 6 3
3
9
13 81 18 3 1 14
51
31 13 22 18
11 28
30.9
52.5
11.5 5.0
2.2 3.6 7.2 10.1
7.9 12.2 15.8 13.7 14.4 4.3 4.3 2.2
2.2
6.5 9.4 58.3 12.9 2.2 0.7
10.1
36.7
22.3 9.4
15.8 12.9 7.9
20.1
104
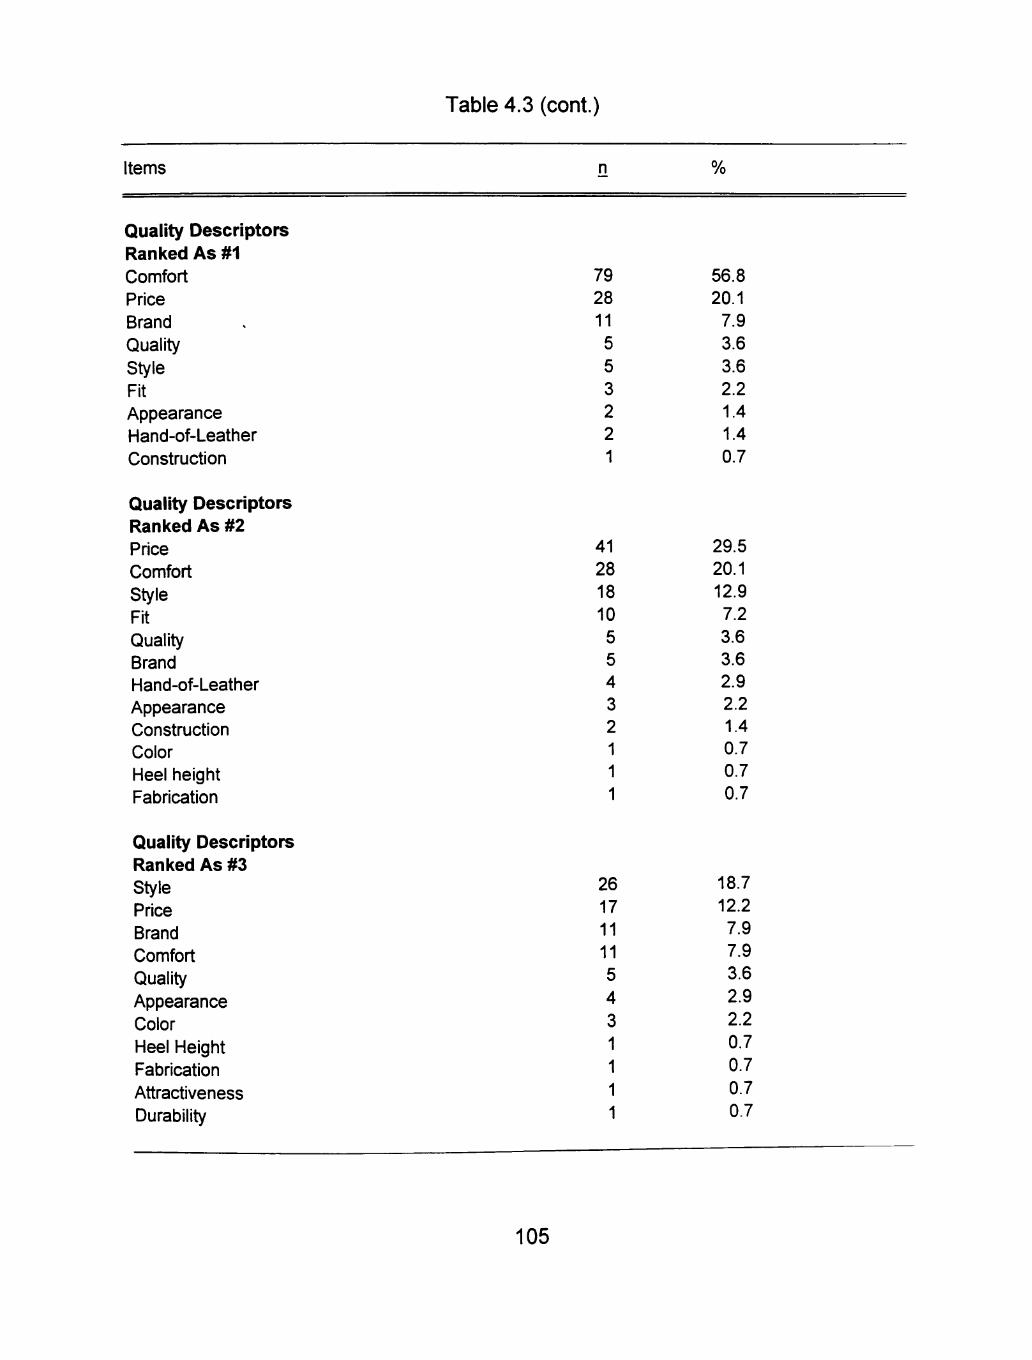
Table 4.3 (cont.)
Items n %
Quality Descriptors Ranked As #1 Comfort Price Brand Quality Style Fit Appearance Hand-of-Leather Construction
Quality Descriptors Ranked As #2 Price Comfort Style Fit Quality Brand Hand-of-Leather Appearance Construction Color Heel height Fabrication
Quality Descriptors Ranked As #3 Style Price Brand Comfort Quality Appearance Color Heel Height Fabrication Attractiveness Durability
79 28 11
5
5 3 2 2 1
56.8 20.1 7.9 3.6
3.6 2.2 1.4 1.4 0.7
41
28 18 10 5 5 4 3 2 1 1 1
29.5 20.1 12.9 7.2 3.6 3.6 2.9 2.2 1.4 0.7 0.7 0.7
26 17 11 11 5
4
3 1
1
1
1
18.7
12.2 7.9 7.9 3.6
2.9
2.2 0.7
0.7
0.7 0.7
105
satisfied. Referring to the number of shoes purchased in retail stores during the
past two years, 13.7% purchased two pairs, and 12.9% purchased six pairs and
ten pairs, respectively. Females were satisfied (41.7%) or very satisfied (23.7%)
with their retail shoe purchases.
Leather footwear was worn to work five times (41.0%) or three times
(16.5%) during a typical week. A majority of the working females stated that
lower price (69.1%) and better comfort (54.7%) were reasons to purchase more
leather dress shoes for business wear. Foot health was considered good by a
majority (52.5%) of the females. As to shoe size length, a majority (56.1%) of
the females ranged in length from IVk to 9, while a majority (58.3%) wore a shoe
size width of B and/or M. Fitting problems were side width (36.7%) and heel
width (22.3%). When females were asked what evaluative characterisfics were
used to determine quality, they ranked comfort (56.8%) first, price (29.5%),
comfort (20.1%), and style (12.9%) second, and style (18.7%) and price (12.2%)
third.
Sixty percent of the females indicated that they had a favorite footwear
brand. The favorite footwear brands among working females were Nine West,
Naturalizer, Liz Claiborne, and Cole Haan, while the most purchased footwear
brands were Nine West and Naturalizer. The largest percentage of females
shopped for footwear at department stores (42.0%) and shoe stores (25.9%).
106
Dillard's, Nine West, JC Penney, and Macy's were the stores most shopped by
females (see Table 4.4 and Table 4.5).
Working Males
Table 4.6 provides a summary of the males' responses to footwear
preferences. At regular price males paid between $10 and less to $499, with a
majority (72.5%) paying $50 to $199. At sale price, males paid between $10 and
less and $299, with 59.4% paying $50 to $199 for leather dress shoes. A
majority of the male respondents (51.7%) had not purchased shoes from a
catalog in the past two years. As to the 26 males who had purchased from
catalogs, they (8.6%) were somewhat satisfied. Referring to the number of shoes
purchased In retail stores during the past two years, males (65.5%) had
purchased 1 to 4 pairs. Males were satisfied (43.1%) or very satisfied (25.0%)
with their retail shoe purchases.
Leather footwear was worn to work by a majority of males (54.3%) five
times during a typical week. A majority of the working males stated that lower
price (63.8%) was the reason to purchase more leather dress shoes for business
wears. Foot health was considered good by a majority (50.9%) of the males. As
to shoe size length, a majority (62.1%) of the males ranged from 8/2 to 11, while
the largest percentage (41.4%) wore a shoe size width of D and/or EW. Fitting
107

Table 4.4 Favorite and Purchased Footwear Brands
by Working Females
Favorite Footwear Brands Footwear Brands Purchased
Nine West (45) Naturalizer (36) Liz Claiborne (19) Cole Haan (17) Kenneth Cole (11) Anne Klein (9) Enzo Anglolini (7) Coach (6) Stuart Weitzman (8) Bandolino (4) Easy Sprit (4) Amalfi (3) Birkenstock (2) Eitenne Alginer (2) Worthington (2) Bass (2) Cobbles (2) Mason (2) Selby (2) Doc Martins (2) Nickels (2) Varieo (2) TImberiand (2) Hush Puppy (1) J. Crew (1) SestoMeucci (1) Candles (1) Bally (1) Joan & David (1) Evan Picone (1) Arche(l) Aerosoles (1) Old Main Trotters (1) Kittens (1) Rockport(1)
Nine West (28) Naturalizer (24) Liz Claiborne (9) Enzo Anglolini (6) Easy Sprit (5) Cole Haan (4) Worthington (4) Selby (4) Anne Klein (3) Nickels (3) SAS (3) Amalfi (2) Bass (2) Doc Martins (2) East Land (2) Hush Puppy (2) Kenneth Cole (2) Soft Spots (2) Stuart Weitzman (2) Aerosoles (1) Ann Taylor (1) Arche(1) Bally (1) Bandolino (1) Bare Traps (1) Buno Sport (1) Dr. Scholl's (1) Eitenne Alginer (1) Enrico Gori (1) Footiary Spekelen (1) Gucci (1) J. Crew (1) Jennifer Moore (1) Johansen (1)
108
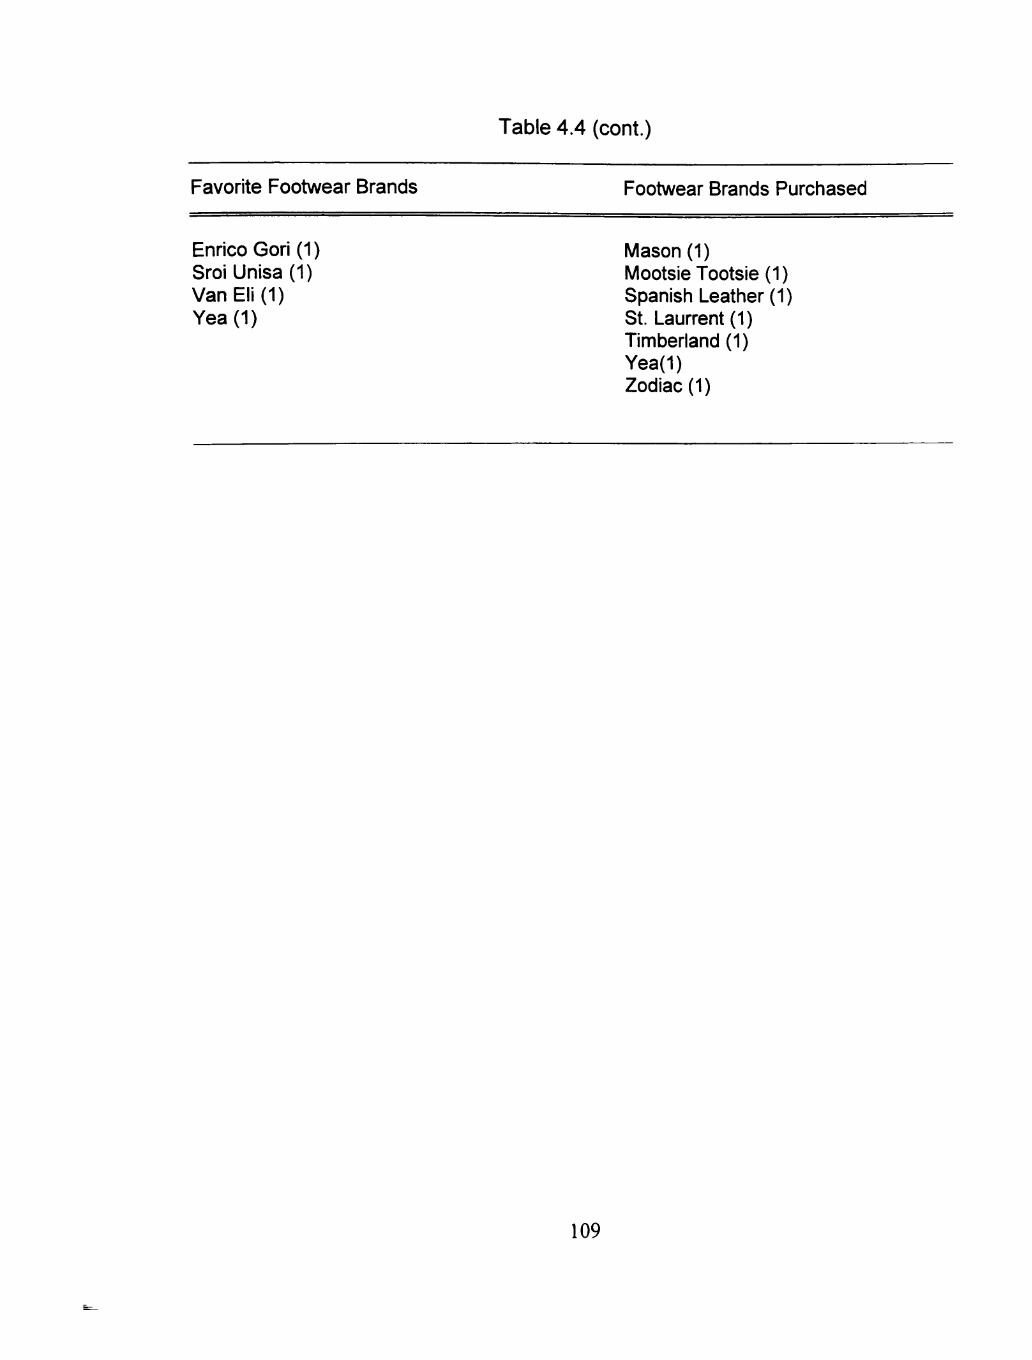
Table 4.4 (cont.)
Favorite Footwear Brands Footwear Brands Purchased
Enrico Gori (1) Mason (1) Sroi Unlsa (1) Mootsie Tootsie (1) Van Eli (1) Spanish Leather (1) Yea(1) St. Laurrent(l)
TImberiand (1) Yea(1) Zodiac (1)
109
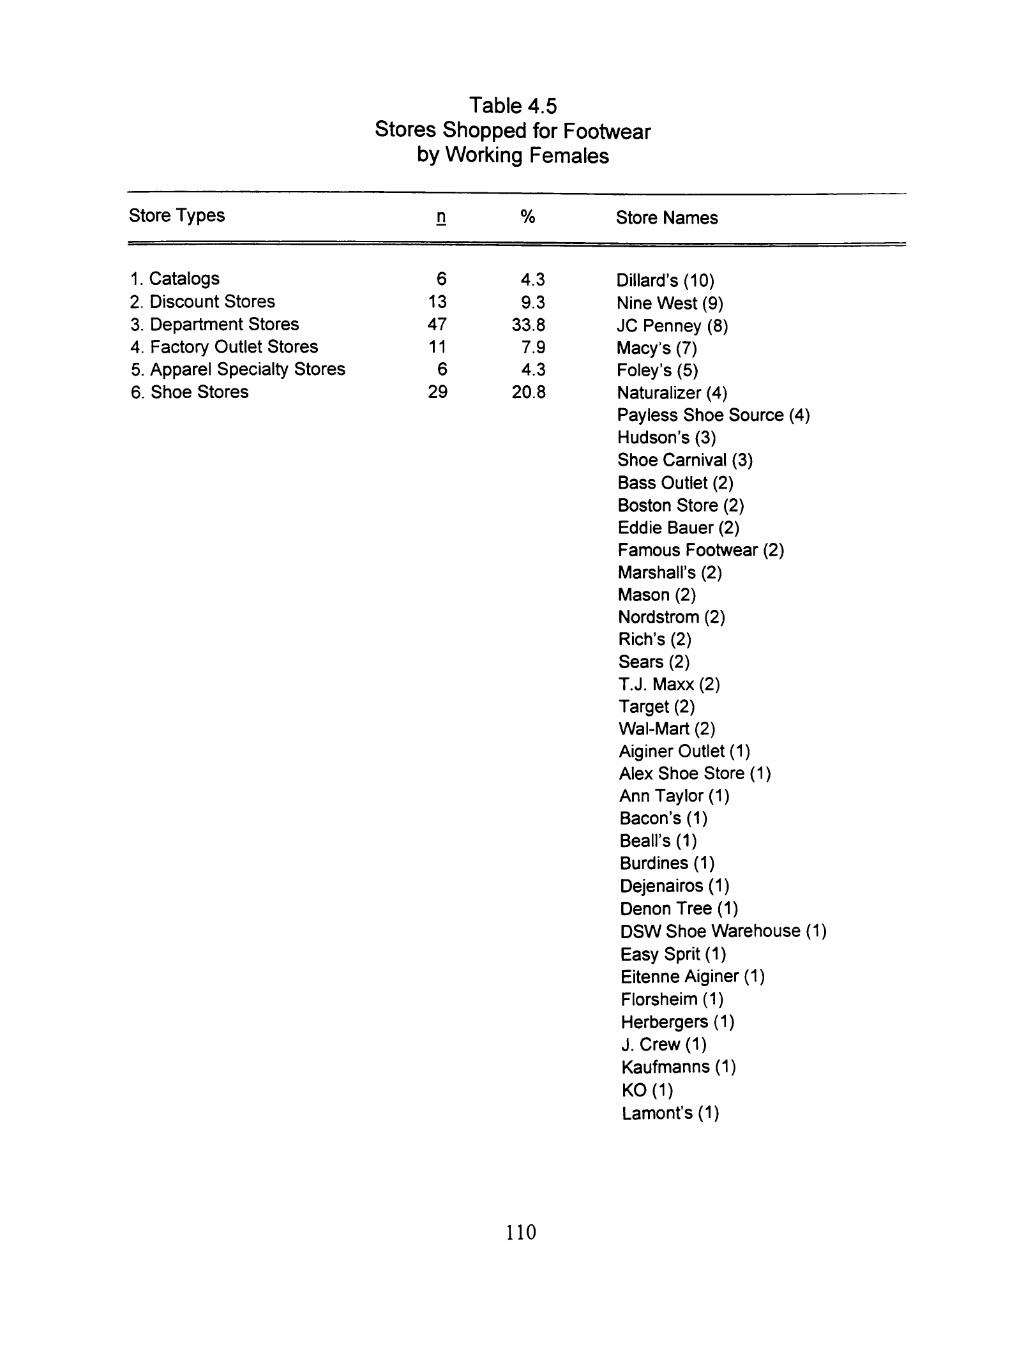
store Types
Table 4.5 Stores Shopped for Footwear
by Working Females
n % Store Names
1. Catalogs 2. Discount Stores 3. Department Stores 4. Factory Outlet Stores 5. Apparel Specialty Stores 6. Shoe Stores
6 13 47 11 6
29
4.3 9.3
33.8 7.9 4.3
20.8
Dillard's (10) Nine West (9) JC Penney (8) Macy's (7) Foley's (5) Naturalizer (4) Payless Shoe Source (4) Hudson's (3) Shoe Carnival (3) Bass Outlet (2) Boston Store (2) Eddie Bauer (2) Famous Footwear (2) Marshall's (2) Mason (2) Nordstrom (2) Rich's (2) Sears (2) T.J. Maxx (2) Target (2) Wal-Mart (2) Alginer Outlet (1) Alex Shoe Store (1) Ann Taylor (1) Bacon's (1) Beall's(l) Burdines(l) Dejenairos (1) DenonTree (1) DSW Shoe Warehouse (1) Easy Sprit (1) Eitenne Alginer (1) Florsheim (1) Herbergers (1) J. Crew (1) Kaufmanns (1) K0(1) Lament's (1)
110
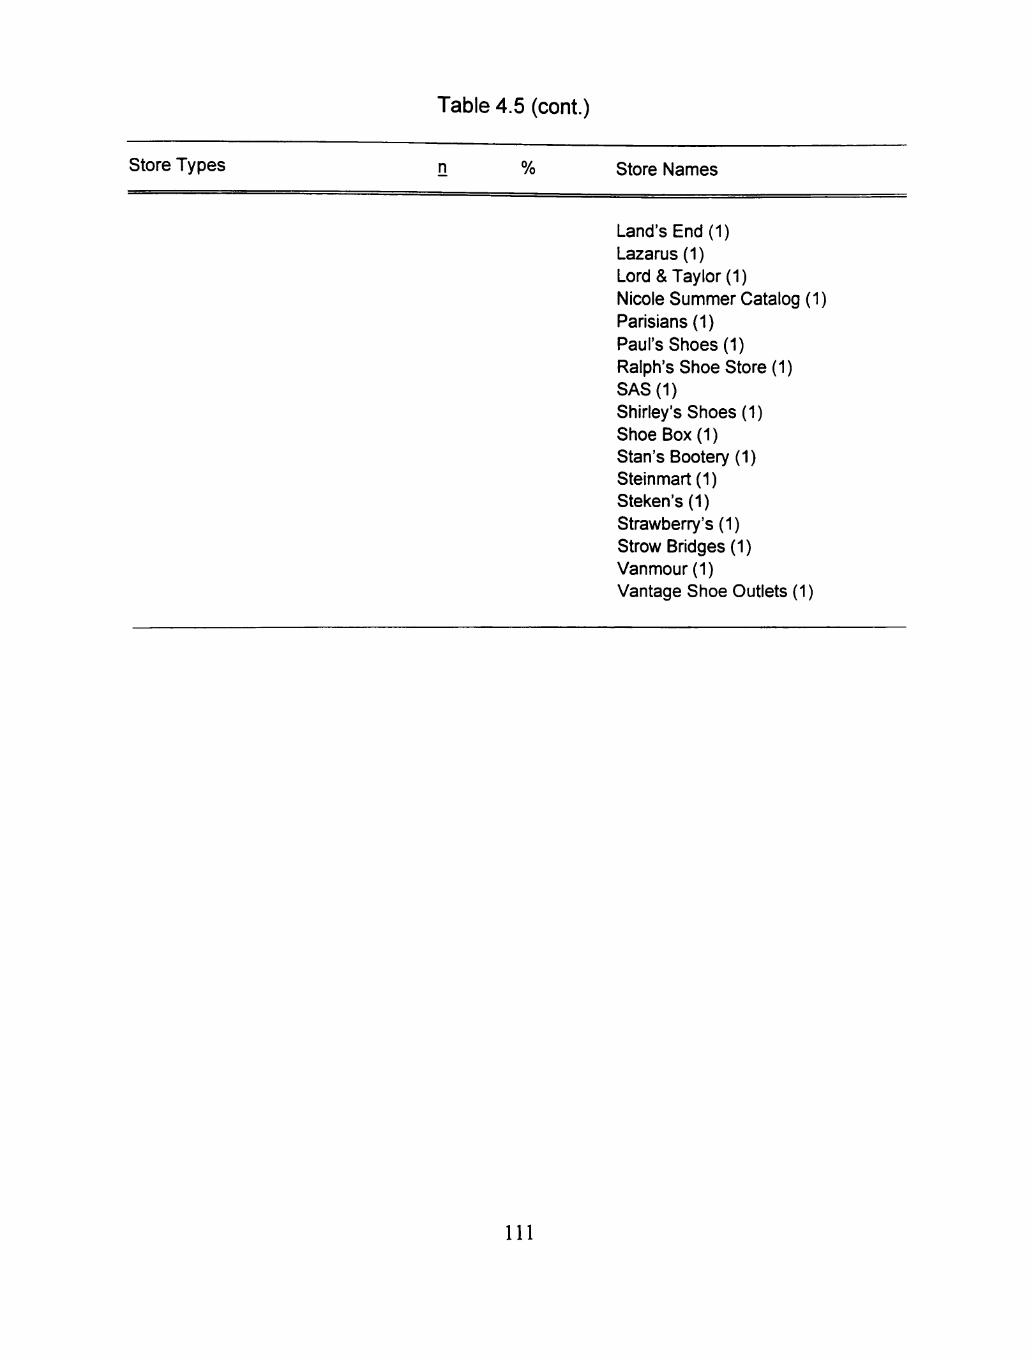
Table 4.5 (cont.)
store Types n % Store Names
Land's End (1) Lazarus (1) Lord & Taylor (1) Nicole Summer Catalog (1) Parisians (1) Paul's Shoes (1) Ralph's Shoe Store (1) SAS(1) Shirley's Shoes (1) Shoe Box (1) Stan's Bootery (1) Steinmart(l) Steken's{1) Strawberry's (1) Strow Bridges (1) Vanmour (1) Vantage Shoe Outlets (1)
111
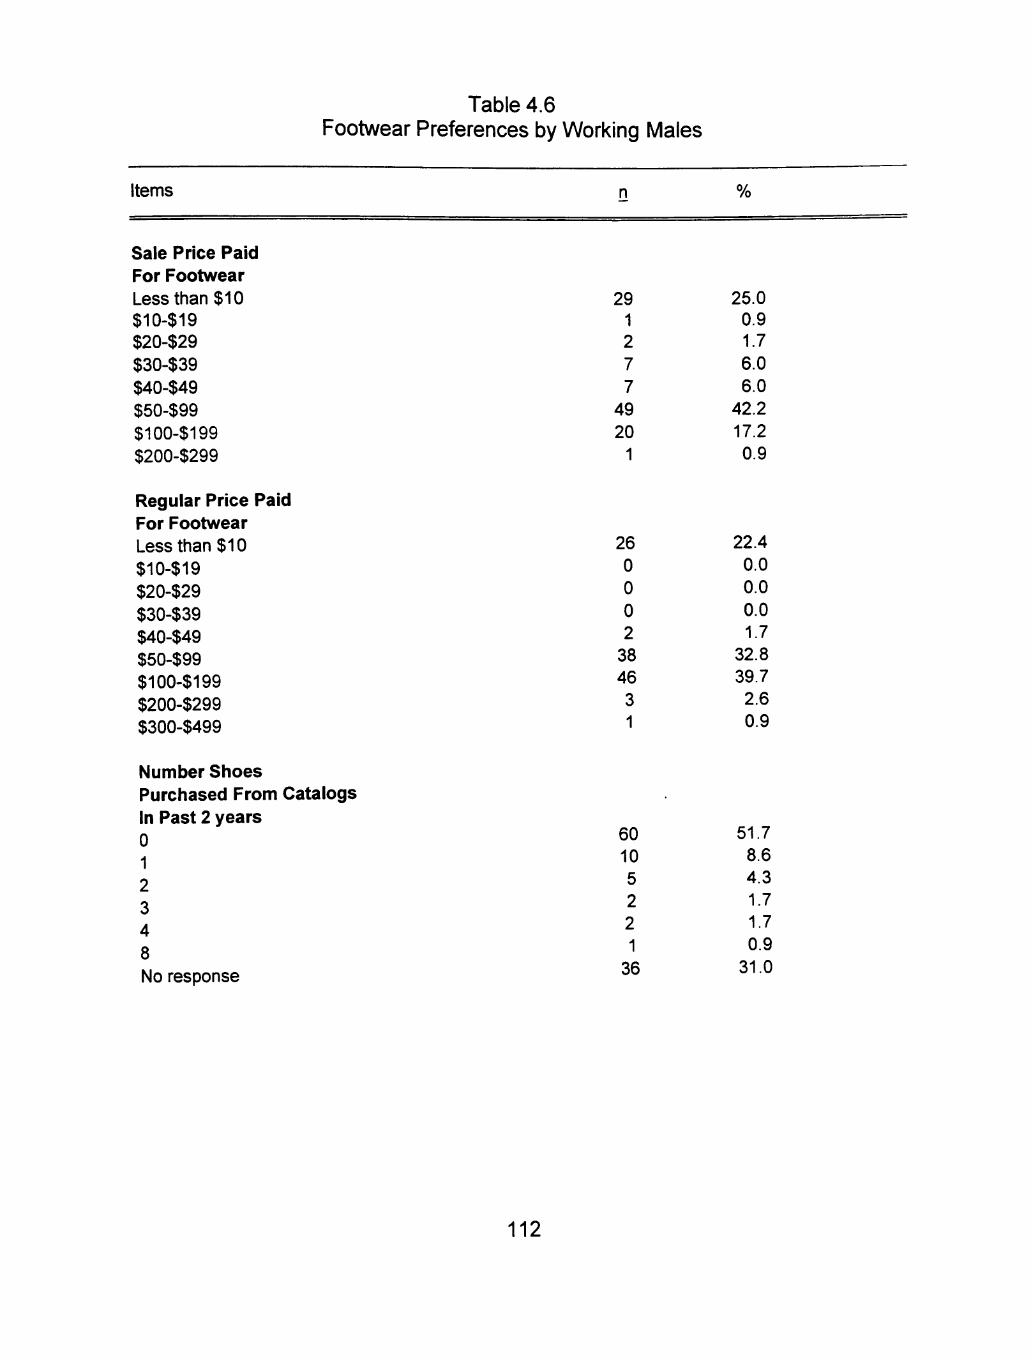
Table 4.6 Footwear Preferences by Working Males
Items n %
Sale Price Paid For Footwear Less than $10 $10-$19 $20-$29 $30-$39 $40-$49 $50-$99 $100-$199 $200-$299
Regular Price Paid For Footwear Less than $10 $10-$19 $20-$29 $30-$39 $40-$49 $50-$99 $100-$199 $200-$299 $300-$499
Number Shoes Purchased From Catalogs In Past 2 years 0 1 2 3 4 8 No response
29 1 2 7 7
49 20
1
25.0 0.9 1.7 6.0 6.0
42.2 17.2 0.9
26 0 0 0 2
38 46 3 1
22.4 0.0 0.0 0.0 1.7
32.8 39.7
2.6 0.9
60 10 5 2 2 1
36
51.7 8.6 4.3 1.7 1.7 0.9
31.0
112
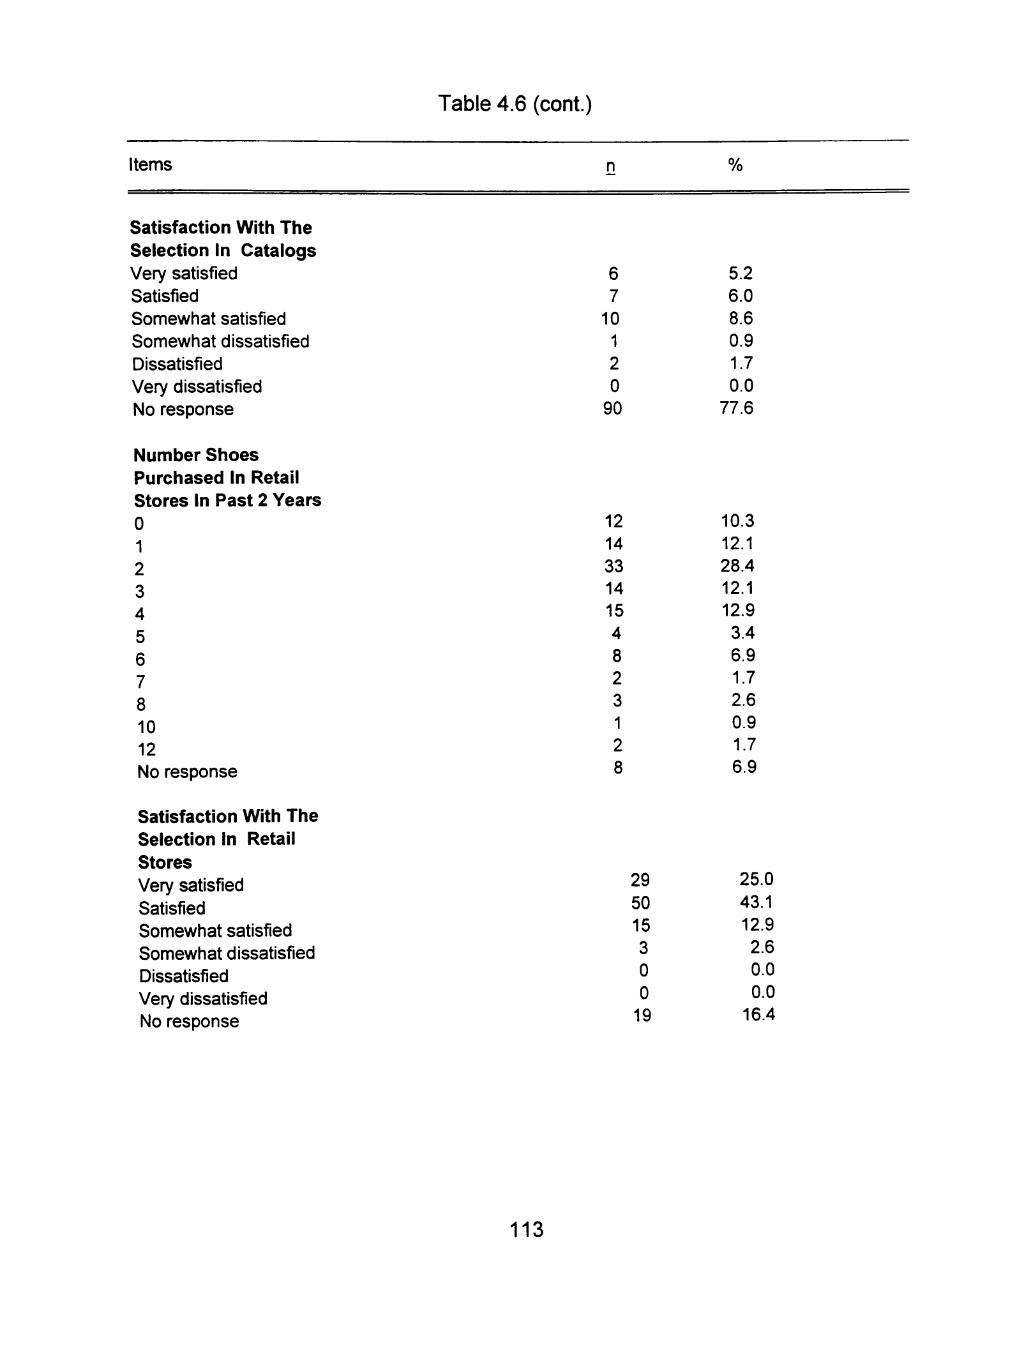
Table 4.6 (cont.)
Items n %
Satisfaction With The Selection In Catalogs Very satisfied Satisfied Somewhat satisfied Somewhat dissatisfied Dissatisfied Very dissatisfied No response
Number Shoes Purchased In Retail Stores In Past 2 Years 0 1 2 3 4 5 6 7 8 10 12 No response
Satisfaction With The Selection In Retail Stores Very satisfied Satisfied Somewhat satisfied Somewhat dissatisfied Dissatisfied Very dissatisfied No response
6 7 10 1 2 0 90
5.2 6.0 8.6 0.9 1.7
0.0 77.6
12 14 33 14 15 4 8 2 3 1 2 8
10.3 12.1 28.4 12.1 12.9 3.4 6.9 1.7 2.6 0.9 1.7 6.9
29
50 15 3 0 0 19
25.0
43.1 12.9 2.6 0.0 0.0 16.4
113
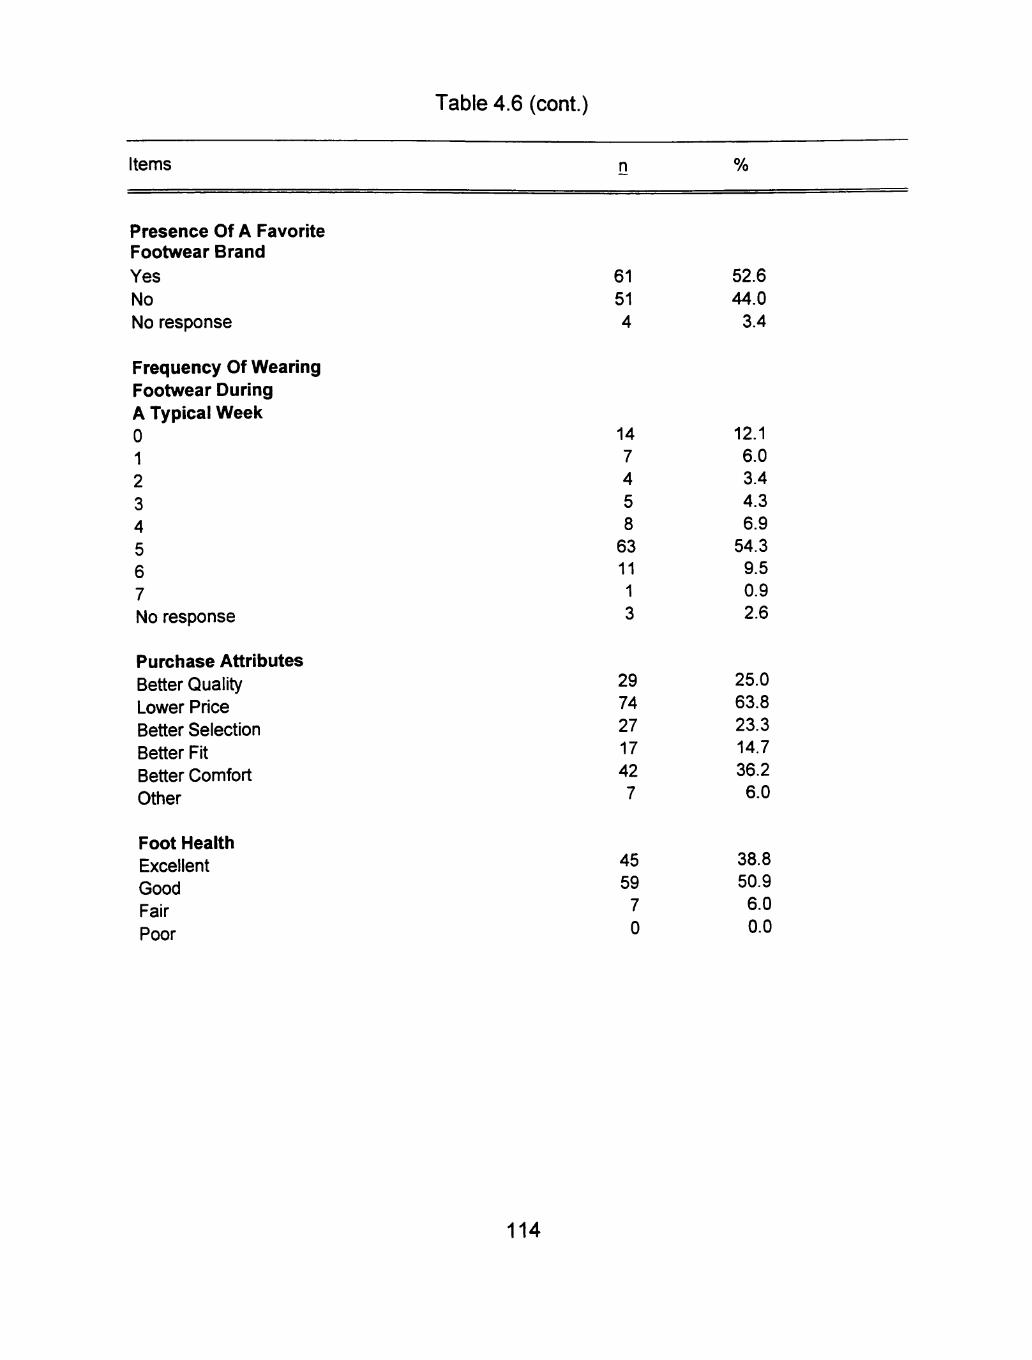
Table 4.6 (cont.)
61 51 4
52.6 44.0 3.4
Items n %
Presence Of A Favorite Footwear Brand Yes No No response
Frequency Of Wearing Footwear During A Typical Week 0 1 2 3 4 5 6 7 No response
Purchase Attributes Better Quality Lower Price Better Selection Better Fit Better Comfort Other
Foot Health Excellent Good Fair Poor
14 7 4
5 8 63 11 1 3
29 74 27 17 42 7
45 59 7
0
12.1 6.0 3.4
4.3 6.9 54.3 9.5 0.9 2.6
25.0 63.8 23.3 14.7 36.2 6.0
38.8 50.9 6.0 0.0
114

Table 4.6 (cont.)
Items n %
Shoe Size Length 6 72 7 72 8 8 72 9 9 72 10 11 11 72 12 12 72 13 14 No Response
Shoe Size Width AA, S A, N B, M C,W D, EW E, EEW No response
Fitting Problems Side Width Heel Width Length Arch Instep Other None
2 4 4 4
13 25 16 14 4 7 1 5 1
16
1 2 25 13 48 13 14
28 9 10 27 8 5 39
1.7 3.4 3.4 3.4
11.2
21.6 13.8 12.1 3.4
6.0 0.9 4.3 0.9 13.8
0.9 1.7
21.6 11.2 41.4 11.2 12.1
24.1 7.8 8.6 23.3 6.9 4.3 33.6
115
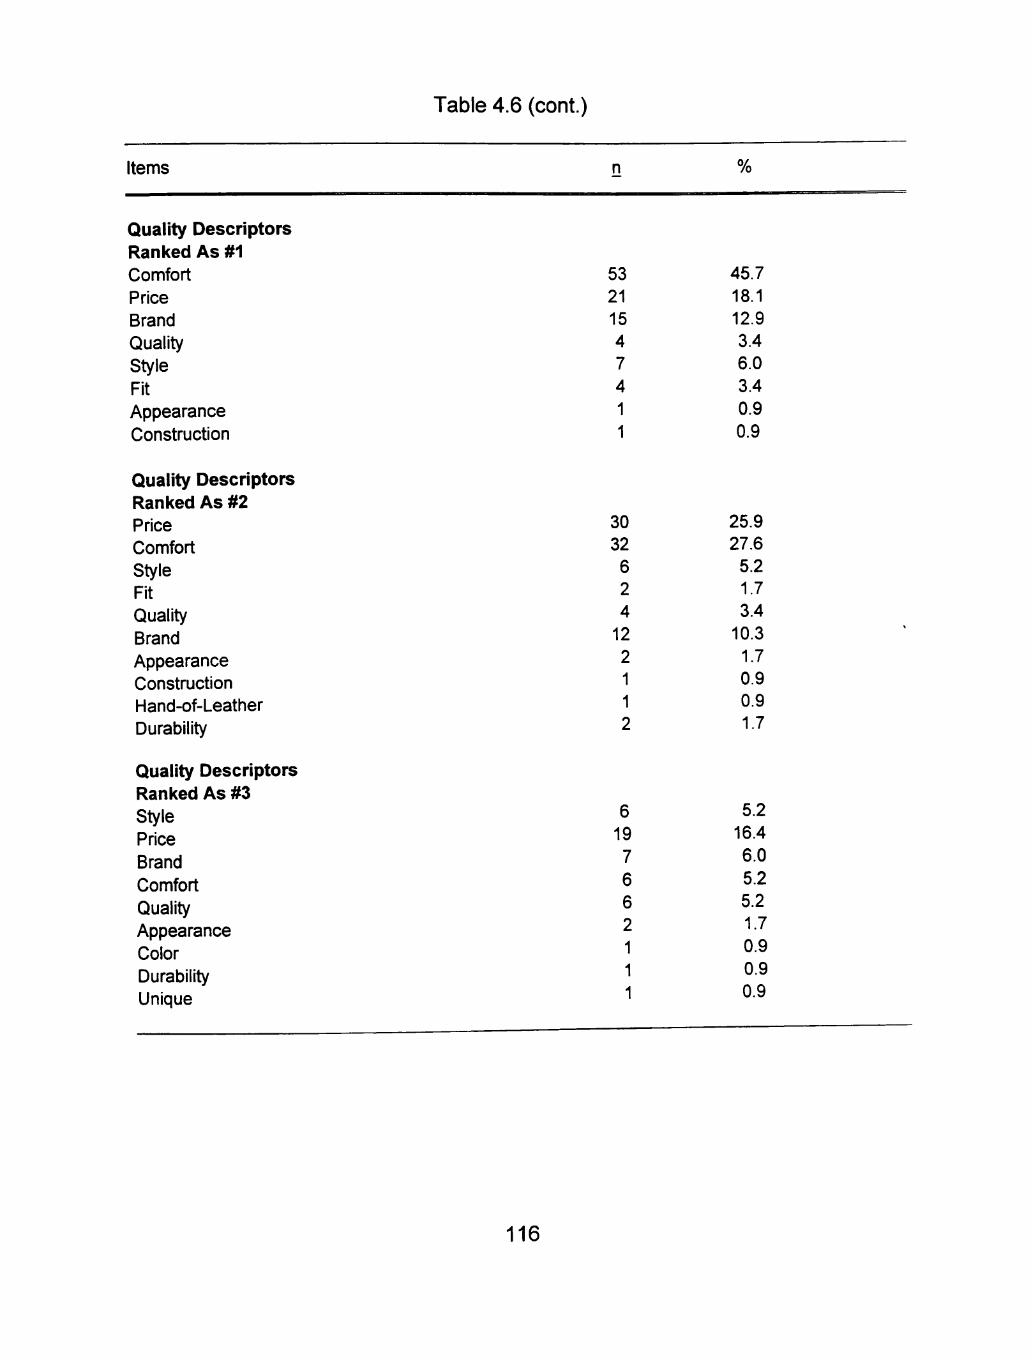
Table 4.6 (cont.)
Items
Quality Descriptors Ranked As #1 Comfort Price Brand Quality Style Fit Appearance Construction
Quality Descriptors Ranked As #2 Price Comfort Style Fit Quality Brand Appearance Construction Hand-of-Leather Durability
Quality Descriptors Ranked As #3 Style Price Brand Comfort Quality Appearance Color Durability Unique
n
53 21 15 4 7 4 1 1
30 32 6 2 4
12 2 1 1 2
6 19 7 6 6 2 1 1 1
%
45.7 18.1 12.9 3.4 6.0 3.4 0.9 0.9
25.9 27.6 5.2 1.7 3.4
10.3 1.7 0.9 0.9 1.7
5.2 16.4 6.0 5.2 5.2 1.7 0.9 0.9 0.9
116
problems were none (33.6%) and side width (24.1%). When males were asked
what evaluative characteristics were used to determine quality, they ranked
comfort (45.7%) first, comfort (27.6%) and price (25.9%) second, and price
(16.4%) and brand (6.0%) third.
A majority (52.6%) of the males Indicated that they had a favorite footwear
brand. The favorite brands among working males were Florsheim, Dexter,
Johnston & Murphy, and Cole Haan, while most purchased brands were
Florsheim and Dexter. The largest percentage of males shopped for footwear at
shoe stores (31.9%) and department stores (31.0%). JC Penney, Florsheim,
and Dillard's were the stores most shopped by males (see Table 4.7 and Table
4.8).
Footwear Involvement
Footwear involvement data were collected using the footwear involvement
secfion of the research questionnaire. Sixteen questions were used for the
purpose of describing the involvement of working females and males in regard to
leather dress shoes for business.
Working Females
Table 4.9 provides a summary of the footwear involvement by working
females. The female respondents did not indicate a majority rating on the 16
117
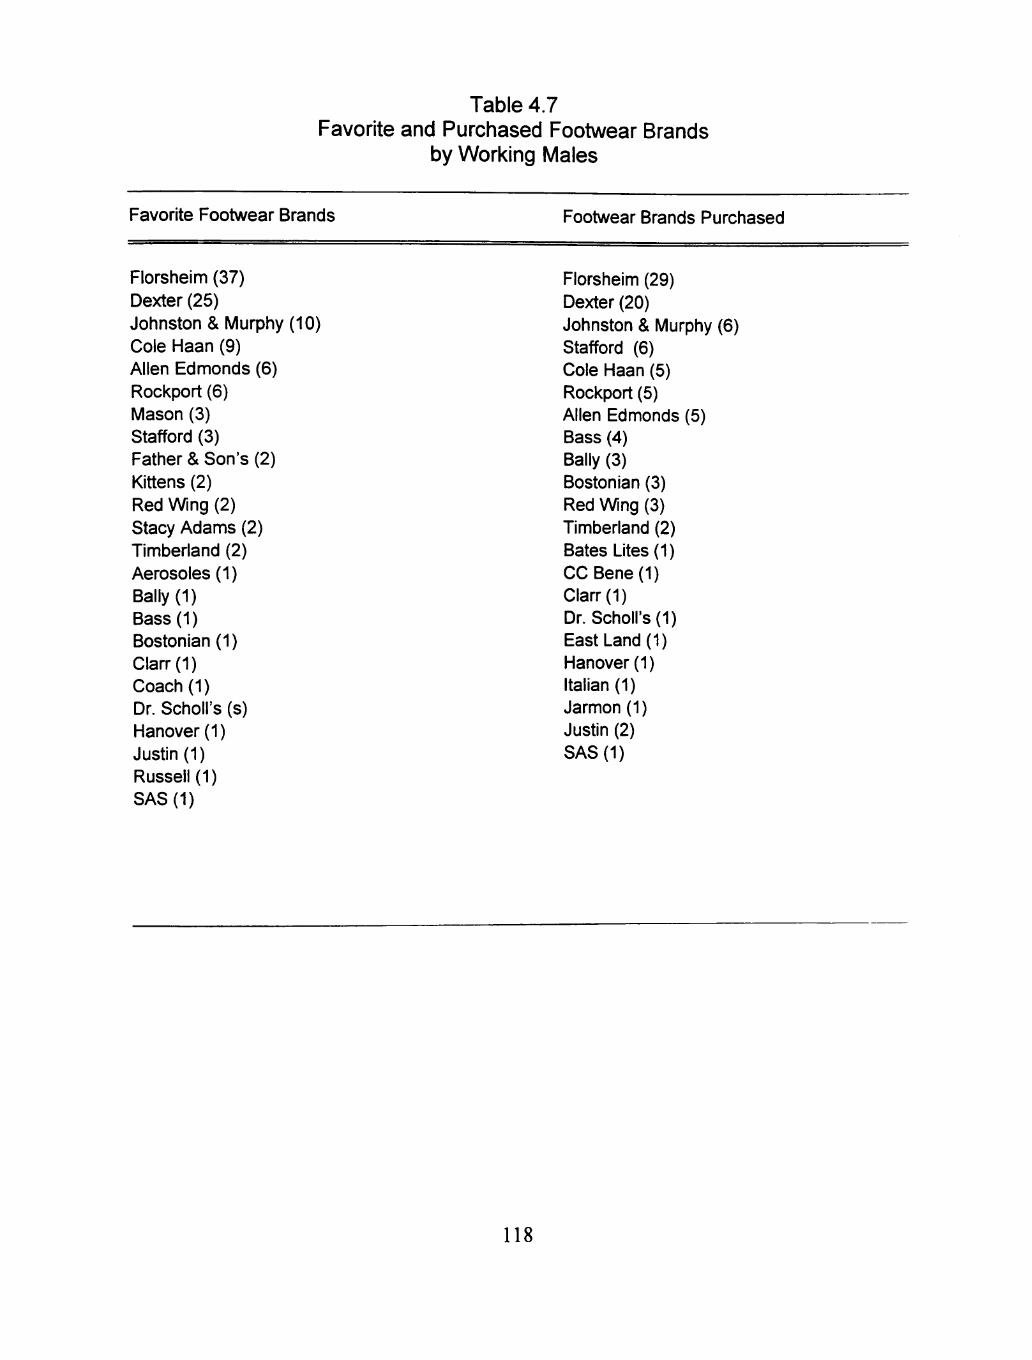
Table 4.7 Favorite and Purchased Footwear Brands
by Working Males
Favorite Footwear Brands Footwear Brands Purchased
Florsheim (37) Dexter (25) Johnston & Murphy (10) Cole Haan (9) Allen Edmonds (6) Rockport (6) Mason (3) Stafford (3) Father & Son's (2) Kittens (2) Red Wing (2) Stacy Adams (2) TImberiand (2) Aerosoles (1) Bally (1) Bass(1) Boston Ian (1) Clarr(l) Coach (1) Dr. Scholl's (s) Hanover (1) Justin (1) Russell (1) SAS(1)
Florsheim (29) Dexter (20) Johnston & Murphy (6) Stafford (6) Cole Haan (5) Rockport (5) Allen Edmonds (5) Bass (4) Bally (3) Bostonian (3) Red Wing (3) TImberiand (2) Bates Lites(1) CCBene(l) Clarr(l) Dr. Scholl's (1) East Land (1) Hanover (1) Italian (1) Jarmon (1) Justin (2) SAS(1)
118
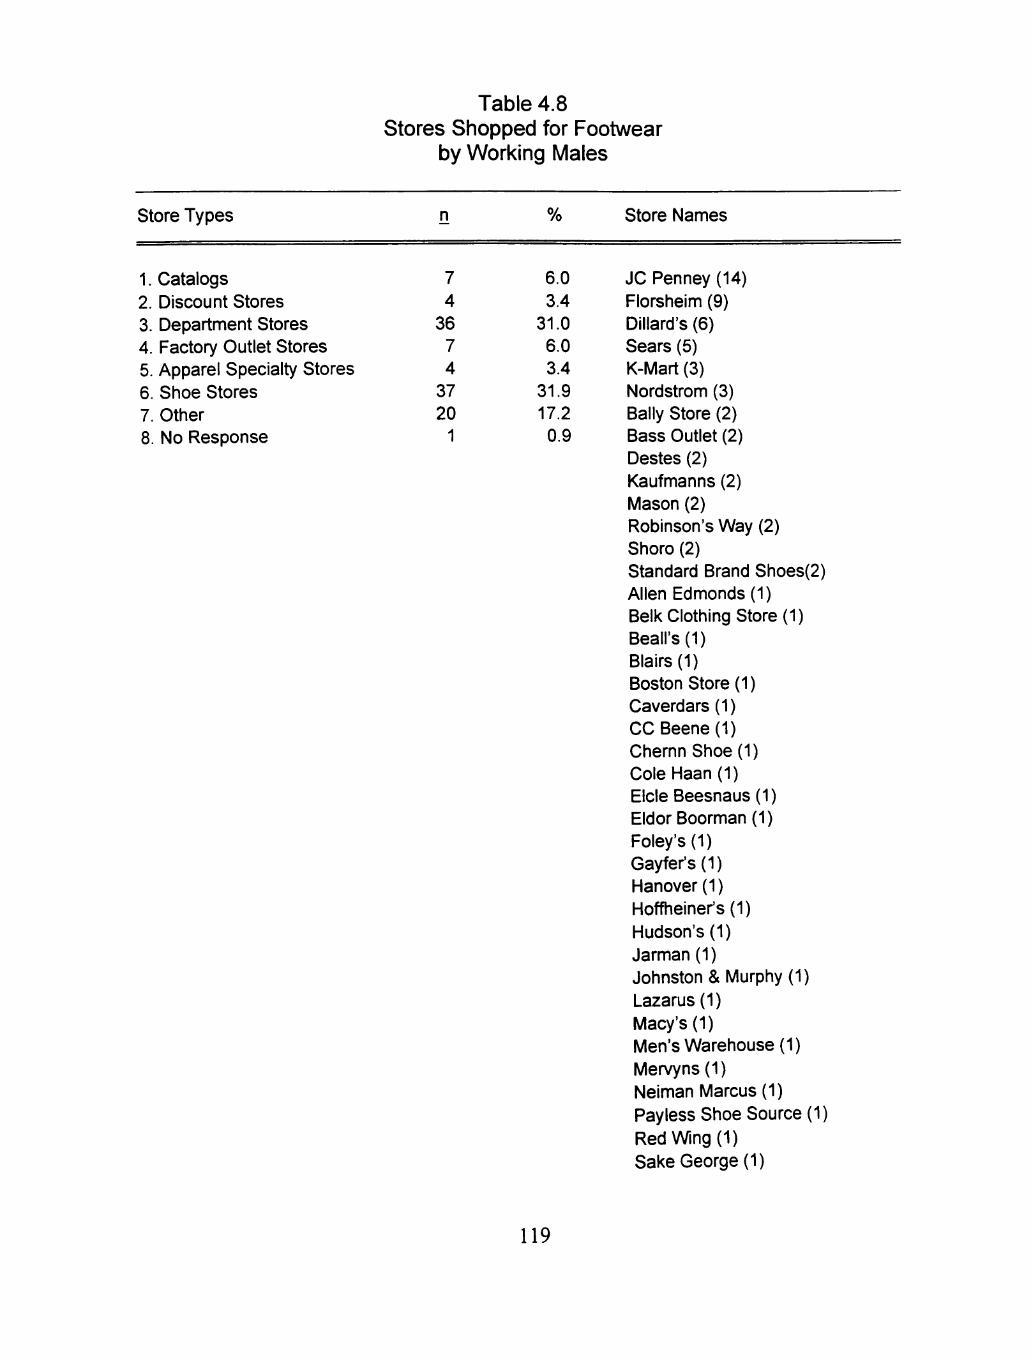
Table 4.8 Stores Shopped for Footwear
by Working Males
Store Types
1. Catalogs 2. Discount Stores 3. Department Stores 4. Factory Outlet Stores 5. Apparel Specialty Stores 6. Shoe Stores 7. Other 8. No Response
n
7 4
36 7 4
37 20
1
%
6.0 3.4
31.0 6.0 3.4
31.9 17.2 0.9
Store Names
JC Penney (14) Florsheim (9) Dillard's (6) Sears (5) K-Mart (3) Nordstrom (3) Bally Store (2) Bass Outlet (2) Destes (2) Kaufmanns (2) Mason (2) Robinson's Way (2) Shoro (2) Standard Brand Shoes(2) Allen Edmonds (1) Belk Clothing Store (1) Beairs(l) Blairs(l) Boston Store (1) Caverdars(l) CCBeene(l) Chernn Shoe(1) Cole Haan (1) Elcle Beesnaus(l) Eldor Boorman (1) Foley's (1) Gayfer's(l) Hanover (1) Hoffheiner's(l) Hudson's (1) Jarman (1) Johnston & Murphy (1) Lazarus (1) Macy's (1) Men's Warehouse (1) Mervyns(l) Nelman Marcus (1) Payless Shoe Source (1) Red Wing (1) Sake George (1)
119
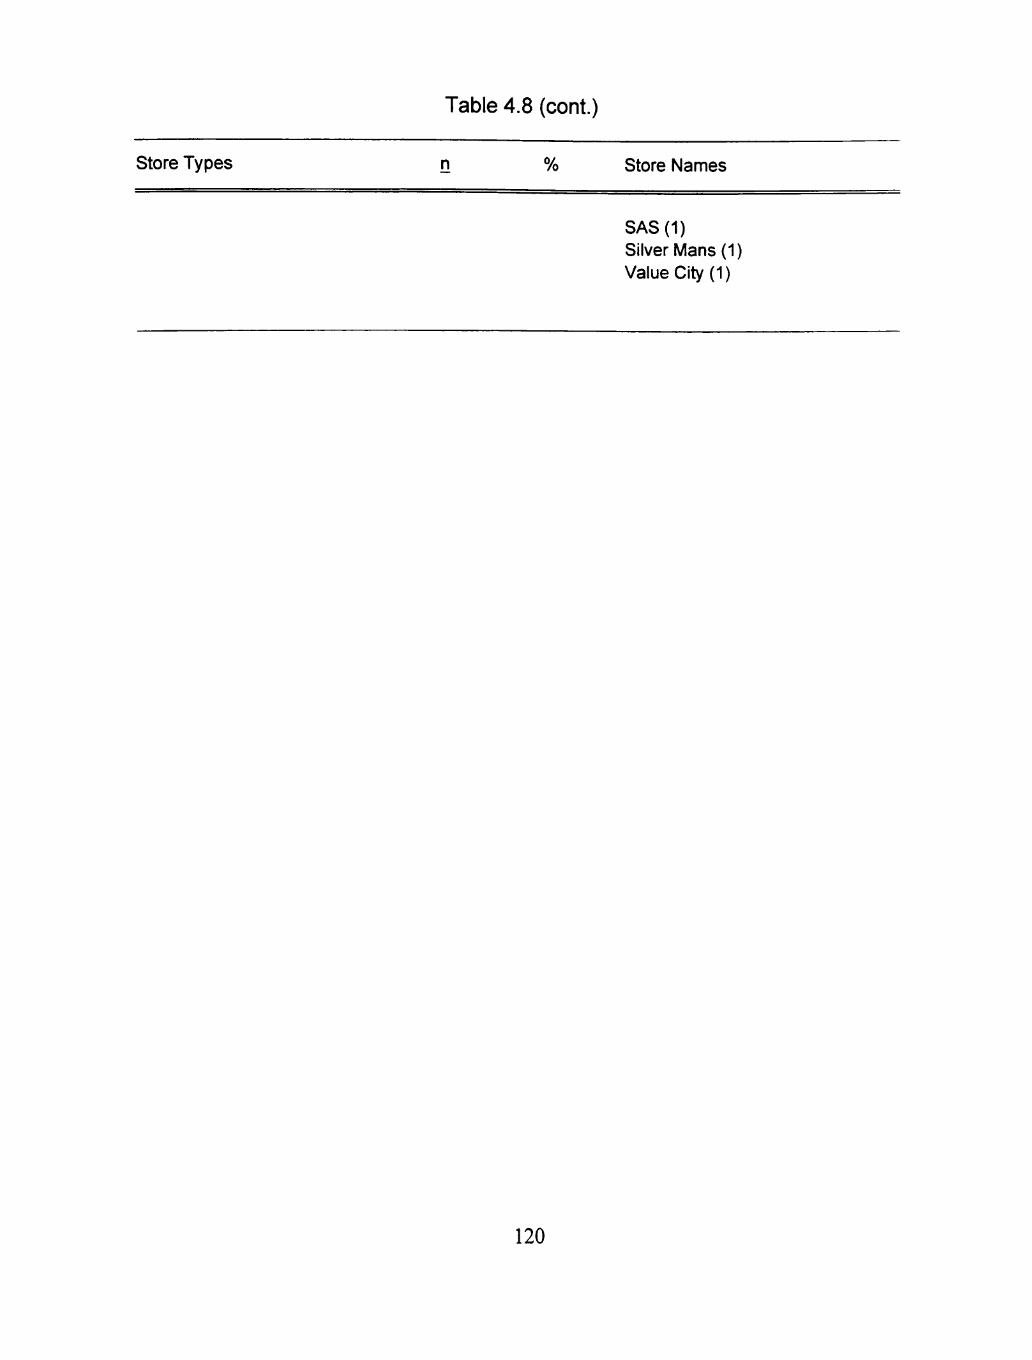
Table 4.8 (cont.)
Store Types n % Store Names
SAS(1) Silver Mans (1) Value City (1)
120
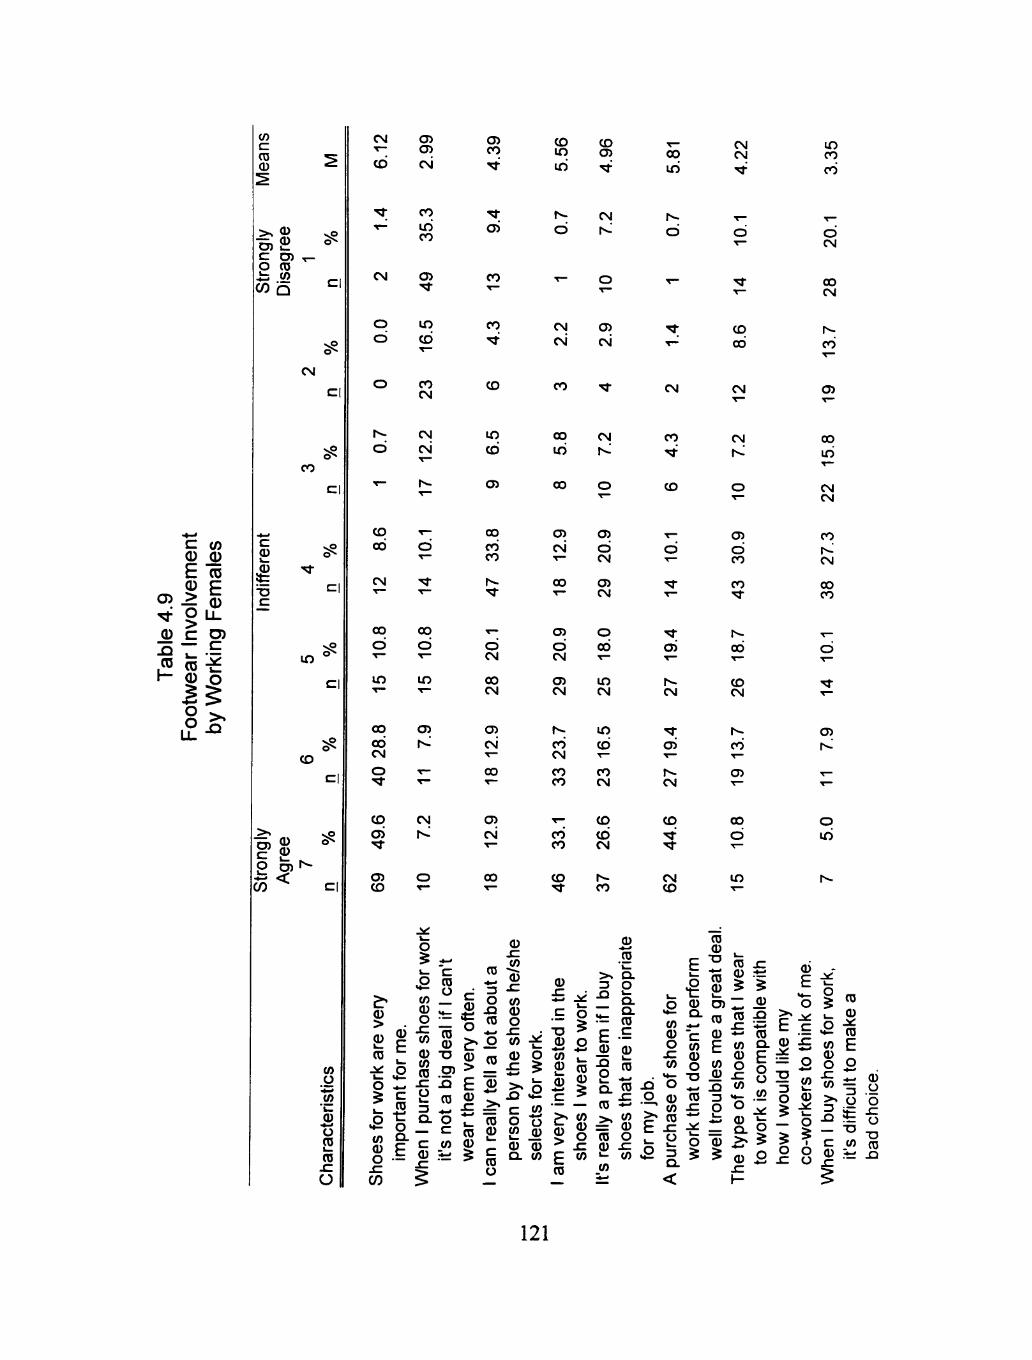
C 0) CD <D Ero CD E
' ^ g LL CD C D)
o >
to
0
D ) £ c cn O (TJ 4= (0 CO Q
CM
CO
c 0
I c|
i n
C I
CD
C I
-Q) 0 0>> C 2 O O) "^ i : < CO C
to o to
' k -
B "o (D
CO
O
CM
CD
00
od CM
o
CD CJ>
Oi CD
Gi CM
"^ '*"
CM
O
b
o
r b
CO
ih CO
en
i n CO
CO CM
CM
csi
CO T -
00 b
CM "sr
00 oo b b
in in
C35
CM
r ^
o
> . to
f § 0 g-^
i£ £ ro o *- -C s s -L. ro 3 O ^ CL to Q- £_
Si I 5 I
ro " d
0 ^ T3 Q) CO > 5 E ro ^
1 " ^ ro to 0
C3) CO
ai
CO
CO
CD
in
CD
C3>
00 CO CO
r
o CM
00 CM
Gi CM
00
Oi
cvi
00
0
^ 0
O to X3 0 ro o o » -S ™ o o
=* c w ro o o 0 to ^ ^ 0 0 ro ° - «« o
CD in iri
b
CM CM
CO
00
iri
00
0
_c T3 0 to
2 0 C •^
very
E ro
o $ o 4 - '
^ ro 0 $
a a ^
hoes
to
<D
CM
• ^ O
Oi CM
CM
<3) CM
00
C3>
b CM
CM
r CO CM
CO CO
.^ CO CO
CD
O)
b CM
Oi CM
o GO
i n CM
i n CD
CO CM
CD CO CM
r»-co
B "TO ' i _
>» Q. 3 O
•° ^ z. °-~ ro E - S J) 0 Si o
00
iri
r^ b
CM CM
CM
CO
CO
o
CI>
r ^ CM
ai
CM
CO
CM CD
CM
CM r^
cn b CO
CO "«3-
00
CO CM
r^ CO
ai
00
b
in
E "
ro CL ro ro *^
= 0 ro o 0 sz »- Ui to
O 0
to . ^
O w -C 0 Oi o
o 0 ro >» ro *"
J=? - § "2 K^
ro
ro ro ^ 0 5 I— _
ro ro
E w Z. <^ to o iD s: Si Oi
o o i : 0 = C2. 0 . ^ 5 tD
SZ \-
sz
B.
m CO CO
o
'^
CO 00
o CM
00 CM
r CO
Oi
oo iri
CM CM
CO
CM
oo CO
o
ai
o iri
0)
E ^ o
ro „ . • = Q. 0 :C
.«5 ^ 0 o 0
0 - 0 ^ $ ^
o o o
to E o o
"5 2 >^ o o ^ »^ x: ^ t o - "^ -D C .to (0 0 . * ; x j
121
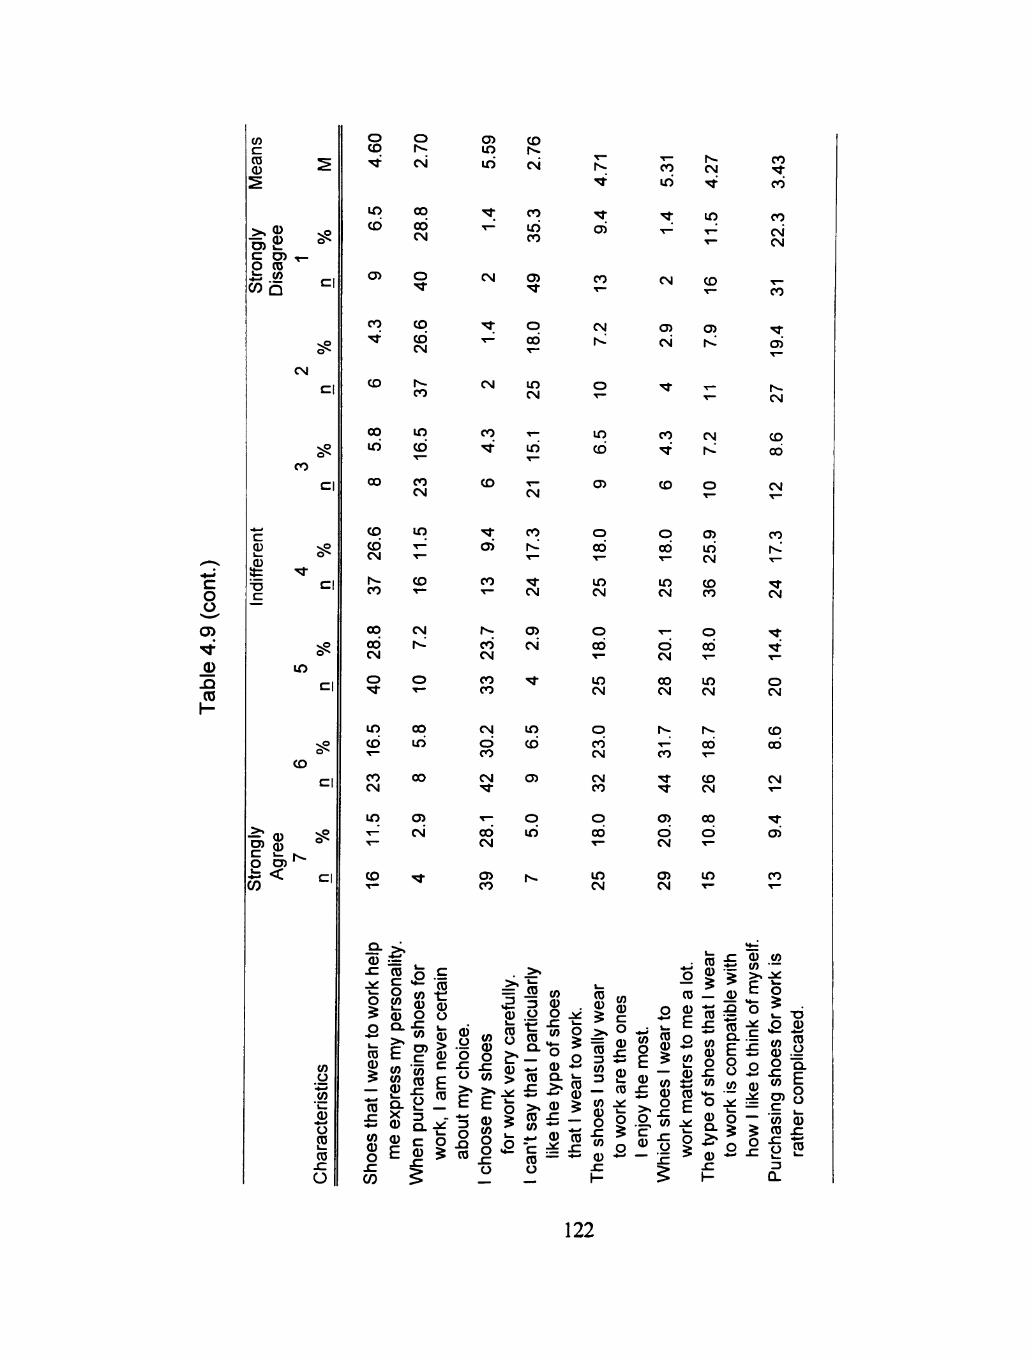
c o
CO
to c ro 0
c en o ro CO Q C I
CM
CO
c 0
I T3 C
i n
CO
_>« O)
o • - •
CO
0 0 C3) <
r^ C I
to u to
' k .
_0
ro O
o CD T t
i n CD
ai
CO
-^
CO
00
iri
00
CD CD CM
CO
00 00 CM
o
i n CO "^ CO CM
i n T - '
o r cvi
00 00 CM
o
CD CD CM
r^ CO
i n CO • ^
CO CM
i n
^
CD
CM
r^
o
00
iri
oo
c: CM
CD
C ^
m iri
- ^ ^~
CM
-^ • * "
CM
CO
-^
CD 1 ^
cvi
CO
iri CO
ai
o 00
m CM
.^ iri
CD CM
-^ ai
CO
r^ CO CM
CO CO
CM
b CO
CM
^ 00 CM
ai CO
CO
r
CM
en csi
-^
i n CO
ai
o iri
r
r^
ai
CO
CM
in CO
c^
o 00
i n CM
o oo
i n CM
CO CM
CM CO
o 00
i n CM
CO
iri
CM
ai csi
CO - ^
CD
r > > -CM
i n
CO
ai r^
CM
o 00
in CM
.^
b CM
CO CM
r
CO
"^ ^
ai b CM
c:> CM
ai iri CM
CO CO
o 00
in CM
t ^ 00
CO CM
00
b
i n
CO -^ CO
CO CM CM
CO
CI>
r^ CM
CO
00
CM
CO
CM
o CM
CO
OC)
CM
ai
CO
help
w
ork
at 1
wea
r to
S
ho
es th
Ity
.
ro
erso
r :p
ress
my
p(
mee
>
o
oe
sf
rcha
sing
sh
Wh
en p
u
c
cert
a 1
am n
ever
w
ork,
my
choi
ce.
abou
t my
shoe
s 1
choo
se
eful
ly
ork
very
car
fo
rwi
^
icul
ar
y th
at 1
part
i 1
can'
t sa
oe
s le
typ
e of
sh
like
th
^
wea
r to
wor
th
ati
Th
e sh
oes
1 us
ually
wea
r
to 0 r—
rk a
re t
he o
r to
WO
I y th
e m
ost.
1 en
jo
o
Whi
ch s
hoes
1 w
ear
o
mat
ters
to
me
a 1
wor
k re
ar
ro
of s
hoes
th
The
type
^
tible
wit
rk is
com
pal
to w
o
0 to Ui —
E o
like
to th
ink
how
1 rw
or
ng s
hoes
fo
Pur
chas
i
TJ
' com
plic
ate
rath
ei
122
statements included in the footwear involvement section of the questionnaire.
According to the highest percentage (49.6%) of female respondents, they
strongly agreed that shoes for work were very important. As to shoes for work
that did not perform well, females strongly agreed (44.6%) that lack of
performance troubled them a great deal. Three statements that female
respondents indicated agreement on were: "I choose my shoes for work very
carefully" (58.3%),"l am very interested in the shoes I wear to work" (56.8%), and
"Which shoes I wear to work matters to me a lot," (52.6%). The highest
percentage of females were indifferent on two statements: "I can really tell a lot
about a person by the shoes he/she selects for work" (33.8%) and "The type of
shoes that I wear to work is compatible with how I would like my co-workers to
think of me" (30.9%). Disagreement by females was indicated on two
statements:" I can't say that I particularly like the type of shoes that I wear to
work" (53.3%) and "When I purchase shoes for work it's not a big deal if I can't
wear them very often" (51.8%).
Working Males
Table 4.10 provides a summary of the footwear involvement by working
males. The male respondents did not indicate a majority rating on the 16
statements included in the footwear involvement section of the questionnaire.
Males agreed on eight involvement statements: "Shoes for work are very
123
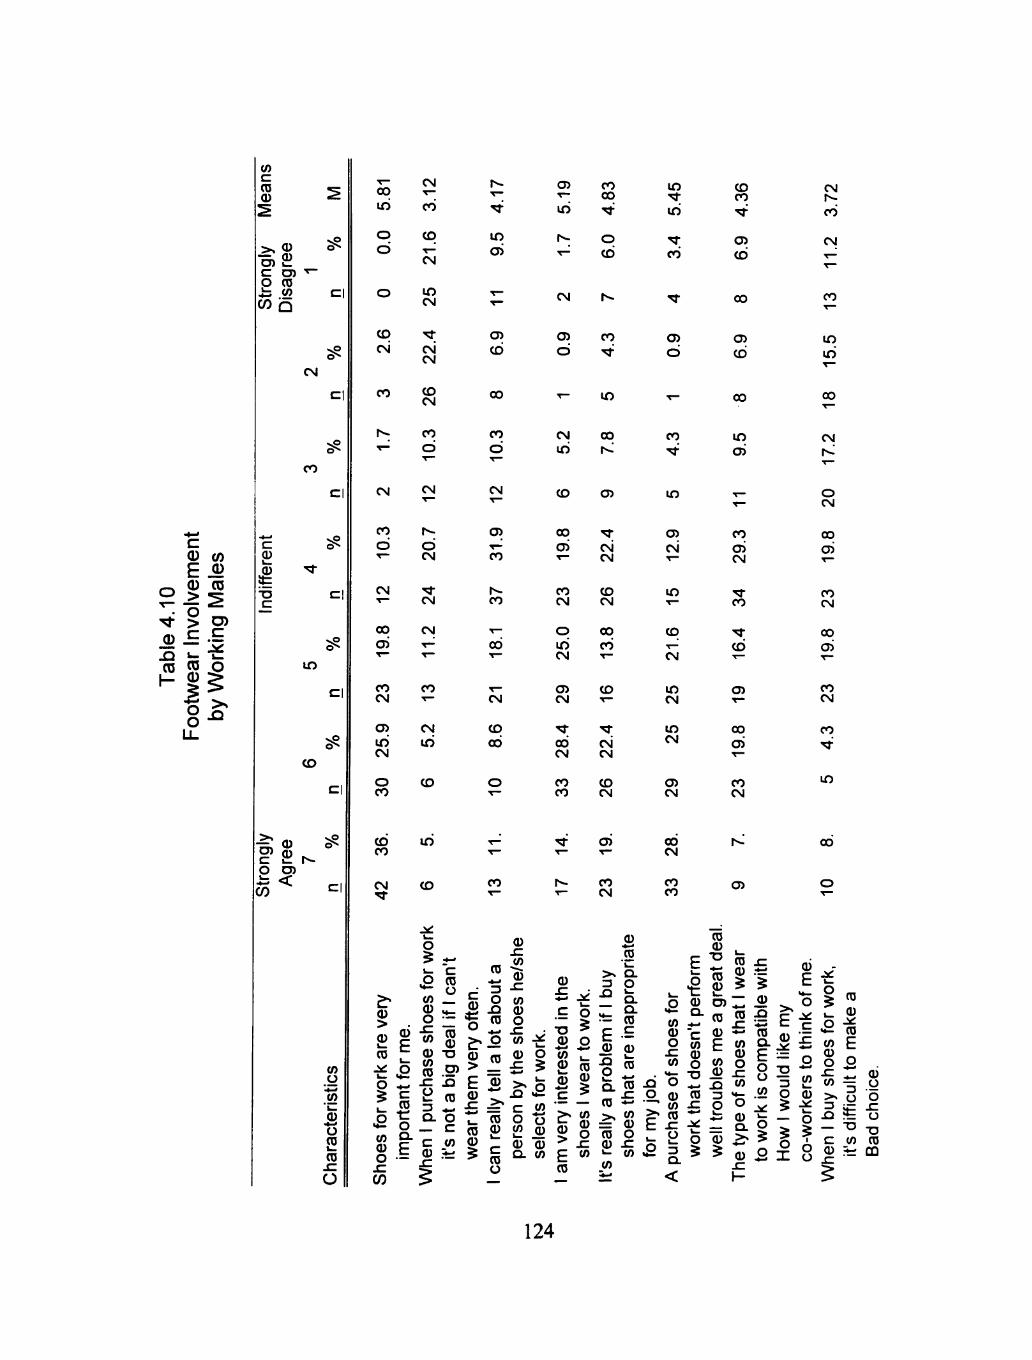
c CD en E J92
^ CD CD
I- g§
o U-
to c ro 0
>s g? en c o l _
w
0
Oi ro to
b
CM
CO
C I
c 0
I C
i n
CD
C I
_>» CJ) c o k .
w
0 2 C3)
< r
C I
CO (J
0 o 2 ro sz O
00
iri
o b
o
CD CM
CO
r»-T - ^
CM
CO
CD
CM
i n CM
^1-CM CM
CD CM
CO
b
CM
CO
b
CM
00
ai
CO CM
C7>
iri CM
o CO
CD CO
CM
CM
b CM
CM
CM
CO
CM
«ri
CD
i n
CO
o
to 0 o .c Oi
0 to ro
0
£ I ro ^ ^ o I - • « -
o *-
£?_ to Q- J-
§ i | 5 I
r ^
in ci>
ai CD
00
CO
b
CM
en
CO
r CO
CO
CM
CO
00
CO
3 Q .
C ro " d ^& ™ £ , 0 ^
"O 0) O) > 5 E ro ^
Ui 0
0 x:
^ 0 3 -^ O to sa 0 ro o
ro^ i
= tz Oi ro o t5 0 to ^ ^ 0 0 ro ° - «« o
ai
iri
r
CM
en b
CM
iri
CO
0
.E o
0 o "to t ! 2 ro
"c ^ >» to Is " . c E <« ro
CO
oo
o CD
CO
i n
00
en
00
ai
CO CM
o iri CM
ai CM
-^ 00 CM
CO CO
-^ csi CM
CD CM
00 CO
CD
-^ CM CM
CD CM
CJ)
CO CM
0 *.< ro
> s Q. 3 O
•° ^ ^ °-~ ro E-£ 0 0 Si Q
in
iri
CO
Oi
b
CO
in
CJ) CM
in
CD
CM
in CM
in CM
CJ) CM
00 CM
CO CO
CO CO
C35 CO
00
en CD
00
in ai
CO
ai CM
CO
CO
ai
00
ai
CO CM
(3)
ro Q. ro ro *-•
to 0 o to
Si O .0, 0 >* ro E s:
>N Oi = 0 ro o ,_ _ >- to i : 5 to Q-
ro 0
E2 o ro
0 O) °-ro C ^ to E 0
"O .3? * - J2 ro 3
• ^ =
o 0 $ 5
ro ^ 0 .ti $ ^
— 0) ro :9
ro Q . E o o to
CM
co
CM
CO
in iri
CO
CM
r
o CM
00
ai
CO CM
00 CJ)
CO CM
CO
in
oo
0
E
E ^ to 0 o
SI Ui
Q. O
0 2
C 0 Z — O • D
3 {2 O 0 5 -if — o $ $ o 6 X o
i" i_ 0
2^ o o o
-c t^ 0 to ^ o >« o o 3 ~ ^
.Q fE o - " ° T3 c Ui m 0 * i CD
124
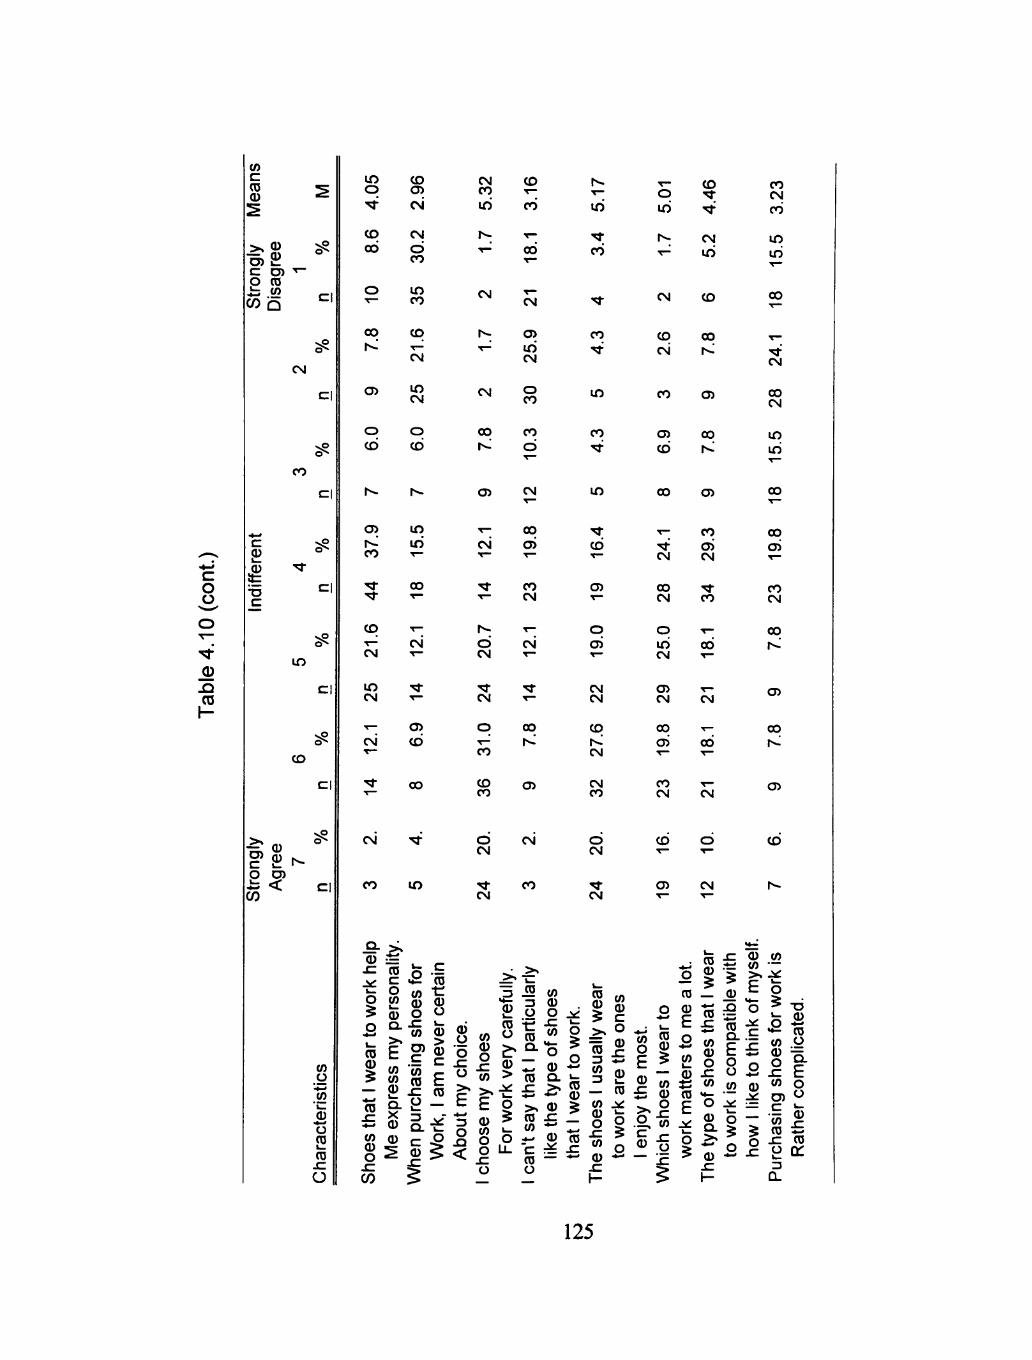
c o o
Oi c ro 0 ^
_>» CJ) c o
str
0
2 Oi ro
Dis
CM
C I
CO
C I
c
i n
CD
^
c o CO
0 0 1 _ CJ) <
r^
Oi
o ' l _
0 o 2 ro sz CJ
in o -^
CD 00
o
00
r '
CJ)
o CO
CD CJ)
CM
CM
b CO
i n CO
CD
CM
i n CM
o (O
CJ) r ^ CO
CD
CM
m CM
T -
CM
in iri
00
.^ CM
"^
CJ) CO
CM
CO
OO
in
0 ~ ro o to 0 Q. >» E to to 0
ro 9-iz 0 to 0) 0 ^
o ^
o
o
ro 0
2 i 0 0 o o
^ «-Oi 0 O) ^ .E c to c: ro E x : ro y _ Q. 1=
0 ^
CM CO
iri
CD
CO
r^ T -
•r^ 0 0
CM
CJ)
CM
r^ • * "
CM
00
r^
en iri CM
o CO
CO
b
CM
T -
CM
-^
h-
b CM
CM
O
CO
CO CO
b CM
CM
OO
ai
CO CM
^ cvi
00
r
CJ)
csi
CO
3 <*— 0
8 <« S -C ^ 0 " « > >» > , -^
3 0 > O Oi ^ < O u. ^ s:
r
tri
CO
CO
in
CO
in
b
CJ)
o ai
CM CM
CO
CM
CM CO
o CM
CM
CO
i5 to 3 0 O O j ^
^ 0 i ; ro Q- j= . c ?> ro >» 0 ^ ro :£ _ w "^ *-ro — *" o
ro to iJ 0 5 c
II to
Ui
o E
— ro to J«£
2 i «" o 0 *-
0 . c
o iri
CO
CM
iri
CM CD
CO
CM
00
<D
CJ)
00 r ^
CO CJ)
CJ) 00 b h
CJ)
r—
CM
00 CM
O
iri CM
CJ) CM
00
ai
CO CM
CO
ai CM
CO
.^ 00
CM
.^ oc>
CM
CM
ro 0
0) «, — to 0
0 -g
^ ro 2 % ro —
ro t £ ° 0 - I
CO CM
CO
in iri
00
CM
00 CM
in iri
CO
00 CJ)
CO CM
00
ai
00
CJ)
b
. c 0
.ti to
-9 o ro ^ Q. .E £ £ 8 o to 0)
o — $ $
to
0 *-
o 5-c i o 2 •^ ro to o
5 I to o CO " p ro *-x: ro 3
CL
125
Important to me" (81.9%), "A purchase of shoes for work that doesn't perform
well troubles me a great deal" (75.0%), "I choose my shoes for work very
carefully" (72.4%), "I am very interested in the shoes I wear to work" (68.1%),
"The shoes I usually wear to work are the ones I enjoy the most" (67.3%), "Which
shoes I wear to work matters to me a lot" (61.2%),"lt's really a problem if I buy
shoes that are inappropriate for my job" (56.0%), and "The type of shoes that I
wear to work is compatible with how I like to think of myself (46.5%). In contrast
males disagreed with five statements: "When purchasing shoes for work, I am
never certain about my choice" (57.8%),"Purchasing shoes for work is rather
complicated" (55.1%), "When I purchase shoes for work it's not a big deal if I
can't wear them very often" (54.3%), "I can't say that I particularly like the type of
shoes that I wear to work" (54.3%), and "When I buy shoes for work, it's difficult
to make a bad choice" (43.9%). The highest percentage of males indicated
indifference to shoes expressing their personality (37.9%), shoes selected for
work that can tell a lot about a person (31.9%), and shoes being compatible with
how they would like for their co-workers to think of them.
Footwear Purchase Criteria
In the purchase criteria section of the research questionnaire, data were
collected on 11 extrinsic and 8 intrinsic footwear attributes. The respondents
were asked to rate the importance level of each purchase criterion.
126
Working Females
More than 95% of the respondents answered from very important to
important to eight purchase criteria (Intrinsic = 6; Extrinsic = 2) they considered
when purchasing leather dress shoes for business wear: fit (98.6%), quality
(97.9%). durability (97.2%), attractiveness (97.1%), comfort (97.1%),
construction (95.6%), color (95.6%), and size (96.4%). For five purchase criteria
(Intrinsic = 4; Extrinsic = 1), more than 90% of the respondents answered from
very important to important price (93.5%), style (93.5%), ease-of-care (91.3%),
fabrication (90.6%), and hand-of-leather (90.0%). The six remaining purchase
criteria (Extrinsic = 6) were rated by a majority of the working females, with
versatility (87.7%), shoes in wardrobe (85.6%), latest fashion (64.0%), retail
store or catalog (61.1%), and brand (58.3%) being considered very important to
important and country-of-origIn (69.1%) considered not important (see Table
4.11).
Working Males
As indicated in Table 4.12, more than 95% of the respondents answered
from very important to important on four purchase criteria (Intrinsic = 3; Extrinsic
= 1): fit (99.0%), size (98.2%), quality (95.8%), and durability (95.7%). More than
90% of the respondents answered from very important to important on six
purchase criteria (Intrinsic = 5; Extrinsic = 1): comfort (94.0%), style (93.5%),
127
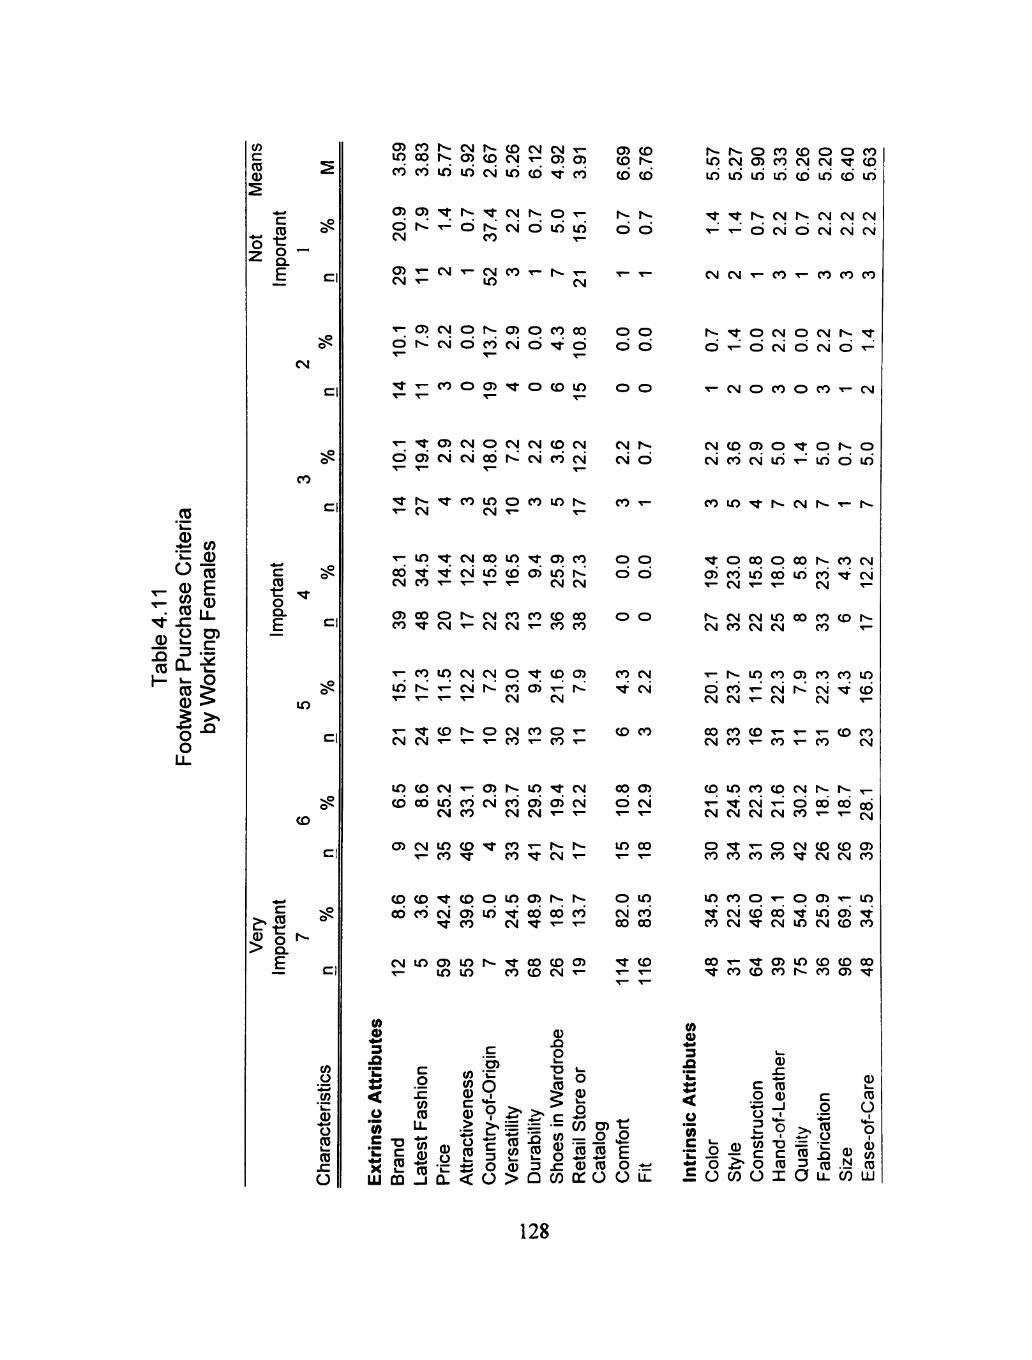
CD
CD
4.1"
(D
CD 1—
•»s v> •n. 0 O-m ^ E
P D) < S 1 •- p CD >
1-° o
to c: ro 0
c
^ Q.
£
CM
CO
£3.
E ==
i n
CD
CI
C vP
^ r o ^
E c
to
to
2 2 ro x : O
CJ)COr*-CMr^CDCMCMT-inoc>r>» .c j )cDCMT-o )c j ) c d c o i r i i r i c M i r i b ^ c o
c j ) C J ) ' ^ r ^ ^ c M r ^ O T -b r ^ T - ^ b r ^ ^ c M b i r i i r i CM CO T -
CJ) ^ CM CM •«-
CM CO T - r^ T -m CM
• r - ; C J ) C M C D r ^ C J ) O C 0 0 0 b i ^ c M b c o c N J b ' ^ b
CO o CJ) Tf o CD in
• - ; " ^ C J ) C M C 3 C M C M C D C M b o i c M C M O O r ^ C M C O C M
^ r « - ' ^ c o i n o c o i n r > ^ ^ CM CM T - T -
• r - i n T l ; C M 0 0 i n ' ^ < 3 ) C 0
o d ' ^ T t c M i r i b b i r i r ^ C M C O r - T - T - T - CMCM
c j ) o o o r ^ c M c o c o c o o o C O I ^ - C M T - C M C M I - C O C O
T - C O i n C M C M O - ^ C O t J ) i r i r ^ - r - ^ C M r ^ c o b - r ^ h ^ T - T - T - T - CM CM
T - ' ^ t O h - O C M C O O C M C M T - T - - « - C O T - C O
m c D C M T - c n r ^ i n ' ^ c M b o d i r i c o c M c o b b c v i
CM CO CM CM •«- •«-
c j ) C M i n c D " ^ c o T - h - r > » -T - CO M- CO Tj- CM T -
c o c D ^ c D O i n c j ) r ^ r ^ o o c o c M c x J i r i T r o o c d c o
"^ CO CM TT •«- •«-
C M i n c j ) i n r ^ ^ o o c o c j ) T - i n i n CO CD CM T-
(0 o
< o 'io 'iZ X
T3 C ro
c o ic to ro u. to 0
to to 0 c 0
CJ)
0 .a o
o I
0 O
2r >.
i l (0 »-CQ - J Q .
ro - , to ro
5 O 0 3 < O > Q
2 3
ro
to 0 o sz
CJ) CD CD r^ b b
r^ ro. b b
o o b b
o o
CM r>*-CM b
CO T -
o o b b
o o
i n 00
o in CM CO
oo oo
" ^ CO
o 0 o (6 CJ) _ o 2 2 0 ro
CO Qi O
•e 2 £ o O
r > * - r > « - o c o c o o o c o i n c M c n c o c M C M T T c p i r i i r i i r i i r i b i r i b i r i
" ^ ^ r ^ C M r ^ C M C M C M • ^ • r ^ b C M b c M C M C M
C M C M T - C O T - C O C O C O
r ''t o CM b -r b CM
o b
CM r-- - ^ CM b -r^
T - C M O C O O C O T - C M
c M c p c D O - ^ o r ^ o C M c o c M i r i - r - ^ i r i b i r i
c o i n ^ i ^ c M r ^ T - r ^
" ^ o o q o o o r ^ c o c M b c o i r i b i r i c o T t c M •«- CM •«- •»- CM T -
r ^ c M C M i n c o c o t o r ^ CM CO CM CM CO T -
CO "^
CO
00
b
CM CM
CO
ai
cvi
•»-
b CM
00 CM
CD •^
r CO CM
CO CO
m -^
in " -
CD
CO CM
CO csi CM
CO
CD T - ^
tJ) r>-:
^
CM
b
CO CM CM
CO
r b
CO ' ^
CO
r> b
in
b
CO CM
b C M C M C M C M C O T - T - ^
O - ^ T - O C M t D C O t J ) C O C O C O C O ^ t C M C M C O
in CO o ^ o ai r-iri ai
in ^ c M c o o o " ^ i n c j ) T r C O C M - ^ C M i n C M C O C O
o o T - ' ^ c j ) i n t D t o o o • ^ c o c o c o r ^ c o t j ) T r
(0 0 3 ja
ti <
c
c q o 3
0
"ro 0
d q o o
0 Ui
3r§ i O CO O
•D C ro I
c o
'•4^
>« ro
0 ro O
ro ^ ^ ro O li- CO m
0 N
128
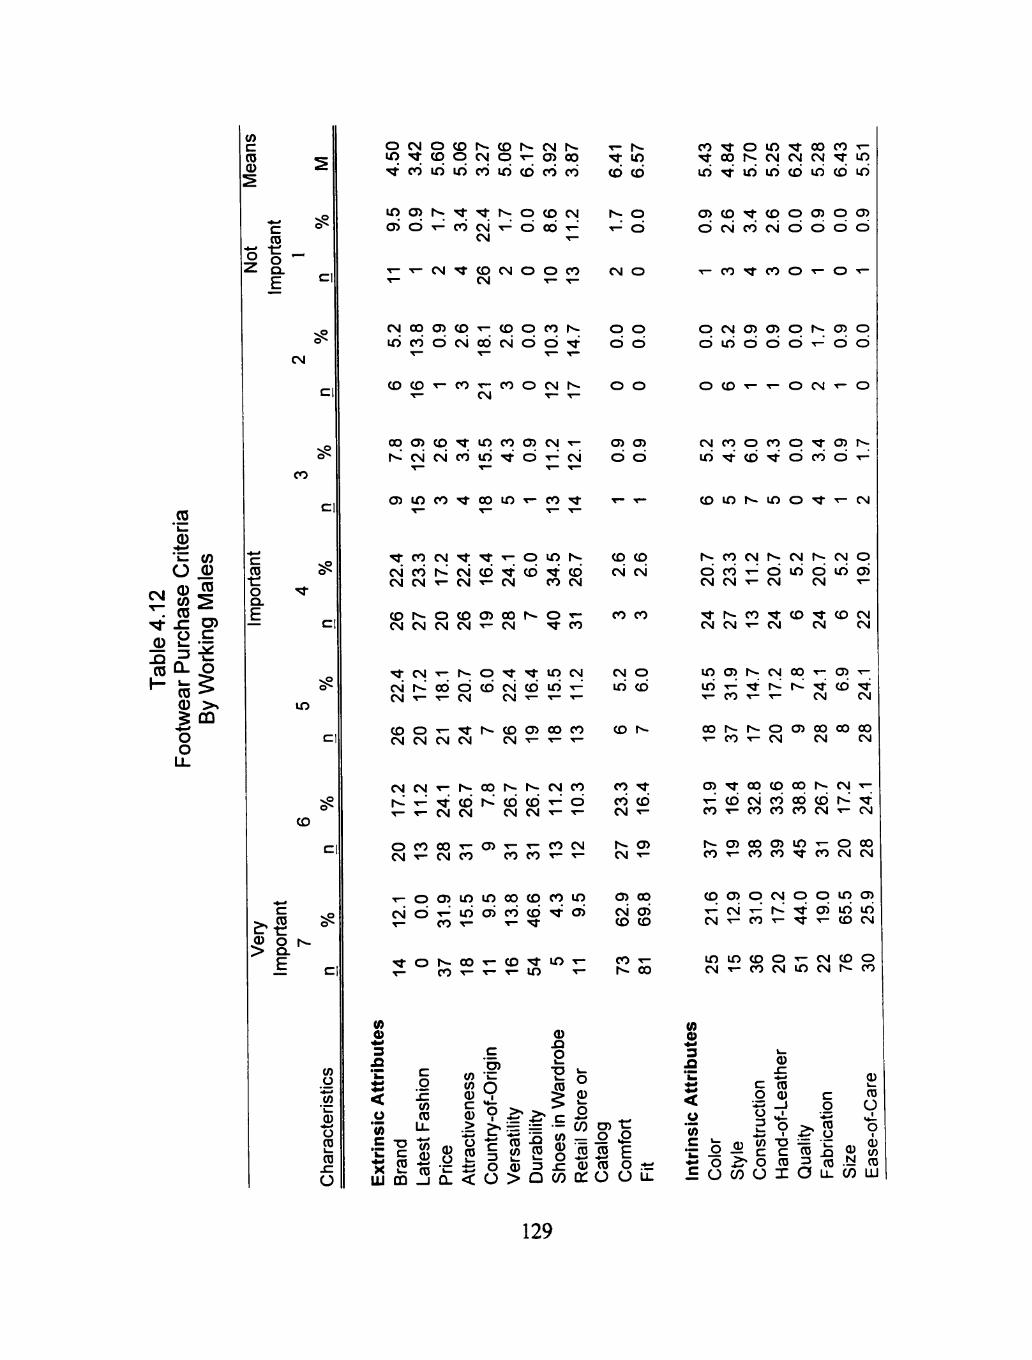
to c ro 0
c ro
£
CD
B o ^
• «5 ^ ^ ^ O) rt^ <^ ^
CD Q - P
0) > s
CM
CO
1 ^ O o
c ro • e o Q .
£
^ o^
i n
CD
5 a^ J i c
to o Ui
'l—
0 o ro ro s: O
o c M o c o r ^ c o r ^ c M r ^ - r - h -i n M ; C p O C M C 3 T - C J ) 0 0 ^ i n ^ c o i r i i r i c o i r i b c o c o <D <D
i n o ) r ^ ^ ' ^ r ^ o c D C M r>»-o b b ' T - ^ b c M ' ^ b b ' ^ -r^ d
CM T -
C M ^ t C O C M O O C O C M O CM T - •«-
C M o c > c n c p T - t D O c o r ^ o o i r i c o b c s i b c M b b T T d o
C D C D - r - C O T - C O O C M t ^ o o T - CM T - T -
o o c n c D ^ m c o c n c M ^ ai ai h . ^ c M C M c o i r i ' ^ b T - ^ C M d d
c j ) i n c o ^ o o i n T - c o ^ •»-•«-
^ c o c M - ^ ^ - ^ o i n h * -c M c o r ^ c M b - ^ b ' t ' b C M C M T - C M T - C M C O C M
c D r > « - o c D C J ) o o r ^ O T -C M C M C M C M T - C M T tCO
•^ CM r^ o "^ "^ i n CM C M r ^ o o o c o c M c o i n T -C M T - T - C M C M - ' - ' ^ - - ' -
c o o T - T r r ^ c D < J ) o o c o CMCMCMCM C M - « - ' « - ' « -
c M C M ^ r ^ o o h - r ^ c M c o r ^ - « - ^ ^ b r ^ b b " « - ^ b T - T - C M C M C M C M T - T -
O C 0 0 0 T - C J ) ' < - T - C 0 C M C M T - C M C O C O C O T - T -
T - o c D i n i n o q c p c o i n c M b " « - b b c o b ' ^ b T - CO • ^ T - " ^
' ^ o r » - o o T - c D " ^ i n , - CO T- r- r- in
(0 0 3
< O
*<« c
X Hi
TJ C ro 00
c g
'sz Ui ro u. * - • to 0
ro
to to 0 c 0
c CJ)
0 O i -
JO
CD CO
CM cvi
CO CO
CM O iri b
CO r^
CO CO CM
r ^ CM
CJ) CM CD
CO
r>^
-^ b
tj)
00 ai to
00
0 o
. > ^ = = - CO D) -c o f roio ^r=22
r ro (0 c T 3 O 0 3 ^ 0 r o o < O > Q C 0 C C O O ro ^ to
c o M - o i n - ^ o o c o T -T j -oor^cMCMCM^in i r i ^ i r i i r i b i r i b i r i
C J ) C O ^ C D O C J ) O C J ) b c s i c o c M b b b b
CO Tt CO o o •«-
o c M C J ) C J > o r ^ c n o d i o d d d - r ^ d d
O CD •«- T- O CM
c M c o o c o o ' ^ c j ) r ^ i r i - ^ b - ^ b c o b - ^
CD in r in o •^ CM
r ^ c o c v j r ^ c M r ^ c M O b c o T ^ b i r i b b b CM CM •«- CM CM •«-
T t h ^ C O ' ^ C O ' ^ C O C M CM CM •«- CM CM CM
incj)r^cM0OT-cj)-<-iriT-^'^tr^r^'^b'^ T- CO T- T- CM CM
o o r > - r ^ o t 3 ) o o o o o o T- CO •«- CM CM CM
CJ)"^oqCOOC)h^CM'r-' b CM CO b b r^ ^
CO CO CO CO CM •«- CM
r>^cj)oot3)inT-ooo C O r - C O C O " ^ C O C M C M
C D C J ) O C M C 3 0 i n f 3 ) •T-^cMT- 'h^Trb i r i i r i C M T - C O T - T J - T - C D C M
i n i n c o o T - c M c o o CMT-cocMincMr^co
(0 0 3
< O
'35 c
0
ro 0
c g o E P
0 o ^ ^ 0 . ^ 0 O CO o
S V 2^ TJ C ro
X
c g "ro o
0 ro
O
ro _ci ^ ro
O u_ CO LU
0 N
0 to ro
129
ease-of-care (93.1%), price (91.3%), fabrication (90.6%), and hand-of-leather
(90.0%). The nine remaining purchase criteria (Intrinsic = 2; Extrinsic = 7) were
rated by a majority of working males, with color (89.7%), construction (89.7%),
versatility (87.0%), attractiveness (85.3%), brand (74.1%), shoes in wardrobe
(65.5%), retail store or catalog (57.7%), and latest fashion (51.7%) being
important, and country-of-origin (56.0%) being not important.
Footwear Consumption Patterns
Footwear consumption data were collected using the footwear
consumption section of the research questionnaire. Participants determined
consumption patterns by responding to six scenarios on a continuum of seven
points.
Working Females
Table 4.13 indicates the footwear consumption patterns of females.
Working females purchased shoes that were basic in color and style (55.4%) and
preferred to have a small number of shoes but of high quality (74.2%). The
largest percentage of females could not decide between versatility and durability
(42.4%), comfort and attractiveness (36.0%), quantity and price (26.6%), and
quantity and usage (22.3%).
130
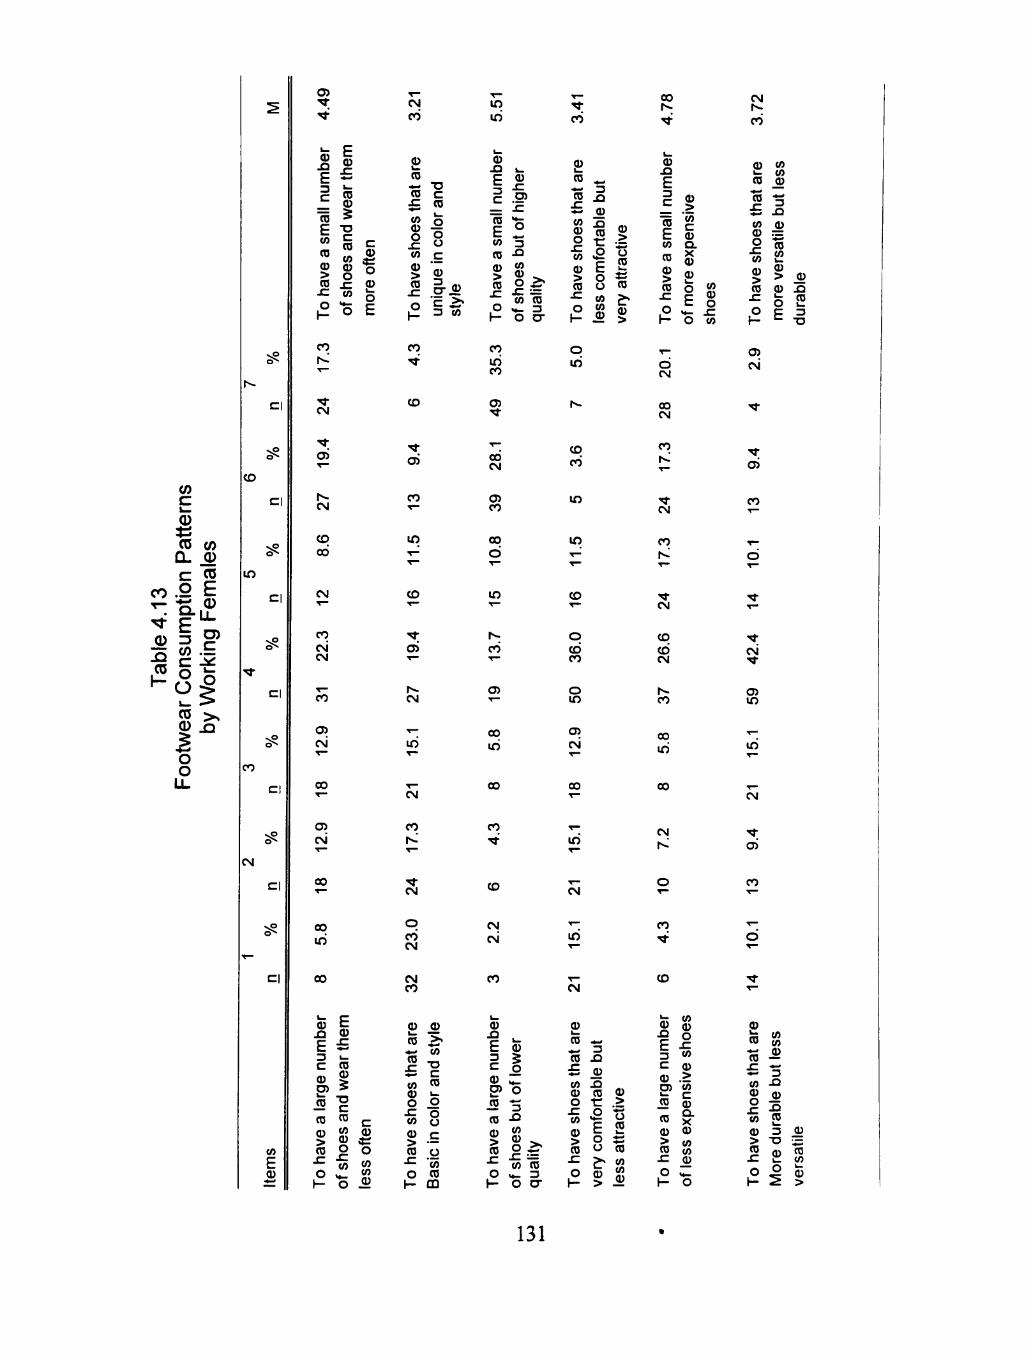
c 0
CD (/) Q_ ^ c «5
0 § g 7= CO . E
CD o ^
0 J3
O O
U.
C I
CD
C I
i n
C I
C I
CO
CM
C I
Ui E 0
fj)
0
CM
C O
CM CM
CO
O) CM
CO
CM CO
E 3 C
all
LUS
ve
a
CO x: o 1-
co r^ ' '"
• ^
CM
' * CJ)
r^ CM
CO 00
SZ
^ CD 0 §
TJ C CD
oe
si
JC Ui
o
c
ofte
0 b .
o E
CD ^ • r f
CD ^ Ui
hoe
ve
s
CD . C
o
co "^
CO
'4-CJ)
CO • ^
in •r-
TJ C CD
colo
r
,c 0 3 O"
uni J?
sty
CO
CJ)
CM
i n
CM
en CM • * "
00 • ^
CO iri
00
0 .a E 3 C 0
_ro to 0 > to
j =
o t -
E 0 £ ^ to 0 5
• o c to CO 0
o sz Ui v^ o
c
fte
o CO Ui
2
CO
r^ ' "
"^ CM
O CO CM
CM CO
0 ^ to
"to £
(0 0 o s: Ui 0
> CD .c o 1-
2 (0
TJ C CO k_
o
col
_c o 'to 0 CQ
m iri
0 Si I -
(0 3 CD -Q
> §> . •f to 0 O . ^ 3
I - O CT
CO iri CO
CJ)
00 CM
cn C O
CO
d
lO
r^ CO
cn
00
iri
00
CO
to
CM
CM
CO
0
Is i i D ) o
CO
0
i 2 3
CO
•^ Ui (0 O >_ 3
I - O CT
CO
0 k_
0 • -0 ^ £ (U Oi "^ -.
§ ^ . i - 1 1 0 c ^
o 0 (0 > •
0
P « S
O iri
CO
CO
i n
in
CD
CO CO
o lO
en CM
oo
i n
CM
in
CM
0 0 «.. 4.^ 3 0 Si
Ui 0 O
.c CO 0 > 0
o
.Q CD 0
•c .> O E o o
0 > ^
o 0
0 Ui Ui 0
oo r»-
0 Si
E 3 C
"CD
E (O CD 0 > 0
00 CM
CO
CM
CO
CM
CO
<6 CM
CO
00
iri
00
CM
CO
CO
0 >
' <0 c 0 a. X 0 0 O Oi
o ^ ° ,C5 H- JC \ - O Ui
O CM
CM
CO
tu CO kl (O 0 _a)
1 = £ Si Ui <U 0) = o s: Ui 0
>
CJ) CM
CJ)
CO
CM
CJ) in
i n
CM
ai
CO
0 (O k. 0 > 0
0 0 .n
o 3 TJ
k .
0
.n E 3 C (U O) ^ JO CO 0 > 0
.c o
(0 0
o .c (0 0
siv
c
xpei
0) (O (O ^
*o
0
0
0
£ (0
cu
she
0 > 0
.c o 1-
(0 (0
_ 0
^ 3
cu
rabl
i
3 T3 0 k . O
_a) •— CO
<o
ver
131
Working Males
Footwear consumption patterns of males (see Table 4.14) indicated they
preferred to have a small number of shoes that had quality (75.9%), were basic
in color and style (68.9%), and were worn more often (59.5%). The largest
percentage of working males could not decide between versatility and durability
(37.0%), comfort and attractiveness (29.3%), and quantity and price (25.0%).
Footwear Characteristics
Tables 4.15 and 4.16 describe 17 of the footwear characteristics for
working females and working males. Included are ten intrinsic characteristics
(i.e., conservative versus casual, comfort, color, quality, breathabllity, care,
natural leather, touch construction, and fit) and seven extrinsic characteristics
(i.e., fashion, contemporary versus traditional, price, attractiveness, versatility,
brand, and durability).
Working Females
In describing leather dress shoes most often worn for business-related
activities, females stated their feelings were related to 70% of the intrinsic and
57.1% of the extrinsic characteristics. The intrinsic were fit well (82.0%), well
constructed (75.5%), comfortable (74.9%), high quality (73.4%), soft to the touch
(71.2%), basic in color (69.0%), and easy to care for (66.2%). The extrinsic were
132
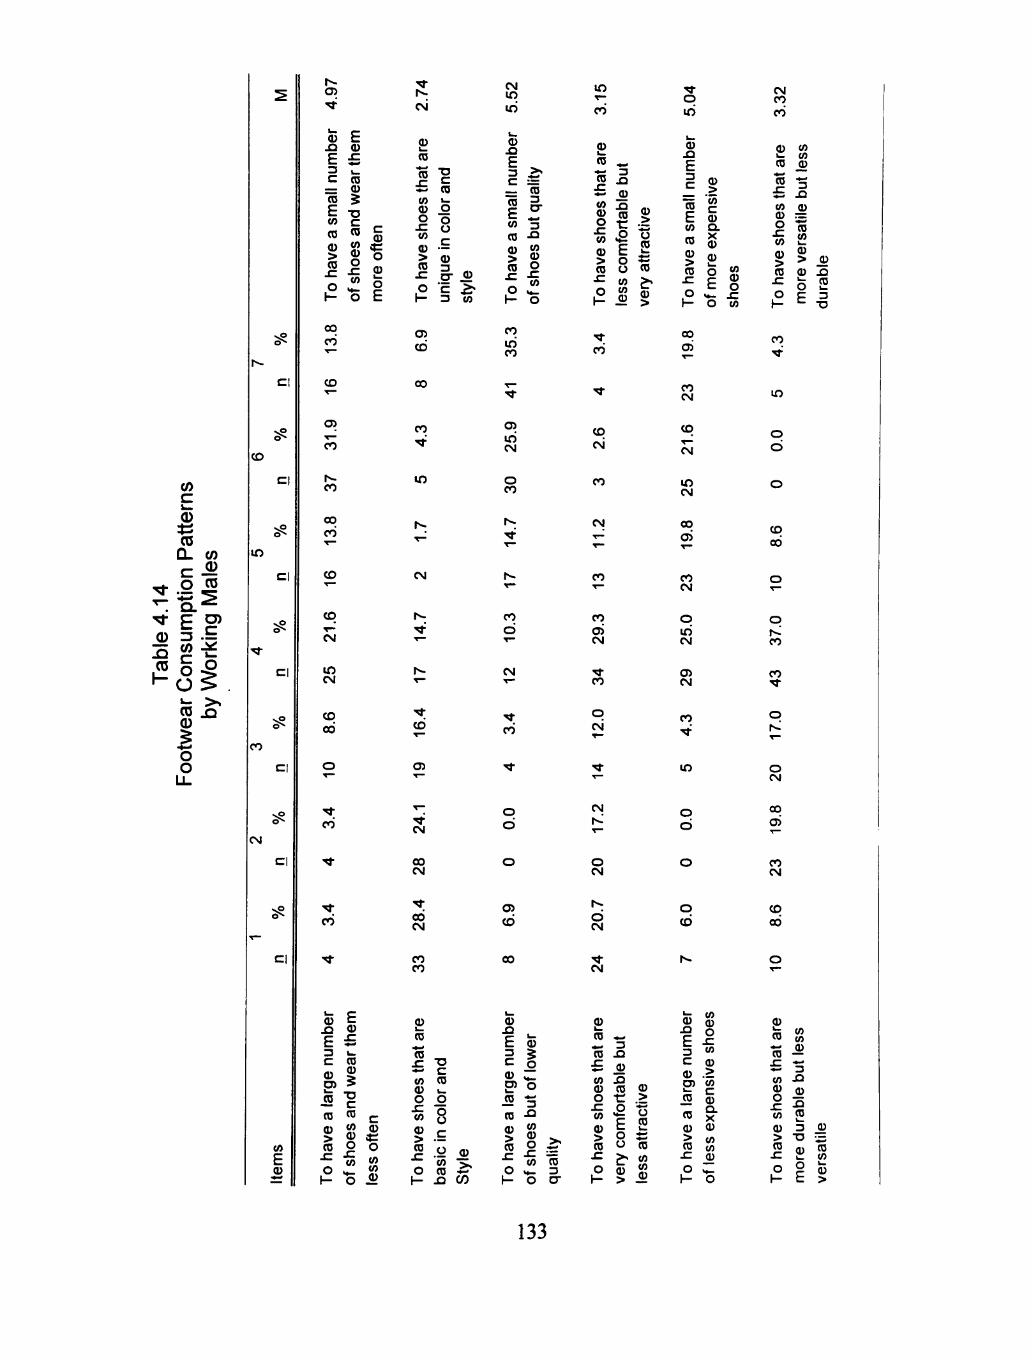
- * •>£.
CD
rns
atte
o
nP
la
les
Con
sum
W
orki
ng
i= >» CD j a 0 5 o o U-
r>-
C D
i n
•^
CO
CM
^
^
C I
>5
C I
C I
-wO o^
C I
C I
C I
C l
CO E 2
ber
4.9
7
E
alln
u
To h
ave
a s
m
13.8
CO ' ' "
31.9
r^ CO
13.8
CO
CD
^-CM
tn CM
8.6
o
4
4
3.4
1
CO
ber
4
E 3 C
rge
2 0 0 > 0 s: o 1-
E 0
j =
wear
of sh
oes
an
d'
E 0
rth
CO 0 5 c CO
CO 0
o sz Ui o
more
often
c 0 «r o CO (0
2
re
2.7
4
0
sth
al
To h
ave
shoe:
6.9
00
4.3
m
1.7
CM
r^ • ^
r*-' "
16.4
cn
.4
28
24.1
1
00 CM
ire
33
CO
"co s:
es
ti
sho
0 > 0
JC
o H
ran
d
uniq
ue
in c
olo
• o
ran
colo
c
asi
c
Si
Sty
le
tyle
CO
mbe
r 5.5
2
To h
ave
a s
mall
nu
35.3
^
25.9
o CO
14.7
r^
CO
d
CM • ^
3.4
'«t
9
G
G.G
b
ber
8
E 3 C
rge
2 CD
0 > 0 .c o 1-
ualit
y of s
hoes
but
q
0
o >*-o
but
CO
s >. o . ^ CO CD
««- 3 O CT
e
3.1
5
0
To h
ave
shoes
that
3.4
• ^
2.6
CO
11.2
CO
CO O) CM
CO
12.G
• *
.7
2G
17
.2
1
o CM
ire
24
0 s:
es
t sh
o
0 > 0 sz o y-
^.
lie b
u
less
com
fort
ab
but
able
im
fort
o o
ery
>
very
attra
ctiv
e
0
ract
iv
^•^^ CD
less
ler
5.G
4
ill n
umb
To h
ave
a s
ma
19.8
CO CM
21.6
i n CM
19.8
CO CM
O
iri CM
CJ) CM
4.3
i n
GG
0
G
b
ber
7
E 3 C
rge
JD 0 0 > 0
SZ
o \-
0 >
'Jo
of m
ore
exp
em
shoes
shoes
0
nsiv
xp
ei
0 (0 (0
2 "o
e 3.3
2
CD
that
To h
ave
shoes
4.3
i n
G.G
o
8.6
o
p rv! CO
CO • ^
17.G
o
6
23
19.8
2
00
ire
10
(0
CD . C
es
t sh
o
0 > 0 sz o h-
(0 CO CU
butl<
m
ore
vers
atil
e
tn
les:
.*.* 3 Si
rabli
3 TJ
more
dura
ble
(U
til
CO
ers
>
133
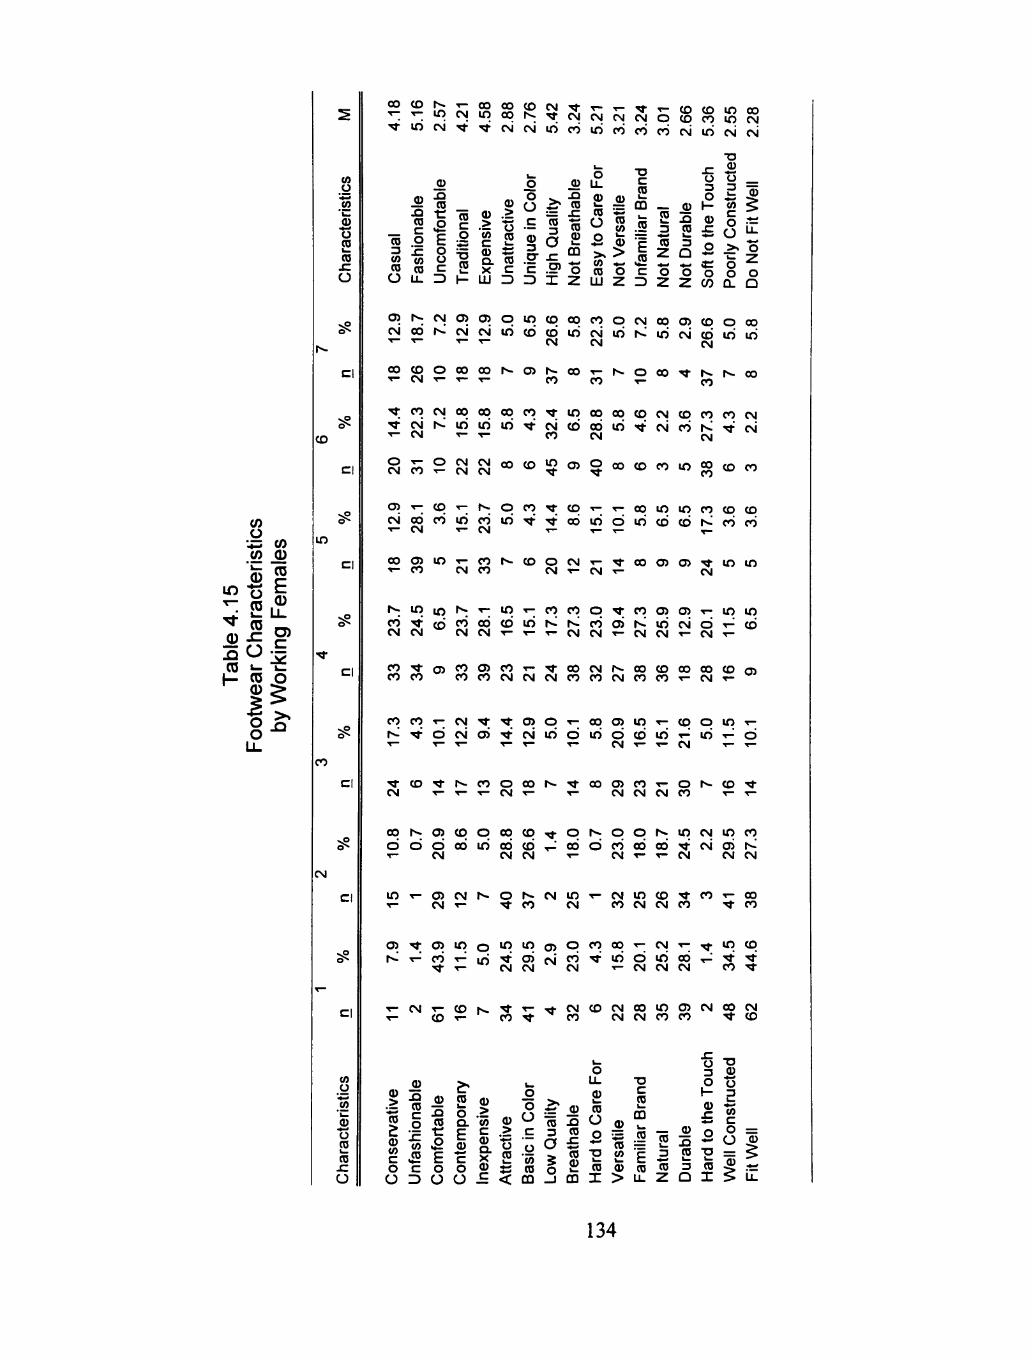
in —
• " ^
ible
CO 1—
(0 O
•^ CO CO 0
0 g
k- Ll_ (0
I - ^ CD O
1 2 -Q o
CO
"OT ' k _
u 0 k. 0 sz O
CD
i n
CO
CM
OT O
"OT
2 "o 0 0 sz O
^ ^ [ n j ; i g S f e ^ ^ j ; i ^ S 5 § j o i n « ' ^ m c M ^ T r C M C M l r i c O l r i c O C O C O C M l r i c M C M
0 >
"CD
0
jO) o
o ^ Ll_
•Q 2 0)
TJ C 0
0 .> ^ = -c 0 -g ^ ^ _ . ^ B S § 0 O S
• ^ . | E . 2 ^ 2 « O £ £ 0 5 - c S = 5 $ « n - ^ C Q > , >
= CQ _ 0
_ 3 "cD
0 D. 0 .S" -c ~ tn Z^ c c .S' o ro o
OT (o U 0 0 ^ — '^ - — — w kU « O l i . Z ) | - U j : 3 D X 2 U J Z
.5 1 2 c Z)
o 3 O
0 »-Si 0
0 sz
Z CO
TJ
2 "o _
IS O >% O
o '^ o o
CL Q
c j ) r > - ; C M O ) c 3 ) p i n c q o q c o o c M o q o ) C D o c o c M o o i > ^ c M C M i r i b b i r i c M i r i r ^ i r i c M b i r i i r i •^ ' " • « " •^ t M CM CM
o o c o o o o o o r ^ O ) r ^ o o ^ r ^ o o o T t i s . r ^ o o T - C M T — T— T - CO CO T - eo
• ^ c o c M o q o q o q c o " * i o o o o o c D C M t D c o c o c M " ^ c M r ^ " i r i i r i i r i ^ c M b o 6 i r i ' < t c M c o r « ^ " « t c M T - CM r - T - CO CM CM
° ; ; ° C M C M ° ° ^ ! $ ° * § " ® ' * 5 « ' ? 8 ® ^
P ' « - : P ' « - : r ^ _ p c o ' < r p T - T - o q i o i n c o p c D c M o d c o i r i c o i r i ^ ^ o c i i r i d i r i b b i ^ c o c o
o o g ) i n T - c o r * - c D o c M T - ' ^ o o o ) 0 ) ' ^ m i o ^ - C O CMCO C M ^ - C M T - CM
r » ; i n i o r * > . ' r ^ i n T - c o c o p ^ c o o ) 0 ) ' r - i o m c o ^ ( r > c o o d b i r i r > ^ r ^ c o o ) r ^ i r i c M d ^ b CMCM C M C M T - T - T - C M C M T - C M C M ^ C M T -
C O ' ^ C J ) C O O ) C 0 T - ' ^ 0 O C M h - 0 0 C D 0 0 0 O t D c 3 j c o c o C O C O C M C M C M C O C O C M C O C O T - C M T -
C 0 C 0 ' « - ; C M - ^ ' * P P ' > r - 0 0 t J ) i n T - C 0 O l 0 ' « -i ^ ^ d c M O J ' ^ c M i r i d i r i d b i r i ' r ^ i r i - r - ^ d
• ^ c D ' ^ i ~ ^ c o o o o r > » . ' ^ o o c j ) c o T - o r ^ C D ' * CM T - T - T - C M T - •»- C M C M C M C O T - T -
o q r « - p p p c q t D - ^ o r < - o o h - ; i o c M i n c o d d d o c ) i r i o d b ^ o 6 d c o c 6 o d ^ c M C J ) i ^ T - CM C M C M • « - C M T - T - C M CMCM
i n ' « - c j ) C M r ^ o r ^ c M i n T - r M i n c D ' a - c o T - o o •«- C M ^ -^CO CM C O C M C M C O ' ^ C O
C J ) ' ^ 0 ) l O o " ' 5 ' ^ C J ) P C O ° 9 " ^ . ^ • ^ ' ^ " ^ * P r ^ T - ^ c o r - ^ i o ' ^ c j i c M C ^ ' ^ i r i d i r i o d . r - ' ' ^ ' *
""t •«- CM CM CM CM CM CM CO • *
C M t - C O N . ^ T - ' * C M C O C M 0 0 i n C J ) C M 0 0 C M C D T - C O ' ^ C O C M C M C O C O • ^ t o
2 Si 0 2 ^
sz Ui J2 c 2 o c
c ^ o .> O CO Q. OT -
"C p C . > C 3 £: 0 •« —
0 Qu'Ui 0 ' - ' cz Si O
o U_ TJ
c 0
0
0 CD
E c o o
^ ^ O = CD -m
0 e 0 o 2 0 0 C D 0 V^ fc_ s^ ,^ — ,^^ \U U ^ _ ^ ,y
C J ^ O O ^ < D Q _ J C Q l >
o 3 o H 0
0 o Si -^ 0 "0 3 0 Q X
T3 2 "C 3 "25 c o = O 0
134
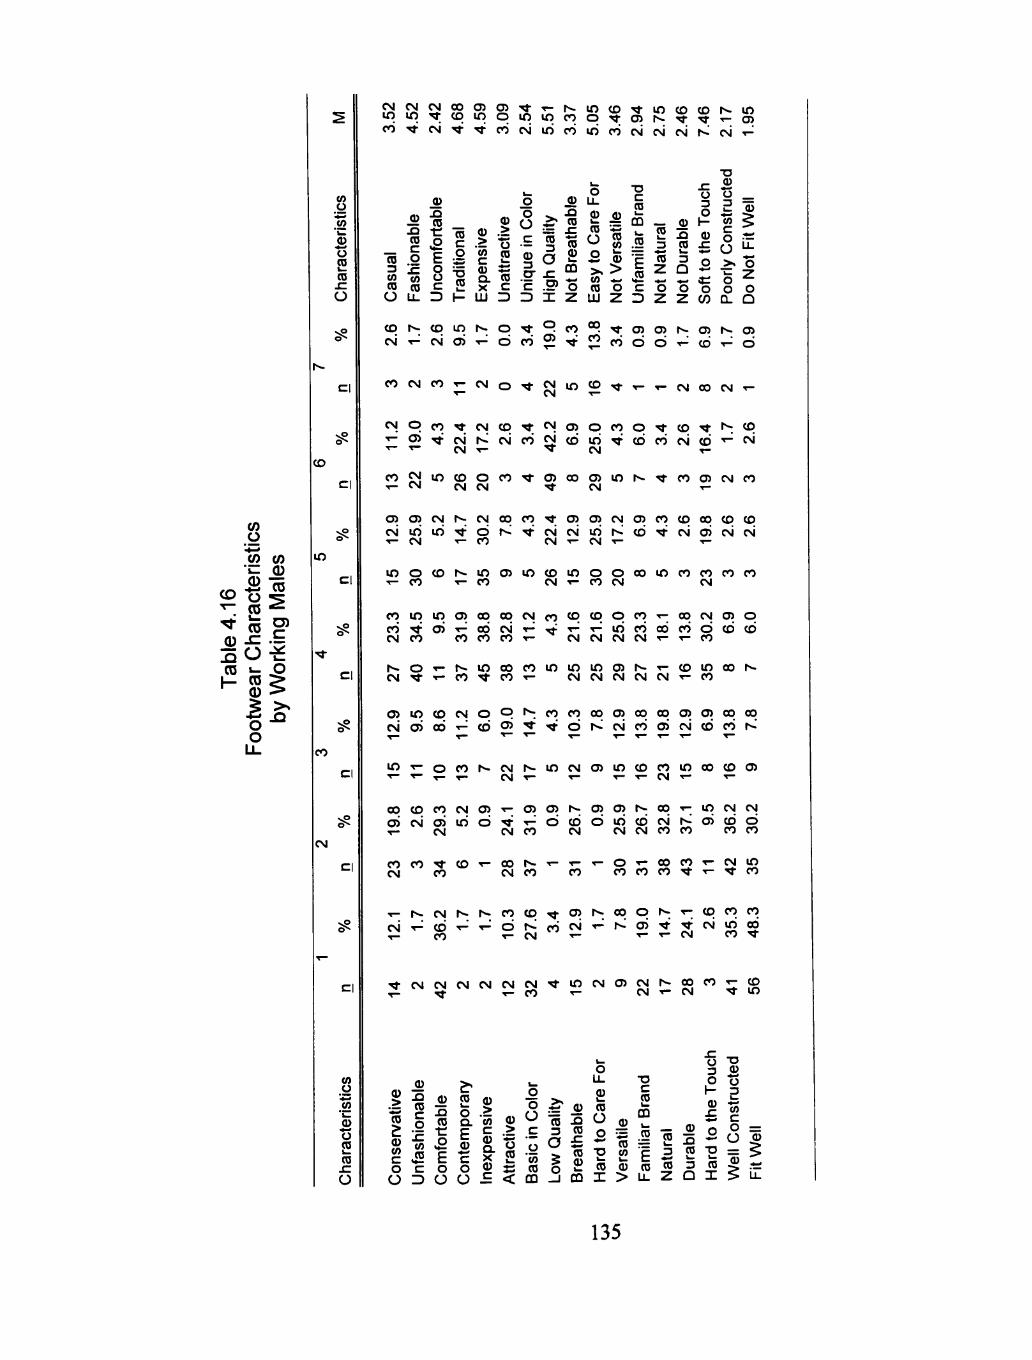
C M C M C M 0 0 O ) O ) ' ^ ' T - r ^ i n t D ' < S - l O t O t D N . l O
i n i n ^ p i n p i n i q c o c D ^ r o h - ' ^ ^ I r ^ a ) C O T f C M ' ^ T r c O C M l r i c O l r i c O C M C M C M h ^ C M ' r - ^
OT
. « ' ^ 0 "o 0 k-0 sz O
0 o c ••
o J> T> C 0
- , O ^ ^ 0 0) ±r
0 Q ^ r o } - : = C D _ CU
C .> t ) - § 0 ^ OT .2 3 0 o 1 I ^ 2 ^ d Q. 0 X C
0
0 CO c nJ
CO 2 0
c -c " Sr - C .5? O CD p
E i 2 z: c o
O L i . D | - l U I 3 Z ) X Z U J 2 3 Z 2
o 3 O
0 1-.Q CU 0 SZ
CO
TJ 0
"5 _
>. "o
o o Q.
o Q
CO CM
r ^ c D i o r » . 0 ' ^ P c o ° ? ' < i t c j ) C 3 ) r ^ c j ) i ^ c j ) CM tJ) •«- O CO CJ) CO CO o o CO
CO CM CO CM O Tt CM m o ^ CM 00 CM T-
CD
CI
C M p c O ' « t C M p ' ^ C M < 3 ) O C O O ' ^ C D ' ^ ' ^ P T - C J > - ^ C M r ^ C M C O C M c D l r i ' ^ C D C O C M t D ' ^ C M "^ •«- CM T- '^ CM T-
C 0 C M i 0 C D O C 0 - ^ 0 ) 0 0 C J ) l 0 r ^ ^ C 0 C 3 ) C M C 0 T- CM CM CM •* CM T-
co
.a CD
CO o CO
'l^
0 t5 CD
CD x: O k_ CD 0 O O
(0
CD
C
o
Si
in
CO
p p c M h ~ C M o q c O ' * p p c M p c o p o q c o t o c M i r i i r i ' ^ d r ^ ' ^ c M C M i r i r > - ^ t D ^ c \ i o ) C M C M 1 - C M • « - C 0 C M - « - C M i - T-
i n o c D » ^ i n o ) i n c D i o o o o o i n c o c o c o c o • « - C 0 T - C O C M ' « - C O C M CM
c o i n i r ) C J ) o o o q c M c o p p p c ? ' ^ o o c M p p c o ' ^ t j i ' T ^ o o c M ' T ^ T f T ^ T - ^ i r i c o o d c o d c d c D CMCO C O C O C O T - ^ C M C M C M C M T - T - C O
r - . 0 ' « - r > ^ i n o o c o m i n i o c 3 ) r > - ' « - t o i n o o r » -C M ' ^ T - C O ' ^ J - C O T - C M C M C M C M C M r - C O
o i n p c M o P ' ^ . c o c o o o p o q o q p p o q o q c M o i o d - ' - c D d ' ^ ' ^ d r ^ c M c o d c N i c D c o r ^ '
i n ' « - o c o h - c M r « - i n c M O ) i n c D c o i n o o c D O )
CM
CI
o o c D c o c M O ) ' « - 0 ) 0 ) r « « - p p r > * ; o q ^ i o c M C M o i c M o i i r i d ^ ^ d d d i r i d c M r ^ d c o d ^ ' • ^ C M C M C O CM C M C M C O C O C O C O
CO CO • ^ CD CM CO
0 0 r*-. •«- •« -CM CO CO
o •«- oo CO T- CM i n CO CO CO ""t •«- ' ^ CO
T - h - c M r ^ h - c o t D ^ p r ^ o q p r ^ ^ p c o c o C M ' r - ^ C D ' « - ' » - ^ d l ^ C O C M ' « - I ^ C J ) ' ^ ' ^ C M l r i o O • ^ CO T - C M •«- T - T - C M C O ^
CI T j - C M C M C M C M C M C M " * i n C M O ) C M I ^ C 0 C 0 T - ^ .,— • ^ T— CO • ^ C M T - C M • ^ m
u , o "OT
2 "o 0 k -
0 sz O
« I c 2
0 0 2
.> -S .SJ £ o Q.
E 0
2
o
T3 C 0
.c o 3 o I -cu
. c > o ^^ 0 0 2 ^
• O T 0 ^ " C D - Q ^ 0 ™ „, ^
C . > C 3 0 o i i 0 f f l i ? O
*^ " 0 -JS
i> o X) 0 TJ
o c o o 0 s s 0 o » - i S . S ' * ° 5 O ^ O O . E < C D _ l C D X > U . Z
TJ 0 "tS 3
"OT
c o = O 0 "0 ^
135
durable (74.2%), fashionable (69.1%), attractive (67.7%), and versatile (59.7%).
Working females did not express exact feelings related to three intrinsic
characteristics (i.e., conservative versus casual, not breathable versus
breathable, and not natural versus natural) and three extrinsic characteristics
(i.e., contemporary versus traditional, inexpensive versus expensive, and
unfamiliar brand versus familiar brand).
Working Males
In describing leather dress shoes most often worn for business-related
activities, males stated their feelings were related to 80% of the intrinsic and
42.9% of the extrinsic characteristics. The intrinsic were fit well (86.3%), well
constructed (85.3%), high quality (83.6%), basic In color (74.2%), comfortable
(74.1%), natural (67.3%), easy to care for (64.7%), and breathable (49.9%). The
extrinsic were durable (74.1%), familiar brand (59.5%), and versatile (46.6%).
Working males did not express exact feelings related to four extrinsic
characteristics (i.e., unfashionable versus fashionable, contemporary versus
traditional, inexpensive versus expensive, and unattractive versus attractive) and
two intrinsic characteristics (i.e., conservative versus casual and hard to the
touch versus soft to the touch).
136
Personal Characteristics
Personal information was collected from female and male respondents on
(a) sex, age, marital status, education, income, and ethnic background, (b) family
size and number of children, geographic region, and city size, and (c) current
employment of adults in the home, present employment status, occupational
category, employment orientation, and length of time not employed. See Tables
4.17 and 4.18.
Working Females
Table 4.17 describes the personal characteristics of the working female
respondents. A majority of females were 36 to 55 years old (68.3%) with a mean
age of 43.9 years. The highest percentage was married (43.9%), with 23.0%
divorced and 20.1% single, never married. They were college graduates (28.1%)
or had some college (24.5%), and the highest percentage (48.9%) had
household incomes between $35,000 and $74,999. Most (84.2%) working
females were Caucasian, Non-Hispanic.
The family size included two persons (34.5%) or one person (29.5%). A
majority (69.8%) of the females did not have children living at home. Residence
was in urban areas (58.9%), primarily in three regions: Midwest (30.2%),
Northeast (29.5%), and South (18.7%).
137
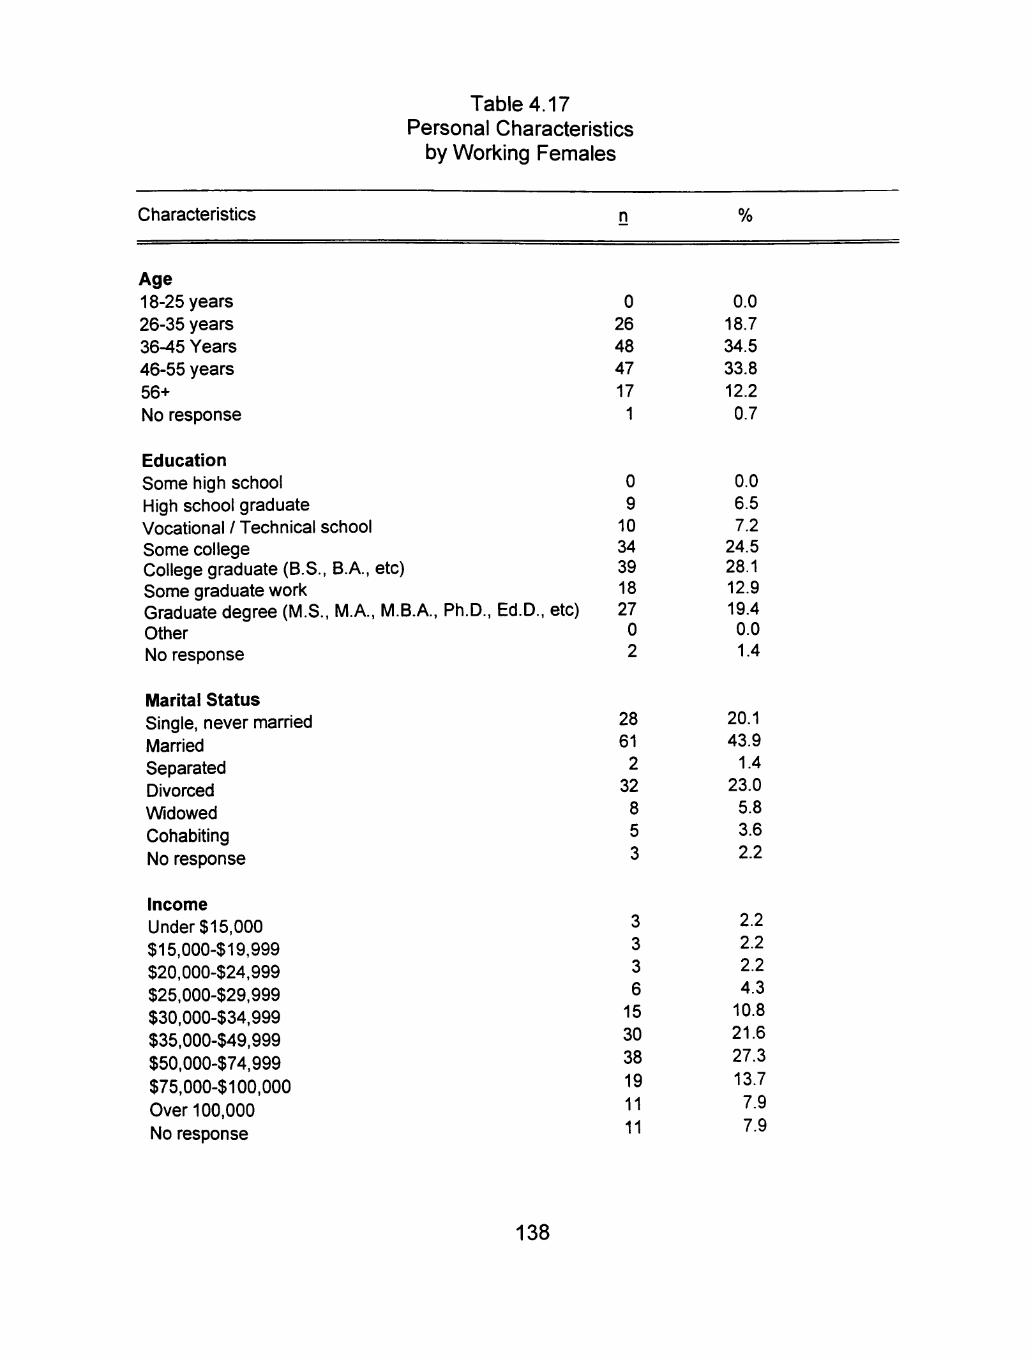
Table 4.17 Personal Characteristics
by Working Females
Characteristics n %
Age 18-25 years 26-35 years 36-45 Years 46-55 years 56+ No response
Education Some high school High school graduate Vocational / Technical school Some college College graduate (B.S., B.A., etc) Some graduate work Graduate degree (M.S., M.A., M.B.A., Ph.D., Ed.D., etc) Other No response
Marital Status Single, never married Married Separated Divorced Widowed Cohabiting No response
Income Under $15,000 $15,000-$19,999 $20,000-$24,999 $25,000-$29,999 $30,000-$34,999 $35,000-$49,999 $50,000-$74,999 $75,000-$100,000 Over 100,000 No response
0 26 48 47 17 1
0 9 10 34 39 18 27 0 2
28 61 2 32 8 5
3
3 3 3 6 15 30
38
19
11
11
0.0 18.7 34.5 33.8 12.2 0.7
0.0 6.5 7.2 24.5 28.1 12.9 19.4 0.0 1.4
20.1 43.9 1.4
23.0 5.8 3.6 2.2
2.2 2.2 2.2 4.3 10.8 21.6
27.3
13.7
7.9
7.9
138

Table 4.17 (cont.)
Characteristics n %
Employment Status Full-time employee Part-time employee Full-time homemaker Full-time student Unemployed Retired
First Job Stature Yes No No response
Current Occupation Professional/Technical Manager/Administrator Sales Worker Clerical Worker Crafts Worker or Machine Operator Full-time Homemaker Full-time Student Service Worker Government or Military Worker Self-employed Other No response
Employment Orientation Career-oriented Just-a-job Plan-to-work Stay-at-home No response
112 24
0 0 1 2
8 127 4
71 28 8 14 2 0 0 8
3 0 4 1
104 16 16
2 1
80.6
17.3 0.0 0.0 0.7 1.4
5.8 91.4 2.9
51.1 20.1 5.8 10.1 1.4 0.0 0.0 5.8
2.2 0.0 2.9 0.7
74.8 11.5 11.5 1.4
0.7
139
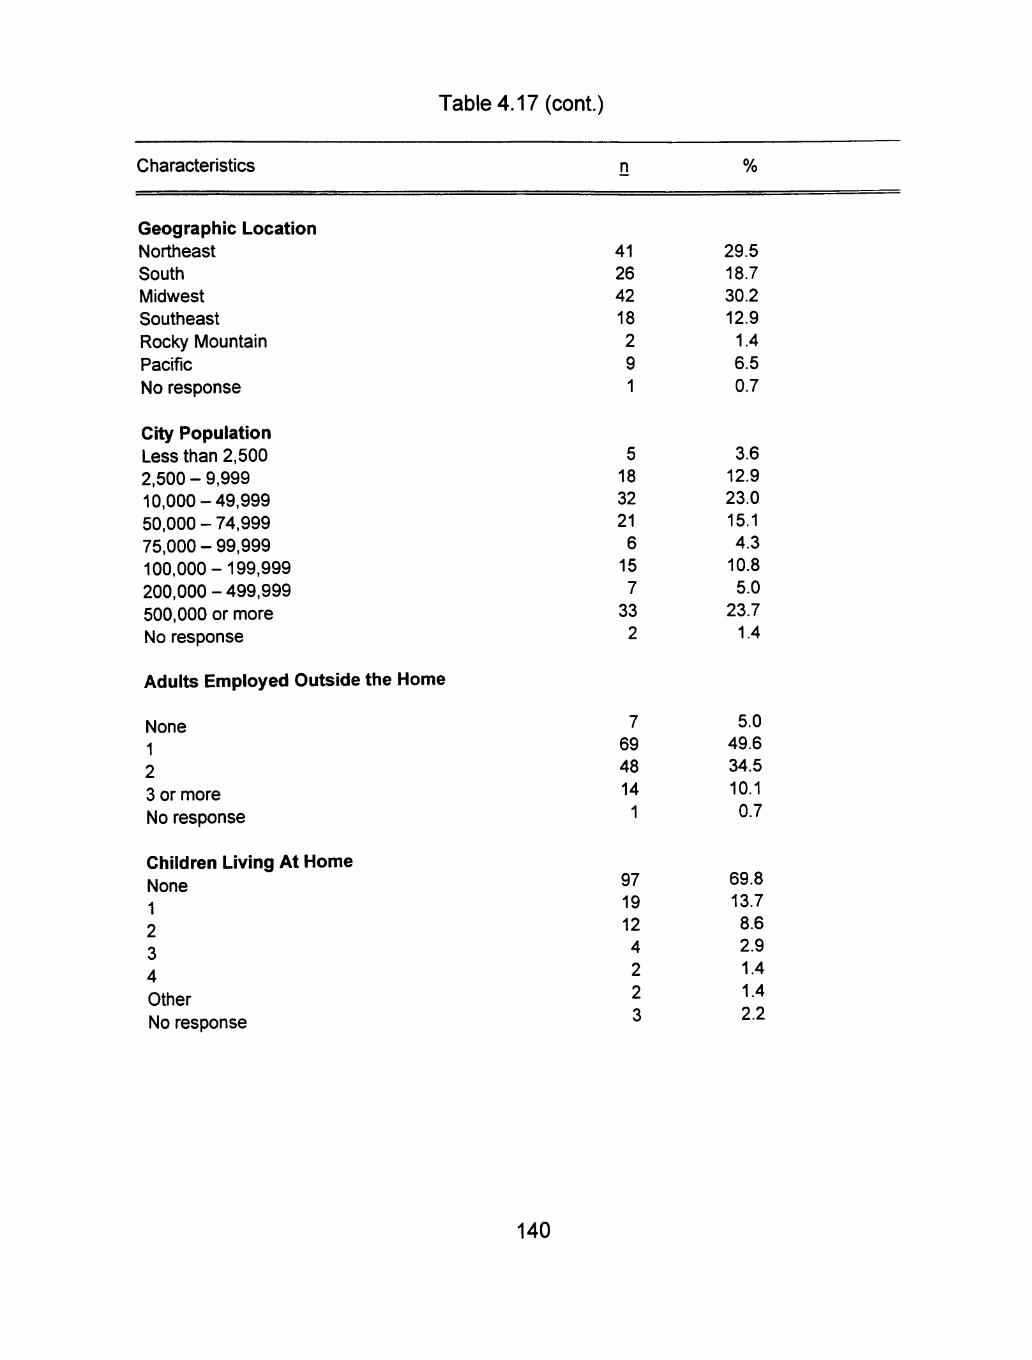
Table 4.17 (cont.)
Characteristics n %
Geographic Location Northeast South Midwest Southeast Rocky Mountain Pacific No response
City Population Less than 2,500 2,500 - 9,999 10,000-49,999 50,000-74,999 75,000-99,999 100,000-199,999 200,000-499,999 500,000 or more No response
Adults Employed Outside the Home
None 1 2 3 or more No response
Children Living At Home None 1 2 3 4 Other No response
41 26 42 18 2
9 1
5 18 32 21 6 15 7
33 2
29.5 18.7 30.2 12.9 1.4
6.5 0.7
3.6 12.9 23.0 15.1 4.3 10.8 5.0 23.7 1.4
7 69 48 14 1
97 19 12 4
2
2 3
5.0 49.6 34.5
10.1 0.7
69.8 13.7 8.6 2.9 1.4
1.4 2.2
140
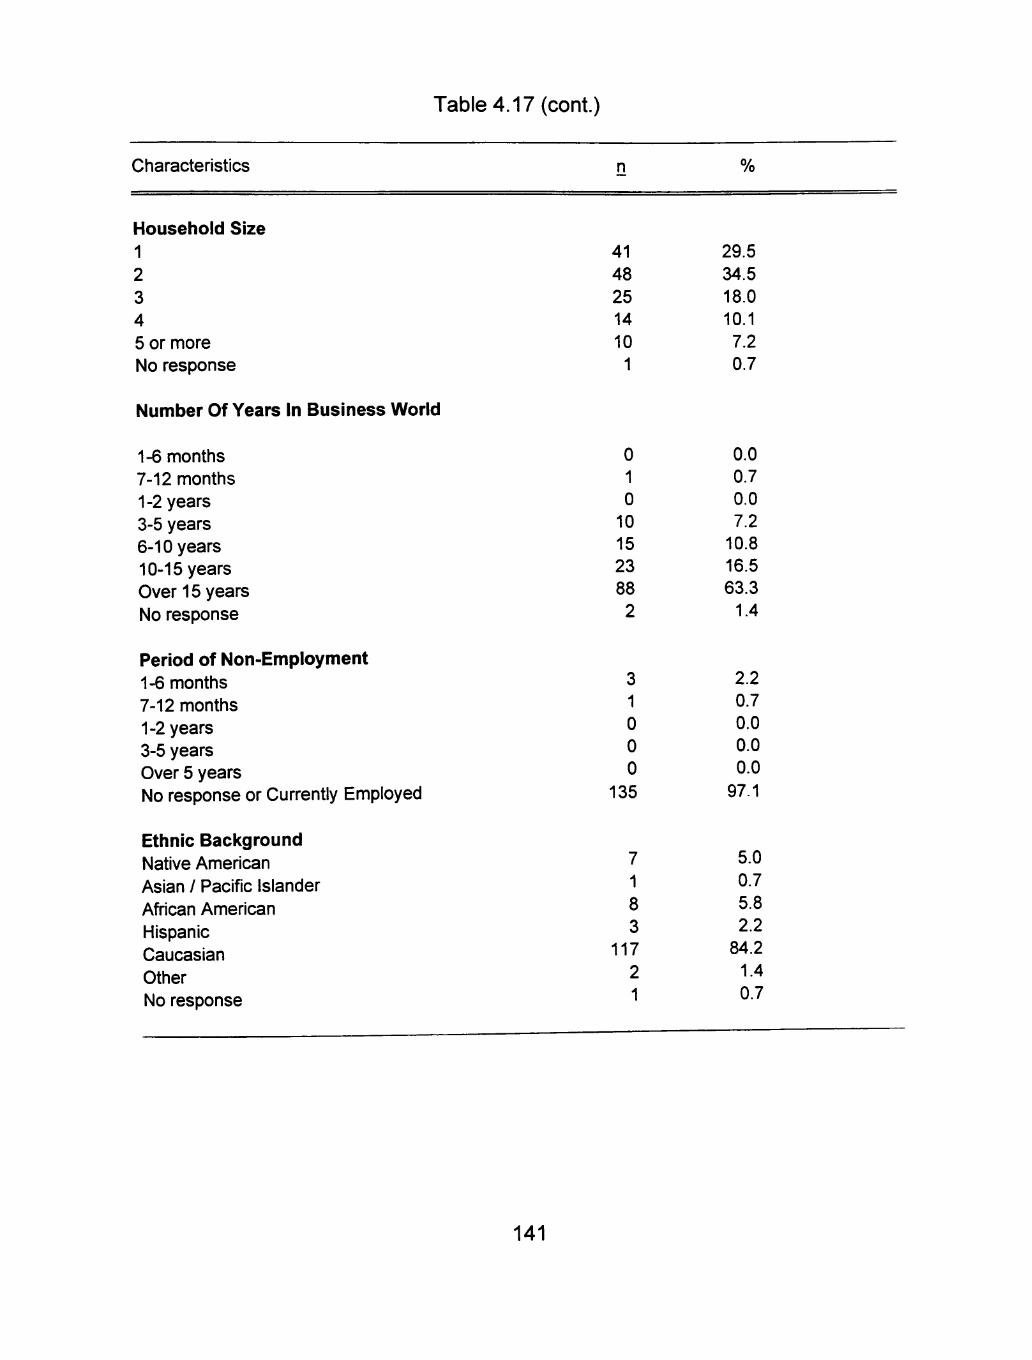
Table 4.17 (cont.)
Characteristics n %
Household Size 1 2 3 4 5 or more No response
Number Of Years In Business World
1-6 months 7-12 months 1-2 years 3-5 years 6-10 years 10-15 years Over 15 years No response
Period of Non-Employment 1-6 months 7-12 months 1-2 years 3-5 years Over 5 years No response or Currently Employed
Ethnic Background Native American Asian / Pacific Islander African American Hispanic Caucasian Other No response
41 48 25 14 10 1
29.5 34.5 18.0 10.1 7.2 0.7
0 1 0 10 15 23 88 2
3 1 0 0 0
)yed 135
7 1
8 3
117
2 1
0.0 0.7 0.0 7.2 10.8 16.5 63.3 1.4
2.2 0.7 0.0 0.0 0.0
97 1
5.0 0.7
5.8 2.2 84.2 1.4 0.7
141
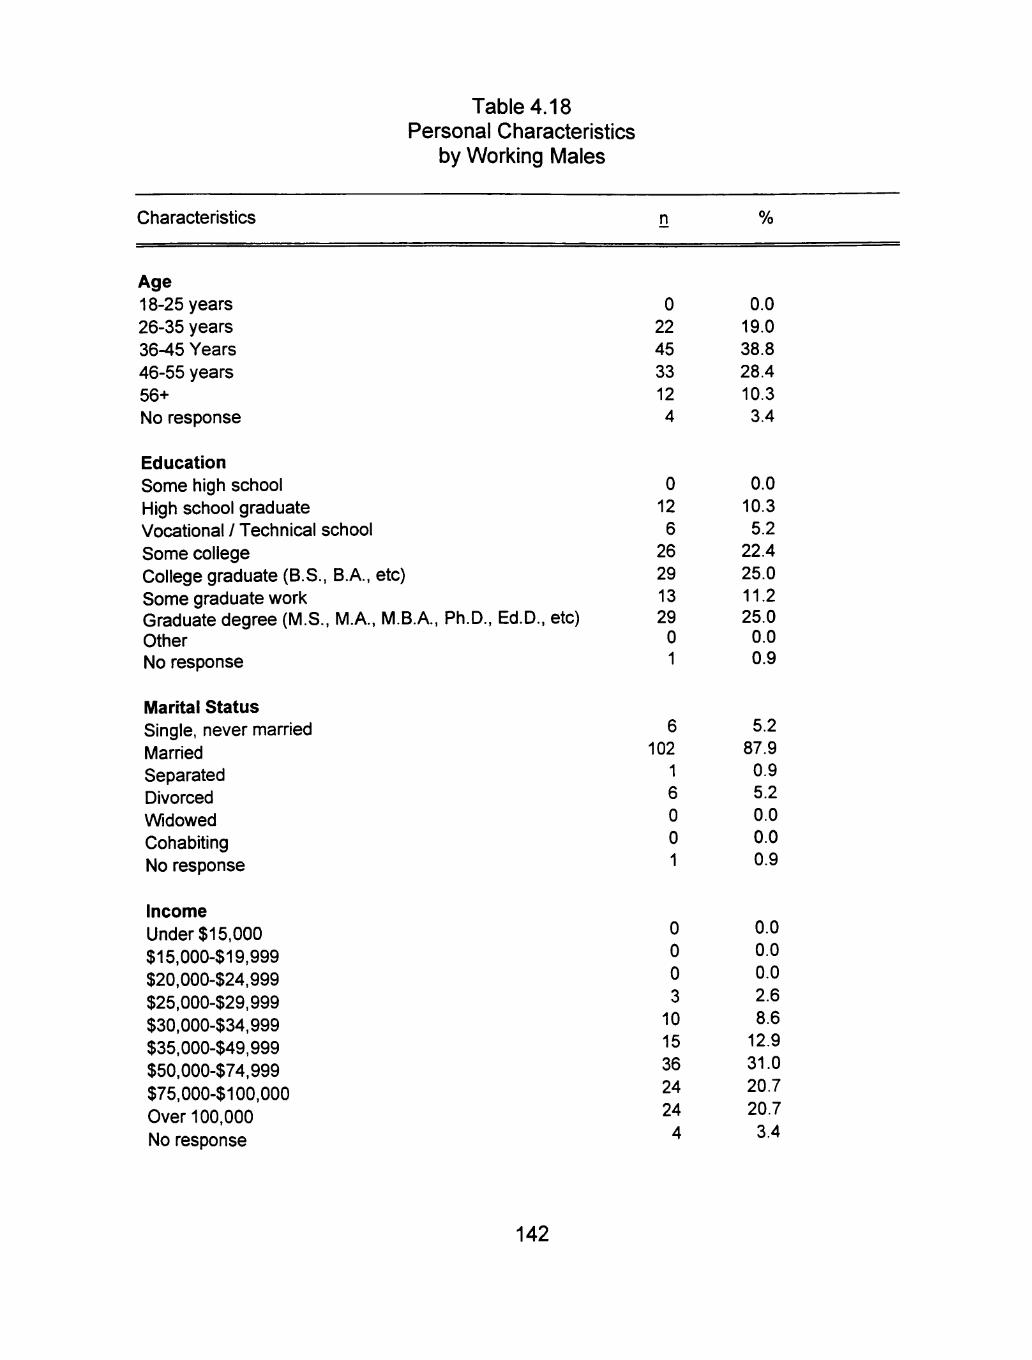
Table 4.18 Personal Characteristics
by Working Males
Characteristics n %
Age 18-25 years 26-35 years 36-45 Years 46-55 years 56+ No response
Education Some high school High school graduate Vocational / Technical school Some college College graduate (B.S., B.A., etc) Some graduate work Graduate degree (M.S., M.A., M.B.A., Ph.D., Ed.D., etc) Other No response
Marital Status Single, never married Married Separated Divorced Widowed Cohabiting No response
Income Under $15,000 $15,000-$19,999 $20,000-$24,999 $25,000-$29,999 $30,000-$34,999 $35,000-$49,999 $50,000-$74,999 $75,000-$100,000 Over 100,000 No response
0 22 45 33 12 4
0 12 6 26 29 13 29 0 1
6 102
1 6 0 0 1
0 0 0
3 10 15 36 24
24
4
0.0 19.0 38.8 28.4
10.3 3.4
0.0 10.3 5.2 22.4
25.0 11.2 25.0 0.0 0.9
5.2 87.9 0.9 5.2 0.0 0.0 0.9
0.0 0.0 0.0 2.6 8.6 12.9 31.0 20.7
20.7 3.4
142
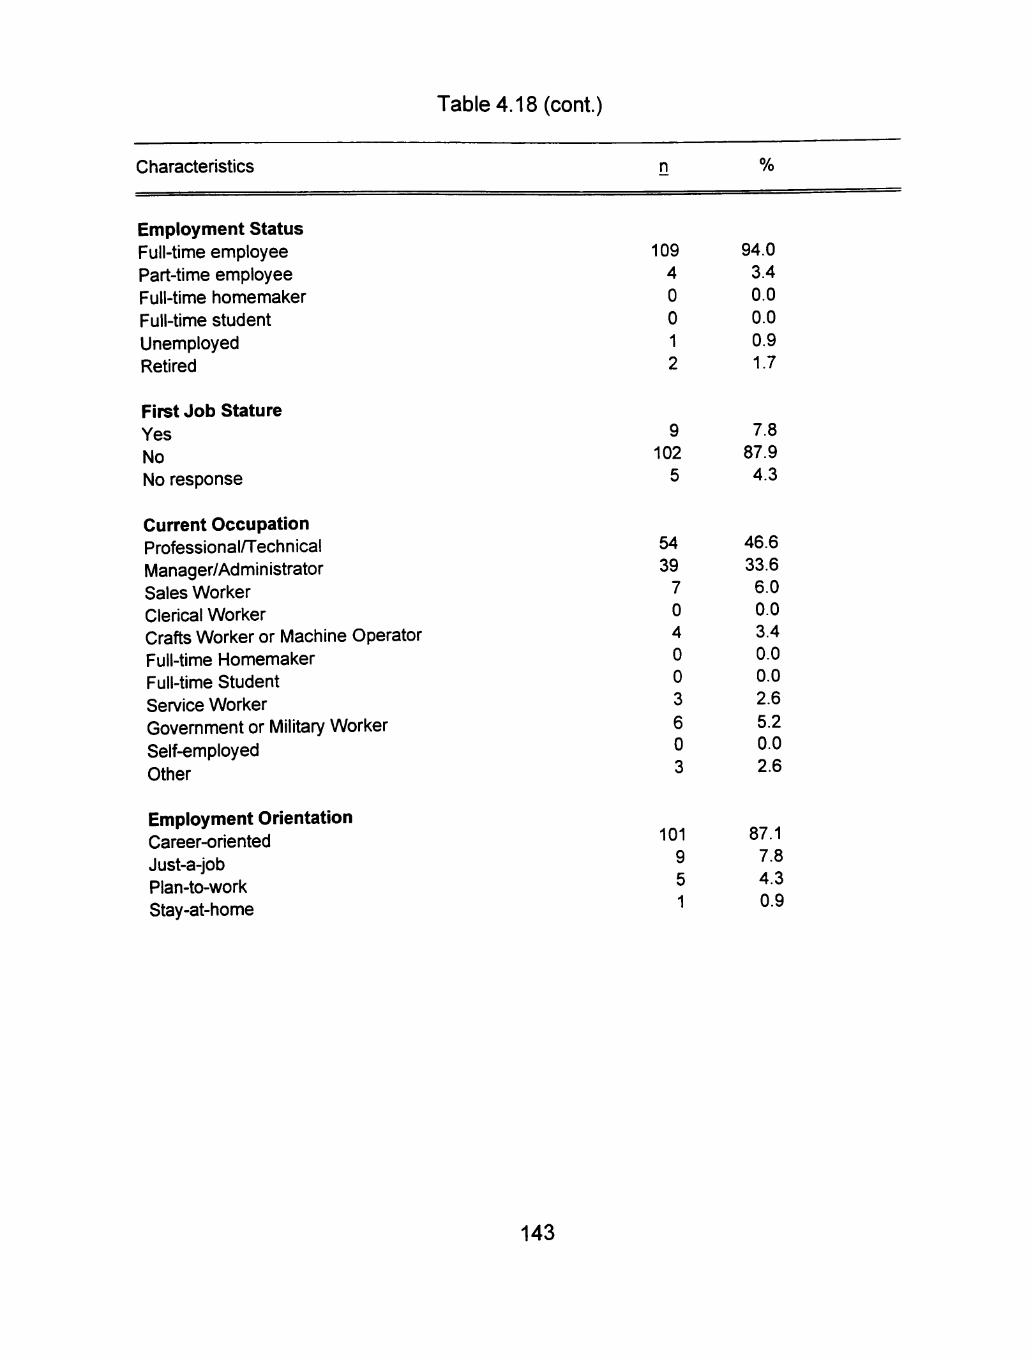
Table 4.18 (cont.)
Characteristics n %
Employment Status Full-time employee Part-time employee Full-time homemaker Full-time student Unemployed Retired
First Job Stature Yes No No response
Current Occupation Professional/Technical Manager/Administrator Sales Worker Clerical Worker Crafts Worker or Machine Operator Full-time Homemaker Full-time Student Service Worker Government or Military Worker Self-employed Other
Employment Orientation Career-oriented Just-a-job Plan-to-work Stay-at-home
109 4 0 0 1 2
9 102
5
54 39
7 0 4 0 0 3 6 0 3
101 9 5 1
94.0 3.4 0.0 0.0 0.9 1.7
7.8 87.9 4.3
46.6 33.6
6.0 0.0 3.4 0.0 0.0 2.6 5.2 0.0 2.6
87.1 7.8 4.3 0.9
143
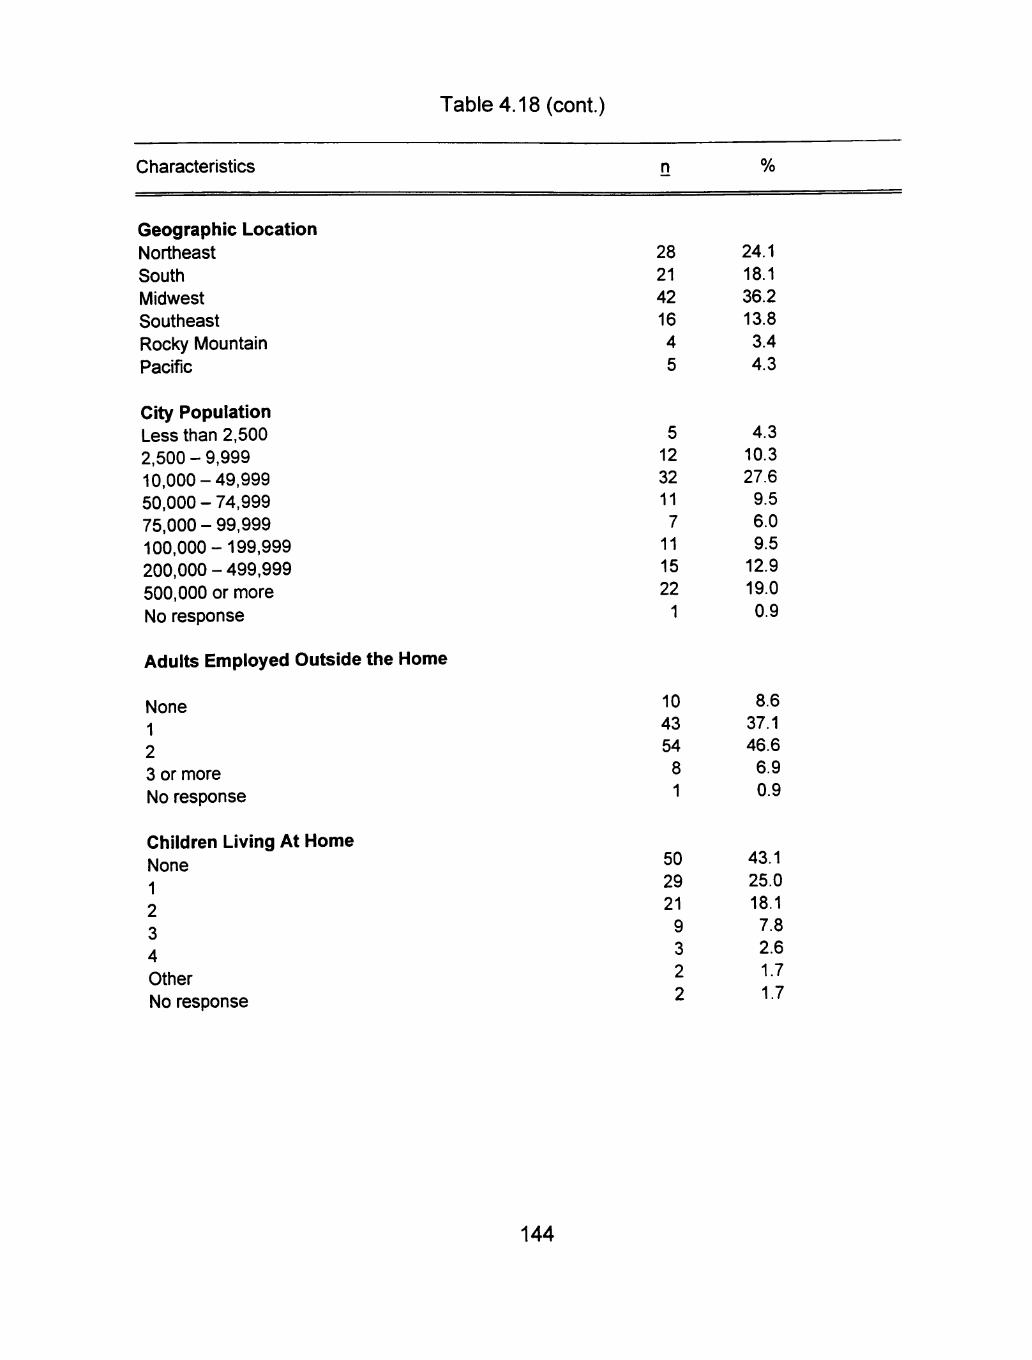
Table 4.18 (cont.)
Characteristics n %
Geographic Location Northeast South Midwest Southeast Rocky Mountain Pacific
City Population Less than 2,500 2,500-9,999 10,000-49,999 50,000 - 74,999 75,000-99,999 100,000-199,999 200,000 - 499,999 500,000 or more No response
Adults Employed Outside the Home
None 1 2 3 or more No response
Children Living At Home None 1 2 3 4 Other No response
28 21 42 16 4
5
5 12 32 11 7 11 15 22 1
24.1 18.1 36.2 13.8 3.4 4.3
4.3 10.3 27.6 9.5 6.0 9.5 12.9 19.0 0.9
10 43 54 8 1
50 29 21 9 3 2
2
8.6 37.1 46.6 6.9 0.9
43.1 25.0 18.1 7.8 2.6 1.7
1.7
144
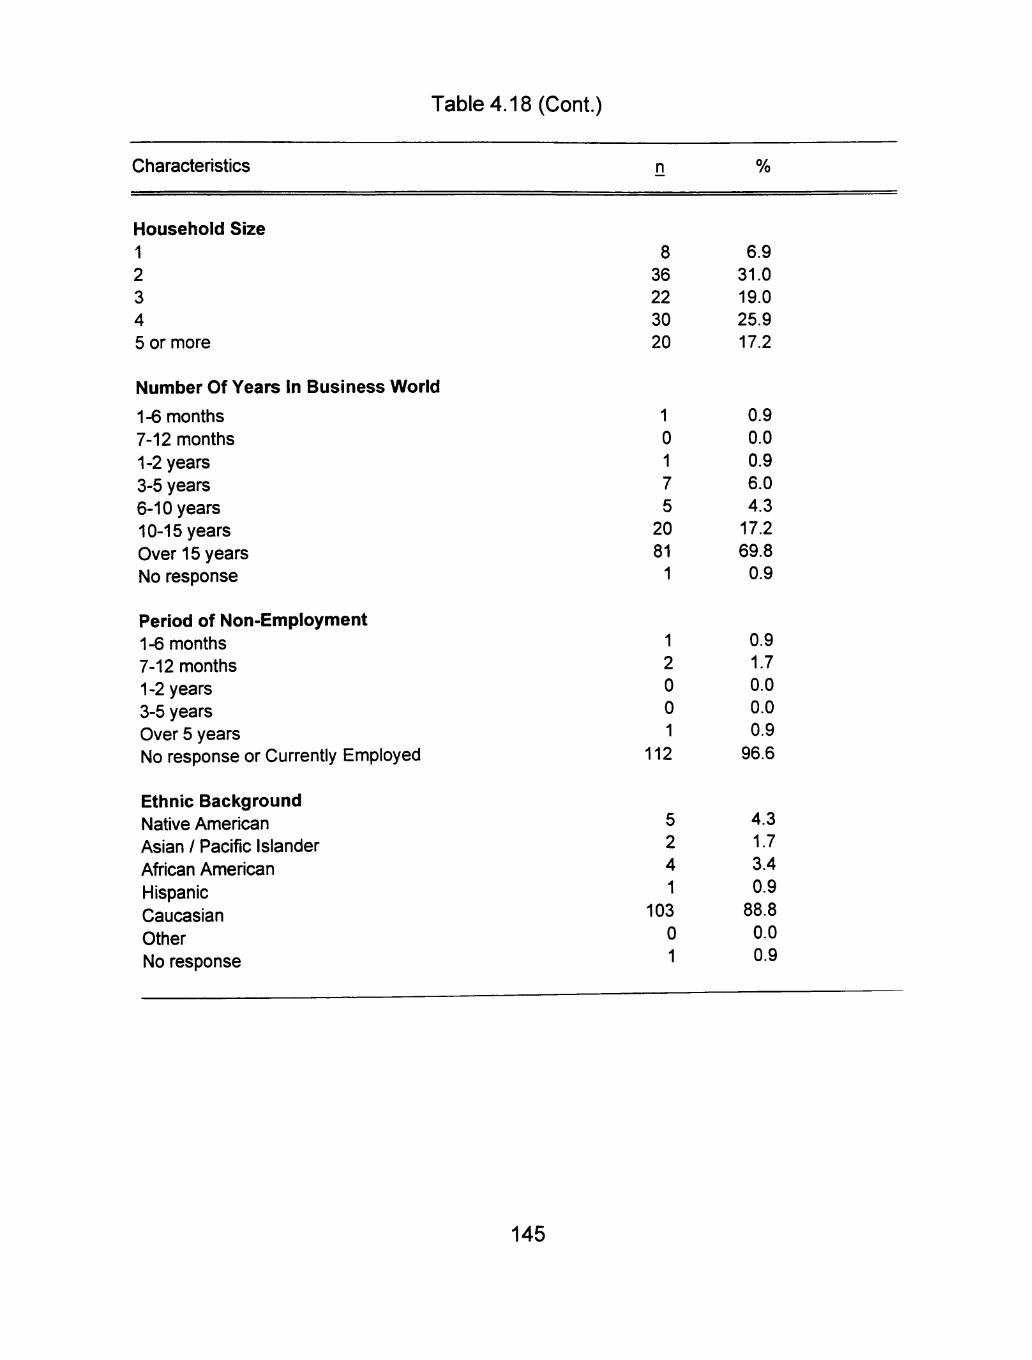
Table 4.18 (Cont.)
Characteristics n %
Household Size 1 2 3 4 5 or more
Number Of Years In Business World
1-6 months 7-12 months 1-2 years 3-5 years 6-10 years 10-15 years Over 15 years No response
Period of Non-Employment 1-6 months 7-12 months 1-2 years 3-5 years Over 5 years No response or Currently Employed
Ethnic Background Native American Asian / Pacific Islander African Amerlc:an Hispanic Caucasian Other No response
8 36 22 30 20
1 0 1 7 5
20 81
1
1 2 0 0 1
112
5 2 4 1
103 0 1
6.9 31.0 19.0 25.9 17.2
0.9 0.0 0.9 6.0 4.3
17.2 69.8
0.9
0.9 1.7 0.0 0.0 0.9
96.6
4.3 1.7 3.4 0.9
88.8 0.0 0.9
145
A majority (80.6%) of the females were full-time employees, with 17.3%
working part-time. The number of adults employed outside the home was one
(49.6%) or two (34.5%). They were in professional/technical (51.1%)
occupations and were career-oriented (74.8%). Females were currently
employed (97.1%), and their current employment was not (91.4%) their first job.
Working Males
Table 4.18 describes the personal characteristics of the working male
respondents. A majority of males were 36 to 55 years old (67.2%) with a mean
age of 43.4 years, were married (87.9%). They were college graduates (25.0%)
or had graduate degrees (25.0%), and a majority (51.7%) had household
incomes between $50,000 and $100,000. Most (88.8%) working males were
Caucasian, Non-Hispanic.
The family size included two persons (31.0%) or four persons (25.9%).
The largest percentage (43.1%) of the males did not have children living at
home, with 25.0% having one child at home. Residence was in urban areas
(57.8%), primarily in the Midwest (36.2%) and Northeast (24.1%).
A majority (94.0%) of the males were full-time employees, with 3.4%
working part-time. The number of adults employed outside the home was two
(46.6%) or one (37.1%). They were in professional/technical (46.6%) or
manager/administrator (33.6%) occupations and were career-oriented (87.1%).
146
Scale Reliabilitv and Tree Validation
Cronbach's alpha coefficients were determined for three scales: Footwear
Involvement, Footwear Purchase Criteria, and Footwear Characteristics. For the
footwear involvement scale the reliability was 0.73, footwear purchase criteria
0.83, and footwear characteristics 0.76. The predictive value of each decision
tree was verified by cross-validation. The classifier for the purchase criteria
scale was correct 67% of the time, for footwear characteristics 66%.
Analysis of Research Questions
Research Question 1
Purchase Criteria
As indicated in Figure 4.1, quality denotes the first-level split of High
Involvement (HI) and Low Involvement (LI) consumers of leather dress shoes for
business wear into Node 1, Node 2, and Node 3 (y^ = 35.09, df=2,p< .0001).
HI and LI rated quality as a very important criterion for the purchase of shoes
(Node 3). The highest number of LI rated quality as important (Node 2).
Respondents in Node 3 were further split into Node 7 and Node 8 (x = 9.62, df =
1, p < .05) by color. Both HI and LI indicated color to be important to not
important (Node 7), whereas the highest number of HI rated color as very
important (Node 8). Those participants rating color as very important were again
147
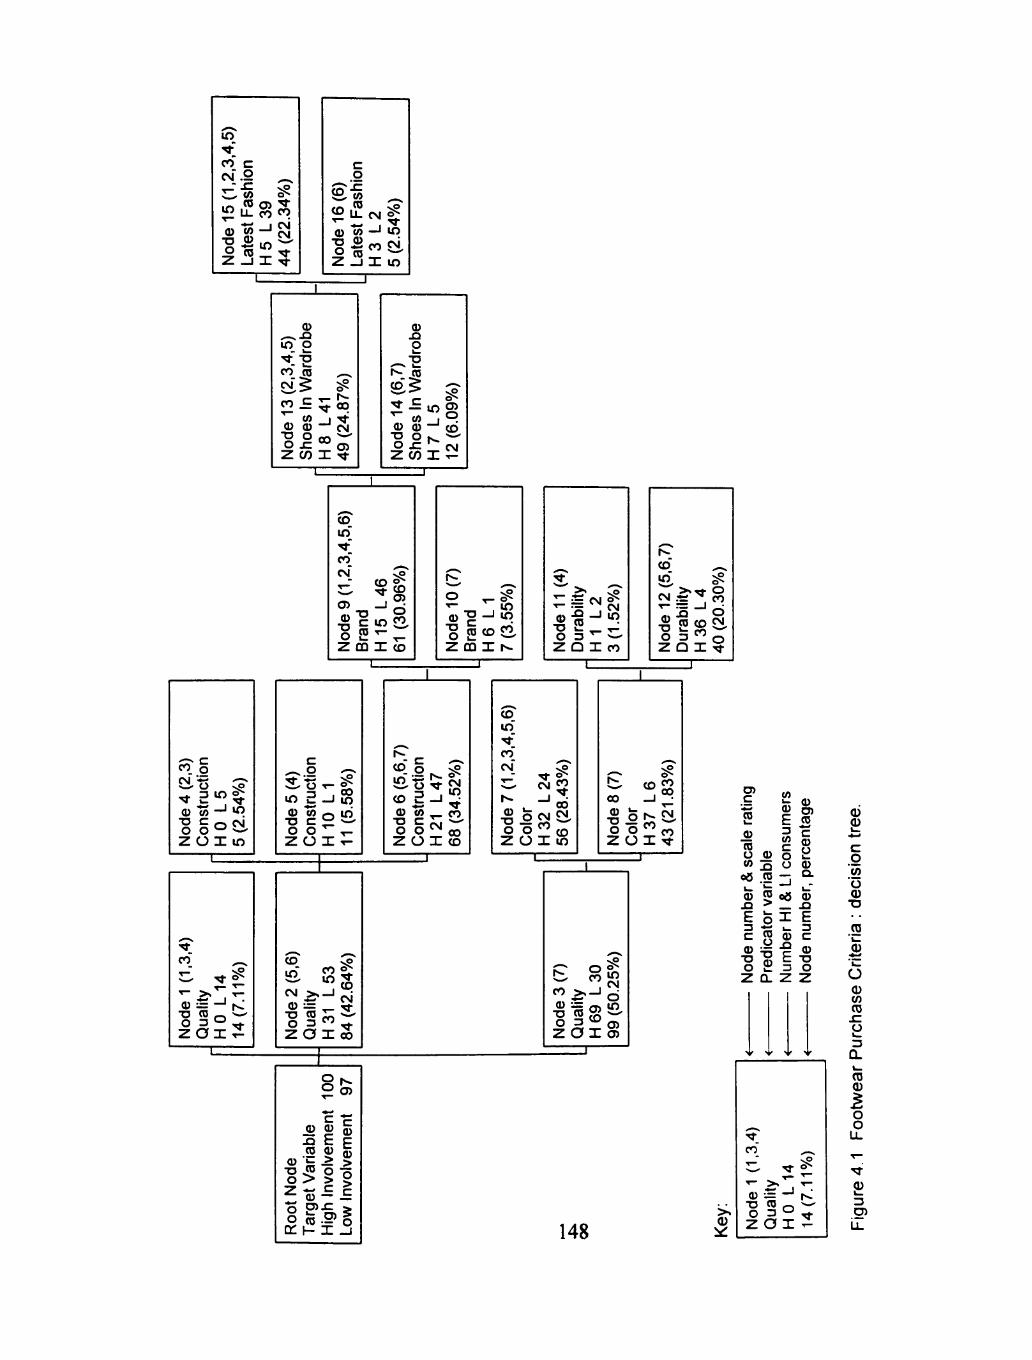
m ^ CO
(1.2
. in 0 •o o Z.
C
shIo
0 U-
OT 0
"cD - J
<J» CO _ l
in
X
^ o ^ "^ CO CM CM
• ^
-*
(9)
CD
Q) TJ O Z
C o
Fas
h
"OT 2 1T5 _ j
fM - J
CO
X
m CM,
m
_ in •^ CO CM
CO
0 TJ O
0 Si o ^ TJ L_ 0
^ _c OT 0 O
SZ
¥ _ l
00
Z CO X
^.^
r^ 00 "^ CM
O) "t
r
4(6
,
0 TJ O
0 Si o ^ TJ
0
InW
OT 0 O
SZ
l O _ l
r». "ZVilL
_,
9%)
o to CM
CD
m "^ CO
(1.2
CJ)
ode
and
k_
CD
_J
in
Z CQ X
1.96
%
CO,
^ CD
c
3 . 00 w —I m i n
•g ^ o S . O O "^ .r-
Z O X T-
1 ^ CD
in CD
0 •a o
r
Ctio
tr
u
OT C o
_ i
CM
Z O X
^ • n ^
CM
in CO
00 CD
CD in "* CO
CM_
r-0
TJ O
CM —I
O CM
Z O X 1
.43%
oo CM,
to m
CD in.
CM 0
TJ
o
CO
in >. - !
0 J 3 ^
CD CM
Z O X <jb
CJ) _C "cD
0 U 0
OT
k. (I)
E iS
I 0 o 0
" ' n v.. \ i /
<« .0 - ] °-0 5 oO 0
E fe X E C W 0) c
0 = 6 - g 0 TJ S E TJ O S 3 O
— z z
o c Z Q.
8fe c •?
iJ 2 0 J3 E c .2 $ 0
2 0 - ^ 1
148 0
0
c g
'to "o 0 TJ
ro ' k _
0 ;^
o 0 Ui ro .c CJ k _
Q.
,_ M-CO ^ .^
^ M- ° :
^ - _ j ""• <u — —' r -TJ 0 /-« ^-' 0 3 ° ^ Z O X ^
L_
ro 0
i o o LL
•^ 0
3 CJ)
U_
split by durability (x' = 7.46, df=1,p< .05), with HI indicating durability was
important to very important in their purchase criteria.
Node 2 HI and LI respondents was split by construction into three nodes,
4, 5, and 6 (x' = 17.76, df=2,p< .01). The higher number of both HI and LI
were assigned to Node 6 where construction was rated as important to very
important. Node 6 was further split into Node 9 and Node 10 (x = 10.99, c/f = 1,
p < .01) by brand, where 31.0% of the target variable rated brand from Important
to not important. The purchase criterion, shoes in wardrobe, split Node 9 into
Nodes 13 and 14 (x = 9.17, df = 1, p < .05). Node 13, which was divided into
Node 15 and Node 16 (x' = 7.77, off = 1, p < .05) by latest fashion, contained a
high number (n = 41, 83.7%) of LI who rated shoes in wardrobe as important to
not important. The highest number at the fifth level split indicated latest fashion
was important to not important.
Footwear Characteristics
Referring to Figure 4.2, HI and LI respondents are divided by the footwear
characteristic, natural versus not natural, (x = 37.76, df= 2, p < .0001) into three
nodes. Node 1, Node 2, and Node 3. Node 3 showed the highest number of HI
chose natural over not natural as a characteristic of the pair of leather dress
shoes most often worn to work. LI indicated neither natural nor not natural but
149
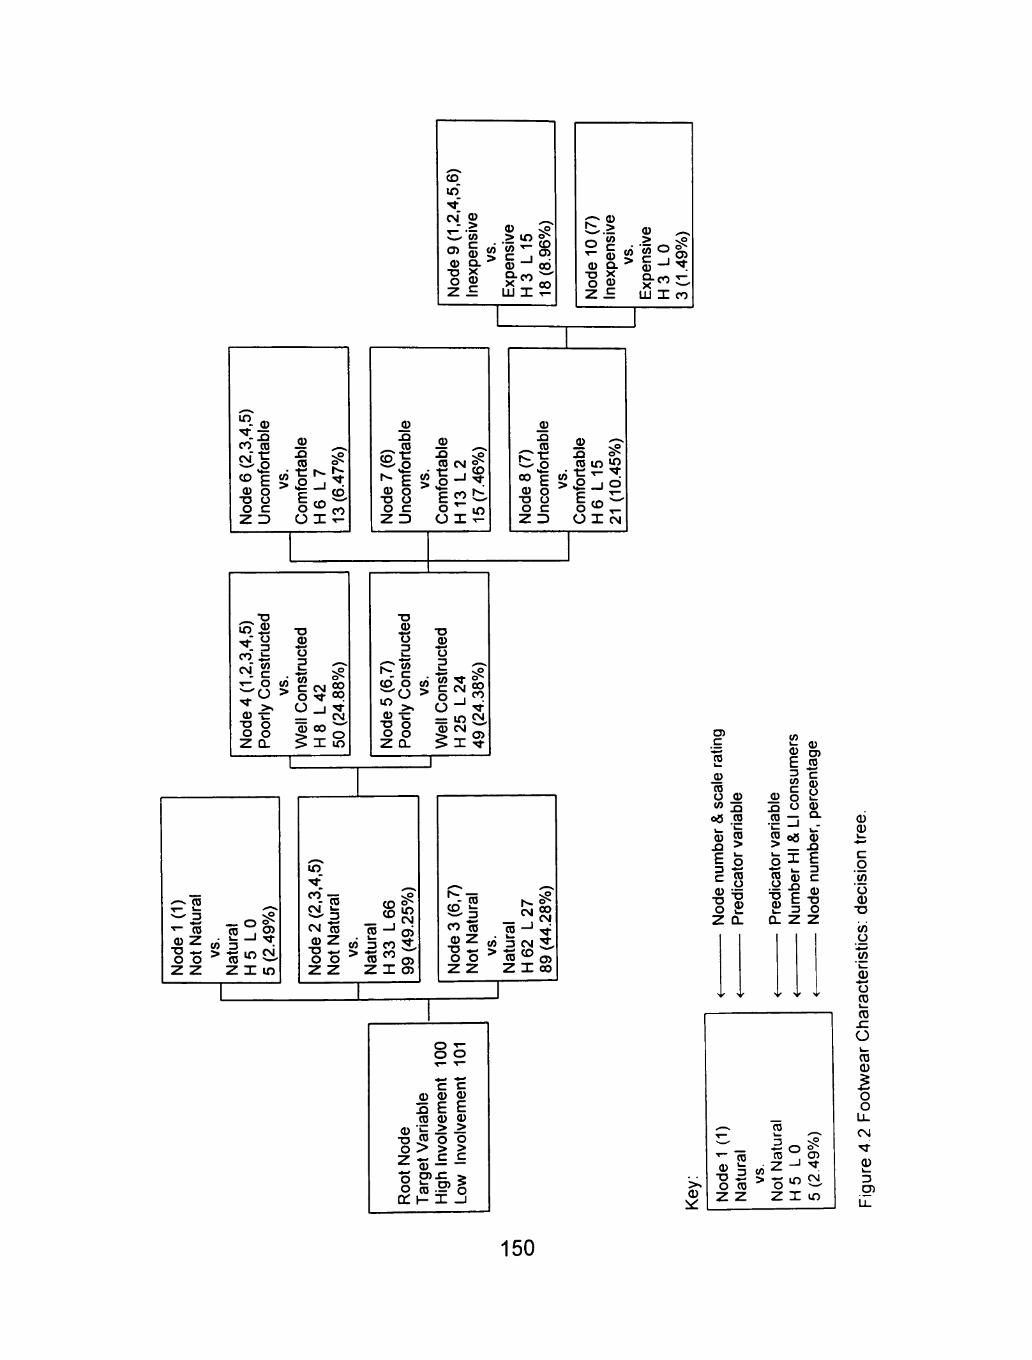
CD in
CM_ 0
CJ) 0 TJ O
OT c 0 C3. X 0
0 >p
0 00 Q-co ^ X _ 00 i LU X ;=
f^ > 'OT
0 > ^ s « 1 3 1
0 Q. > ^ -J '*
o 0 x*^ ^ Z .E HI X CO
TJ in .2
3.4.
tr
ue
CM: C
8 4
(1
rIyC
o
TJ O
o o Z CL
TJ
.truc
te
2-^^ > X in
•o
2 "o 3
to" o
« ^ 0 — TJ O O O
z a.
^ d :?
TJ 0 O 3
Str
c o o CI)
^
"* CM _ 1
in CM
X
, ^
t o
CM
1(1)
at
ural
2 ^ ui TJ • - > O O ^
z z
— o g; 0 , CJ) 3 - * ^ ^ ^ ^ Z X in
in •»r
2(2
.3
atur
al
al L6
6
3.25
%
2 ^ oi 3 CO S . O O "^ 0 " O i
z z Z X O)
^ ^ ^ 1 ^ ^
3(6
.7
atur
al
al L2
7
4.28
%
© ^ CO 3 C M S
O O > " 0 « > C J )
z z
o •»-C=) O ^- '^
c c (U 0 0
S E ^ CD 0 0
-o 0 o o o > > > z *- = .E
S * - CJ) > O CD • - O
Q : I - X _j
Z X 00
ting
CO k_
0 CD U 0 CO S
00 0
•- "is 0 5
E S 3 * -
od
en
redi
ca
Z CL
N
> N
0
T
1
y y Y
~ CD
\ n 3 ^ 3 0
z z
a cu m
e onsu
m
rcen
ta
J3 O 0
ro - : Q- 0)
ro oS cu ^ o X E S
; i_ 3 . is
redi
ca
umbe
od
e n
deci
s
Q. Z Z
>
c k ^ r
tr\ ^ > » t
-
r >
0
2 r ) r —
" ir i " I 1
c/) o .^^ Ui I
0 O
l' * ro k _
^^
' ^ . , o) J - r ) c : i n
\\j
SZ
O .
ro 0
% o o u_ CM
""T
0 k -3 O )
iZ
150
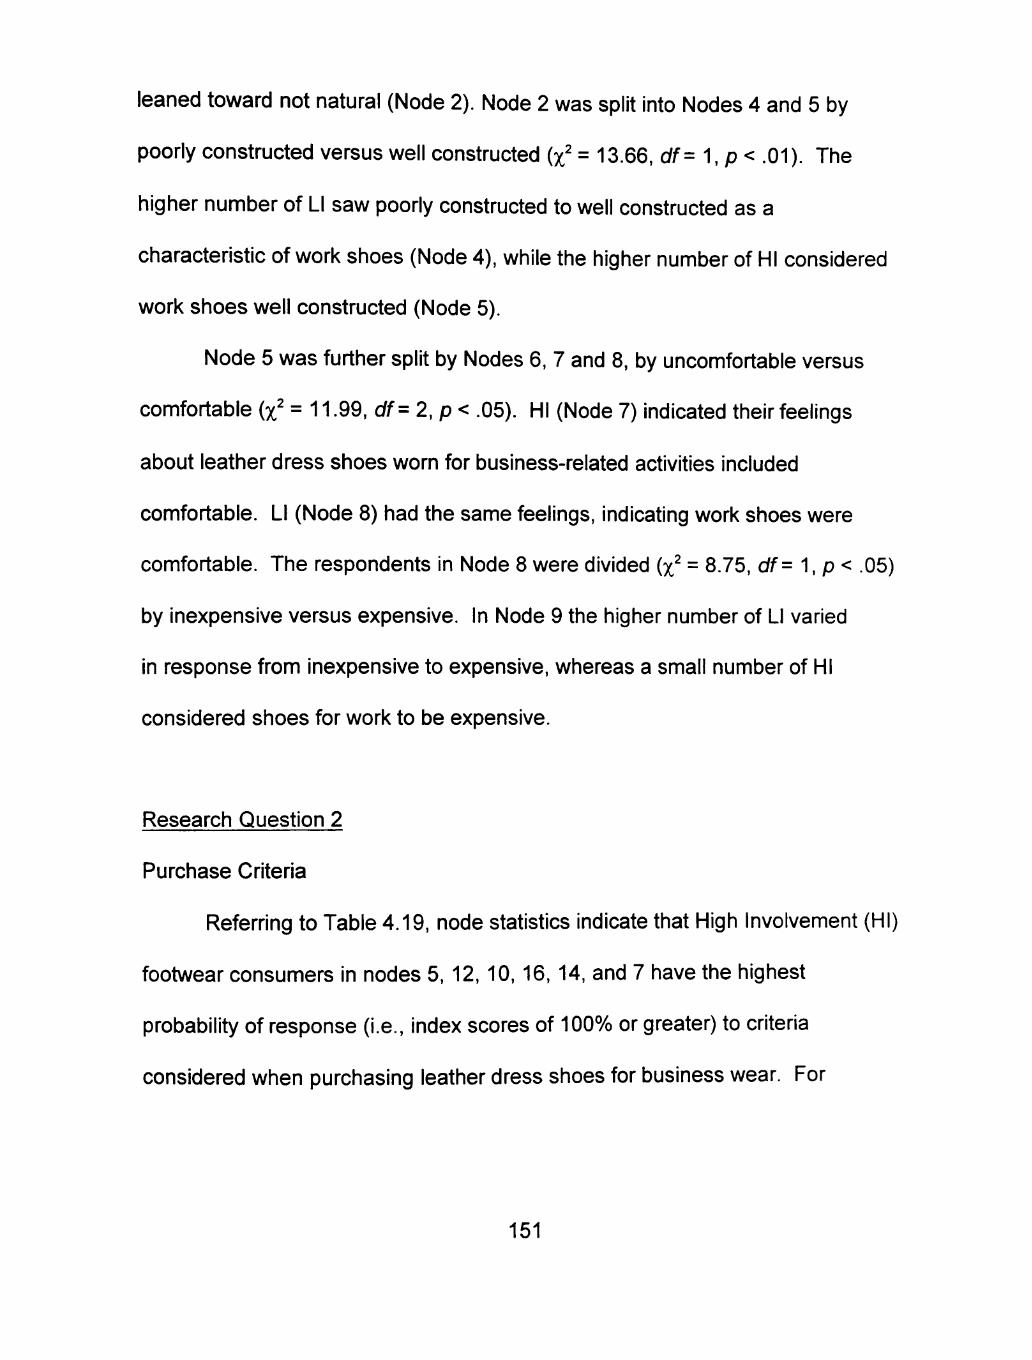
leaned toward not natural (Node 2). Node 2 was split into Nodes 4 and 5 by
poorly constructed versus well constructed (x = 13.66, df= 1, p < .01). The
higher number of LI saw poorly constructed to well constructed as a
characteristic of work shoes (Node 4), while the higher number of HI considered
work shoes well constructed (Node 5).
Node 5 was further split by Nodes 6, 7 and 8, by uncomfortable versus
comfortable (x' = 11.99, df= 2, p < .05). HI (Node 7) indicated their feelings
about leather dress shoes worn for business-related activities included
comfortable. LI (Node 8) had the same feelings, indicating work shoes were
comfortable. The respondents in Node 8 were divided (x = 8.75, off = 1, p < .05)
by inexpensive versus expensive. In Node 9 the higher number of LI varied
in response from inexpensive to expensive, whereas a small number of HI
considered shoes for work to be expensive.
Research Question 2
Purchase Criteria
Referring to Table 4.19, node statistics indicate that High Involvement (HI)
footwear consumers In nodes 5, 12, 10, 16, 14, and 7 have the highest
probability of response (i.e., index scores of 100% or greater) to criteria
considered when purchasing leather dress shoes for business wear. For
151
Node
Number
Table 4.19 High Involvement Leather Footwear Purchase Criteria:
Gain Summary
Node
Number 5
12
10
16
14
7
Node: n 11
40
7
5
12
56
Node: % 5.58
20.30
3.55
2.54
6.09
28.43
Node-I
Response: 10
36
6
3
7
32
by-Node
n Response: % 10.00
36.00
6.00
3.00
7.00
32.00
Gain: (%) 90.91
90.00
85.71
60.00
58.33
57.14
Index: (%) 179.09
177.30
168.86
118.20
114.92
112.57
Cumulative
Node: n Node: % Response: n Response: % Gain: (%) Index: (%) 5
12
10
16
14
7
11
15
11
51
58
63
75
131
134
178
5.58
25.89
29.44
31.98
38.07
66.50
68.02
90.36
10
46
52
55
62
94
95
100
10.00
46.00
52.00
55.00
62.00
94.00
95.00
100.00
90.91
90.20
89.66
87.30
82.67
71.76
70.90
56.18
179.09
177.68
176.62
171.98
162.85
141.36
139.66
110.67
Target Nodes
5
12
10
Quality (5,6)
Quality (7) +
Quality (7) +
Target Segment Characteristics ^ + Construction (4)
Color (7) + Durability (5-7)
Construction (5-7) + Brand (7)
16 Quality (5,6) + Construction (5-7) + Brand (1-6) + Shoes In Wardrobe (2-5) + Latest Fashion (6)
14 Quality (5,6) + Construction (5-7) + Brand (1-6) + Shoes in Wardrobe (6, 7) Quality (5,6) +Color (1-6)
Scale Rating: Very Important (7) - Not Important (1) ^ Number(s) In parenthesis indicates scale rating of node.
152
example. Node 5 with a response number of 10 HI has a response rate of
90.91%. The index number is 179.09%, meaning that the proportion of HI for
Node 5 is almost twice the response rate for all high involvement consumers of
leather dress shoes. The cumulative statistics (see Table 4.19) show that by
taking the best node (Node 5), 10.00% of HI can be reached by targeting 5.58%
of the market. To reach 50% of HI consumers, 29.44% of the market should be
targeted. The percentage reached can be increased to 100% by including all of
the nodes (5, 12, 10, 16, 14,7, 11, 15) listed in Table 4.19. The characteristics
that define the best node. Node 5, for HI footwear consumers are described in
Table 4.19 and include acknowledging quality and construction when purchasing
leather shoes for work. When Node 12 is reviewed, HI consider quality, color,
and durability in their purchase criteria for shoes.
As noted in Table 4.20, four nodes for Low Involvement (LI) footwear
consumers were found to have the highest probability of response to purchase
criteria for shoes worn to work. Nodes 4 and 1 each had a response rate or gain
score of 100% and index score of 203.09%. Looking at Node 15, there is a
response rate of 88.64% with an index score of 180.01%. The cumulative
statistics show that when 2.54% of LI are targeted in regard to footwear
purchase criteria, 5.15% can be reached. If 50% of LI consumers are to be
reached the 31.98% of the market must be targeted. Characteristics (see Table
153
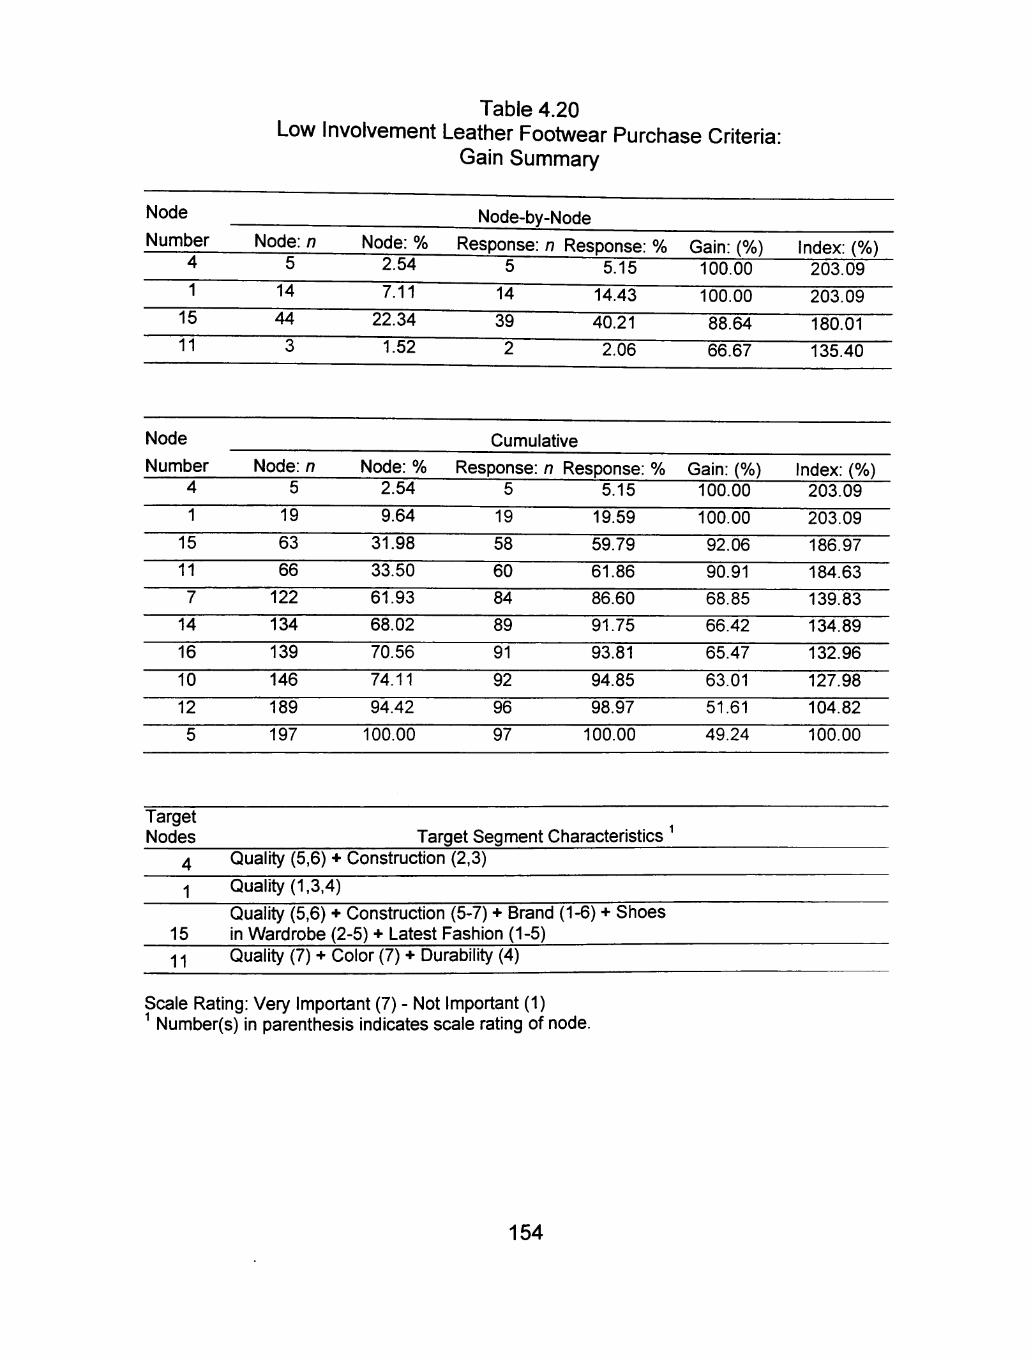
Node
Number
1
15
11
Table 4.20 Low Involvement Leather Footwear Purchase Criteria:
Gain Summary
Node: n
14
44
Node: % 2.54
7.11
22.34
1.52
Node-by-Node
Response: n Response: % Gain: (%) Index: (%) 5 5.15
14 14.43
39 40.21
2.06
100.00
100.00
88.64
66.67
203.09
203.09
180.01
135.40
Node
Number
1
Cumulative
Node: n Node: % Response: n Response: % Gain: (%) Index: (%) 5 2.54 5 5.15 100.00 203.09
19 9.64 19 19.59 100.00
Scale Rating: Very Important (7) - Not Important (1) ^ Number(s) In parenthesis indicates scale rating of node.
203.09
15
11
7
14
16
10
12
5
63
66
122
134
139
146
189
197
31.98
33.50
61.93
68.02
70.56
74.11
94.42
100.00
58
60
84
89
91
92
96
97
59.79
61.86
86.60
91.75
93.81
94.85
98.97
100.00
92.06
90.91
68.85
66.42
65.47
63.01
51.61
49.24
186.97
184.63
139.83
134.89
132.96
127.98
104.82
100.00
Target Nodes
4
1
15
11
Quality (5,6) +
Quality (1,3,4)
Target Segment ( Construction (2,3)
Characteristics ^
Quality (5,6) + Construction (5-7) + Brand (1-6) + Shoes In Wardrobe (2-5) + Latest Fashion (1-5) Quality (7) + Color (7) + Durability (4)
154

4.20) indicate that the purchase criteria for business shoes by LI is quality and
construction, with not important to important.
Footwear Characteristics
Two nodes, Node 1 and Node 10, for HI footwear consumers had
response rates or gain scores of 100.00%, with index scores of 201.00%. See
Table 4.21. Nodes 7 and 3 were also considered within the "best" nodes for
examining the footwear characteristics of leather dress shoes worn most often to
work. Respectively, response rates were 86.67% and
69.66%. Referring to the cumulative statistics shown in Table 4.21, 5.00% of HI
consumers are reached by targeting 2.49% of the market. To reach 50% of HI
footwear consumers. Nodes 1, 10, 7, and 3 must be considered. Characteristics
of the shoes most often worn for work activities indicate well constructed,
expensive, and comfortable. HI footwear consumers were not definite in
considering leather footwear as not natural to natural.
As noted in Table 4.22, 24.88% of LI footwear consumers must be
targeted to reach 41.58% in terms of characteristics describing the leather dress
shoes they most often wear to work. If 50% of the market is desired then
33.84% must be targeted or both Node 4 and Node 9 must be considered.
Characteristics of the shoes worn for work activities indicate well constructed. LI
155
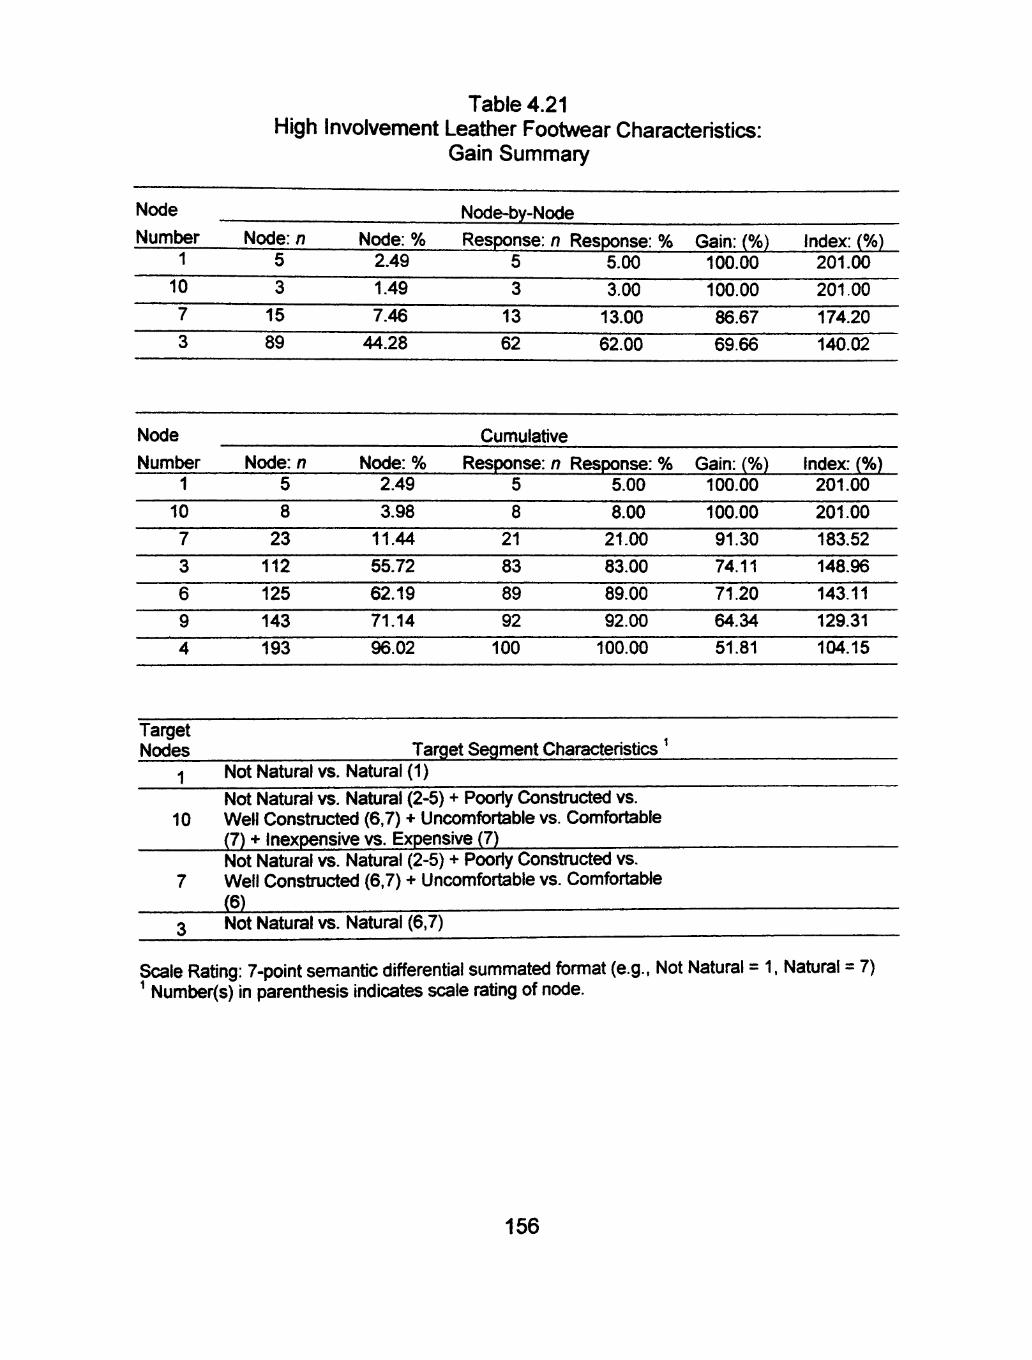
Node Number
1 10
Table 4.21 High Involvement Leather Footwear Characteristics:
Gain Summary
15
Node-by-Node Node: n Node: % Response: n Response: % Gain: (%) Index: (%)
2.49 5.00 100.00 1.49 3.00 100.00 7.46 13 13.00 86.67
Not Natural vs. Natural (2-6) + Poorly Constructed vs. 10 Well Constructed (6,7) + Uncomfortable vs. Comfortable
(7) + Inexpensive vs. Expensive (7) Not Natural vs. Natural (2-5) + Poorly Constmcted vs. Well Constructed (6,7) + Uncomfortable vs. Comfortable
Not Natural vs. Natural (6,7)
201.00 201.00
174.20 3 89 44.28 62 62.00 69.66 140.02
Node Number
1 10 7
3 6 9 4
Node: n 5 8
23
112 125 143 193
Node: % 2.49 3.98
11.44 55.72 62.19 71.14 96.02
Cumulative Response: n Response: %
5 5.00 8 8.00
21 21.00 83 83.00 89 89.00 92 92.00
100 100.00
Gain: (%) 100.00 100.00 91.30 74.11
71.20 64.34 51.81
Index: (%) 201.00 201.00 183.52 148.96 143.11 129.31 104.15
Target Nodes
1 Not Natural vs. Target Segment Characteristics ^
Natural (1)
Scale Rating: 7-point semantic differential summated format (e.g.. Not Natural = 1, Natural = 7) ^ Number(s) in parenthesis indicates scale rating of node.
156
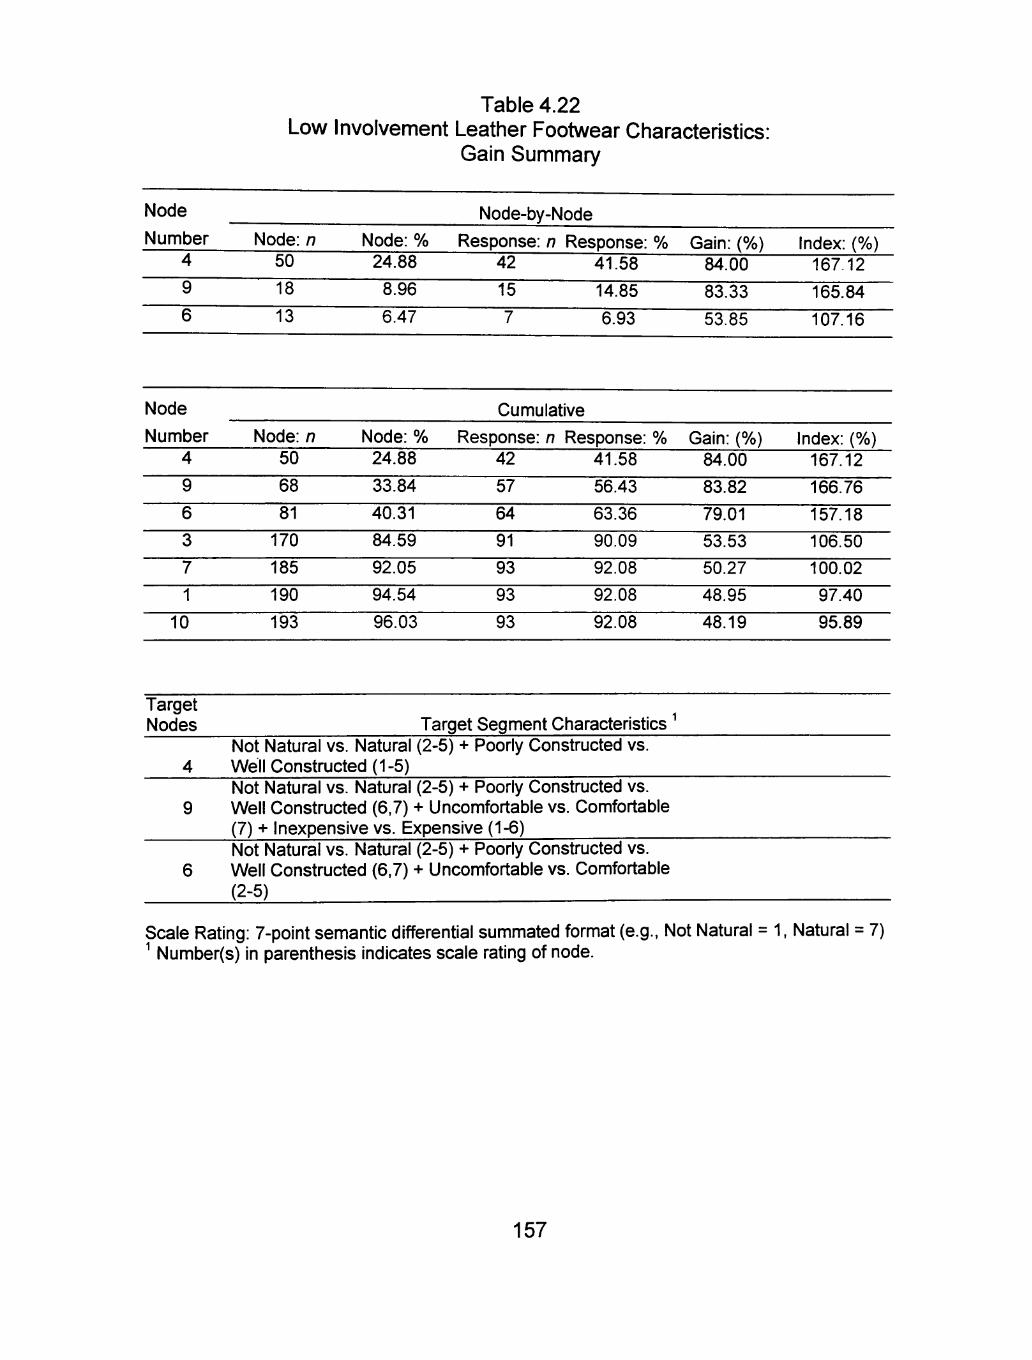
Table 4.22 Low Involvement Leather Footwear Characteristics:
Gain Summary
Node
Number Node: n 50
18
13
Node: % 24.88
8.96
6.47
Node-by-Node
42 41.58 15 14.85
6.93
84.00
83.33
53.85
Response: n Response: % Gain: (%) Index: (%) 167-12
165.84
107.16
Node Cumulative Number
4
9
6
3
7
1
10
Node: n 50
68
81
170
185
190
193
Node: % 24.88
33.84
40.31
84.59
92.05
94.54
96.03
Response: i 42
57
64
91
93
93
93
n Response: % 41.58
56.43
63.36
90.09
92.08
92.08
92.08
Gain: (%) 84.00
83.82
79.01
53.53
50.27
48.95
48.19
Index: (%) 167.12
166.76
157.18
106.50
100.02
97.40
95.89
Target Nodes
4
9
Target Segment Not Natural vs. Natural (2-5) Well Constructed (1-5)
Characteristics ^ + Poorly Constructed vs.
Not Natural vs. Natural (2-5) + Poorly Constructed vs. Well Constructed (6,7) + Uncomfortable vs. Comfortable (7) + Inexpensive vs. Expensive (1-6) Not Natural vs. Natural (2-5) + Poorly Constructed vs. Well Constructed (6,7) + Uncomfortable vs. Comfortable (2-5) ^
Scale Rating: 7-point semantic differential summated format (e.g., Not Natural = 1, Natural = 7) ^ Number(s) In parenthesis indicates scale rating of node.
157
consumers were not definite in considering leather footwear as not natural or
natural, uncomfortable or comfortable, and inexpensive or expensive.
Summary of Findings of Research Questions
Research Question 1
RQ 1 asked if HI and LI consumers could be grouped by their assessment
of footwear purchase criteria and footwear characteristics of leather dress shoes
for business wear. In summary, the majority (12 of 19) of the purchase criterions
could not be classified. Referring to the seven criterions classified as predictors
of group membership, HI consumers considered quality (Node 3), color (Node 8),
and durability (Node 12) as important criteria when purchasing leather dress
shoes for business wear, whereas, LI consumers considered quality (Node 2)
and construction (Node 6) important and gave mixed ratings to brand (Node 9),
shoes in wardrobe (Node 13), and latest fashion (Node 15). See Figure 4.1. In
regard to footwear characteristics (see Figure 4.2) used to describe leather dress
shoes most often worn for business-related activities, HI stated natural (Node 3)
while LI stated not natural (Node 2) and poor construction (Node 4).
Research Question 2
RQ 2 asked If HI and LI consumers could be classified on their leather
footwear purchase behavior (i.e., footwear purchase criteria and footwear
158
characteristics of leather dress shoes for business wear). In summary, the HI
consumers were classified by their assessment of quality (very important to
important) and construction (important), whereas LI consumers considered
quality as very important to important and construction as important to not
important. HI could also be classified as to the combination of quality (very
important), color (very important), and durability (very important to important). LI
continued to be classified by their rating of quality (important to not important).
Though brand, shoes in wardrobe, and latest fashion characteristics classified
the HI and LI consumers, they showed no specific pattern (see Tables 4.19 and
4.20).
As to leather footwear characteristics, HI consumers were classified by
the not natural versus natural characteristics of their leather dress shoes worn for
business related activities, with a description of natural. LI consumers described
their footwear characteristics as not natural to natural and pooriy constructed to
well constructed. Both HI and LI were also classified by the combination of
natural, construction, comfort, and expense, with HI describing feelings of not
natural to natural, well constructed, comfortable, and expensive and LI
describing feelings of, well constructed, not natural to natural, uncomfortable to
comfortable, and inexpensive to expensive (see Tables 4.21 and 4.22).
159
CHAPTER V
SUMMARY, CONCLUSIONS, AND RECOMMENDATIONS
This chapter includes the following five aspects of the study: (a) summary
of the study, (b) scale reliability and tree validation, (c) summary of the findings,
(d) conclusions and implications, and (e) recommendations for further research.
Summarv of the Studv
The purpose of this study was to (a) segment the female and male leather
footwear market within a set of U.S. consumers by their footwear involvement,
and (b) identify extrinsic and intrinsic product attributes that influence their
purchase behavior for leather dress shoes for business wear.
The population for the study was employed females and males age 25 to
65 years in the U.S. who wore leather dress shoes to work at least one day a
week. A national cross-section of 1,000 female and 1,000 male consumers was
drawn for the study. National Demographics & Lifestyles Inc. (NDL) selected
subjects through a random sampling technique using a 752,357 female database
and a 3,327,143 male database.
The study was designed to determine (RQ -1) if High Involvement (HI) and
Low Involvement (LI) consumers can be grouped by their assessment of the
footwear purchase criteria and footwear characteristics of leather dress shoes for
business wear, and (RQ -2) if HI and LI consumers can be classified on their
160
leather footwear purchase behavior, thus benefiting the retailer selling leather
shoes to HI and LI consumers in footwear purchase criteria and footwear
characteristics.
A self-administered mail questionnaire was constructed to obtain
information regarding the respondent's (a) footwear opinion leadership, (b)
preferences regarding footwear worn for business wear, (c) favorite and
purchased footwear brands, (d) stores shopped for footwear, (e) footwear
involvement, (f) footwear purchase criteria, (g) footwear consumption patterns,
(h) footwear characteristics, and (i) personal characteristics.
The research data were collected using the Total Design Method (Salant
& Dillman, 1994) for implementing mail surveys. During the summer of 1998,
2,000 questionnaires were sent to 1,000 females and 1,000 males. Participation
was voluntary and respondents were informed of the confidentiality of the
investigation and rights as human subjects.
A complete implementation theme was followed for collection of the
research data. Correspondence was personalized, and all questionnaires were
numbered so that non-respondent, follow-up procedures could be efficiently and
economically implemented. The initial mailing was executed one week after a
preliminary postcard was sent. Twelve days after the initial mailing, a follow-up
postcard was sent to all non-respondents from the first mailing. A second mailing
was mailed to all non-respondents three weeks after the initial mailing. Eight
161
weeks after initiating data collection, 245 questionnaires, 139 female and 116
male, were processed, data tabulated, and subjected to statistical analysis.
Statistical procedures used to answer the research questions addressed
the following objectives: (a) identifying predictor variables from footwear
purchase criteria and footwear characteristics using AnswerTree(g) to create
decision trees, (b) identifying nodes from decision trees having the highest
proportion of HI and LI consumers (i.e., HI and LI that are most likely to purchase
leather dress shoes for business wear), (c) calculating percentage of HI and LI
consumers that leather dress shoe retailers can reach by targeting a certain
percentage of the market, and (d) identifying HI and LI consumer characteristics
in regard to their ratings of footwear purchase criteria and footwear
characteristics.
Summarv of the Findings
Personal Characteristics
Personal characteristics were defined as family size, number of children,
current employment of adults in the home, martial status, sex, age, education,
present employment status, occupational category, employment orientation,
length of time not employed, geographic region, city size, ethnic background, and
income.
162
1. (a) The majority of female respondents were 36 to 55 years old
(68.3%) with a mean age of 43.9 years. The highest percentage was married
(43.9%), with 23.0% divorced and 20.1% single, never married. They were
college graduates (28.1%) or had some college (24.5%), and the highest
percentage (48.9%) had household incomes between $35,000 and $74,999.
Most (84.2%) working females were Caucasian, Non-Hispanic.
1. (b) A majority of males were 36 to 55 years old (67.2%) with a mean
age of 43.4 years and, were married (87.9%). They were college graduates
(25.0%) or had graduate degrees (25.0%), and a majority (51.7%) had household
incomes between $50,000 and $100,000. Most (88.8%) working males were
Caucasian, Non-Hispanic.
2. (a) The female respondents' family size included two persons (34.5%)
or one person (29.5%). A majority (69.8%) of the females did not have children
living at home. Residence was in urban areas (58.9%), primarily in three
regions: Midwest (30.2%), Northeast (29.5%), and South (18.7%).
2. (b) The male respondents' family size included two persons (31.0%) or
four persons (25.9%). The largest percentage (43.1%) of the males did not have
children living at home, with 25.0% having one child at home. Residence was in
urban areas (57.8%), primarily in the Midwest (36.2%) and Northeast (24.1%).
3. (a) Females were currently employed (97.1%), and their current
employment was not (91.4%) their first job. A majority (80.6%) of the females
were full-time employees, with 17.3% working part-time. They were in
163
professional/technical (51.1%) occupations and were career-oriented (74.8%).
3. (b) Males were currently employed (96.6%), and their current
employment was not (87.9%) their first job. A majority (94.0%) were full-time
employees, with 3.4% working part-time. They were in professional/technical
(46.6%) or manager/administrator (33.6%) occupations and were career-oriented
(87.1%).
Footwear Opinion Leadership
Footwear opinion leadership was analyzed to determine the level of
fashion leadership toward leather dress shoes worn for business wear.
1. (a) Females were indifferent to trying new fashion ideas before co
workers. Females agreed or were indifferent as to wearing clothes to work that
were of the latest styles.
1. (b) Males were either indifferent or strongly disagreed to trying new
fashion ideas before co-workers. Males were indifferent or agreed as to wearing
clothes to work that were of the latest styles.
2. (a) Females agreed that they liked to try new and different places to
shop for clothing but were indifferent to visiting a new store first.
2. (b) Males were indifferent or agreed to trying new and different places
to shop for clothing but did not agree with visiting new clothing stores first.
3. (a) For females, quality, comfort, and styling were highly important
when purchasing leather dress shoes.
164
3. (b) For males, comfort, quality, and styling were highly important when
purchasing leather dress shoes.
Footwear Preferences
Footwear shopping preference data were analyzed to determine shopping
preferences toward leather dress shoes for business wear.
1. (a) Females paid from $10 and less to $299 at regular price, with the
majority paying between $50 and $99. As to sale price, the amount paid was
from $10 and less to $199, with most paying $40 to $99.
1. (b) Males paid from $10 and less to $499 at regular price, with the
majority paying between $50 and $199. As to sale price, the amount paid was
from $10 and less to $299, with most paying $50 to $199.
2. (a) Females had not purchased shoes from a catalog in the past two
years or had purchased one pair. Females were satisfied with catalog
selections.
2. (b) Males had not purchased shoes from a catalog in the past two
years and were somewhat satisfied with selections.
3. (a) Females were satisfied with their retail shoe purchases and
purchased two to ten pairs in retail stores during the past two years.
3. (b) Males were satisfied or very satisfied with their retail shoe
purchases and purchased one to four pairs in retail stores during the past two
years.
165
4. (a) Females wore leather footwear to work five times or three times
during a typical week. A majority stated that lower price and better comfort were
reasons to purchase more leather dress shoes for business wear.
4. (b) Males wore leather footwear to work five times during a typical
week. A majority stated that lower price was the reason to purchase more
leather dress shoes for business wear
5. (a) Females considered foot health good. As to shoe size length,
females ranged in length from TA to 9, most wore a shoe size width of B and/or
M. Fitting problems were side width and heel width.
5. (b) Males considered foot health good. As to shoe size length, males
ranged from 8!4 to 11, while the largest percentage wore a shoe size width of D
and/or EW. No fitting problems were cited.
6. (a) Females determined quality, by comfort first; price, comfort, and
style, second; and style and price third. The females (60%) indicated that they
had a favorite footwear brand.
6. (b) Males determined quality, by comfort first, comfort and price
second, and price and style third. The males (52.6%) indicated that they had a
favorite brand.
7. (a) Females responded that Nine West, Naturalizer, Liz Claiborne, and
Cole Haan were the favorite footwear brands while the most purchased footwear
brands were Nine West and Naturalizer. Females shopped for footwear at
166
department stores and shoe stores. Dillard's, Nine West, JC Penney, and Macy's
were the stores most shopped by females.
7. (b) Males responded that Florsheim, Dexter, Johnston & Murphy, and
Cole Haan, while most purchased brands were Florsheim and Dexter. Males
shopped for footwear at shoe stores and department stores. JC Penney,
Florsheim, and Dillard's were the stores most shopped by males.
Footwear Involvement
Footwear involvement data were analyzed to determine beliefs and
attitudes of participants regarding shoes for business wear.
1. Cronbach alpha coefficient on the footwear involvement scale was
0.73.
2. (a) Female respondents strongly agreed that shoes for work were
very important, lack of performance troubled them a great deal, and agreed that
they choose shoes for work very carefully, and are interested in the shoes worn
for work.
2. (b) Male respondents agreed that shoes for work are very
important, performance of shoes for work troubles them a great deal, choose
shoes for work very carefully, and are very interested in the shoes worn to work.
3. (a) Females enjoy the shoes wom to work the most, and it's a problem if
shoes are inappropriate for their job. Females were indifferent that the type of
167
shoes worn to work is compatible with how they think of themselves, but agreed
that the shoes worn to work matter a lot.
3. (b) Males enjoy the shoes worn to work the most, its a problem if
shoes are inappropriate for their job, the type of shoes worn to work is
compatible with how they think of themselves, and shoes worn to work
matter a lot.
4. (a) Females disagreed that they never were certain about their choice
of shoes purchased for work, purchasing shoes for work is complicated, when
purchasing shoes for work, it is not a big deal if they can't wear them very often,
particulariy like the type of shoes that are worn to work and, it is difficult to make
a bad choice.
4. (b) Males disagreed that they never were certain about their choice
of shoes purchased for work, purchasing shoes for work is complicated, when
purchasing shoes for work, it is not a big deal if they can't wear them very often,
particularly like the type of shoes that are worn to work and, it is difficult to make
a bad choice.
Footwear Purchase Criteria
Footwear purchase criteria data were analyzed to determine the
importance of intrinsic and extrinsic product attributes in the purchase evaluation
of leather dress shoes for business wear.
168
1. Cronbach alpha coefficient on the footwear purchase criteria scale was
0.83.
2. The classifier for the footwear purchase criteria scale was correct 67%
of the time.
3. (a) Females consider fit, quality, durability, attractiveness, comfort,
construction, color, and size very important.
3. (b) Males considered, fit, size, quality, and durability very important or
important.
4. (a) Females considered price, style, ease-of-care, fabrication, and
hand-of-leather important or very important.
4. (b) Males considered comfort, style, ease-of-care, price, fabrication,
and hand-of-leather as important.
5. (a) The working females rated versatility, shoes in wardrobe, latest
fashion, retail store or catalog, and brand as very important to important and
country-of-origin was considered not important.
5. (b) The working males rated color, construction, versatility,
attractiveness, brand, shoes in wardrobe, retail store or catalog, and latest
fashion as being important, and country-of-origin being not important.
Footwear Consumption Patterns
Footwear consumption pattern data were analyzed to determine
consumption motivation as an act toward intrinsic and extrinsic product attributes.
169
1. (a) Females purchased shoes that were basic in color and style and
preferred to have a smaller number of shoes but of high quality.
1. (b) Males purchased shoes and preferred to have a smaller number of
shoes but of high quality, that were basic in color and style, and were worn more
often.
2. (a) Females could not decide between versatility and durability,
comfort and attractiveness, quantity and price, and quantity and usage.
2. (b) Males could not decide between versatility and durability, comfort
and attractiveness, and quantity and price.
Footwear Characteristics
Footwear characteristic data were analyzed to determine feelings as a
motivation toward intrinsic and extrinsic product attributes.
1. Cronbach alpha coefficient on the footwear characteristics scale was
0.74.
2. The classifier for the footwear characteristics scale was correct 66% of
the time.
3. (a) Females stated their feelings were related to 70% of the intrinsic
and 57.1% of the extrinsic characteristics. The intrinsic were fit, construction,
comfort, quality, touch, color, and care. The extrinsic were durability, fashion,
attractiveness, and versatility.
3. (b) Males stated their feelings were related to 80% of the intrinsic and
170
42.9% of the extrinsic characteristics. The intrinsic were fit, construction, quality,
color, comfort, natural leather, care, and breathabllity. The extrinsic were
durability, brand, and versatility.
4. (a) Working females did not express exact feelings related to three
intrinsic characteristics (i.e., conservative versus casual, not breathable versus
breathable, and not natural versus natural) and three extrinsic characteristics
(i.e., contemporary versus traditional, inexpensive versus expensive, and
unfamiliar brand versus familiar brand).
4. (b) Working males did not express exact feelings related to four
extrinsic characterisfics (i.e., unfashionable versus fashionable, contemporary
versus traditional, inexpensive versus expensive, and unattracfive versus
attracfive) and two intrinsic characterisfics (i.e., conservative versus casual and
hard to the touch versus soft to the touch).
Research Question 1
Refer to Table 5.1 for a summary of the decision trees. Involvement levels
are described by leather footwear purchase criteria and characteristics.
Research Question 2
HI footwear purchase criteria consumers. To reach 50% of HI consumers,
29.44% of the market should be targeted. The percentage reached can be
increased to 100% by including all of the "best" nodes (see Table 4.19). HI
171
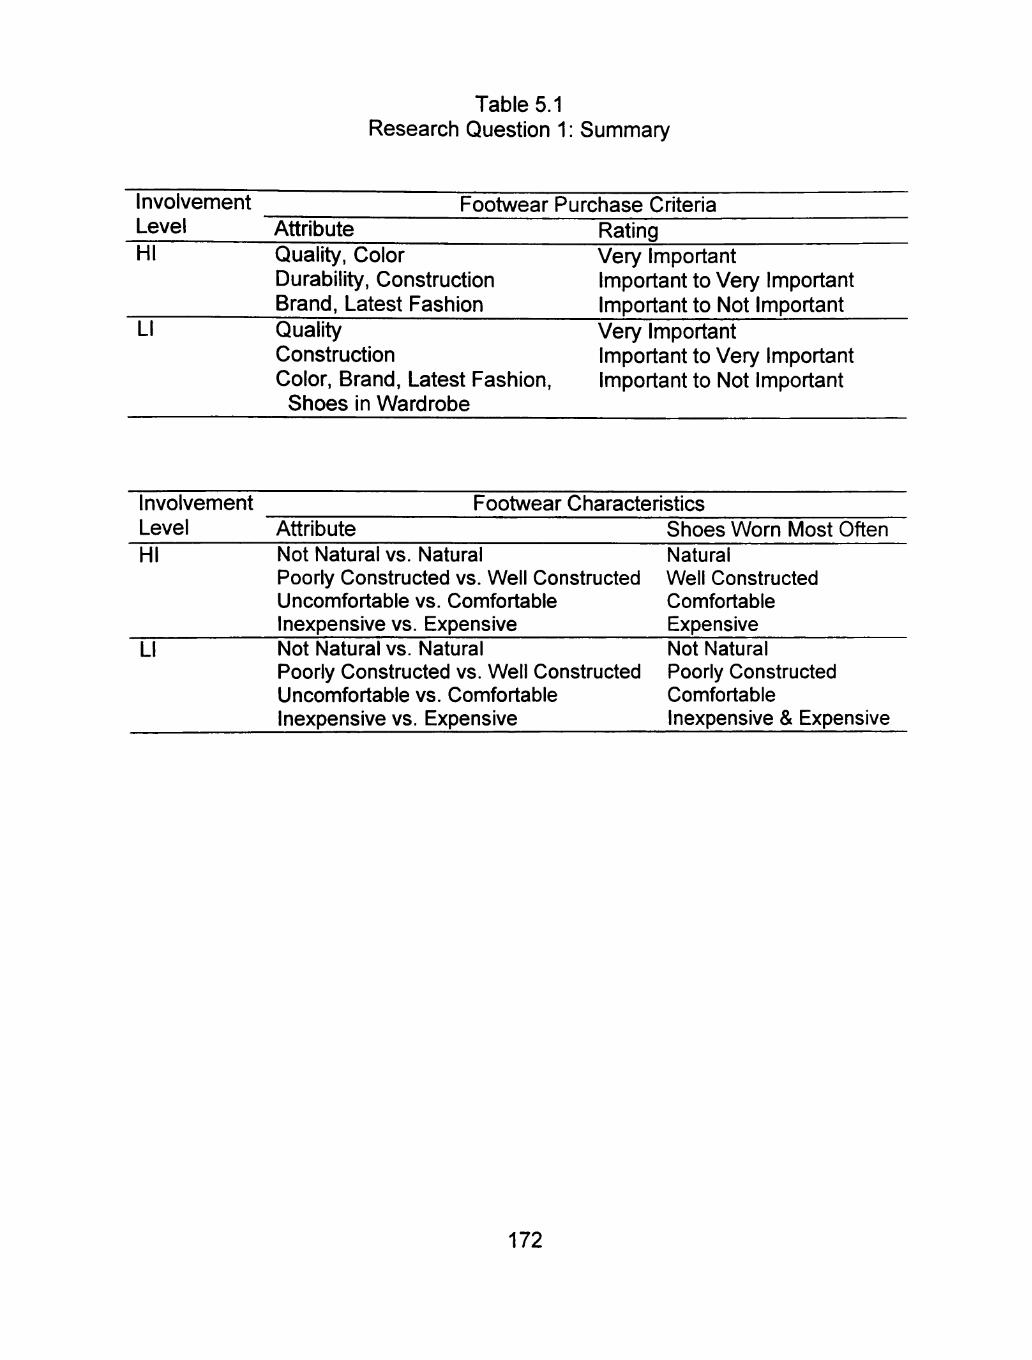
Table 5.1 Research Question 1: Summary
Involvement Level HI
LI
Footwear Purchase Criteria Attribute Quality, Color Durability, Construcfion Brand, Latest Fashion Quality Construction Color, Brand, Latest Fashion,
Shoes in Wardrobe
Rating Very Important Important to Very Important Important to Not Important Very Important Important to Very Important Important to Not Important
Involvement Level HI
LI
Footwear Characteristics Attribute Shoes Worn Most Often Not Natural vs. Natural Natural Poorly Constructed vs. Well Constructed Well Constructed Uncomfortable vs. Comfortable Comfortable Inexpensive vs. Expensive Expensive Not Natural vs. Natural Not Natural Poorly Constructed vs. Well Constructed Pooriy Constructed Uncomfortable vs. Comfortable Comfortable Inexpensive vs. Expensive Inexpensive & Expensive
172
footwear consumers were characterized by quality (Important to Very Important),
construcfion (Important to Very Important), color (Not Important to Very
Important), and brand (Not important to Very Important) in their purchase criteria
for leather dress shoes worn for business activities.
LI footwear purchase criteria consumers. To reach 50% of LI consumers,
31.98% of the market must be targeted. The percentage reached can be
increased to 100% by including all of the "best" nodes (see Table 4.20). LI
footwear consumers were characterized by quality (not important to important)
and construcfion (not important to important) in their purchase criteria for leather
dress shoes worn for business activities.
HI footwear characteristics consumers. To reach 50% of HI consumers,
55.72% of the market should be targeted. The percentage reached can be
increased to 100% by including all of the "best" nodes (see Table 4.21). HI
footwear consumers were characterized by not natural versus natural (not natural
and natural), pooriy constructed versus well constructed (well constructed),
uncomfortable versus comfortable (comfortable), and inexpensive versus
expensive (expensive) in describing a pair of leather dress shoes most often
worn to work.
LI footwear characteristics consumers. To reach 50% of LI consumers,
33.84% of the market should be targeted. The percentage reached can be
increased to 100% by including all of the "best" nodes (see Table 4.22). LI
footwear consumers were characterized by not natural versus natural (not natural
173
and natural), pooriy constructed versus well constructed (pooriy constructed and
well constructed), uncomfortable versus comfortable (uncomfortable and
comfortable), and Inexpensive versus expensive (inexpensive and expensive) in
describing a pair of leather dress shoes most often worn to work.
Conclusions and Implications
Retailers often want to know how to more effectively tailor their marketing,
advertising, and promofional activities based on a specific market segment to
which a consumer belongs but lack precise identifiers needed to predict group
membership. Overall, the analyses offer considerable support for the
assumption that (a) the female and male leather footwear market within a set of
U.S. consumers can be segmented by their footwear involvement, and (b)
identified extrinsic and intrinsic product attributes can influence their purchase
decisions for leather dress shoes worn for business wear.
Classificafion analysis can address target markefing by assigning High
Involvement (HI) and Low Involvement (LI) consumers to groups based on
footwear purchase criteria and footwear characteristics. Then market share can
be predicted in terms of the contributions each product attribute makes to the
share. Therefore, product development and introduction, retail merchandise
assortments, and market share predictions can be built on a data set with both
group membership and individual characterisfics.
174
Research that addresses large quantities of categorical variables and is
product-person-situatlonal specific has the potential to assist marketers in
making the retail environment more productive, thereby increasing customer
satisfaction with a purchased product, brand and store loyalty, repeat purchases,
and ulfimately profitability and market share. This study demonstrated that data
reducfion and variable screening have the potential to more accurately segment
and classify consumers with regard to leather footwear purchased and worn for
business activities.
Consumers benefit by market segmentation classification by having the
right merchandise mix available that better match product preferences and
product usage situafions. Results of segmentafion research in the footwear
market by product involvement and product attributes can contribute to the body
of knowledge in consumer behavior research related to apparel products and
assist manufacturers and retailers in meeting the needs of consumers in a
specific product classificafion, leather footwear for business wear.
Research Question 1
In terms of purchase criteria, (HI) consumers tended to consider quality,
color, durability, and construcfion to be important to them when purchasing
leather dress shoes used for business wear. Low Involvement (LI) consumers
were influenced by quality and construcfion. The differences among the two
consumer groups is consistent with the study by Thomas, Cassill, and Forsythe
175
(1991) that showed apparel product involvement is mulfi-dimensional and that
there are underlying dimensions of involvement.
As to attribute categories, both involvement groups considered intrinsic
attributes (HI - quality, color, durability, construcfion/ LI - quality and
construcfion) as very important to important in the product evaluafion and
purchase decision of leather footwear for business wear. Extrinsic attributes (HI
- brand, latest fashion/ LI - brand, latest fashion, shoes in wardrobe) were
considered as not important to important. According to Cox (1962) and Olson
(1977), intrinsic cues are likely to have a higher "predictive" value and extrinsic
cues are not universal but moderated by consumer individual differences (Lee &
Yung-Chien, 1995/1996).
The number of attributes (HI - 4 intrinsic, 2 extrinsic/ LI - 3 intrinsic, 3
extrinsic) used in the evaluation and purchase decision of leather footwear was
consistent with previous findings in which the number of product attributes in a
specific purchase situation was typically small (i.e., range of 3 to 7) (Ettenson,
Wagner, & Gaeth, 1988; Hsiao & Dickerson, 1995). Quality was considered by
HI and LI consumer groups as very important in the evaluafion and purchase of
leather footwear for business wear. Perceived quality in evaluafing apparel has
been well documented in the literature (Forsythe, 1991; Heisey, 1990; Hines &
O'Neal, 1995; Abraham-Murali & Littrell, 1995b). Results show consumers ufilize
mulficue Indicators, intrinsic and extrinsic, to measure apparel quality. As a
176
result, the issue of product attribute ufilizafion by consumers in apparel quality
judgments is an integral element in marketing strategy.
HI and LI consumers considered brand as important to not important
criterion in the purchase decision of leather dress shoes for business wear.
Product involvement was reported to be important in the formafion of brand
loyalty by Jin and Koh (1999) and Huddleston et al. (1993). Warrington and
Shim (2000) found product involvement and brand commitment were not highly
related. Forsythe (1991) proved that the absence of a significant relationship
between brand name and perception of quality among shoppers showed that
consumers rely primarily on actual product characteristics as an indicator of
product quality.
In terms of footwear characterisfics, HI and LI consumers placed similar
importance on footwear attributes, although the intensity of some product
descriptors differed between the two groups. HI consumers considered
characteristics of the shoes most often worn for work activifies natural, well
constructed, comfortable, and expensive, LI consumers considered footwear
characterisfics as not natural, poorly constructed, comfortable, and inexpensive
or expensive. This suggests that product attributes that influence consumers'
footwear purchase decisions may be similar but differences in market strategy
may be important in targefing HI and LI consumers.
177
Research Quesfion 2
Results of this study demonstrate that footwear purchase criteria and
footwear characterisfics operafionalizid by intrinsic and extrinsic product
attributes can be used to provide a profile for HI and LI consumer groups. To
target HI consumers, manufacturers and retailers should use this information to
identify product characteristics that connate the intrinsic attributes of quality and
construcfion and the extrinsic attribute of brand in the minds of the consumers on
labeling, advertising, and merchandising strategies based on product knowledge.
Bei and Widdows (1999) showed product involvement interacted with product
informafion and product knowledge. High involvement consumers are perceived
to have engaged in more complex purchasing decisions and are more brand
loyal (Zaichowsky, 1985). HI consumers may have more product knowledge and
perceive the quality and construcfion of shoes differently than LI consumers.
When targeting LI consumers, manufacturers and retailers should plan
merchandise assortments introducing high to low price levels in nafional brand
and private-label footwear and develop point-of-purchase displays and in-store
promotions that focus on quality descriptors and construction features to
sfimulate interest in leather footwear for business wear. Low Involvement (LI)
consumers have been identified as spending a small amount of fime actively
seeking informafion about brands and comparison-shopping (Warrington & Shim,
2000; Jin & Koh, 1999). By concentrafing on making the shoe purchase process
easy and convenient for LI consumers, manufacturers and retailers may possibly
178
create more interest during the product evaluafion and purchase phases,
increase sales, and gain market share.
Recommendations for Further Research
This study extended the research in the area of market research with
respect to product involvement and product attributes associated with a fashion
related product category. Significant results were found in analyzing the
research questions through decision tree analyses. Further research could:
Sample
1. Replicate a study of similar design with more diverse consumers (e.g.
African-Americans, Hispanics). The findings would better reflect the
demographic population in the US.
Data Collection
1. Replicate a study of similar design in a different fime frame (e.g.
September, October, November). As the data were collected in June, July,
August, a fime period many employed consumers are involved in relocation and
vacation activifies and perhaps not as predisposed to answering and returning
mail surveys. Findings with a larger sample and higher response rate would
verify if the results could be generalized to a wider populafion.
179
Instrument Design
1. Test the proposed research questions with open-ended questions
eliciting free response data obtained from in-depth interviews and/or focus group
sessions. Findings would generate product attributes grounded in the
consumers' vocabulary and counteract quantitative bias associated with
preselected evaluative criteria and product attribute rating and ranking scales.
2. Replicate a study of similar design that includes the business casual
dress usage situation. Findings would better reflect current business wear trends
and render more accurate segmentation.
3. Assess the consumption patterns for footwear on a 7-point Likert-type
scale ranging from strongly agree (7) to strongly disagree (1), with a mid-point of
indifferent (4). A Likert-type scale would perhaps generate more accurate and
measurable responses.
4. Assess perceived product quality with open-ended questions regarding
what attributes contribute to the quality of leather footwear. Responses would
provide insight as to how consumers categorize footwear quality and reflect the
intrinsic and extrinsic criteria used to make quality judgments.
5. Assess comfort and construction with open-ended quesfions regarding
what product characteristics contribute to the evaluation of comfort and
construction of leather footwear. Responses would provide insight as to the
product features consumers consider as determinants of comfort and
construction in leather footwear.
180
REFERENCES
Aaker, D.A., & Day. G.S. (1990). Markefing Research. (4 ^ Ed.). New York: John Wiley and Sons.
Abraham-Murali, L., & Littrell, M.A. (1995a). Consumers' conceptualizafion of apparel attributes. Clothing and Textiles Research Journal. 13(2). 65-74.
Abraham-Murali, L., & LIttrell, M.A. (1995b). Consumers' perceptions of apparel quality over fime: An exploratory study. Clothing and Textiles Research Journal. 13(3). 149-158.
Ambler, T. (1999, July 8). More choice for marketers can lead to misplaced random bets. Markefing. 16. 45-47.
Anderson, N.H. (1981). Foundations of informafion integrafion theory. New York: Academic Press.
Andrews, J.C, Durvasula, S., & Akhter, S.H. (1990). A framework for conceptualizing and measuring the involvement construct in advertising research. Journal of Advertising. 19(4). 27-40.
Assael, H. (1984). Consumer behavior and marketing action. Boston, MA: Kent Publishing.
Ballance, R.H., Robyn, G., & Forstner, H. (1993). The worid's leather & leather products industry. Liverpool, UK: United States Industrial Development Organization.
Bartos, R. (1982). The moving target: What every market should know about women. New York: The Free Press.
Baugh, D.F., & Davis, L.L. (1989). The effect of store image on consumer percepfions of designer and private label clothing. Clothing and Textiles Research Journal, 7(3). 15-21.
Beatty, S.E., Kahle, LR., & Homer, P. (1988). The involvement-commitment model: Theory and implicafions. Journal of Business Research, 16(2). 149-167.
Beaudoln, P., Moore, M.A., & Goldsmith, R.E. (2000). Fashion leaders' and followers' attitudes toward buying domestic and imported apparel. Clothing and Textiles Research Journal. 18(1), 56-64.
181
Bei, L., & Widdows, R. (1999, Summer). Product knowledge and product involvement as moderators of the effects of information on purchase decisions: A case study using the perfect informafion frontier approach. The Journal of Consumer Affairs. 33(1). 165-186.
Best footwear foHA/ard. (2000, January/February). World Footwear. 14(1), 71-72.
Bloch, P. (1981). An exploration into the scaling of consumers' involvement with a product class. Advances in Consumer Research, 8. 61-65.
Boettge, B. (2002, December/January). The independent shoe retailer in 2002. American Shoemaking. 375(8). 20.
Buirski, D. (1999, November). Forecasfing the footwear industry. Worid Leather, 12(7), 56.
Cassill, N.L. (1990). Employment orientafion of women as a market segmentafion variable for apparel. Clothing and Textiles Research Journal, 9(1). 59-64.
Cassill, N.L., & Drake, M.F. (1987). Apparel selecfion criteria related to female consumers' lifestyle. Clothing and Textile Research Journal. 6(1). 20-28.
Celsl, R.L., & Olson, J.C. (1988, September). The role of involvement in attenfion and comprehension processes. Journal of Consumer Research, 15. 210-224.
Chaiken, S. (1980). Heurisfic versus systematic information processing and the use of source versus message cues in persuasion. Journal of Personality and Social Psychology. 39(5). 752-766.
Charlesworth, J. (2001, July/August). Effect of new technology on footwear education and training. World Footwear. 15(4). 57-58.
Components go ecological. (2001, May/June). Worid Footwear. 15(3). 29-34.
Cox, D.G. (1962, December). The measurement of information value: A study in consumer decision-making. Emerging Concepts in Marketing. American Marketing Proceedings, 413-421.
Creusen, M., & Schoormans, J. (1997). The nature of differences between similarity and preference judgments: A replication with extension. International Journal of Research in Marketing. 14. 81-87.
182
Cross, L. (1999). Segmentation: When less is more. Graphic Arts Monthly. 71(6). 124.
Danneels, E. (1996). Market segmentation: Normative model versus business reality. European Journal of Marketing. 30(6). 36-51.
Davis, L.L. (1985). Effects of physical quality and brand labeling on perceptions of clothing quality. Perceptual and Motor Skills. 61. 671-677.
Davis, L.L. (1987). Consumer use of label information in ratings of clothing quality and clothing fashionability. Clothing and Textiles Research Journal, 6(1), 8-14.
Developments in Footwear Distribution. (2000, May/June). Worid Footwear. 14,(3), 41-45.
Dhalla, N.K., & Mahatoo, W.H. (1976). Expanding the scope of segmentation research. Journal of Marketing. 40. 34-41.
Dickson, P.R., & GInter, J.L. (1987). Market segmentation, product differentiation, and marketing strategy. Journal of Marketing. 1(10). 1-10.
Dodds, W.B., Monroe, K.B., & Grewal, D. (1991, August). Effects of price, brand, and store information on buyer's product evaluation. Journal of Marketing Research. 28. 307-319.
Eckman, M. (1997). Attractiveness of men's suits: The effect of aesthetic attributes and consumer characteristics. Clothing and Textiles Research Journal. 15(4). 193-202.
Eckman, M., Damhorst, M.L., & Kadolph, S.J. (1990, Winter). Toward a model of the in-store purchase decision process: Consumer use of criteria for evaluating women's apparel. Clothing and Textile Research Journal. 8(2). 13-22.
Engel, J.F., Blackwell, R.D., & Minlard, P.W. (1986). Consumer behavior. (5 ^ ed.). New York: Dryden Press.
Ericksen, M.K., & Sirgy, M.G. (1985). Employed females' clothing preferences, self-image congruence, and career anchorage. Journal of Applied Social Psychology. 22. 408-422.
183
Ettenson, R., Wagner, J., & Gaeth, G. (1988, Spring). Evaluating the effect of country-of-origIn and the 'Made in the USA' campaign: A conjoint approach. Journal of Retailing. 64. 84-100.
Fiore, A.M., & Damhorst, M.L (1992). Intrinsic cues as predictors of perceived quality of apparel. Journal of Satisfaction. Dissatisfaction and Complaining Behavior. 5. 168-178.
Fishbein, M. (1967). A behavior theory approach to the relations between beliefs about an object and the attitude toward the object. In M. Fishbein (Ed.), Readings in attitude theory and measurement. New York: John Wiley, 389-399.
Flynn , L.R., & Goldsmith, R.E. (1993, July/August). Application of the personal involvement inventory in marketing. Psychology & Marketing. 10(4), 357-366.
Forsythe, S.M. (1988). Effects of brand name on perceptions of product quality and price. In Robert King (Ed.), Retailing: Its present and future. Proceedings of the National Retailing Conference, 6, 171-176.
Forsythe, S.M. (1991). Effect of private, designer, and national brand names on shopper's perception of apparel quality and price. Clothing and Textiles Research Journal. 9(2). 1-6.
Frank, R.E., Massy, W.F., & Wind, Y. (1972). Market segmentation. Englewood Cliffs, NJ: Prentice-Hall.
Footwear market grows while domestic producers suffer. (2000, September/October), Worid Footwear. 14(5), 39-42.
Geistfeld, L.V., Sproles, G.B., & Badenhop, S.B. (1977). The concept and measurement of a hierarchy of product characteristics. Advances in Consumer Research. 4. 302-307.
Global shoemaking grows again. (2001, May/June). Worid Footwear. 15(3). 23-27.
Goldmith, R.E., & Hofacker, C.F. (1991). Measuring consumer innovativeness. Journal of the Academy of Marketing Science. 19(3). 209-221.
Green, P.E., & Tull, D.S. (1978). Research for Marketing Decisions. (4 ^ Ed.), New York: Prentice-Hall.
184

Grier, S.A., & Brumbaugh, A.M. (1999). Noticing cultural differences: Ad meanings created by target and non-target markets. Journal of Advertising. 28(1). 79-93.
Growth of branding. (2001, July/August). Worid Footwear. 15(4). 17-21.
Han, M.C., & Terpstra, V. (1988, Summer). Country-of-origin effects for uni-national and bi-national products. Journal of International Business Studies. 235-255.
Harp, S.S., Moore, C.L.W., & Horridge, P.E. (2001). A focus group examination of the role of product attributes in footwear shopping in the United States. In H. Timmermans (Ed.). European Institute of Retailing and Services Science Conference Proceedings. 64.
Hatch, K.L., & Roberts, J.A. (1985). Use of intrinsic and extrinsic cues to assess textile product quality. Journal of Consumer Studies and Home Economics. 9. 341-357.
Hawes, J.M., & Lumpkin, J.R. (1984, Fall). Understanding the outshopper. Journal of the Academy of Marketing Science. 12. 200-218.
Haynes, J.L., Pipkin, A.L., Black, W.C, & Cloud, R.M. (1994, Spring). Application of a choice sets model to assess patronage decision styles of high involvement consumers. Clothing and Textiles Research Journal. 12(3). 22-32.
Heisey, F.L. (1990, Summer). Perceived quality and predicted price: Use of the minimum information environment in evaluating apparel. Clothing and Textiles Research Journal. 8(4). 22-28.
Henricks, M. (1997, October). Shoe companies get a foot in the door. Apparel Industry Magazine, 48-52.
Hines, J.D., & O'Neal, J.D. (1995). Underlying determinants of clothing quality: The consumers' perspective. Clothing and Textiles Research Journal, 13(4), 227-233.
HIavaty, V.T., Harp, S.S., & Horridge, P.E. (1997). A South Korean consumer typology based on fashion opinion leadership. Journal of Fashion Marketing and Management. 1(2). 125-141.
Howard, J.A., & Sheth, J.N. (1969). The theory of buyer behavior. New York: John Wiley.
185
Hsiao, C.F., & Dickerson, K. (1995). Evaluative criteria for purchasing leisure wear: Taiwanese and U.S. students In a U.S. university. Journal of Consumer Studies in Home Economics. 19. 145-153.
Huddleston, P., Cassill, N.L., & Hamilton, L.K. (1993, Fall). Apparel selection criteria as predictors of brand orientation. Clothing and Textile Research Journal. 12(1). 51-56.
Jain, L. & Srinivassan, N. (1990). An empirical assessment of multiple operationalizations of involvement. In M. Goldberg, G. Gorn, and R. Pollay (Eds.), Advances of Consumer Research : Vol. 17. Provo, UT: Association for Consumer Research, 594-602.
James, J., Brinberg, D., & Ackerman, L.J. (1986). Assessing attribute importance: A comparison of six methods. Journal of Consumer Research, 12. 463-468.
Jin, B., & Koh, A. (1999). Differences between South Korean male and female consumers in the clothing brand loyalty fomriation process: Model testing. Clothing and Textiles Research Journal. 17(3). 117-127.
Johnson, K.K.P., & Workman, J.E. (1990, December). Effect of fiber-content information on percepfion of fabric characteristics. Home Economics Research Journal. 19(7). 132-138.
Kahle, L.R., & Homer, P.M. (1990). Source expertise, time of source identlficafion, and involvement in persuasion: An elaborative processing perspective. Journal of Advertising, 19(1). 30-39.
Kassarijian, H.H. (1985). Low Involvement: A second look. In K. Monroe (Ed.), Advances in Consumer Research. 8. Ann Arbor: Associafion for Consumer Research, 31-34.
Kelly, F. (1998). The key to keeping shoppers loyal. Marketing Magazine. 103(12), 10.
Kim, C, Laroche, M.K., & Joy, A. (1990). An empirical study of the effects of ethnicity on consumption patterns in a bi-cultural environment. In T. C. Kinnear (Ed.), Advances in Consumer Research 17. Provo, UT: Association for Consumer Research, 839-846.
Kim, Y-K., & Lee, J. (2000). Benefit segmentafion of catalog shoppers among professionals. Clothing and Textile Research Journal. 18(2). 111-120.
186
Kohli, A.K, & Jaworski, B.J. (1990). Market orientafion: The construct, research propositions, and managerial implications. Journal of Markefing. 54. 1-13.
Kotler, P. (1988). Markefing management. Englewood Cliffs, NJ: Prenfice-Hall.
Lai, A.W. (1991, January). Consumption situation and product knowledge in the adoption of a new product. European Journal of Marketing. 25(10), 55-67.
Lambert, Z.V. (1972). Price and choice behavior. Journal of Marketing Research. 9. 35-40.
Laurent, G., & Kapferer. J. (1985. February). Measuring consumer involvement profiles. Journal of Mari<eting Research. 22. 41-53.
Lavin, M.R. (1996). Understanding the census: A guide for marketers, planners, grant writers and other data users. Buffalo, NY: Epoch Books, Inc.
Lee, M., & Yung-Chien, L. (1995/1996, Winter). Consumer reliance on intrinsic and extrinsic cues in product evaluations: A conjoint approach. Journal of Applied Business Research. 12(1). 21-29.
Lehmann, D.R. (1989). Marketing Research and Analysis. (3' Ed.). New York: InA in.
Liefeld, J., Wall, M., Ji, Y., & Xu. X. (1993). Cue interaction and cue type effects in product choice: Conjoint analysis of choice processes. American Psychological Association. Society for Consumer Psychology. 124-133.
Look of leather. (2000, May). World Leather. 13(3). 55-57.
Magdison, J. (1994). The CAID approach to segmentation modeling: Chi-squares automatic approach interaction detection. Advanced Methods of Mari<eting Research. A.P. Bagozzi (ed.). Cambridge, MA: Blackwell, 118-119.
Mahajan, V., & Jain, A.K. (1978). An approach to normative segmentation. Journal of Marketing Research. 15, 338-345.
Martin, J. (1997, November, 10). Give 'em exactly what they want. Fortune 136, 283.
May, R., Shim. S., & Kotsiopulos, A. (1992). Market segmentation of tuxedo customers. Clothing and Textiles Research Journal. 11(1), 31-38.
187
McCallin, T. (1995). Marketing leather footwear: Suggestions for new exporters. International Trade Forum 2. 10-16.
Mitchell, A. (1983). The nine American lifestyles: Who we are and where we're going. New York: McMillan.
Mittal, B. (1989, Summer). Measuring purchase-decision involvement. Psychology & Marketing. 6(2). 147-162.
Myers, J.H. (1996). Segmentation positioning for strategic marketing decisions. Chicago, IL: American Marketing Association.
Nisbett, R., & Ross, L. (1980). Human inference: Strategies and shortcomings of social judgment. Englewood Cliffs, NJ: Prentice-Hall.
Norum, P.S., & Claris, L.A. (1989). A comparison of quality and retail price of domestically produced and imported blazers. Clothing and Textiles Research Journal. 7(3). 1-9.
O'Cass, A. (2000). An assessment of consumers product, purchase decision, advertising and consumption involvement in fashion clothing. Journal of Economic Psychology. 21. 545-576.
Olson, J.C. (1977). Price as an informational cue: Effects in product evaluation. In A.G. Woodside, J.N. Sheth, & P.D. Bennett (Eds.), Consumer and Industrial Buying Behavior. New York: North Holland, 267-286.
Olson, J.C, & Jacoby, J. (1972). Cue utilization in the quality perception process. In M. Venkatesan (Ed.). Proceedings of the Third Annual Conference of the Association for Consumer Research. Ann Arbor, Ml: Association for Consumer Research, 167-179.
O'Neal, G.S., Hines, J.D., & Jackson, H.O. (1990). Interpreting the meaning of consumer perceptions of clothing quality. In P. Horridge (Ed.), ACPTC Proceedings. Monument, CO: The Association of College Professors of Textiles and Clothing, 88.
Ownbey, S.F., & Horridge, P.E. (1997). Acculturation levels and shopping orientations of Asian-American consumers. Psychology and Marketing, 14(1), 1-18.
Perspective on leather - its place in the worid. (2000, October). Worid Footwear, 13(6), 55-57.
188
Salant, P.. & Dillman, D. A. (1994). How to conduct your own survey. New York: John Wiley & Sons, Inc.
Sauerman, M. (1998). Segmentation studies should be practical. Marketing News 32(1), 11.
Schiffman, L.G., & Kanuk, L.L. (1991). Consumer behavior. Englewood Cliffs, NJ: Prentice Hall Publishing.
Sheth, J.N., Sisodia, R.S., & Sharma, A. (2000, Winter). The antecedents and consequences of customer-centric marketing. Journal of the Academy of Marketing Science. 28(1). 55-66.
Shim, S., & Bickle, M.C. (1994). Benefit segments of the female apparel market: Psychographics, shopping orientafions, and demographics. Clothing and Textile Research Journal. 12(2). 1-12.
Shim, S., & Kotsiopulos, A. (1992). Patronage behavior of apparel shopping: Part 1. shopping orientations, store attributes, infonnation sources, and personal characteristics. Clothing and Textile Research Journal, 10(2), 48-57.
Shim, S., & Kotsiopulos, A. (1991). Big and tall men as apparel shoppers: Consumer characterisfics and shopping behavior. Clothing and Textile Research Journal. 9(2). 16-24.
Sinclair, S.A., & Stalling, E.C. (1990). How to identify differences between market segments with attribute analysis. Industrial Markefing Management. 19, 31-40.
Slama, M.E. & Tashchian, A. (1987. Spring). Validafing the S-O-R paradigm for consumer involvement with a convenience good. Journal of the Academy of Marketing Science. 15. 36-45.
Slama, M.E., & Tashchian. A. (1985. Winter). Selected socioeconomic and demographic characterisfics associated with purchasing involvement. Journal of Marketing. 49(1). 72-82.
Smart, K. (2001, November/December). E-business for every business. Worid Footwear. 15(6), 33-39.
Smith, W. (1956). Product differenfiafion and market segmentafion as alternative marketing strategies. Journal of Markefing. 21, 3-8.
189
Smith, W.R. (1995). Product differenfiafion and market segmentation as alternative marketing strategies. Markefing Management. 4(3). 63-65.
Sproles, G.B.. & Kendall, E.L. (1986). A methodology for profiling consumers' decision-making styles. The Journal for Consumer Affairs. 20(2). 267-279.
Stafisfical package for the social sciences (1998). AnswerTree® 2.0 User's Guide. Chicago, IL: Author.
Summers, T.A., Belleau, B.D., & Wozniak, P.J. (1992). Fashion and shopping percepfions, demographics, and store patronage. Clothing and Textiles Research Journal. 11(1). 83-91.
Swan, J.E., & Combs, L.J. (1976). Product performance and consumer satisfaction: A new concept. Journal of Marketing. 40(2). 25-33.
Szybillo, G.J., & Jacoby, L.J. (1974). Intrinsic versus extrinsic as determinants of perceived product quality. Journal of Applied Psychology. 59(1). 74-78.
Thomas, J.B., Cassill, N.L., & Forsythe, S.M. (1991, Spring). Underlying dimensions of apparel involvement in consumers' purchase decisions. Clothing and Textiles Research Journal. 9(3). 45-48.
Traylor, M.B. (1981). Product involvement and brand commitment. Journal of Advertising Research. 21. 27-33.
Traylor. M.B. & Joseph. W.B. (1984). Measuring consumer involvement in products. Psychology & Marketing. 1(2). 65-77.
Tull, D.S., & Hawkins, D.I. (1990). Marketing Research: Measurement & Method. (5** Ed.). New York: Macmillian Publishing Company.
The up down, up down, worid of leather. (2001, September/October). World Footwear. 15(5). 41-43.
U.S. Department of Commerce-Bureau of Census. (2000). Statistical Abstract of the United States 2000. Washington, DC: Economics and Statistics Administration.
U.S. Department of Commerce - Bureau of the Census. (1993). 1990 census of the population - social and economic characteristics: Urbanized areas. Washington, DC: US Government Printing Office.
190
Vaughn, R. (1980, June 9). The consumer mind: How to tailor ad strategies. Advertising Age. 51 f25V 45-46.
Vriens, M., & Hofstede, F.T. (2000, Fall). Linking attributes, benefits, and consumer values. Markefing Research. 12(3). 4-10.
Warrington, P.. & Shim, S. (2000, September). An empirical invesfigafion of the relationship between product involvement and brand commitment. Psychology & Marketing. 17(9). 761-782.
Wedel, M., & Kamakura, W.A. (1998). Market segmentation conceptual and methodological foundations. Boston: Kluwer Academic Publishers.
Weinstein, A. (1994). Market segmentation. New York: McGraw-Hill.
Wensley, R. (1995, December). A critical review of research in marketing. British Journal of Management. 6. 563-582.
Wheatley, J.J., Chiu, J.S.Y., & Goldman, A. (1981, Summer). Physical quality, price, and perceptions of product quality: Implication for retailers. Journal of Retailing. 57(2). 101-117.
Wheatley, J.J., & Chiu, J.S.Y. (1977). The effect of price, store image, and product characteristics on perceptions of quality. Journal of Marketing Research. 14. 181-186.
Wilkie, W.L., & Cohen, J.B. (1977). An overview of market segmentation: Behavioral concepts and research approaches. Marketing Science Institute Working Paper.
Will, T.R., & Hasty, R.W. (1971). Attitude measurement under conditions of multiple stimuli. Journal of Marketing 35. 66-70.
Wind, Y. (1978, August). Issues and advances in segmentation research. Journal of Marketing Research. 15. 317-337.
World leather markets. (1998, October). Leather 2000(4680), 29-32.
Wyner, G.A. (1995). Segmentation analysis, then and now. Marketing Research. 7(1). 40-41.
Wyner, G.A. (1999/2000). Customer classificafion. Marketing Research. 11(4). 38-39.
191

Zaichkowsky. J.L. (1985. December). Measuring the involvement construct. Journal of Consumer Research. 12, 341-352.
Zaichkowsky, J.L. (1986). Conceptualizing involvement. Journal of Advertising, 15(2), 4-14, 34.
ZeithamI. V.A. (1988). Consumer perceptions of price, quality, and value: A means-end model and synthesis of evidence. Journal of Marketing. 52.2-22.
192

APPENDIX A
AMERICAN CONSUMERS' QUESTIONNAIRE
193

- A 1998 STUDY OF AMERICAN CONSUMERS --
Each time you purchase footwear, you make decisions regarding where to shop, what style and color to buy, and how much to spend. This survey is being conducted as part of an educational endeavor, by research associates at Texas Tech University in Lubbock, Texas, to better understand Americans' purchase and consumption patterns for footwear worn for business wear. We would appreciate it if you could take about 15 minutes to fill out the survey completely.
This quesfionnaire is not designed to sell you anything or solicit money from you in any way! You are one of a very small number of consumers that are being asked to provide information about shopping for footwear. Your name was drawn from a random sample of consumers from the entire United States. So that the results accurately represent the activities and opinions of American consumers, it is important that each questionnaire be completed and returned. It is also important that you, the person to whom the quesfionnaire is addressed, are the person that completes the survey.
Participation is voluntary. You may be assured of complete confidentiality. The questionnaire has an identification number for mailing purposes only. This number is necessary so that we may check your name off of the mailing list when the questionnaire is returned. Your name will never be placed on the questionnaire.
There are no right or wrong answers. If you have any questions, please call Shelley Harp or Lori Yoo at (806) 742-1762. After you have completed the questionnaire, please return it in the enclosed, p re-ad dressed, postage-paid envelope on or before August 24,1998 to: Shelley Harp, Leather Research Institute, Texas Tech University, Box 41162, Lubbock, Texas, 79409-1162
If you complete and return this survey, and want to be entered in a drawing to win a $100 U.S. Savings Bond being given in appreciation to respondents, please complete the enclosed entry card and return it with the completed questionnaire.
Leather Research Institute Texas Tech University
194

CONSUMER FOOTWEAR PROFILE
2.
3.
How would you describe your clothing and shoe purchasing practices for business wear? (Circle only One response per statement)
strongly Strongly Agree Indifferent Disagree
I often try new fashion ideas before my co-workers 5 4 3 2
It Is important that the clothes I wear to work be of the latest styles
I like to try new and different places to shop for clothing-
When a new clothing store opens, I am among the first to visit it
In purchasing leather dress shoes, I feel that quality is highly important
In purchasing leather dress shoes, I feel that fashion styling is highly important
When purchasing leather dress shoes, I feel that comfort is highly important
How often do you wear leather dress shoes to work — per week? DAYS
How much do you usually pay for a pair of leather dress shoes you wear to work?
Dollars — on sale Dollars — at regular price
4. How many pairs of leather dress shoes for business wear have you purchased for yourself during the past 2 years?
Pairs at Retail Stores
How satisfied were you with the selection in the retail stores:
• 1. Very Satisfied • 2. Satisfied • 3. Somewhat Satisfied • 4. Somewhat Dissatisfied • 5. Dissatisfied • 6. Very Dissatisfied
Pairs from Catalogs
How satisfied were you with the selection in the catalogs:
• 1. Very Satisfied • 2. Satisfied • 3. Somewhat Satisfied • 4. Somewhat Dissatisfied • 5. Dissatisfied • 6. Very Dissatisfied
195
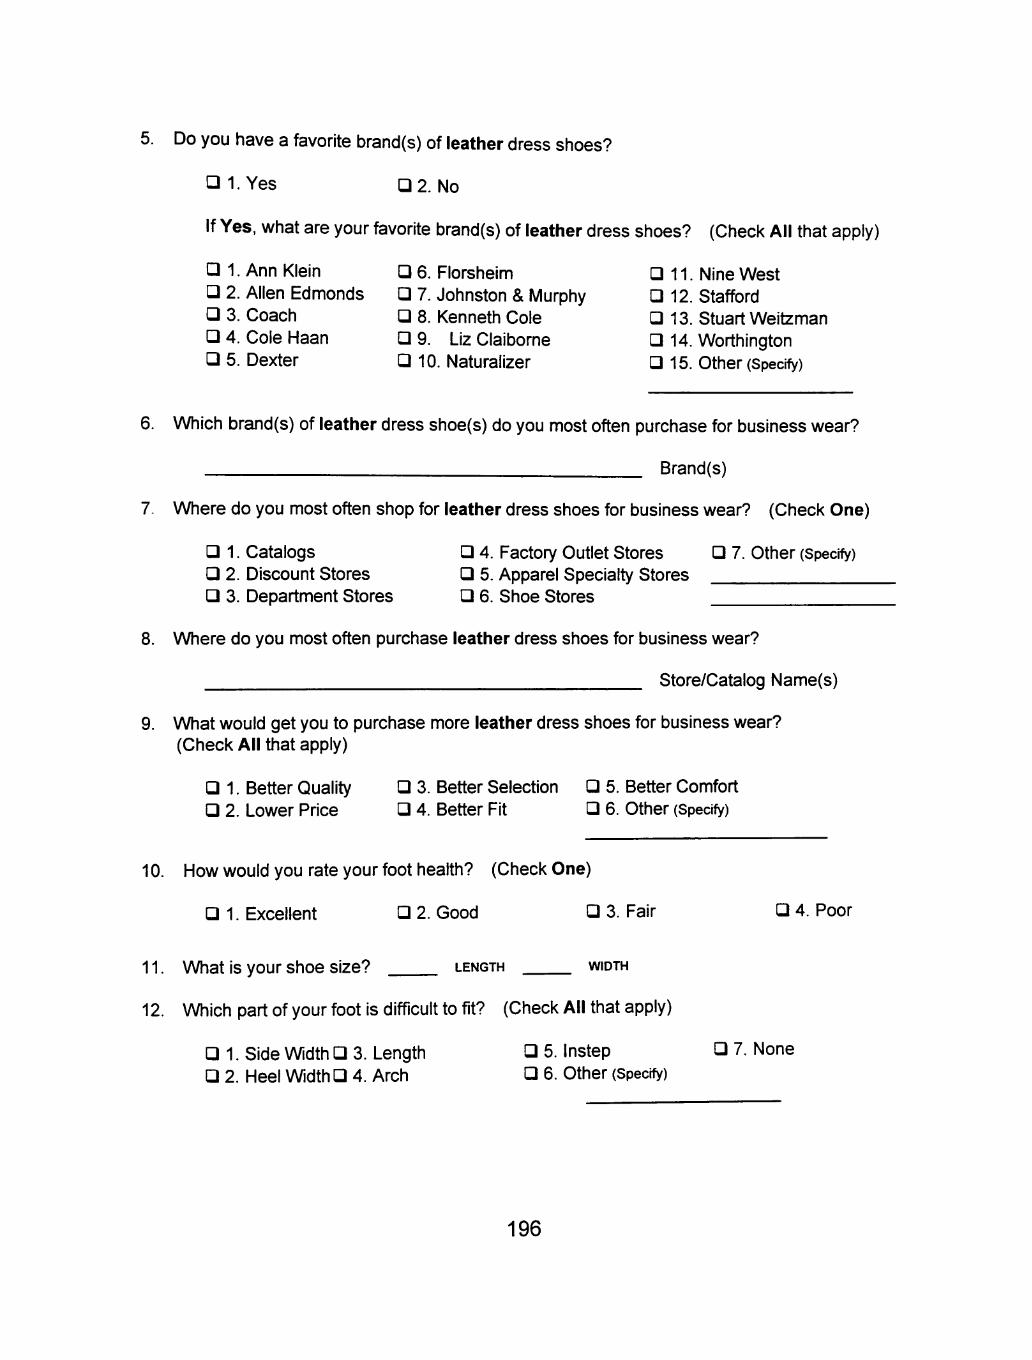
5. Do you have a favorite brand(s) of leather dress shoes?
• I.Yes 0 2. No
If Yes, what are your favorite brand(s) of leather dress shoes? (Check All that apply)
• 1. Ann Klein • 6. Florsheim a i l . Nine West • 2. Allen Edmonds • 7. Johnston & Murphy • 12. Stafford • 3. Coach • 8. Kenneth Cole • 13. Stuart Weitzman • 4. Cole Haan • 9. Liz Claiborne • 14. Worthington • 5. Dexter • 10. Naturalizer • 15. Other (Specify)
6. Which brand(s) of leather dress shoe(s) do you most often purchase for business wear?
Brand(s)
7. Where do you most often shop for leather dress shoes for business wear? (Check One)
• 1. Catalogs • 4. Factory Outlet Stores • 7. Other (Specify) • 2. Discount Stores • 5. Apparel Specialty Stores • 3. Department Stores • 6. Shoe Stores
8. Where do you most often purchase leather dress shoes for business wear?
Store/Catalog Name(s)
9. What would get you to purchase more leather dress shoes for business wear? (Check All that apply)
• 1. Better Quality • 3. Better Selection • 5. Better Comfort • 2. Lower Price • 4. Better Fit • 6. Other (Specify)
10. How would you rate your foot health? (Check One)
• 1. Excellent • 2. Good • 3. Fair • 4. Poor
11. What Is your shoe size? LENGTH WIDTH
12. Which part of your foot is difficult to fit? (Check All that apply)
• 1. Side Width • 3. Length • 5. Instep • 7. None • 2. Heel Width • 4. Arch • 6. Other (Specify)
196
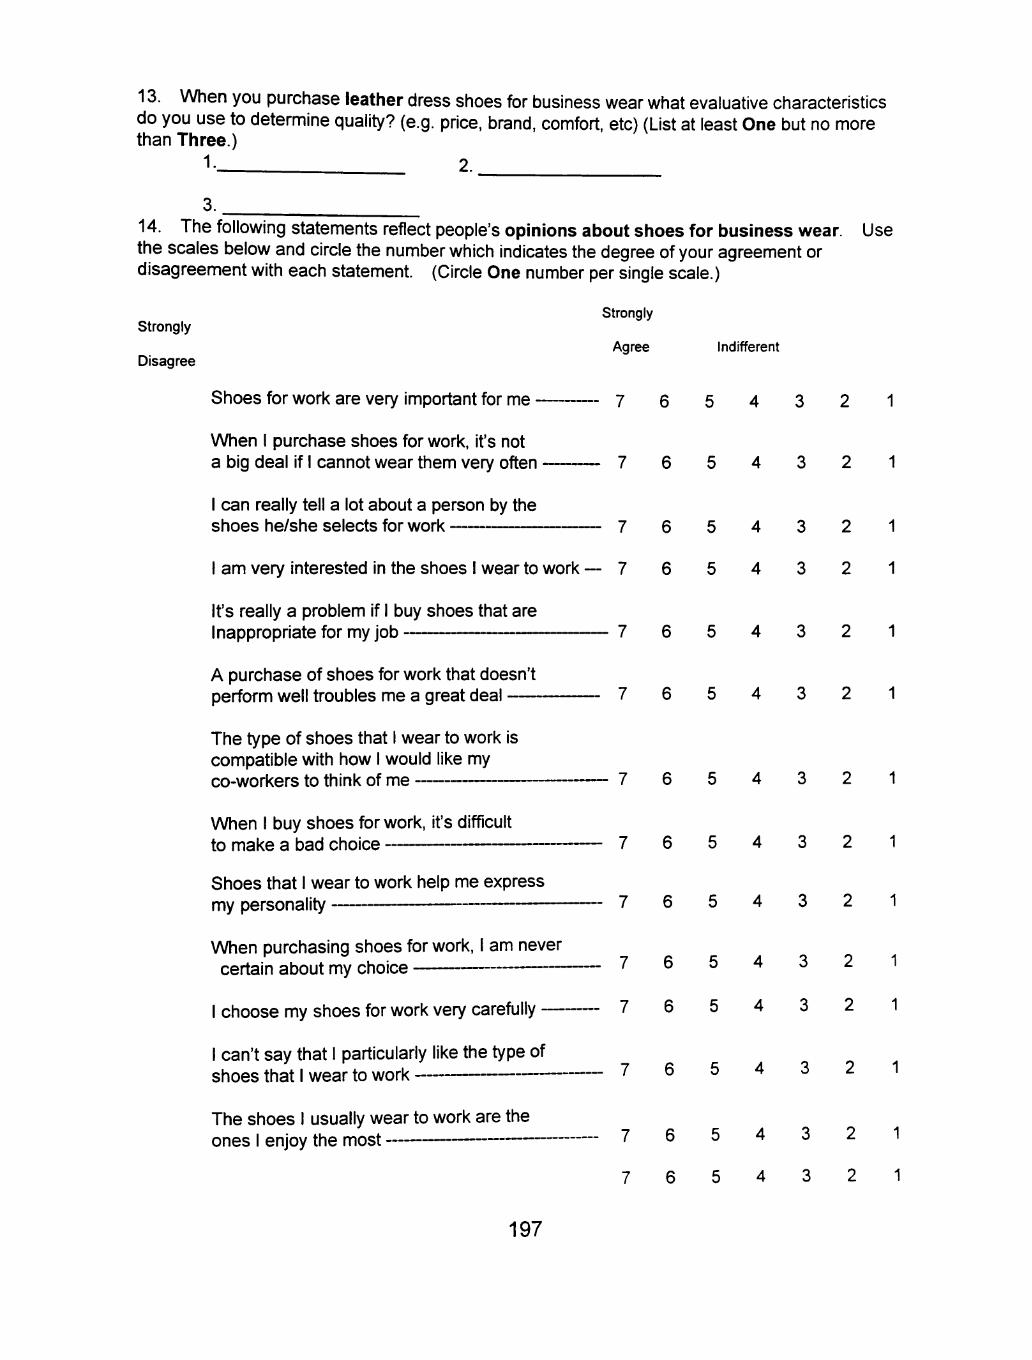
13. When you purchase leather dress shoes for business wear what evaluative characteristics do you use to determine quality? (e.g. price, brand, comfort, etc) (List at least One but no more than Three.)
1 _ 2.
14. The following statements reflect people's opinions about shoes for business wear, the scales below and circle the number which indicates the degree of your agreement or disagreement with each statement. (Circle One number per single scale.)
Use
strongly
Disagree
Shoes for work are very important for me -
When I purchase shoes for work. It's not a big deal if I cannot wear them very often
I can really tell a lot about a person by the shoes he/she selects for work
I am very interested in the shoes I wear to work
It's really a problem If I buy shoes that are Inappropriate for my job
A purchase of shoes for work that doesn't perform well troubles me a great deal
The type of shoes that I wear to work is compatible with how I would like my co-workers to think of me
When I buy shoes for work, it's difficult to make a bad choice
Shoes that I wear to work help me express my personality
When purchasing shoes for work, I am never certain about my choice
I choose my shoes for work very carefully -
I can't say that 1 particularly like the type of shoes that I wear to work
The shoes I usually wear to work are the ones I enjoy the most
Strongly
Agree
7
7
7
7
6
6
6
6
Indifferent
4
5
5
5
5
4
4
4
4
3
3
3
3
2
2
2
2
2
2
197
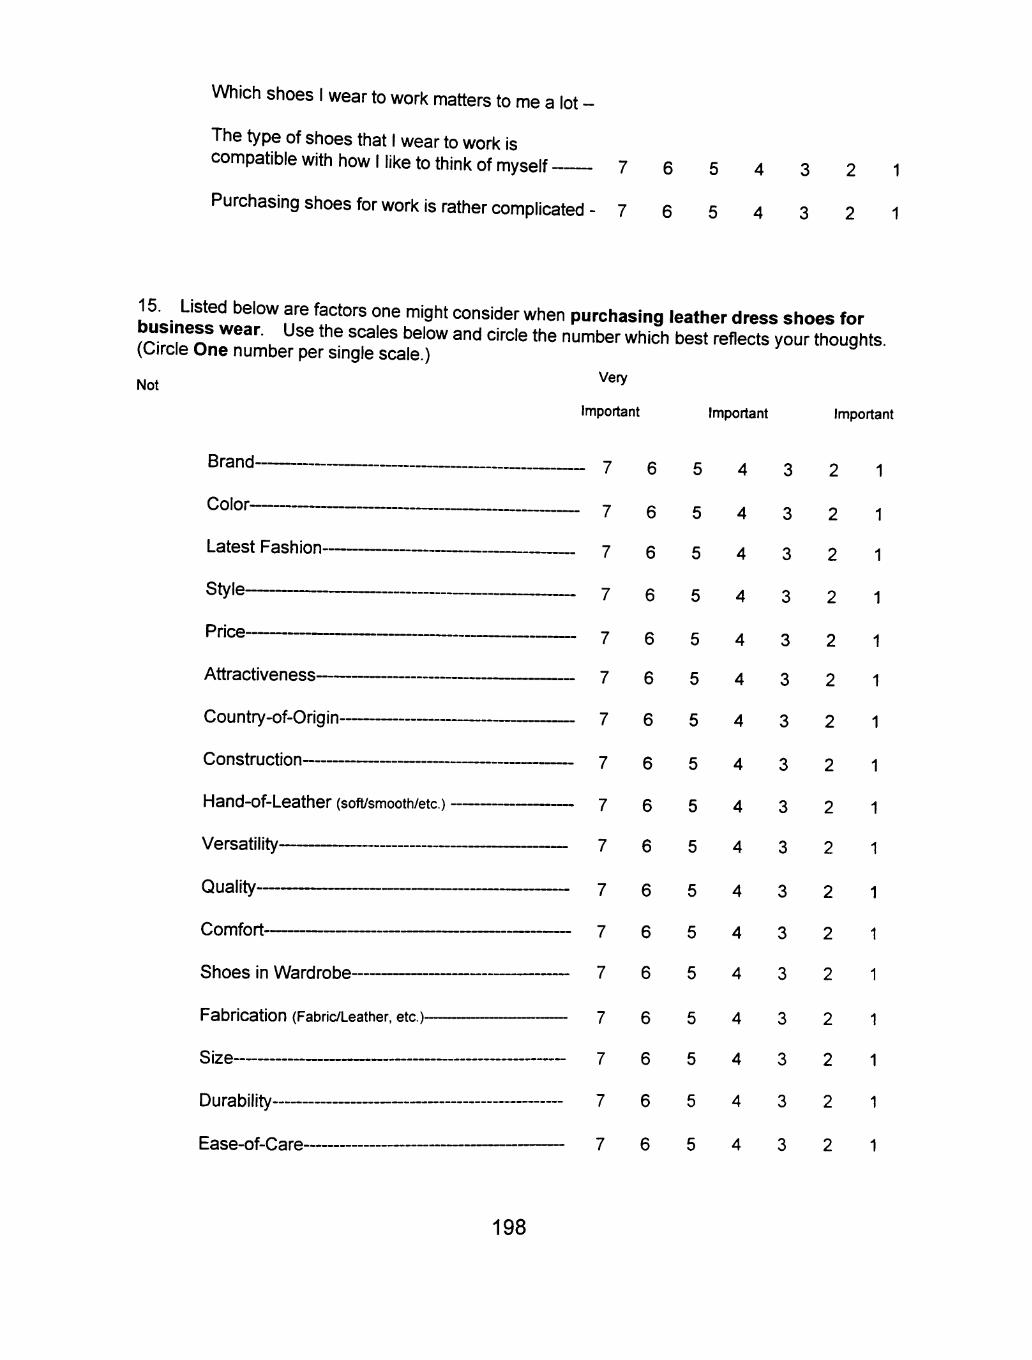
Which shoes I wear to work matters to me a lot -
The type of shoes that I wear to work is compatible with how I like to think of myself 7 6 5 4 3 2 1
Purchasing shoes for work is rather complicated- 7 6 5 4 3 2 1
15. Listed below are factors one might consider when purchasing leather dress shoes for Dusiness wear. Use the scales below and circle the number which best reflects your thoughts (Circle One number per single scale.)
Not
Color-
Prlce-
Shoes in Wardrobe-
Fabrication (Fabric/Leather, etc.)-
Size
Durability-
Ease-of-Care-
Very
Important Important Important
Brand 7 6 5 4 3 2
7 6 5 4 3 2
Latest Fashion 7 6 5 4 3
198
2
Style 7 6 5 4 3 2
7 6 5 4 3 2
Attractiveness 7 6 5 4 3 2
Country-of-Origin 7 6 5 4 3 2
Construction 7 6 5 4 3 2
Hand-of-Leather (soft/smooth/etc.) 7 6 5 4 3 2
Versatility 7 6 5 4 3 2
Quality 7 6 5 4 3 2
Comfort 7 6 5 4 3 9
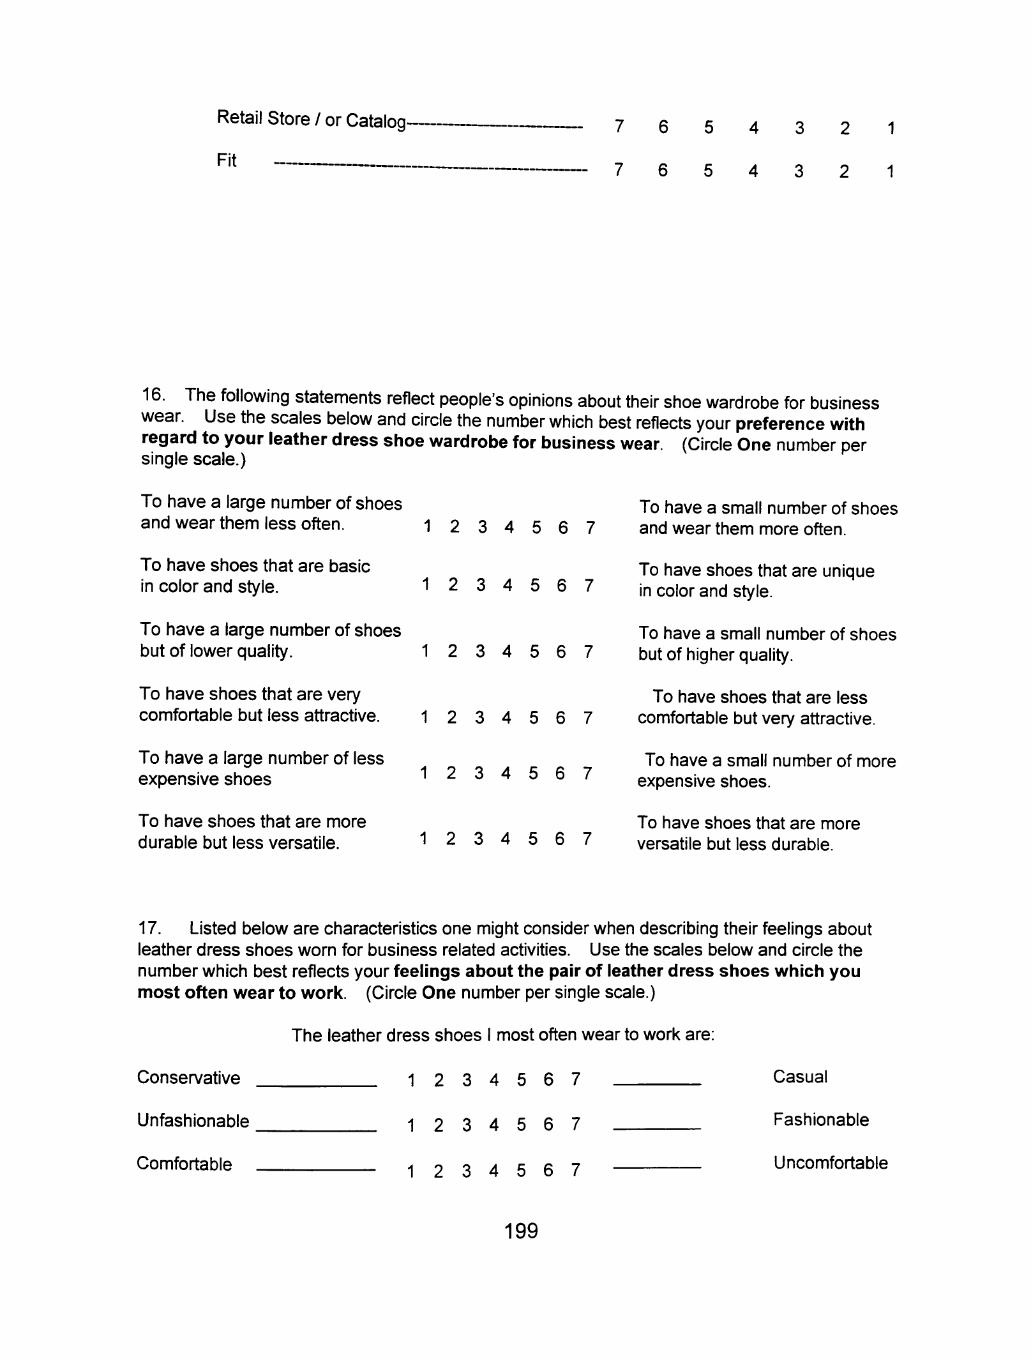
Retail Store / or Catalog-
Fit
7 6 5 4 3 2 1
7 6 5 4 3 2 1
16. The following statements reflect people's opinions about their shoe wardrobe for business wear. Use the scales below and circle the number which best reflects your preference with regard to your leather dress shoe wardrobe for business wear (Circle One number per single scale.)
To have a large number of shoes and wear them less often. 1 2 3 4 5 6 7
To have shoes that are basic in color and style. 1 2 3 4 5 6 7
To have a large number of shoes but of lower quality. 1 2 3 4 5 6 7
To have shoes that are very comfortable but less attractive.
To have a large number of less expensive shoes
To have shoes that are more durable but less versatile.
1 2 3 4 5 6 7
1 2 3 4 5 6 7
1 2 3 4 5 6 7
To have a small number of shoes and wear them more often.
To have shoes that are unique in color and style.
To have a small number of shoes but of higher quality.
To have shoes that are less comfortable but very attractive.
To have a small number of more expensive shoes.
To have shoes that are more versatile but less durable.
17. Listed below are characteristics one might consider when describing their feelings about leather dress shoes worn for business related activities. Use the scales below and circle the number which best reflects your feelings about the pair of leather dress shoes which you most often wear to work. (Circle One number per single scale.)
Conservative
Unfashionable
Comfortable
The leather dress shoes I most often wear to work are:
1 2 3 4 5 6 7
1 2 3 4 5 6 7
1 2 3 4 5 6 7
Casual
Fashionable
Uncomfortable
199
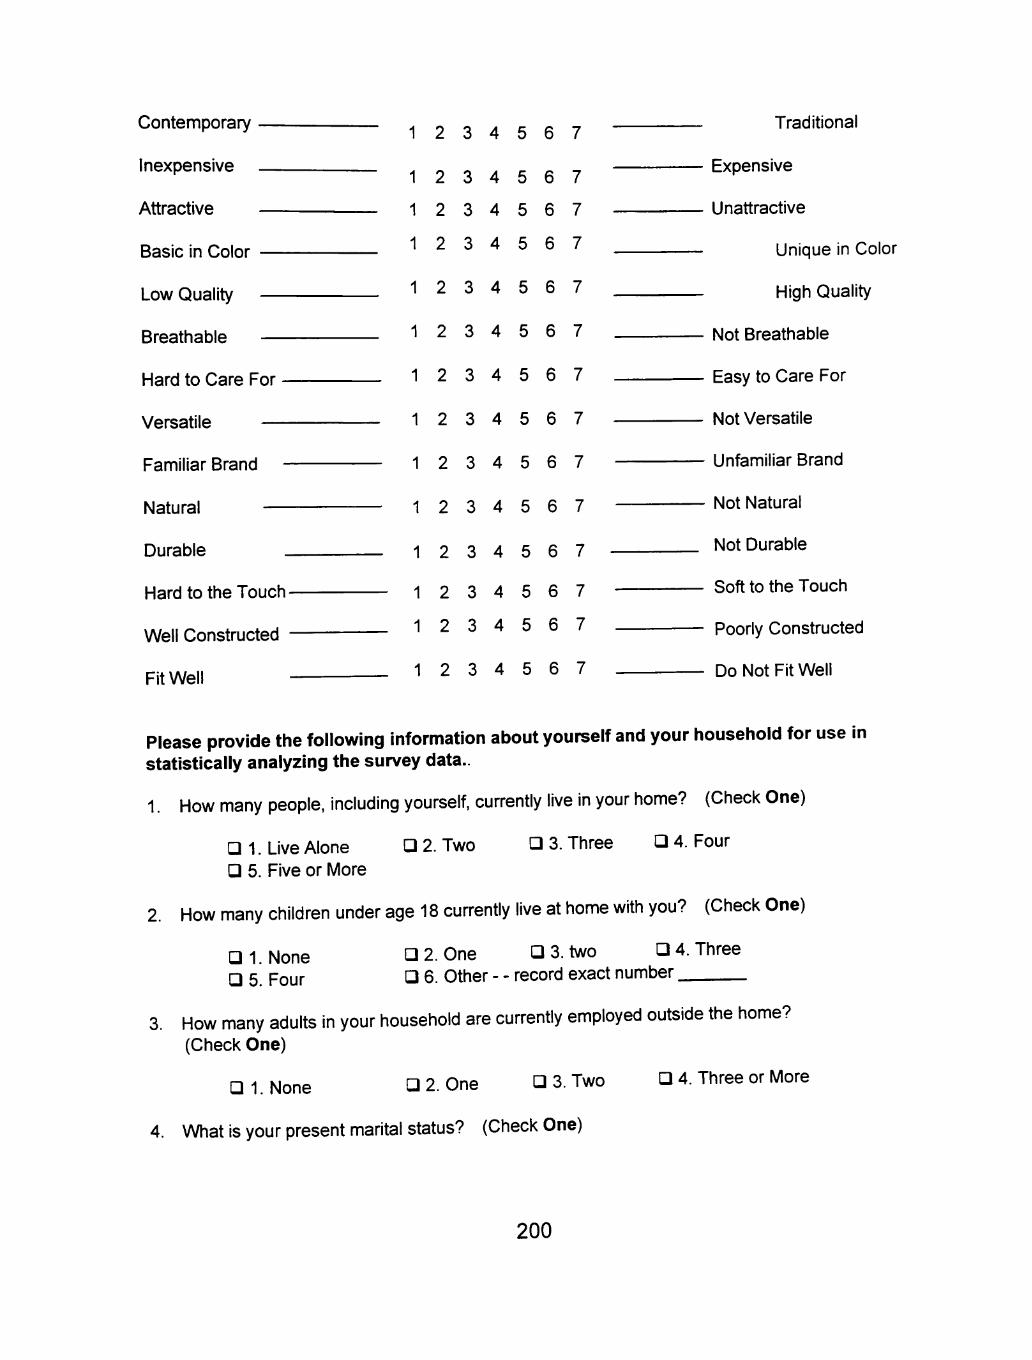
Contemporary
Inexpensive
Attractive
Basic in Color
Low Quality
Breathable
Hard to Care For
Versatile —
Familiar Brand
Natural —
Durable
Hard to the Touch
Well Constructed
Fit Well
1 2 3 4 5 6 7
1 2 3 4 5 6 7
1 2 3 4 5 6 7
1 2 3 4 5 6 7
1 2 3 4 5 6 7
1 2 3 4 5 6 7
1 2 3 4 5 6 7
1 2 3 4 5 6 7
1 2 3 4 5 6 7
1 2 3 4 5 6 7
1 2 3 4 5 6 7
1 2 3 4 5 6 7
1 2 3 4 5 6 7
1 2 3 4 5 6 7
Traditional
Expensive
Unattractive
Unique in Color
High Quality
Not Breathable
Easy to Care For
Not Versatile
Unfamiliar Brand
Not Natural
Not Durable
Soft to the Touch
Poorly Constructed
Do Not Fit Well
Please provide the following information about yourself and your household for use in statistically analyzing the survey data..
1. How many people, including yourself, currently live in your home? (Check One)
• 1. Live Alone • 5. Five or More
• 2. Two • 3. Three • 4. Four
2. How many children under age 18 currently live at home with you? (Check One)
• 1. None • 5. Four
• 2. One • 3. two • 4. Three • 6. Other - - record exact number
3. How many adults in your household are currently employed outside the home? (Check One)
• 1. None • 2. One • 3. Two • 4. Three or More
4. What is your present marital status? (Check One)
200
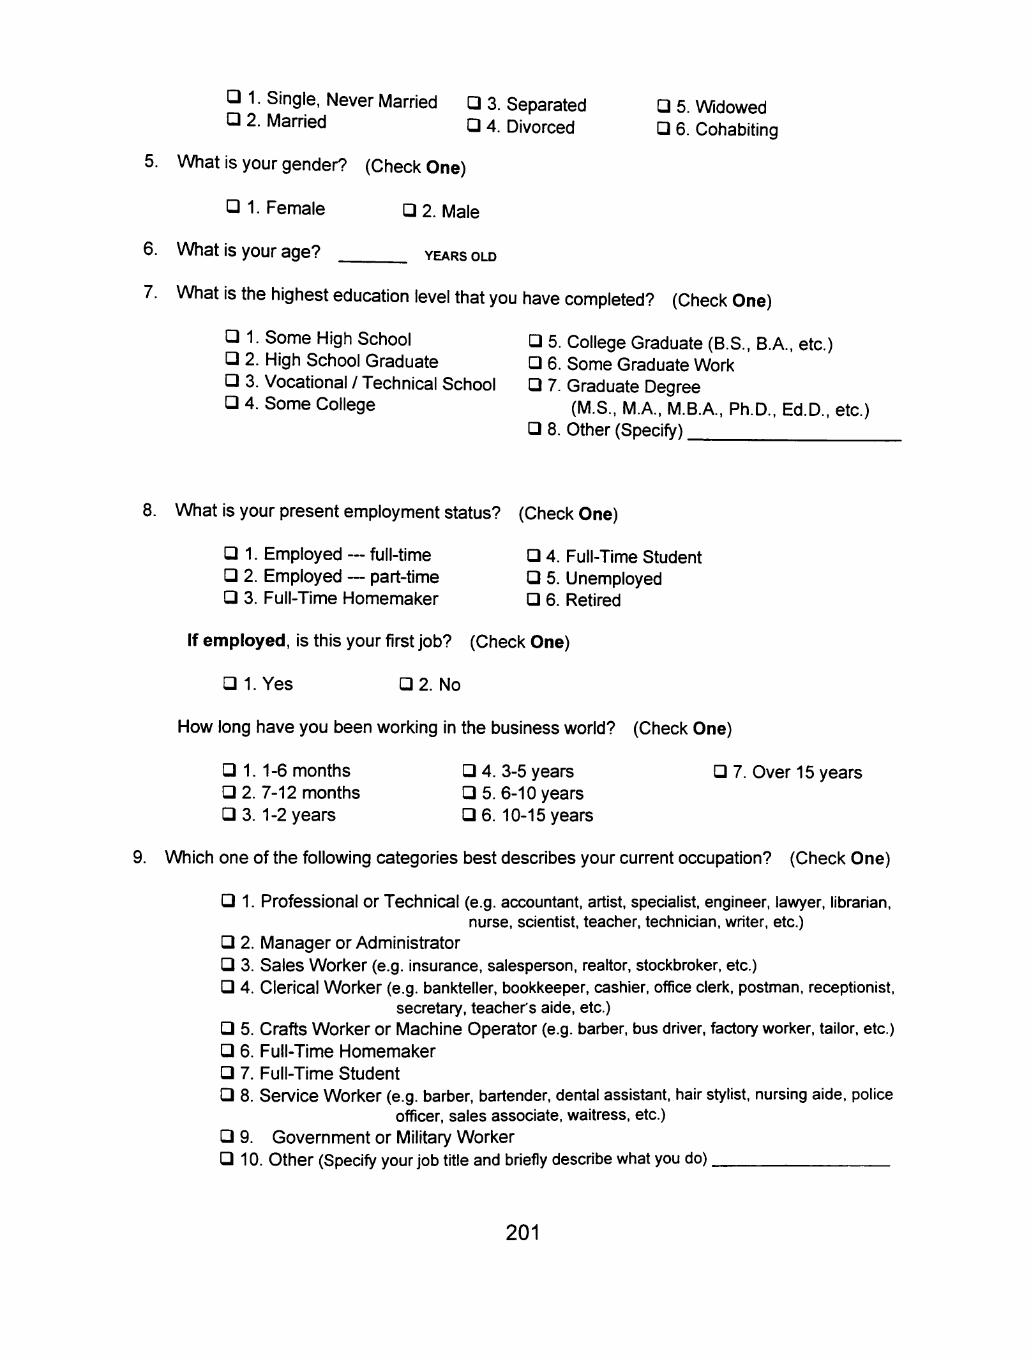
• 1. Single, Never Married • 3. Separated • 5. Widowed • 2. Married • 4. Divorced Q 6. Cohabiting
5. What is your gender? (Check One)
• 1. Female • 2. Male
6. What Is your age? YEARS OLD
7. What is the highest education level that you have completed? (Check One)
• 1. Some High School • 5. College Graduate (B.S., B.A., etc.) • 2. High School Graduate • 6. Some Graduate Work • 3. Vocational / Technical School • 7. Graduate Degree • 4. Some College (M.S., M.A., M.B.A., Ph.D., Ed.D., etc.)
• 8. Other (Specify)
8. What is your present employment status? (Check One)
• 1. Employed ~ full-time • 4. Full-Time Student • 2. Employed ~ part-time • 5. Unemployed • 3. Full-Time Homemaker • 6. Retired
If employed, is this your first job? (Check One)
• I.Yes • 2 . No
How long have you been working in the business world? (Check One)
• 1.1-6 months • 4. 3-5 years • 7. Over 15 years • 2. 7-12 months • 5 . 6-10 years
• 3. 1 -2 years • 6. 10-15 years
9. Which one of the following categories best describes your current occupation? (Check One)
• 1. Professional or Technical (e.g. accountant, artist, specialist, engineer, lawyer, librarian,
nurse, scientist, teacher, technician, writer, etc.) • 2. Manager or Administrator • 3. Sales Worker (e.g. insurance, salesperson, realtor, stockbroker, etc.) • 4. Clerical Worker (e.g. bankteller, bookkeeper, cashier, office clerk, postman, receptionist,
secretary, teachers aide, etc.) • 5. Crafts Worker or Machine Operator (e.g. barber, bus driver, factory worker, tailor, etc.) • 6. Full-Time Homemaker • 7. Full-Time Student • 8. Service Worker (e.g. barber, bartender, dental assistant, hair stylist, nursing aide, police
officer, sales associate, waitress, etc.) • 9. Government or Military Worker • 10. Other (Specify your job title and briefly describe what you do)
201
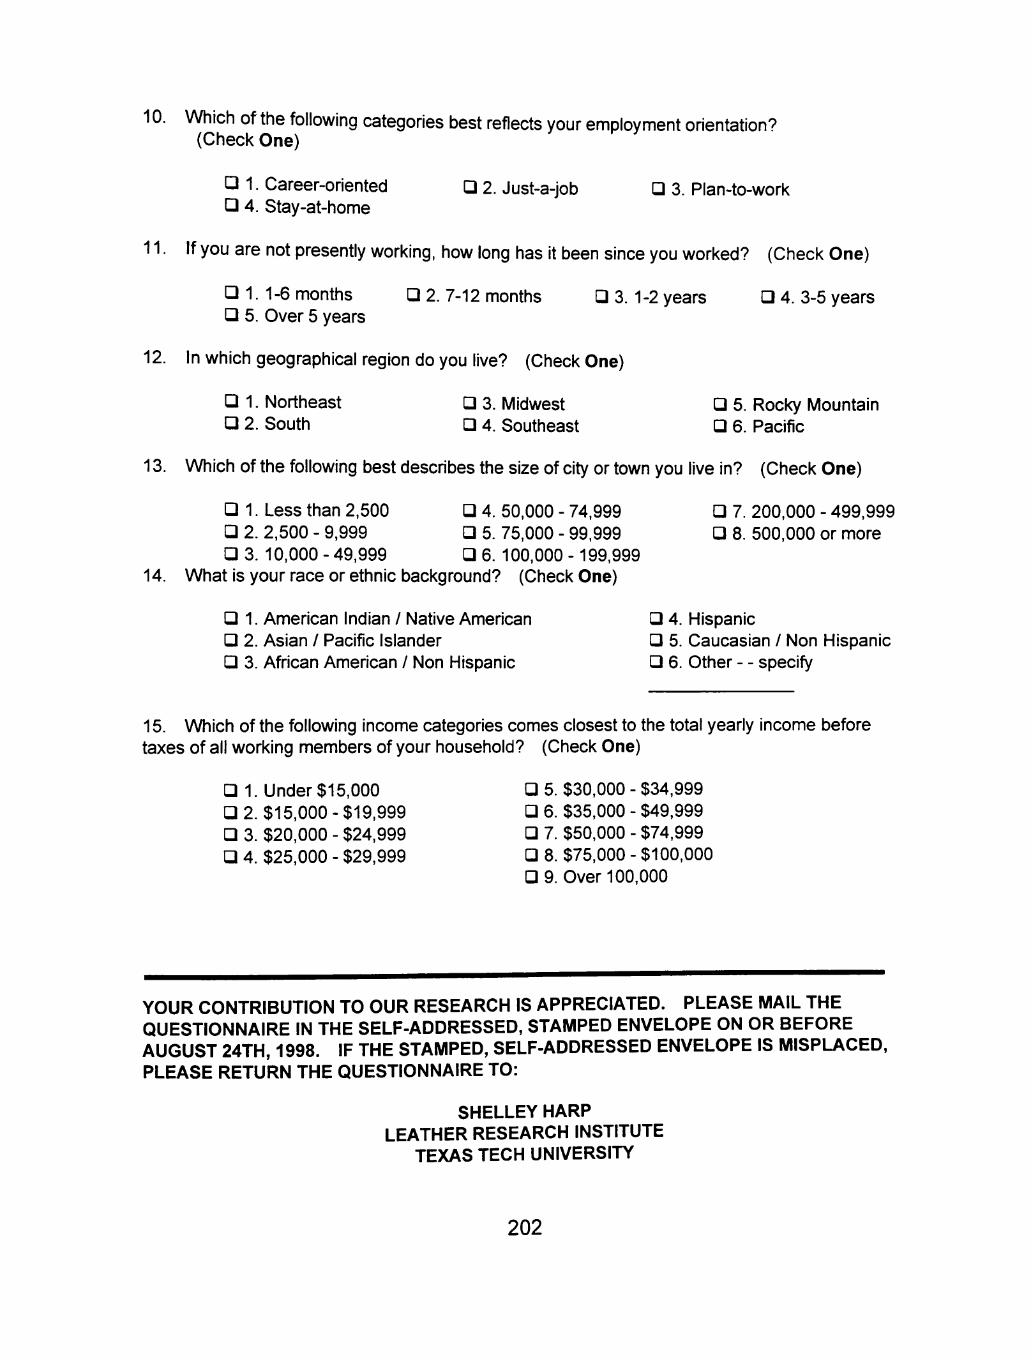
10. Which of the following categories best reflects your employment orientation'? (Check One)
• 1. Career-oriented • 2. Just-a-job • 3. Plan-to-work
• 4. Stay-at-home
11. If you are not presently working, how long has it been since you worked? (Check One)
• 1.1-6 months • 2. 7-12 months • 3. 1-2 years • 4. 3-5 years
• 5. Over 5 years
12. In which geographical region do you live? (Check One)
• 1. Northeast • 3. Midwest • 5. Rocky Mountain • 2. South • 4. Southeast • 6. Pacific
13. Which of the following best describes the size of city or town you live in? (Check One) • 1. Less than 2,500 • 4. 50,000 - 74,999 • 7. 200,000 - 499,999 • 2. 2,500 - 9,999 • 5. 75,000 - 99,999 • 8. 500,000 or more • 3. 10,000 - 49,999 • 6. 100,000 - 199,999
14. What Is your race or ethnic background? (Check One)
• 1. American Indian / Native American • 4. Hispanic • 2. Asian / Pacific Islander • 5. Caucasian / Non Hispanic • 3. African American / Non Hispanic • 6. Other - - specify
15. Which of the following income categories comes closest to the total yearly income before taxes of all working members of your household? (Check One)
• 1. Under $15,000 • 5. $30,000 - $34,999 • 2. $15,000 - $19,999 • 6. $35,000 - $49,999 • 3. $20,000 - $24,999 • 7. $50,000 - $74,999 • 4. $25,000 - $29,999 • 8. $75,000 - $100,000
• 9. Over 100,000
YOUR CONTRIBUTION TO OUR RESEARCH IS APPRECIATED. PLEASE MAIL THE QUESTIONNAIRE IN THE SELF-ADDRESSED, STAMPED ENVELOPE ON OR BEFORE AUGUST 24TH, 1998. IF THE STAMPED, SELF-ADDRESSED ENVELOPE IS MISPLACED, PLEASE RETURN THE QUESTIONNAIRE TO:
SHELLEY HARP LEATHER RESEARCH INSTITUTE
TEXAS TECH UNIVERSITY
202
APPENDIX B
U.S. SAVINGS BONDS ENTRY FORMS
203
U. S. SAVINGS BONDS ENTRY FORM
To be eligible for the $100 U.S. Savings Bond drawing, you must return this entry form with your completed questionnaire. Winners will be notified by telephone and the savings bond will be fon/varded to you August 24, 1998. Please print the information below.
Name:
Mailing Address:
Telephone Number {_
204

APPENDIX C
PRELIMINARY POSTCARD
205
Dear Consumer:
We are writing to request your participation in a research study designed to explore consumer footwear preference for business wear. Your cooperation will assist in completing our consumer profile.
In a few days you will receive a survey-booklet in the mail. Directions for completion will be included in the booklet. Participation will involve about 15 minutes of your time. Your assistance in helping us complete the consumer study is appreciated.
Sincerely,
Shelley Harp, Research Associate
Leather Research Institute Texas Tech University Box 41001 Lubbock, TX 79409-5300
206

APPENDIX D
REMINDER POSTCARD
207
ATTENTION! ATTENTION!
Recently, a questionnaire seeking information about your footwear preference for business wear was mailed to you. Your name was drawn from a random sample of consumers in the U.S.
If you have already completed and returned the questionnaire, please accept our sincere thanks. If not, please do so today. Because the questionnaire was sent to a small, but representative sample of consumers, it is extremely important that you be included in the study if the results are to accurately represent the America consumer.
Thank you very much for your support of this research project.
Sincerely,
Shelley Harp, Research Associate
Leather Research Institute Texas Tech University Box 41001 Lubbock, TX 79409-5300
208

APPENDIX E
ANSWERTREE® SOFTWARE
209
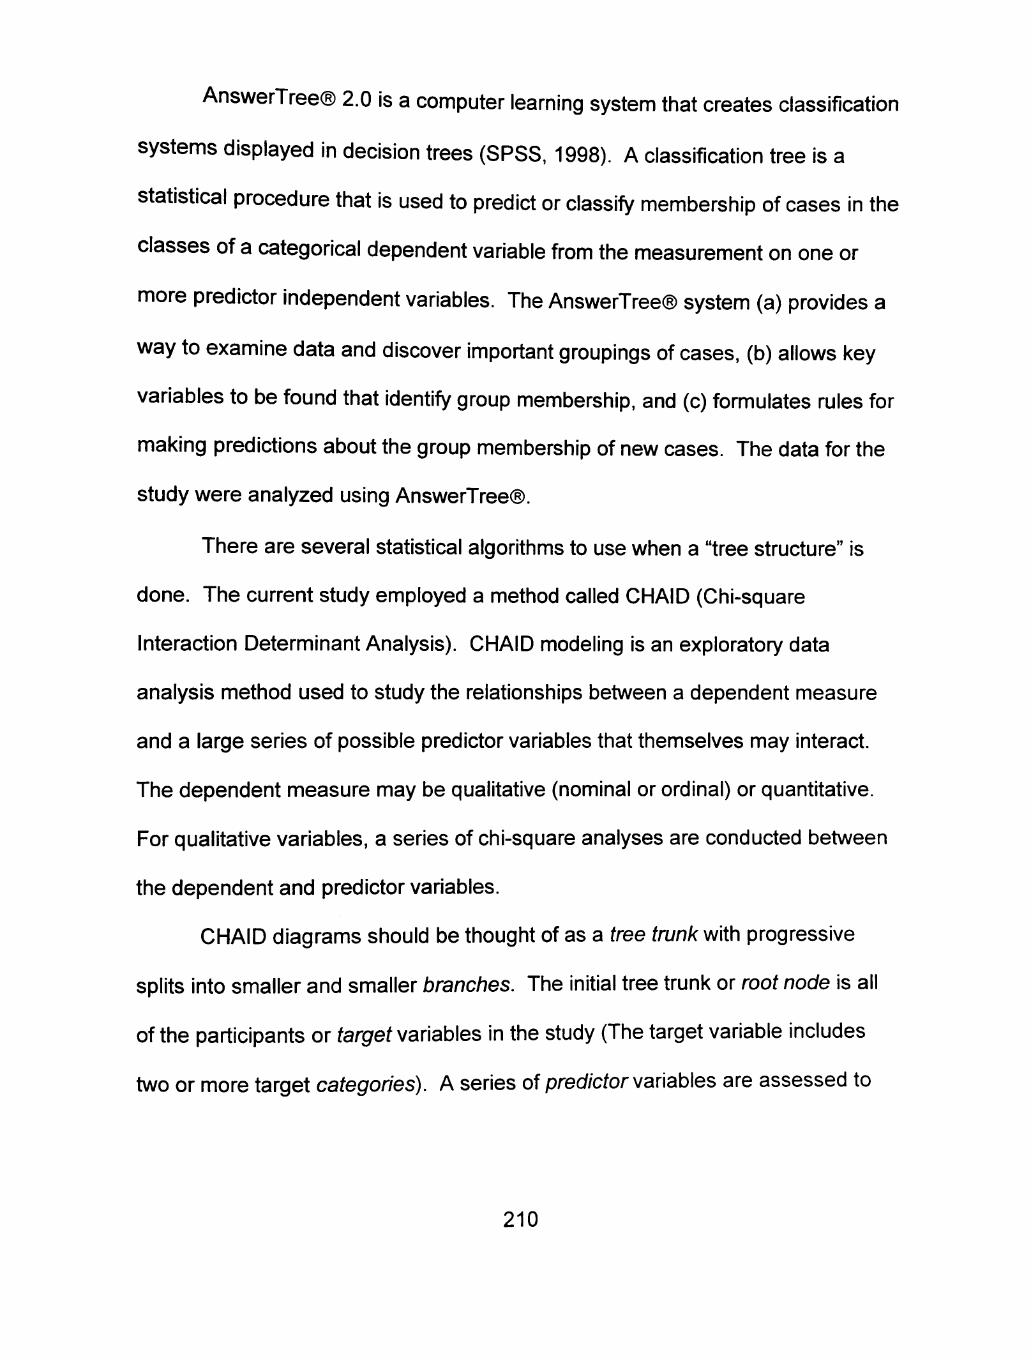
AnswerTreeCB) 2.0 is a computer learning system that creates classification
systems displayed in decision trees (SPSS, 1998). A classification tree is a
statistical procedure that is used to predict or classify membership of cases in the
classes of a categorical dependent variable from the measurement on one or
more predictor independent variables. The AnswerTreeCB) system (a) provides a
way to examine data and discover important groupings of cases, (b) allows key
variables to be found that identify group membership, and (c) fomiulates rules for
making predictions about the group membership of new cases. The data for the
study were analyzed using AnswerTree®.
There are several statistical algorithms to use when a "tree structure" is
done. The current study employed a method called CHAID (Chi-square
Interaction Determinant Analysis). CHAID modeling is an exploratory data
analysis method used to study the relationships between a dependent measure
and a large series of possible predictor variables that themselves may interact.
The dependent measure may be qualitative (nominal or ordinal) or quantitative.
For qualitative variables, a series of chi-square analyses are conducted between
the dependent and predictor variables.
CHAID diagrams should be thought of as a tree trunk with progressive
splits into smaller and smaller branches. The initial tree trunk or root node is all
of the participants or fargef variables in the study (The target variable includes
two or more target categories). A series of pred/ctor variables are assessed to
210

see if splitting the sample based on these predictors leads to a statistically
significant discrimination in the dependent measure.
For instance, if the dependent measure (i.e., target variable) is HI and LI
consumers and the potential independent measures (i.e., predictor variables) are
footwear purchase criteria and footwear characteristics, the first step would be to
assess whether there were different levels of HI and LI (i.e., separately referred
to as a target category) for two or more nodes formed on the basis of one of the
predictor variables. The most significant of these predictor variables would
define the first split of the sample, or the first branching of the tree. Then, for
each of the new nodes formed, it would be determined if the node could be
further significantly split by another of the predictor variables. And so on. After
each split, the question is again asked if the new node can be further split on
another variable, so that there are significant differences in the dependent
variable. The result at the end of the tree building process is that there are a
series of nodes that are maximally different from one another on the dependent
variable. At each step, statistical tests are made to determine if a significant split
can be made.
The procedure for AnswerTree® using CHAID includes the following six
steps:
1. Determine the tree growing criteria: (a) growing method, (b)
target variable, (c) predictor variables, and (d) stopping rules.
Current study: The growing method used was CHAID, target
211
variable included 100 HI consumers and 101 LI consumers,
predictor variables were footwear purchase criteria (n = 19) and
footwear characteristics (n = 17), and the stopping rule was
when the number of cases in a node dropped below 20.
2. Grow the decision tree. Current study: Decision trees or charts
that illustrated decision rules were created for footwear
purchase criteria (see Figure 4.1) and footwear characteristics
(see Figure 4.2).
3. Validate the tree. To assess how well the tree structure
generalizes from the data at hand to a larger sample, three
validation options are available: (a) partitioning, (b) cross-
validation, and (c) random seed. Current study: The cross-
validation method was used to estimate the risk or number of
cases correctly classified. Cross-validation uses all of the data
to build the tree. The risk estimate is computed by partitioning
the data into k separate groups or folds (where k is specified by
the user). Next, k trees are built using the same growing criteria
as the tree being evaluated. The first tree uses all folds except
the first, the second tree uses all folds except the second, and
so on, until each fold had been excluded once. For each of
these trees, a risk estimate is computed, and the cross-
212
validated risk estimate is the average of these k risk estimates
for the k trees, weighted by number of cases in each fold.
4. Calculate the gain summary for each decision tree. The gain
chart indicates which nodes in the tree have the highest (and
lowest) response or profit. A gain summary is determined for
each node for each independent variable. Current study: The
gain score for each node was computed as the proportion, i.e.,
probability of response, of cases in the node to the overall
sample. Gain summaries were determined for the 100 HI
consumers and 101 LI consumers (see Tables 4.19 - 4.22).
Information is displayed as Node-by-Node and Cumulative.
Cumulative gains or values are accumulated, so that each row
indicates value for cases in that group plus all previous groups
(see Tables 4.19 - 4.22). The cumulative statistics can indicate
where to find the category variable (i.e., HI consumers) by
considering the nodes with Index (%) scores of 100% or greater.
The response % reveals the percentage of HI (i.e.. Node: %)
reached by targeting the best node, then by including the
second best node, and so on until the response % reaches
100% (e.g., in Table 4.19, Node 16, 60.00% of HI can be
reached by targeting 31.98% of the market).
213
To calculate a Node-by-Node gain summary, the following
definitions apply:
a. Node: Nodes are branches of the root node, fonning
rows for each predictor variable.
b. Node n: Total number of participants of target variable in
a node.
c. Node % = Node n - Target Variable (N = 201).
d. Response n: Number of participants belonging to the
target category in a node.
e. Response % = Response n -r Category Variable (HI =
100, LI = 101).
f. Gain (%) = Response n ^ Node n
g. Index (%) = Response % -r Node %
5. Calculate analysis summaries or identifying segment
characteristics for each node Index (%) scores of 100% or
greater (i.e., summary includes a description, starting with the
first row, or the nodes that lead to the node behind described).
Scores of 100% or greater have a higher response rate than the
overall target variable, scores less than 100% have a lower
response rate than the overall target variable. Current study:
Segment characteristics were determined for all nodes identified
as having Index (%) scores of 100% or greater for HI and LI for
214
footwear purchase criteria and footwear characteristics (see
Tables 4.19-4.22).
6. Calculate profits from the decision trees. Retailers and others
using the AnswerTree® computer learning system can specify
profits for each of the outcomes. Gain scores can then be
expressed as profits, rather than probabilities of response.
Current study: The researchers used AnswerTree® to work
through steps 1-5 for HI and LI, using probability of response in
step 4.
215
PERMISSION TO COPY
In presenting this thesis in partial ftilfillment of the requirements for a master';
degree at Texas Tech University or Texas Tech University Health Sciences Center, I
agree that the Library and my major department shall make it freely available for
research purposes. Permission to copy this thesis for scholarly purposes may be
granted by the Director of the Library or my major professor. It is understood diat
any copying or publication of this thesis for financial gain shaU not be allowed
without my further written permission and that any user may be liable for copyright
infringement.
Agree (Permission is eranted.)
/ - • M V J^ 1> • > — — —f f
^ tude in Signature Date
Disagree (Permission is not granted.)
Student Signature Date