SEEC/SECL South East Property Tax Devolution · SEEC/SECL South East Property Tax Devolution...
36
SEEC/SECL South East Property Tax Devolution January 2015
Transcript of SEEC/SECL South East Property Tax Devolution · SEEC/SECL South East Property Tax Devolution...

SEEC/SECL
South East Property Tax Devolution
January 2015

Report overview
1. Objectives of the Work
2. Fiscal Balance
3. Property Taxes – Overview
4. Property Taxes – Analysis
5. Conclusions
2

1. Objectives of the Work
3
Identify headline property tax figures for the South East, consistent with
the report by the London Finance Commission’s (LFC’s) 2013 report,
“Raising the Capital”.
Specifically, quantify the values of (i) council tax, (ii) business rates,
(iii) stamp duty land tax, (iv) annual tax on enveloped dwellings, and (v)
capital gains tax on property disposal.
Estimate total property tax for each local authority in the South East,
based upon assumptions about potential apportionment bases.
Compare against local authority funding from central government.

1. Objectives of the Work
4
Definitions:
(i) Council Tax – levied on households, based on property value and
occupancy
(ii) Business Rates – levied on non-domestic property, based on rateable
value
(iii) Stamp Duty Land Tax – on ‘land’ transactions, including property
(based on purchase price), leases, rent
(iv) Annual Tax on Enveloped Dwellings – payable by companies,
partnerships, investment vehicles that own high value residential property,
based on property value
(v) Capital Gains Tax on Property Disposal – on the ‘gain’ from the
sale/disposal of property (but note that the LFC only considered property
owned by companies).

2. Fiscal Balance
5
To provide context, we begin with an overview of the balance between
total tax revenue and total public expenditure in the South East.
Oxford Economics estimates that, in 2011/12, the South East had
resident-based revenues of £88.5bn, compared to a share of total public
expenditure of £84.0bn.
This translates to fiscal balance of +£4.5bn, second only to London.
Since 1999, the South East’s net fiscal contribution has averaged
+£10.2bn per year. This ‘return on investment’ contracted sharply in the
wake of the global financial crisis, and has since partially recovered.

Fiscal Balance
6
Figure 1 – South East Fiscal Balance
-25
0
25
50
75
100
19
99
/00
2000/0
1
2001/0
2
20
02
/03
20
03
/04
20
04
/05
20
05
/06
20
06
/07
20
07
/08
20
08
/09
20
09
/10
2010/1
1
2011/1
2
£b
n R
eve
nu
e /
Ex
pe
nd
itu
re
Revenues Expenditure

Fiscal Balance
7
Figure 1 – South East Fiscal Balance
-5
0
5
10
15
20
-25
0
25
50
75
100
19
99
/00
2000/0
1
2001/0
2
20
02
/03
20
03
/04
20
04
/05
20
05
/06
20
06
/07
20
07
/08
20
08
/09
20
09
/10
2010/1
1
2011/1
2
£b
n F
isc
al B
ala
nc
e
£b
n R
eve
nu
e /
Ex
pe
nd
itu
re
Fiscal Balance (right axis) Revenues Expenditure

Fiscal Balance
The fiscal balance captures all major sources of tax revenue and public
expenditure in the UK.
Public expenditure includes services that are typically outside the remit of
local government, such as health care, welfare payments and defence.
Oxford Economics’ measure of tax revenues include all major revenue
streams, including:
Income tax
National Insurance Contributions (NICs)
Value Added Tax (VAT)
Corporation tax
Council tax
Business rates
8

Fiscal Balance
An earlier study by Oxford Economics (London’s Finances and Revenues)
included a breakdown of the South East’s tax revenues in 2010/11.
9
Figure 2 – South East Tax Revenues, 2010/11
* Capital Gains Tax also includes financial assets, and so is not a
pure property tax
4.9% 3.6%
1.6% 0.6%
30.6%
17.6%
15.1%
5.9%
20.0%
Council Tax
Business Rates
Stamp Duty
Capital Gains Tax*
Income Tax
NICs
VAT
Corporation Tax
Other

Council Tax
Business Rates
Stamp Duty
Capital Gains Tax*
Income Tax
NICs
VAT
Corporation Tax
Other
Fiscal Balance
Overall, it showed that property taxes accounted for only 11% of the
region’s total tax take.
10
Figure 2 – South East Tax Revenues, 2010/11
11%
* Capital Gains Tax will also include financial assets, and so is not
a pure property tax

3. Property Taxes - Overview
11
The following sections focus on property taxes in the South East, in the
context of the London Finance Commission’s (LFC’s) report, “Raising the
Capital”.
The report calls for the devolution of all property taxes. It is argued that
this would increase the capital’s autonomy to invest in infrastructure,
promote economic growth, and increase accountability to local residents
and businesses.
Specifically, the commission calls for the devolution of:
1. Council tax
2. Business rates
3. Stamp duty land tax (SDLT)
4. Annual tax on enveloped dwellings (ATED)
5. Capital gains property disposal tax (for companies only)

Property Taxes – Overview
LFC concluded that property taxes are well suited to devolution
because:
They have immobile tax bases
They are buoyant, increasing over time in line with general economic
growth; and
They are relatively easy to administer and enforce.
12

Property Taxes – Overview
LFC did not believe that devolution of the other major taxes was
appropriate at this time:
Income tax could disincentivise employment, create inefficiencies
(due to a mobile workforce) and would be difficult to implement.
NICs are already ‘ring-fenced’ for nationally administered services,
such as pensions.
VAT could not be devolved, due to EU requirements that member
states apply common rates within their jurisdictions. It could instead
be assigned (i.e. collected by central government and allocated to
local authorities), but this would be difficult to implement.
Corporation tax posed a number of challenges, such as volatility,
distortions (e.g. authorities driving away businesses, or engaging in a
competitive ‘race to the bottom’), and difficulty identifying the origin of
the tax revenues.
13

4. Property Taxes – Analysis
14
Analysis was carried out to estimate property tax yields in the South East
and use assumptions to apportion these to local authority level.
This section is divided into the following parts:
Methodology
Results
Analysis

Property Taxes – Analysis
When estimating tax revenues at the local authority level, it is necessary
to consider local government structure. Within the South East, there are
four structure types, as illustrated below.
15
Methodology Results Analysis
Shire
District
County
Council
(no fire)
Fire &
Rescue
Unitary
Council
(no fire)
County
Council
(with fire) Unitary
Council
(with fire)
Fire &
Rescue
Shire
District
Figure 3 – Local Authority Structure
Type 1 Type 2 Type 3 Type 4

Property Taxes – Analysis
Tax revenue data is often only available for shire districts and unitaries. In
this case, we need to estimate how much of the revenue would be
passed on to the other tiers.
16
Methodology Results Analysis
Shire
District
County
Council
(no fire)
Fire &
Rescue
Unitary
Council
(no fire)
County
Council
(with fire) Unitary
Council
(with fire)
Fire &
Rescue
Shire
District
Figure 3 – Local Authority Structure
Type 1 Type 2 Type 3 Type 4
?
?
?
?

Property Taxes – Analysis
To do this, we need to estimate the shares attributable to the lower, upper
and fire tiers. One approach is to base these share on past service
expenditure. In this case, we have used actual Revenue Outturn 2013/14.*
17
Methodology Results Analysis
Shire
District
County
Council
(no fire)
Fire &
Rescue
Unitary
Council
(no fire)
County
Council
(with fire) Unitary
Council
(with fire)
Fire &
Rescue
Shire
District
Figure 3 – Local Authority Structure
Type 1 Type 2 Type 3 Type 4
Lower
Upper
Fire
* Based on the average for South East England. Only a sub-set of
authorities can be used in these calculations.

Property Taxes – Analysis
The resulting shares, based on past expenditure, are illustrated below. As
can be seen, the majority of expenditure is attributable to the upper tier
(87.5%).
18
Methodology Results Analysis
Shire
District
County
Council
(no fire)
Fire &
Rescue
Unitary
Council
(no fire)
County
Council
(with fire) Unitary
Council
(with fire)
Fire &
Rescue
Shire
District
Figure 3 – Local Authority Structure
Type 1 Type 2 Type 3 Type 4
Lower
Upper
Fire 2.8%
87.5%
9.7%

Property Taxes – Analysis
Council tax revenue is already known for all tiers of local government.
For business rates and SDLT, revenue was allocated between tiers on
the basis of past expenditure, as described in the previous slides.
For ATED, figures were only available at the regional level, so population
was first used to estimate the shares for each district/unitary council.
19
Methodology Results Analysis
Property Tax Regional
amount
District or
Unitary amounts
Fire & County
amounts
Council Tax Actual Actual Actual
Business Rates Actual Actual Past
expenditure
Share
Stamp Duty Land Tax Actual Actual
Annual Tax on Enveloped Dwellings Actual Population share
Table 1 – Methods used to allocate notional tax revenue

Property Taxes – Analysis
Capital gains tax was ultimately excluded from our analysis.
The LFC report only includes capital gains tax relating to UK residential
properties, worth over £2m, which are owned by companies.
LFC report that this revenue was worth £25m to the UK in 2013/14, of
which an estimated £20m would be raised in London.
Any remaining revenues raised by the South East would therefore be
insignificant compared to the other property taxes discussed here.
An earlier LFC working paper* stated that the devolution of capital gains
tax more widely would be “prohibitively complex”
20
Methodology Results Analysis
* London Finance Commission Working Paper ‘Options for Tax
Assignment and Devolution’, September 2012

Property Taxes – Analysis
Overall, property taxes were worth £9bn to the SEEC area alone in
2013/14
21
Methodology Results Analysis
Figure 4 – South East Property Tax Revenues, 2013/14

Property Taxes – Analysis
Overall, property taxes were worth £9.8bn to the South East in
2013/14.These figures include Swindon, Wiltshire & Central Bedfordshire.
22
Methodology Results Analysis
Council Tax £4.34bn
Business Rates £3.65bn
SDLT £1.84bn
ATED £0.01bn
Figure 4a – South East Property Tax Revenues, 2013/14
£9.8bn

Property Taxes – Analysis
For unitaries and counties, once apportioned, total property tax revenues
ranged from £1,340m (Surrey) to £108m (Isle of Wight)
23
Methodology Results Analysis
Figure 5a – Property Tax Revenues (Unitaries & Counties)
0
200
400
600
800
1,000
1,200
1,400
Surr
ey
Ken
t
Ha
mpshir
e
We
st
Su
sse
x
Oxfo
rdsh
ire
Buckin
gha
msh
ire
Wilt
shir
e
East
Susse
x
Milt
on
Ke
yn
es
Brig
hto
n &
Ho
ve
Centr
al B
edfo
rdsh
ire
Win
dsor
an
d…
Read
ing
Sw
indo
n
We
st
Be
rkshire
Me
dw
ay
Sou
tha
mp
ton
Wo
kin
gh
am
Slo
ug
h
Port
sm
ou
th
Bra
ckne
ll F
ore
st
Isle
of
Wig
ht
Cou
ncil
£m

Property Taxes – Analysis
For shire districts, property tax revenues ranged from £27m (Elmbridge)
to £7m (Gosport)
24
Methodology Results Analysis
Figure 5b – Property Tax Revenues (Shire Districts)
0
5
10
15
20
25
30
Elm
bridg
eO
xfo
rdR
eig
ate
and B
an
ste
ad
Guild
ford
Ma
idsto
ne
Ne
w F
ore
st
Wycom
be
Cra
wle
yA
yle
sbury
Vale
Waverle
yW
eald
en
Ton
brid
ge a
nd M
alli
ng
Basin
gsto
ke a
nd D
eane
Ca
nte
rbu
ryM
id S
ussex
Wokin
gS
eveno
aks
Win
ch
este
rH
ors
ha
mC
herw
ell
Ch
icheste
rS
outh
Oxfo
rdshire
Aru
nD
art
ford
Tu
nbrid
ge W
ells
Vale
of
Wh
ite
Hors
eS
urr
ey H
ea
thA
sh
ford
Mo
le V
alle
yE
ast H
am
pshire
Eastle
igh
Test V
alle
yS
peltho
rne
Wort
hin
gT
ha
net
Ch
iltern
Shep
way
Sw
ale
Eastb
ou
rne
Ha
va
nt
Ru
nnym
ede
Tan
drid
ge
Fare
ham
South
Bucks
Ha
rtLe
wes
Ru
sh
moo
rD
ove
rE
psom
and
Ew
ell
Ro
ther
West O
xfo
rdshire
Ha
sting
sG
ravesham
Adur
Gospo
rt
£m

Property Taxes – Analysis
We assessed the balance between (i) property tax revenues and (ii) local
authorities’ current funding from central government.
The objective was to determine whether the devolved property taxes
(excluding council tax) would be sufficient to replace the major grants.
This includes all grants making up ‘Revenue Spending Power’ in 2015/16,
with the exception of two major ring-fenced grants (Public Health Grant
and Better Care Fund). This also excludes funding for education, police,
and other grants that were not included in Revenue Spending Power.
Property tax revenues in 2013/14 were projected forward to 2015/16.
Business rates were increased by 1.9% each year (reflecting the
multiplier cap), and SDLT was increased in line with OBR forecasts
(which increase sharply, due to rising property values and transaction
volumes).
25
Methodology Results Analysis

Property Taxes – Analysis
By 2015/16, the SEEC area alone was forecast to have revenues of
£5.8bn, vs. grants of £2.7bn. This gives a ‘funding surplus’ of +£3.1bn.
After ring-fenced grants, the SEEC area surplus would be £2.3bn
26
Methodology Results Analysis
Figure 5 – Balance of Funding

Property Taxes – Analysis
By 2015/16, the South East was forecast to have revenues of £6.3bn, vs.
grants of £2.9bn. This gives a ‘funding surplus’ of +£3.3bn. These figures
include Swindon, Wiltshire & Central Bedfordshire.
27
Methodology Results Analysis
Figure 5a – Balance of Funding
Non ring-fenced grants
Business rates
SDLT
ATED
0
1,000
2,000
3,000
4,000
5,000
6,000
7,000
Property Taxes Grants Surplus
£ m
illi
on
Surplus
+£3.3bn
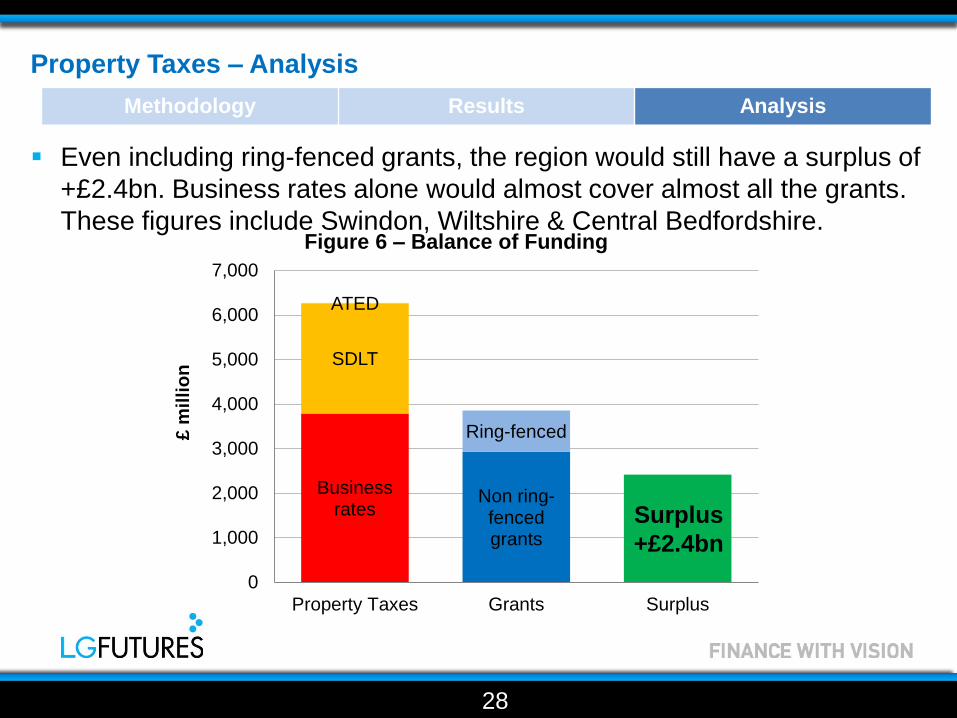
Property Taxes – Analysis
Even including ring-fenced grants, the region would still have a surplus of
+£2.4bn. Business rates alone would almost cover almost all the grants.
These figures include Swindon, Wiltshire & Central Bedfordshire.
28
Methodology Results Analysis
Figure 6 – Balance of Funding
Non ring-fenced grants
Ring-fenced
Business rates
SDLT
ATED
0
1,000
2,000
3,000
4,000
5,000
6,000
7,000
Property Taxes Grants Surplus
£ m
illi
on
Surplus
+£2.4bn

Property Taxes – Analysis
Excluding ring-fenced grants, nearly all unitaries and counties would have
a funding surplus in 2015/16 (with the exception of Isle of Wight)
29
Methodology Results Analysis
Figure 7a – Funding Surplus (Unitaries & Counties)
-100
0
100
200
300
400
500
600
700
800
Surr
ey
Ham
pshir
e
Ken
t
We
st
Su
sse
x
Oxfo
rdsh
ire
Buckin
gha
msh
ire
Win
dsor
an
d M
aid
enh
ea
d
Milt
on
Ke
yn
es
Wilt
shir
e
We
st
Be
rkshire
Read
ing
Wo
kin
gh
am
Brig
hto
n &
Ho
ve
Bra
ckne
ll F
ore
st
East
Susse
x
Sw
indo
n
Slo
ug
h
Centr
al B
edfo
rdsh
ire
Sou
tha
mp
ton
Me
dw
ay
Port
sm
ou
th
Isle
of
Wig
ht
Cou
ncil
£m
su
rplu
s (
+)
or
de
ficit (
-)

Property Taxes – Analysis
For shire districts, 60% would have a funding surplus and 40% would
have a deficit
30
Methodology Results Analysis
Figure 7b – Funding Surplus (Shire Districts)
-10
-5
0
5
10
15
Elm
bridg
eG
uild
ford
Waverle
yC
raw
ley
South
Bucks
Mo
le V
alle
yT
un
brid
ge W
ells
Ru
nnym
ede
Re
iga
te a
nd B
an
ste
ad
Ch
iltern
Surr
ey H
eath
Wycom
be
Wokin
gW
inch
este
rS
outh
Oxfo
rdshire
Ch
icheste
rD
art
ford
Vale
of
Wh
ite
Hors
eH
art
Seveno
aks
Ho
rsha
mS
peltho
rne
Ne
w F
ore
st
East H
am
pshire
Ton
brid
ge a
nd M
alli
ng
Mid
Sussex
Fare
ham
Eastle
igh
Ch
erw
ell
Epsom
and
Ew
ell
Tan
drid
ge
Oxfo
rdW
est O
xfo
rdshire
Basin
gsto
ke a
nd D
eane
Ru
sh
moo
rT
est V
alle
yLe
wes
Ash
ford
Wort
hin
gA
dur
Ro
ther
Ma
idsto
ne
Weald
en
Ha
va
nt
Eastb
ou
rne
Do
ve
rG
ospo
rtC
ante
rbu
ryA
run
Gra
vesham
Shep
way
Ayle
sbury
Vale
Sw
ale
Ha
sting
sT
ha
net£
m s
urp
lus (
+)
or
deficit (
-)

Property Taxes – Analysis
The preceding slides raise two additional issues:
Ensuring a fiscally neutral outcome; and
Equalisation of funding between the South East councils.
31
Methodology Results Analysis

Property Taxes – Analysis
Fiscal neutrality
LFC recommended that newly devolved taxes should be offset through
corresponding reductions in grant, to ensure a fiscally neutral outcome.
As shown on the previous slides, property tax revenue (excluding council
tax) exceeds the South East’s major sources of revenue funding.
To ensure fiscal neutrality, options include:
Assume responsibility for funding a wider set of services, e.g. police
and schools
Return a share of property tax revenue to central government
Devolve a limited set of property taxes, e.g. business rates, which
would be sufficient to replace most existing, non ring-fenced central
government grants
32
Methodology Results Analysis

Property Taxes – Analysis
Equalisation
Based on the assumed revenue splits between the upper, lower and fire
tiers (of 87%/10%/3%), a large number of shire districts would still not be
revenue self-sufficient if property taxes were devolved to the local level.
This would require equalisation among the South East authorities. This
could take the form of ‘top ups’ and ‘tariffs’, similar to the current business
rates retention scheme.
At the outset, equalisation could be based on prevailing levels of funding.
However, the region would then need to consider if or how equalisation
would be adjusted to reflect future changes in need; for example, due to
population growth, ageing populations or changes in deprivation.
33
Methodology Results Analysis

Property Taxes – Analysis
Council Tax
Finally, it should be noted that our measurement of “surplus” excluded
council tax. This is because council tax is already fully devolved, and is
both collected and retained by the South East.
Our definition of “surplus” measures the difference between (i) property
tax revenues that are currently collected on behalf of the Exchequer, and
(ii) the amounts that are currently redistributed back to local authorities in
the form of central government grants.
For completeness, however, we also provide projections of council tax
revenues in 2015/16. As a prudent estimate, we used 2014/15 council tax
requirements, which assumes a 100% uptake of the council tax freeze
that is to be offered in 2015/16.*
34
Methodology Results Analysis
* Historically, the take up of council tax freeze grant has ranged
from 65% to 100% of local authorities (nationally) in any given year.

Property Taxes – Analysis
Summary of Revenue Streams
The table below summarises the projected value of all major property
taxes in the South East from 2013/14 to 2015/16, including council tax.
35
Methodology Results Analysis
Property Tax 2013/14 2014/15 2015/16
Council Tax £4.338 bn £4.449 bn £4.449 bn
Business Rates £3.650 bn £3.719 bn £3.790 bn
Stamp Duty Land Tax £1.845 bn £2.257 bn £2.473 bn
Annual Tax on Enveloped Dwellings £0.010 bn £0.010 bn £0.010 bn
Total Property Tax Revenue £9.843 bn £10.436 bn £10.722 bn
Table 2 – Summary of Actual and Projected Property Tax Values, South East

5. Conclusions
Oxford Economics estimated that the South East generated a fiscal surplus of
£4.5bn to the UK (as at 2011/12).
Earlier work by Oxford Economics (in 2010/11) identified that property taxes
accounted for 11% of total tax revenues in the South East.
LG Futures estimates that devolving the property taxes under consideration would
generate revenue of £9.8bn in the South East of England in 2013/14.
By 2015/16, property tax revenues (excluding council tax) would be £3.3bn
greater than the major non ring-fenced grants currently received by local
authorities from central government.
Limiting devolution to business rates, rather than all property taxes, could help
ensure fiscal neutrality.
Given our key assumptions, most counties and unitary authorities would become
revenue self-sufficient. However, ‘equalisation’ would still be needed for a large
number of shire districts.
36