Sediment water chironomid toxicity test using spiked water ... · Study Report 1st of 5 . Sediment...
59
Study Report 1 st of 5 Sediment – water chironomid toxicity test using spiked water (OECD 219) Effect of sodium cyanide on the development of Chironomus riparius GLP-Code of Testing Facility: IPW-001/4-29/R REG-No.: 2010-0232-DGO Principal Sponsor CEFIC Cyanide Sector Group Avenue E. van Nieuwenhuyse 4 1160 Brussels, Belgium Study Monitor: Dr. Daniel Bertow Industriepark Wolfgang GmbH Rodenbacher Chaussee 4 63457 Hanau-Wolfgang, Germany Test facility Fraunhofer-Institute for Molecular Biology and Applied Ecology (IME) 57377 Schmallenberg Germany Test facility management Dr. Christoph Schäfers Study director Dr. Markus Simon Page 1 of 59 October 19 th , 2011
Transcript of Sediment water chironomid toxicity test using spiked water ... · Study Report 1st of 5 . Sediment...

Study Report 1st
of 5
Sediment – water chironomid toxicity test using spiked water (OECD 219) Effect of sodium cyanide on the development of Chironomus riparius
GLP-Code of Testing Facility: IPW-001/4-29/R
REG-No.: 2010-0232-DGO
Principal Sponsor
CEFIC Cyanide Sector Group Avenue E. van Nieuwenhuyse 4 1160 Brussels, Belgium
Study Monitor:
Dr. Daniel Bertow
Industriepark Wolfgang GmbH
Rodenbacher Chaussee 4
63457 Hanau-Wolfgang, Germany
Test facility
Fraunhofer-Institute for Molecular Biology and Applied Ecology (IME) 57377 Schmallenberg Germany
Test facility management Dr. Christoph Schäfers
Study director Dr. Markus Simon
Page 1 of 59
October 19th
, 2011
Study report: Sediment – water chironomid toxicity test - page 2/59 - Test item: Sodium cyanide GLP-Code: IPW – 001 / 4 – 29 / R
This page was intentionally left blank for statements of the sponsor or submitter


Study report: Sediment – water chironomid toxicity test - page 5/59 - Test item: Sodium cyanide GLP-Code: IPW – 001 / 4 – 29 / R
Contents page
Statement of GLP-Compliance 3
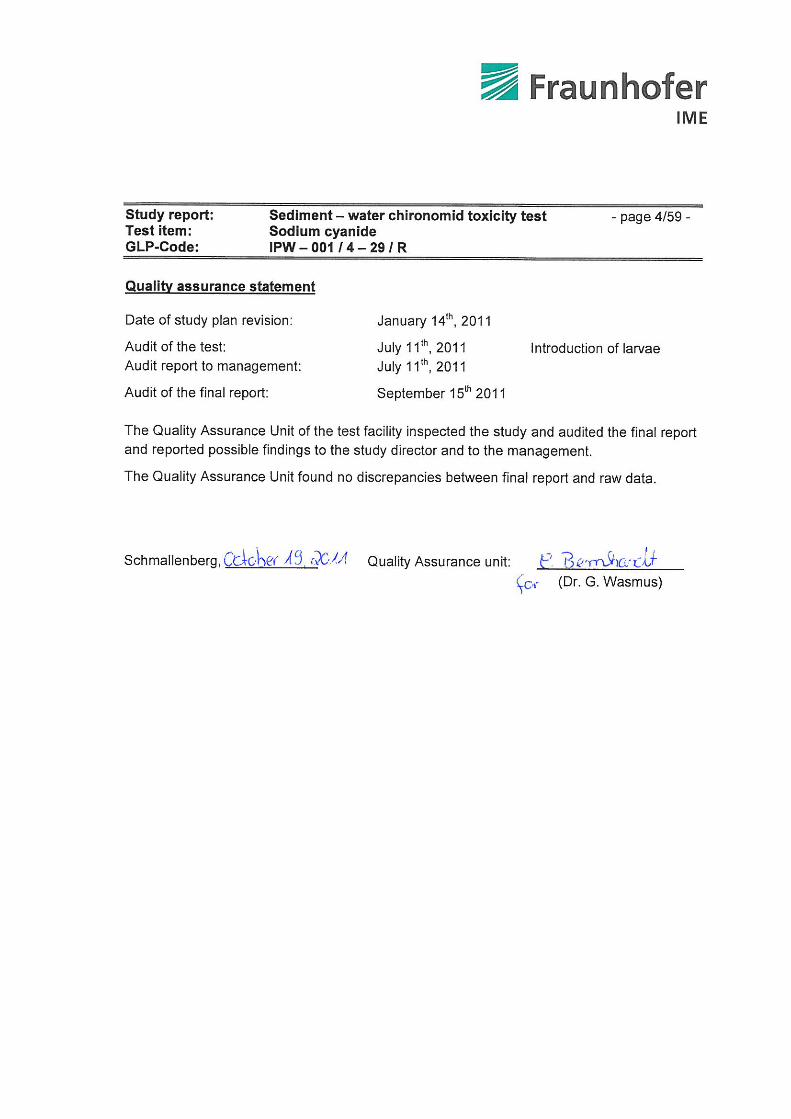
Quality assurance statement 4
Contents 5
Distribution list 5
Definitions 6
List of tables 7
List of figures 7
Summary 8
1 Title 9
2 GLP-Status 9
3 Sponsor 9
4 Monitor 9
5 Testing facility 9
6 Schedule 9
7 Test and reference items 10
8 Test principle 12
9 Details concerning the test 12
10 Treatment of the results 16
11 Results 17
12 Validity 21
13 References 22
14 Archiving 22
15 Annex 1: Raw data and statistical evaluation 23
16 Annex 2: Inspection certificate of the test item according to EN 10204 3.1 38
17 Annex 3: GLP Certificate 39
18 Annex 4: Chemical Analysis 41
Distribution list
GLP-archive: 1 original (1st of 5)
Principal Sponsor: 4 originals (2nd, 3rd, 4th, 5th, of 5) and pdf
Study director: 1 copy
Study report: Sediment – water chironomid toxicity test - page 6/59 - Test item: Sodium cyanide GLP-Code: IPW – 001 / 4 – 29 / R
Definitions
LOEC: (lowest observed effect concentration) is the lowest
concentration tested at which the measured parameter shows
significant increased immobilization relative to the control.
NOEC: (no observed effect concentration) is the highest concentration
tested at which the measured parameter shows no significant
increased immobilization relative to the control.
EC10/20/50: (effective concentration) is the concentration of the test item,
which results in a 10, 20 or 50 per cent increased
immobilization relative to the control.
Development time: The mean development time represents the mean time span
between the introduction of larvae (day 0 of the test) and the
emergence of the experimental cohort of midges.
Development rate: The development rate is the reciprocal of the development time
(unit: 1/day) and represents that portion of larval development
which takes place per day.
Study report: Sediment – water chironomid toxicity test - page 7/59 - Test item: Sodium cyanide GLP-Code: IPW – 001 / 4 – 29 / R
List of tables page Table 1: Measured test item concentrations. .................................................................................. 18
Table 2: Emergence at test end. Emerged midges [Ind.] and emergence rate [% of introduced larvae] .................................................................................................... 19
Table 3: Development time and rate. Development time [d] and rate [1/d] of midges.. .................. 20
Table 4: Effect summary table. ........................................................................................................ 21
Table 5: Oxygen saturation of the overlaying water. Values of the test vessels throughout the test [%]. ....................................................................................................................... 23
Table 6: pH of the overlaying water. Values of the test vessels at representative dates (once a week). .................................................................................................................. 24
Table 7: Temperature of the overlaying water [°C]. ........................................................................ 24
Table 8: Total hardness and ammonia concentration of the overlaying water.. .............................. 25
Table 9: Analysed concentrations [µg CN-/L] and recovery rates [% of nominal] of free cyanide in representative application solutions. ............................................................... 44
Table 10: Calculation of elimination rate ke for 5.31 µg CN-/L .......................................................... 48
Table 11: Geometric mean test item concentrations. ........................................................................ 50
Table 12: Results of representative test media analysis right after spiking ...................................... 51
List of figures page Figure 1: Influence of the test item on emergence rate of the introduced Chironomus riparius
as observed after 28 d. ..................................................................................................... 19
Figure 2: Influence of the test item on development rate of the introduced Chironomus riparius as observed after 28 d. ........................................................................................ 20
Figure 3: Calibration function of cyanide .......................................................................................... 43
Figure 4: Basic calibration function of cyanide ................................................................................. 47
Figure 5: Dissipation of cyanide during 22 hour in medium with 5.31 µg CN-/L .............................. 49
Figure 6: Calibration solution level 1, cyanide conc.: 2 µg CN/L ...................................................... 54
Figure 7: Calibration solution level 7, cyanide conc.: 30 µg CN/L .................................................... 54
Figure 8: Test sample kinetic test; nominal CN conc.: 5.31 µg/L; sampling time: 0 h ...................... 55
Figure 9: Test sample kinetic test; nominal CN conc.: 5.31 µg/L; sampling time: 6 h ...................... 55
Figure 10: Control sample; sampling time: day 14 (measured on July 26, 2011) .............................. 56
Figure 11: Test sample; nominal CN conc.: 2.5 µg/L; sampling time: day 14, right after spiking ...... 56
Figure 12: Test sample; nominal CN conc.: 5.0 µg/L; sampling time: day 14, right after spiking ...... 57
Figure 13: Copper free tap water ........................................................................................................ 57
Figure 14: Control sample; sampling time: day 14 (measured on July 26, 2011) .............................. 58
Figure 15: Ultra pure water ................................................................................................................. 58
Figure 16: Pure NaOH trap solution ................................................................................................... 59

Study report: Sediment – water chironomid toxicity test - page 8/59 - Test item: Sodium cyanide GLP-Code: IPW – 001 / 4 – 29 / R
Summary
At the Fraunhofer-Institute for Molecular Biology and Applied Ecology the influence of
sodium cyanide on emergence of midges of the species Chironomus riparius was
investigated. For this, the sediment-dwelling larvae (first instar) of the freshwater
dipteran were placed in a sediment-water test system with defined artificial sediment.
The overlaying water was spiked with the test item at nominal concentrations of 0.31,
0.63, 1.25, 2.5, 5.0 µg CN/L (as 0.59, 1.18, 2.35, 4.71 and 9.42 µg NaCN/L). Daily
application of the test item was made due to total disappearance within 24 h.
Chironomid emergence was evaluated at the end of the test after 28 days of
incubation.
The initial measured test item concentration in the application solutions were within
80 - 120 % of nominal concentrations. Due to a representative verification of the
nominal concentrations in the overlaying water of the treatments right after spiking,
nominal concentrations were assumed to be after each medium renewal. Effects on
the midges were related to the initial concentrations according to the guideline.
Concentrations applied for statistical evaluation were 0.32, 0.64, 1.28, 2.50, and
5.0 µg CN/L, corresponding with 0.60, 1.20, 2.40, 4.70, and 9.42 µg NaCN/L (initial
concentrations) and 0.10, 0.21, 0.41, 0.82, and 1.65 µg CN/L, corresponding with
0.19, 0.39, 0.78, 1.55, and 3.10 µg NaCN/L (geometric mean concentrations),
respectively.
No significant effects were found on emergence rate, development time and rate, and
sensitivity of the sexes at any concentration tested. The NOECs (no observed effect
concentrations) for all endpoints were found to be ≥5.0 µg CN/L, corresponding with
≥9.42 µg NaCN/L (initial concentrations) and ≥1.65 mg CN/L, corresponding with
≥3.10 mg NaCN/L (geomean concentrations). Due to the lack of effects, no EC
calculation could be applied. The EC10, EC20, and EC50 values for all endpoints were
found to be >5.0 µg CN/L, corresponding with >9.42 µg NaCN/L (initial
concentrations) and >1.65 mg NaCN/L, corresponding with >3.10 mg NaCN/L
(geomean concentrations).
Conclusion: Sodium cyanide had no adverse effect on development and emergence of
Chironomus riparius under the chosen test conditions. NOEC is ≥5.0 µg CN/L per litre
based on initial concentration (corresponding with ≥9.42 µg NaCN) and ≥1.65 mg CN/L
per litre based on mean measured concentration (corresponding with ≥3.10 mg NaCN).
EC10, EC20, and EC50 values for all endpoints were >5.0 µg CN/L per litre based on
initial concentration (corresponding with >9.42 µg NaCN) and >1.65 mg CN/L based on
mean measured concentration (corresponding with >3.10 mg NaCN/L).

Study report: Sediment – water chironomid toxicity test - page 9/59 - Test item: Sodium cyanide GLP-Code: IPW – 001 / 4 – 29 / R
1. Title: Sediment – water chironomid toxicity test using spiked water
Test item: Sodium cyanide 2. GLP-Code: IPW – 001 / 4 – 29 / R 3. Sponsor: Principal Sponsor: CEFIC Cyanide Sector Group
Avenue E. van Nieuwenhuyse 4
1160 Brussels, Belgium
Co-Sponsors:
CONCAWE
Boulevard du Souverain 165
1160 Brussels, Belgium
EUROFER
Avenue Ariane 5
1200 Brussels, Belgium
EUROMINES
Ave de Broqueville 12
1150 Brussels, Belgium
4. Monitor: Dr. Daniel Bertow
Industriepark Wolfgang GmbH
Rodenbacher Chaussee 4
63457 Hanau-Wolfgang, Germany
5. Test facility: Fraunhofer-Institute for
Molecular Biology and Applied Ecology (IME)
Postfach 1260
57377 Schmallenberg
Division Applied Ecology
Test facility Management: Dr. Christoph Schäfers
Department: Ecotoxicology
Study director: Dr. Markus Simon Deputy: Dr. Andrea Wenzel
Study report: Sediment – water chironomid toxicity test - page 10/59 - Test item: Sodium cyanide GLP-Code: IPW – 001 / 4 – 29 / R
Technical staff, Biology: T. Görtz, K. Mock, S. Preißler, K.
Schlich, R. Schlinkert, R. Ulrich
Quality Assurance Unit: Dr. G. Wasmus, Dr. U. Wahle,
Cornelia Bernhardt, Karin Fink
6. Schedule: Test start: July 8th, 2011
Test end: August 9th, 2011

Study report: Sediment – water chironomid toxicity test - page 11/59 - Test item: Sodium cyanide GLP-Code: IPW – 001 / 4 – 29 / R
7. Test and reference items:
The test item and certificate of analysis were delivered by the sponsor before the start of the study. Test item information is given by the sponsor. By his signature of the study plan the sponsor accepts that the chemical identity and purity of test item were not checked analytically by the test facility. Test item which will not be needed for testing and for archiving will be stored until expiry date and thereafter will be disposed of as hazardous waste according to local regulations or send back to the sponsor after agreement of the Sponsor.
7.1 Test item (Data supplied by the sponsor)
7.1.1 Trade name: Sodium cyanide
7.1.2 CAS name: Sodium cyanide
7.1.3 CAS-Number: 143-33-9
7.1.4 Lot Number: 23.10.10
7.1.5 Purity: > 98 %
7.1.6 State of matter and appearance: White, crystalline solids
7.1.7 Water solubility (20 °C): 370 g/L
7.1.8 Vapour pressure (20 °C): None
7.1.9 Relative density (20 °C): 1.595 g/mL
7.1.10 Partition coefficient (logPow, 20 °C): Not applicable
7.1.11 Chemical stability: Stable under normal temperatures. Formation
of HCN in aqueous solution.
7.1.12 Waste disposal: Via halogen-free, organic/aqueous wastes; pre-
treatment with H2O2 35% for 24 hours
7.1.13 Origin of the test item: Principal Sponsor
7.1.14 Date of receipt: November 24, 2010
7.1.15 Expiry date: October 23, 2015
7.1.16 Required amount for testing and archiving: 5 g
7.1.17 Storage conditions: Store in a cool, dry place. Store in a tightly
closed container. Poison room locked. Keep
away from acids. Do not store in metal (also not
aluminium) containers.

Study report: Sediment – water chironomid toxicity test - page 12/59 - Test item: Sodium cyanide GLP-Code: IPW – 001 / 4 – 29 / R
7.1.18 Storage stability: Stable (see 7.1.11)
7.1.19 Safety data sheet available? Available
7.1.20 General preventive measures: Non-flammable protective clothing, gloves, eye
protector
8. Test principle
The sediment-dwelling larvae (first instar) of the freshwater dipteran Chironomus riparius
were placed in a sediment-water test system with defined artificial sediment. The overlaying
water was spiked with the test item at a range of concentrations. Daily application of the test
item was made due to total disappearance within 24 h. Chironomid emergence was
evaluated at the end of the test after 28 days of incubation. The test was performed
according to the guideline OECD 219. Using appropriate statistical methods it was analysed,
whether there was a statistical significant difference in emergence rate, development time
and rate, and sensitivity of the sexes between the treatment and the control.
9. Details concerning the test
9.1 Biological material:
The test organisms were the first instar larvae from the dipteran Chironomus riparius.
Origin of the midges: Bayer Crop Science AG, 40789 Monheim, Germany.
Specimens used in the test were bred in the laboratory of the
Fraunhofer IME.
Breeding conditions: The breeding conditions follow SOP V4-601/02. On a layer of
diatomaceous earth purified tap water was used. The
dipterans were fed daily with powder of TetraMin® Hauptfutter
(Tetra Werke, Melle, Germany).
Pre-treatment: Four to five days before adding the test organisms to the test
vessels, egg masses were taken from the cultures and placed
in small aerated vessels with test water at about 20 °C. First
instar larvae (2 days post hatching) were used in the test.
Study report: Sediment – water chironomid toxicity test - page 13/59 - Test item: Sodium cyanide GLP-Code: IPW – 001 / 4 – 29 / R
9.2 Test substrate/water:
Artificial sediment components
Sphagnum peat, air-dried, finely ground 5%
Kaolinite, air-dried 20%
Industrial quartz sand, air-dried 75%
The test substrate was wetted with deionised water to reach a water content of
between 30% and 50%. Pulverized calcium carbonate of chemically pure quality
(CaCO3) was added to adjust the pH of the final mixture of the sediment to 7.0 ± 0.5.
Organic carbon content of the final mixture was 2.4%, which was within the
demanded range of 2% ± 0.5%.
Water
Purified tap water was used as test water.
9.3 Food:
Powder of TetraMin® Hauptfutter was used for feeding the larva. According to the
guideline, the food ration for the first 10 days were 0.25 – 0.5 mg TetraMin®
/larvae/day, from day 10 the food ration was increased up to 0.5 – 1.0 mg TetraMin®
/larvae/day.
9.4 Test item:
The test item was sodium cyanide. The nominal concentration in the test containers
with test item was 0.59, 1.18, 2.35, 4.71, and 9.42 µg NaCN/L, corresponding with
0.31, 0.63, 1.25, 2.50, and 5.00 µg CN/L. Four replicates per concentration were
conducted.
9.5 Control:
The control consisted of formulated sediment and test water. Four replicates were
conducted.
9.6 Introduction of the test item:
A stock solution of the test substance suspended in deionised water was added
thoroughly to the water column in the test vessels 24 h after addition of the test
specimens and then every 24 h. The water column was mixed thoroughly after test
item application not to disturb the sediment. The daily application results in the most
reproducible test item concentration with nominal concentrations right after spiking
and 0 – 10 % of nominal after 24 h right before the next test item application. For
details see Annex 4, 18.5.2, 18.6.6 and 18.6.7.
Study report: Sediment – water chironomid toxicity test - page 14/59 - Test item: Sodium cyanide GLP-Code: IPW – 001 / 4 – 29 / R
9.7 Test container:
Round glass beakers (3L) were used as test Vessels. The vessels were filled up with
486 g of wet artificial sediment (corresponding with 370 g dry mass). The height was
2 cm. The overlaying water was 8 cm high (the sediment-water ratio being about 1:4).
The containers were covered with glass plates. After 10 days, emergence traps were
placed on the test vessels, the glass plates were rested on the emergence traps to
avoid evaporation. Aeration of overlaying water was provided through a glass pipette
fixed 2-3 cm above the sediment layer (at least 1 bubble /second).
9.8 Test procedure:
Batches of twenty larvae were placed into each vessel including those of the control.
The test was carried out at 20 °C ± 2 °C and at 16 hours photoperiod (500 –1000 lux).
The exposure duration was 28 days. The development time and total number of fully
emerged male and female midges were determined. Test vessels were observed
three times a week for visual assessment of abnormal behaviour. Emergence was
counted daily. After identification the midges were removed from the test vessel. At
test end, test vessels were observed for visible pupae that had failed to emerge.
9.9 Analytical measurement:
Concentration of the test substance
At test start and four additional dates distributed over the whole test duration, samples
of the application solutions were taken for the analytical determination of the test item
concentration. Additionally, samples of the overlaying water were taken after an
equilibration period of 1 hour after addition of the test item from one vessel per
treatment for the analytical determination of the test item concentration in the
overlaying water after media renewal at these dates. However, due to technical
reasons only overlaying water samples of one of the dates could be measured.
Results of a non-GLP kinetic study applied before the chronic test show total
disappearance of the test item after 24 h under test conditions. Since analytical
values were expected to be clearly below the LOQ, no samples were taken and
measured at the end of the 24h-aging periods. However, total disappearance was
verified by nominal concentrations in the overlaying water samples of day 14 after
media renewal (For details see Annex 4, 18.6.7). For the sampling additional vessels
were prepared.
Samples of the sediment were taken at the start and at the end of the test from one
vessel of all treatments. For the sampling time day 0 additional vessels were
prepared. At the end of the test sediment from the main test were used. Due to
technical reasons, test item concentration in the sediment could not be verified
Study report: Sediment – water chironomid toxicity test - page 15/59 - Test item: Sodium cyanide GLP-Code: IPW – 001 / 4 – 29 / R
analytically. Also test item concentration in pore water could not be verified
(insufficient volumes available). For details see Annex 4.
Analytical method
The determination of free cyanide in the application solutions was carried out by
photometric measurement using the Merck Spectroquant® 1.14800 kit. For details see
Annex 4.
Due to the unexpected low test concentrations, overlaying water and sediment
samples were intended to be measured with an ion chromatographic system after an
acetous extraction with subsequent collecting in sodium hydroxide. However, due to
several technical reasons, this method could not be applied successfully to the
samples. For details see Annex 4.
Physical chemical parameters (overlaying water)
Temperature and pH were measured at test start / end and during the study once a
week. Dissolved oxygen was measured at test start and twice a week in one
representative vessel per treatment, and at test end in all test vessels. Hardness and
ammonia were measured in the controls and one test vessel at the highest
concentration at the start, and in the controls and representative vessels of the
treatments at the end of the study.
9.10 Deviations from the guideline/study plan:
Contrary to the study plan, test item concentration in the overlaying water and the
sediment could not be analysed due to technical reasons. However, results of
representatively analysed application solutions and of a non-GLP kinetic study
obtained that the test item concentrations in the overlaying water were at nominal
concentrations right after spiking and nearly zero at the end of the 24 h-aging period.
Due to the chemical/physical properties of the test item, no adsorption to the sediment
is expected. Therefore, the deviations are without influence on the integrity of the
study.

Study report: Sediment – water chironomid toxicity test - page 16/59 - Test item: Sodium cyanide GLP-Code: IPW – 001 / 4 – 29 / R
10. Treatment of the results
Data evaluation:
Numerical values in this report are frequently rounded to a smaller degree of precision
(number of digits) than were used in the actual calculation. Minor differences in results
obtained from calculations with such rounded values in comparison to those obtained with
higher precision values are possible. They are, however, well within the limits of the
experimental accuracy and thus of no practical concern.
Statistical calculations:
Calculation were performed with the computer software ToxRat® Professional version 2.10
(release 20.02.2010) by ToxRat® Solutions GmbH. Results are presented in chapter 11 and
Annex 1.

Study report: Sediment – water chironomid toxicity test - page 17/59 - Test item: Sodium cyanide GLP-Code: IPW – 001 / 4 – 29 / R
11. Results
Environmental conditions:
With 20.0 – 20.4 °C and pH values throughout the test of 7.7 – 8.3 the permitted range of
20 ± 2 °C and pH 6 – 9 was kept. The light intensity was measured using an illuminance
meter (MINOLTA) with photometric sensor in Lux. With 558 – 697 lx the permitted range of
about 500 - 1000 lx was kept. The total hardness at test start was 1.1 – 1.3 mmol/L as
CaCO3 equivalents which was below the demanded threshold value of 4 mmol/L as CaCO3
equivalents. The total hardness at test end was 0.9 – 1.0 mmol/L as CaCO3 equivalents in
the controls and 1.0 – 1.3 mmol/L as CaCO3 equivalents in the replicates of the highest test
concentration. For raw data please refer to Annex 1.
Test item concentrations:
The mean measured test item concentrations of the overlaying water (based on
representative measurements of the application solutions) were within the range of 80-120 %
of the nominal dose introduced into the test vessels in the treatments with 0.313, 0.625, 1.25,
2.5, and 5.0 µg CN/L nominal concentration, respectively (table 2, further details see Annex
4).
At the end of the 24 h-aging periods, cyanide concentrations in the overlaying water were
expected to correspond to approximately 10 % (based on results of a non-GLP kinetic study,
see Annex 4) of the dose introduced into the test vessels.
Concentrations in the sediment and the pore water could not be determined due to technical
reasons (see Annex 4 for explanations). However, it is assumed that pore water
concentration is comparable to the concentration in the overlaying water and no adsorption
to the sediment occurs due to the physical/chemical properties of the test item.
According to the guideline initial concentrations in the overlaying water were applied for
concentration response calculation of the biological endpoints of the study. Concentrations
applied for statistical evaluation were 0.313, 0.625, 1.25, 2.5, and 5.0 µg CN/L (initial
concentrations).
Study report: Sediment – water chironomid toxicity test - page 18/59 - Test item: Sodium cyanide GLP-Code: IPW – 001 / 4 – 29 / R
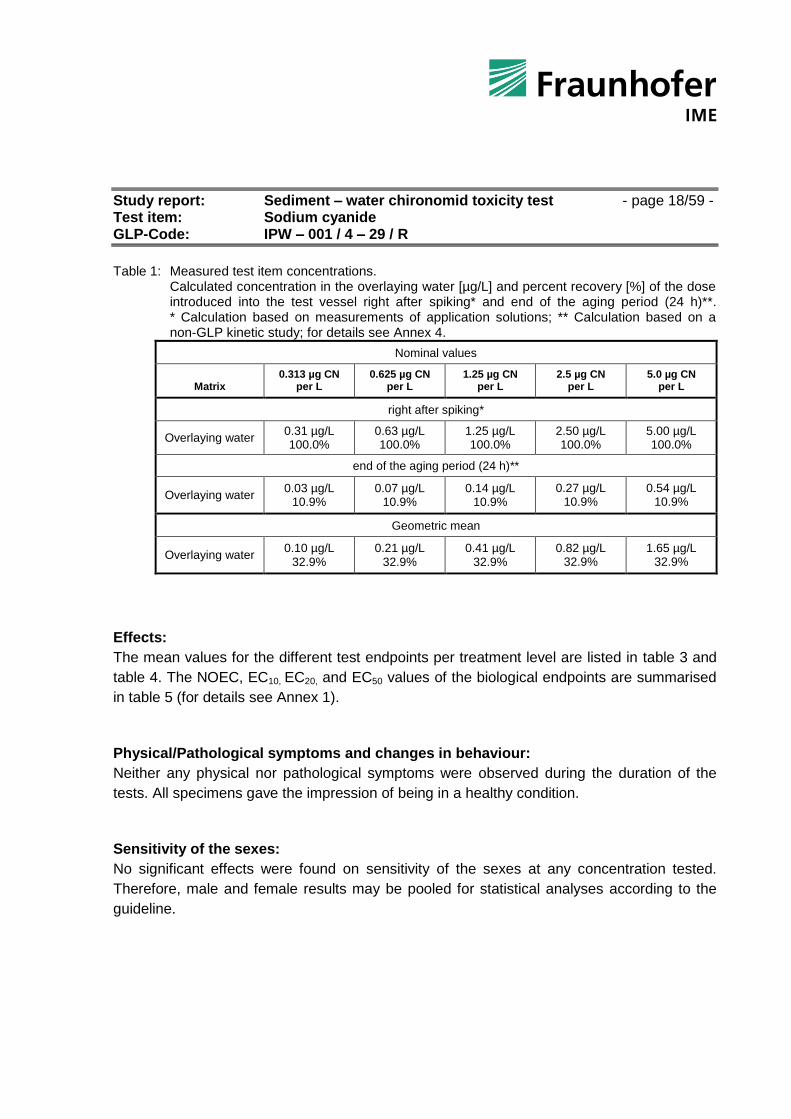
Table 1: Measured test item concentrations. Calculated concentration in the overlaying water [µg/L] and percent recovery [%] of the dose
introduced into the test vessel right after spiking* and end of the aging period (24 h)**. * Calculation based on measurements of application solutions; ** Calculation based on a non-GLP kinetic study; for details see Annex 4.
Nominal values
Matrix 0.313 µg CN
per L 0.625 µg CN
per L 1.25 µg CN
per L 2.5 µg CN
per L 5.0 µg CN
per L
right after spiking*
Overlaying water 0.31 µg/L 100.0%
0.63 µg/L 100.0%
1.25 µg/L 100.0%
2.50 µg/L 100.0%
5.00 µg/L 100.0%
end of the aging period (24 h)**
Overlaying water 0.03 µg/L
10.9%
0.07 µg/L 10.9%
0.14 µg/L 10.9%
0.27 µg/L 10.9%
0.54 µg/L 10.9%
Geometric mean
Overlaying water 0.10 µg/L
32.9%
0.21 µg/L 32.9%
0.41 µg/L 32.9%
0.82 µg/L 32.9%
1.65 µg/L 32.9%
Effects:
The mean values for the different test endpoints per treatment level are listed in table 3 and
table 4. The NOEC, EC10, EC20, and EC50 values of the biological endpoints are summarised
in table 5 (for details see Annex 1).
Physical/Pathological symptoms and changes in behaviour:
Neither any physical nor pathological symptoms were observed during the duration of the
tests. All specimens gave the impression of being in a healthy condition.
Sensitivity of the sexes:
No significant effects were found on sensitivity of the sexes at any concentration tested.
Therefore, male and female results may be pooled for statistical analyses according to the
guideline.

Study report: Sediment – water chironomid toxicity test - page 19/59 - Test item: Sodium cyanide GLP-Code: IPW – 001 / 4 – 29 / R
Emergence rate:
The results of emergence are presented in table 3. For raw data of the emergence see
Annex 1.
No concentration/effect dependency on emergence rate due to sodium cyanide was
detected. The EC10, EC20, and EC50 were found to be > 5.0 µg CN per litre (initial
concentration) and > 1.65 µg CN per litre (geometric mean concentration), respectively.
Confidence limits could not be calculated (Table 5).
The NOEC (no observed effect concentration) for the tested species Chironomus riparius
was found to be ≥ 5.0 µg CN per litre (initial concentration) and > 1.65 µg CN per litre
(geometric mean concentration), respectively.
Table 2: Emergence at test end. Emerged midges [Ind.] and emergence rate [% of introduced larvae]
Concentrations given as initial concentrations. No significant deviation when compared with control (Fisher`s Exact Binomial Test with Bonferroni Correction, p < 0.05; one-sided).
Control 0.313 µg CN per litre
0.625 µg CN per litre
1.25 µg CN per litre
2.5 µg CN per litre
5.0 µg CN per litre
Emerged midges [Ind.]
76 67 69 74 71 70
Emergence rate midges [%]
95 84 86 93 89 88
Figure 1: Influence of the test item on emergence rate of the introduced Chironomus riparius as observed after 28 d.
Effect on both sexes; No dose-response curve calculation possible.

Study report: Sediment – water chironomid toxicity test - page 20/59 - Test item: Sodium cyanide GLP-Code: IPW – 001 / 4 – 29 / R
Development time and rate:
The results of development time and rate are presented as mean values (Table 4). For
statistical comparison see Annex 1.
No concentration/effect dependency on development time and rate due to sodium cyanide
was detected. The EC10, EC20, and EC50 were found to be > 5.0 µg CN per litre (initial
concentration) and > 1.65 µg CN per litre (geometric mean concentration), respectively.
Confidence limits could not be calculated (Table 5).
The NOEC (no observed effect concentration) for the tested species Chironomus riparius
was found to be ≥ 5.0 µg CN per litre (initial concentration) and > 1.65 µg CN per litre
(geometric mean concentration), respectively.
Table 3: Development time and rate. Development time [d] and rate [1/d] of midges. Concentrations
given as initial concentrations. No significant deviation when compared with control (Williams Multiple Sequential t-test, p < 0.05; one-sided).
Control 0.313 µg CN per litre
0.625 µg CN per litre
1.25 µg CN per litre
2.5 µg CN per litre
5.0 µg CN per litre
Development time midges
17.8 17.9 18.2 18.0 17.9 18.7
Development rate midges
0.056 0.056 0.055 0.055 0.056 0.053
Figure 2: Influence of the test item on development rate of the introduced Chironomus riparius as observed after 28 d.
Effect on both sexes; No dose-response curve calculation possible.
Study report: Sediment – water chironomid toxicity test - page 21/59 - Test item: Sodium cyanide GLP-Code: IPW – 001 / 4 – 29 / R
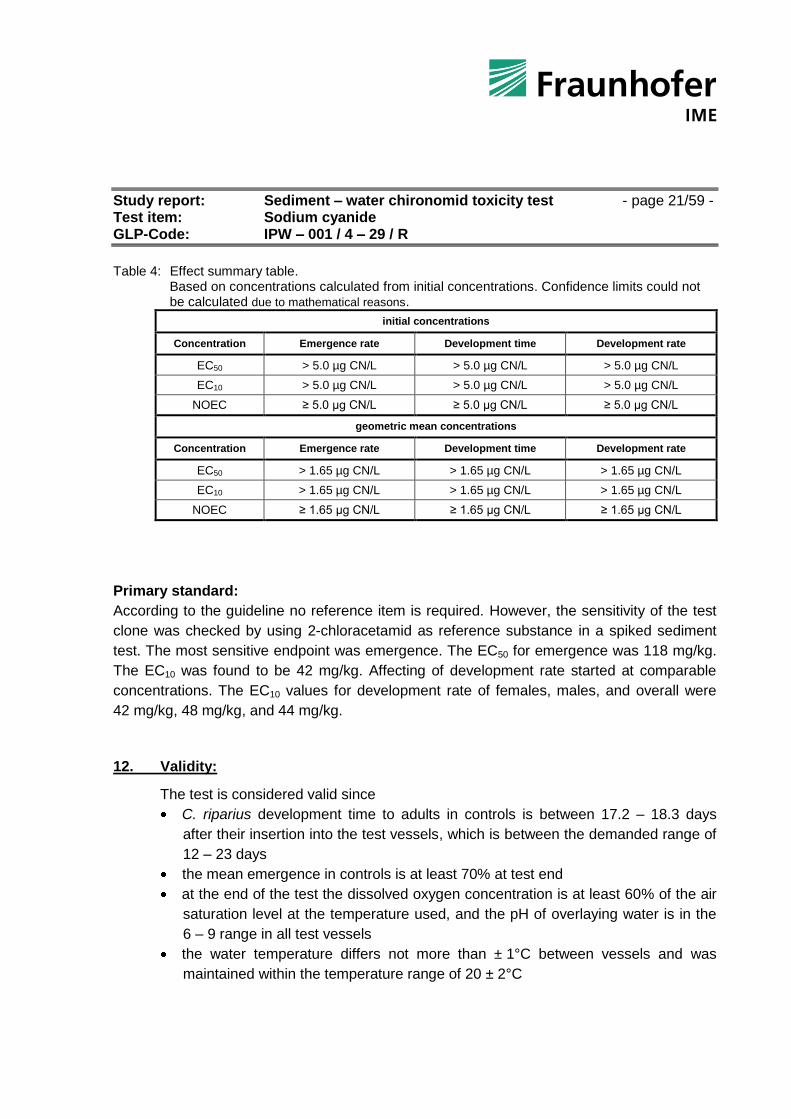
Table 4: Effect summary table.
Based on concentrations calculated from initial concentrations. Confidence limits could not be calculated due to mathematical reasons.
initial concentrations
Concentration Emergence rate Development time Development rate
EC50 > 5.0 µg CN/L > 5.0 µg CN/L > 5.0 µg CN/L
EC10 > 5.0 µg CN/L > 5.0 µg CN/L > 5.0 µg CN/L
NOEC ≥ 5.0 µg CN/L ≥ 5.0 µg CN/L ≥ 5.0 µg CN/L
geometric mean concentrations
Concentration Emergence rate Development time Development rate
EC50 > 1.65 µg CN/L > 1.65 µg CN/L > 1.65 µg CN/L
EC10 > 1.65 µg CN/L > 1.65 µg CN/L > 1.65 µg CN/L
NOEC ≥ 1.65 µg CN/L ≥ 1.65 µg CN/L ≥ 1.65 µg CN/L
Primary standard:
According to the guideline no reference item is required. However, the sensitivity of the test
clone was checked by using 2-chloracetamid as reference substance in a spiked sediment
test. The most sensitive endpoint was emergence. The EC50 for emergence was 118 mg/kg.
The EC10 was found to be 42 mg/kg. Affecting of development rate started at comparable
concentrations. The EC10 values for development rate of females, males, and overall were
42 mg/kg, 48 mg/kg, and 44 mg/kg.
12. Validity:
The test is considered valid since
C. riparius development time to adults in controls is between 17.2 – 18.3 days
after their insertion into the test vessels, which is between the demanded range of
12 – 23 days
the mean emergence in controls is at least 70% at test end
at the end of the test the dissolved oxygen concentration is at least 60% of the air
saturation level at the temperature used, and the pH of overlaying water is in the
6 – 9 range in all test vessels
the water temperature differs not more than ± 1°C between vessels and was
maintained within the temperature range of 20 ± 2°C
Study report: Sediment – water chironomid toxicity test - page 22/59 - Test item: Sodium cyanide GLP-Code: IPW – 001 / 4 – 29 / R
13. References:
13.1 OECD 219 (13.04.04): OECD guideline for testing of chemicals – Sediment-Water
Chironomid Toxicity Test using Spiked Water.
13.2 Oetken, M., Ludwichowski, K.-U., Nagel, R. (March 2001): Validation of the
preliminary EU-concept of assessing the impact of chemicals to organisms in
sediment by using selected substances. German Federal Environmental Agency,
report UBA-FB 299 67 411.
13.3 Gesetz zum Schutz vor gefährlichen Stoffen (Chemikaliengestz - ChemG) in der
Neufassung vom 02. Juli 2008 (BGBl. I S. 1146), geändert am 11.08.2010 (BGBL. I
S. 1163) (Anhang 1 (zu § 19a Abs. 1) Grundsätze der Guten Laborpraxis (GLP))
13.4 Verordnung zur Neufassung der Gefahrstoffverordnung und zur Änderung
sprengstoffrechtlicher Verordnungen vom 30. November 2010 (BGBl. I S 1643).
13.5 ToxRat® Professional 2.09. ToxRat® Solutions GmbH, Naheweg 15, D-52477 Alsdorf
(http://www.toxrat-solutions.de).
13.6 Simon, M. (2011): Chironomid acute toxicity test, Semi-static exposure - Acute
Toxicity of sodium cyanide on Chironomus riparius. Unpublished report. Report No.
IPW-001/4-36/R; Reg. No. 2010-0230-DGO.
13.7 ISO/DIS 11262 (2010): Bodenbeschaffenheit - Bestimmung von Gesamtcyanid
14. Archiving
An aliquot of the test and reference item, all raw data and all records necessary to
reconstruct the study will be archived, following internal SOPs, in the GLP-archive of the
Fraunhofer-Institute for Molecular Biology and Applied Ecology, D-57377 Schmallenberg,
according with the Principles of Good Laboratory Practice (for references see chapter 13).
List of records that will be archived:
Data specifying the test item
Data concerning test species and substrate (origin, properties)
List of correspondence between study director and monitor
Because no GLP deviations occurred, no list is presented
Original raw data of test
Original study plan
Original final report

Study report: Sediment – water chironomid toxicity test - page 23/59 - Test item: Sodium cyanide GLP-Code: IPW – 001 / 4 – 29 / R
15. Annex 1: Raw data and statistical evaluation
Table 5: Oxygen saturation of the overlaying water. Values of the test vessels throughout the test [%].
Concentrations given as initial concentrations.
Replicate Start Day 5 Day 9 Day 12 Day 16 Day 19 Day 23 Day 26 Day 29
Control
1 102.1 102.0 91.4 92.2 100.1
2 102.6 100.0 94.9 93.6 100.0
3 102.3 101.7 91.7 95.8 100.2
4 101.6 100.3 85.8 98.8
0.313 µg CN per litre
1 102.3 101.2 95.6 94.4 100.2
2 102.0 100.6 95.0 94.2 99.7
3 102.3 101.2 88.2 95.1
4 101.1 97.6 89.4 90.2
0.625 µg CN per litre
1 100.8 96.2 82.1 86.1 90.1
2 103.1 100.1 95.1 89.7 96.1
3 103.4 100.9 87.9 90.4
4 101.6 82.7 88.1 96.8
1.25 µg CN per litre
1 100.7 101.2 92.3 95.5 100.7
2 101.5 99.5 92.3 90.7 98.8
3 101.3 99.1 89.4 98.0
4 100.8 99.5 83.1 83.7
2.5 µg CN per litre
1 101.2 100.3 88.9 88.2 89.4
2 101.3 100.1 92.4 92.0 99.0
3 101.6 101.4 89.2 97.8
4 102.0 95.8 88.3 77.9
5.0 µg CN per litre
1 102.1 101.4 87.3 88.6 100.4
2 101.1 98.2 88.4 86.2 85.8
3 101.6 100.2 90.8 95.3
4 101.5 100.4 89.5 83.3
Study report: Sediment – water chironomid toxicity test - page 24/59 - Test item: Sodium cyanide GLP-Code: IPW – 001 / 4 – 29 / R
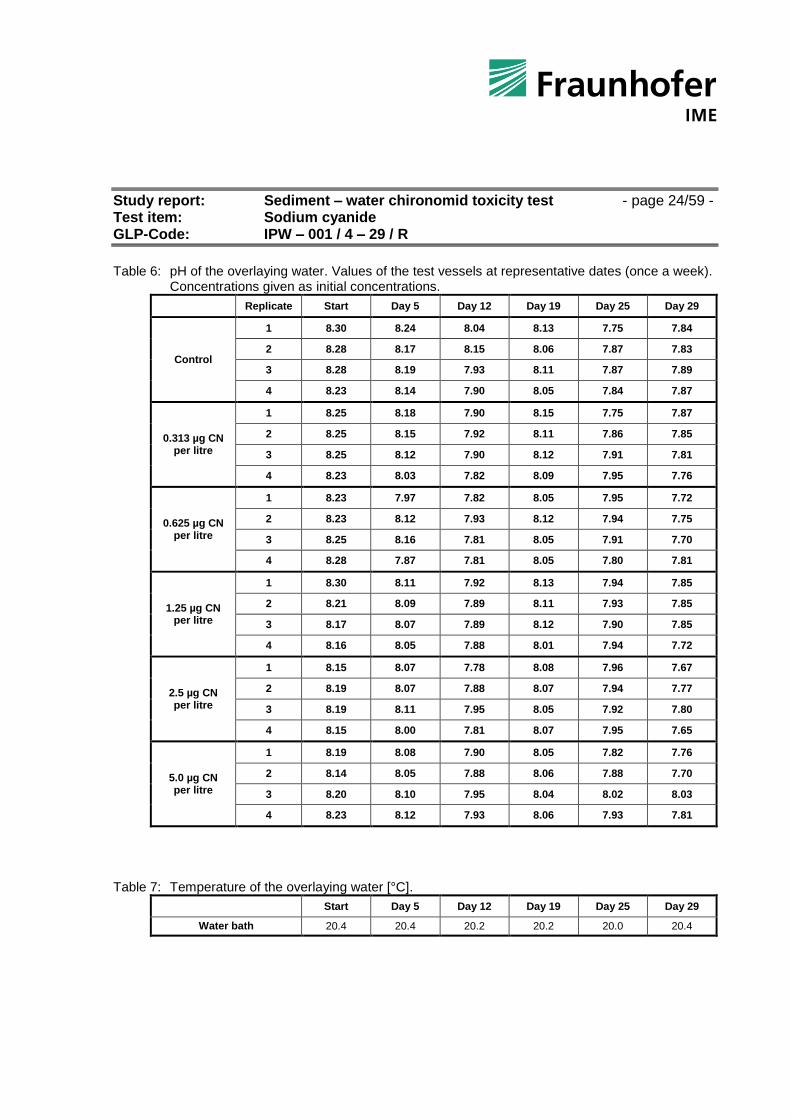
Table 6: pH of the overlaying water. Values of the test vessels at representative dates (once a week).
Concentrations given as initial concentrations.
Replicate Start Day 5 Day 12 Day 19 Day 25 Day 29
Control
1 8.30 8.24 8.04 8.13 7.75 7.84
2 8.28 8.17 8.15 8.06 7.87 7.83
3 8.28 8.19 7.93 8.11 7.87 7.89
4 8.23 8.14 7.90 8.05 7.84 7.87
0.313 µg CN per litre
1 8.25 8.18 7.90 8.15 7.75 7.87
2 8.25 8.15 7.92 8.11 7.86 7.85
3 8.25 8.12 7.90 8.12 7.91 7.81
4 8.23 8.03 7.82 8.09 7.95 7.76
0.625 µg CN per litre
1 8.23 7.97 7.82 8.05 7.95 7.72
2 8.23 8.12 7.93 8.12 7.94 7.75
3 8.25 8.16 7.81 8.05 7.91 7.70
4 8.28 7.87 7.81 8.05 7.80 7.81
1.25 µg CN per litre
1 8.30 8.11 7.92 8.13 7.94 7.85
2 8.21 8.09 7.89 8.11 7.93 7.85
3 8.17 8.07 7.89 8.12 7.90 7.85
4 8.16 8.05 7.88 8.01 7.94 7.72
2.5 µg CN per litre
1 8.15 8.07 7.78 8.08 7.96 7.67
2 8.19 8.07 7.88 8.07 7.94 7.77
3 8.19 8.11 7.95 8.05 7.92 7.80
4 8.15 8.00 7.81 8.07 7.95 7.65
5.0 µg CN per litre
1 8.19 8.08 7.90 8.05 7.82 7.76
2 8.14 8.05 7.88 8.06 7.88 7.70
3 8.20 8.10 7.95 8.04 8.02 8.03
4 8.23 8.12 7.93 8.06 7.93 7.81
Table 7: Temperature of the overlaying water [°C].
Start Day 5 Day 12 Day 19 Day 25 Day 29
Water bath 20.4 20.4 20.2 20.2 20.0 20.4

Study report: Sediment – water chironomid toxicity test - page 25/59 - Test item: Sodium cyanide GLP-Code: IPW – 001 / 4 – 29 / R
Table 8: Total hardness and ammonia concentration of the overlaying water. Single values of
representative test vessels [mmol/L CaCO3 equivalents and mg/L NH4] at test start and end. Concentrations given as initial concentrations.
Total hardness [mmol/L CaCO3] NH4 [mg/L)
replicate Day 1 Day 29 Day 1 Day 29
Control
1 1.2 1.0 0.9 < 0.1
2 1.3 1.0 0.9 < 0.1
3 1.2 0.9 0.9 < 0.1
4 1.2 1.0 0.9 < 0.1
5.0 µg CN per litre
1 1.2 < 0.1
2 1.1 < 0.1
3 1.1 1.0 0.8 6.8
4 1.3 0.7
Study report: Sediment – water chironomid toxicity test - page 26/59 - Test item: Sodium cyanide GLP-Code: IPW – 001 / 4 – 29 / R
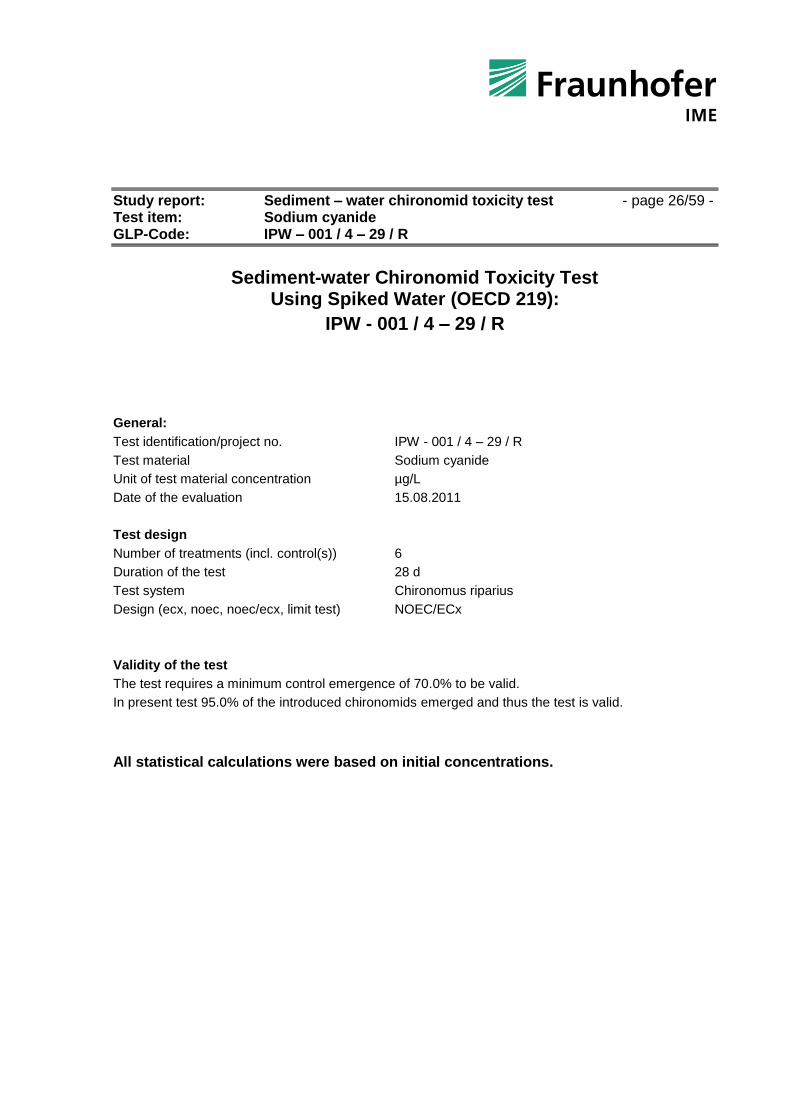
Sediment-water Chironomid Toxicity Test Using Spiked Water (OECD 219):
IPW - 001 / 4 – 29 / R
General:
Test identification/project no. IPW - 001 / 4 – 29 / R
Test material Sodium cyanide
Unit of test material concentration µg/L
Date of the evaluation 15.08.2011
Test design
Number of treatments (incl. control(s)) 6
Duration of the test 28 d
Test system Chironomus riparius
Design (ecx, noec, noec/ecx, limit test) NOEC/ECx
Validity of the test
The test requires a minimum control emergence of 70.0% to be valid.
In present test 95.0% of the introduced chironomids emerged and thus the test is valid.
All statistical calculations were based on initial concentrations.
Study report: Sediment – water chironomid toxicity test - page 27/59 - Test item: Sodium cyanide GLP-Code: IPW – 001 / 4 – 29 / R
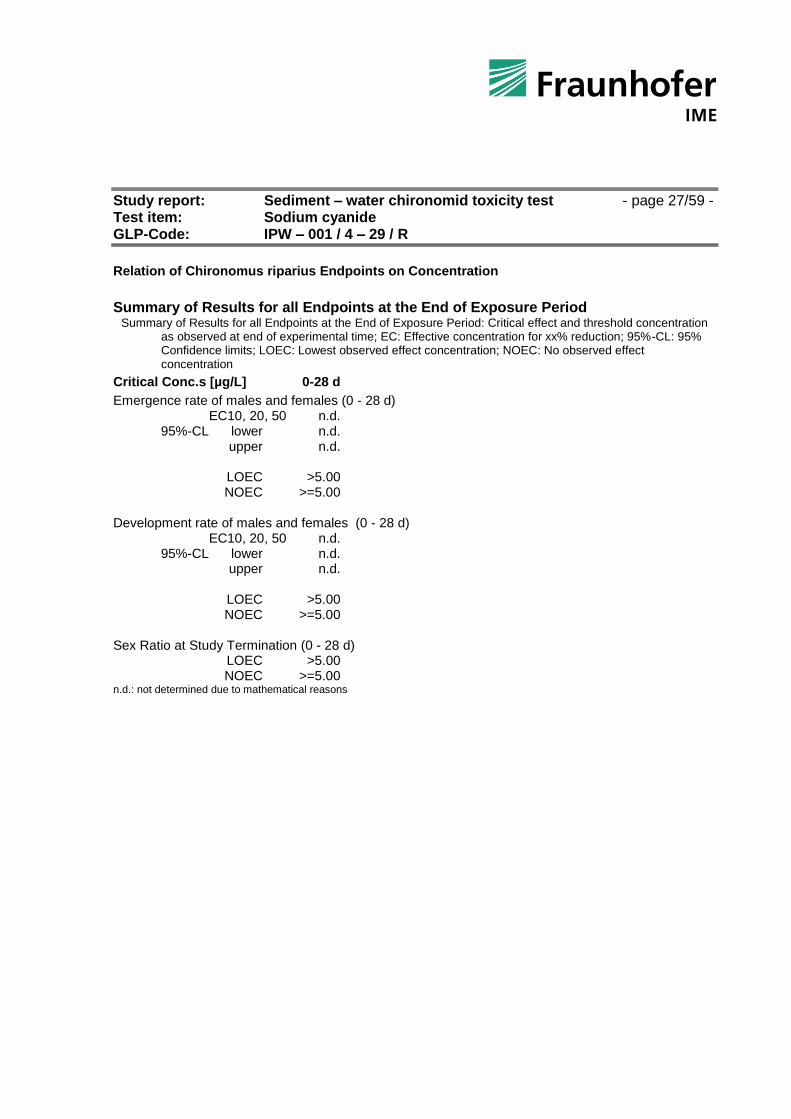
Relation of Chironomus riparius Endpoints on Concentration
Summary of Results for all Endpoints at the End of Exposure Period
Summary of Results for all Endpoints at the End of Exposure Period: Critical effect and threshold concentration as observed at end of experimental time; EC: Effective concentration for xx% reduction; 95%-CL: 95% Confidence limits; LOEC: Lowest observed effect concentration; NOEC: No observed effect concentration
Critical Conc.s [µg/L] 0-28 d
Emergence rate of males and females (0 - 28 d) EC10, 20, 50 n.d. 95%-CL lower n.d. upper n.d. LOEC >5.00 NOEC >=5.00 Development rate of males and females (0 - 28 d) EC10, 20, 50 n.d. 95%-CL lower n.d. upper n.d. LOEC >5.00 NOEC >=5.00 Sex Ratio at Study Termination (0 - 28 d) LOEC >5.00 NOEC >=5.00 n.d.: not determined due to mathematical reasons

Study report: Sediment – water chironomid toxicity test - page 28/59 - Test item: Sodium cyanide GLP-Code: IPW – 001 / 4 – 29 / R
Emergence of males and females as Dependent on Concentration and Time Cumulative emergence of Chironomus riparius males and females as dependent on concentration of the test item and time (calculated from InputRawDataAll)
Treatm. [µg CN/L]Control 0.31 0.63 1.25 2.50 5.00 0 d: 0 0 0 0 0 0 10 d: 0 0 0 0 0 0 11 d: 0 0 0 0 0 0 12 d: 0 0 0 0 0 0 13 d: 0 0 0 0 0 0 14 d: 1 0 0 0 1 0 15 d: 7 6 6 7 5 3 16 d: 13 13 11 17 12 7 17 d: 25 26 23 28 21 22 18 d: 40 43 36 39 39 30 19 d: 58 50 46 50 56 38 20 d: 66 53 53 55 63 47 21 d: 72 56 61 64 65 55 22 d: 74 63 63 71 67 61 23 d: 76 65 66 72 68 67 24 d: 76 67 68 73 70 70 25 d: 76 67 69 74 71 70 26 d: 76 67 69 74 71 70 27 d: 76 67 69 74 71 70 28 d: 76 67 69 74 71 70
Fig.: Emergence rate of males and females of the introduced Chironomus riparius as observed under
presence of the test item.
Study report: Sediment – water chironomid toxicity test - page 29/59 - Test item: Sodium cyanide GLP-Code: IPW – 001 / 4 – 29 / R
Emergence Rate of Males and Females of Chironomus riparius Failure of emergence caused by the test item at 28 d.
Treatm.[µg CN/L]Introduced Emerged Not-emerged % Not-emerged
Control 80 76 4 5.0 0.31 80 67 13 16.3 0.63 80 69 11 13.8 1.25 80 74 6 7.5 2.50 80 71 9 11.3 5.00 80 70 10 12.5 The control mortality of 5.0% at 28 d will be compensated using Abbott`s formula.
Effective Concentrations (ECx) with Emergence Rate of Males and Females at 28 d
Probit analysis using linear max. likelihood regression Probit analysis using linear max. likelihood regression: Determination of the concentration/response function; data is shown which entered the probit analysis; Log(x): logarithm of the concentration; n: number of organisms; Emp. Probit: empirical probits; reg. probit: calculated probits for the final function.
Treatm.[µg CN/L] Log(x)% Not-emerged n Emp. Probit Weight Reg. Probit Control 0.00 80 excluded 0.31 -0.504 11.84 80 -0.9565 27.007 -1.295 0.63 -0.204 9.21 80 -1.0224 25.069 -1.366 1.25 0.097 2.63 80 -1.1874 23.160 -1.438 2.50 0.398 6.58 80 -1.0884 21.298 -1.509 5.00 0.699 7.89 80 -1.0554 19.493 -1.580 excluded: value not in line with the chosen function Inhibitions lower equal 0% or greater equal 100% were replaced by 0.100 and 99.900, respectively.
No meaningful Concentration/response was found (slope <= 0). Therefore, the program refrained from deriving Concentration/response plots. Results of the probit analysis
Results of the probit analysis: Selected effective concentrations (ECx) of the test item and their 95%-confidence limits
Parameter EC10 EC50 Value [µg CN/L] n.d. n.d. lower 95%-cl n.d. n.d. upper 95%-cl n.d. n.d. Inhibitions lower equal 0% or greater equal 100% were replaced by 0.100 and 99.900, respectively. Slope function after Litchfield and Wilcoxon: 0.000 (The slope function is derived from the slope, b, of the linearized probit function and computes as S = 10^(1/b); please note that small values refer to a steep concentration/response relation and large ones to a flat relation.)
Study report: Sediment – water chironomid toxicity test - page 30/59 - Test item: Sodium cyanide GLP-Code: IPW – 001 / 4 – 29 / R
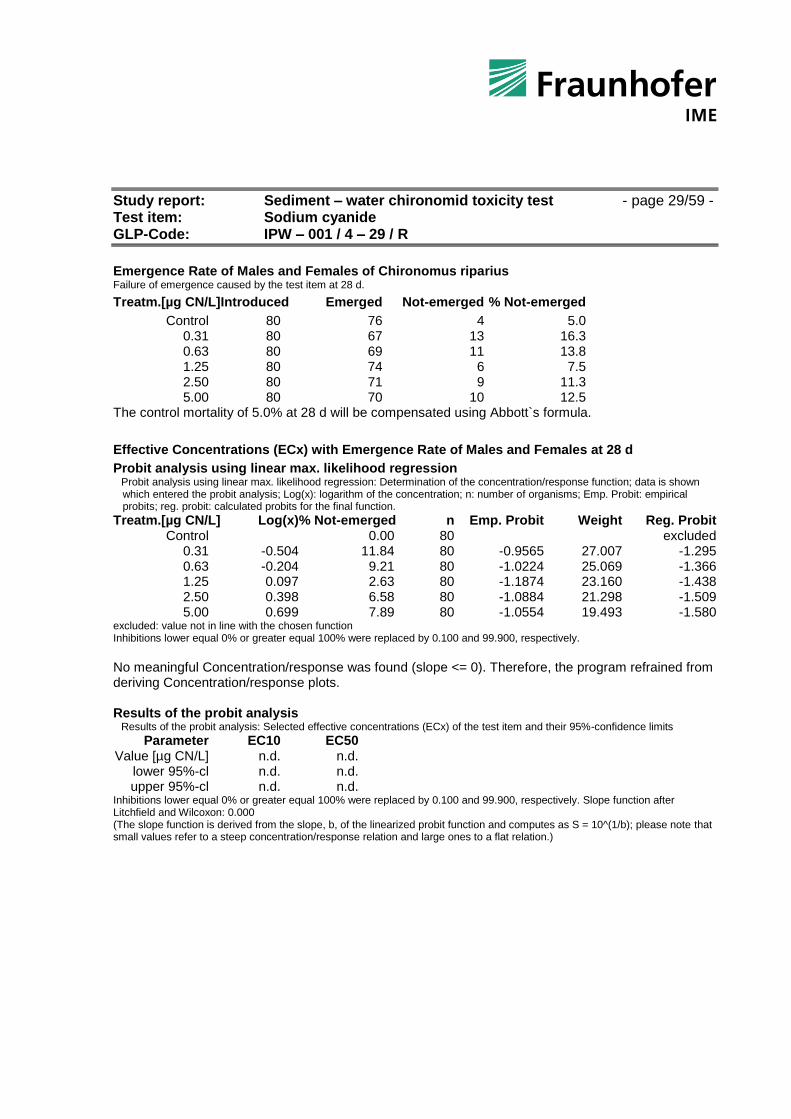
Fig.: Concentration-effect curve showing the influence of the test item on emergence rate of males
and females of the introduced Chironomus riparius as observed after 28 d.
Threshold concentrations (NOEC) with Emergence Rate of Males and Females at 28 d
Fisher`s Exact Binomial Test with Bonferroni Correction The NOEC appears to be higher than or equal 5.00 µg CN/L.
Development Rate of Males and Females as Dependent on Concentration and Time Development rate in Chironomus riparius Males and Females as dependent on concentration of the test item and time; Mean: arithmetic mean; Std.Dev.: standard deviation; n: number of replicates; CV: coefficient of variation (calculated from InputRawDataAll)
Treatm. [µg CN/L] Control 0.31 0.63 1.25 2.50 5.00 28 d 18.026 18.026 18.278 17.778 19.026 19.026 17.816 17.233 18.147 17.889 17.667 17.974 17.200 18.389 19.079 18.950 17.500 19.550 18.278 17.833 17.167 17.556 17.382 18.417
Mean: 17.830 17.870 18.168 18.043 17.894 18.742 Std.Dev.: 0.4605 0.4832 0.7842 0.6203 0.7639 0.6904 n: 4 4 4 4 4 4 CV: 2.6 2.7 4.3 3.4 4.3 3.7
Study report: Sediment – water chironomid toxicity test - page 31/59 - Test item: Sodium cyanide GLP-Code: IPW – 001 / 4 – 29 / R
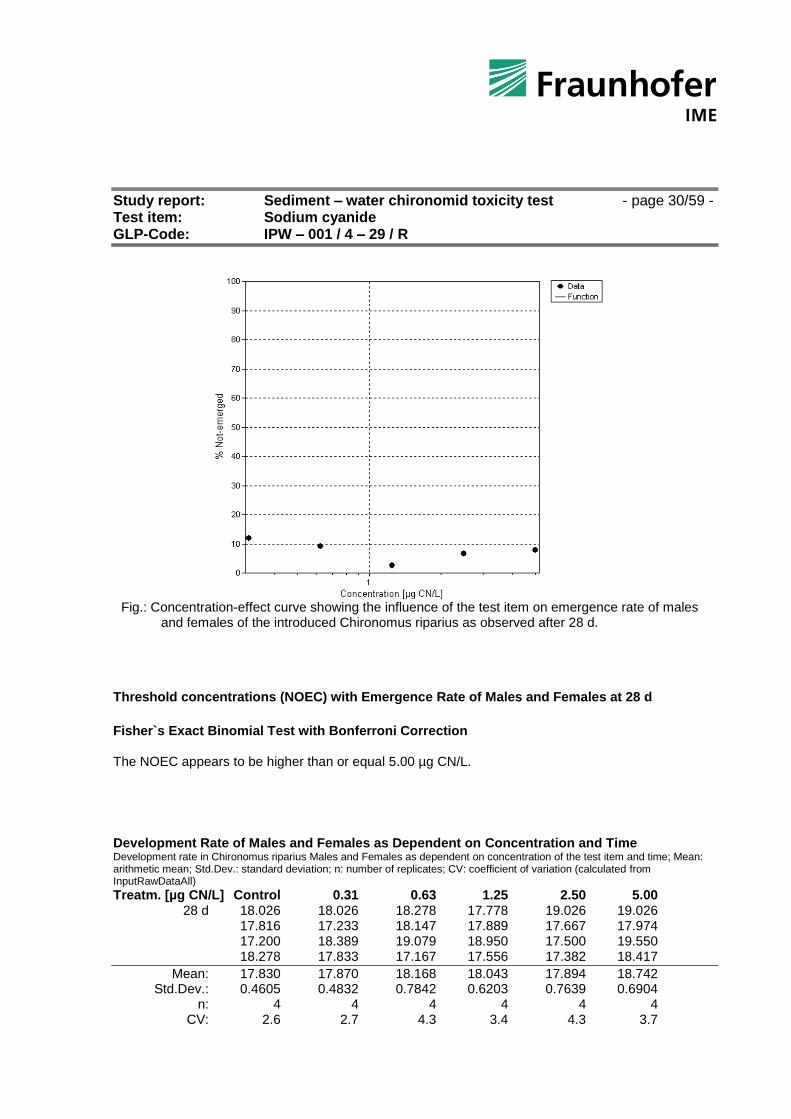
Fig.: Development time of males and females of Chironomus riparius as observed under presence of the test
item after 28 d.
Development Time of Males and Females in Chironomus riparius after 28 d. %Inhibition of development time of males and females caused by the test item after 28 d.
Treatm.[µg CN/L] Mean Std. Dev. n %Inhibition Control 17.830 0.4605 4 0.0 0.31 17.870 0.4832 4 -0.2 0.63 18.168 0.7842 4 -1.9 1.25 18.043 0.6203 4 -1.2 2.50 17.894 0.7639 4 -0.4 5.00 18.742 0.6904 4 -5.1
Effective Concentrations (ECx) with Development Time of Males and Females at 28 d
Probit analysis using linear max. likelihood regression Probit analysis using linear max. likelihood regression: Determination of the concentration/response function; data is shown which entered the probit analysis; Log(x): logarithm of the concentration; n: number of replicates; Emp. Probit: empirical probits; reg. probit: calculated probits for the final function.
Treatm. [µg CN/L] Log(x) % Inhibition n Emp. Probit Weight Reg. Probit Control 0.00 4 excluded 0.31 -0.504 0.00 4 -1.2590 0.208 -1.253 0.63 -0.204 0.00 4 -1.3008 0.208 -1.253 1.25 0.097 0.00 4 -1.2833 0.208 -1.253 2.50 0.398 0.00 4 -1.2623 0.208 -1.253 5.00 0.699 0.00 4 -1.3815 0.208 -1.253 excluded: value not in line with the chosen function Inhibitions lower equal 0% or greater equal 100% were replaced by 0.100 and 99.900, respectively.
Study report: Sediment – water chironomid toxicity test - page 32/59 - Test item: Sodium cyanide GLP-Code: IPW – 001 / 4 – 29 / R
No meaningful Concentration/response was found (slope <= 0). Therefore, the program refrained from deriving Concentration/response plots. Results of the probit analysis
Results of the probit analysis: Selected effective concentrations (ECx) of the test item and their 95%-confidence limits
Parameter EC10 EC50
Value [mg/L] n.d. n.d. lower 95%-cl n.d. n.d. upper 95%-cl n.d. n.d. Inhibitions lower equal 0% or greater equal 100% were replaced by 0.100 and 99.900, respectively. Slope function after Litchfield and Wilcoxon: 0.000 (The slope function is derived from the slope, b, of the linearized probit function and computes as S = 10^(1/b); please note that small values refer to a steep concentration/response relation and large ones to a flat relation.)
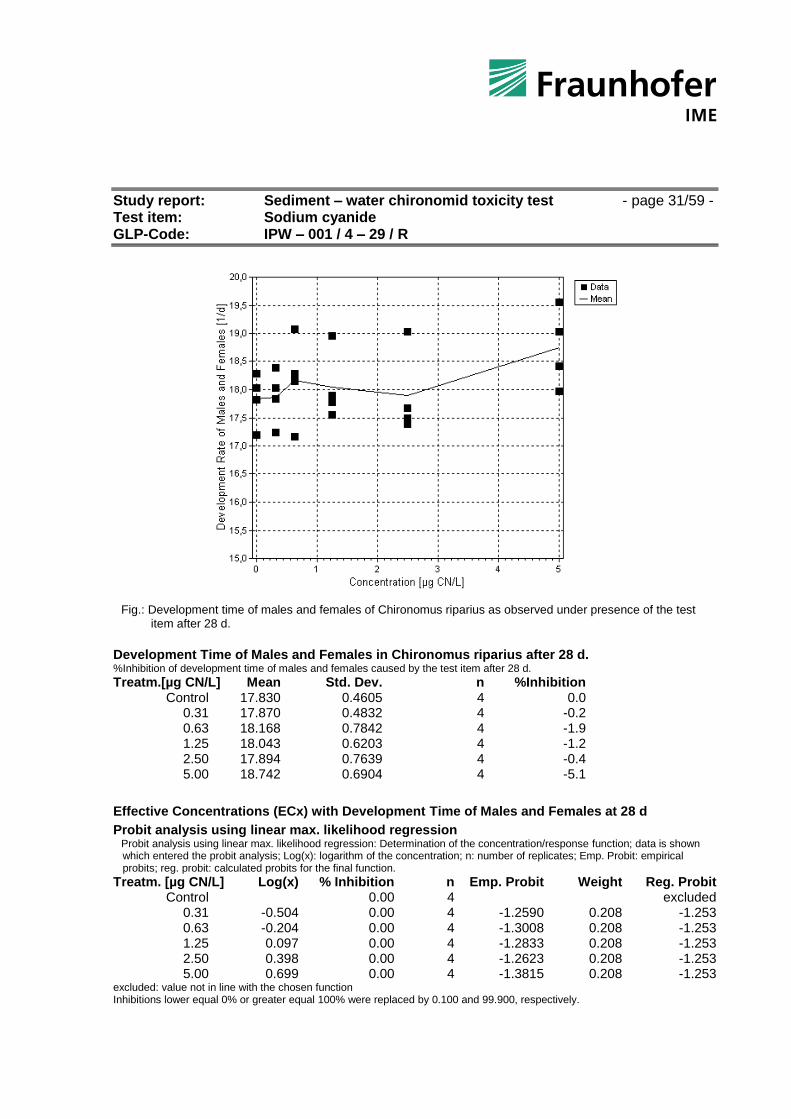
Fig.: Concentration-effect curve showing the influence of the test item on development time of males
and females of the introduced Chironomus riparius as observed after 28 d.
Threshold Concentrations (NOEC) with Development Time of Males and Females at 28 d
Shapiro-Wilk´s Test on Normal Distribution Normality check was passed (p > 0.05). Levene´s test is chosen for variance homogeneity testing. Levene´s Test on Variance Homogeneity (with Residuals) Variance homogeneity check was passed. Normal distribution and variance homogeneity requirements are fulfilled. A parametric multiple test is advisable. Williams Multiple Sequential t-test Procedure
The NOEC appears to be higher than or equal 5.00 µg CN/L.
Study report: Sediment – water chironomid toxicity test - page 33/59 - Test item: Sodium cyanide GLP-Code: IPW – 001 / 4 – 29 / R
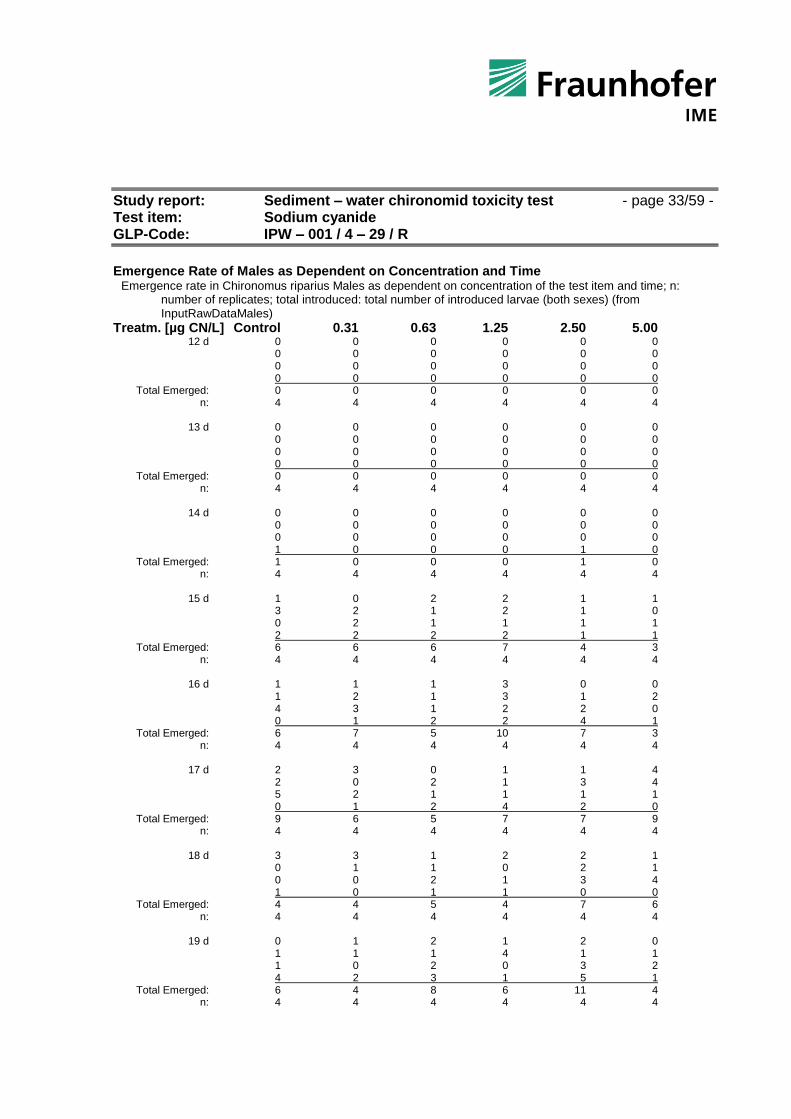
Emergence Rate of Males as Dependent on Concentration and Time
Emergence rate in Chironomus riparius Males as dependent on concentration of the test item and time; n: number of replicates; total introduced: total number of introduced larvae (both sexes) (from InputRawDataMales)
Treatm. [µg CN/L] Control 0.31 0.63 1.25 2.50 5.00 12 d 0 0 0 0 0 0 0 0 0 0 0 0 0 0 0 0 0 0 0 0 0 0 0 0 Total Emerged: 0 0 0 0 0 0 n: 4 4 4 4 4 4 13 d 0 0 0 0 0 0 0 0 0 0 0 0 0 0 0 0 0 0 0 0 0 0 0 0 Total Emerged: 0 0 0 0 0 0 n: 4 4 4 4 4 4 14 d 0 0 0 0 0 0 0 0 0 0 0 0 0 0 0 0 0 0 1 0 0 0 1 0 Total Emerged: 1 0 0 0 1 0 n: 4 4 4 4 4 4 15 d 1 0 2 2 1 1 3 2 1 2 1 0 0 2 1 1 1 1 2 2 2 2 1 1 Total Emerged: 6 6 6 7 4 3 n: 4 4 4 4 4 4 16 d 1 1 1 3 0 0 1 2 1 3 1 2 4 3 1 2 2 0 0 1 2 2 4 1 Total Emerged: 6 7 5 10 7 3 n: 4 4 4 4 4 4 17 d 2 3 0 1 1 4 2 0 2 1 3 4 5 2 1 1 1 1 0 1 2 4 2 0 Total Emerged: 9 6 5 7 7 9 n: 4 4 4 4 4 4 18 d 3 3 1 2 2 1 0 1 1 0 2 1 0 0 2 1 3 4 1 0 1 1 0 0 Total Emerged: 4 4 5 4 7 6 n: 4 4 4 4 4 4 19 d 0 1 2 1 2 0 1 1 1 4 1 1 1 0 2 0 3 2 4 2 3 1 5 1 Total Emerged: 6 4 8 6 11 4 n: 4 4 4 4 4 4
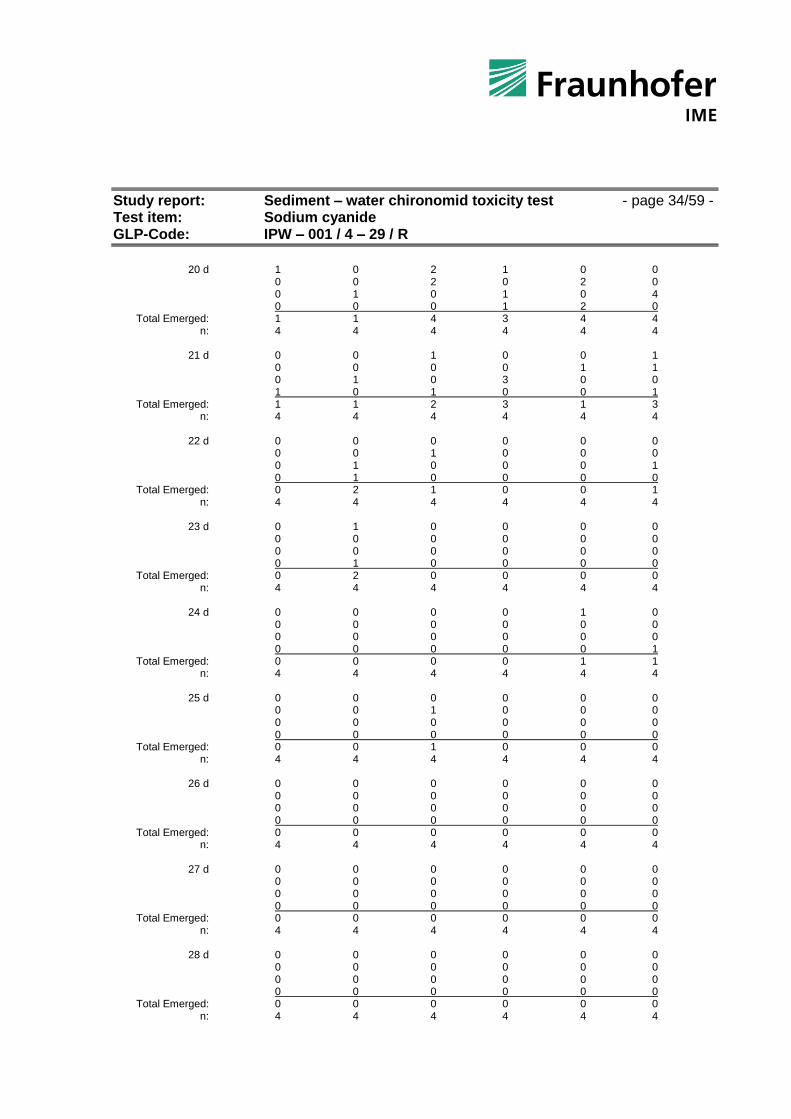
Study report: Sediment – water chironomid toxicity test - page 34/59 - Test item: Sodium cyanide GLP-Code: IPW – 001 / 4 – 29 / R
20 d 1 0 2 1 0 0 0 0 2 0 2 0 0 1 0 1 0 4 0 0 0 1 2 0 Total Emerged: 1 1 4 3 4 4 n: 4 4 4 4 4 4 21 d 0 0 1 0 0 1 0 0 0 0 1 1 0 1 0 3 0 0 1 0 1 0 0 1 Total Emerged: 1 1 2 3 1 3 n: 4 4 4 4 4 4 22 d 0 0 0 0 0 0 0 0 1 0 0 0 0 1 0 0 0 1 0 1 0 0 0 0 Total Emerged: 0 2 1 0 0 1 n: 4 4 4 4 4 4 23 d 0 1 0 0 0 0 0 0 0 0 0 0 0 0 0 0 0 0 0 1 0 0 0 0 Total Emerged: 0 2 0 0 0 0 n: 4 4 4 4 4 4 24 d 0 0 0 0 1 0 0 0 0 0 0 0 0 0 0 0 0 0 0 0 0 0 0 1 Total Emerged: 0 0 0 0 1 1 n: 4 4 4 4 4 4 25 d 0 0 0 0 0 0 0 0 1 0 0 0 0 0 0 0 0 0 0 0 0 0 0 0 Total Emerged: 0 0 1 0 0 0 n: 4 4 4 4 4 4 26 d 0 0 0 0 0 0 0 0 0 0 0 0 0 0 0 0 0 0 0 0 0 0 0 0 Total Emerged: 0 0 0 0 0 0 n: 4 4 4 4 4 4 27 d 0 0 0 0 0 0 0 0 0 0 0 0 0 0 0 0 0 0 0 0 0 0 0 0 Total Emerged: 0 0 0 0 0 0 n: 4 4 4 4 4 4 28 d 0 0 0 0 0 0 0 0 0 0 0 0 0 0 0 0 0 0 0 0 0 0 0 0 Total Emerged: 0 0 0 0 0 0 n: 4 4 4 4 4 4
Study report: Sediment – water chironomid toxicity test - page 35/59 - Test item: Sodium cyanide GLP-Code: IPW – 001 / 4 – 29 / R
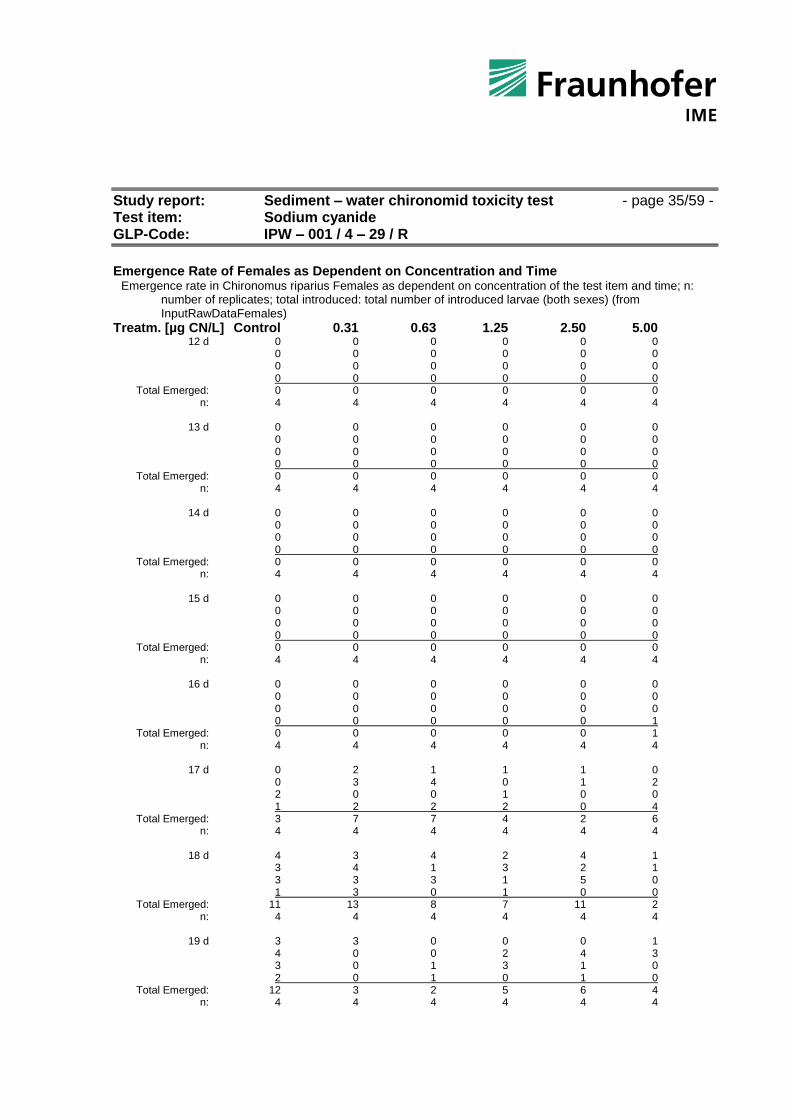
Emergence Rate of Females as Dependent on Concentration and Time
Emergence rate in Chironomus riparius Females as dependent on concentration of the test item and time; n: number of replicates; total introduced: total number of introduced larvae (both sexes) (from InputRawDataFemales)
Treatm. [µg CN/L] Control 0.31 0.63 1.25 2.50 5.00 12 d 0 0 0 0 0 0 0 0 0 0 0 0 0 0 0 0 0 0 0 0 0 0 0 0 Total Emerged: 0 0 0 0 0 0 n: 4 4 4 4 4 4 13 d 0 0 0 0 0 0 0 0 0 0 0 0 0 0 0 0 0 0 0 0 0 0 0 0 Total Emerged: 0 0 0 0 0 0 n: 4 4 4 4 4 4 14 d 0 0 0 0 0 0 0 0 0 0 0 0 0 0 0 0 0 0 0 0 0 0 0 0 Total Emerged: 0 0 0 0 0 0 n: 4 4 4 4 4 4 15 d 0 0 0 0 0 0 0 0 0 0 0 0 0 0 0 0 0 0 0 0 0 0 0 0 Total Emerged: 0 0 0 0 0 0 n: 4 4 4 4 4 4 16 d 0 0 0 0 0 0 0 0 0 0 0 0 0 0 0 0 0 0 0 0 0 0 0 1 Total Emerged: 0 0 0 0 0 1 n: 4 4 4 4 4 4 17 d 0 2 1 1 1 0 0 3 4 0 1 2 2 0 0 1 0 0 1 2 2 2 0 4 Total Emerged: 3 7 7 4 2 6 n: 4 4 4 4 4 4 18 d 4 3 4 2 4 1 3 4 1 3 2 1 3 3 3 1 5 0 1 3 0 1 0 0 Total Emerged: 11 13 8 7 11 2 n: 4 4 4 4 4 4 19 d 3 3 0 0 0 1 4 0 0 2 4 3 3 0 1 3 1 0 2 0 1 0 1 0 Total Emerged: 12 3 2 5 6 4 n: 4 4 4 4 4 4

Study report: Sediment – water chironomid toxicity test - page 36/59 - Test item: Sodium cyanide GLP-Code: IPW – 001 / 4 – 29 / R
20 d 1 0 0 1 3 4 3 0 1 0 0 1 1 1 1 1 0 0 2 1 1 0 0 0 Total Emerged: 7 2 3 2 3 5 n: 4 4 4 4 4 4 21 d 2 0 3 2 1 2 1 0 0 1 0 2 1 1 3 1 0 1 1 1 0 2 0 0 Total Emerged: 5 2 6 6 1 5 n: 4 4 4 4 4 4 22 d 1 2 0 2 1 2 0 2 1 1 0 1 0 1 0 2 1 2 1 0 0 2 0 0 Total Emerged: 2 5 1 7 2 5 n: 4 4 4 4 4 4 23 d 0 0 1 0 0 2 1 0 0 0 0 0 0 0 2 1 0 4 1 0 0 0 1 0 Total Emerged: 2 0 3 1 1 6 n: 4 4 4 4 4 4 24 d 0 0 0 0 1 0 0 0 0 0 0 0 0 2 2 1 0 0 0 0 0 0 0 2 Total Emerged: 0 2 2 1 1 2 n: 4 4 4 4 4 4 25 d 0 0 0 0 1 0 0 0 0 1 0 0 0 0 0 0 0 0 0 0 0 0 0 0 Total Emerged: 0 0 0 1 1 0 n: 4 4 4 4 4 4 26 d 0 0 0 0 0 0 0 0 0 0 0 0 0 0 0 0 0 0 0 0 0 0 0 0 Total Emerged: 0 0 0 0 0 0 n: 4 4 4 4 4 4 27 d 0 0 0 0 0 0 0 0 0 0 0 0 0 0 0 0 0 0 0 0 0 0 0 0 Total Emerged: 0 0 0 0 0 0 n: 4 4 4 4 4 4 28 d 0 0 0 0 0 0 0 0 0 0 0 0 0 0 0 0 0 0 0 0 0 0 0 0 Total Emerged: 0 0 0 0 0 0 n: 4 4 4 4 4 4

Study report: Sediment – water chironomid toxicity test - page 37/59 - Test item: Sodium cyanide GLP-Code: IPW – 001 / 4 – 29 / R
Sex Ratio at Study Termination Chi² rx2-Contingency Table
Chi²-Contingency test to investigate the relationship between treatment and sex ratio (alpha is 0.05; one-sided greater); Ho (no changes in sex ratio) is accepted, if the probability p > Alpha.
Treatm.[µg CN/L] Emerged Males Females Control 76 34 42 0.31 67 33 34 0.63 69 37 32 1.25 74 40 34 2.50 71 43 28 5.00 70 34 36 Chi² = 4.411; df = 5; significance: p(Chi²) = 0.492. Because p(Chi²) > Alpha, there is no significant effect.
Study report: Sediment – water chironomid toxicity test - page 38/59 - Test item: Sodium cyanide GLP-Code: IPW – 001 / 4 – 29 / R
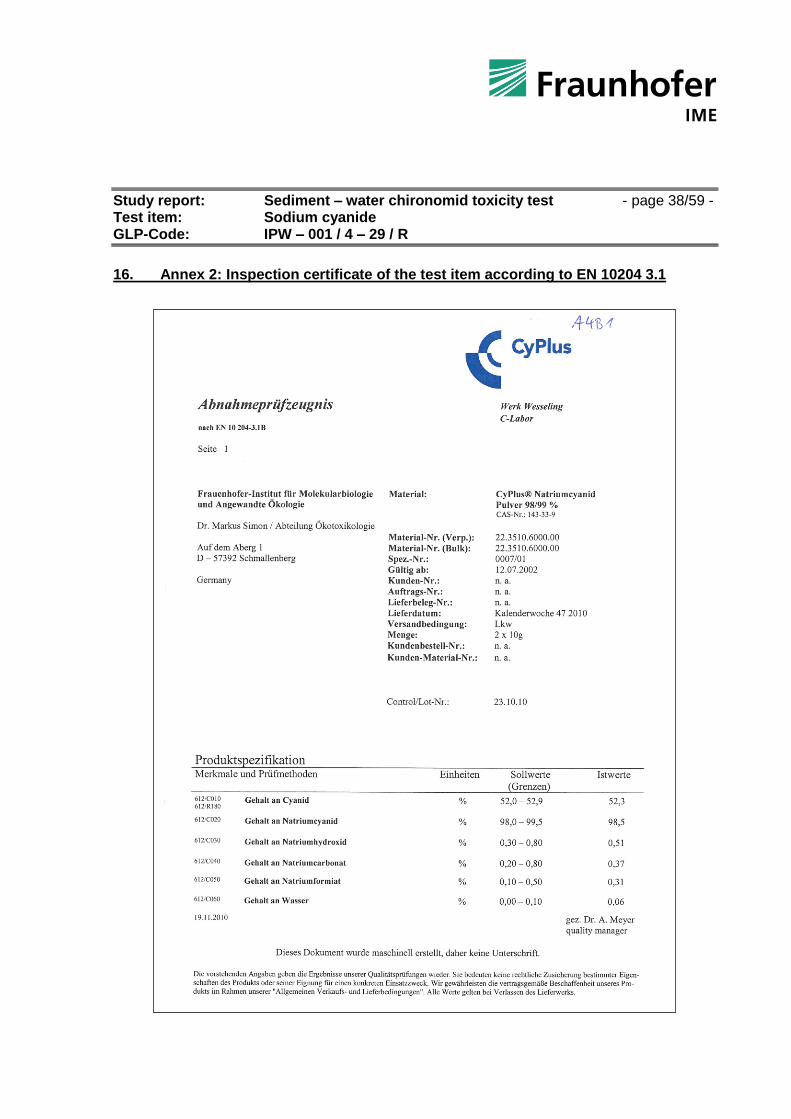
16. Annex 2: Inspection certificate of the test item according to EN 10204 3.1

Study report: Sediment – water chironomid toxicity test - page 39/59 - Test item: Sodium cyanide GLP-Code: IPW – 001 / 4 – 29 / R
17. Annex 3: GLP certificate
Study report: Sediment – water chironomid toxicity test - page 40/59 - Test item: Sodium cyanide GLP-Code: IPW – 001 / 4 – 29 / R
Study report: Sediment – water chironomid toxicity test - page 41/59 - Test item: Sodium cyanide GLP-Code: IPW – 001 / 4 – 29 / R
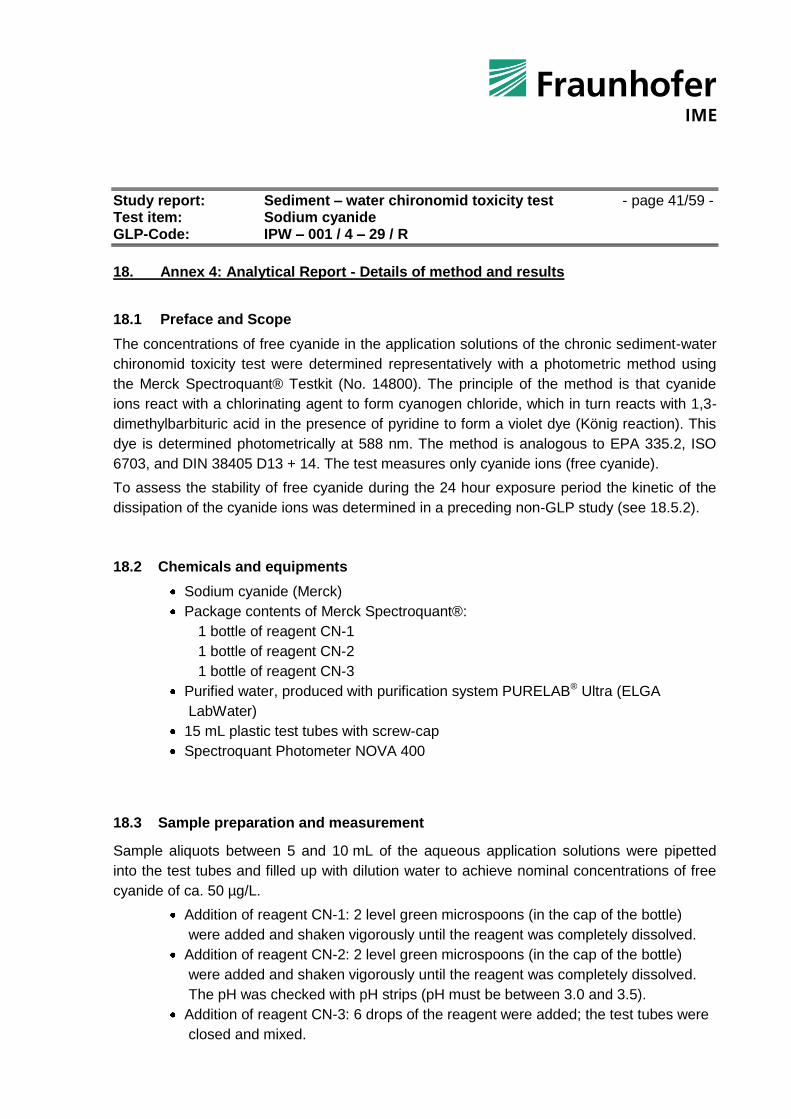
18. Annex 4: Analytical Report - Details of method and results
18.1 Preface and Scope
The concentrations of free cyanide in the application solutions of the chronic sediment-water
chironomid toxicity test were determined representatively with a photometric method using
the Merck Spectroquant® Testkit (No. 14800). The principle of the method is that cyanide
ions react with a chlorinating agent to form cyanogen chloride, which in turn reacts with 1,3-
dimethylbarbituric acid in the presence of pyridine to form a violet dye (König reaction). This
dye is determined photometrically at 588 nm. The method is analogous to EPA 335.2, ISO
6703, and DIN 38405 D13 + 14. The test measures only cyanide ions (free cyanide).
To assess the stability of free cyanide during the 24 hour exposure period the kinetic of the
dissipation of the cyanide ions was determined in a preceding non-GLP study (see 18.5.2).
18.2 Chemicals and equipments
Sodium cyanide (Merck)
Package contents of Merck Spectroquant®:
1 bottle of reagent CN-1
1 bottle of reagent CN-2
1 bottle of reagent CN-3
Purified water, produced with purification system PURELAB® Ultra (ELGA
LabWater)
15 mL plastic test tubes with screw-cap
Spectroquant Photometer NOVA 400
18.3 Sample preparation and measurement
Sample aliquots between 5 and 10 mL of the aqueous application solutions were pipetted
into the test tubes and filled up with dilution water to achieve nominal concentrations of free
cyanide of ca. 50 µg/L.
Addition of reagent CN-1: 2 level green microspoons (in the cap of the bottle)
were added and shaken vigorously until the reagent was completely dissolved.
Addition of reagent CN-2: 2 level green microspoons (in the cap of the bottle)
were added and shaken vigorously until the reagent was completely dissolved.
The pH was checked with pH strips (pH must be between 3.0 and 3.5).
Addition of reagent CN-3: 6 drops of the reagent were added; the test tubes were
closed and mixed.
Study report: Sediment – water chironomid toxicity test - page 42/59 - Test item: Sodium cyanide GLP-Code: IPW – 001 / 4 – 29 / R
The tubes were left to stand for 5 minutes (reaction time). Then the measurement sample
was filled into the cuvette and the absorbance was measured in the photometer at 588 nm.
Dilution water was used for zero position.
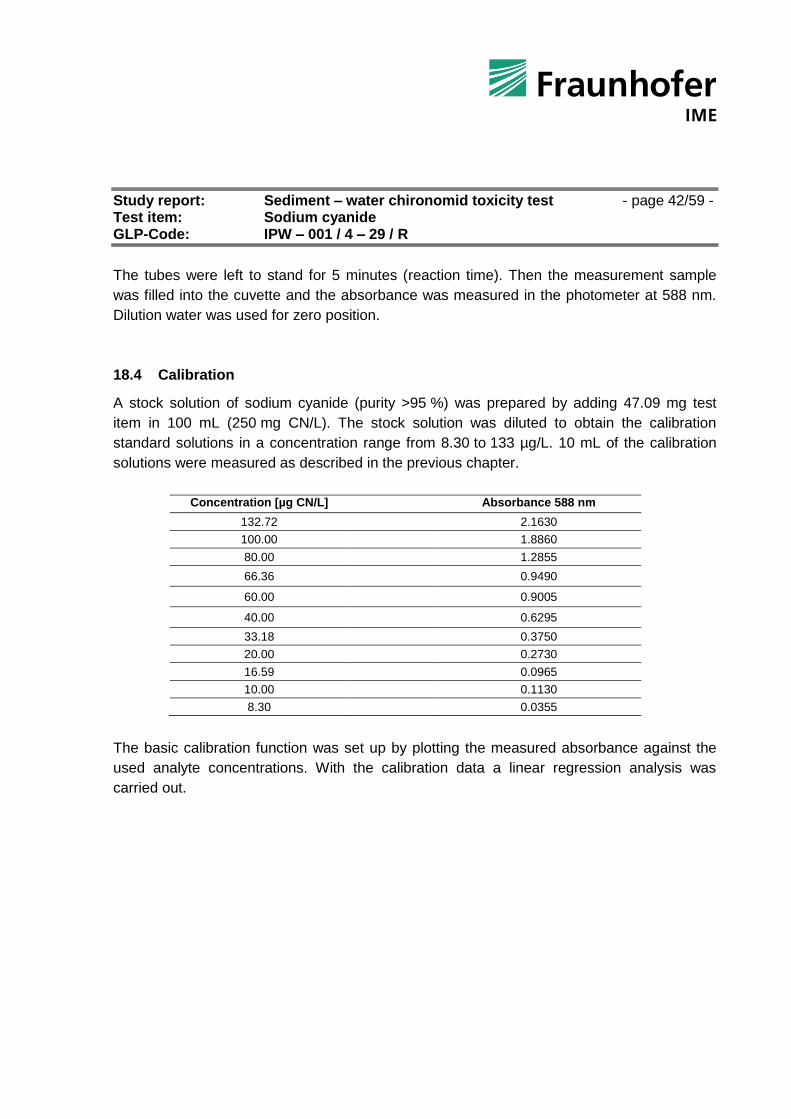
18.4 Calibration
A stock solution of sodium cyanide (purity >95 %) was prepared by adding 47.09 mg test
item in 100 mL (250 mg CN/L). The stock solution was diluted to obtain the calibration
standard solutions in a concentration range from 8.30 to 133 µg/L. 10 mL of the calibration
solutions were measured as described in the previous chapter.
Concentration [µg CN/L] Absorbance 588 nm
132.72 2.1630
100.00 1.8860
80.00 1.2855
66.36 0.9490
60.00 0.9005
40.00 0.6295
33.18 0.3750
20.00 0.2730
16.59 0.0965
10.00 0.1130
8.30 0.0355
The basic calibration function was set up by plotting the measured absorbance against the
used analyte concentrations. With the calibration data a linear regression analysis was
carried out.
Study report: Sediment – water chironomid toxicity test - page 43/59 - Test item: Sodium cyanide GLP-Code: IPW – 001 / 4 – 29 / R
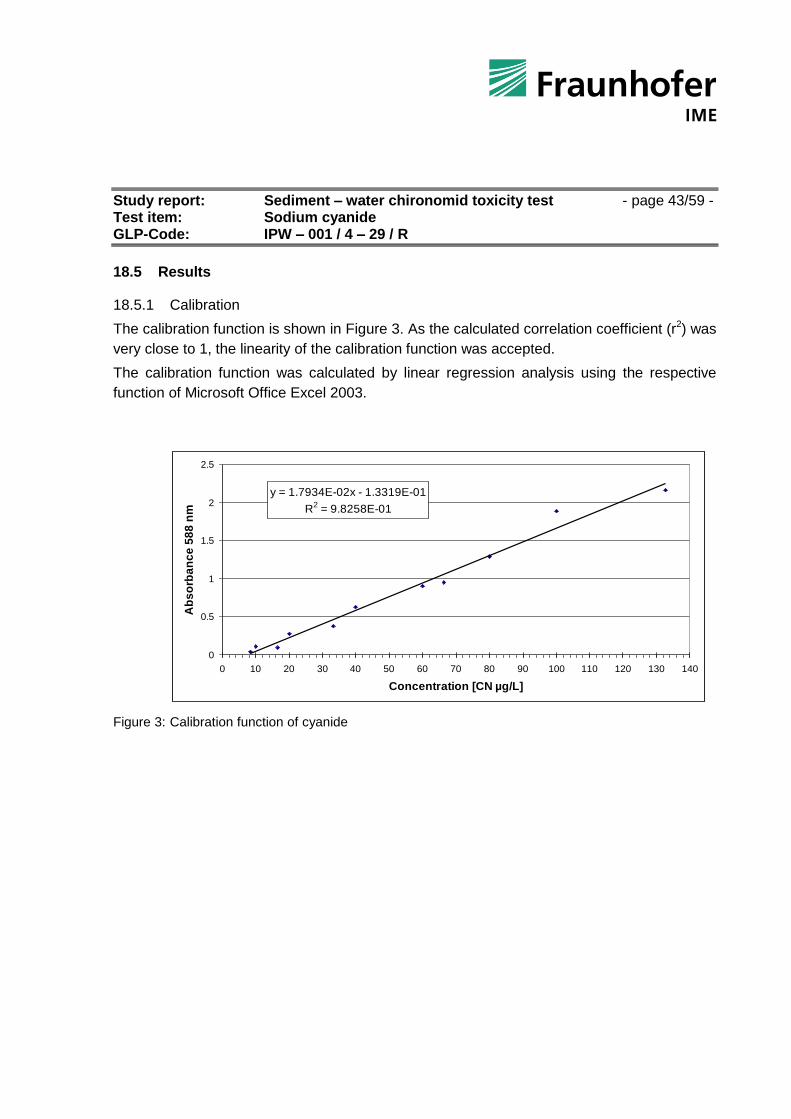
18.5 Results
18.5.1 Calibration
The calibration function is shown in Figure 3. As the calculated correlation coefficient (r2) was
very close to 1, the linearity of the calibration function was accepted.
The calibration function was calculated by linear regression analysis using the respective
function of Microsoft Office Excel 2003.
Figure 3: Calibration function of cyanide
y = 1.7934E-02x - 1.3319E-01
R2 = 9.8258E-01
0
0.5
1
1.5
2
2.5
0 10 20 30 40 50 60 70 80 90 100 110 120 130 140
Concentration [CN µg/L]
Ab
so
rba
nc
e 5
88
nm

Study report: Sediment – water chironomid toxicity test - page 44/59 - Test item: Sodium cyanide GLP-Code: IPW – 001 / 4 – 29 / R
18.5.2 Results of the analysed application solutions
Based on the calibration function the concentration was calculated using the equation
x=(y+0.13319)/0.017411. The results of the analysed application solutions are listed in Table
9 (start of exposure interval) and Table 1(TWA values, main report).
Table 9: Analysed concentrations [µg CN-/L] and recovery rates [% of nominal] of free cyanide in
representative application solutions.
DF = Dilution factor of the measurement sample LOQ = 7.4 µg CN
-/L
# Values in brackets represent the theoretical concentrations in the test vessels
Nominal concentration
Absorbance Conc. in sample
Final concentration (Blank corrected)
% of nominal
[µg CN-/L] Extinction [µg CN
-/L] DF [µg CN
-/L] [µg CN
-/L] (#) [%]
Day 0
1000 1.024 64.52 16 1032.40 1023.8 (5.12) 102.4 500 1.043 65.58 8 524.67 516.1 (2.58) 103.2 250 1.016 64.08 4 256.32 247.7 (1.24) 99.1 125 0.992 62.74 2 125.48 116.9 (0.58) 93.5 62.5 1.051 66.03 1 66.03 57.4 (0.29) 91.9 Blank 0.021 8.60 1 8.60 Day 7
1000 0.901 57.67 16 922.66 915.5 (4.58) 91.6 500 0.917 58.56 8 468.47 460.8 (2.30) 92.2 250 0.929 59.23 4 236.91 229.3 (1.15) 91.7 125 0.932 59.40 2 118.79 111.1 (0.56) 88.9 62.5 1.016 64.08 1 64.08 56.4 (0.28) 90.3 Blank 0.004 7.65 1 7.65 Day 14
1000 1.013 63.91 16 1022.59 1014.7 (5.07) 101.5 500 1.016 64.08 8 512.63 505.5 (2.53) 101.1 250 1.029 64.80 4 259.21 252.1 (1.26) 100.8 125 1.013 63.91 2 127.82 120.7 (0.60) 96.5 62.5 1.018 64.19 1 64.19 57.0 (0.29) 91.3 Blank -0.005 7.15 1 7.15 Day 27
1000 0.976 61.85 16 989.58 981.7 (4.91) 98.2 500 1.060 66.53 8 532.26 524.3 (2.62) 104.9 250 1.060 66.53 4 266.13 258.1 (1.29) 103.3 125 1.009 63.69 2 127.38 119.4 (0.60) 95.5 62.5 1.011 63.80 1 63.80 55.8 (0.28) 89.3 Blank 0.008 7.98 1 7.98
To ensure measured values for the start concentrations of all five treatments, at test start the
200fold concentrated application solutions were measured. For calculation of the theoretic
concentrations in the test vessels right after daily spiking, the results were divided by a factor
of 200. With recovery rates of 89 – 105 % of nominal, it was shown that chironomid larvae
were exposed at date of application with the aspired concentrations.
Study report: Sediment – water chironomid toxicity test - page 45/59 - Test item: Sodium cyanide GLP-Code: IPW – 001 / 4 – 29 / R
18.6 Cyanide quantification using ion chromatrography (non-GLP)
It was intended to quantify the concentrations of free cyanide in the test solutions of the
chronic sediment-water chironomid toxicity test by ion chromatography after sample
preparation due to the low test concentrations. The principle of the preparation method is that
cyanide is evaporated as HCN at acid pH and trapped in a small volume of NaOH. This
results in a concentration of the cyanide.
However, it was not possible to apply this preparation method to the samples due to
technical reasons. Details about the problems are presented in the following (18.6.8).
Samples were also directly used for an analytical determination (without sample clean-up
including distillation) at single days, but no results could be obtained due to the consistency
of the samples. However, results of a kinetic study conducted before the chronic chironomid
test (18.6.6) and results of one sampling date right after spiking (18.6.7) showed – after
background correction – that the concentrations in the overlying water right after spiking was
in the range of nominal concentrations. In the following, method, validation and results of the
non-GLP measurements are presented.
18.6.1 Chemicals and equipment
Hydro chloride
Sodium hydroxide
Zn(II)sulphate heptahydrate
Cu(II)sulphate pentahydrate
Sn(II)chloride dihydrate
Buffer solution pH4 (Titrisol, Merck)
Silicon Antifoam Emulsion (Roth, Article no. 0865.1)
Boiling stones
Sodium EDTA
Purified water, produced with purification system PURELAB® Ultra (ELGA
LabWater)
Cucurbit (500 mL)
Reflux condenser with NaOH trap
Suction pump
pH meter
Ion chromatograph (Metrohm)

Study report: Sediment – water chironomid toxicity test - page 46/59 - Test item: Sodium cyanide GLP-Code: IPW – 001 / 4 – 29 / R
18.6.2 Sample preparation
Sample preparation was done following ISO/DIS 11262:2010. Sample aliquots of 200 mL of
the aqueous test medium are adjusted to pH 8.0 (± 0.2) using diluted hydro chloride or
sodium hydroxide. The volume of the titration solutions is considered. Some drops antifoam
emulsion was added and the solution was shaken. 10 mL Zn(II)sulphate (100 g/L) and 50 mL
double concentrated pH buffer (pH 4) were added. After an equilibration phase of 1 h, the
solution is distilled with reflux for 1 h.
For sediment samples, 25, 15, and 5 g sediment were filled up with 100 mL purified water.
Subsequently, proceeding follows the approach mentioned for aqueous samples.
The NaOH trap solution was diluted 1:2 (necessary due to technical reasons) and analyzed
by ion chromatography (results 18.6.8).
Additionally, some aliquots of the aqueous test medium were measured directly by ion
chromatography without sample preparation (results 18.6.6 and 18.6.7).
18.6.3 Ion chromatography measurement
The determination of cyanide was carried out by Ion chromatography; the measurement
conditions and instrument settings are listed below.
Ion chromatography system
Ion chromatography system: Metrohm
Detector: 791 VA Detector
Column: Metrosep A Supp 1 (7.0 µm), 250 mm x 4.6 mm
Column temperature: 20 °C
Injection volume: 20 µL loop
Flow rate: 1 mL/min
Pressure: 6.9 MPa
Eluent: 0.1 M NaOH; 10 % Acetone
Retention time: 3.9 – 4.3 min
18.6.4 Calibration
Seven 'calibration standards' were prepared in purified water in volumetric flasks in the
concentration range from 2 to 30 µg/L. The calibration solutions were measured as described
in the previous chapters.
The calibration solutions were measured by ion chromatography according to the instructions
given in analytical guidance. The basic calibration function was set up by plotting the
calculated peak height ratio against the used analyte concentrations. With the calibration
data a linear regression analysis was carried out.

Study report: Sediment – water chironomid toxicity test - page 47/59 - Test item: Sodium cyanide GLP-Code: IPW – 001 / 4 – 29 / R
The quantification data were generated by processing (integration) the chromatographic raw
data and by subsequent calculation of the quantification results using the basic calibration
function.
The calibration function used for quantification of the test samples is shown in Figure 4. The
calibration function was calculated by linear regression analysis to:
X = 1.55649 * (cCal), r = 0.998
X = Cyanide concentration in sample
cCal = Analyte concentration of the calibration solutions
Figure 4: Basic calibration function of cyanide

Study report: Sediment – water chironomid toxicity test - page 48/59 - Test item: Sodium cyanide GLP-Code: IPW – 001 / 4 – 29 / R
18.6.5 Validation
The validation of the analytical method was performed following DIN 32645 (1994) “German
standard method for estimation of limits of detection and determination”.
Correlation coefficient: 0.9992
LOD (95 % CL) 1.25 µg/L
LOQ (95 % CL) 4.60 µg/L
Linearity range: (analyte solution for measurement) 2 to 30 µg/L
18.6.6 Stability of free cyanide during the exposure – non-GLP pre-test
5.31 µg CN/L were incubated under test condition (1 L overlaying water on sediment,
aeration). The concentrations of free cyanide were analysed via ion chromatography
immediately after test media preparation (0 h), after 1.5, 3, 4.5, 6, and 22 hours without
sample preparation. The measured values (corrected for background value) and the
calculations of the elimination rates are summarised in the tables below. For background
correction the result of the control sample of day 14 was applied (see 18.6.7).
Table 10: Calculation of elimination rate ke for 5.31 µg CN-/L
5.31 µg/L free cyanide nominal Calculated conc.
non-linear fit [µg CN
-/L]
Time h
Time d
Measured values* [µg CN
-/L]
Mean measured [µg CN
-/L]
Mean ln(y)
measured
0 0.0 4.32 4.32 1.46 4.376
1.5 0.063 3.54 3.54 1.26 3.807
3 0.135 3.80 3.80 1.34 3.312
4.5 0.188 2.98 2.98 1.09 2.881
6 0.250 2.55** 2.55** 0.94 2.506
8.5 0.354 1.75** 1.75** 0.56 1.986
22 0.917 0.58** 0.58** -0.54 0.567
mean 2.79 0.84
* Values corrected for blank; ** Values < LOQ but > LOD before blank correction
Fit statistics: One compartment: ln-linear fit: c=c0 exp(-ke t)
Intercept: 1.476 slope ke :2.230 t time [d]
r²: 0.985 n: 7

Study report: Sediment – water chironomid toxicity test - page 49/59 - Test item: Sodium cyanide GLP-Code: IPW – 001 / 4 – 29 / R
Figure 5: Dissipation of cyanide during 22 hour in medium with 5.31 µg CN-/L
It can be seen, that 1st order equations show a good fit (r² 0.985). Therefore, a simple
geometric mean calculation can be applied to the results. The results correspond to kinetics
obtained for cyanide in aqueous media in other studies (Simon, M. 2011; see refereces).
It can be seen that the measured concentrations in the aged test media of all test
concentrations in the chronic chironomid test would be lower than the LOQ for the
photometric method.
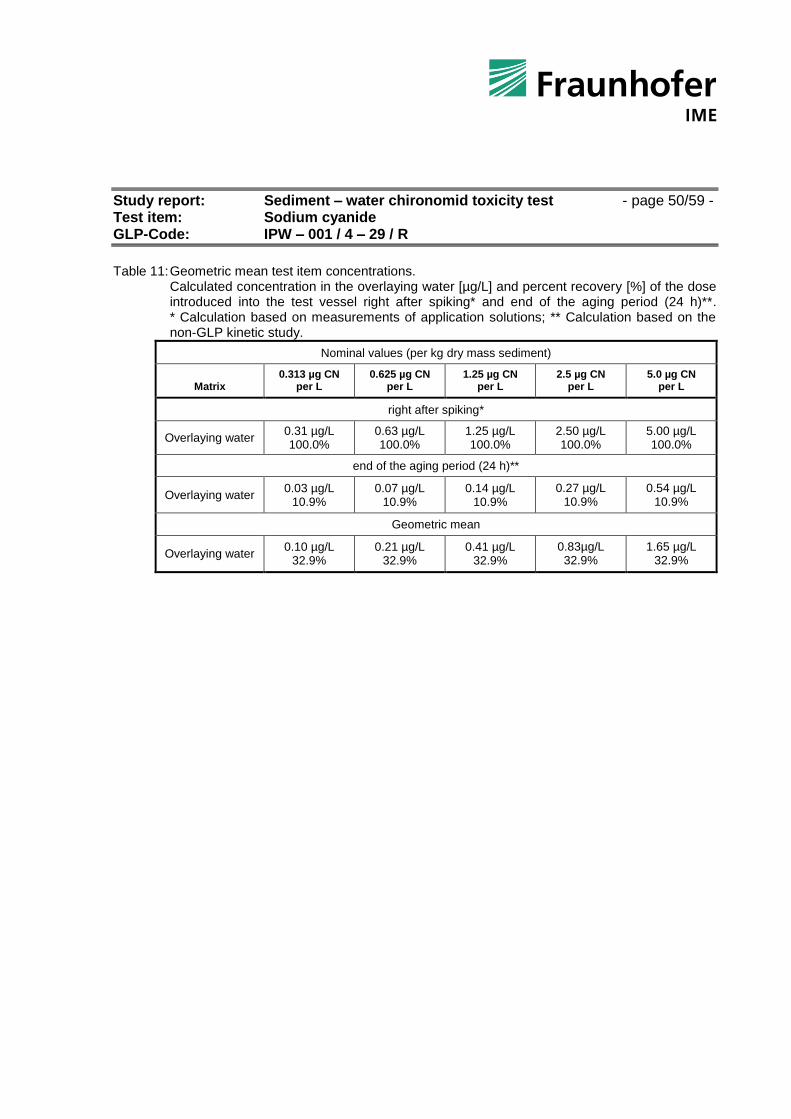
According to the OECD Guidance Document for difficult substances, for concentrations
<LOQ (7.4 µg CN-/L) the half LOQ (3.7 µg CN-/L) should be applied for the calculation of the
TWA measured concentration. However, due to test item concentrations below the LOQ in all
test media of the chronic main test - also in all fresh test media -, theoretical geometric mean
concentrations could be calculated on the basis of the nominal concentrations and 10.9 %
recovery after 24 h, resulting in a geometric mean recovery of 32.9 % of nominal.
Study report: Sediment – water chironomid toxicity test - page 50/59 - Test item: Sodium cyanide GLP-Code: IPW – 001 / 4 – 29 / R
Table 11: Geometric mean test item concentrations. Calculated concentration in the overlaying water [µg/L] and percent recovery [%] of the dose
introduced into the test vessel right after spiking* and end of the aging period (24 h)**. * Calculation based on measurements of application solutions; ** Calculation based on the non-GLP kinetic study.
Nominal values (per kg dry mass sediment)
Matrix 0.313 µg CN
per L 0.625 µg CN
per L 1.25 µg CN
per L 2.5 µg CN
per L 5.0 µg CN
per L
right after spiking*
Overlaying water 0.31 µg/L 100.0%
0.63 µg/L 100.0%
1.25 µg/L 100.0%
2.50 µg/L 100.0%
5.00 µg/L 100.0%
end of the aging period (24 h)**
Overlaying water 0.03 µg/L
10.9%
0.07 µg/L 10.9%
0.14 µg/L 10.9%
0.27 µg/L 10.9%
0.54 µg/L 10.9%
Geometric mean
Overlaying water 0.10 µg/L
32.9%
0.21 µg/L 32.9%
0.41 µg/L 32.9%
0.83µg/L 32.9%
1.65 µg/L 32.9%
Study report: Sediment – water chironomid toxicity test - page 51/59 - Test item: Sodium cyanide GLP-Code: IPW – 001 / 4 – 29 / R
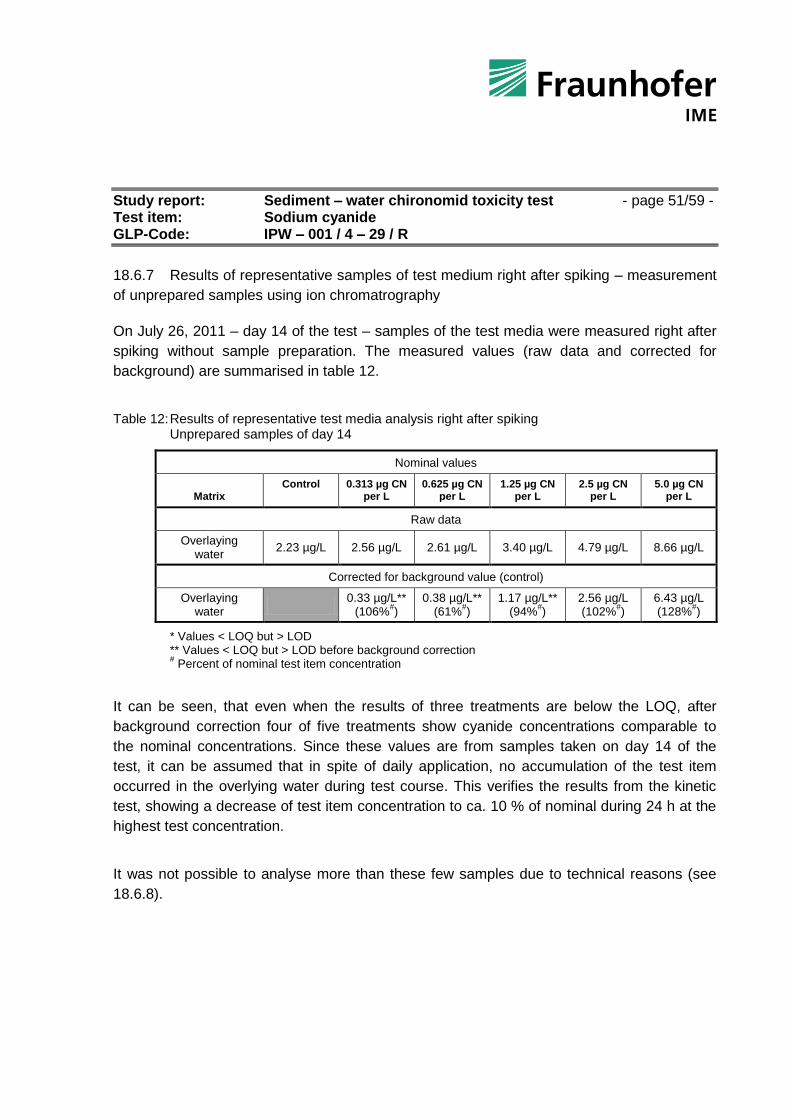
18.6.7 Results of representative samples of test medium right after spiking – measurement
of unprepared samples using ion chromatrography
On July 26, 2011 – day 14 of the test – samples of the test media were measured right after
spiking without sample preparation. The measured values (raw data and corrected for
background) are summarised in table 12.
Table 12: Results of representative test media analysis right after spiking Unprepared samples of day 14
Nominal values
Matrix Control 0.313 µg CN
per L 0.625 µg CN
per L 1.25 µg CN
per L 2.5 µg CN
per L 5.0 µg CN
per L
Raw data
Overlaying water
2.23 µg/L 2.56 µg/L 2.61 µg/L 3.40 µg/L 4.79 µg/L 8.66 µg/L
Corrected for background value (control)
Overlaying water
0.33 µg/L**
(106%#)
0.38 µg/L** (61%
#)
1.17 µg/L** (94%
#)
2.56 µg/L (102%
#)
6.43 µg/L (128%
#)
* Values < LOQ but > LOD ** Values < LOQ but > LOD before background correction # Percent of nominal test item concentration
It can be seen, that even when the results of three treatments are below the LOQ, after
background correction four of five treatments show cyanide concentrations comparable to
the nominal concentrations. Since these values are from samples taken on day 14 of the
test, it can be assumed that in spite of daily application, no accumulation of the test item
occurred in the overlying water during test course. This verifies the results from the kinetic
test, showing a decrease of test item concentration to ca. 10 % of nominal during 24 h at the
highest test concentration.
It was not possible to analyse more than these few samples due to technical reasons (see
18.6.8).

Study report: Sediment – water chironomid toxicity test - page 52/59 - Test item: Sodium cyanide GLP-Code: IPW – 001 / 4 – 29 / R
18.6.8 Measurement of prepared samples
Overlying water samples
It was already seen for the unprepared samples that background peaks at the same retention
time as for cyanide occurred in the ion chromatogram (Figure 13). However, in prepared
samples much higher background peaks at the same retention time were obtained (Figure
14). Modifications of the analytical method (including a second column) leaded did not lead
to a reduction of the background peaks and sufficient valid results.
According to the supplier of the columns, carbonate is detected at the same retention time
under the conditions applied for the analytical method. This may explain why no background
was found for the calibration solutions (prepared in purified water) but for the overlying water
samples of the biological test. As test water, copper free tap water is used which is generally
passed through a limestone column to increase hardness of the water. Using this procedure
a total hardness of about 1.0 mmol/L CaCO3 equivalents can be achieved, which is – e.g. for
Daphnia tests – necessary to provide adequate water quality for the test specimens.
Additionally, sodium carbonate is used for pH adjustment of the artificial sediment (see 9.2).
This content of carbonate results in a background value already in an unprepared sample.
The method of concentrating cyanide in a NaOH trap results unintentionally also in a
concentration of CO32- in this trap, which consequently results in an increased background
peak in the measurement. Therefore, the preparation method using distillation and trapping
in NaOH is not suitable for test water of test systems using artificial sediment.
It was tried to quantify the cyanide concentration of the NaOH trap solution photometrically
with the Merck Spectroquant® test system. However, there were several technical problems
avoiding a successful measurement. I) It was not possible to adjust the pH of the solution
(originally ca. pH 12) via titration in a suitable time frame into a range of 4.5 – 8.0 without the
risk of cyanide loss. II) The concentration of NaCl, NaNO3 and Na2SO4 ions in the samples is
limited for this test system, which also limits the volume of usual acids for titration. III) A high
dilution due to titration counteracts the concentration step of distillation. Consequently, no
color reaction was achieved when directly analyzing the cyanide concentration in the trap
samples following the test procedure of the Merck Spectroquant® test system.
Sediment samples
It was intended to distill sediment samples to quantify the amount of adsorbed cyanide. The
method described in 18.6.2 is a standard method for soil samples. However, it was not
possible to distill the sediment with this method. Usually 25 g of soil is leached and boiled in
100 mL water and 50 mL pH buffer. Even after reducing the amount of sediment to 5 g in
150 mL solution, boiling retardation occurred in each sample boiled (although using boiling

Study report: Sediment – water chironomid toxicity test - page 53/59 - Test item: Sodium cyanide GLP-Code: IPW – 001 / 4 – 29 / R
stones and antifoam emulsion). The boiling retardation results in a flash over of the leachate
into the NaOH trap and therefore in a contamination of the trap solution. A possible reason
for the boiling retardation could be the kaolin in the artificial sediment. Therefore, the
preparation method using distillation and trapping in NaOH is not suitable for artificial
sediment.

Study report: Sediment – water chironomid toxicity test - page 54/59 - Test item: Sodium cyanide GLP-Code: IPW – 001 / 4 – 29 / R
18.6.9 Representative chromatograms
Typical ion chromatograms of standards, blanks, and test samples are shown in Figure 6 to
Figure 14. The retention times (tR) are approximately 3.9 - 4.3 min for cyanide.
Figure 6: Calibration solution level 1, cyanide conc.: 2 µg CN/L
Figure 7: Calibration solution level 7, cyanide conc.: 30 µg CN/L
0 1 2 3 4 5 6 7 min
2
4
6
8
10
mV
ch2
4.2
3
0 1 2 3 4 5 6 7 min
2
4
6
8
10
12
mV
ch2
4.2
7

Study report: Sediment – water chironomid toxicity test - page 55/59 - Test item: Sodium cyanide GLP-Code: IPW – 001 / 4 – 29 / R
Figure 8: Test sample kinetic test; nominal CN conc.: 5.31 µg/L; sampling time: 0 h
Aqueous sample without preparation
Figure 9: Test sample kinetic test; nominal CN conc.: 5.31 µg/L; sampling time: 6 h
Aqueous sample without preparation
0 1 2 3 4 5 6 7 min
2
4
6
8
10
12
mV
ch2
4.2
1
0 1 2 3 4 5 6 7 min
2
4
6
8
10
mV
ch2
4.2
0

Study report: Sediment – water chironomid toxicity test - page 56/59 - Test item: Sodium cyanide GLP-Code: IPW – 001 / 4 – 29 / R
Figure 10: Control sample; sampling time: day 14 (measured on July 26, 2011)
Aqueous sample without preparation
Figure 11: Test sample; nominal CN conc.: 2.5 µg/L; sampling time: day 14, right after spiking
Aqueous sample without preparation
0 1 2 3 4 min
2
4
6
8
mV
ch2
3.9
4
0 1 2 3 4 min
1
2
3
4
5
6
7
mV
ch2
3.9
5

Study report: Sediment – water chironomid toxicity test - page 57/59 - Test item: Sodium cyanide GLP-Code: IPW – 001 / 4 – 29 / R
Figure 12: Test sample; nominal CN conc.: 5.0 µg/L; sampling time: day 14, right after spiking
Aqueous sample without preparation
Figure 13: Copper free tap water
Aqueous sample without preparation
0 1 2 3 4 min
2
4
6
8
10
12
mV
ch2
3.9
5
0 1 2 3 4 min
2
4
6
8
mV
ch2
3.9
5

Study report: Sediment – water chironomid toxicity test - page 58/59 - Test item: Sodium cyanide GLP-Code: IPW – 001 / 4 – 29 / R
Figure 14: Control sample; sampling time: day 14 (measured on July 26, 2011) Diluted NaOH trap solution after preparation
Figure 15: Ultra pure water Aqueous sample without preparation
0 1 2 3 4 min
5
10
15
20
25
mV
ch24.0
0
0 1 2 3 4 min
5
10
15
mV
ch2
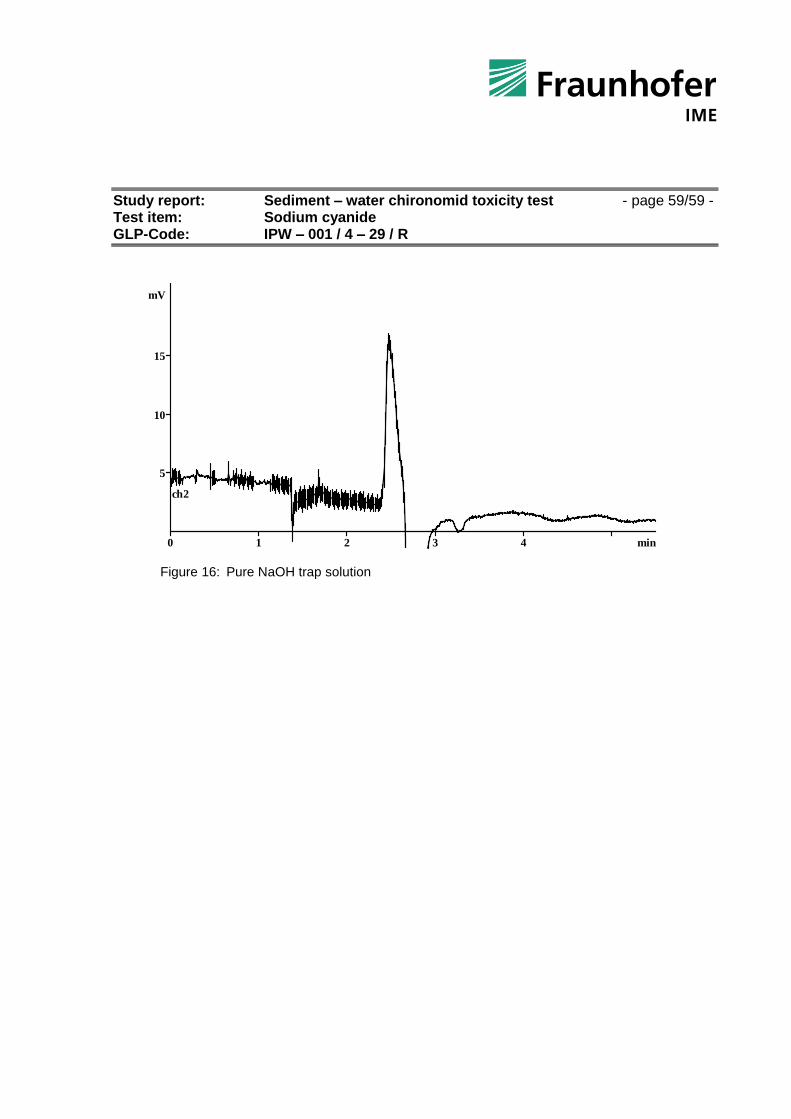
Study report: Sediment – water chironomid toxicity test - page 59/59 - Test item: Sodium cyanide GLP-Code: IPW – 001 / 4 – 29 / R
Figure 16: Pure NaOH trap solution
0 1 2 3 4 min
5
10
15
mV
ch2