Ecotoxicological Impact of Ferric Sulphate on Chironomid ...
GROWTH, SURVIVAL, AND COMMUNITY COMPOSITION OF
CHIRONOMIDAE (DIPTERA) LARVAE IN SELECTED ATHABASCA
OIL SANDS PROCESS-AFFECTED WETLAND WATERS OF NORTH-
EASTERN ALBERTA
By
Kaitlin D. Kennedy
A Thesis
Submitted to the Faculty of Graduate Studies
through the Department of Biological Sciences
in Partial Fulfillment of the Requirements for
the Degree of Master of Science
at the University of Windsor
Windsor, Ontario, Canada
2012
© 2012 Kaitlin D. Kennedy

Growth, survival, and community composition of Chironomidae (Diptera) larvae in
selected Athabasca oil sands process-affected wetland waters of north eastern Alberta
by
Kaitlin Kennedy
APPROVED BY:
______________________________________________
Carla M. Wytrykush
Syncrude Canada, Ltd.
______________________________________________
Dr. Edwin Tam
Department of Civil and Environmental Engineering
______________________________________________
Dr. Kenneth G. Drouillard
Great Lakes Institute for Environmental Research
______________________________________________
Dr. Jan J.H. Ciborowski, Advisor
Department of Biological Sciences
______________________________________________
Dr. Trevor E. Pitcher, Chair of Defense
Department of Biological Sciences
July 23, 2012

iii
DECLARATION OF ORIGINALITY
I hereby certify that I am the sole author of this thesis and that no part of this thesis has
been published or submitted for publication.
I certify that, to the best of my knowledge, my thesis does not infringe upon anyone’s
copyright nor violate any proprietary rights and that any ideas, techniques, quotations, or
any other material from the work of other people included in my thesis, published or
otherwise, are fully acknowledged in accordance with the standard referencing practices.
Furthermore, to the extent that I have included copyrighted material that surpasses the
bounds of fair dealing within the meaning of the Canada Copyright Act, I certify that I
have obtained a written permission from the copyright owner(s) to include such
material(s) in my thesis and have included copies of such copyright clearances to my
appendix.
I declare that this is a true copy of my thesis, including any final revisions, as approved
by my thesis committee and the Graduate Studies office, and that this thesis has not been
submitted for a higher degree to any other University or Institution.

iv
ABSTRACT
Oil sands process water (OSPW) is toxic to many aquatic organisms. The goal of
this study is to determine if or how midge (Diptera: Chironomidae) productivity and
community assemblages may differ between OSPW and reference wetlands and the
effects of OSPW wetland water, naphthenic acids (NA), and salts on chironomid growth
and survival. Although chironomids differed in size, abundance, and community
composition among wetlands, the differences were not attributable to the presence or
absence of OSPW. Community composition varied with respect to wetland-specific water
chemistry attributes (e.g., dissolved oxygen). Ten-d Chironomus riparius laboratory
bioassays indicated that larvae grew to a smaller size when exposed to OSPW wetland
water compared to reference wetland water. When C. riparius was reared for 10 d in
water mimicking combinations of salts and NA, survival was significantly negatively
correlated with salt and NA concentrations, and there was an antagonistic interaction
between the two toxicants.

v
For my parents, Cindy and Dan Kennedy;
for their love and support.

vi
ACKNOWLEDGEMENTS
First and foremost, I would like to acknowledge my supervisor, Dr. Jan
Ciborowski. His advice and support guided me through this challenging process like no
other supervisor could. I would like to thank my committee members Dr. Edwin Tam
and Dr. Ken Drouillard, and my industry mentor Carla Wytrykush (Syndrude Canada).
I would also like to thank my fellow graduate students and field assistants
throughout my Masters including Jesse Gardner Costa, Carsten Slama, Josh Martin (now
with Suncor), Lyndon Barr, Emily Crisovan, Michael Chen, Katie Williams, Hannah
Bagnall, Julie Koloff, Karolina Jurkowski, Jessica Dowson, and Megan Schieck. A
special thank you goes out to Sheeva Nakhaie with whom I made many “slap bets”—
without her (well-meaning) threat of physical pain hovering over the completion of each
chapter, this thesis would not have been possible. Members of the Ciborowski lab that
helped me out on the Windsor front included Katya Kovalenko, Mary Sebastian, Li
Wang, Michelle Dobrin, Mirna Jajo, Laxmi Pandit, Shubha Pandit, Paige McDonald,
Jessica Cuthbert, Nicole Barker, and Kyle Swiston.
In Fort McMurray, AB, many oil sands industry staff members helped
tremendously with the logistics of my field research: Chris Beierling (Syncrude), Lori
Cyprien (Syncrude), Christine Daly (Suncor), Terry Van Meer (Syncrude), and Richard
Kavanaugh (Canadian Natural Resources Limited).
Finally, I’d like to thank my wonderfully supportive family: my parents Cindy
and Dan, my brother Mike, and my sister Laura. I’d also like to thank my loving and
supportive partner Dave Middleton.

vii
This research was funded by grants provided to Dr. Jan Ciborowski from
Syncrude Canada Ltd, Suncor Energy Ltd., PetroCanada, Canadian Natural Resources
Ltd., Shell Canada, Total Canada Ltd., Imperial Oil Ltd., the Canadian Water Network,
and the Natural Sciences and Engineering Research Council of Canada (NSERC). I
gratefully acknowledge receipt of an NSERC Industrial Postgraduate Scholarship and
graduate/research assistantships from the University of Windsor.

viii
TABLE OF CONTENTS
DECLARATION OF ORIGINALITY .......................................................................... iii
ABSTRACT ...................................................................................................................... iv
ACKNOWLEDGEMENTS ............................................................................................ vi
LIST OF TABLES ........................................................................................................... xi
LIST OF FIGURES ....................................................................................................... xiii
LIST OF APPENDICES ................................................................................................ xv
LIST OF ABBREVIATIONS ....................................................................................... xvi
CHAPTER I: GENERAL INTRODUCTION ............................................................... 1
Chironomidae .................................................................................................................. 1
The Oil Sands Industry and Wet Landscape Reclamation.............................................. 3
Toxicity of Oil Sands Process Water across Taxa .......................................................... 5
Effect of OSPW on Benthic Invertebrates and Chironomidae ..................................... 10
Mode of Action for Naphthenic Acid Toxicity............................................................. 12
Toxicity of Salts to Freshwater Biota ........................................................................... 13
Objectives ..................................................................................................................... 15
References ..................................................................................................................... 17
CHAPTER II: ABUNDANCE, SIZE, AND GENUS RICHNESS OF
CHIRONOMIDAE EMERGING FROM REFERENCE AND OIL SANDS
PROCESS-AFFECTED WETLANDS ......................................................................... 24

ix
Introduction ................................................................................................................... 24
Methods......................................................................................................................... 28
Results ........................................................................................................................... 37
Discussion ..................................................................................................................... 51
Conclusion .................................................................................................................... 54
References ..................................................................................................................... 55
CHAPTER III :GROWTH RATE AND SURVIVAL OF CHIRONOMUS RIPARIUS
WHEN EXPOSED TO OIL SANDS PROCESS-AFFECTED WETLAND WATER
IN A 10-D BIOASSAY.................................................................................................... 60
Introduction ................................................................................................................... 60
Methods......................................................................................................................... 63
Results ........................................................................................................................... 69
Discussion ..................................................................................................................... 78
Conclusion .................................................................................................................... 80
References ..................................................................................................................... 81
CHAPTER IV: ASSESSING INDEPENDENT AND INTERACTIVE EFFECTS OF
NAPHTHENIC ACIDS AND SALTS ON LARVAE OF CHIRONOMUS RIPARIUS
(DIPTERA: CHIRONOMIDAE) IN LABORATORY BIOASSAYS ....................... 83
Introduction ................................................................................................................... 83
Methods......................................................................................................................... 87
Results ........................................................................................................................... 93

x
Discussion ................................................................................................................... 107
Conclusion .................................................................................................................. 109
References ................................................................................................................... 111
CHAPTER V: GENERAL DISCUSSION.................................................................. 114
Goals ........................................................................................................................... 114
Discussion of Key Findings ........................................................................................ 114
Implications................................................................................................................. 117
Future Studies ............................................................................................................. 118
Conclusion .................................................................................................................. 120
References ................................................................................................................... 120
VITA AUCTORIS ........................................................................................................ 144

xi
LIST OF TABLES
Table 2.1: Description of wetlands used in this study. ..................................................... 30
Table 2.2: Descriptions of four principal components derived log percent abundance of
eight dominant emergent chironomid genera. .................................................................. 47
Table 2.3: PC loadings for each of the eight dominant genera. Loadings greater than |0.6|
are bolded. ......................................................................................................................... 47
Table 2.4: Results of a forward stepwise multiple regression of conductivity, salinity,
naphthenic acid concentration, dissolved oxygen (D.O.), dissolved organic carbon
(D.O.C.), and temperature on PCA scores. Statistically significant p-values (<0.05) are
indicated by an asterisk (*). .............................................................................................. 50
Table 3.1: Descriptions of the study wetlands. ................................................................. 65
Table 3.2: Results of a forward stepwise multiple regression on log(survival ratio + 1)
with class (OSPW or reference), year, log(NA), log(conductivity), and the interaction
term of log(NA) and log(conductivity) as independent variables. Significant p-values are
indicated by an asterisk (*)................................................................................................71
Table 3.3: Results of a forward stepwise multiple regression with log(biomass) as the
dependent variable and class (OSPW or reference), year, log(NA), log(conductivity), and
the interaction term of log(NA) and log(conductivity) as independent variable.
Significant p-values are indicated by an asterisk (*) ........................................................ 71
Table 4.1: Concentrations of major ions in Natural Wetland. .......................................... 89
Table 4.2: Salts added to Millipore filtered water to match major ion concentrations listed
in Table 4.1 to yield 10L stock solution. .......................................................................... 89

xii
Table 4.3: Description of the concentrations of potentially toxic constituents in each
series ................................................................................................................................. 92
Table 4.4: Linear regression results of log transformed NA on log-transformed survival
ratio (survival/mortality). Statistically significant p-values (<0.05) are indicated by an
asterisk (*). ........................................................................................................................ 97
Table 4.5: Linear regression results of log transformed NA on log-transformed mean
length (mm). Statistically significant p-values (<0.05) are indicated by an asterisk (*). . 97
Table 4.6: Linear regression results of log transformed TDS on log-transformed survival
ratio (survival/mortality). Statistically significant p-values (<0.05) are indicated by an
asterisk (*). ...................................................................................................................... 100
Table 4.7: Linear regression results of log transformed TDS on log-transformed mean
length (mm). Statistically significant p-values (<0.05) are indicated by an asterisk (*). 100
Table 4.8: Multiple regression results of log transformed NA, TDS, and interaction effect
on log-transformed survival ratio (survival/mortality). Statistically significant p-values
(<0.05) are indicated by an asterisk (*). ......................................................................... 106
Table 4.9: Multiple regression results of log transformed NA, TDS, and interaction effect
on log-transformed mean length (mm). Statistically significant p-values (<0.05) are
indicated by an asterisk (*). ............................................................................................ 106

xiii
LIST OF FIGURES
Figure 2.1: Photo of floating hoop emergence traps (Photo by K. Jurkowski, 2009). Hoop
diameter is 30 cm. ............................................................................................................. 33
Figure 2.2: Schematic diagram of floating hoop emergence trap (from Swisterski et al.,
2006)..................................................................................................................................34
Figure 2.3: Mean (± SE) number of exuviae per 732 cm2 hoop for 4 OSPM-affected
wetlands and 5 reference wetlands. .................................................................................. 38
Figure 2.4: Mean (± SE; n=5) number of exuviae per 732 cm2 hoop in study wetlands. . 39
Figure 2.5: Mean exuviae length (± 1 SE) for four OSPM-affected wetlands and five
reference wetlands.............................................................................................................41
Figure 2.6: Mean exuviae length (± 1 SE) graphed by wetland........................................42
Figure 2.7: Genus richness in OSPM and reference wetlands. ......................................... 43
Figure 2.8: Wetlands graphed according to PCI and PCII scores. .................................... 48
Figure 2.9: Wetlands graphed according to PC III and PCIV scores. .............................. 49
Figure 3.1: Percent larval survival per jar across a range of conductivities (μS/cm) of
thirteen wetland waters......................................................................................................72
Figure 3.2: Percent larval survival per jar across a range of naphthenic acid
concentrations (mg/L) of thirteen wetland waters.............................................................73
Figure 3.3: Mean larval biomass (mg) per jar across a range of conductivities of thirteen
wetland waters...................................................................................................................74
Figure 3.4: Mean larval biomass (mg) per jar across a range of naphthenic acid
concentrations (mg/L) of thirteen wetland waters.............................................................75

xiv
Figure 3.5: Relationship between mean length of chironomids per jar (mm) and the
number of individuals surviving to the end of 10-d bioassay............................................77
Figure 4.1: Larval survival (percent) in each jar in which at least one larva survived to the
end of the study the naphthenic assay series. .................................................................... 95
Figure 4.2: Geometric mean body length (mm) of larvae for each jar in which at least one
larva survived in the naphthenic acid assay. ..................................................................... 96
Figure 4.3: Larval survival (percent) in each jar in which at least one larva survived to the
end of the study the salt assay series. ................................................................................ 98
Figure 4.4: Geometric mean body length (mm) of larvae for each jar in which at least one
larva survived in the salt acid assay.. ................................................................................ 99
Figure 4.5: Larval survival (%) in the combination bioassay in which salts (TDS) and
NAs were combined. ....................................................................................................... 102
Figure 4.6: Geometric mean larval length (mm) in the combination assay in which salts
(TDS) and NAs were combined. ..................................................................................... 103
xv
LIST OF APPENDICES
APPENDIX A: WATER QUALITY OF WETLANDS STUDIED IN CHAPTER II .. 122
APPENDIX B: ABUNDANCE OF EMERGENT CHIRONOMID GENERA OF NINE
WETLANDS................................................................................................................... 123
APPENDIX C: MAJOR IONS IN WETLAND WATERS USED IN CHAPTER III ... 125
APPENDIX D: MEASURED WATER QUALITY PER JAR IN WETLAND WATER
BIOASSAY 2011............................................................................................................ 127
APPENDIX E: SURVIVAL AND MEAN FINAL SIZE IN WETLAND WATER
BIOASSAY..................................................................................................................... 132
APPENDIX F: MEASURED WATER QUALITY FOR CHAPTER IV TEST JARS . 136
APPENDIX G: SURVIVAL AND MEAN LENGTH FOR CHAPTER IV BIOASSAYS
......................................................................................................................................... 139

xvi
LIST OF ABBREVIATIONS
OSPW= Oil Sands Process Water
OSPM= Oil Sands Process Material
NA= Naphthenic Acids
TDS= Total Dissolved Solids
PCA= Principal Components Analysis
ANOVA= Analysis of Variance
DO= Dissolved Oxygen
DOC= Dissolved Organic Carbon
1
CHAPTER I: GENERAL INTRODUCTION
The overarching goal of this research was to determine if oil sands process affected
wetlands can support a chironomid community with productivity equivalent to that of
natural wetlands. Whether differences in productivity can be attributed to naphthenic acid
(NA) concentration, salts, or a combination of the two was also examined.
Chironomidae
Chironomidae are a diverse family of non-biting midges, which are ubiquitous and
abundant in North America (Pinder, 1986; Pascoe et al., 1989).It is estimated that there
may be up to 15,000 species of Chironomidae world-wide (Cranston, 1995). The life
cycle of chironomid species varies greatly in duration and timing; for example,
Chironomus riparius, a species commonly cultured in the laboratory, has a larval
duration of 10 d at 20 degrees C, and can pass through about 7 generations per year in
their natural habitat (Learner and Edwards, 1966). At the other extreme, two arctic
species of Chironomus were found to have a seven year life cycle from egg to adult
(Butler, 1982).
Adult female chironomids lay their eggs embedded in a gelatinous matrix on
macrophytes, rocks, or leaf litter close to the shoreline (Nolte 1993). A single egg mass
can contain between a few dozen eggs for smaller species to several thousand eggs for
larger species (Pinder, 1995a). Eggs will typically hatch in 2-6 d. At the time of hatching
and for approximately 24 h, the transparent first-instar larvae are planktonic, which
causes them to become dispersed via water currents (Pinder, 1995a). Larvae subsequently
settle to the substrate, and the larvae are benthic for the remainder of their prepupal

2
development. Many chironomid species create tubes of mucus, often incorporating other
materials. Tubes can secure larvae to substrates, facilitate respiratory efficiency, or
provide shelter from predators (Oliver, 1971; Hershey, 1987).
After passing through 4 larval instars, chironomids develop into pupae. During the very
brief pupal stage, an individual rises through water column to the surface where it moults
and emerges as an adult (Oliver 1971), typically leaving the pupal exuvia floating on the
surface of the water. The exuviae, collected as floating windrows in backwaters
(Ferrington et al. 1991), or trapped with nets anchored in streams (Boerger 1977) can be
identified and enumerated and thus provide a measure of chironomid community
composition and abundance.
Chironomids are typically among the most numerous benthic invertebrates in freshwater
systems. Larvae can be present in densities of up to 50,000 individuals m-2
(Coffman,
1995). The transfer of this aquatic biomass to the terrestrial community through
emergence creates an important link between aquatic and terrestrial food webs (Oliver
1971). They are especially important contributors to overall wetland productivity (Pascoe
et al. 1989), providing energy to higher trophic levels both within and outside of the
wetland communities in which they develop (Oliver, 1971). Chironomid carcass
deposition can provide significant nutrient inputs to near-shore terrestrial food webs, and
these nutrient inputs can be detected in multiple trophic levels (Hoekman et al., 2012).
Because they are so abundant, they can serve as a primary food source for invertebrate
predators such as dragonflies (Benke, 1976)) and many vertebrate functional groups,

3
including dabbling ducks such as mallards (Batzer et al. 1993), and aerial insectivores
such as silver-haired bats (Barclay, 1985) and tree swallows (St. Louis et al., 1990).
Chironomid larvae have potential to be especially useful bioindicators in that species and
genera are differentially sensitive to both disturbance and to specific classes of pollution
(Rosenberg 1992, Carew et al. 2007).
Representatives of some multivoltine chironomid genera are amenable to laboratory
culturing and are commonly used in biomonitoring freshwater ecosystems. Chironomus
larvae in particular are standard test organisms used to determine aquatic toxicity
(Environment Canada, 1997; EPA, 1996; OECD, 2004).
The Oil Sands Industry and Wet Landscape Reclamation
Unlike traditional oil extraction methods, the shallow nature of the Athabasca oil deposit
requires open pit mining. The process of extracting bitumen from the mined oil sand ore
(usually the Clark hot water extraction method) requires large volumes of alkaline, hot
water and generates large amounts of tailings material. The tailings material is primarily
composed of water, sand, and clays, but also contains unrecovered bitumen, salts,
naphthenic acids, and trace metals (FTFC 1995). In 2004, the total volume of tailings
water on site at Syncrude was approaching 1 billion m3 (MacKinnon 2004).
The post-mining landscape must be restored to a function equivalent to its pre-mining
state, which included 20-40% wetland area (FTFC 1995). Mine tailings material has been
used as a component of reclaimed demonstration wetlands (FTFC 1995), but the

4
consequences to wetland productivity must be determined before this reclamation
strategy is implemented on a large scale.
The “wet landscape option” is a proposed reclamation regime comprised of a landscape
consisting of series of interconnected wetlands that ultimately drain into end-pit lakes
(lakes created by allowing the mined open pit to partially or completely fill with water)
(FTFC, 1995). It is currently in the initial stages of being implemented by several oil
sands companies because it has the potential to use and permanently store large volumes
of process water (FTFC, 1995). However, the practicality of this option at a full scale,
however, depends on knowing, among other things, the long-term toxicity of oil sands
process water and material on aquatic biota. Initial studies on the use of fresh oil sands
process water (OSPW) in reclamation wetlands indicated that OSPW was toxic to a
variety of aquatic organisms (MacKinnon and Boerger, 1986). Of the major constituents
that comprise OSPW, naphthenic acids (NAs) are commonly cited in the literature as the
main contributor to the toxicity (Allen, 2008). However, marine sediments from the late
Cretaceous and Devonian eras are close to the surface in the Athabasca oil sands area
(Gosselin et al., 2010). Furthermore, sodium hydroxide is used during extraction, and
calcium sulphate is often added during the consolidation of tailings, which produces a
subsaline environment that adds to the toxicity by imposing osmotic stress on aquatic
organisms (MacKinnon et al. 2001). Sodium, calcium, chloride, sulphate, and
bicarbonate are the major ions that contribute to the salinity of OSPW (M. MacKinnon,
Syncrude Canada Ltd., pers. communication, Gosselin et al., 2010). Concentrations of

5
naphthenic acids covary with salts in OSPW, making their individual effects difficult to
distinguish when conducting field studies (Leung et al. 2003).
Toxicity of Oil Sands Process Water across Taxa
Naphthenic acids are a group of alkyl-substituted carboxylic acids that naturally occur in
petroleum (Clemente & Fedorak, 2005; Seifert & Teeter, 1969). They occur in low
concentrations (1-2 mg/L) in the Athabasca River and its tributaries, and in natural
wetlands, but they can be present in OSPW at concentrations of up to 120 mg/L (M.
MacKinnon pers. communication). Recent improvements in technology indicate that the
acid extractable portion of OSPW which was previously called NA is not truly NA in its
entirety (Rowland et al., 2011). However, since this is a very recent finding, the term
“NA” will be used synonymously with “acid extractable portion of OSPW” in this thesis.
NAs in freshly produced OSPW are acutely toxic to a variety of microbes, plants,
invertebrates, fishes, mammals, and amphibians. Leung et al. (2001) studied
phytoplankton community composition and biomass using microcosms in OSPM-
affected and reference wetlands. They found significant differences in community
composition between reference and OSPM-affected wetlands but no significant
differences in biomass.
In yeast, NAs extracted from North Sea oil effluent were found to be weak estrogen
receptor agonists and androgen receptor antagonists (Thomas et al., 2009). This means
that NAs bind to the estrogen receptor and disrupt binding at the androgen receptor
(Thomas et al., 2009). This may explain some of the changes in sex characteristics in

6
higher trophic organisms (explained further below) such as fathead minnows (e.g.
Kavanagh et al. 2011).
Naphthenic acids are acutely toxic to microorganisms (Clemente et al. 2004). Some
toxicity assays using Vibrio fischeri (Frank et al., 2008a; Frank et al., 2008b) and
Photobacterium phosphorem (Holowenko et al. 2002) suggested that low molecular
weight naphthenic acids are more toxic than higher molecular weight acids. However,
these findings must be interpreted with caution because the concentrations of the
fractions were reported in mg/L rather than as molar concentrations.
Furthermore, the addition of carboxylic acid, which is expected to reduce
hydrophobicity, reduces the toxicity of the acid fraction (Frank et al. 2008a). This
relationship between molecular weight, carboxylic acid content, and toxicity was also
demonstrated in bioassays using Daphnia magna (Frank et al. 2008a).
Water from OSPM-affected ponds reduced the growth rate and slowed the development
of northern Canadian toad (B. boreas) and wood frog (R. sylvatica), tadpoles relative to
tadpole growth and development in water from reference ponds (Pollet & Bendell-
Young, 2000). When Hersikorn et al. (2010) conducted a similar study, they found that
wood frog tadpoles only exhibited high mortality when held in young OSPM-affected
wetlands. Tadpoles held in older (>7 years old) OSPM-affected wetlands appeared to
have a survival rate similar to tadpoles held in reference wetlands. However, Schock et
al. (Keyano College, pers. commun.) found that OSPW slowed the development of wood

7
frog tadpoles so much that they were unlikely to be able to metamorphose and disperse
from ponds prior to winter freeze-up.
The responses of several fish species to OSPW and NA have been studied. Kavanagh et
al. (2011) reported disturbances in reproduction and secondary sex characteristics in
fathead minnows (Pimephales promelas) that were exposed to NA concentrations and
conductivities typical of OSPM-affected wetlands; OSPW with NA concentrations of
>25 mg/L and conductivities of >2000 µS/cm caused spawning inhibition, lowered sex
steroid hormone concentrations, and reduced secondary sex characteristics (nuptials)
(Kavanagh et al. 2011). In another assay in which fish were first acclimated in water that
was half the conductivity of treatment water prior to the test, spawning and sex steroids in
males were significantly reduced but not completely inhibited (Kavanagh et al. 2011), so
native or acclimated fathead minnow populations may not be affected to the same extent
as those exposed to OSPW quickly. Similarly, fathead minnows in early life stages that
were exposed to oil sands process sediments and naturally-occurring oil sands showed
delayed hatching, increased mortality, and increased incidence of malformations
(Colavecchia et al. 2004). Changes in sex hormone levels detected in goldfish exposed to
OSPW may explain the changes in reproductive traits seen in fathead minnows. Both
male and female goldfish caged in experimental ponds containing OSPW exhibited
significantly lower testosterone and 17β-estradiol concentrations compared to fish held in
control ponds (Lister et al. 2008). Furthermore, plasma 17β-estradiol levels were
significantly higher in male goldfish that were exposed to a concentration of 6 mg/L
naphthenic acids in a 7-d day laboratory bioassay than in fish that were exposed to

8
reference lake water (Lister et al. 2008). However, these changes in sex steroid levels
were not seen in native slimy sculpin (Cottus cognatus) and pearl dace (Margariscus
margarita) collected close to oil sands developments compared to fish collected upstream
of developments (Tetreault et al. 2003). But, EROD activity (a biomarker for chemical
detoxification of any kind) activity in the liver was significantly higher in slimy sculpin
and pearl dace that were collected close to the oil sands developments (Tetreault et al.
2003); this means that although the fish are exposed to potentially toxic chemicals when
close to the oil sands developments, this exposure does not necessarily manifest itself in
alteration of the sex characteristics studied. In contrast to focusing on sexual differences
fish as did the previously described studies, Nero et al. (2006a) examined gill and liver
histopathology in goldfish and yellow perch that were held in OSPM-affected and
reference ponds. Perch held in a pond with high NA (24 mg/L) concentrations and high
conductivity (2657 μS/cm) exhibited significantly higher inflammatory and degenerative
liver response indices and significantly higher gill proliferation than fish held in a ponds
with lower concentrations of NA and lower conductivities (Nero et al., 2006a). Similarly,
goldfish gills showed an inflammatory and degenerative response when held in the high
NA and high conductivity pond (Nero et al., 2006a). Nero et al. (2006b) conducted a
separate lab bioassay on yellow perch to assess the effect of salinity on NA toxicity.
They used a low salt and a high salt treatment on 3 different concentrations of extracted
NA and 3 different concentrations of commercial NA. The authors found that all
individuals died at 3.6 mg/L NA. However, at lower concentrations of NA the addition of
salt reduced mortality by 40-50%. Gill surface area was, however, significantly reduced
by the addition of salts to NA (Nero et al. 2006b). This change in gill morphology was

9
not seen in fathead minnows exposed to OSPW, but the minnows did exhibit very high
mortality rates when caged in OSPW ponds compared to control ponds (Farrell et al.,
2004). Siwik et al. (2000) conducted two repetitions of a bioassay in which young fathead
minnows were held in OSPM-affected wetland water, salty reference wetland water, and
lower salt reference wetland water. In the first bioassay, the investigators did not detect
any significant differences in growth or survival, but in the second bioassay the minnows
exhibited significant differences in survival but not growth (Siwik et al., 2000).
Although many researchers have studied the toxicity of OSPW and NA to fishes, studies
on taxa that may be less directly affected by OSPW, such as mammals and birds, are
relatively scarce. Rogers et al. (2002) analyzed the short-term toxicity of NA
consumption (extracted from OSPW) by rodents at dosages of 3, 30 and 300 mg/kg body
weight. High-dose females had significantly higher ovary and spleen weights and high-
dose males had significantly higher heart and testes weights than control rats. However,
the high dose (300 mg/kg body weight) corresponds to 50 times a “worst-case single-day
exposure for wild animals”, so results like this would not be seen in nature. In a 90-d test,
rats fed 60 mg/kg body weight/d showed increased liver glycogen storage and higher
liver weights than rats given lower dosages and controls. The authors suggested that the
liver was likely a target organ for NA toxicity in mammals (Rogers et al. 2002). Birds
ingest NA in a way similar to mammals-- directly by drinking OSPW, and indirectly by
consuming food (e.g., emergent insects) that developed in OSPW. Thyroid hormone
concentration (T4) was significantly higher in tree swallow (Tachycineta bicolour)
nestlings from two OSPM-affected wetlands compared to concentrations in nestlings
10
from two reference wetlands (Gentes et al. 2007a). However, when tree swallow
nestlings were directly fed NA at a rate of 1.5 mg/d for 7 d — an amount corresponding
to ten times the worst case scenario exposure—no negative effects were found in growth,
organ weight, or blood biochemistry, among other endpoints (Gentes et al. 2007b).
Collectively, these studies indicate that ingested NA pose minimal acute toxicity to birds
and mammals.
Effect of OSPW on Benthic Invertebrates and Chironomidae
Young (<7 year old) OSPW wetlands support less diverse macroinvertebrate populations
than naturally-formed reference or older OSPW wetlands (Leonhardt, 2003). This
suggests that toxicity of OSPW may decline over time; naphthenic acids can biodegrade
over time (Herman et al. 1994), and this may explain the apparent reduction in toxicity.
An alternative explanation may be that more tolerant species may be colonizing OSPW
and after seven years the richness may be equivalent, but community composition may
still be different.
Bendell-Young et al. (2000) found that Chironomidae larvae were the numerically
dominant invertebrates in seven reference wetlands and five OSPW wetlands. OSPW
wetlands tended to have lower overall benthic macroinvertebrate diversity, but higher
chironomid diversity than reference wetlands. Furthermore, OSPW wetlands had greater
chironomid densities and biomass than reference wetlands. Mouthparts of chironomids
were also examined for deformities as evidence of teratogenic effects, and no significant
difference between wetlands was found (Bendell-Young et al. 2000). Whelly (1999) also
found that natural reference wetlands supported greater diversity but lower

11
macroinvertebrate abundance than constructed wetlands. However, reference constructed
wetlands had greater richness than OSPW-affected wetlands of equivalent age. Whelly
(1999) also found that the incidence of mouthpart deformities was uniformly low across
multiple genera and in all classes of wetlands that he studied.
Anderson et al. (2011) exposed partially grown (2nd
-3rd
instar) Chironomus dilutus (= C.
tentans) larvae to water from three different OSPW-affected wetlands, two fresh OSPW
samples, as well as a freshwater and a saltwater control. No consistent significant
differences were found in mean survival among water treatments, but larvae grown in the
two fresh OSPW samples did exhibit a lower wet biomass than larvae grown in water
from the controls or the reclamation ponds. Larvae grown in two fresh OSPW samples
and one OSPW-affected wetland water sample exhibited significantly lower emergence
success than controls (Anderson et al. 2011).
Most relevant to this study is a toxicity test done by Whelly (1999) on a laboratory
population of Chironomus riparius and lab and field derived C. dilutus larvae. Mean final
body length and survival were not significantly affected by OSPW concentration in the C.
riparius larvae. But, growth and survival were significantly reduced in both of the C.
dilutus populations when exposed to high concentrations of OSPW. At 100% OSPW the
lab-derived C. dilutus population grew to only 40% the size of controls, whereas the field
population grew to 75% the size of controls at the same concentration. Whelly (1999)
also found that 50% of C. dilutus larvae reared in fresh OSPW died at a concentration of
65% OSPW. Although naphthenic acid concentrations of the OSPW used in the

12
experiment were not known, given the typical range of fresh OSPW (80-100 mg/L;
Holowenko et al. 2002), we can estimate that the LC50 of naphthenic acids to C. dilutus is
likely 52- 65 mg/L.
Mode of Action for Naphthenic Acid Toxicity
Although the mode of action of NA toxicity is largely unknown, it has been proposed that
it probably acts by causing narcosis—the disruption of cell membrane function (Roberts,
1991; Frank et al. 2008a). Because surfactants can interact with proteins, NAs may affect
cell membrane permeability (Abel, 1974). Low molecular weight NAs are more toxic,
but are also more readily degraded by microbes (Frank et al. 2008b). The number of
carboxylic acid groups in the NA molecular structure also plays a role in toxicity; the
greater the carboxylic acid content, the less toxic the mixture is (Frank et al. 2008a).
There is also a physical mechanism by which NAs pose stress to aquatic organisms. NAs
have surfactant properties, which can cause gill damage and death by asphyxiation (Abel,
1974).
Another alternate mechanism of (sublethal) toxicity was reported recently by Thomas et
al (2009); in a yeast bioassay, the authors found NAs to be a weak estrogen receptor
agonist and an androgen receptor antagonist. This may explain some of the sex steroid
hormone levels and secondary sex characteristic changes in fish that have been detected
in other studies (e.g. Kavanagh et al. 2011, Lister et al. 2008). Estrogen is not only used
by vertebrates— insects also depend on estrogen to regulate aspects of reproduction
(Mechoulam et al. 1984) and may be affected similarly by OSPW. The genomic response

13
of E. coli to NAs was analysed by Zhang et al. (2011) in order to determine how NAs
interact with organisms on the cellular level. The main molecular responses were up-
regulation of genes involved with NADP or NADPH binding and down-regulation of
genes involved with ATP binding.
Recent advances in the analysis of the components of the acidic fraction of OSPW have
indicated that different fractionation techniques can yield a different suite of organic
acids and not purely NAs (Rowland et al. 2011). Furthermore, the method of analysis
used to quantify NAs differs broadly within the scientific community, and determining
exactly which acids comprise the suite of extractable organic acids in OSPW has proven
to be a very difficult task (Rowland et al. 2011). It is increasingly realized that toxicity
tests referring to oil sands extracted “naphthenic acids” actually refer to a broad group of
acids, only some of which are toxic.
Toxicity of Salts to Freshwater Biota
High salinities in OSPW and OSPW-affected wetlands pose a great challenge in wetland
reclamation. Like NAs, salts can be toxic to freshwater biota, but, unlike NAs, salts do
not degrade and therefore decrease in concentration over time. The topography and
hydrology of watersheds in the Athabasca oil sands region, is such that annual
evaporation often exceeds precipitation (DeVito et al. 2005). Consequently, salinity of
wetland waters can increase or remain constant over time. This has been shown to be the
case with OSPW-affected wetlands (Macyk et al. 2004).

14
Salinity can be measured in concentration of ions (i.e., total dissolved solids; parts per
thousad (ppt), or mg/L) or by the electrical conductance of the ions in solution, (i.e.,
conductivity; μS/cm); however, the two measures are very highly positively correlated
(Walker et al. 1995).
High salinity can pose a great challenge for freshwater plants and biota. In plants, the
sodium, chloride, and sulphate ions can interfere with water transport in a variety of
boreal plants (Renault et al. 1998). In a group of OSPW wetlands and natural wetlands
surveyed, salinity was found to be negatively correlated with species richness and peak
biomass in boreal marsh plants (Trites and Bayley, 2009).
Wojnarowicz (2009) assessed the toxicity of two salts commonly found in OSPW,
sodium chloride and sodium sulphate, to Ceriodaphnia dubia. She hypothesized that
specific ions and the interaction between them may better predict toxicity than the overall
concentration of ions or conductivity. However, the effects of sodium chloride and
sodium sulphate were additive, and thus there was no interaction between these salts
(Wojnarowicz, 2009).
Genera of Chironomidae are differentially sensitive to salinity; as such, chironomid head
capsules in sediment cores are often used in paleolimnology in order to infer the water
chemistry history of lakes (Walker et al. 1995). For example, highly saline lakes (>10
ppt) are characterized by abundant Cricotopus or Orthocladius larvae, whereas lakes with
lower salinity are characterized by Chironomus, Procladius, or Psectrocladius (Walker et

15
al. 1995). Because several genera are tolerant of high salinities, chironomids can make up
a large component of the benthic fauna in brackish waters (Pinder 1995b). In
Chironomus, high salinities (conductivity >5000 μS/cm) lower the number of emergent
adults, delay the time of emergence, and reduce larval growth rate (Hassell et al. 2006).
Chironomus riparius larvae reared in water with sodium chloride concentrations of 5, 10
and 20 ppt exhibited significantly reduced survival compared to controls (0 ppt) (Silver et
al. 2009). This effect, however, was only seen at temperatures of 22˚C and not at lower
temperatures. Furthermore, the survival rate in the controls at 22˚C was low
(approximately 30%) (Silver et al. 2009).
Objectives
Although many studies have been done on the effects of OSPW (particularly with fish),
the independent and interactive effects of salts and NAs are not well understood.
Furthermore, one must understand the impact of these interactions on chironomid
productivity in order to assess the likelihood that wetland reclamation strategies in the
Athabasca oil sands region can provide enough biomass to support a food web similar to
that of natural wetlands. Therefore, the objectives of this thesis were to determine
whether OSPW-affected wetlands differ from natural wetlands in emerging chironomid
abundance, biomass, and community composition (Chapter II), to assess the effect of
water from OSPW-affected wetlands on survival and growth of C. riparius relative to the
water of reference wetlands under controlled laboratory conditions (Chapter III), and to
assess whether the toxicity of OSPW to chironomids primarily due to naphthenic acids,
the complement of salts, or an interaction between NAs and salts (Chapter IV).

16
In general, my expectations were that NAs and salts would each exert stress on
chironomid larvae and lower productivity. However, when NAs and salts are present
together, I expected there to be an antagonistic effect, thus supporting greater
productivity than if the individual effects were added together.

17
References
Abel, P.D. 1974. Toxicity of synthetic detergents to fish and aquatic invertebrates.
Journal of Fish Biology 6: 279-298.
Allen, E.W. 2008. Process water treatment in Canada’s oil industry: I. Target pollutants
and treatment objectives. Journal of Environmental Engineering and Science 7: 123-138.
Batzer, D. P., M. McGee, V.H. Resh, and R.R. Smith 1993. Characteristics of
invertebrates consumed by mallards and prey response to wetland flooding schedules.
Wetlands 13: 41-49.
Barclay, R.M.R. 1985. Long- versus short-range foraging strategies of hoary (Lasiurus
cinereus) and silver-haired (Lasionycteris noctivagans) bats and the consequences for
prey selection. Canadian Journal of Zoology 63: 2507-2515.
Bendell-Young, L.L., K.E. Bennett, A. Crowe, C.J. Kennedy, A.R. Kermode, M.M.
Moore, A.L. Plant, and A. Wood. 2000. Ecological characteristics of wetlands receiving
an industrial effluent. Ecological Applications 10: 310-322.
Benke, A.C. 1976. Dragonfly production and prey turnover. Ecology 57: 915-927.
Bervoets, L., C. Wils, and R. Verheyen. 1996. Tolerance of Chironomus riparius larvae
(Diptera: Chironomidae) to salinity. Bulletin of Environmental Contamination and
Toxicology 57: 829-835.
Butler, M.G. 1982. A 7-year life cycle for two Chironomus species in arctic Alaskan
tundra ponds (Diptera: Chironomidae). Canadian Journal of Zoology 60: 58-70.
Carew, M.E., V. Pettigrove, R.L. Cox, and A.A. Hoffmann. 2007. The response of
Chironomidae to sediment pollution and other environmental characteristics in urban
wetlands. Freshwater Biology 52: 2444-2462.
Clemente, J. S., and P.M. Fedorak. 2005. A review of occurrence, analyses, toxicity, and
biodegradation of naphthenic acids. Chemosphere 60: 585-600.
Clemente, J.S., M.D. MacKinnon, and P.M. Fedorak. 2004. Aerobic biodegradation of
two commercial naphthenic acids preparations. Environmental Science and Technology
38: 1009–1016.
Coffman, W.P. 1995. Conclusions In The Chironomidae: The biology and ecology of
non-biting midges. Edited by: Armitage, P.D., Cranston, P.S., and Pinder, L.C.V.
Chapman & Hall, London, UK. Pages 436-447.
Colavecchia, M.V., S.M. Backus, P.V. Hodson, and J.L. Parrott. 2004. Toxicity of oil

18
sands to early life stages of fathead minnows (Pimephales promelas). Environmental
Toxicology and Chemistry 23: 1709-1718.
Cranston, P.S. 1995. Introduction In The Chironomidae: The biology and ecology of non-
biting midges. Edited by: Armitage, P.D., Cranston, P.S., and Pinder, L.C.V. Chapman &
Hall, London, UK. Pages 1-7.
Dominski, M. 2007. Surface mined oil sand: tailings practices, performance, and
projections. Alberta Energy and Utilities Board. In Proceedings of the 3rd International
Heavy Oil Conference, March 5–7, 2007, Calgary, AB. Alberta Energy and Utilities
Board.
Environment Canada. 1997. Biological test method: test for survival and growth in
sediment using larvae of freshwater midges (Chironomus tentans or Chironomus
riparius). Report EPS 1/RM/32, Environment Canada, Ottawa, Ontario.
EPA (United States Environmental Protection Agency). 1996. Ecological effects test
guidelines OPPTS 850.1790 Chironomid Sediment Toxicity Test. Public Draft. EPA
712-C-96-313. US Environmental Protection Agency, Office of Protection, Pesticides
and Toxic Substances, Washington, DC.
Farrell, A.P., C.J. Kennedy, and A. Kolok. 2004. Effects of wastewater from an oil-sand-
refining operation on survival, hematology, gill histology, and swimming of fathead
minnows. Canadian Journal of Zoology 82: 1519-1527.
Ferrington, L.C., M. Blackwood, and C.A. Wright. 1991. A protocol for using surface-
floating pupal exuviae of Chironomidae for rapid bioassessment of changing water
quality. Sediment and Stream Water Quality in a Changing Environment: Trends and
Explanation 203: 181-190.
Frank, R.A., K. Fischer, R. Kavanagh, B.K. Burnison, G. Arsenault, J.V. Headley, K.M.
Peru, G. Van der Kraak, and K.R. Solomon. 2008a. Effect of carboxylic acid content on
the acute toxicity of oil sands naphthenic acids. Environmental Science and Technology
43: 266-271.
Frank, R.A., R. Kavanagh, B.K. Burnison, G. Arsenault, J.V. Headley, K.M. Peru, G.
Van Der Kraak, and K.R. Solomon. 2008b. Toxicity assessment of collected fractions
from an extracted naphthenic acid mixture. Chemosphere 72: 1309-1314.
FTFC (Fine Tailings Fundamentals Consortium). 1995. “Volume II: Fine Tails and
Process Water Reclamation” In: Advances in Oil Sands Tailings Research, Alberta
Department of Energy, Oil Sands and Research Division, Edmonton, Alberta, Canada.

19
Gentes, M.L., C. Waldner, Z. Papp, and J.E.G. Smits. 2006a. Effects of oil sands tailings
compounds and harsh weather on mortality rates, growth and detoxification efforts in
nestling tree swallows (Tachycineta bicolor). Environmental Pollution 142: 24–33.
Gentes, M.L., C. Waldner, Z. Papp, and J.E.G. Smits. 2007b. Effects of exposure to
naphthenic acids in tree swallows (Tachycineta bicolor) on the Athabasca oil sands,
Alberta, Canada. Journal of Toxicology and Environmental Health 70A: 1182-1190.
Gosselin, P., S.E. Hrudey, M.A. Naeth, A. Plourde, R. Therrien, G. Van Der Kraak, and
Z. Xu. 2010. The Royal Society of Canada Expert Panel: Environmental and Health
Impacts of Canada’s Oil Sands Industry. Pages 111- 130.
Hassell, K. L., B.J. Kefford, and D. Nugegoda. 2006. Sub-lethal and chronic salinity
tolerances of three freshwater insects: Cloeon sp. and Centroptilum (Ephemeropptera:
Baetidae) and Chironomus sp. (Diptera: Chironomidae). Journal of Experimental Biology
209: 4024-4032.
Herman, D.C., P.M. Fedorak, M.D. MacKinnon, and J.W. Costerton. 1994.
Biodegradation of naphthenic acids by microbial populations indigenous to oil sands
tailings. Canadian Journal of Microbiology 40: 467-477.
Hersikorn, B.D., J.J.C. Ciborowski, and J.E.G. Smits. 2010. The effects of oil sands
wetlands on wood frogs (Rana sylvatica). Toxicology & Environmental Chemistry 92:
1513-1527.
Hershey, A.E. 1987. Tubes and foraging behaviour in larval Chironomidae: implications
for predator avoidance. Oecologia (Berlin) 73: 236-241.
Hoekman, D., M. Bartrons, and C. Gratton. 2012. Ecosystem linkages revealed by
experimental lake-derived isotope signal in heathland food webs. Oecologia (in press).
Holowenko, F.M., M.D. MacKinnon, and P.M. Fedorak. 2001. Naphthenic acids and
surrogate naphthenic acids in methanogenic microcosms. Water Research 35: 2595–606.
Kavanagh, R.J., R.A. Frank, K.D. Oakes, M.R. Servos, R.F. Young, P.M. Fedorak, M.D.
MacKinnon, and K. Solomon. 2011. Fathead minnow (Pimephales promelas)
reproduction is impaired in aged oil sands process-affected waters. Aquatic Toxicology
101: 214-220.
Learner, M.A. and R.W. Edwards. 1966. The distribution of the midge Chironomus
riparius in a polluted river system and its environs. Air and Water Pollution 10: 757-768.
Leung, S.S., M.D. MacKinnon, and R.E.H. Smith. 2001. Aquatic reclamation in the
Athabasca, Canada, oil sands: naphthenate and salt effects on phytoplankton
communities. Environmental Toxicology and Chemistry 20: 1532-1543.
20
Leung, S.S., M.D. MacKinnon, and R.E.H. Smith. 2003. The ecological effects of
naphthenic acids and salts on phytoplankton from the Athabasca oil sands region.
Aquatic Toxicology 62: 11-26.
Leonhardt, C.L. 2003. Zoobenthic succession in constructed wetlands of the Fort
McMurray oil sands region: developing a measure of zoobenthic recovery. M.Sc. Thesis,
University of Windsor, Windsor, ON, Canada.
Lister, A., V. Nero, A. Farwell, D.G. Dixon, and G. Van Der Kraak. 2008. Reproductive
and stress hormone levels in goldfish (Carassius auratus) exposed to oil sands process-
affected water. Aquatic Toxicology 87: 170-177.
MacKinnon, M.D. 2004. Oil sands water quality issues: properties, treatment, and
discharge options. Canadian Oil Sands Network for Research and Development
(CONRAD) Oil Sands Water Usage Workshop, Edmonton, Alberta, February 24–25,
2005.
MacKinnon, M.D. Unpublished data. Summary of water chemistry of selected
waterbodies on the Syncrude mine lease area. Prepared for Syncrude Canada, Ltd.
Edmonton, AB.
MacKinnon, M.D., J.G. Matthews, W.H. Shaw, and R.G. Cuddy. 2001. Water quality
issues associated with composite tailings (CT) technology for managing oil sands
tailings. International Journal of Mining, Reclamation and Environment 15: 235-256.
MacKinnon, M.D., and H. Boerger. 1986. Description of two treatment methods for
detoxifying oil sands pond water. Water Pollution Research Journal of Canada 21: 496-
512.
Macyk, T.M., R.L. Faught, and R.C. Price. 2004. Evaluation of long term changes in
reconstituted soils at the operations of Syncrude Canada Ltd. Alberta Research Council.
Edmonton, AB.
Mechoulam, R., R.W. Brueggemeier, and D.L. Denlinger. 1984. Estrogens in insects.
Experimentia 40: 943-944.
Nero, V., A. Farwell, A. Lister, G. Van Der Kraak, L.E.J. Lee, T. Van Meer,
M.D. MacKinnon, and D.G. Dixon. 2006(a). Gill and liver histopathological changes in
yellow perch (Perca flavescens) and goldfish (Carassius auratus). Ecotoxicology and
Environmental Safety 63: 365-377.
Nero, V., A. Farwell, L.E.J. Lee, T . Van Meer, M.D. MacKinnon, and D.G. Dixon.
2006. The effects of salinity on naphthenic acid toxicity to yellow perch: Gill and liver
histopathology. Ecotoxicology and Environmental Safety 65: 252–64.

21
Nolte, U. 1993. Egg masses of Chironomidae (Diptera): a review, including new
observations and a preliminary key. Entomologica Scandinavica Supplement 43: 1-75.
OECD. 2004. Test No. 218: Sediment-water chironomid toxicity test using spiked
sediment. OECD Guidelines for the Testing of Chemicals Section 2: Effects of Biotic
Systems. Organisation for Economic Co-operation and Development, Paris.
Oliver, D.R. 1971. Life history of the Chironomidae. Annual Review of Entomology 16:
211-230.
Pascoe, D., K.A. Williams, and D.W.J. Green. 1989. Chronic toxicity of cadmium to
Chironomus riparius Meigen -- effects upon larval development and adult emergence.
Hydrobiologia 175: 109-115.
Pinder, L.C.V. 1986. Biology of freshwater Chironomidae. Annual Review of
Entomology 31: 1-23.
Pinder, L.C.V. 1995a. Biology of the eggs and first instar. In The Chironomidae: biology
and ecology of non-biting midges. Edited by P.D. Armitage, P. S. Cranston, and L.C.V.
Pinder. Chapman & Hall, London, UK. Pg. 91-97.
Pinder, L.C.V. 1995b. The habitats of chironomid larvae. In The Chironomidae: biology
and ecology of non-biting midges. Edited by P.D. Armitage, P. S. Cranston, and L.C.V.
Pinder. Chapman & Hall, London, UK. Pg. 131.
Pollet, I., and L.I. Bendell-Young. 2000. Amphibians as indicators of wetland quality in
wetlands formed from oil sands effluent. Environmental Toxicology and Chemistry 19:
2589-2597.
Renault, S., C. Lait, J.J. Zwiazek, and M. MacKinnon. 1998. Effect of high salinity
tailings waters produced from gypsum treatment of oil sands tailings on plants of the
boreal forest. Environmental Pollution 102: 177-184.
Roberts, D.W. 1991. QSAR issues in aquatic toxicity of surfactants. The Science of the
Total Environment 109/110: 557-568.
Rogers, V.V., M. Wickstrom, K. Liber, and M.D. MacKinnon. 2002. Acute and
subchronic mammalian toxicity of naphthenic acids from oil sands tailings. Toxicological
Sciences 66: 347-355.
Rosenberg, D.M. 1992. Freshwater biomonitoring and Chironomidae. Netherlands
Journal of Aquatic Ecology 26: 101-122.
Rowland, S.J., A.G. Scarlett, D. Jones, C.E. West, and R.A. Frank. 2011. Diamonds in
22
the rough: identification of individual naphthenic acids in oil sands process waters.
Environmental Science and Technology 45: 3154-3159.
Seifert, W.K., and R.M. Teeter. 1969. Preparative thin-layer chromatography and high
resolution mass spectrometry of crude oil carboxylic acids. Analytical Chemistry 41:
786–795.
Silver, P, S.M. Rupprecht, and M.F. Stauffer. 2009. Temperature-dependent effects of
road deicing salt on chironomid larvae. Wetlands 29: 942-951.
Siwik, P.L., T. Van Meer, M.D. MacKinnon, and C. Paszkowski. 2000. Growth of
fathead minnows in oil sand-processed wastewater in laboratory and field. Environmental
Toxicology and Chemistry 19: 1837–45.
St. Louis, V. L., L. Breebaart, and J.C. Barlow. 1990. Foraging behaviour of tree
swallows over acidified and nonacidic lakes. Canadian Journal of Zoology 68: 2385-
2392.
Tetreault, G.R., M.E. McMaster, D.G. Dixon, and J.L. Parrott. 2003. Using reproductive
endpoints in small forage fish species to evaluate the effects of Athabasca oil sands
activities. Environmental Toxicology and Chemistry 22: 2775-2782.
Thomas, K.V., K. Langford, K. Petersen, A.J. Smith, and K.E. Tollefsen. 2009. Effect-
directed identification of naphthenic acids as important in vitro xeno-estrogens and anti-
androgens in North Sea offshore produced discharges. Environmental Science and
Technology 43: 8066-8071.
Trites, M., and S.E. Bayley. 2009. Vegetation communities in continental boreal wetlands
along a salinity gradient: implications for oil sands mining reclamation. Aquatic Botany
91: 27-39.
Walker, I.R., S.E. Wilson, and J.P. Smol. 1995. Chironomidae (Diptera): quantitative
paleosalinity indicators for lakes of western Canada. Canadian Journal of Fisheries and
Aquatic Sciences 52: 950-960.
Whelly, M.P. 1999. Aquatic invertebrates in wetlands of the oil sands region of northeast
Alberta, Canada, with emphasis on Chironomidae (Diptera). M.Sc. Thesis, University of
Windsor, Windsor, ON, Canada.
Wojnarowicz, P. 2009. Effects of salt interactions in oil sands process waters on
Ceriodaphnia dubia using an isobolographic approach. B.Sc. Thesis. University of
Saskatchewan, Saskatoon, SK, Canada.
Zhang, X., S. Wiseman, H. Yu, H. Liu, J.P. Giesy, and M. Hecker. 2011. Assessing the

23
toxicity of naphthenic acids using a microbial genome wide live cell reporter array
system. Environmental Science & Technology 45: 1984-1991.

24
CHAPTER II: ABUNDANCE, SIZE, AND GENUS RICHNESS OF
CHIRONOMIDAE EMERGING FROM REFERENCE AND OIL SANDS
PROCESS-AFFECTED WETLANDS
Introduction
As part of the lease agreement with the Alberta government, oil sands companies must
restore land to its original level of productivity before mine closure (FTFC, 1995). This
means that reclaimed wetlands on site must be as productive as their reference
counterparts. As mentioned in the general introduction, one challenge in the reclamation
strategy is utilizing the enormous volumes of fine fluid tailings in the wet landscape
option. It is therefore of utmost importance that the OSPM-affected reclaimed wetlands
sustain a chironomid community.
Biological Productivity and Food Web Structure
Biological productivity is the accumulation of living tissue over a period of time. It is
measured in biomass accumulation per unit time per unit area (Huryn and Benke, 2007).
In other words, measuring productivity usually involves measuring the growth rate (i.e.,
change in biomass), and abundance of a group of organisms. High productivity at the
bottom of a food web supports greater productivity in the populations at higher trophic
levels. Net primary productivity—productivity of autotrophs -- in wetlands can vary
greatly and depends on many factors including light, sediment, nutrient availability, and
the hydrology of a wetland, i.e., whether it is largely precipitation fed (low primary
productivity) or whether it receives inputs of nutrient rich water (higher primary
productivity) (Sharitz & Pennings, 2006). Heterotrophic bacteria are likely the greatest

25
contributors to biomass in wetlands; bacteria play a fundamental role in nutrient cycling,
contributing to the decay of organic matter, and providing food for aquatic, detritivorous
invertebrates including chironomids (Boon, 2006). Aquatic invertebrates, such as
chironomids, are the most important primary consumers in many wetland ecosystems
(Jackson & Fisher, 1986), and thus play a major role in food web structure, linking the
microbial and macrophyte compartments to upper trophic levels.
The Importance of Chironomidae
Chironomidae dominate the diets of many predators, including fish, waterfowl, and
various terrestrial insectivores (spiders, aerial insectivorous birds, bats, etc.) (Hershey,
1985; Batzer et al., 1993; Barclay, 1985). Their abundance and ubiquity make them
especially representative of the aquatic emergent component of food webs (Pascoe et al,
1989). Chironomids make up a large portion of the benthic invertebrate biomass of
wetlands in northern Alberta, so their productivity influences the overall productivity of
the wetland as a whole. In oil sands lease area wetlands, Chironomidae larvae are
predominant. The subfamilies Tanypodinae and Orthocladiinae are among the most
common invertebrates in young wetlands and Chironominae among the most common
invertebrates in older wetlands (Leonhardt, 2003). Chironomids are often the dominant
benthic organisms in disturbed ecosystems; for example, they comprised 98% of the total
invertebrate biomass in four brackish, constructed ponds located in England (Rehfisch,
1994).

26
Quantifying Emergence
Chironomids spend most of their life cycle living in the sediment of rivers, lakes and
wetlands, passing through four larval instar stages before they pupate. When ready to
transform into an adult, a pupa rises to the water surface, sheds its exoskeleton, and
emerges as an adult fly. The cast skin (exuvia) typically remains floating on the surface
of the water for 24 h or more. The exuviae therefore provide a quantitative measure of the
number of chironomids that are emerging per unit area from a wetland (Switerski et al.,
2006). Ferrington et al. (1991) recommended the collection of pupal exuviae as an
especially effective way of characterizing chironomid community composition.
Because adult chironomids live for only a few days and typically do not feed (Oliver
1971), larval survival and growth are good predictors of the productivity of a population.
In a 10-d bioassay, Liber et al. (1996), reared second to third instar Chironomus tentans
larvae on six different feeding regimes to determine the relationship between larval
growth and subsequent emergence and ovipositing success. Survival was >88% in all
feeding treatments. Larval growth significantly differed among all treatments, and was
highly correlated with emergence success (R2=0.96). Although fewer females emerged at
the lower feeding regimes and their weights were lower, oviposition success (the ability
to lay an egg mass) was not affected and second generation larval growth was not
affected by maternal growth rate (Liber et al. 1996). However, Butler and Walter (1992)
found that female pupal dry biomass was highly correlated (R2=0.76) with fecundity
(number of eggs). The authors studied the correlation by first collecting a total of 79

27
mature female pupae from three lakes then weighing and dissecting the eggs from these
pupae (Butler & Walter, 1992). Together, these studies indicate that assessing the number
and size of emergent pupal chironomids permits one to infer larval growth rate and to
predict wetland productivity, and ultimately potential adult fecundity.
Toxicity of Oil Sands Process Water
As discussed previously, fresh oil sands process water (OSPW) is toxic to chironomids
(Whelly, 1999). In a 10-d bioassay, the LC50 of OSPW from a tailings pond to
Chironomus dilutus occurred at a dilution of approximately 65% OSPW: 35% reference
water (Whelly, 1999). The principal toxic constituent in fresh OSPW is thought to be
some component of naphthenic acids (Schramm et al., 2000), which is a complex mixture
of carboxylic compounds (Grewer et al. 2010). However, this toxicity is expected to
decrease over time as naphthenic acids are readily degraded by microorganisms (Del Rio
et al., 2006; Frank et al., 2008; Toor 2012). However, naphthenic acids are not the only
toxic component in OSPW. Because the Athabasca oil sand deposit is derived from
marine sediment, process water becomes enriched in salts during the extraction process.
Thus, OSPW contains elevated concentrations of sodium (~500-700 mg/L), bicarbonate
(~470-950 mg/L), chloride (~75- 550 mg/L), and sulphate (~200-300 mg/L) (Allen,
2008) typically resulting in conductivity of 1113 to 2400 uS (MacKinnon & Sethi, 1993).
These salts can impair growth and survival of aquatic plants and other organisms. When
multivariate statistical analyses were used to separate effects of naphthenic acids and
elevated conductivity in OSPW, Leung et al. (2001) found that phytoplankton
communities were more strongly affected by high conductivity. Chironomus plumosus is
unable to osmoregulate and is therefore intolerant of salinities greater than the internal

28
salinity (Lauer, 1969). Salt stress has also been shown to negatively affect emergence.
Bervoets et al. (1996) observed significantly lower emergence of C. riparius from high
salinity water (12 ppt) than in fresh water. Although most Chironomus species appear to
be salt-intolerant (Cannings & Scudder, 1978), the genera of Chironomidae are
differentially sensitive to salt. For instance, Whelly (1999) found that Tanytarsus,
Derotanypus, and Cricotopus were dominant in salty, OSPW-affected wetlands. Of these,
only Derotanypus was completely absent in low-conductivity reference wetlands, making
it an indicator of saline conditions (Whelly, 1999).
Objectives
The objectives of this study were to determine 1) whether OSPW-affected wetlands are as
productive as reference wetlands by monitoring emergent pupal Chironomidae abundance
and size; 2) if different OSPW-affected wetlands support different chironomid
community assemblages than reference wetlands; 3) if particular assemblages of
emergent chironomid genera can be accounted for by specific physicochemical factors.
Methods
Study Area and Wetlands
The study wetlands were all located in the Athabasca oil sands region north of Fort
McMurray, AB. Four OSPM-affected wetlands were studied - “4-m CT”, “Mike’s Pond”,
“Natural Wetland”, and “Test Pond 9”. Five reference wetlands were used in this study
named “High Sulphate”, “North West Interceptor Ditch” or “NWID”, “V-Notch Weir”,
“Shallow Wetland”, and “Suncor Pond 5 Wetland”. The details of these wetlands and
dates sampled are described in Table 2.1.

29

30
Table 2.1: Description of wetlands used in this study.
Wetland
Name
Class Substrate Organic
carbon
class
Water Age in
2010
(years)
Location
(UTM
Coordinates)
Property Sampling Dates
(dd/mm/yyyy) –
Dates marked (*)
used in analyses
4-m CT OSPW Four meters
of
consolidated
tailings with
small shallow
areas
containing
peat.
Rich Suncor Oil
sands
process
water.
13 0467670,
6316509
Suncor
Energy
06/07/2009*,
17/06/2010,
24/06/2010.
Mike’s
Pond
OSPW Clay. Poor Syncrude
Consolidat
ed tailings
oil sands
process
water.
18 0458752,
6330013
Syncrude
Canada
Ltd.
23/06/2009*.
Natural
Wetland
OSPW Sand and 15
cm peat
mineral mix.
Rich Suncor Oil
sands
process
water
(seepage)
>24 0468962,
6315305
Suncor
Energy
25/07/2009*,
17/06/2010,
24/06/2009.
Test Pond 9 OSPW Clay. Poor Oil sands
process
water
17 0458007,
6326993
Syncrude
Canada
Ltd
06/07/2009*,
16/06/2010,
24/06/2010,
29/06/2010.

31
High
Sulphate
Constructed
Reference
Sodic
overburden
and 15 cm
peat.
Rich Fresh (but
may be
contamina
ted by
seepage
from lean
oil sands
26 0466395,
6317235
Off-site 25/07/2009*,
17/06/2010,
25/06/2010.
North West
Interceptor
Ditch
(NWID)
Constructed
Reference
Sodic
overburden
Rich Fresh 18 0458147,
6330045
Syncrude
Canada
Ltd.
23/06/2009*.
Shallow
Wetland
Constructed
Reference
Sodic
overburden
Poor Fresh 18 0458126,
6326649
Syncrude
Canada
Ltd.
06/07/2009*,
16/06/2010,
23/06/2010,
29/06/2010.
V-Notch
Weir
Constructed
Reference
Peat Rich Fresh 10 0467653,
6316221
Suncor
Energy
24/06/2010*.
Pond 5
Wetland
Reference
that
developed
opportunist-
ically
Sodic
overburden
Poor Fresh <7 0466472,
6319087
Suncor
Energy
06/07/2009*.

32
Field Methods
Pupal emergence traps were built from polyvinyl chloride (PVC) piping (26 mm ID x 3
mm) bent into a circle to create floating hoops 30 cm in diameter (Swisterski et al.,
2006). Acetate sheets (11 cm wide) were stapled around the circumference of the hoop to
provide a barrier against the wind and waves. Each wetland was sectioned radially into
five equal areas, and one hoop was placed in an open expanse of water at the boundary
between the emergent and submergent vegetation zone of each area at a water depth of
approximately 40 cm. Three 25-cm long bamboo stakes driven into the sediment were
used to secure each hoop in place (Fig. 2.1, Fig 2.2). Then, a small aquarium net was
used to clear the surface of the water of any debris. Material floating on the water surface
within the area circumscribed by the hoop was collected after 24 h by gently sweeping
the surface of the water with a 0.4-mm mesh aquarium net. The net was inverted into a
jar, and 70% ethanol was poured through the net and into the jar. The net was inspected
for any remaining exuviae adhering to the mesh, and then more ethanol was poured into
the jar. At the time of collection, water pH, conductivity, temperature, and salinity were
measured with a YSI model 556MPS meter. Preliminary data indicated that there was
very little within-wetland variability in these measures. Consequently, only one set of
measurements per wetland per sampling date was taken.

33
Figure 2.1: Photo of floating hoop emergence traps (Photo by K. Jurkowski, 2009)
Hoop diameter is 30 cm.

34
Figure 2.2: Schematic diagram of floating hoop emergence trap (from Swisterski et
al., 2006).
Bamboo Canes
Acetate Film
¾” White Plastic
Piping

35
Water samples were also taken for later analysis of NA, major ions, dissolved organic
carbon, and other water quality characteristics. Analyses were performed by the Syncrude
Canada, Ltd. analytical lab. In cases where current data were not available, 2008 data was
used instead (see appendix A for all water quality results). If rain occurred during any 24-
h sampling period, exuviae were not collected, and hoops were deployed again until dry
weather conditions were met.
Laboratory Methods
When samples were brought back to the lab, jar contents were poured through a small
250-µm sieve and emptied into a Petri plate containing water. Exuviae were then counted
and sorted beneath a dissecting microscope, placed in a petri dish with glycerin to reduce
movement, and photographed using a mounted digital camera. ImageTool 3.0©
software
(UTHSCSA, San Antonio, TX) was then used to digitally determine the length of each
exuvia from the images.
Exuviae were mounted on labeled glass microscope slides with a drop of CMC-9AF
mounting medium (Masters Chemical Co., Wood Dale, IL), covered with a cover slip,
allowed to dry, and the edges of the cover slip were sealed with nail polish. Pupae were
identified to genus or species where possible using the keys of Wiederholm (1986).

36
Data Analysis
Statistical analyses were performed using STATISTICA 7 software (Statsoft, Inc., Tulsa,
OK). Differences in mean abundance and mean pupal length between wetland classes
(OSPM vs. reference) were compared by one-way ANOVA. Data were log transformed
to meet the assumption of equal variances. A type I error value of 0.05 was chosen to
determine whether wetland classes were significantly different. The influence of various
water quality parameters (dissolved oxygen, conductivity, salinity, temperature,
naphthenic acid concentration, and dissolved organic carbon) on mean abundance and
mean length was estimated using forward stepwise multiple regression. A stepwise
procedure was used to distinguish among the effects of independent variables that tended
to be correlated among themselves (e.g., conductivity and NA concentration).
For diversity data, richness was compared between wetland classes using one-way
ANOVA. The relative abundance of each genus within each wetland was expressed as a
percentage and transformed to octaves (log2 +1) to reduce the dominance of the most
common taxa (Gauch 1972). Genera that occurred in two or fewer wetlands were
discarded from further analysis. The transformed relative abundance data were then
analysed by Principal Components Analysis (PCA) in order to reduce the number of
variables/genera to a few independent principal components (e.g. Leonhardt, 2003; Barr,
2009). Components were rotated using varimax raw rotation. Multiple regression
analyses were then performed to determine relationships between the principal

37
component scores of the chironomid emergence data (dependent variables) and water
quality parameters (temperature, dissolved oxygen, naphthenic acid concentration,
salinity, and conductivity – independent variables).
Results
Abundance of Exuviae
On average, about twice as many exuviae per hoop were collected from OSPM wetlands
than from reference wetlands (mean ± SE was 10.4 ± 6.1 (n=4) for OSPM wetlands vs.
5.1 ±1.9 for reference wetlands (n=5) per 732 cm2 hoop). The difference was almost
entirely attributable to the large numbers of exuviae collected in Test Pond 9. Because
there was marked among-wetland variation in abundance (Fig 2.3) the difference was not
statistically significant (p=0.44). There were no significant differences in abundance
among all nine wetlands (p=0.13; n=9; one-way ANOVA, Fig. 2.4).

38
Wetland Type
Mean
Nu
mb
er o
f E
xu
via
e P
er H
oop
OSPM Reference0
2
4
6
8
10
12
14
16
18
Figure 2.3: Mean (± SE) number of exuviae per 732 cm2 hoop for 4 OSPM-affected
wetlands and 5 reference wetlands.

39
Wetland
Nu
mb
er o
f E
xu
via
e P
er H
oo
p
4mCT
Mike's Pond
Natural
TP9
High Sulphate
NWID
Pond 5
Shallow
Vnotch0
10
20
30
40
50
60
OSPM
Reference
Figure 2.4: Mean (± SE; n=5) number of exuviae per 732 cm2 hoop in study
wetlands.

40
Size of Exuviae
There was no significant difference in mean exuviae length between OSPM wetlands and
reference wetlands (p=0.13; n=4 OSPM wetlands and n=5 reference wetlands; one-way
ANOVA; Fig.2.5). However, there was significant heterogeneity in mean exuvia length
among wetlands (p<0.001; n=9; one-way ANOVA; Fig. 2.6).
Richness
There was no significant difference between OSPM and reference wetlands in richness of
genera (p>0.05; n=4 OSPM wetlands and 5 reference wetlands; one-way ANOVA; Fig.
2.7).

41
Wetland Type
Mea
n L
ength
(m
m)
OSPM Reference0
1
2
3
4
5
6
7
Figure 2.5: Mean exuviae length (± 1 SE) for four OSPM-affected wetlands and five
reference wetlands (p=0.13).

42
Wetland
Len
gth
(m
m)
4mCT
Mike's Pond
Natural
TP9
High Sulphate
NWID
Pond 5
Shallow
Vnotch0
1
2
3
4
5
6
7
8
OSPM
Reference
Figure 2.6: Mean exuviae length (± 1 SE) graphed by wetland.

43
Figure 2.7: Genus richness in OSPM and reference wetlands.

44
Water Chemistry
Water chemistry measured at the time of sample collection included dissolved oxygen
(mg/L), temperature (˚C), conductivity (μS/cm), and salinity (ppt). Naphthenic acid
concentrations (mg/L) and dissolved organic carbon (mg/L) values from previous years
were used to supplement the data set. Organic level (peat or no peat) was included as a
categorical variable in the data set (present (1) or absent (0), depending on whether or not
a layer was placed over the inorganic sediments during wetland construction). Water
quality data are summarized in Appendix A.
The forward stepwise regression of the water chemistry data on the mean abundance of
exuviae revealed no significant relationships (n=9, p=0.23, R2= 0.20, with dissolved
oxygen as the only step). However, the forward stepwise regression of water chemistry
data on mean exuviae length revealed a significant relationship with dissolved organic
carbon (n=9, p=0.015, R2=0.67).
Composition of Emergent Chironomidae
Thirty genera were identified from among the 300+ exuviae examined from the nine
study wetlands (Appendix B). Twenty-two genera were relatively rare, occurring in only
one or two wetlands. Common genera (those that were present in three or more
wetlands) belonged to the subfamlies Tanypodinae (Ablabesmyia, Guttipelopia,

45
Neozavrelia, Procladius, Tanypus), Chironominae (Einfeldia, and Tanytarsus) and
Orthocladiinae (Paracricotopus,).
Covariation in relative abundances among the 8 common genera in the study wetlands
was summarized by principal component analysis (PCA) of the octave-transformed
values. Four principal components (PCs) with eigenvalues >1.0 were derived and,
together, they explained 84% of the variance in the data set (Table 2.2). The relative
abundance of Einfeldia was positively correlated with PC-I whereas relative abundances
of Neozavrelia and Paracricotopus were negatively correlated with this principal
component (Table 2.3). Relative abundances of Ablabesmyia and Tanytarsus were
positively and negatively correlated with values of PC-II, respectively. The relative
abundances of both Procladius and Tanypus were positively correlated with PC-III,
whereas Guttipelopia relative abundance was negatively associated with PC-IV.
Scatterplots of where each wetland falls with respect to each PC indicate that there was
no obvious grouping of wetland type with respect to community composition (Figures 2.8
and 2.9).
Forward stepwise regression was performed on the PC scores for each of the four
principlal compoents using water quality data (Table 2.4). Scores of PC-I were
significantly negatively correlated with temperature (p= 0.002) and significantly
positively correlated with dissolved organic carbon (p= 0.023). Values of PC-II were

46
significantly negatively correlated with dissolved oxygen (p= 0.034) and conductivity (p=
0.045). The scores of PC-III and PC-IV were not significantly correlated with any of the
water quality parameters.

47
Table 2.2: Descriptions of four principal components derived log percent abundance
of eight dominant emergent chironomid genera.
Eigenvalue Variance Explained
(%)
Cumulative
Variance Explained
(%)
PCI 2.559 32.0 32.0
PCII 1.721 21.5 53.5
PCIII 1.252 15.7 69.1
PCIV 1.162 14.5 83.7
Table 2.3: PC loadings for each of the eight dominant genera. Loadings greater than
|0.6| are bold faced.
Genus PCI PCII PCIII PCIV
Neozavrelia -0.87 0.03 -0.02 0.01
Paracricotopus -0.68 0.36 -0.25 0.01
Einfeldia 0.66 0.11 0.17 0.58
Ablabesmyia -0.28 0.89 -0.05 0.15
Tanytarsus -0.51 -0.74 -0.01 0.12
Procladius 0.01 -0.13 0.96 -0.17
Tanypus 0.26 0.19 0.74 0.49
Guttipelopia 0.04 -0.02 0.08 -0.94
Explained
Variance 2.07 1.53 1.58
1.52
% of Total
Variance
Explained
25.8 19.1 19.7
19.0

48
Figure 2.8: Wetlands graphed according to PCI and PCII scores.

49
Figure 2.9: Wetlands graphed according to PC III and PCIV scores.

50
Table 2.4: Results of a forward stepwise multiple regression of conductivity, salinity,
naphthenic acid concentration, dissolved oxygen (D.O.), dissolved organic carbon
(D.O.C.), and temperature on PCA scores. Statistically significant p-values (<0.05)
are indicated by an asterisk (*).
PC-I
R2= 0.898, N= 9, p= 0.006
Regression
Coefficient
S.E. of
Regression
Coefficient
Partial R2
t-value p-value
Intercept 10.06 1.642 6.127 0.002*
Temperature
(C) -0.497 0.083 0.654 -6.035 0.002*
Organic
Level 0.965 0.296 0.137 3.256 0.023*
DOC (mg/L) -0.015 0.006 0.107 -2.301 0.070
PC-II
R2= 0.798, N= 9, p= 0.034
Regression
Coefficient
S.E. of
Regression
Coefficient
Partial
R2
t-value p-value
Intercept 1.723 0.793 2.172 0.082
DO (mg/L) -0.218 0.076 0.510 -2.881 0.034*
Conductivity -0.001 0.001 0.179 -2.650 0.045*
DOC (mg/L) 0.021 0.013 0.109 1.648 0.160

51
Discussion
Exuvial abundance and size were similar between wetland types, indicating that overall
production was equivalent among wetlands, at least within the areas and at the times
sampled. The abundance of chironomids emerging from OSPW wetlands was much
more variable than abundance of chironomids emerging from reference wetlands but this
is largely due to Test Pond 9 data. Swisterski et al. (2006) used the same hoops and found
a mean (±S.E.) of 37 (± 5) chironomid pupal exuviae per hoop across 18 samples, which
exceeds the mean of this study (7.5 ± 3.0); however, she studied only one wetland
(Natural Wetland). The chironomids that emerged from reference wetlands tended to be
smaller than chironomids that emerged from OSPW wetlands, but the trend was not
statistically significant. The apparent similarity in productivity, as measured by
abundance and size at time of emergence, between OSPW wetlands and reference
wetlands suggests that overall productivity was similar between wetland classes, which
implies similarity at other stages of the life cycle. Adult fecundity is highly correlated
with pupal size (Butler and Walker 1992) and larval growth rate correlates with
emergence success (Liber et al. 1996). One factor that may explain the lack of
relationship between wetland type and emergence is their relatively older age. The
OSPW wetlands were 13 to 24 years old. Perhaps toxicity of the OSPW with which the
reclaimed wetlands were originally filled has decreased over time, or the chironomids
present are tolerant of the water quality in those wetlands. Leonhardt (2003) predicted
that community composition of reference and OSPW-affected wetlands would become

52
indistinguishable after approximately 18 years. However, water quality data suggests that
the conductivity has not changed much over time. The conductivities of the OSPW
wetlands, all of which were >10 years old remained high. Another explanation for the
high variability is that the limited dudration of sampling was not representative of
emergence over the season. Different species emerge at different times throughout the
year, so a 24-h emergence trap collection provides only a small snapshot of the
community emerging and may be subject to bias in size and abundance of chironomids.
Assessing emergence over the entire season could indicate how the timing of emergence
might vary with respect to wetland characteristics.
In general, emergent chironomid abundance is positively correlated with the volume of
submerged aquatic vegetation (e.g. Gerking 1957, Darby 1962, Krul 1970). Pondweed
(Potamogeton pectinatus), in particular, offers a habitat with greater surface area for
colonization than emergent vegetation such as cattail (Typha latifolia) (Wrubleski 1987).
By observation, wetlands in this study with very little submerged aquatic vegetation, such
as Mike’s Pond, supported fewer emergent chironomids than wetlands with a greater
abundance of submerged aquatic vegetation such as Test Pond 9 and High Sulphate.
When analyzing water chemistry data that may have influenced chironomid pupal size
and abundance, the only significant relationship detected was between mean length (mm)
and dissolved organic carbon (mg/L). This may reflect a difference food quality.
Chironomids predominantly feed on detritus, and high dissolved organic carbon can

53
result in greater bacterial biomass, which is an important, nutritious component of
detritus (Boon, 2006; Daly, 2007). Therefore, it is logical that dissolved organic carbon
and chironomid size are correlated with one another.
The PCA and forward stepwise multiple regressions on the PCA scores (dependent
variables) using the water quality parameters (independent variables) indicated that the
relative abundance of Einfeldia, as summarized by PC1, was negatively associated with
temperature and positively associated with organic level (peat presence or absence); the
presence of Neozavrelia, also summarized by PC1, was positively associated with
temperature and negatively associated with organic level; relative abundance of
Paracricotopus, the third genus summarized by PC1, was positively associated with
temperature and negatively associated with organic level; Ablabesmyia, as summarized
by PCII, had negative relationships with both dissolved oxygen and conductivity; and
finally, the relative abundance of Tanytarsus, as summarized by PCII, was positively
associated with both dissolved oxygen and conductivity. There were no consistent results
regarding community assemblages that were specific to one wetland class (OSPW versus
reference) or the other.
Certain assemblages of Chironomidae are usually so closely associated with conductivity
that they are used to infer lake history (Walker et al. 1995). Walker et al. (1995) analyzed
the chironomid community in 86 British Columbia lakes of varying salinities. Einfeldia

54
are burrowers, so the presence of organic material could make the habitat at the sediment
level more favourable—this could explain the positive relationship we see with organic
level. Relative abundances of both Neozavrelia and Paracricotopus were negatively
associated with organic level. Ablabesmyia is a predacious chironomid and since it does
not feed on detritus directly, as the other common genera do, this could explain the lack
of relationship with organic level. Only two of the common genera exhibited a significant
relationship with conductivity; Ablabesmyia relative abundance was negatively related to
conductivity, and Tanytarsus relative abundance was positively related. This indicates
that Tanytarsus is a salt-tolerant genus whereas Ablabesmyia is salt-intolerant. Similar
relationships were found between these two genera and dissolved oxygen; Ablabesmyia
had a negative relationship with dissolved oxygen levels whereas Tanytarsus exhibited a
positive relationship. Whelly (1999) found that Tanytarsus was a common genus in both
OSPW and reference wetlands. However, Tanytarsus was the only predominant genus
found in common between the study by Whelly (1999) and the present study. It is
noteworthy that Derotanypus, whose occurrence is strongly associated with elevated
salinity (Walker et al., 1995; Whelly, 1999) was not collected on the sampling dates of
this study. Clearly, examination of trends throughout the emergence season would
strengthen the conclusions of this study.
Conclusion
It appears that reclaimed wetlands affected by OSPW and other process materials do not
significantly differ in the abundance of chironomids emerging or the size at time of

55
emergence over the time period sampled. Reference wetland waters supported
chironomids with smaller pupae than did OSPW wetlands. This may be a function of the
species present. Dissolved organic carbon concentration was significantly correlated with
mean length of chironomid pupae; this is likely related to better food quality in wetlands
with high dissolved organic carbon. Differences in chironomid community among
wetlands did not correspond to wetland class (OSPW versus reference wetlands), but the
relative abundances of certain genera tended to be correlated with some water quality
parameters; of particular interest was that Ablabesmyia was relatively uncommon in
wetlands with high conductivity whereas Tanytarsus were most abundant in high
conductivity conditions.

56
References
Allen, E.W. 2008. Process water treatment in Canada’s oil industry: I. Target pollutants
and treatment objectives. Journal of Environmental Engineering and Science 7: 123-138.
Batzer, D. P., M. McGee, V.H. Resh, and R.R. Smith. 1993. Characteristics of
invertebrates consumed by mallards and prey response to wetland flooding schedules.
Wetlands 13: 41-49.
Barclay, R.M.R. 1985. Long- versus short-range foraging strategies of hoary (Lasiurus
cinereus) and silver-haired (Lasionycteris noctivagans) bats and the consequences for
prey selection. Canadian Journal of Zoology 63: 2507-2515.
Barr, L. 2009. Influence of consolidated mine tailings and oil sands process water on
colonization potential of aquatic invertebrates of constructed wetlands in the Athabasca
oil sands, Alberta. M.Sc. Thesis, University of Windsor, Windsor Ontario.
Bervoets, L., C. Wils, and R. Verheyen. 1996. Tolerance of Chironomus riparius larvae
(Diptera: Chironomidae) to salinity. Bulletin of Environmental Contamination and
Toxicology 57: 829-835.
Boon, P. I. 2006. Biogeochemistry and bacterial ecology of hydrologically dynamic
wetlands. pages 125-126 In Ecology of Freshwater and Estuarine Wetlands edited by
Batzer, D.P., and Sharitz, R.R. University of California Press.
Butler, M.G., and L. Walker. 1992. Fecundity, reproductive effort, and pupal size in the
profundal midge Chironomus cucini (Diptera: Chironomidae). Netherlands Journal of
Aquatic Ecology 26: 263-267.
Cannings, R.A., and G.G.E. Scudder.1978. The littoral Chironomidae (Diptera) of saline
lakes in central British Columbia. Canadian Journal of Zoology 56: 1144-1155.
Daly, C. 2007. Carbon sources, microbial community production, and respiration in
constructed wetlands of the Alberta, Canada oil sands mining area. M.Sc. Thesis.
University of Windsor, Windsor, ON.
Darby, R.E. 1962. Midges associated with California rice fields, with special reference to
their ecology (Diptera: Chironomidae). Hilgardia 32: 1-206.
Del Rio, L. F., A.K.M. Hadwin, L.J. Pinto, M.D. MacKinnon, and M.M. Moore. 2006.

57
Degradation of naphthenic acids by sediment micro-organisms. Journal of Applied
Microbiology 101: 1049-1061.
Ferrington, L.C., M. Blackwood, and C.A. Wright. 1991. A protocol for using surface-
floating pupal exuviae of Chironomidae for rapid bioassessment of changing water
quality. Sediment and Stream Water Quality in a Changing Environment: Trends and
Explanation 203: 181-190.
Frank, R. A., R. Kavanagh, B.K. Burnison, G. Arsenault, J.V. Headley, K.M. Peru, G.
Van Der Kraak, and K.R. Solomon. 2008. Toxicity assessment of collected fractions
from an extracted naphthenic acid mixture. Chemosphere 72: 1309-1314.
FTFC (Fine Tailings Fundamentals Consortium). 1995. “Volume II: Fine Tails and
Process Water Reclamation” In: Advances in Oil Sands Tailings Research, Alberta
Department of Energy, Oil Sands and Research Division, Edmonton, Alberta.
Gerking, S.D. 1957. A method of sampling the littoral macrofauna and its application.
Ecology 38: 219-226.
Hershey, A. 1985. Effects of predatory sculpin on the chironomid communities in an
arctic lake. Ecology 66: 1131-1138.
Jackson, J.K., and S.G. Fisher. 1986. Secondary production, emergence, and export of
aquatic insects of a sonoran desert stream. Ecology 67: 629-638.
Lauer, G.J. 1969. Osmotic regulation of Tanypus nubifer, Chironomus plumosus, and
Enallagma clausum in various concentrations of saline lake water. Physiological Zoology
42: 381-387.
Leonhardt, C. L. 2003. Zoobenthic succession in constructed wetlands of the Fort
McMurray oil sands region: developing a measure of zoobenthic recovery. M.Sc. Thesis,
University of Windsor, Windsor, ON.
Leung, S.S., M.D. MacKinnon, and R.E.H. Smith. 2001. Aquatic reclamation in the
Athabasca, Canada, oil sands: naphthenate and salt effects on phytoplankton
communities. Environmental Toxicology and Chemistry 20: 1532-1543.
Liber, K., D.J. Call, T.D. Dawson, F.W. Whiteman, and T. Dillon. 1996. Effects of
Chironomus tentans larval growth retardation on adult emergence and ovipositing
success: implications for interpreting freshwater sediment bioassays. Hydrobiologia 323:
155-167.

58
Krull, J.N. 1970. Aquatic plant- macroinvertebrate associations and waterfowl. Journal of
Wildlife Management 34: 707-718.
MacKinnon, M.D., and A. Sethi. 1993. A comparison of the physical and chemical
properties of the tailings ponds at the Syncrude and Suncor oil sands plants. In
Proceedings of Our Petroleum Future Conference, Alberta Oil Sands Technology and
Research Authority (AOSTRA), Edmonton, Alta.
Pascoe, D., K.A. Williams, and D.W.J. Green. 1989. Chronic toxicity of cadmium to
Chironomus riparius Meigen -- effects upon larval development and adult emergence.
Hydrobiologia 175: 109-115.
Rehfisch, M. M. 1994. Man-made lagoons and how their attractiveness to waders might
be increased by manipulating the biomass of an insect benthos. Journal of Applied
Ecology 31: 383-401.
Schramm, L.L., E.N. Stasiuk, and M.D. MacKinnon. 2000. Surfactants in Athabasca oil
sands slurry conditioning, flotation recovery, and tailings processes. pp. 365-430 In:
Schramm, L.L. (Ed.),Surfactants: Fundamentals and Applications in the Petroleum
Industry. Cambridge University Press, Cambridge,
Sharitz, R. R., and S.C. Pennings. 2006. Development of wetland plant communities. Pp.
125-126 In: Batzer, D.P. and R.R. Sharitz (eds.) Ecology of Freshwater and Estuarine
Wetlands. University of California Press, Berkeley, California, USA.
Slama, C. 2010. Sediment oxygen demand of wetlands in the oil sands region of North-
eastern Alberta. M.Sc. Thesis, University of Windsor, Windsor, ON
Swisterski, A., Ciborowski, J.J.H., Wytrykush, C.M., and Beierling, C. 2006. A novel
approach to assess chironomid (Diptera: Chironomidae) community composition in the
Athabasca oil sands region. Proceedings of the 32nd Annual Toxicity Workshop,
Waterloo, ON. October 2005. Canadian Technical Report of Fisheries and Aquatic
Science. 2617: 43.
Toor, N.S. 2012. Degradation and aquatic toxicity of oil sands naphthenic acids using
simulated wetlands. Ph.D. Dissertation.,University of Saskatchewan, Saskatoon, SK.
Walker, I.R., S.E. Wilson, and J.P. Smol. 1995. Chironomidae (Diptera): quantitative
paleosalinity indicators for lakes of western Canada. Canadian Journal of Fisheries and
Aquatic Sciences 52: 950-960.
Whelly, M.P. 1999. Aquatic invertebrates in wetlands of the oil sands region of northeast
59
Alberta, Canada, with emphasis on Chironomidae (Diptera). M.Sc. Thesis, University of
Windsor, Windsor, ON.
Wiederholm, T. 1986. Chironomidae of the holarctic region: part II: pupae. Entomologica
Scandinavica, Supplement No. 28.
Wrubleski, D.A. 1987. Chironomidae (Diptera) of peatlands and marshes in Canada.
Memoirs of the Entomological Society of Canada 140: 141-161.

60
CHAPTER III
GROWTH RATE AND SURVIVAL OF CHIRONOMUS RIPARIUS WHEN
EXPOSED TO OIL SANDS PROCESS-AFFECTED WETLAND WATER IN
A 10-D BIOASSAY
Introduction
Chironomids play an important role in ecosystems by providing food for higher trophic
level organisms (Batzer et al., 1993) and by linking terrestrial and aquatic components of
the food web. They are abundant and ubiquitous in water bodies, making them a highly
applicable study group (Pascoe et al. 1989). In this study, Chironomus riparius larvae
were used to assess the interaction of two key toxicants found in oil sands process
waters—naphthenic acids and salts—and their individual and combined effects on larval
biomass and survival.
The Use of Field Level Bioassays
Laboratory bioassays are useful in assessing toxicity because they are controlled, i.e.,
responses to the variable of interest are not confounded by the many factors that influence
growth and survival under field conditions. However, results from a laboratory bioassay
may not be fully transferable to the field precisely because natural variability in factors
such as temperature, dissolved organic carbon, environmental heterogeneity, and the
effects of other species may alter the organism’s response. Whole-effluent toxicity
(WET) testing provides a holistic, environmentally-realistic test that can integrate many
61
interactions of contaminants (Chapman, 2000). This makes whole effluent toxicity testing
especially appropriate for determining toxicity in the wetlands of the oil sands region.
Wetland Reclamation in the Athabasca Oil Sands
As part of the lease agreement with the Alberta government, all leased land must be
functionally restored to a level of productivity equivalent to what it was before mining
took place (FTFC, 1995). Therefore, terrestrial and aquatic reclamation strategies have
become an important-- and necessary-- stage of mine closure. Due to the nature of the
bitumen extraction process, large volumes of fluid tailings material are generated by the
oil sands refining process. Since wetland area comprised 20-40% of the pre-mining
landscape (FTFC, 1995), constructing wetlands that incorporate this tailings material and
the associated mine process water has become a major goal of landscape reclamation.
With the goal of reclamation research in mind, Syncrude Canada Ltd. and Suncor Energy
both constructed a series of demonstration OSPM (oil sands process material)-affected
and reference wetlands. Natural wetlands that formed opportunistically in the area are
also used in this study.
Two components of OSPW can be particularly toxic to aquatic biota—naphthenic acids
and salts (Allen 2008, Leung et al. 2001), both of which occur naturally in the oil sands
ore but become concentrated by the mining process. Naphthenic acids are a complex
mixture of alkyl-substituted carboxylic acids (Holowenko et al., 2002). Due to their
surfactant nature, naphthenic acids are expected to cause respiratory stress to
chironomids, whereas high ionic concentrations may affect osmoregulation. There is

62
evidence, however, that there may be an antagonistic relationship between these two
compounds (Turcotte et al., 2009). Although studies on the interaction between
naphthenic acids and salts are scarce, an antagonistic interaction between other
surfactants and salts has been documented in bluegill (Hokanson & Smith, 1971) and
goldfish (Gafa Riv, 1974). The reason for this is likely due to precipitation of the
surfactant out of solution caused by interactions with bivalent cations (e.g. Ca2+
and
Mg2+
), which causes a reduction in bioavailability (Verge et al. 2001).
Whelly (1999) conducted a 10-d dilution series bioassay of OSPW with several
populations of Chironomus. He found that fresh OSPW reduced survival and growth. The
LC50, that is, the lethal concentration for 50% of organisms, was found to be
approximately 65% OSPW (Whelly, 1999), which would correspond to an NA
concentration of approximately 32 mg/L given the concentrations of the source process
water around the time of the study (Holowenko et al., 2002).
The majority of OSPW or OSPM-affected wetlands in the area contain both NA and salts.
As wetland waters age, naphthenic acid concentrations tend to decline over time due to
microbial degradation (Del Rio et al. 2006; Frank et al. 2008), but salinity should remain
relatively unchanged in the closed systems of constructed study wetlands.
The goal of this study was to determine what toxic effects, if any, are associated with
naphthenic acids and salinity. Survivorship and growth rate of C. riparius in wetland
water that contains a range of naphthenic acids (NAs) and conductivities was studied.
63
Wetland waters used as replicates in toxicity bioassays as opposed to a dilution series is a
novel and highly applicable approach to the question at hand.
It was expected that there would be significant negative relationships between survival
and conductivity, biomass and conductivity, survival and NA concentration, and biomass
and NA concentration. Both salts and NAs were expected to pose lethal and sublethal
toxicity to C. riparius larvae, resulting in lower survival and lower final biomass due to
reduced growth rate. However, salts and NAs were expected to react antagonistically and
yield higher survival and biomass than if their individual effects were added together.
This was expected to be reflected in a positive interaction term in the multiple regression
on conductivity and NA concentration with both biomass and survival as dependent
variables. This antagonism between salts and NAs has been demonstrated in preliminary
studies on Ceriodaphnia dubia by Turcotte et al. (2009). Other surfactants have also been
shown to interact antagonistically with salts (Hokanson & Smith, 1971; Gafa Riv, 1974).
Methods
Organism Origin and Maintenance
Chironomus riparius eggs were provided from a culture maintained at the National Water
Research Institute of Environment Canada (Burlington, ON). One set of eggs was used
immediately for studies conducted in July 2009. Another set of eggs was used to generate
a self-sustaining culture maintained at the University of Windsor following Environment
Canada protocols. Studies conducted during July 2010 used first instar larvae hatching
from egg masses derived from the University of Windsor daughter culture.

64
Study Wetlands
Twelve wetlands were selected for this experiment. Wetlands were chosen to represent a
broad range of combinations of naphthenic acids (NA) and conductivities. Conductivity
was chosen over Total Dissolved Solids (TDS) in this case because insufficient data were
available to characterise the concentration of major ions prior to the experiment. Each
wetland’s class, age, conductivity, concentration of NA, major ions (when data were
available), and UTM coordinates are listed in Table 3.1.
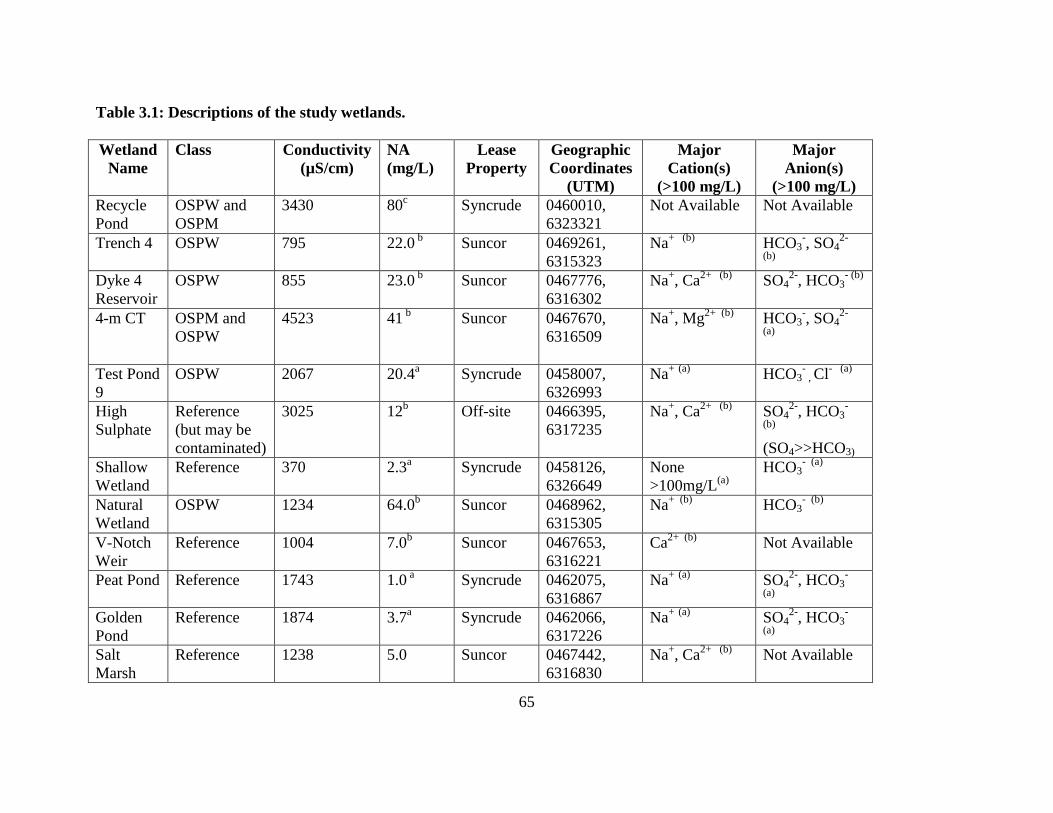
65
Table 3.1: Descriptions of the study wetlands.
Wetland
Name
Class Conductivity
(µS/cm)
NA
(mg/L)
Lease
Property
Geographic
Coordinates
(UTM)
Major
Cation(s)
(>100 mg/L)
Major
Anion(s)
(>100 mg/L)
Recycle
Pond
OSPW and
OSPM
3430 80c
Syncrude 0460010,
6323321
Not Available Not Available
Trench 4 OSPW 795 22.0 b
Suncor 0469261,
6315323
Na+
(b) HCO3
-, SO4
2-
(b)
Dyke 4
Reservoir
OSPW 855 23.0 b
Suncor 0467776,
6316302
Na+, Ca
2+ (b) SO4
2-, HCO3
- (b)
4-m CT OSPM and
OSPW
4523 41 b
Suncor 0467670,
6316509
Na+, Mg
2+ (b) HCO3
-, SO4
2-
(a)
Test Pond
9
OSPW 2067 20.4a
Syncrude 0458007,
6326993
Na+ (a)
HCO3- , Cl
-
(a)
High
Sulphate
Reference
(but may be
contaminated)
3025 12b
Off-site 0466395,
6317235
Na+, Ca
2+ (b) SO4
2-, HCO3
-
(b)
(SO4>>HCO3)
Shallow
Wetland
Reference 370 2.3a
Syncrude 0458126,
6326649
None
>100mg/L(a)
HCO3- (a)
Natural
Wetland
OSPW 1234 64.0b
Suncor 0468962,
6315305
Na+ (b)
HCO3-
(b)
V-Notch
Weir
Reference 1004 7.0b
Suncor 0467653,
6316221
Ca2+ (b)
Not Available
Peat Pond Reference 1743 1.0 a
Syncrude 0462075,
6316867
Na+ (a)
SO42-
, HCO3-
(a)
Golden
Pond
Reference 1874 3.7a
Syncrude 0462066,
6317226
Na+ (a)
SO42-
, HCO3-
(a)
Salt
Marsh
Reference 1238 5.0 Suncor 0467442,
6316830
Na+, Ca
2+ (b) Not Available

66
Mildred
Lake
Reference 331 0.9 Syncrude 0463618,
6323259
Not Available Not Available
aMackinnon, 2008,
bMartin, 2011,
cBirks, 2010.

67
Bioassay Procedures
This study was conducted over a two years. The first 10-d trial occurred in July 2009 and
the second 10-d trial occurred in July 2010. Egg masses were placed in Petri dishes filled
with dechlorinated tap water and checked daily for evidence of hatching. When first
instar chironomids hatched from the eggs, 20 planktonic larvae were collected using a
glass Pasteur pipette. In trial one, the chironomids were transferred to a 30-mL holding
vial containing dechlorinated tap water before they were gently poured into treatment
jars. In trial two, larvae were transferred directly from the Petri dish in which they
hatched into the treatment jar. For each egg mass, two sets of 20 larvae were preserved
per day to provide a measure of initial size.
New 1-L Mason jars were scrubbed with Fisherbrand Sparkleen detergent and tap water,
rinsed with tap water, then triple rinsed with deionized water. Coarse silica sand was used
as a substrate with 100 mL of sand in each jar which produced a depth of approximately 2
cm. Jars were then filled with 500 mL of wetland water, which had been filtered through
a 280-μm fabric sieve. Five replicate jars per wetland were used. Jars were kept in an
evaporation tank 120 cm in diameter filled with 7.5 cm of water to facilitate temperature
control. The experiment was done in an unheated trailer on Syncrude Canada Ltd’s
Mildred Lake site. Jars were aerated for a minimum of 24 h before the addition of larvae
and continuously thereafter throughout the study. A branched aeration method as
described in Corkum and Hanes (1989) was used. Dissolved oxygen, conductivity,
salinity, and pH were measured on days 1 and 0 of the experiments. Larvae were fed a
volume of slurry solution equivalent to 10 mg tropical fish flakes per jar, per day. After

68
10 d, larvae were removed by sieving the contents of each jar through a 250-um sieve and
using forceps to remove larvae. Larvae were preserved in chilled Carnoy’s solution (3:1,
ethanol: glacial acetic acid), which was changed 1 h and 24 h after initial preservation.
Laboratory Procedures
Survival was determined by counting the number of living larvae found after day 10.
Final chironomid size was determined by photographing each chironomid using a digital
camera mounted on a dissecting microscope. Images of larval length were then measured
digitally using ImageTool software. Biomass was then calculated from larval length using
the following conversion equation:
Biomass = 0.0018 x (Length)2.617
where biomass is in mg (dry mass) and length is in mm (Benke et al., 1999).
Statistical Analyses
Log-transformed survival ratio (survival divided by mortality plus one) and log-
transformed mean biomass across log-transformed NA concentrations and log-
transformed conductivities and the interaction term (i.e., the product of NA concentration
and conductivity) were analyzed by forward stepwise multiple regression. The class of
wetland from which source water was taken (OSPW or reference) and year were included
in the regressions as dummy variables, indicated in the model as 0 or 1. Linear regression
was also used to determine whether there was a relationship between length and
survival—in other words, a density-dependent effect. STATISTICA 7 software was used

69
for all statistical analyses and a p-value of less than 0.05 was considered statistically
significant.
Results
Survival of Chironomid Larvae
Results of the forward stepwise multiple regression of log-transformed survival ratio
(survival/mortality) versus log-transformed conductivity, log-transformed naphthenic
acid concentration, and their interaction term as well as the class and year dummy
variables indicated that chironomid larval survival was affected only by conductivity
(Table 3.3). Log survival ratio was positively associated with log conductivity. This
indicates that chironomids exhibited higher survival in higher conductivity wetland
waters (Fig. 3.1). There was no significant relationship between log NA concentration
and survival (Fig. 3.2).
Biomass of Chironomid Larvae
Forward stepwise multiple regression (results in Table 3.4) indicated that mean biomass
varied significantly both between years and with respect to wetland class-- larvae attained
higher biomass in the 2010 trial than in the 2011 trial-- and reference wetland waters
yielded larger chironomids than OSPW wetland waters. There was also a significant,
positive relationship between conductivity and chironomid biomass, indicating that
chironomid larvae reared in water with higher conductivities grew larger than those
reared in lower conductivity wetland water (Fig. 3.3), even after taking into account the
differences due to wetland class. There was also a significant, positive effect of log-NA

70
on log-biomass—this indicates that chironomids grew larger in high NA wetland waters
than in lower NA wetland waters (Fig. 3.4). Log conductivity and log NA had a
significant, negative interaction on log biomass.

71
Table 3.2: Results of a forward stepwise multiple regression on log(survival ratio +
1) with class (OSPW or reference), year, log(NA), log(conductivity), and the
interaction term of log(NA) and log(conductivity) as independent variables.
Significant p-values are indicated by an asterisk (*).
Regression
Coefficient
S.E. R2
t-value p-value
Intercept -0.6174 0.5535 -1.11 0.269
Log(Conductivity) 0.3571 0.1758 0.246 2.03 0.0463*
Total 0.246
Table 3.3: Results of a forward stepwise multiple regression with log(biomass) as the
dependent variable and class (OSPW or reference), year, log(NA),
log(conductivity), and the interaction term of log(NA) and log(conductivity)
as independent variable. Significant p-values are indicated by an asterisk (*).
Regression
Coefficient
S.E. Partial
R2
t-value p-value
Intercept 0.0589 0.3000 0.1966 0.8450
Year -0.3603 0.0445 0.4680 -8.0916 <0.0001*
Log(Conductivity) 0.0082 0.1146 -0.4145 0.0718 0.9430
Wetland Class -0.1923 0.0721 0.9774 -2.6665 0.0104*
Log(NA) 0.8794 0.2246 0.0313 3.9147 0.0003*
Log(NA)*Log
(Conductivity) -0.2812 0.0826 0.0789 -3.4044 0.001*
Total 0.6731

72
Figure 3.1: Percent larval survival per jar across a range of conductivities (μS/cm)
of thirteen wetland waters.

73
Figure 3.2: Percent larval survival per jar across a range of naphthenic acid
concentrations (mg/L) of thirteen wetland waters.
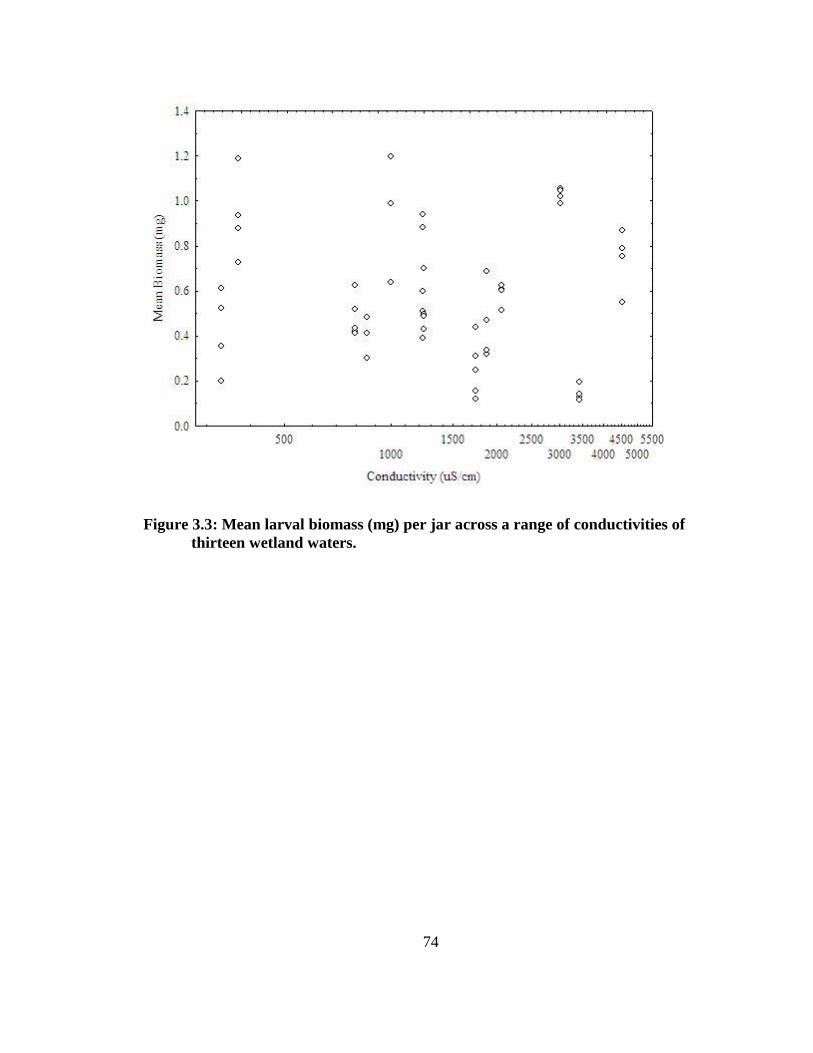
74
Figure 3.3: Mean larval biomass (mg) per jar across a range of conductivities of
thirteen wetland waters.

75
Figure 3.4: Mean larval biomass (mg) per jar across a range of naphthenic acid
concentrations (mg/L) of thirteen wetland waters.

76
Correlation between Length and Survival
In order to determine whether the density of larvae, (which was very variable both among
and within treatments) affected their size, a linear regression was performed .Mean length
per jar was not significantly related to number of larvae per jar surviving to the end of the
bioassay (p=0.664; Figure 3.3). This indicates that surviving larvae in each jar did not
consume proportionally more food per individual when larvae in the same jar died. The
two variables appear to be independent of one another
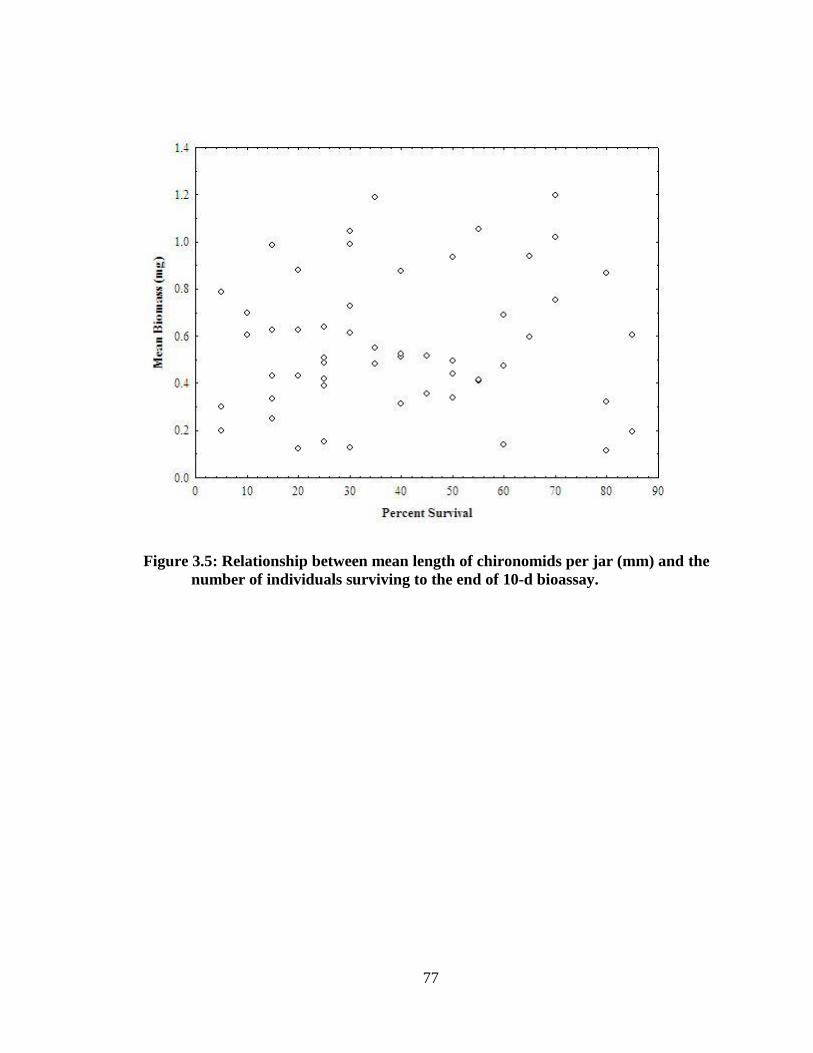
77
Figure 3.5: Relationship between mean length of chironomids per jar (mm) and the
number of individuals surviving to the end of 10-d bioassay.

78
Discussion
Chironomid larvae survival was low overall, but was significantly positively related to
conductivity. In other words, larvae reared in high conductivity wetland waters survived
better than those in low conductivity wetland waters. This was unexpected because many
species of the genus Chironomus are among the least salt tolerant of the family (Cannings
and Scudder, 1978). Survival was not significantly affected by year, class, or NA
concentration. There was no significant interaction between NA and conductivity on
larval survival.
There was a significant positive logarithmic relationship between NA and biomass and
between conductivity and biomass. This was contrary to the expectation that these two
toxicants would pose sublethal stress leading to lower growth rate. There was also a
negative interaction between NA and conductivity—this indicated that there was a
synergistic effect and that the two are more likely to limit growth when combined than
expected if the effects of each were added together. The 2010 trial yielded larger
chironomids than the 2011 trial. This may have been due to temperature differences or
the wetlands chosen in each year. Chironomid larvae that were held in reference wetland
waters grew to a larger size than those that were held in OSPW wetland waters. This may
indicate a sublethal toxicity of OSPW wetland waters from components other than NA
and conductivity.

79
Preliminary findings by Turcotte et al. (2009) indicated that there was an antagonistic
interaction between the effects of salts and NA on survival of Ceriodaphnia dubia in the
laboratory. They hypothesized that the presence of salts caused the acids to precipitate
out of solution (Turcotte et al. 2009). If the acids did precipitate out of solution, a
planktonic animal such as C. dubia would no longer be in contact with the salt-bound
acid, but a benthic invertebrate such as C. riparius would still be in contact with the
surfactant. It is also possible that C. riparius are more resilient to these concentrations of
salts and NA.
Anderson et al. (2011) studied survival, growth, and emergence of Chironomus dilutus
exposed to fresh and treated OSPW. There was no consistent, significant trend to indicate
that OSPW negatively affected survival, but it did reduce larval size. In the same study,
also found that exposure to a saltwater control did not significantly impair growth,
survival, or emergence of C. dilutus larvae, but concentration of NA did correlate
significantly with reductions in these three endpoints (Anderson et al. 2011). The findings
of Anderson et al. (2011) are not consistent with the findings of this study.
The effect of naphthenic acids and conductivity on biomass and survival of chironomid
larvae did not prove to be significant in this study. Overall, there was high mortality in
every treatment, including controls, and this more likely led to non-significant results.
This high mortality may have been the result of residual detergent in the jars which may
have caused stress to the larvae. Alternatively, the stress caused by handling and

80
transferring chironomid larvae that were only a few hours hold, may have been
responsible for the consistently high mortality.
There was no significant relationship between length and survival of chironomids. This
indicates that chironomids did not grow more quickly when other chironomids in the jar
died. This is confounded with the overall high mortality, but indicates that adequate space
and food was provided for each larva.
Conclusion
Larvae reared in water from wetlands containing OSPW tended to be smaller than larvae
reared in water from reference wetlands, all other things being equal. However, low
survivorship of the chironomid larvae overall compromised this study and prevented an
adequate assessment of the interaction between naphthenic acids and salts and their
combined and separate effects on biomass and survival. Limited evidence suggests that
C. riparius larvae may survive better in water with conductivity higher than the controls
used in this study.

81
References
Allen, E.W. 2008. Process water treatment in Canada’s oil industry: I. Target pollutants
and treatment objectives. Journal of Environmental Engineering and Science. 7: 123-
138.
Anderson, J., Wiseman, S.B.,Moustafa, A., El-Din, M.G., Liber, K., Giesy, J.P.
2011.Effects of exposure to oil sands process-affected water from experimental
reclamation ponds on Chironomus dilutus. Water Research. Accepted December 3, 2011.
Batzer, D. P. , McGee, M, Resh, V.H., and R.R. Smity. 1993. Characteristics of
invertebrates consumed by mallards and prey response to wetland flooding schedules.
Wetlands 13: 41-49
Benke, A.C., Huryn, A.D., Smock, L.A., and Wallace, J.B. 1999. Length-
massrelationships for freshwater macroinvertebrats in North America with particular
reference to the southeastern United States. Journal of the North American Benthological
Society. 18: 308- 343.
Birks, J. 2011. Personal communication.
Cannings, R.A., and Scudder, G.G.E. 1978. The littoral Chironomidae (Diptera) of saline
lakes in central British Columbia. Canadian Journal of Zoology 56: 1144-1155.
Chapman, P. M. 2000. Whole effluent toxicity testing—usefulness, level of protection,
and risk assessment. Environmental Toxicity and Chemistry. 19: 3-13.
Corkum, L.D. and E.C. Hanes. 1989. A laboratory aeration system for rearing aquatic
invertebrates. Entomological News 100:169-172.
Del Rio, L.F., Hadwin, A.K.M., Pinto, L.J., MacKinnon, M.D., and Moore, M.M. 2006.
Degradation of naphthenic acids by sediment micro-organisms. Journal of Applied
Microbiology 101: 1049-1061.
Frank, R. A., Kavanagh, R., Burnison, B.K., Arsenault, G., Headley, J. V., Peru, K. M.,
Van Der Kraak, G., and Solomon, K.R. 2008. Toxicity assessment of collected fractions
from an extracted naphthenic acid mixture. Chemosphere 72: 1309-1314.
FTFC (Fine Tailings Fundamentals Consortium). 1995. “Volume II: Fine Tails and
Process Water Reclamation” In: Advances in Oil Sands Tailings Research, Alberta
Department of Energy, Oil Sands and Research Division, Edmonton, Alberta, Canada.
Gafa Riv, S. 1974. Studies on relationships between acute toxicity to fish and surface
activity of anionic surfactants. Sostanze Grasse 51: 183-192.
82
Hall Jr., L.W., and Anderson, R.D. 1995. The influence of salinity on the toxicity of the
various classes of chemicals of aquatic biota. Critical Reviews in Toxicology. 25: 281-
346.
Hokanson, K.E.F., and Smith, L.L. 1971. Some factors influencing toxicity of linear
alkylate sulphonate (LAS) to the bluegill. Transactions of the American Fisheries
Society. 100: 1-12.
Holowenko, F.M., MacKinnon, M.D., and Fedorak, P.M. 2001. Naphthenic acids and
surrogate naphthenic acids in methanogenic microcosms. Water Research 35: 2595–606.
Leung, S.S., MacKinnon, M.D., and Smith, R.E.H. 2001. Aquatic reclamation in the
Athabasca, Canada, oil sands: naphthenate and salt effects on phytoplankton
communities. Environmental Toxicology and Chemistry 20 (7): 1532-1543.
MacKinnon, M.D. 2000. Personal communication.
Martin, J.P. 2011. Personal communication.
Pascoe, D., Williams, K.A., and Green, D.W.J. 1989. Chronic toxicity of cadmium to
Chironomus riparius Meigen -- effects upon larval development and adult emergence.
Hydrobiologia 175: 109-115.
Turcotte, D., Kautzman, M., Peru, K, Headley, J., and Liber, K. 2009. Characterizing salt
and naphthenic acids interaction in the toxicity of oil sands process water to freshwater
invertebrates. SETAC Poster Presentation.
Verge, C., Morenso, A., Bravo, J., and Berna, J.L. 2001. Influence of water hardness on
the bioavailability and toxicity of linear alkylbenzene sulphonate (LAS). Chemosphere
44: 1749-1757.
Whelly, M.P. 1999. Aquatic invertebrates in wetlands of the oil sands region of northeast
Alberta, Canada, with emphasis on Chironomidae (Diptera). M.Sc. Thesis, University of
Windsor, Windsor, ON.

83
CHAPTER IV: ASSESSING INDEPENDENT AND INTERACTIVE EFFECTS OF
NAPHTHENIC ACIDS AND SALTS ON LARVAE OF CHIRONOMUS
RIPARIUS (DIPTERA: CHIRONOMIDAE) IN LABORATORY
BIOASSAYS
Introduction
Oil sands process water contains a mixture of potential toxicants including, but not
limited to, high concentrations of naphthenic acids and salts. The purpose of this study
was to determine the independent and combined effects of these two toxicants on the
growth and survival of the benthic macroinvertebrate Chironomus riparius in the
laboratory.
Chironomus riparius as a Study Species
Chironomids often dominate the benthic invertebrate community biomass, so their
productivity has potential to influence overall wetland ecosystem productivity and
productivity of surrounding terrestrial food webs (Pascoe et al., 1989). For example,
Hoekman et al. (2012) found that the deposition and accrual of dying, postmating
chironomids can enrich plant and arthropod communities in terrestrial food webs. Their
abundance makes large chironomids an important prey species for mallards (Batzer et al.,
1993). Adult chironomids are a dominant part of the diets of silver-haired bats (Barclay,
1985) and tree swallows (St. Louis et al., 1990). Chironomus riparius is a commonly-
used toxicity test organism, so toxicants can be easily compared within this species
(Pascoe et al. 1989).

84
The Toxicity of Oil Sands Process Water
The extraction and refining of oil from mined oil sands generates large volumes of fine
fluid tailings material (FTFC, 1995). Oil sands industries then face the challenge of
storing the tailings material and process water in an environmentally sound manner.
However, oil sands process water/ material (OSPW or OSPM, respectively) contains high
concentrations of salts and naphthenic acids and some trace metals, which can cause
adverse effects to aquatic biota (reviewed in the General Introduction).
Oil sands process water (OSPW) and water from OSPM-affected wetlands can be toxic to
a variety of organisms across several trophic levels. Northern Canadian toad (Bufo
boreas) and wood frog (Rana sylvatica) tadpoles held in OSPM-affected ponds exhibited
reduced growth and development (Pollet & Bendell-Young, 2000). Similarly, wood frog
tadpoles have exhibited delayed metamorphosis in young OSPM-affected wetlands
whereas older OSPM-wetlands had similar metamorphosis timing to reference wetlands
(Hersikorn and Smits, 2011). In fathead minnows, OSPW with NA concentrations of >25
mg/L and conductivities of >2000 µS/cm caused a variety reproduction-associated
effects including lowered spawning success and reduced sex steroid hormone levels
(Kavanaugh et al., 2011). In the laboratory, 96-h exposure to as little as 6.3 % OSPW
significantly reduced mean final length and survival of larvae of black flies (Simulium
vittatum) (Sabo 2003). In one study, first instar Chironomus dilutus larvae exhibited a 10-
d LC50 of 65% OSPW (Whelly, 1999). However, Chironomus riparius were more
tolerant than C. dilutus, exhibiting relatively minor reductions in survival and growth in
100% OSPW (Whelly 1999).

85
The Toxicity of Salts
There are several ways of measuring the amount of salt in solution (Mackie, 2004).
Specific conductance or conductivity measures the flow of electrons through the water
usually in microsiemens per centimeter (µS/cm). Second, salinity refers to the
concentration of dissolved salts, usually expressed in parts per thousand (ppt). Third,
total dissolved solids (TDS) also refers to the concentration of dissolved salts, but it is
measured by mass as opposed to number of ions per volume of water and is usually
expressed as milligrams per liter (mg/L) (Mackie, 2004).
The marine origin of the oil sands mined in northeastern Alberta causes OSPW to be
saline, which results in characteristically elevated conductivity (FTFC, 1995).
Chironomids can tolerate varying degrees of salinity, and several species thrive in
intertidal or marine conditions (Pinder, 1995). Fourth instar Chironomus riparius can
tolerate salinity of up to 10 ppt without increases in mortality or reductions in emergence
success (Bervoets et al., 1996). The presence of salts, especially particular ions may
reduce the bioavailability of other constituents that may themselves be toxic. For
example, Hall and Anderson (1995) found that the toxicity of most metals to aquatic
biota decreases as salinity increases, likely because metals are more bioavailable in the
free ion form (Hall & Anderson, 1995). This suggests that the toxicity of trace metals in
OSPW-affected wetlands that contain higher salinities may be lower than metal toxicity
in reference wetlands.

86
The Toxicity of Naphthenic Acids
Naphthenic acids (NAs) are “alkyl-substituted cyclic and aliphatic carboxylic acids that
are removed from bitumen during the extraction process” (Allen, 2008). They occur
naturally in low levels (<1 mg/L) in waters of the oil sands area but become concentrated
in OSPW (reaching concentrations as high as 120 mg/L) during the refining process
(M.D. MacKinnon, Syncrude Canada Ltd., unpublished; Headley & McMartin, 2004).
In a 96-h toxicity test, NAs had LC50 of <10 mg/L in trout (Schramm et al. 1984). The
mode of toxicity of NAs has seldom been addressed. One possibility is that the
amphipathic nature of NAs causes disruption at the cell membrane (narcosis) which could
ultimately lead to cell death (Frank et al., 2008). Zhang et al. (2011) used a genetic
approach in order to determine the mode of toxicity for NAs. They found that genes
involved in NADP or NADPH binding were up-regulated and genes involved in the
ATP-binding cassette transporter complex were down-regulated when E. coli was
exposed to naphthenic acids (Zhang et al., 2011). Because of the surfactant nature of NA,
gill damage and death by asphyxiation is likely the cause of toxicity (Abel, 1974).
Surfactants like NA can also interact with proteins and affect the permeability of cell
membranes (Abel, 1974).
Objectives
The objectives of this study were to determine the toxicity of naphthenic acids and total
dissolved solids to Chironomus riparius midge larvae and to determine the relationship of
these toxicants when combined. The response variables studied were 10-d survival and
larval final length at the end of a standard laboratory bioassay. It was expected that alone,
high concentrations of naphthenic acids and added salts would reduce larval survival and

87
growth due to increased narcosis at the cell membrane and osmoregulation-related stress,
respectively.
Methods
Study Organisms
Egg masses from a Chironomus riparius culture at the University of Windsor, Windsor,
Ontario were used in this study. These insects were originally derived from a lab-reared
culture at Environment Canada, Burlington, Ontario. Freshly-laid egg masses were
incubated individually in Petri dishes containing dechlorinated tap water at room
temperature and were monitored every 12 h until hatching occurred. Planktonic newly
hatched larvae that had finished feeding on the gelatinous egg matrix (>12 h old) were
removed from their Petri dish by pipette and gently placed in experimental jars in groups
of 20. Two groups of 20 newly hatched larvae from each egg mass were preserved in
Carnoy’s solution (3:1 v/v, acetic acid: ethanol) at this time to be later measured as a
proxy for initial size.
Sources of Chemicals and Preparation of Water Treatments
Naphthenic acids were extracted from Mildred Lake Settling Basin fluid tailings and
concentrated into a stock solution by Richard Kavanagh (Canadian Natural Resources
Limited) in 2008 using methods described by Frank et al. (2006). The salt solution was
created by looking at the concentrations of individual ions recorded from Natural
Wetland in 2008, which receives OSPW as seepage from an adjacent tailings pond on the
Suncor Energy, Inc lease area (MacKinnon, 2008). This yielded a stock salt solution with
the same ionic composition and total dissolved solids of a real oil sands process affected

88
wetland. The concentrations of individual ions in Natural Wetland are listed in Table 4.1
and the salts added to ultrapure water to yield these concentrations are listed in Table 4.2.

89
Table 4.1: Concentrations of major ions in Natural Wetland.
Ion
Concentration in
Natural Wetland
(mg/L)
Na
482
K 15
Mg 16
Ca 23
Cl 82
SO4 240
CO3 38
HCO3 908
Table 4.2: Salts added to Millipore filtered water to match major ion concentrations
listed in Table 4.1 to yield 10L stock solution.
Salt Mass (g)
KCl 0.4944
CaCl2 0.6369
NaCl 0.4687
NaHCO3 12.6971
Na2CO3 0.6712
Na2SO4 2.1805
MgSO4 0.5910

90
Experimental Design
Several assays were conducted in this study (Table 4.3). The following assays were
conducted in a randomized block design in which replicates were blocked through time
and space. Jars were randomly arranged under fluorescent light in an environmental
chamber under a photoperiod of 16 hours light and 8 hours dark and kept at a constant
temperature of 21˚C. The replicated sets of 25 treatments were randomly arranged
through space. One-L Jars were washed with Sparkcleen soap, triple-rinsed with
dechlorinated tap water, rinsed with 10% HCl, and triple-rinsed with high purity,
Millipore-filtered water. A 2-cm depth of autoclaved fine silica sand was placed on the
bottom of each jar, after which 1 L of treatment water was added. Jars were aerated
individually with capillary tubing using the method of Corkum and Hanes (1989).
Twenty newly hatched larvae (<24 h old; previously counted into a holding container)
were carefully transferred into each jar. Ten mg of ground Nutrifin7 tropical fish food in
a slurry solution was added to each jar daily (0.5mg/larvae/day).
The assays ran for 10 d. On the 11th day of the study (240 h post inoculation) larvae were
recovered by pouring the water and sand from a jar through a 250-µm mesh sieve and
examining the material retained. Larvae were enumerated, immediately preserved in
chilled Carnoy’s solution (3:1 v/v acetic acid: ethanol) and stored refrigerated. Larvae
were then digitally photographed at 60x magnification beneath a dissection microscope.
The body length (distance from posterior end of the anal proleg to the anterior margin of
the head) of each larval image was measured to the nearest 100 µm using ImageTool
3.0© (UTHSCSA, San Antonio, TX) image analysis software.

91

92
Table 4.3: Description of the concentrations of potentially toxic constituents in each
series
Assay Naphthenic Acids Total Dissolved
Solids
Number of
Replicates
Completed
Number
of
Replicates
used in
Analysis
Concentration
(mg/L)
Percent of
Maximum
(%)
TDS
(mg/L)
Percent of
Maximum
(%)
Naphthenic
Acid Assay
0 0 335 0 4 3
10 13 335 0 4 4
18 22 335 0 4 2
29 36 335 0 4 4
48 60 335 0 3 2
80 100 335 0 4 2
Salt Assay 0 0 335 0 3 3
0 0 523 13 4 4
0 0 651 22 3 2
0 0 853 36 4 4
0 0 1199 60 3 3
0 0 1774 100 4 4
Combination
Assay
0 0 335 0 4 4
0 0 1774 100 4 3
10 13 1199 60 4 3
18 22 853 36 4 3
29 36 651 22 4 4
48 30 523 13 3 2
80 100 335 0 2 2

93
Statistical Analyses
In order to analyze independent effects of NA and TDS on length and survival, the single
toxicant bioassays were analyzed using linear regression on log transformed variables. A
survival ratio (number of larvae that survived divided by number of larvae that died) was
used in analysis and an arithmetic mean was taken as average length. Log transforming
both the independent (NA and TDS) and dependent (length and survival) variables should
produce a dose-response relationship that follows a linear model (De Lean et al., 1978).
Two multiple linear regression analyses were performed, to relate each of the two
dependent variables (larval survival and mean length-- both log-transformed) to
concentrations of NA and TDS and their interaction (NA x TDS).
Results
In all three assays, larval survival was quite low, even in controls, ranging from 0 to 35
percent in controls and 0 to 80 percent overall, with an overall mean of 19 percent.
Furthermore, survival was highly variable. It is possible that first instar larvae were so
fragile that handling stress occurred early on when larvae were transferred into test jars.
Consequently, results should be interpreted with caution. Appendix G provides detailed
survival and growth data. Temperature stayed constant over the course of the study
beginning at 22.8 ± 1.1˚C and ending at 22.8 ± 1.8˚C. Because water was not changed
throughout the 10 d, some evaporation occurred, and conductivity was slightly higher at
the end of the experiment than at the beginning. On day 1 the control jars had a mean
(±SD) of 470 ± 7 µS/cm, and this increased to 518 ± 43 µS/cm by day 11 Appendix F
provides detailed water quality data.
94
Single Toxicant Bioassays
There was no significant relationship between the concentration of NA alone and larval
survival [(Log (survival)/Log(mortality)] (Fig. 4.1; table 4.4). There was also no
significant relationship between the concentration of NA and mean larval length (Fig.
4.2; table 4.5).
There was also no significant relationship between TDS alone and larval survival (Fig.
4.3; table 4.6). However, there was a significant, negative relationship between mean
larval length (mm) and TDS (p=0.01; Fig. 4.4; table 4.7).

95
Figure 4.1: Larval survival (percent) in each jar in which at least one larva survived
to the end of the study the naphthenic assay series.

96
Figure 4.2: Geometric mean body length (mm) of larvae for each jar in which at
least one larva survived in the naphthenic acid assay.

97
Table 4.4: Linear regression results of log transformed NA on log-transformed
survival ratio (survival/mortality). Statistically significant p-values (<0.05) are
indicated by an asterisk (*). N= 17, df=15.
Regression
Coefficient
S.E. R2
t-value p-value
Intercept -0.94 0.32 -2.9 0.009*
Log(NA+1) 0.23 0.24 0.057 0.95 0.36
Table 4.5: Linear regression results of log transformed NA on log-transformed
mean length (mm). Statistically significant p-values (<0.05) are indicated by an
asterisk (*). N=17, df=15.
Regression
Coefficient
S.E. R2
t-value p-value
Intercept 0.90 0.05 16.9 <0.0001*
Log(NA+1) -0.01 0.04 0.012 -0.43 0.67

98
Figure 4.3: Larval survival (percent) in each jar in which at least one larva survived
to the end of the study the salt assay series.

99
Figure 4.4: Geometric mean body length (mm) of larvae for each jar in which at
least one larva survived in the salt acid assay. Note the log scale on the X axis.

100
Table 4.6: Linear regression results of log transformed TDS on log-transformed
survival ratio (survival/mortality). Statistically significant p-values (<0.05) are
indicated by an asterisk (*). N=20, df=18.
Regression
Coefficient
S.E. R2
t-value p-value
Intercept 0.17 0.94 0.18 0.86
Log(TDS) -0.32 0.32 0.05 -0.98 0.34
Table 4.7: Linear regression results of log transformed TDS on log-transformed
mean length (mm). Statistically significant p-values (<0.05) are indicated by an
asterisk (*). N=20, df=18.
Regression
Coefficient
S.E. R2
t-value p-value
Intercept 1.44 0.21 6.98 <0.0001*
Log(TDS) -0.19 0.07 0.29 -2.73 0.01*

101
Combination Bioassay
In the salt and NA combination bioassay, there was a significant negative relationship
between NA concentration and survival (p<0.001; Fig. 4.5) and TDS and survival
(p=0.02) (Fig. 4.6; Table 4.8). There was also a significant, positive interaction effect
between NA and TDS with respect to survival (p<0.001). This indicates that there was an
antagonistic relationship between NA and TDS resulting in greater larval survival in
treatments in which the two toxicants were combined. In other words, there was a “rescue
effect” of the salts on the toxicity of NA. Mean larval length was not significantly
influenced by NA concentration (Fig. 4.7), TDS (Fig. 4.8), or the interaction between the
two (Table 4.9).

102
Figure 4.5: Larval survival (%) versus NA in the combination bioassay in which
salts (TDS) and NAs were combined.
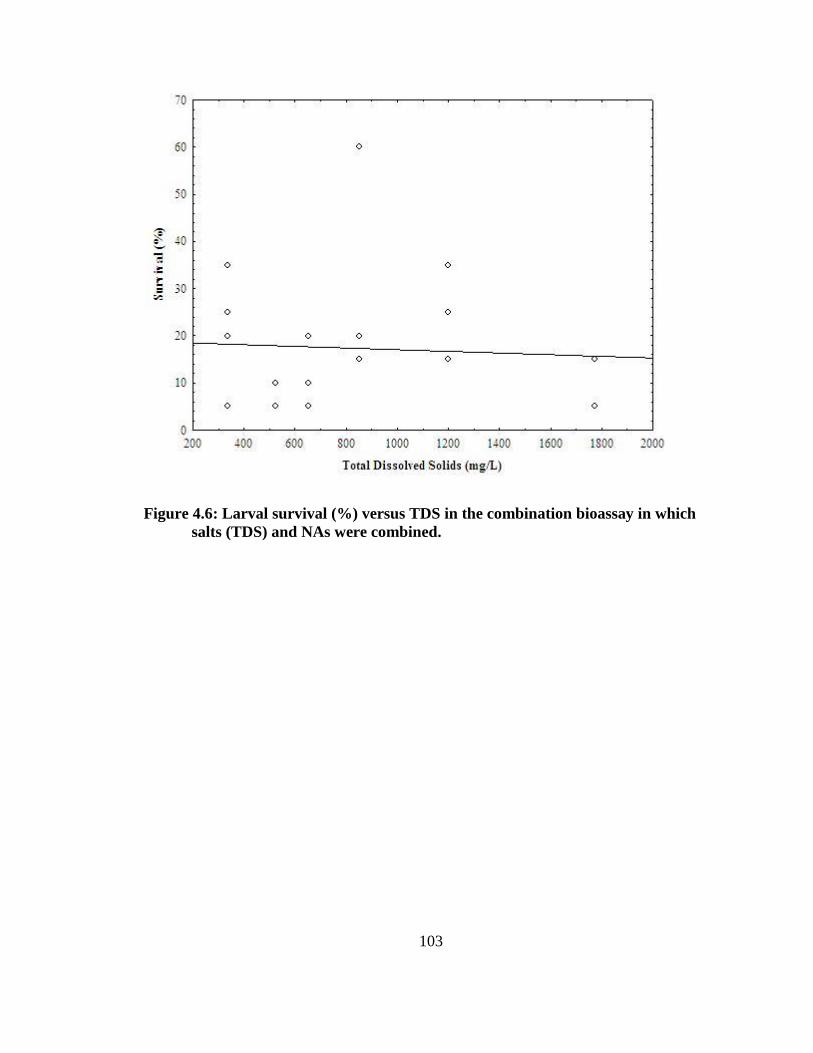
103
Figure 4.6: Larval survival (%) versus TDS in the combination bioassay in which
salts (TDS) and NAs were combined.
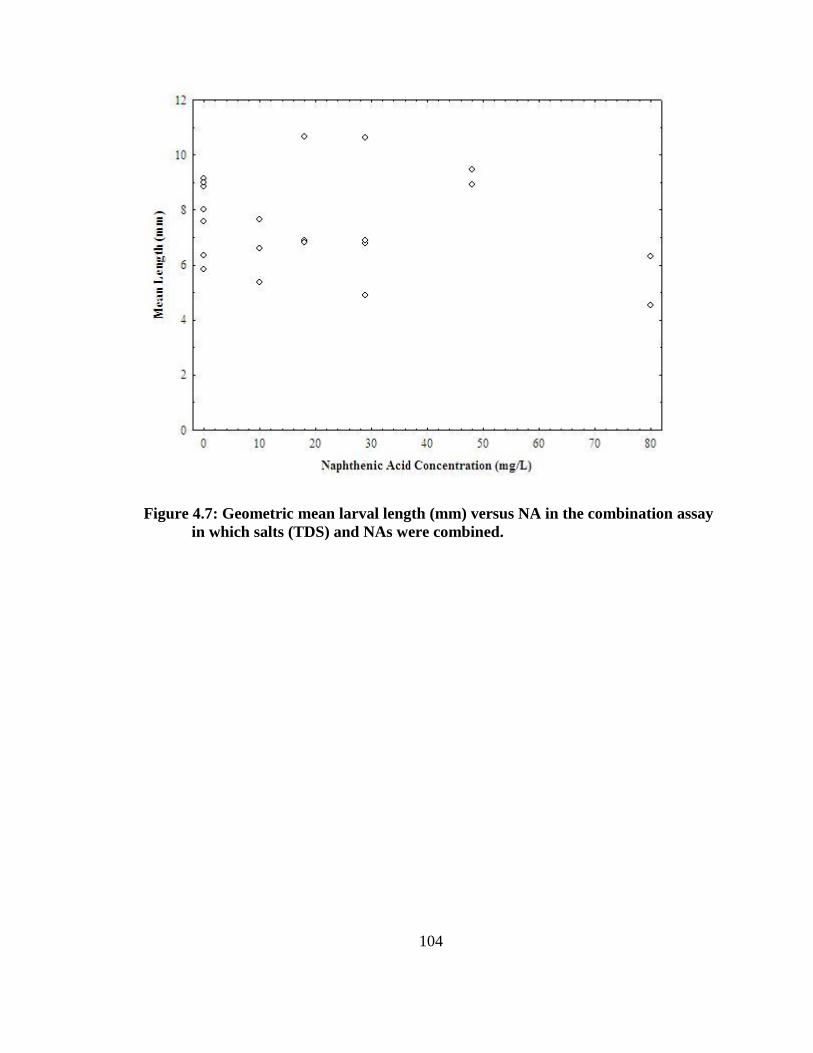
104
Figure 4.7: Geometric mean larval length (mm) versus NA in the combination assay
in which salts (TDS) and NAs were combined.

105
Figure 4.8: Geometric mean larval length (mm) versus TDS in the combination
assay in which salts (TDS) and NAs were combined.

106
Table 4.8: Multiple regression results of log transformed NA, TDS, and interaction
effect on log-transformed survival ratio (survival/mortality). Statistically significant
p-values (<0.05) are indicated by an asterisk (*).
Regression
Coefficient
S.E. R2
t-value p-value
Intercept 1.41 0.85 1.66 0.12
Log(NA+1) -4.22 1.01 0.07 -4.18 <0.001*
Log(TDS) -0.75 0.30 0.29 -2.51 0.02*
NA*TDS 1.49 0.37 0.18 4.06 <0.001*
Total 0.53
Table 4.9: Multiple regression results of log transformed NA, TDS, and interaction
effect on log-transformed mean length (mm). Statistically significant p-values
(<0.05) are indicated by an asterisk (*).
Regression
Coefficient
S.E. R2
t-value p-value
Intercept 0.69 0.32 2.14 0.047*
Log(NA+1) -0.10 0.38 -- -0.25 0.81
Log(TDS) 0.07 0.11 0.05 0.60 0.55
NA*TDS 0.03 0.14 -- 0.19 0.85
Total 0.08
107
Discussion
In all three bioassays, survival was low. First instar larvae are more sensitive to stress
than later instars; handling stress or contamination posed to all larvae possibly caused the
low survival rate. Nebeker et al. (1984) found that first instar C. tentans larvae were the
most sensitive to acute copper exposure followed by second, third, and fourth instars. It is
unlikely that dilution water was contaminated by trace metals because salts were added to
ultrapure water in order to create reconstituted wetland water. Though unlikely, it is
possible that contamination by residual HCl or detergent in the jars from the cleaning
process may have been the cause for the low survival rate. The most plausible
explanation for the low survival rate is handling stress. Second to third instar C. tentans
that were transported from the lab to the field for a series of 7-d in situ bioassays
exhibited low survival (31.7 ± 21.5%) even when test tubes were used to hold the larvae
in an effort to reduce physical stress of sediment contact (Chappie & Burton, Jr., 1997).
Given that first instar larvae are more sensitive to chemical stress than later instars
(McCahon & Pascoe, 1991; Nebeker et al. 1984), it is expected that they would be more
sensitive to physical stress as well.
Single Toxicant Bioassays
In the NA assay, no significant relationship was found between NA concentration and
survival or mean larval length. This may mean that the naphthenic acid concentrations
used were not high enough to induce a strong response from the larvae. Alternatively,
background sources of mortality exceeded the toxic potential of NAs. Another
explanation is that the naphthenic acids used contained a low proportion of the lower

108
molecular weight acids that have been shown to be more toxic and biodegradable by
bacteria (Frank et al, 2008). Because these acids were extracted approximately three
years prior to this bioassay, it is also possible, though unlikely, that degradation by
bacteria may have reduced the stock solution toxicity. The stock solutions were held
refrigerated for the entire period since extracted.
In the salt assay, no significant relationship was found between TDS and survival. There
was, however, a significant negative relationship between TDS and mean larval length
(p= 0.01). This may be evidence that salt stress was high enough to reduce growth but not
high enough to meaningfully reduce survival. This is not surprising as C. riparius is
somewhat tolerant of increased salinities (Bervoets et al., 1996). Furthermore, these
results are consistent with those of Hassell et al. (2006) who conducted a bioassay on
Chironomus sp. with 8 conductivity treatments ranging from 150-25,000 µS/cm. As a
frame of reference, conductivities in the present salt assay ranged from 503- 2322 µS/cm.
Hassell et al. (2006) found that Chironomus larvae growth rate (mm/d) steadily declined
with increased salinity. Time to emerge was also negatively affected by increased
salinity, but size at time of emergence did not depend on salinity (Hassell et al., 2006).
The reduction in growth could cause longer emergence times as well as reduced
emergence success; third and fourth instar C. tentans larvae that were manipulated to
grow more slowly than controls exhibited a longer emergence time and drastic reductions
in 10-d emergence success (Liber et al. 1996). Oviposition success— the ability to
produce an egg mass-- was not found to be correlated with growth rate (Liber et al.

109
1996). However, the number of eggs produced, or fecundity, of C. cucini was negatively
affected by reduced size at time of emergence (Butler & Walter, 1992).
Naphthenic Acid and Salt Combination Bioassay
In the combination assay, both NA and TDS had significant negative effects on survival
(p<0.001 and p=0.02, respectively). There was also a significant positive interaction
effect of NA with TDS on larval survival. This indicates that there was an antagonistic
interaction between NA and salts. The salts may have induced a rescue effect that
ameliorated the toxicity of the NA. This effect has also been observedin Ceriodaphnia
dubia (Turcotte et al., 2009) exposed to NA and salts in OSPW. This indicates that the
results of toxicity tests performed using NAs alone may not be applicable to OSPW-
affected wetlands and to do so may exaggerate toxicity.
Conclusion
Overall survival in controls was fairly low, due either to the fragility of first instar larvae
or to handling stress. Future studies should use later instar larvae with the understanding
that these will not be as sensitive to toxicity as first instar larvae.
Salts were found to reduce chironomid larval growth. This is consistent with other
findings in the literature (Hassell et al. 2006). This finding also has implies that
emergence (Liber et al. 1996) and adult fecundity (Butler & Walter, 1992); may be
reduced by the effects of salts.
In the combination assay, salts and NAs were each found to reduce survival, but this
effect was reduced when the two classes of compounds were present together
(antagonistic interaction). This interaction has seldom been studied, but those that have

110
investigated this interaction in zooplankton have found similar results (Turcotte et al.,
2009).

111
References
Batzer, D. P., M. McGee, V.H. Resh, and R.R. Smity. 1993. Characteristics of
invertebrates consumed by mallards and prey response to wetland flooding schedules.
Wetlands 13: 41-49.
Barclay, R.M.R. 1985. Long- versus short-range foraging strategies of hoary (Lasiurus
cinereus) and silver-haired (Lasionycteris noctivagans) bats and the consequences for
prey selection. Canadian Journal of Zoology 63: 2507-2515.
Bervoets, L., C. Wils, and R. Verheyen. 1996. Tolerance of Chironomus riparius larvae
(Diptera: Chironomidae) to salinity. Bulletin of Environmental Contamination and
Toxicology 57: 829-835.
Butler, M.G., and L. Walker. 1992. Fecundity, reproductive effort, and pupal size in the
profundal midge Chironomus cuccini (Diptera: Chironomidae). Netherlands Journal of
Aquatic Ecology 26: 263-267.
Chappie, D.J, and G.A. Burton, Jr. 1997. Optimization of in situ bioassays with Hyalella
azteca and Chironomus tetans. Environmental Toxicology and Chemistry 16: 559-564.
Corkum, L.D., and E.C. Hanes. 1989. A laboratory aeration system for rearing aquatic
invertebrates. Entomological News 100: 169-172.
De Lean, A., Munson, P.J., and Rodbard, D. 1978. Simultaneous analysis of families of
sigmoidal curves: application to bioassay, radioligand assay, and physiological dose-
response curves. American Journal of Physiology. 235: E97-E102.
Frank, R. A., R. Kavanagh, B.K. Burnison, G. J.V. Headley, K.M. Peru, G. Van Der
Kraak, and K.R. Solomon. 2006. Diethlaminoethyl-cellulose clean-up of a large volume
of naphthenic acid extract. Chemosphere 64: 1346- 1352.
Frank, R. A., R. Kavanagh, B.K. Burnison, G. Arsenault, J.V. Headley, K.M. Peru, G.
Van Der Kraak, and K.R. Solomon. 2008. Toxicity assessment of collected fractions
from an extracted naphthenic acid mixture. Chemosphere 72: 1309-1314.
FTFC (Fine Tailings Fundamentals Consortium). 1995. “Volume II: Fine Tails and
Process Water Reclamation” In: Advances in Oil Sands Tailings Research, Alberta
Department of Energy, Oil Sands and Research Division, Edmonton, Alberta, Canada.
Hall Jr., L.W., and R.D. Anderson. 1995. The influence of salinity on the toxicity of the
various classes of chemicals of aquatic biota. Critical Reviews in Toxicology 25: 281-
346.
Hassell, K. L., B.J. Kefford, and D. Nugegoda. 2006. Sub-lethal and chronic salinity
tolerances of three freshwater insects: Cloeon sp. and Centroptilum (Ephemeroptera:

112
Baetidae) and Chironomus sp. (Diptera: Chironomidae). Journal of Experimental Biology
209: 4024-4032.
Headley, J.V., and D.W. McMartin. 2004. A review of the occurence and fate of
naphthenic acids in aquatic environments. Journal of Environmental Science and Health
A39: 1989-2010.
Herman, D.C., P.M. Fedorak, M.D. MacKinnon, and J.W. Costerton. 1994.
Biodegradation of naphthenic acids by microbial populations indigenous to oil sands
tailings. Canadian Journal of Microbiology 40: 467-477.
Hoekman, D., M. Bartrons, and C. Gratton. 2012. Ecosystem linkages revealed by
experimental lake-derived isotope signal in heathland food webs. Oecologia (in press).
Kavanagh, R.J., R.A. Frank, K.D. Oakes, M.R. Servos, R.F. Young, P.M. Fedorak, M.D.
MacKinnon, and K. Solomon. 2011. Fathead minnow (Pimephales promelas)
reproduction is impaired in aged oil sands process-affected waters. Aquatic Toxicology
101: 214-220.
Liber, K., D.J. Call, T.D. Dawson, F.W. Whiteman, and T. Dillon. 1996. Effects of
Chironomus tentans larval growth retardation on adult emergence and ovipositing
success: implications for interpreting freshwater sediment bioassays. Hydrobiologia 323:
155-167.
Mackie, G. 2004. Knowing a lake’s healthy signs. Pages 103-142. In Applied Aquatic
Ecosystem Concepts, Second Edition. Mackie, G. (Ed.) Kendall/Hunt Publishing.
Dubuque, Iowa.
MacKinnon, M.D. 2008. Unpublished data. Summary of water chemistry of selected
waterbodies on the Syncrude mine lease area. Prepared for Syncrude Canada, Ltd.
Edmonton, AB.
McCahon, C.P. and D. Pascoe. 1991. Brief-exposure of first and fourth instar
Chironomus riparius larvae to equivalent assumed doses of cadmium: effects on adult
emergence. Water, Air, and Soil Pollution. 60: 395-403.
Nebeker, A.V, M.A. Cairns, and C.M. Wise. 1984. Relative sensitivity of Chironomus
tentans life stages to copper. Environmental Toxicology and Chemistry. 3: 151-158.
Pascoe, D., K.A. Williams, and D.W.J. Green. 1989. Chronic toxicity of cadmium to
Chironomus riparius Meigen -- effects upon larval development and adult emergence.
Hydrobiologia. 175: 109-115.
Pinder, L.C.V. 1995. The habitats of chironomid larvae. In The Chironomidae: biology
and ecology of non-biting midges. Edited by P.D. Armitage, P. S. Cranston, and L.C.V.
Pinder. Chapman & Hall, London, UK. Pg. 131.

113
Pollet, I. and L.I. Bendell-Young. 2000. Amphibians as indicators of wetland quality in
wetlands formed from oil sands effluent. Environmental Toxicology and Chemistry. 19:
2589-2597.
Sabo, E. 2003. Simulium vittatum growth, survival, mentum fluctuating asymmetry and
incidence of deformity as indicators of contaminant stress. Undergraduate Thesis,
University of Windsor, Windsor, ON.
Schramm, L.L., R.G. Smith, and J.A. Stone. 1984. The influence of natural surfactant
concentration on the hot water process for recovering bitumen from the Athabasca Oil
Sands. AOSTRA Journal of Researcj 1: 5-15.
St. Louis, V. L., L. Breebaart, and J.C. Barlow. 1990. Foraging behaviour of tree
swallows over acidified and nonacidic lakes. Canadian Journal of Zoology 68: 2385-
2392.
Tammes, P.M.L. 1964. Isoboles, a graphic representation of synergism in pesticides.
Netherlands Journal of Plant Pathology. 70:73-80.
Turcotte, D., Kautzman, M., Peru, K, Headley, J., and Liber, K. 2009. Characterizing salt
and naphthenic acids interaction in the toxicity of oil sands process water to freshwater
invertebrates. SETAC Poster Presentation.
Whelly, M.P. 1999. Aquatic invertebrates in wetlands of the oil sands region of northeast
Alberta, Canada, with emphasis on Chironomidae (Diptera). College of Graduate Studies
and Research, University of Windsor, Windsor, Ontario, Canada.
Zhang, X., S. Wiseman, H.Yu, H. Liu, J.P. Giesy, and M. Hecker. 2011. Assessing the
toxicity of naphthenic acids using a microbial genome wide live cell reporter array
system. Environmental Science & Technology. 45: 1984-1991.

114
CHAPTER V: GENERAL DISCUSSION
Goals
The goals of this study were to determine a) how emerging chironomid abundance,
biomass, and community composition differ between young reference and OSPW
wetlands, b) how levels of conductivity and naphthenic acids in OSPW and reference
wetland waters affect survival and growth of chironomids, and c) whether an interaction
between naphthenic acids and salts affects chironomid sensitivity to the two potential
toxicants.
Discussion of Key Findings
Chapter II
Neither the abundance nor the length of chironomids that emerged from OSPW wetlands
differed from those emerging from reference wetlands. However, there was a non-
significant trend towards smaller (shorter length) chironomids emerging from reference
wetlands compared to OSPW wetlands. This was not expected given the water quality-
related stress posed to chironomids in OSPW wetlands. Because the community
composition between OSPW and reference wetlands did not significantly differ, the
difference in size is unlikely to be attributable to different species inhabiting the wetland.
However, the trend may be the result of increased predation by ducks or other predators.
Some ducks, such as mallards, selectively forage on large chironomids (Batzer et al.
1993) so this foraging activity would make the average biomass of emerging chironomids
smaller.

115
Mean length was significantly positively correlated with dissolved organic carbon
concentration. This may be related to food quality. Bacterial biofilm is considered the
most nutritious component of detritus and high dissolved organic carbon can result in
greater bacterial biomass (Boon, 2006).
Although community composition did not significantly differ between reference and
OSPW wetlands, the abundance of certain genera was correlated with certain water
quality parameters. The abundance of Einfeldia was found to be positively associated
with the addition of peat to the wetland whereas Neozavrelia and Paracricotopus were
negatively associated with peat. Einfeldia also seemed to be more abundant in cool
waters whereas Neozavrelia and Paracricotopus were more abundant in warm waters.
Tanytarsus was found to be intolerant of low dissolved oxygen whereas Ablabesmyia
seems to be abundant in low dissolved oxygen conditions. In contrast, Tanytarsus was
found to be salt-tolerant and Ablabesmyia is salt-intolerant. This finding is supported by
Cannings and Scudder (1978), who found that Ablabesmyia larvae were present only in
waters with very low conductivities whereas Tanytarsus larvae were either present in all
waters or only those with higher conductivities, depending on the species.
Chapter III
In the wetland water bioassay, survival was low and this may have confounded results.
There were no significant effects of conductivity, naphthenic acids, or any significant
interaction between the two in survival or biomass endpoints. However, there was a slight
non-significant trend that chironomids survived better in high conductivity wetland

116
water. Among all chironomids, Chironomus is among the least salt-tolerant genera but it
can be found in lakes with conductivities between about 400 and 4100 μS/cm (Cannings
and Scudder, 1976), which fall within the approximate range of the conductivities of the
wetland waters in this study. The trend towards higher survival in high conductivity
wetland waters may be due to the decreased availability of metals when salts are present.
The free metal ion is a metals most toxic form and the bioavailability, and thereby
toxicity, is greatly reduced when metallic salts are formed (Hall & Anderson, 1995).
Although pore waters of constructed wetlands may contain metal concentrations in
excess of Canadian drinking water guidelines, there is no evidence that trace metals reach
toxic concentrations in OSPW wetlands (Baker et al. 2012).
Chapter IV
In the salt assay, TDS had a negative effect on larval growth/final size. This finding is
consistent with those of Hassell et al. (2006) who found that Chironomus riparius growth
rates were reduced with increased conductivity. This result differs from my findings from
Chapter II, which showed a non-significant trend towards larger size in wetland waters
that had higher conductivity. In the combination bioassay, both TDS and NA had a
significant, negative influence on survival, and there was a significant positive interaction
between TDS and NA. This means that alone, salts and NAs may each negatively affect
survival, but that there was an antagonistic interaction between these two toxicants. When
salts and NAs occur together, chironomids survived better than would be expected if the
individual effects were added together. This indicates that OSPW may be less toxic than
individual laboratory toxicity tests may imply. No significant negative effect of either
toxicant was found in the bioassay tests of whole wetland waters (Chapter III), and also
117
suggests that the two classes of compounds have mitigative effects on one another. This
antagonistic interaction between salts and NAs has also been reported in Ceriodaphnia
dubia (D. Turcotte, University of Saskatchewan, unpublished data and 2009). Turcotte
(2009) proposed that salts caused NAs to precipitate out of solution.
Implications
There were very few differences in the size and length of chironomids emerging from
OSPW wetlands compared to reference wetlands. Water chemistry factors that were not
specific to OSPW apparently had a greater impact on emerging chironomid numbers than
wetland class (OSPW or reference). Dissolved organic carbon had a positive correlation
with mean emergent chironomid length. Future research might investigate the value of
adding a source of dissolved organic carbon in the reclamation process to facilitate
chironomid productivity.
Lower growth in high TDS conditions could be manifested as reduced population size of
future generations. Larval size at pupation is highly correlated with eventual emergence
success (Liber et al. 1996) and fecundity (Butler and Walker, 1992) so even slight
changes could potentially influence future generations of chironomids. This lowered
growth rate in high TDS conditions and lowered survival rate in both high TDS and high
NA conditions also means that OSPW food webs may be less productive. Ganshorn
(2002) analyzed chironomid productivity and food web structure using carbon isotope
signatures in many of the same wetlands used in this study. He found no consistent
differences between OSPW and reference wetlands in their productivity, but did find that
118
they had different food web structures. Not only do chironomids contribute to aquatic
food web productivity as a food source for higher trophic organisms, but nearby
terrestrial ecosystems will gain nutrient inputs from dead chironomid deposition in both
plant and insect trophic levels (Hoekman et al., 2012).
Future Studies
There was a low survival rate in the pilot study related to Chapter IV, Chapter IV itself,
and Chapter III. This may be due to use of newly hatched first instar chironomid larvae
across all of these studies. Although it is common to use first instar larvae in aquatic
toxicity tests, later instars tend to be less sensitive to handling stress and therefore may
have a higher survival rate. Future studies using Chironomus riparius larvae should
therefore use older larvae in order to protect against mortality caused by handling.
Chironomus riparius may possibly be more tolerant than other benthic invertebrate
species in the wetlands studied. This may explain the lack of significant differences in
growth and survival observed in the naphthenic acid bioassay contrasting OSPW and
reference wetland waters. Perhaps more a sensitive indicator of toxicity should be used in
future in order to ensure that all invertebrates, no matter what their tolerance to pollution
is, will be protected. Whelly (1999) found that Chironomus dilutus was slightly less
tolerant of OSPW than C. riparius.
The mode of action for NA toxicity should be researched further in order to elucidate the
mechanism behind the antagonistic relationship with salts if it is confirmed in other
bioassays (those supporting higher survival overall). Turcotte (2009) speculated that NAs
may precipitate out of solution in the presence of salt but showed no supporting evidence.

119
Alternatively, results from studies of stoichiometrically similar synthetic detergents
(Abel, 1974) may help explain how NA causes toxicity through surfactant action and may
shed light on the antagonistic interaction with salt. Surfactants have the potential to
interact with proteins and alter the permeability of the cell membrane (Abe,l 1974).
Surfactants also cause gill damage and death by asphyxiation (Abel, 1974). However, it is
unknown if or how these mechanisms would be alleviated by the presence of salts.
Fresh naphthenic acids may have a different toxicity than the naphthenic acid stock
solution used in this study as microbial decomposition can degrade and detoxify these
acids. Fresh tailings are not often added to wetlands, but in order to investigate “worst-
case scenario” situations, fresh naphthenic acids should be tested for toxicity. Recent
studies also indicate that what has previously been thought to be naphthenic acids is
actually a broad suite of acids and the composition of these acids differ greatly across the
industry depending on refinement techniques used (Rowland et al., 2011). The
identification of exactly what constitutes the acid extractable portion of OSPW is
essential before toxicity tests can be done on these acids and reclamation procedures
reducing the most toxic of these acids can take effect.
Of the 300+ exuviae counted, 257 were identifiable and thirty genera were found. This is
on the lower end of typical community assembly studies. Researchers often have to
choose between sampling a constant area sampled and collecting a constant number of
insects. Because wetlands can be quite variable in chironomid abundances, sampling
methods that use the constant number collected approach (such as 300 insects per

120
wetland) can provide more accurate assessments of community composition. In future
studies, an equal number of chironomids per wetland (as opposed to an “equal area”
sample) should be sampled and these should be counted in the field in order to ensure all
genera have an equal opportunity to be accounted for.
Conclusion
Available data indicated that oil sands process water in itself did not negatively affect
chironomid species composition, abundance, size at emergence, larval biomass, or
survival. Water chemistry variables such as conductivity affected larval biomass and
better accounted for the distribution of common genera among wetlands. Wetlands with
higher dissolved organic carbon concentration supported larger chironomid pupae.
Organic material, dissolved oxygen, and temperature were also correlated with which
genera were collected. These limited results indicate that the OSPW-affected wetlands
can support chironomid assemblages that are not consistently different from those in
reference wetlands. However, there was limited laboratory evidence that NA and salt
concentration individually reduced survival at high concentrations, and there was an
antagonistic effect when the two were combined.
References
Abel, P.D. 1974. Toxicity of synthetic detergents to fish and aquatic invertebrates.
Journal of Fish Biology 6: 279-298.
Baker, L.F., J.J.H. Ciborowski and M.D. MacKinnon. 2012. Petroleum coke and soft
tailings amendments in constructed wetlands in the Athabasca oil sands may contribute to
the uptake of trace metals by algae and aquatic invertebrates. Science of the Total
Environment 414: 177–186.

121
Batzer, D. P., M. McGee, V.H. Resh, and R.R. Smity. 1993. Characteristics of
invertebrates consumed by mallards and prey response to wetland flooding schedules.
Wetlands 13: 41-49.
Boon, P. I. 2006. Biogeochemistry and bacterial ecology of hydrologically dynamic
wetlands. pages 125-126 In Ecology of Freshwater and Estuarine Wetlands edited by
Batzer, D.P., and Sharitz, R.R. University of California Press.
Butler, M.G., and L. Walker. 1992. Fecundity, reproductive effort, and pupal size in the
profundal midge Chironomus cucini (Diptera: Chironomidae). Netherlands Journal of
Aquatic Ecology 26: 263-267.
Cannings, R.A., and G.G.E. Scudder.1978. The littoral Chironomidae (Diptera) of saline
lakes in central British Columbia. Canadian Journal of Zoology 56: 1144-1155.
Ganshorn, K. Secondary production, trophic position and potential for accumulation of
polycyclic aromatic hydrocarbons in predatory diptera in four wetlands of the Athabasca
oil sands, Alberta, Canada. M.Sc. Thesis. College of Graduate Studies and Research.
University of Windsor, Windsor, ON, Canada.
Hall Jr., L.W., and Anderson, R.D. 1995. The influence of salinity on the toxicity of the
various classes of chemicals of aquatic biota. Critical Reviews in Toxicology. 25: 281-
346.
Hassell, K. L., B.J. Kefford, and D. Nugegoda. 2006. Sub-lethal and chronic salinity
tolerances of three freshwater insects: Cloeon sp. and Centroptilum (Ephemeropptera:
Baetidae) and Chironomus sp. (Diptera: Chironomidae). Journal of Experimental Biology
209: 4024-4032.
Hoekman, D., M. Bartrons, and C. Gratton. 2012. Ecosystem linkages revealed by
experimental lake-derived isotope signal in heathland food webs. Oecologia (in press).
Liber, K., D.J. Call, T.D. Dawson, F.W. Whiteman, and T. Dillon. 1996. Effects of
Chironomus tentans larval growth retardation on adult emergence and ovipositing
success: implications for interpreting freshwater sediment bioassays. Hydrobiologia 323:
155-167.
Rowland, S.J., A.G. Scarlett, D. Jones, C.E. West, and R.A. Frank. 2011. Diamonds in
the rough: identification of individual naphthenic acids in oil sands process waters.
Environmental Science and Technology 45: 3154-3159.
Turcotte, D., Kautzman, M., Peru, K, Headley, J., and Liber, K. 2009. Characterizing salt
and naphthenic acids interaction in the toxicity of oil sands process water to freshwater
invertebrates. SETAC Poster Presentation.

122
APPENDICES
APPENDIX A: WATER QUALITY OF WETLANDS STUDIED IN CHAPTER II
Wetland
Type Wetland
Conductivity
(µS/cm)
Salinity
(ppt)
N.A.
(mg/L)
D.O.
(mg/L)
D.O.C.
mg/L
Temp
(C)
Organic Level
(Peat=1, No
Peat=0)
OSPM 4mCT 4523 1 41 4.6 86 18.7 1
OSPM Test Pond 9 2067 1.1 20.4 11.6 48 19.4 0
OSPM Mike's Pond 1936 2.4 26.2 9.5 43 19 0
OSPM Natural 1234 0.6 64 4.4 74 22 1
Reference High Sulphate 3025 1.6 12 6.4 39 22.2 1
Reference NWID 701 0.3 0.2 3.3 29 19.3 1
Reference Pond 5 1265 0.6 4 10.1 24 22.5 0
Reference Shallow 371 0.2 2.3 8.7 18 17.6 0
Reference V-notch 1004 0.5 7 6.3 22 19.3 1

123
APPENDIX B: ABUNDANCE OF EMERGENT CHIRONOMID GENERA OF NINE WETLANDS
4mCT
Test
Pond 9
Mike's
Pond Natural
High
Sulphate NWID Pond 5 Shallow V-Notch
Procladius 9 7 0 0 1 1 3 2 0
Tanytarsus 1 64 1 0 15 0 2 0 0
Ablabesmyia 0 1 0 4 1 4 0 0 0
Neozavrelia 0 3 0 1 1 0 3 0 0
Einfeldia 6 8 0 0 0 1 0 0 1
Guttipelopia 0 2 0 0 5 0 0 8 0
Paracricotpus 0 27 0 2 3 0 0 0 0
Tanypus 1 5 0 0 0 1 0 0 0
Diplocladius 0 3 0 0 0 1 0 0 0
Doithrix 0 1 0 0 0 1 0 0 0
Endochironomus 1 0 0 0 0 0 0 1 0
Labrundinia 0 0 0 0 2 0 0 0 1
Nanocladius 1 4 0 0 0 0 0 0 0
Neostempellina 0 2 0 0 1 0 0 0 0
Orthocladius 0 0 0 0 2 1 0 0 0
Paratanytarsus 2 0 0 0 1 0 0 0 0
Psectrocladius 0 11 0 0 0 0 0 0 1
Psectrotanypus 0 0 0 1 1 0 0 0 0
Xenopelopia 0 1 0 0 1 0 0 0 0
Zavrelia 0 0 0 0 8 0 2 0 0
Brillia 0 1 0 0 0 0 0 0 0
Chironomus 0 0 0 0 0 1 0 0 0

124
Cryptochironomus 0 0 0 0 1 0 0 0 0
Glyptotendipes 0 0 0 0 0 0 1 0 0
Lipinella 0 1 0 0 0 0 0 0 0
Monopelopia 0 0 0 0 0 1 0 0 0
Nilothauma 0 0 0 0 2 0 0 0 0
Omisus 0 0 0 0 0 1 0 0 0
Rheotanytarsus 0 1 0 0 0 0 0 0 0
Telmatopelopia 0 2 0 0 0 0 0 0 0

125
APPENDIX C: MAJOR IONS IN WETLAND WATERS USED IN CHAPTER III
Major Cations (mg/L) Major Anions (mg/L)
Wetland Na K Mg Ca NH4 F CL SO4 CO3 HCO3
Recycle
Pond N/A N/A N/A N/A N/A N/A N/A N/A N/A N/A
Trench 4* 291.0 9.7 20.7 36.6 0.3 0 100.0 118.0 36.30 538.0
Dyke 4
Reservoir* 217.0 7.3 45.5 127.0 0.2 0 25.0 542.0 0 359.0
4-m CT* 647 21.3 121 44.8 0.1 0 88 737 N/A N/A
Test Pond
9 492 1.0 8.7 5.4 0.3 0 230 115 133 525
High
Sulphate* 401 15.4 114 146 0.7 0 7.9 1410 0 144
Shallow
Wetland 44.9 0.5 11.4 31.9 0.0 0 8.4 18.9 0 232
Natural
Wetland* 383 17.8 15 22.1 2.2 0.82 28 64.5 27 834
V-Notch
Weir* 76.8 5.9 35.8 114 0.2 0 1.3 312 N/A N/A
Peat Pond 155 5.0 38.1 90.5 0.1 0 37.0 368 0.0 316
Golden
Pond 208 5.3 57.9 142 0.3
0 45.0 783 0 221

126
Salt
Marsh* 206.0 13.7 53.0 144.0 0.630 0.0 2.8 703.0 N/A N/A
Mildred
Lake N/A N/A N/A N/A N/A N/A N/A N/A N/A N/A
Note: Wetlands marked with an asterisk (*) are from Martin (2010) Suncor Energy Ltd., unpublished data. All other wetland data are
from MacKinnon, (2008), Syncrude Canada Ltd. N/A= Not Available

127
APPENDIX D: MEASURED WATER QUALITY PER JAR IN WETLAND WATER BIOASSAY 2011
Starting Water Chemistry
Wetland
Water Jar
Conductivity
(µS/cm)
Dissolved
Oxygen (mg/L)
Temperature
(˚C)
Salinity
(ppt) Start Date End Date
Mildred
Lake 1 335 7.03 18.1 0.1 17-Jun-11 27/06/2011
Mildred
Lake 2 325 7.05 18 0.2 18-Jun-11 28/06/2011
Mildred
Lake 3 327 7.05 18.3 0.1 18-Jun-11 28/06/2011
Mildred
Lake 4 343 6.45 18.3 0.1 17-Jun-11 27/06/2011
Mildred
Lake 5 327 6.12 18.3 0.2 18-Jun-11 28/06/2011
Dyke 4
Resevoir 1 863 6.24 18.5 0.4 17-Jun-11 27/06/2011
Dyke 4
Resevoir 2 878 6.04 18.5 0.4 17-Jun-11 27/06/2011
Dyke 4
Resevoir 3 839 6.06 18.4 0.4 17-Jun-11 27/06/2011
Dyke 4
Resevoir 4 852 6.29 18.4 0.4 17-Jun-11 27/06/2011
Dyke 4
Resevoir 5 843 6.3 18.4 0.4 18-Jun-11 28/06/2011
Recycle
Pond 1 3091 6.8 18.2 1.9 17-Jun-11 27-Jun-11

128
Recycle
Pond 2 3647 3.52 18.5 1.9 17-Jun-11 28/06/2011
Recycle
Pond 3 3632 6.23 18.5 1.9 17-Jun-11 27/06/2011
Recycle
Pond 4 3122 5.09 18.5 1.6 17-Jun-11 27-Jun-11
Recycle
Pond 5 3659 6.48 18.5 1.9 17-Jun-11 27/06/2011
Trench 4 1 797 6.24 18.4 0.4 17-Jun-11 27/06/2011
Trench 4 2 794 6.26 18.7 0.4 18-Jun-11 28/06/2011
Trench 4 3 792 6.22 18.4 0.4 17-Jun-11 27/06/2011
Trench 4 4 793 6.39 18.7 0.4 18-Jun-11 28/06/2011
Trench 4 5 797 6.06 18.4 0.2 17-Jun-11 27/06/2011
Peat Pond 1 1753 6.57 18.5 0.8 18-Jun-11 28/06/2011
Peat Pond 2 1737 6.69 18.6 0.4 18-Jun-11 28/06/2011
Peat Pond 3 1723 6.15 18.4 0.4 17-Jun-11 27/06/2011
Peat Pond 4 1756 6.57 18.5 0.9 18-Jun-11 28/06/2011
Peat Pond 5 1747 6.25 18.5 0.9 17-Jun-11 27/06/2011

129
Golden
Pond 1 1869 6.5 18.5 1 18-Jun-11 28/06/2011
Golden
Pond 2 1886 6.35 18.5 1 18-Jun-11 28/06/2011
Golden
Pond 3 1877 6.32 18.4 1 18-Jun-11 28/06/2011
Golden
Pond 4 1852 6.26 18.5 0.9 18-Jun-11 28/06/2011
Golden
Pond 5 1890 6.36 18.5 1 18-Jun-11 28/06/2011
Salt Marsh 1 1234 6.06 18.5 0.6 17-Jun-11 27/06/2011
Salt Marsh 2 1252 5.8 18.4 0.6 17-Jun-11 27/06/2011
Salt Marsh 3 1243 6.11 18.5 0.6 18-Jun-11 28/06/2011
Salt Marsh 4 1230 6.29 18.5 0.6 18-Jun-11 28/06/2011
Salt Marsh 5 1229 6.32 18.5 0.6 18-Jun-11 28/06/2011
Ending Water Chemistry
Wetland
Water Jar
Conductivity
(µS/cm)
Dissolved Oxygen
(mg/L)
Temperature
(˚C)
Salinity
(ppt) End Date
Mildred Lake 1 466 6.62 17.7 0.2 27/06/2011

130
Mildred Lake 2 460 6.51 16 0.2 28/06/2011
Mildred Lake 3 456 2.67 16.2 0.2 28/06/2011
Mildred Lake 4 425 6.82 17.5 0.2 27/06/2011
Mildred Lake 5 445 6.52 16.1 0.2 28/06/2011
Dyke 4
Resevoir 1 916 2.24 17.9 0.5 27/06/2011
Dyke 4
Resevoir 2 931 4.88 18 0.4 27/06/2011
Dyke 4
Resevoir 3 909 3.23 18 0.4 27/06/2011
Dyke 4
Resevoir 4 958 0.36 18 0.3 27/06/2011
Dyke 4
Resevoir 5 905 5.95 16.3 0.4 28/06/2011
Recycle Pond 1 3634 6.12 17.9 1.9 27-Jun-11
Recycle Pond 2 3605 6.35 16 2 28/06/2011
Recycle Pond 3 3678 6.23 17.8 1.9 27/06/2011
Recycle Pond 4 3744 6.58 17.9 2 27-Jun-11
Recycle Pond 5 3715 5.79 17.7 1.9 27/06/2011
Trench 4 1 857 6.66 17.7 0.4 27/06/2011
Trench 4 2 878 3.11 16.2 0.4 28/06/2011
Trench 4 3 852 6.41 17.5 0.4 27/06/2011
Trench 4 4 849 6.26 16.1 0.4 28/06/2011
Trench 4 5 857 6.27 17.8 0.4 27/06/2011
Peat Pond 1 1820 6.55 16 0.9 28/06/2011
Peat Pond 2 1806 4.74 16.3 0.9 28/06/2011
Peat Pond 3 1782 0.37 18 0.3 27/06/2011
Peat Pond 4 1817 5.64 16.1 0.9 28/06/2011

131
Peat Pond 5 1808 5.32 17.9 0.6 27/06/2011
Golden Pond 1 1935 6.46 16.1 1 28/06/2011
Golden Pond 2 1941 6.69 16.1 1 28/06/2011
Golden Pond 3 1933 7.05 16.2 1 28/06/2011
Golden Pond 4 1908 0.37 16.4 1 28/06/2011
Golden Pond 5 1944 6.54 16 1 28/06/2011
Salt Marsh 1 1275 2.41 17.9 0.6 27/06/2011
Salt Marsh 2 1291 6.72 17.7 0.6 27/06/2011
Salt Marsh 3 1305 1.09 16.3 0.7 28/06/2011
Salt Marsh 4 1304 6.77 16 0.7 28/06/2011
Salt Marsh 5 1285 6.6 16.3 0.3 28/06/2011

132
APPENDIX E: SURVIVAL AND MEAN FINAL SIZE IN WETLAND WATER BIOASSAY
Class
Wetland
Survival
(# of
larvae)
Percent
Survival
(%)
Length
(mm)
Mean
Biomass
(mg)
Year
Naphthenic
Acids
(mg/L)
Conductivity
(μS/cm)
OSPM
Dyke 4
Resevoir 0 0 N/A N/A 2011 23.0 855
OSPM
Dyke 4
Resevoir 1 5 7.06 0.300 2011 23 855
OSPM
Dyke 4
Resevoir 7 35 8.47 0.483 2011 23 855
OSPM
Dyke 4
Resevoir 0 0 N/A N/A 2011 23 855
OSPM
Dyke 4
Resevoir 11 55 7.97 0.412 2011 23 855
OSPM
Recycle
Pond 17 85 6.01 0.197 2011 80 3430.2
OSPM
Recycle
Pond 6 30 5.10 0.128 2011 80 3430.2
OSPM
Recycle
Pond 12 60 5.29 0.141 2011 80 3430.2
OSPM
Recycle
Pond 16 80 4.91 0.116 2011 80 3430.2
OSPM
Recycle
Pond 0 0 N/A N/A 2011 80 3430.2
OSPM Trench 4 9 45 8.70 0.517 2011 22 794.6
OSPM Trench 4 4 20 9.36 0.627 2011 22 794.6
OSPM Trench 4 5 25 8.03 0.420 2011 22 794.6
OSPM Trench 4 11 55 7.99 0.415 2011 22 794.6

133
OSPM Trench 4 3 15 8.13 0.434 2011 22 794.6
OSPM 4mCT 0 0 N/A N/A 2010 24.9 4523
OSPM 4mCT 0 0 N/A N/A 2010 24.9 4523
OSPM 4mCT 16 80 10.61 0.869 2010 24.9 4523
OSPM 4mCT 14 70 10.05 0.755 2010 24.9 4523
OSPM 4mCT 7 35 8.92 0.552 2010 24.9 4523
OSPM 4mCT 1 5 10.22 0.788 2010 24.9 4523
OSPM Natural 13 65 9.19 0.597 2010 11.7 1233.8
OSPM Natural 4 20 10.66 0.880 2010 11.7 1233.8
OSPM Natural 5 25 8.64 0.508 2010 11.7 1233.8
OSPM Natural 5 25 7.80 0.389 2010 11.7 1233.8
OSPM Natural 13 65 10.93 0.940 2010 11.7 1233.8
OSPM TP9 8 40 8.67 0.514 2010 20.4 2067.4
OSPM TP9 2 10 9.25 0.607 2010 20.4 2067.4
OSPM TP9 17 85 9.22 0.603 2010 20.4 2067.4
OSPM TP9 3 15 9.35 0.624 2010 20.4 2067.4
OSPM TP9 0 0 N/A N/A 2010 20.4 2067.4
Reference
Mildred
Lake 1 5 6.07 0.201 2011 0.9 331.4
Reference
Mildred
Lake 8 40 8.74 0.524 2011 0.9 331.4
Reference
Mildred
Lake 9 45 7.54 0.356 2011 0.9 331.4
Reference
Mildred
Lake 0 0 N/A N/A 2011 0.9 331.4
Reference
Mildred
Lake 6 30 9.29 0.614 2011 0.9 331.4

134
Reference Peat Pond 10 50 8.17 0.439 2011 1 1743.2
Reference Peat Pond 8 40 7.17 0.312 2011 1 1743.2
Reference Peat Pond 3 15 6.58 0.249 2011 1 1743.2
Reference Peat Pond 4 20 5.00 0.121 2011 1 1743.2
Reference Peat Pond 5 25 5.48 0.155 2011 1 1743.2
Reference
Golden
Pond 10 50 7.40 0.338 2011 3.7 1874.8
Reference
Golden
Pond 16 80 7.24 0.320 2011 3.7 1874.8
Reference
Golden
Pond 12 60 8.40 0.472 2011 3.7 1874.8
Reference
Golden
Pond 3 15 7.38 0.336 2011 3.7 1874.8
Reference
Golden
Pond 12 60 9.71 0.689 2011 3.7 1874.8
Reference Salt Marsh 4 20 8.11 0.431 2011 5.0 1237.6
Reference Salt Marsh 2 10 9.76 0.700 2011 5.0 1237.6
Reference Salt Marsh 0 0 N/A N/A 2011 5.0 1237.6
Reference Salt Marsh 10 50 8.57 0.497 2011 5.0 1237.6
Reference Salt Marsh 5 25 8.50 0.486 2011 5.0 1237.6
Reference Vnotch 3 15 11.14 0.987 2010 5.7 1003.6
Reference Vnotch 5 25 9.42 0.638 2010 5.7 1003.6
Reference Vnotch 14 70 11.99 1.197 2010 5.7 1003.6
Reference Vnotch 0 0 N/A N/A 2010 5.7 1003.6
Reference Vnotch 10 50 N/A N/A 2010 5.7 1003.6
Reference
High
Sulphate 14 70 11.27 1.018 2010 17.8 3025.2
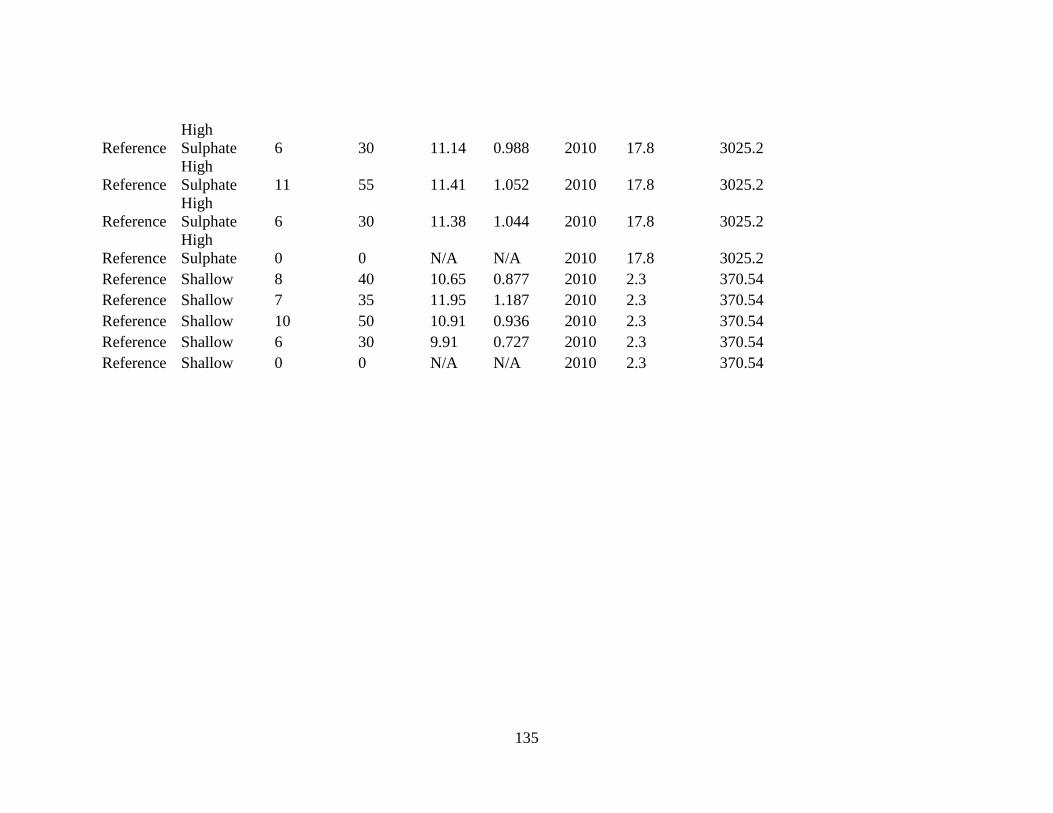
135
Reference
High
Sulphate 6 30 11.14 0.988 2010 17.8 3025.2
Reference
High
Sulphate 11 55 11.41 1.052 2010 17.8 3025.2
Reference
High
Sulphate 6 30 11.38 1.044 2010 17.8 3025.2
Reference
High
Sulphate 0 0 N/A N/A 2010 17.8 3025.2
Reference Shallow 8 40 10.65 0.877 2010 2.3 370.54
Reference Shallow 7 35 11.95 1.187 2010 2.3 370.54
Reference Shallow 10 50 10.91 0.936 2010 2.3 370.54
Reference Shallow 6 30 9.91 0.727 2010 2.3 370.54
Reference Shallow 0 0 N/A N/A 2010 2.3 370.54

136
APPENDIX F: MEASURED WATER QUALITY FOR CHAPTER IV TEST JARS
Initial Final
Rep Treatment
Temp.
(˚C)
Conductivity
(µS/cm)
DO
(mg/L) pH
Temp.
(˚C)
Conductivity
(µS/cm)
DO
(mg/L) pH
1 0NA (Control) 22.84 464 7.35 8.42 22.77 532 7.86 7.62
2 0NA (Control) 23.21 462 6.56 8.38 23.44 485 7.1 7.81
3 0NA (Control) 22.44 482 8.23 8.01 22.8 572 7.86 7.8
1 13NA 23.62 465 7.32 7.62
2 13NA 22.7 459 7.1 8.45 23.11 550 7.52 7.85
3 13NA 22.77 484 10.79 7.47 22.3 555 8.84 7.51
4 13NA 22.33 542 11.06 7.43
1 22NA 22.78 472 7.07 8.32 22.71 566 7.15 7.55
2 22NA 22.77 470 6.47 8.47 23.33 562 7.6 7.82
3 22NA 22.88 480 8.2 7.95 22.42 550 8.23 7.76
4 22NA 22.91 497 8.3 7.71 21.48 558 8.1 7.63
1 36NA 23.03 477 6.24 8.45 22.9 554 7.17 7.78
2 36NA 23.36 473 6.01 8.49 23.67 556 7.62 7.76
3 36NA 22.42 429 8.61 7.78 22.11 570 8.17 7.74
1 60NA 22.6 485 7.16 8.37 22.41 562 8.07 7.71
2 60NA 23.48 490 7.01 8.44 23.52 413 7.37 7.72
3 60NA 22.05 500 8.52 7.53 22.07 566 8.56 7.66
1 100NA 22.87 512 7.23 8.55 22.53 590 7.68 7.81
2 100NA 23.24 496 7.07 8.36 24.55 588 7.76 7.49
3 100NA 21.85 510 8.53 7.77 22.04 583 8.5 7.62
4 100NA 22.9 532 7.21 7.9 22.04 599 8.66 7.73
1 0S (Control) 23.2 480 7.16 8.3 23 568 7.74 7.72

137
2 0S (Control) 23.16 462 6.74 8.23 24.25 450 8.01 7.39
3 0S (Control) 21.97 478 7.96 7.84 21.93 537 8.65 7.69
1 13S 22.44 706 7.3 8.45 22.77 733 7.79 7.91
2 13S 23.22 715 6.87 8.31 23.71 784 7.61 7.79
3 13S 22.79 713 8.16 7.91 21.67 755 8.4 7.81
4 13S 22.06 711 7.41 7.89 21.75 748 8.07 7.73
1 22S 22.77 891 7.04 8.24 22.57 937 7.87 7.86
2 22S 22.89 984 8.17 7.88 22.69 1034 8.67 7.97
3 22S 22.61 889 7.38 7.92 22.74 919 8.07 7.91
1 36S 22.66 1133 6.92 8.15 23.78 1194 8.19 7.89
2 36S 23.19 1106 6.77 8.33 23.98 1172 7.4 7.95
3 36S 22.67 1145 8.57 7.95 22.83 1266 7.93 8.05
1 60S 22.7 1534 6.72 8.29 22.59 1617 7.63 8.1
2 60S 23.97 1528 7.07 8.18 23.21 1573 7.15 8.08
3 60S 22.89 1555 8.24 8.01 22.02 1583 8.05 8.1
1 100S 22.99 2208 6.6 8.24 23.37 2136 7.64 8.25
2 100S 22.79 2246 7.7 7.78 22.74 2275 8.33 8.02
3 100S 23.04 2217 8.85 8.03 22.08 2297 8.23 8.14
4 100S 23.12 2269 8.73 8.08 21.41 2281 8.18 8.2
1
0NA + 0 S
(Control) 23.25 476 7.14 8.33 23.05 447 7.89 7.3
2
0NA + 0 S
(Control) 23.2 466 6.86 8.41 23.58 525 7.17 7.7
3
0NA + 0 S
(Control) 23.11 465 7.94 7.85 22.57 536 7.98 7.71
4
0NA + 0 S
(Control) 22.08 470 7.58 7.91 22.31 530 7.66 7.64
1 0NA + 100S 22.53 2211 7.08 8.36 23.18 2294 7.35 8.19

138
2 0NA + 100S 23.44 2282 7.53 7.77 23.55 2406 9.45 8.19
3 0NA + 100S 22.51 2228 7.8 7.9 21.95 2269 8.04 8.13
1 100NA+ 0 S 22.8 492 6.81 8.44 23.94 447 7.61 7.56
2 100NA+ 0 S 23.52 541 7.29 8.41 25.04 622 7.56 7.79
3 100NA+ 0 S 22.81 538 7.97 7.77 22.07 573 8.56 7.59
4 100NA+ 0 S 22.94 536 8.01 7.74 21.63 595 8.16 7.64
1 13NA+ 60S 22.72 1539 6.55 8.3 22.93 1602 7.53 8.07
2 13NA+ 60S 22.88 1575 6.95 8.2 24.54 1641 7.86 8.14
3 13NA+ 60S 22.44 1504 8.64 7.71 22.15 1606 8.87 7.89
4 13NA+ 60S 22.97 1575 7.55 8.04 21.79 1604 8.24 8.05
1 22NA + 36S 22.55 1119 7.05 8.24 22.85 1188 7.16 7.92
2 22NA + 36S 23.33 1149 6.85 8.39 23.79 1051 7.42 7.87
3 22NA + 36S 22.59 1076 7.73 7.96 21.71 1122 8.74 7.94
4 22NA + 36S 23.13 1143 7.51 7.94 21.76 1191 8.48 7.9
1 36NA+ 22S 22.87 903 6.33 8.33 22.72 1019 8.66 7.71
2 36NA+ 22S 22.97 902 6.52 8.32 23.13 860 7.66 8
3 36NA+ 22S 22.75 888 8.43 7.78 22.61 939 8.33 7.82
4 36NA+ 22S 21.91 900 8.41 7.86 22.91 955 8.29 7.88
1 60NA + 13 S 22.7 736 7.03 8.36 22.67 678 7.35 7.83
2 60NA + 13 S 22.61 709 6.63 8.44 22 793 7.58 7.88
3 60NA + 13 S 22.63 731 7.35 8.01 21.64 787 8.66 7.97
4 60NA + 13 S 23 744 8.33 8.01 21.84 800 8.44 7.88

139
APPENDIX G: SURVIVAL AND MEAN LENGTH
FOR CHAPTER IV BIOASSAYS
Salt Assay
TDS (mg/L) Rep
Mean Length
(mm) % Survival
335 1 8.94 15
335 2 9.77 10
335 3 7.16 30
523 1 9.88 5
523 2 7.98 10
523 3 7.08 45
523 4 7.40 15
651 2 8.32 5
651 3 6.71 20

140
853 1 8.86 10
853 2 8.79 20
853 3 7.61 35
853 4 8.20 50
1199 1 6.27 10
1199 2 8.64 15
1199 3 9.53 10
1774 1 6.63 5
1774 2 4.27 15
1774 3 6.63 10
1774 4 5.85 10
NA Assay
NA (mg/L) Rep
Mean Length
(mm) % Survival

141
0 1 8.04 5
0 2 10.99 5
0 4 6.71 15
10 1 6.14 5
10 2 7.52 5
10 3 6.04 15
10 4 7.00 60
18 2 7.03 15
18 4 9.05 45
29 1 9.73 5
29 2 7.84 35
29 3 9.65 10
29 4 8.28 80
48 3 7.08 20
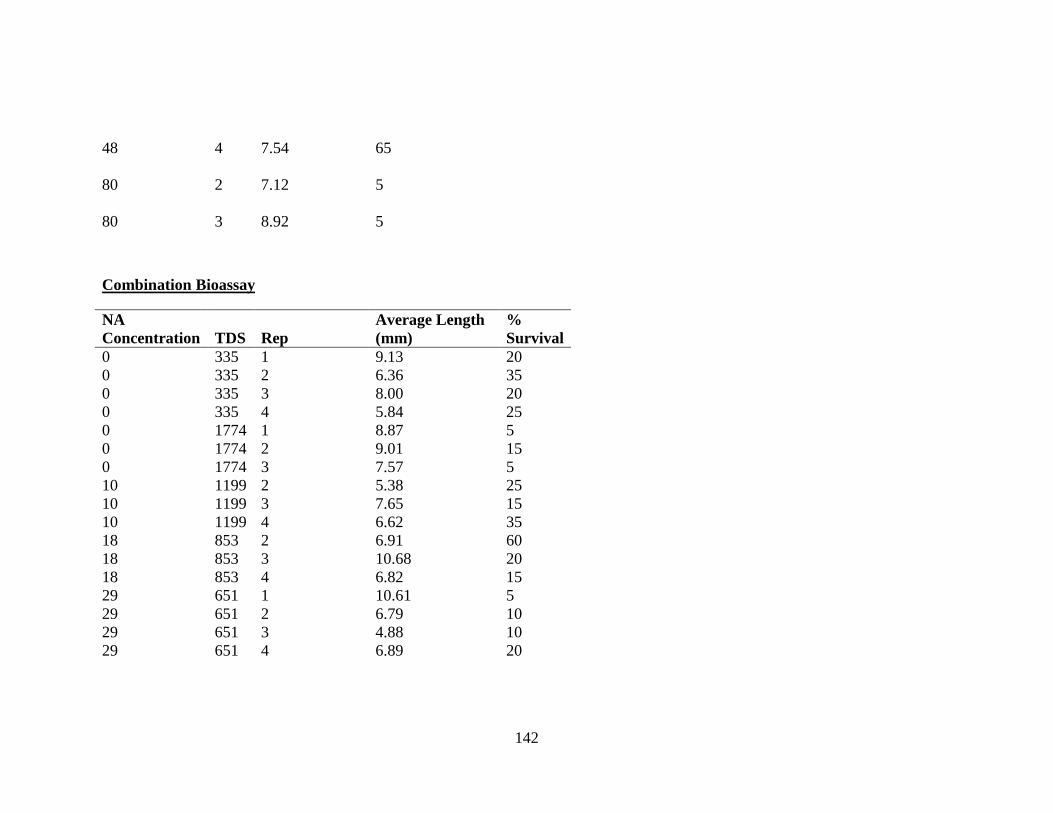
142
48 4 7.54 65
80 2 7.12 5
80 3 8.92 5
Combination Bioassay
NA
Concentration TDS Rep
Average Length
(mm)
%
Survival
0 335 1 9.13 20
0 335 2 6.36 35
0 335 3 8.00 20
0 335 4 5.84 25
0 1774 1 8.87 5
0 1774 2 9.01 15
0 1774 3 7.57 5
10 1199 2 5.38 25
10 1199 3 7.65 15
10 1199 4 6.62 35
18 853 2 6.91 60
18 853 3 10.68 20
18 853 4 6.82 15
29 651 1 10.61 5
29 651 2 6.79 10
29 651 3 4.88 10
29 651 4 6.89 20

143
48 523 3 9.47 5
48 523 4 8.91 10
80 335 3 6.33 5
80 335 4 4.55 5

144
VITA AUCTORIS
Name: Kaitlin D. Kennedy
Place of Birth: Windsor, Ontario
Year of Birth: 1987
Education: F.J. Brennan Catholic High School
Windsor, Ontario
2001-2005
University of Guelph
B.Sc. Biological Sciences, Honours
Guelph, Ontario
2005-2009
University of Windsor
M.Sc. Biological Sciences,
Windsor, Ontario
2009- 2012