SEDAR - GMRI.org...S E SEDAR Magnuson‐Stevens Act • Originally Passed in 1976 – 200 mile...
19
SEDAR SouthEast Data, Assessment, and Review S E Regional Fisheries Assessment and Science Plus a little more
Transcript of SEDAR - GMRI.org...S E SEDAR Magnuson‐Stevens Act • Originally Passed in 1976 – 200 mile...

SEDARSouthEast Data, Assessment, and Review
S
E
Regional Fisheries Assessment and Science
Plus a little more

S
E
SE
DA
RS
ED
AR
General Topics
• Overview of Regional Science and Management
• Introductory Principles

S
E
SE
DA
R
Magnuson‐Stevens Act
• Originally Passed in 1976– 200 mile Exclusive Economic Zone– Regional Council system to manage the resources– Capitalization to take advantage of resources in the EEZ
• 1992 Reauthorization “Sustainable Fisheries Act” (SFA)– 16 years later and concerns are more about overfishing than increasing capacity
– MSY, precautionary principle, 10 year rebuilding– Biological References (MFMT, MSST, OY)

S
E
SE
DA
R
Magnuson‐Stevens Act
• 2006 “Magnuson‐Stevens Fishery Conservation and Management Reauthorization Act” (MSRA)– Existing law not enough to end overfishing– Address scientific and management uncertainty– End overfishing “immediately”– Cannot exceed SSC “Fishing Level Recommendations”– Led to Accountability Measures (AMs), Annual Catch Targets (ACT), Annual Catch Limits (ACL), Overfishing Level (OFL), Allowable Biological Catch (ABC)
• What’s Next?– Flexibility

S
E
SE
DA
RS
ED
AR
Management & ScienceALASKA
WEST COAST
Pacific Islands
GARFO
Southeast
5 Regions8 Councils6 Centers
S
E
SE
DA
R
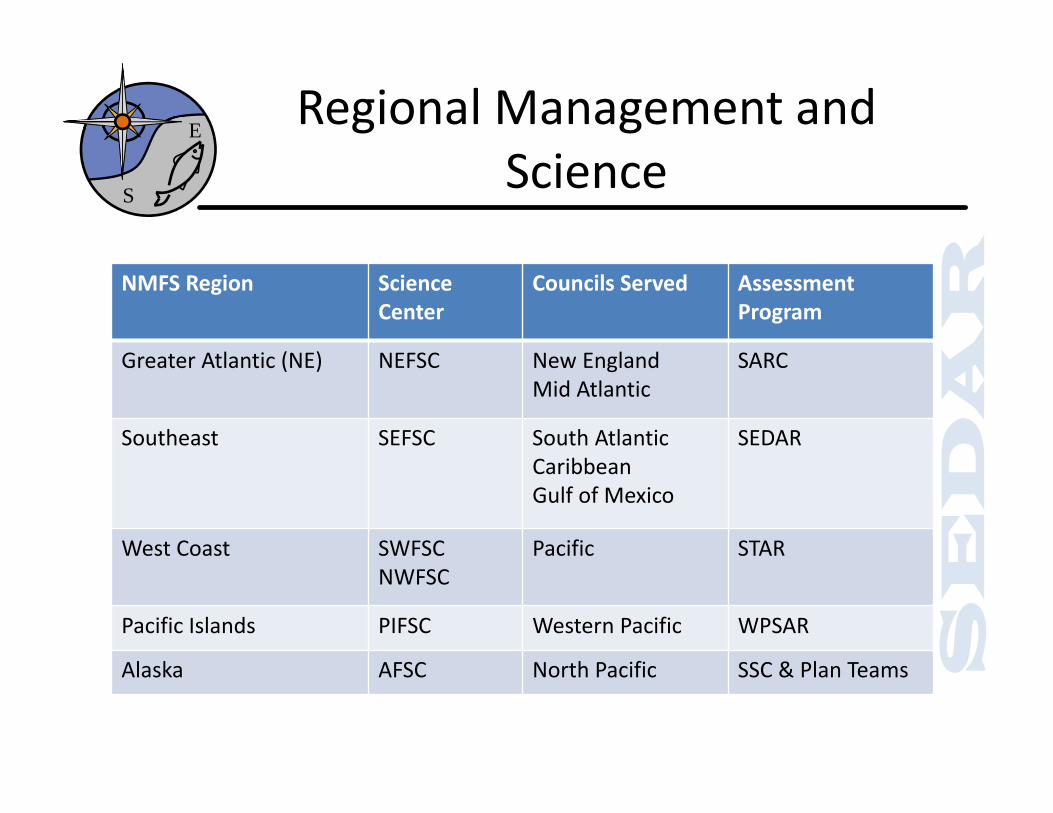
Regional Management and Science
NMFS Region ScienceCenter
Councils Served Assessment Program
Greater Atlantic (NE) NEFSC New EnglandMid Atlantic
SARC
Southeast SEFSC South AtlanticCaribbeanGulf of Mexico
SEDAR
West Coast SWFSCNWFSC
Pacific STAR
Pacific Islands PIFSC Western Pacific WPSAR
Alaska AFSC North Pacific SSC & Plan Teams

S
E
SE
DA
RS
ED
AR
Southeast Region
Southeast Fisheries Science Center and Southeast Regional Office
S
E

S
E
SE
DA
RS
ED
AR
Separation of Science and Management
Entity Science Management
Council System SSC (Scientific and Statistical Committee)
Council and Committees
NMFS Science Center Regional Office
Products Stock status, fishing level recommendations
ManagementActions (e.g., seasons, bag and size limits)

S
E
SE
DA
R
What is the SSC ?
• Scientific and Statistical Committee• Provide Peer Review
– anything coming before the Council• Make Recommendations
– some are binding, like OFL and ABC, but are nonethelessrecommendations
• Determine “Best ScienceInformation Available”
And Important role in SEDAR…

S
E
SE
DA
RS
ED
AR
What is SEDAR
• Southeast Region method for assessing regional, federal stocks
• Southeast Data, Assessment, and Review– Data Workshop– Assessment Workshop– Review Workshop
• Each step is open and transparent• Exhaustive documentation

SCIENCE-MANAGEMENT FRAMEWORK
Data StockAssessment
ManagementDecision
Information Needs to be Summarized and Generalizedfor Conclusions to be Drawn

Time to start thinking Scientifically

S
E
SE
DA
R
Process
ESTIMATES, INFERENCE, TRENDS
POPULATION
SAMPLE
DATA< SURVEY
Fishing for Science is not like fishing for fun or money!!!
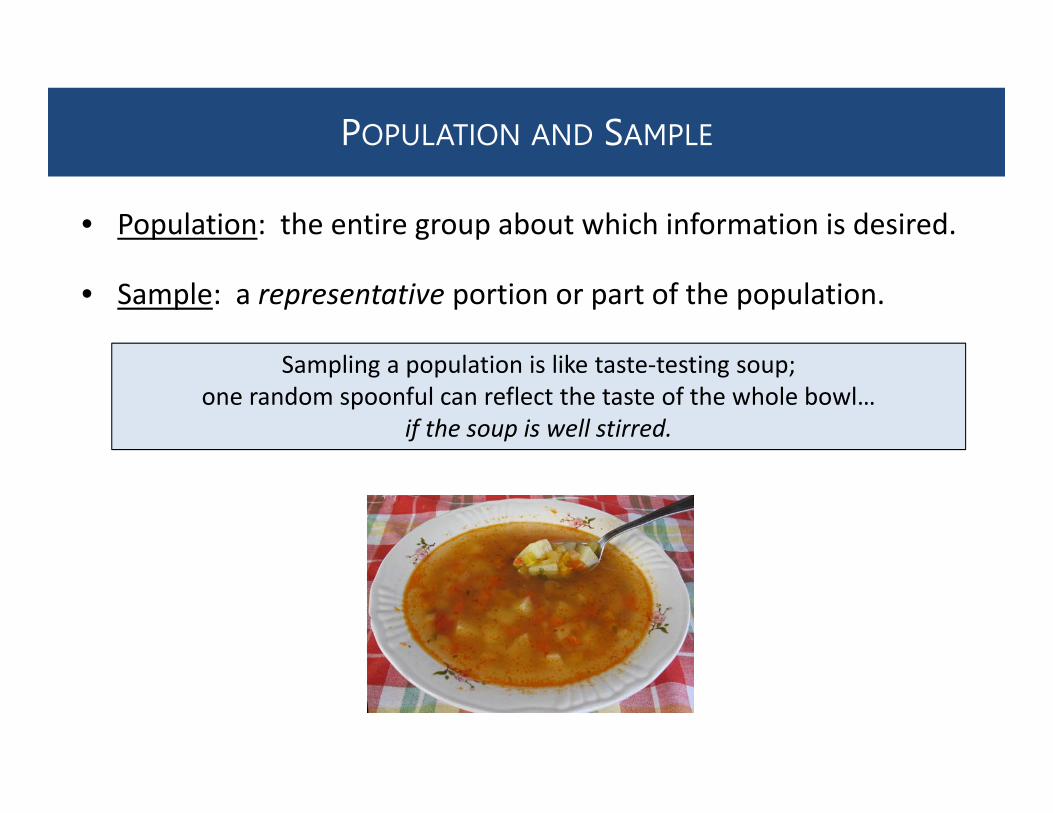
• Population: the entire group about which information is desired.
• Sample: a representative portion or part of the population.
POPULATION AND SAMPLE
Sampling a population is like taste‐testing soup; one random spoonful can reflect the taste of the whole bowl…
if the soup is well stirred.

GOAL: STATISTICAL INFERENCE AND ESTIMATES
• Drawing conclusions based on data.
• The goal is to use information collected from a sample to try to describe the entire population.
• For process to work PROPERLY, must meet certain scientific criteria
The sample needs to be representative of the population! Populations are
seldom ‘well stirred’ !!!

S
E
SE
DA
R
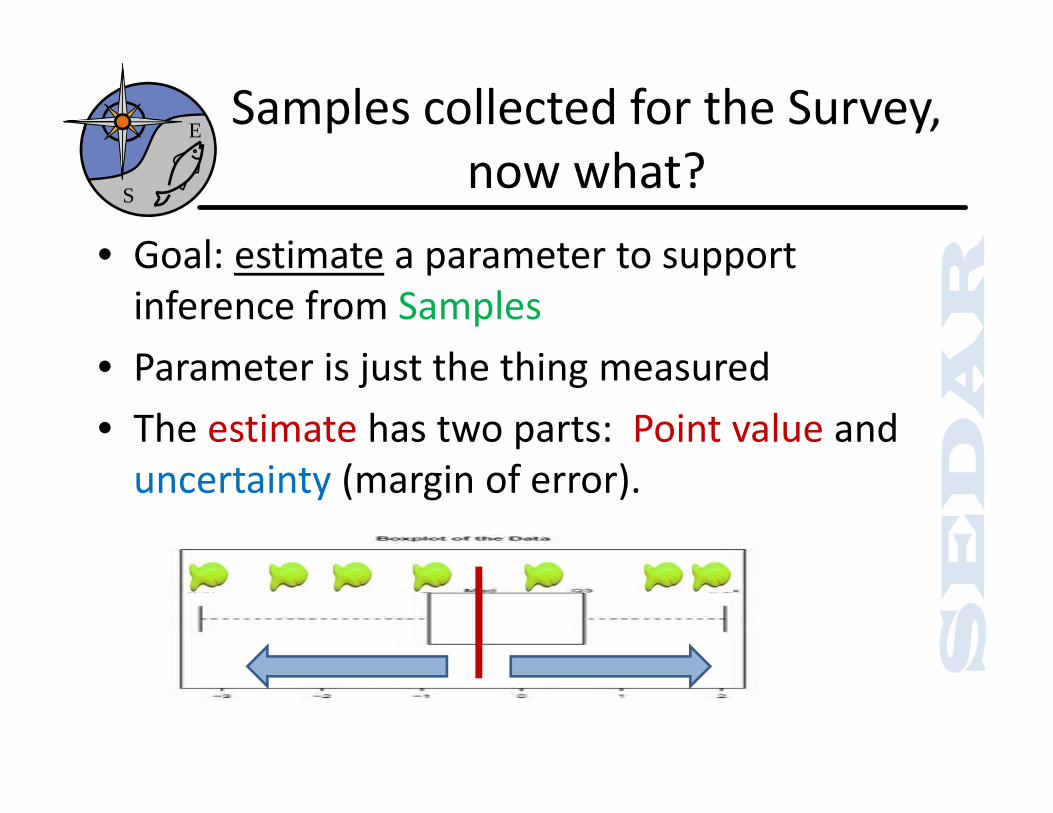
Samples collected for the Survey, now what?
• Goal: estimate a parameter to support inference from Samples
• Parameter is just the thing measured• The estimate has two parts: Point value and uncertainty (margin of error).
S
E
SE
DA
R
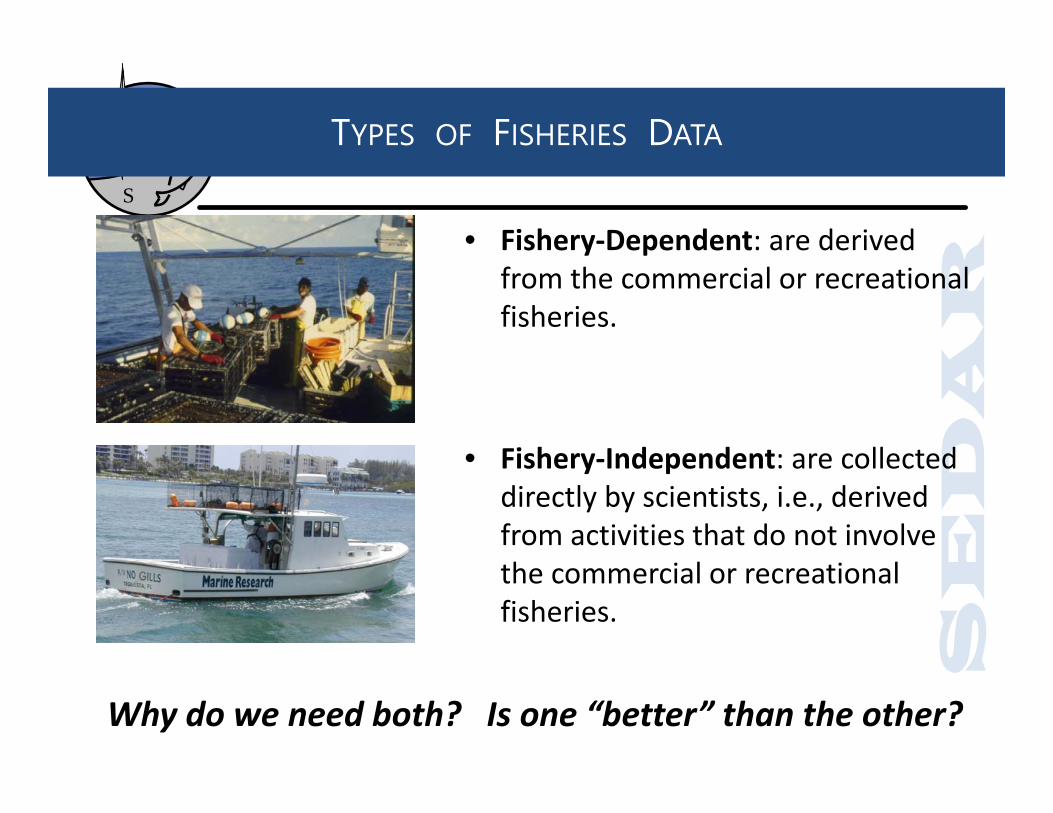
TYPES OF FISHERIES DATA
• Fishery‐Dependent: are derived from the commercial or recreational fisheries.
• Fishery‐Independent: are collected directly by scientists, i.e., derived from activities that do not involve the commercial or recreational fisheries.
Why do we need both? Is one “better” than the other?

S
E
SE
DA
R
1 3 5 7 9 11 13 15 17 19 21 23 25 27 29F 20040
12
3
Spaw
ning
bio
mas
s
Age (yr)
F 2004 F goal F = 0
F
Commercial FisheriesMonitoring
Scientific Surveys
RecreationalFisheriesMonitoring
Biology and EcologyPopulation Structure
STOCK ASSESSMENT – DATA INTEGRATION