Security Market Indices (Ch. 2)beu.edu.az/~faliyev/presentations/fin312/smi.pdf · Stock B Earnings...
31
SECURITY MARKET INDICES Presenter: Dr. Fuzuli Aliyev Venue: Baku Engineering University Date: 28.02.2017
Transcript of Security Market Indices (Ch. 2)beu.edu.az/~faliyev/presentations/fin312/smi.pdf · Stock B Earnings...

SECURITY MARKET INDICES
Presenter: Dr. Fuzuli Aliyev
Venue: Baku Engineering University
Date: 28.02.2017

DESCRIPTION OF A SECURITY MARKET
INDEX
Security market index
Price return index Total return index
Constituent
securities
VALUE OF A PRICE RETURN INDEX
D
Pn
V 1PR
N
i
ii
I
VPRI = the value of the price return index
ni = the number of units of constituent securities in the
index
N = the number of constituent securities in the index
Pi = the unit price of constituent security i
D = the value of the divisor
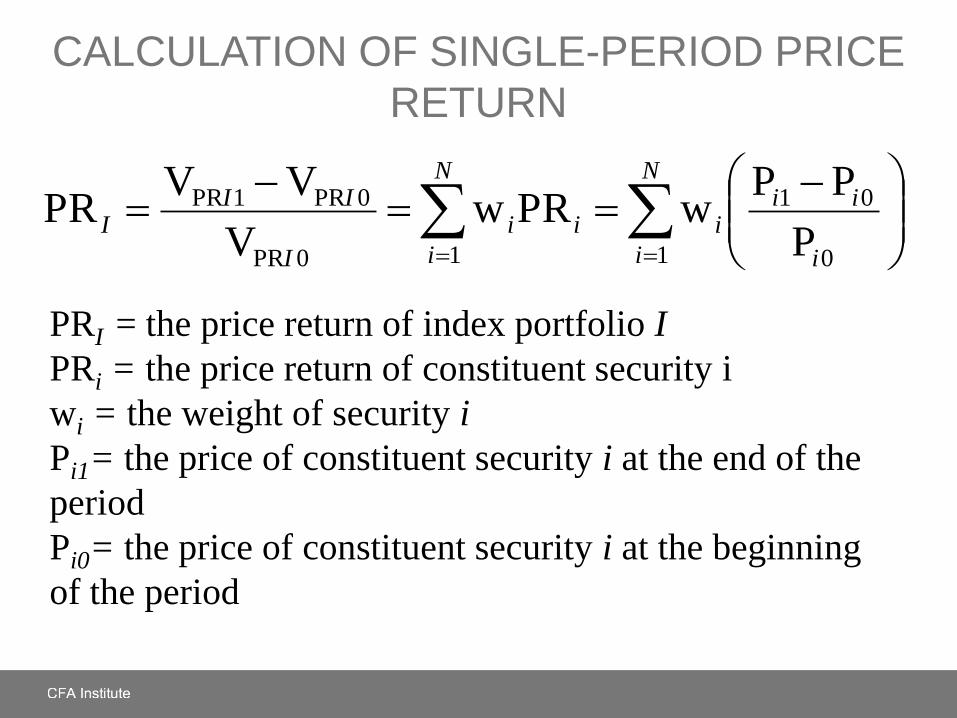
CALCULATION OF SINGLE-PERIOD PRICE
RETURN
N
i
N
i i
iiiii
I
III
1 1 0
01
0PR
0PR1PR
P
PPwPRw
V
VVPR
PRI = the price return of index portfolio I
PRi = the price return of constituent security i
wi = the weight of security i
Pi1= the price of constituent security i at the end of the
period
Pi0= the price of constituent security i at the beginning
of the period

%29.141429.00.105
00.10500.120PR
00.120100
)18400()24100()12200(V
00.105100
)15400()25100()10200(V
1PR
0PR
I
I
I
Security
Beginning
of Period
Price (€)
Ending of
Period Price
(€)
Dividends
per share
(€)
Shares
Outstanding
LMN 10.00 12.00 0.50 200
OPQ 25.00 24.00 1.00 100
RST 15.00 18.00 0.25 400
Divisor = 100
EXAMPLE: CALCULATION OF SINGLE-PERIOD
PRICE RETURN

CALCULATION OF SINGLE-PERIOD TOTAL
RETURNS
N
i
N
i i
iiiiiiI
I
IPRIII
1 1 0
01
0PR
01PR
P
Inc PPwTRwTR
V
Inc VVTR
TRI = the total return of the index portfolio
IncI = the total income from all securities in the index
TRi = the total return of the constituent security i
Inci = the total income from security i

Security
Beginning
of Period
Price (€)
Ending of
Period
Price (€)
Dividends
per share
(€)
Shares
Outstanding
LMN 10.00 12.00 0.50 200
OPQ 25.00 24.00 1.00 100
RST 15.00 18.00 0.25 400
Divisor = 100
00.3100)]25.0400()00.1100()50.0200[(Inc I
%14.171714.00.105
00.300.10500.120TR
I
EXAMPLE: CALCULATION OF SINGLE-PERIOD
TOTAL RETURN

CALCULATION OF INDEX VALUES OVER
MULTIPLE TIME PERIODS
T210TRTTR
T210PRTPR
TR1TR1TR1VV
PR1PR1PR1VV
IIIII
IIIII
The calculation of index values over multiple time
periods requires geometrically linking the series of
index returns.

Period Return (%) Calculation Ending Value
0 1,000(1.00) 1,000.00
1 5.00 1,000(1.05) 1,050.00
2 3.00 1,000(1.05)(1.03) 1,081.50
For an index with an inception value set to 1,000 and
price returns of 5 percent and 3 percent for Periods 1
and 2 respectively, the values of the price return index
would be calculated as follows:
EXAMPLE: CALCULATION OF INDEX VALUES
OVER MULTIPLE TIME PERIODS
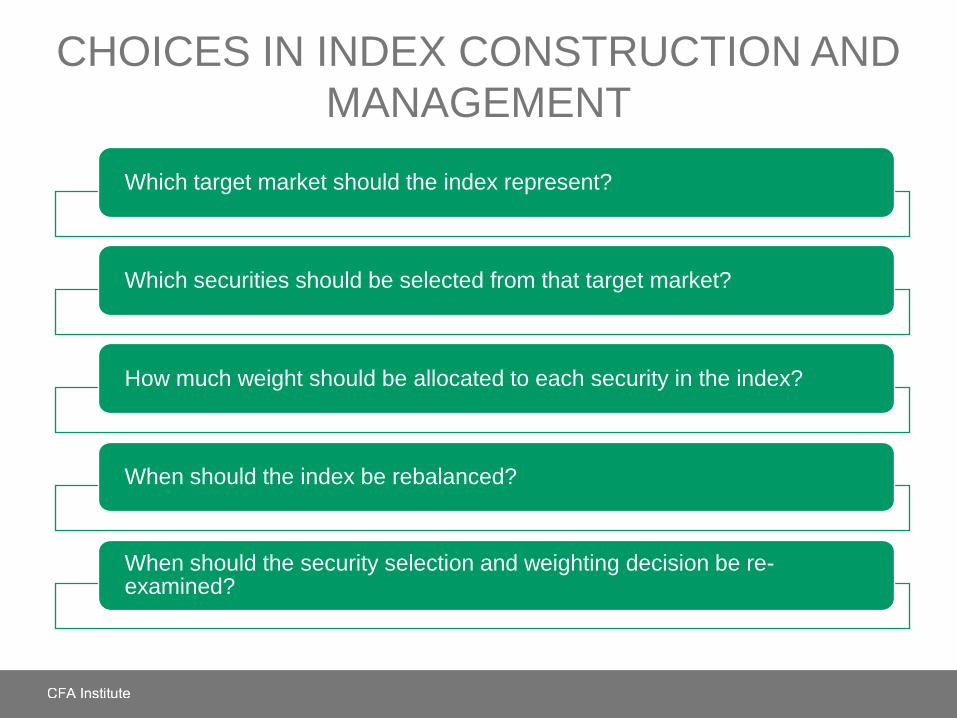
CHOICES IN INDEX CONSTRUCTION AND
MANAGEMENT
Which target market should the index represent?
Which securities should be selected from that target market?
How much weight should be allocated to each security in the index?
When should the index be rebalanced?
When should the security selection and weighting decision be re-examined?

TARGET MARKET SELECTION
Target market
Defined broadly or narrowly?
Based on an asset class?
Based on geographic
region?
Based on an exchange?
Other characteristics
?

DIFFERENT WEIGHTING METHODS USED IN
INDEX CONSTRUCTION
Index weighting
Price weighted
Equal weighted
Market capitalization
weighted
Fundamentally weighted

WEIGHTING SCHEMES
N
i
i
ii
1
P
P
Pw
Ni
1wE
N
j
jj
iii
1
M
PQ
PQw
N
j
j
ii
1
F
F
Fw
Price weighted:
Equal weighted:
Market capitalization weighted:
Factor weighted:

EXHIBIT 2-1 EXAMPLE OF A PRICE-
WEIGHTED INDEX
Security
Shares
in
Index
BOP
Price
Value
(Shares
x BOP
Price)
BOP
Weight
%
EOP
Price
Dividends
Per Share
Value
(Shares
x EOP
Price)
Total
Dividends
Price
Return
%
Total
Return
%
BOP
Weight
x Price
Return
%
BOP
Weight
x Total
Return
%
EOP
Weight
%
A 1 50.00 50.00 49.26 55.00 0.75 55.00 0.75 10.00 11.50 4.93 5.66 52.38
B 1 25.00 25.00 24.63 22.00 0.10 22.00 0.10 –12.00 –11.60 –2.96 –2.86 20.95
C 1 12.50 12.50 12.32 8.00 0.00 8.00 0.00 –36.00 –36.00 –4.43 –4.43 7.62
D 1 10.00 10.00 9.85 14.00 0.05 14.00 0.05 40.00 40.50 3.94 3.99 13.33
E 1 4.00 4.00 3.94 6.00 0.00 6.00 0.00 50.00 50.00 1.97 1.97 5.72
Total 101.50 100 105.00 0.90 3.45 4.33 100.00
Index
Value 20.30 21.00 0.18 3.45 4.33
Divisor = 5
BOP = Beginning of period
EOP = End of period
Type of Index BOP Value Return % EOP Value
Price Return 20.30 3.45 21.00
Total Return 20.30 4.33 21.18

EXHIBIT 2-3 EXAMPLE OF AN EQUAL-
WEIGHTED EQUITY INDEX
Security
Shares
in
Index
BOP
Price
Value
(Shares
x BOP
Price)
Weight
%
EOP
Price
Dividends
Per Share
Value
(Shares
x EOP
Price)
Total
Dividends
Price
Return
%
Total
Return
%
Weight
x Price
Return
%
Weight
x Total
Return
%
EOP
Weight
%
A 40 50.00 2,000 20.00 55.00 0.75 2,200 30 10.00 11.50 2.00 2.30 19.93
B 80 25.00 2,000 20.00 22.00 0.10 1,760 8 –12.00 –11.60 –2.40 –2.32 15.94
C 160 12.50 2,000 20.00 8.00 0.00 1,280 0 –36.00 –36.00 –7.20 –7.20 11.60
D 200 10.00 2,000 20.00 14.00 0.05 2,800 10 40.00 40.50 8.00 8.10 25.36
E 500 4.00 2,000 20.00 6.00 0.00 3,000 0 50.00 50.00 10.00 10.00 27.17
Total 10,000 100.00 11,040 48 10.40 10.88 100.00
Index
Value
1,000 1,104 4.80 10.40 10.88
Divisor = 10
BOP = Beginning of period
EOP = End of period
Type of Index BOP Value Return % EOP Value
Price Return 1,000.00 10.40 1,104.00
Total Return 1,000.00 10.88 1,108.80

EXHIBIT 2-4 EXAMPLE OF A MARKET-
CAPITALIZATION-WEIGHTED EQUITY INDEX
Stock
Shares
Out-
standing
BOP
Price
BOP
Market
cap
BOP
Weight
%
EOP
Price
Dividends
Per Share
EOP
Market
cap
Total
Dividends
Price
Return
%
Total
Return
%
BOP
Weight
x Price
Return
%
BOP
Weight
x Total
Return
%
EOP
Weight
%
A 3,000 50.00 150,000 26.29 55.00 0.75 165,000 2,250 10.00 11.50 2.63 3.02 28.50
B 10,000 25.00 250,000 43.82 22.00 0.10 220,000 1,000 –12.00 –11.60 –5.26 –5.08 38.00
C 5,000 12.50 62,500 10.96 8.00 0.00 40,000 0 –36.00 –36.00 –3.95 –3.95 6.91
D 8,000 10.00 80,000 14.02 14.00 0.05 112,000 400 40.00 40.50 5.61 5.68 19.34
E 7,000 4.00 28,000 4.91 6.00 0.00 42,000 0 50.00 50.00 2.46 2.46 7.25
Total 570,500 100.00 579,000 3,650 1.49 2.13 100.00
Index
Value 1,000 1,014.90 6.40 1.49 2.13
Divisor = 570.50
BOP = Beginning of period
EOP = End of period
Type of Index BOP Value Return % EOP Value
Price Return 1,000.00 1.49 1,014.90
Total Return 1,000.00 2.13 1,021.30

COMPARISON OF FUNDAMENTAL WEIGHTING WITH
MARKET-CAPITALIZATION WEIGHTING
Stock A
Earnings = €20
Market cap = €200
Market cap weight = 20%
Fundamental weight = 50%
Stock B
Earnings = €20
Market cap = €800
Market cap weight = 80%
Fundamental weight = 50%
Assume a 2-stock Index, consisting of Stock A and
Stock B:

ADVANTAGES AND DISADVANTAGES
Price weighted
Simple
High price stocks have
greater impact
Stock splits result in arbitrary changes
Equal weighted
Simple
Under- and over-
representation
Frequent rebalancing
Market capitalization
weighted
Securities held in
proportion to their value
Similar to a momentum
strategy
Fundamental weighted
Ensures a value or
contrarian tilt
Data intensive

REBALANCING
May become necessary as market prices
change
Creates
turnover
Rebalancing

RECONSTITUTION
Beginning index
Reconstitution date
New index
Change
constituent
securities?

USES OF MARKET INDICES
Gauges of market sentiment
Proxies for measuring and modeling returns, systematic risk, and risk-adjusted performance
Proxies for asset classes in asset allocation models
Benchmarks for actively managed portfolios
Model portfolios for such investment products as index funds and exchange-traded funds (ETFs)
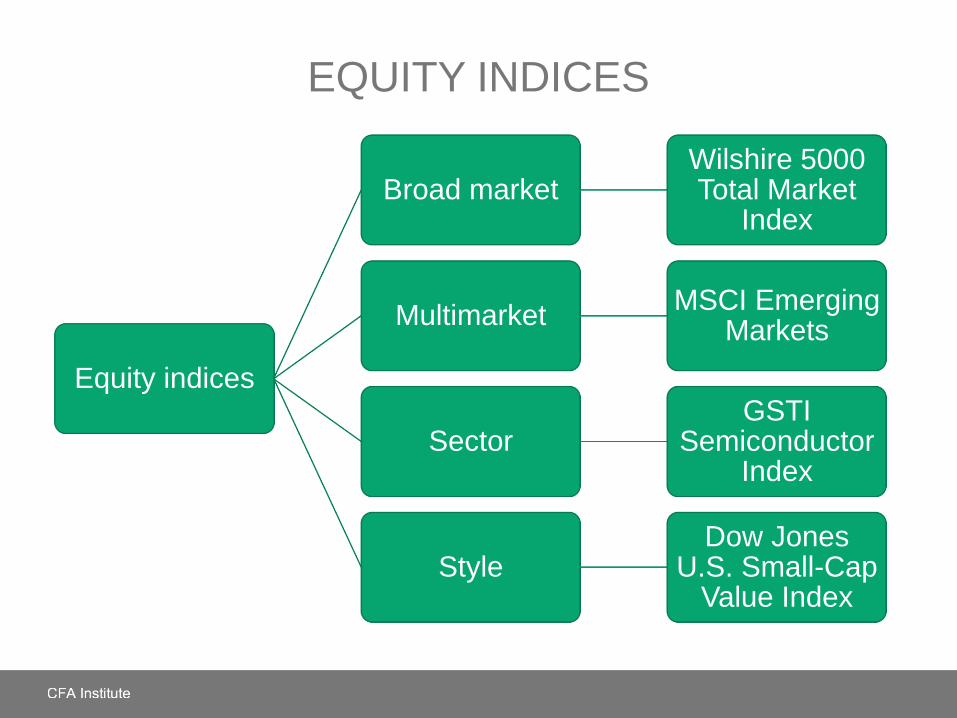
EQUITY INDICES
Equity indices
Broad marketWilshire 5000 Total Market
Index
MultimarketMSCI Emerging
Markets
SectorGSTI
Semiconductor Index
StyleDow Jones
U.S. Small-Cap Value Index

CHALLENGES FACING FIXED INCOME INDEX
CONSTRUCTION
Lack of pricing data
Number of
securities
Illiquid securities

EXHIBIT 2-9 DIMENSIONS OF FIXED-INCOME
INDICES
Market
Global
Regional
Country or currency zone
Type Corporate
Collateralized
Securitized
Mortgage-
backed
Government
agencyGovernment
Maturity For example, 1–3, 3–5, 5–7, 7–10, 10+ years;
short-term, medium-term, or long-term
Credit
quality
For example, AAA, AA, A, BBB, etc.; Aaa, Aa, A,
Baa, etc.; investment grade, high yield
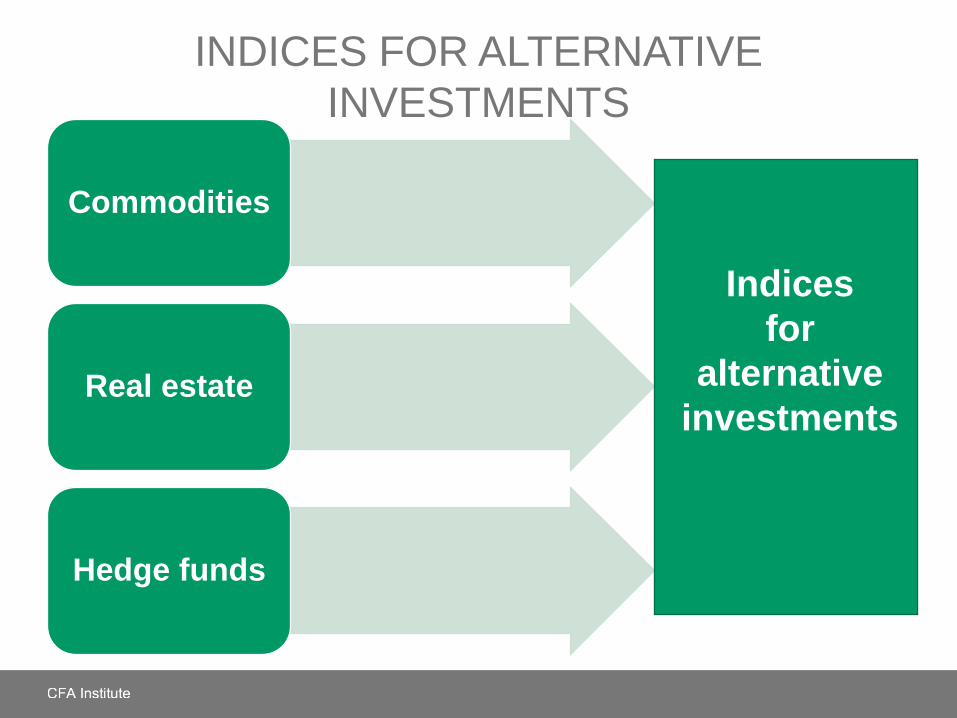
INDICES FOR ALTERNATIVE
INVESTMENTS
Commodities
Real estate
Hedge funds
Indices
for
alternative
investments

COMMODITY INDICES
Risk-free interest rate
Changes in futures prices
Roll yield
Commodity index return

REAL ESTATE INDICES
Appraisal indices
Repeat sales indices
Real estate investment trust (REIT) indices
Ownership of properties
Investment in mortgages

EXHIBIT 2-12 THE FTSE EPRA/NAREIT GLOBAL
REIT INDEX FAMILY
Source: FTSE International, “FTSE EPRA/NAREIT Global & Global Ex US Indices”
(Factsheet 2009).

HEDGE FUND INDICES
Hedge funds are private investment vehicles that typically use leverage and long and short investment strategies.
Research organizations maintain databases of hedge fund returns and summarize these returns into indices.
Most indices reflect performance on a broad global level or on a strategy level.
Most indices are equal weighted.
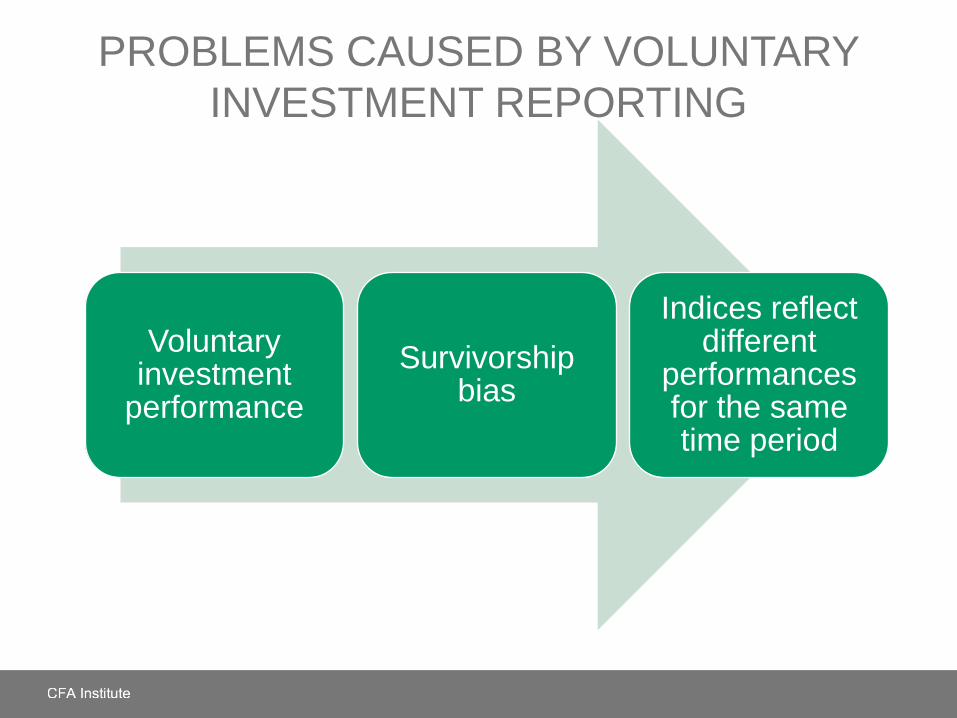
PROBLEMS CAUSED BY VOLUNTARY
INVESTMENT REPORTING
Voluntary investment
performance
Survivorship bias
Indices reflect different
performances for the same time period
SUMMARY
• Price return index
• Total return index
• Choices in index construction and management
• Advantages and disadvantages of different weighting schemes
• Rebalancing and reconstitution
• Uses of market indices
• Equity, fixed income, and alternative investment indices