
Section 3groundwater.fullerton.edu/Ongoing_Research/San_Gabriel... · Web viewStream flow can be...
22
Section 3e Collecting Water Samples One of the critical skills needed to conduct water quality testing is the ability to properly collect samples. Your monitoring program leader will provide specific instructions on proper sample collection. All water samples should be collected and transported to the laboratory in strict accordance with these instructions (see San Gabriel River QAPP). The Freshwater and Marine Team is composed of various groups that collect water samples in different environments. Some monitoring programs work in shallow streams, rivers, and estuaries, and other programs work in deep rivers, lakes, estuaries, and the ocean. The Collecting Water Samples section is divided into three components: sampling wadeable (shallow) streams, rivers, and estuaries, non-wadeable concrete lined and deep water sampling from boats, piers, and bridges. Please select the section that is appropriate for your monitoring group. Collecting Water Samples General Information Often, the Freshwater and Marine Team will be asked to collect additional samples for other groups or agencies so that they can run additional tests. Citizen monitoring groups have limited laboratory space and typically do not have the facilities or equipment to conduct certain tests. This partnership between public agencies and citizen monitoring groups benefits both parties. Public agencies save a great deal of money by having field samples collected for free. Citizen groups benefit from the public agencies ability to run additional tests that that are often too costly for the citizen group. The Freshwater and Marine Team collects four types of samples: 1. Bacteria samples are collected in sterile containers. The critical issue is that these containers have been specially cleaned so that they contain no bacteria that might contaminate our water samples. * When collecting bacteria samples, never rinse the sample container. The Freshwater and Marine Team collects bacteria samples in a 120 ml sterile bottle or a sterile Friends of the San Gabriel River Field Manual Page 3e - 1
Transcript of Section 3groundwater.fullerton.edu/Ongoing_Research/San_Gabriel... · Web viewStream flow can be...

Section 3e
Collecting Water Samples
One of the critical skills needed to conduct water quality testing is the ability to properly collect samples. Your monitoring program leader will provide specific instructions on proper sample collection. All water samples should be collected and transported to the laboratory in strict accordance with these instructions (see San Gabriel River QAPP). The Freshwater and Marine Team is composed of various groups that collect water samples in different environments. Some monitoring programs work in shallow streams, rivers, and estuaries, and other programs work in deep rivers, lakes, estuaries, and the ocean. The Collecting Water Samples section is divided into three components: sampling wadeable (shallow) streams, rivers, and estuaries, non-wadeable concrete lined and deep water sampling from boats, piers, and bridges. Please select the section that is appropriate for your monitoring group.
Collecting Water Samples General Information
Often, the Freshwater and Marine Team will be asked to collect additional samples for other groups or agencies so that they can run additional tests. Citizen monitoring groups have limited laboratory space and typically do not have the facilities or equipment to conduct certain tests. This partnership between public agencies and citizen monitoring groups benefits both parties. Public agencies save a great deal of money by having field samples collected for free. Citizen groups benefit from the public agencies ability to run additional tests that that are often too costly for the citizen group.
The Freshwater and Marine Team collects four types of samples:
1. Bacteria samples are collected in sterile containers. The critical issue is that these containers have been specially cleaned so that they contain no bacteria that might contaminate our water samples. * When collecting bacteria samples, never rinse the sample container. The Freshwater and Marine Team collects bacteria samples in a 120 ml sterile bottle or a sterile sample bag known as a Whirl-Pak (Figure 3-28).
2. Preserved Samples are water samples that Figure 3-28: Bacteria Sample Containers require some type of chemical additive (usually acid) to prevent the water samples from undergoing unwanted chemical reactions. Never place preserved sample containers into a waterbody. Always use the specially designated “filling container” to fill sample bottles containing preservative.
3. Standard samples are used to collect any measurements on site such as turbidity, pH, and conductivity. In addition, nitrates, phosphates, pesticides, and toxicity water samples are all collected in this manner. Standard samples are rinsed in the waterbody or with the sample water
Friends of the San Gabriel River Field ManualPage 3e - 1

Section 3e
three times before being filled. This insures that any contaminants that may have been in the sample container are removed prior to taking an actual water sample.
4. Blanks samples are used for quality assurance / quality control of the laboratory. This insures that the laboratory is following proper procedures and have not cross-contaminated their instrumentation.
Friends of the San Gabriel River Field ManualPage 3e - 2
Section 3e
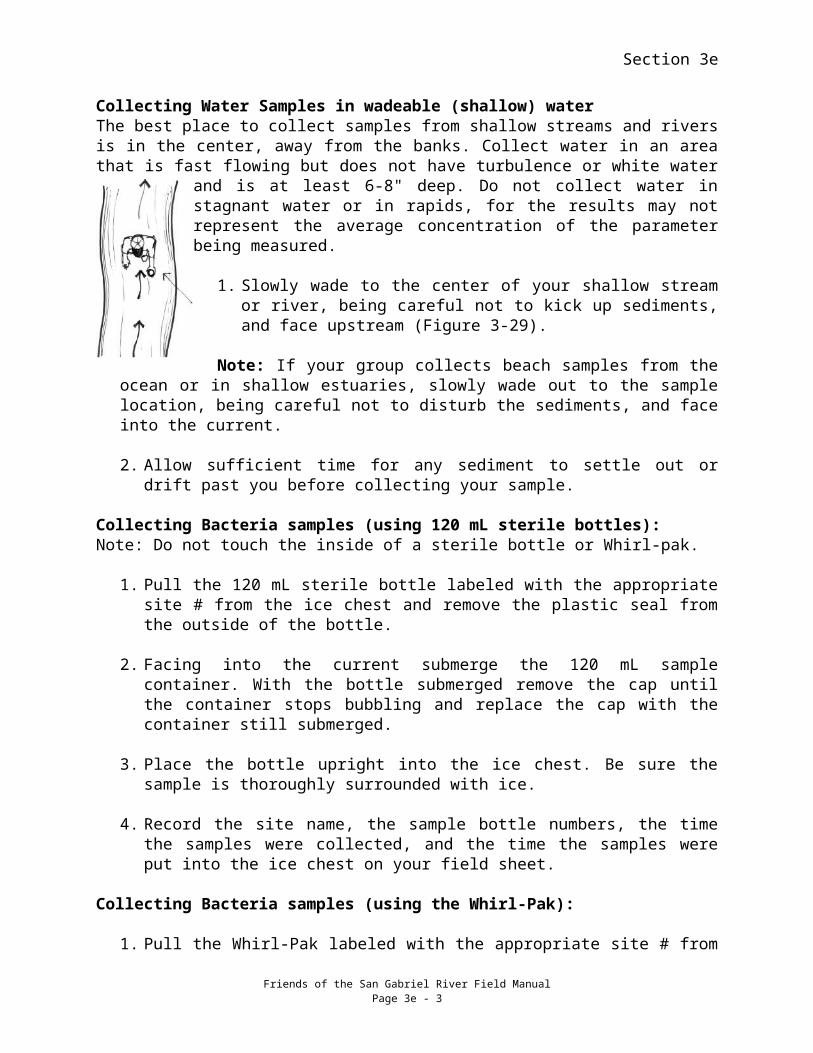
Collecting Water Samples in wadeable (shallow) waterThe best place to collect samples from shallow streams and rivers is in the center, away from the banks. Collect water in an area that is fast flowing but does not have turbulence or white water and is at least 6-8" deep. Do not collect water in stagnant water or in rapids, for the results may
not represent the average concentration of the parameter being measured.
1. Slowly wade to the center of your shallow stream or river, being careful not to kick up sediments, and face upstream (Figure 3-29).
Note: If your group collects beach samples from the ocean or in shallow estuaries, slowly wade out to the sample location, being careful not to disturb the sediments, and face into the current.
2. Allow sufficient time for any sediment to settle out or drift past you before collecting your sample.
Collecting Bacteria samples (using 120 mL sterile bottles):Note: Do not touch the inside of a sterile bottle or Whirl-pak.
1. Pull the 120 mL sterile bottle labeled with the appropriate site # from the ice chest and remove the plastic seal from the outside of the bottle.
2. Facing into the current submerge the 120 mL sample container. With the bottle submerged remove the cap until the container stops bubbling and replace the cap with the container still submerged.
3. Place the bottle upright into the ice chest. Be sure the sample is thoroughly surrounded with ice.
4. Record the site name, the sample bottle numbers, the time the samples were collected, and the time the samples were put into the ice chest on your field sheet.
Collecting Bacteria samples (using the Whirl-Pak):
1. Pull the Whirl-Pak labeled with the appropriate site # from the ice chest. If your Whirl-Pak is not labeled, label the Whirl-Pak with the site number, date and time the samples were collected.
2. Remove the perforation seal from the top of the Whirl-Pak (Figure 3-28).
3. Submerge the Whirl-Pak. With the Whirl Pak submerged pull out on the side tabs to open the bag until it fills with water (Figure 3-30). With the Whirl-Pak underwater, close the bag and remove the sample.
Friends of the San Gabriel River Field ManualPage 3e - 3

Section 3e
4. Hold the Whirl-Pak from the ends, and flip the bag away from your body two to three times to ensure a water tight seal (Figure 3-31).
5. Secure the closure by snugly twisting the metal ties together and folding the metal-reinforced ends around the Whirl-Pak (Figure 3-32).
6. Hold the Whirl-Pak upside down and carefully check for leaks and/or punctures. Repeat the above steps until the sample is water tight.
7. Place the Whirl-Pak in the ice chest and gently surround the Whirl-Pak with ice, being careful not to puncture it.
8. Record the information labeled on the Whirl-Pak and the time the samples were put on ice on your field sheet.
Collecting Preserved and Standard Water samples: (Always use a designated filling container to fill a sample bottle containing preservative and labeled “preserved”). Please follow the instructions below for any sample labeled preserved.
1. Pull the Designated filling container labeled with the appropriate site # from your field kit. Each container will have a site number labeled on the side; use only the container with the appropriate site numbers.
2. Acclimate the large filling container marked for your site by filling and rinsing it out with water from your waterbody three times. Don’t forget the cap.
3. Submerge the large container with the cap on below the surface of the water.
4. With the container submerged remove the cap until the container stops bubbling and replace the cap with the container still submerged.
5. Use the designated filling container to carefully fill all the smaller sample bottles labeled “preserved” with the appropriate site #. DO NOT ALLOW PRESERVED SAMPLE CONTAINERS TO OVERFLOW.
Friends of the San Gabriel River Field ManualPage 3e - 4

Section 3e
6. Place the samples in the cooler standing straight up surrounded and supported by the ice.
7. Record the number of each sample written on the sample bottle, the time the samples were collected, and the time the samples were put on ice on the Field Sheet.
If your group does not use preserved sample containers you will collect a Standard Sample by following steps 2-4 and 6-7 above using the designated sampling bottles for your sampling site.
Friends of the San Gabriel River Field ManualPage 3e - 5

Section 3e
Collecting sample in a concrete lined channel
The best place to collect samples from a concrete lined channel is from the dry bank area. Collect water in an area that is fast flowing but does not have turbulence or white water. Do not wade into the channel even if water appears to moving slowly. Collect water and handle instrumentation from the sides.
Collecting water for field analysis: When utilizing sampling apparatus do not drop the instrument or bang it against the channel. Lower in slowly from the bank following procedures outlined in section 3c.
Collecting water for laboratory analysis: (Always use a designated filling container to fill sample bottles and labeled “preserved” or “not preserved”). Please follow the instructions below for any sample labeled preserved.
8. Pull the Designated filling container labeled with the appropriate site # from your field kit. Each container will have a site number labeled on the side; use only the container with the appropriate site numbers.
9. Acclimate the large filling container marked for your site by filling and rinsing it out with water from your waterbody three times. Don’t forget the cap.
10. Submerge the large container with the cap on below the surface of the water.
11. With the container submerged remove the cap until the container stops bubbling and replace the cap with the container still submerged.
12. Use the designated filling container to carefully fill all the smaller sample bottles labeled “preserved” with the appropriate site #. DO NOT ALLOW PRESERVED SAMPLE CONTAINERS TO OVERFLOW.
13. Place the samples in the cooler standing straight up surrounded and supported by the ice.
14. Record the number of each sample written on the sample bottle, the time the samples were collected, and the time the samples were put on ice on the Field Sheet.
If your group does not use preserved sample containers you will collect a Standard Sample by following steps 2-4 and 6-7 above using the designated sampling bottles for your sampling site.
Friends of the San Gabriel River Field ManualPage 3e - 6

Section 3e
Collecting Water Samples in Deep Water
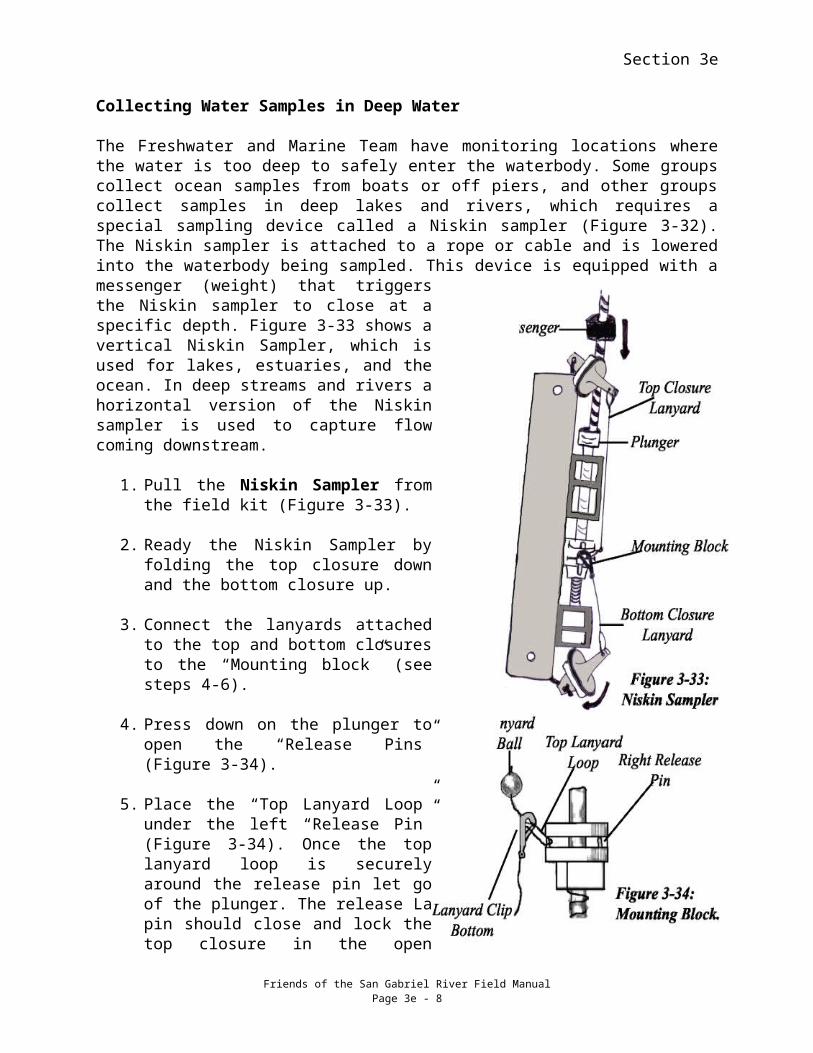
The Freshwater and Marine Team have monitoring locations where the water is too deep to safely enter the waterbody. Some groups collect ocean samples from boats or off piers, and other groups collect samples in deep lakes and rivers, which requires a special sampling device called a Niskin sampler (Figure 3-32). The Niskin sampler is attached to a rope or cable and is lowered into the waterbody being sampled. This device is equipped with a messenger (weight) that triggers the Niskin sampler to close at a specific depth. Figure 3-33 shows a vertical Niskin Sampler, which is used for lakes, estuaries, and the ocean. In deep streams and rivers a horizontal version of the Niskin sampler is used to capture flow coming downstream.
1. Pull the Niskin Sampler from the field kit (Figure 3-33).
2. Ready the Niskin Sampler by folding the top closure down and the bottom closure up.
3. Connect the lanyards attached to the top and bottom closures to the “Mounting block” (see steps 4-6).
4. Press down on the plunger to open the “Release Pins” (Figure 3-34).
5. Place the “Top Lanyard Loop” under the left “Release Pin” (Figure 3-34). Once the top lanyard loop is securely around the release pin let go of the plunger. The release La pin should close and lock the top closure in the open position.
6. Attach the “Bottom Lanyard Clip” onto the top closure lanyard above the top lanyard loop and below the “Lanyard Ball” (Figure 3-34). This should lock the bottom closure into the open position (Figure 3-33).
7. Lower the open Niskin sampler into the waterbody to the depth that you wish to collect your sample. Your monitoring program leader will specify the sampling depth. If you do not receive explicit
Friends of the San Gabriel River Field ManualPage 3e - 7
Section 3e
instructions, lower the Niskin sampler to a depth of one meter.
8. Acclimate the Niskin sampler by holding it stationary at the sampling depth for at least one minute.
9. Release the messenger (weight) that is attached to the lowering rope. When the messenger hits the plunger it will trigger the release pins and allow the top and bottom lanyards to escape. This will close the Niskin sampler at the desired sampling depth.
10. Slowly retrieve the sampler by pulling up on the rope. The Niskin sampler can then be used to fill “Bacteria Samples”, “preserved Samples”, and “Standard Samples”. Follow the instructions for Collecting Bacteria Samples or Collecting Preserved and Standard Samples on pgs. 3e 2-4.
Friends of the San Gabriel River Field ManualPage 3e - 8

Section 3e
Stream Flow
Adapted from Streamkeeper’s Field Guide (Murdoch, Cheo, and O'Laughin 1996, p. 108)
If there is an operational USGS gage located at or near the sampling site, its height should be recorded in feet and later converted to an instantaneous flow value. Stream flow is measured by calculating the volume of water that passes a particular point in a stream within a specified amount of time. To calculate flow you must know two things: how much water a section of stream holds (volume), and how fast that water is moving (velocity). Stream flow can be determined by measuring the velocity of water and the cross sectional area of the stream. The formula to use when calculating stream flow is:
stream flow = velocity x cross sectional area
To measure velocity, a float (orange peel) will be used to determine how fast the water is flowing. To calculate the cross sectional area of the stream, a stadia rod (vertical measuring stick) will be used to measure water depth at 1-foot intervals across the width of the stream (Figure 3-35).
Procedures for determining stream flow:
1. Pick a 20-foot long section of the stream that is straight and of uniform width. Water should be flowing evenly within this section without turbulence, obstacles or other disturbances. This section of the stream should be shallow enough for you to safely wade across and conduct the stream flow test. In narrow headwater streams it may be necessary to choose a 10-foot long stream section.
2. Securely hammer in two stakes directly across from each other on the wetted edge of each stream bank. The wetted edge is where the land and water meet. Stretch the string line across the stream and securely attach it to the two stakes. The string line should be stretched across the stream at a 90 degree angle. (Figure 3-35).
3. Have a teammate hold the loose end of the tape measure against the stake on the left stream bank. Walk downstream along the left stream bank while stretching out the tape measure until it reads 20-feet. Hammer in another stake.
Friends of the San Gabriel River Field ManualPage 3e - 9

Section 3e
4. Repeat step 2 on the right stream bank and attach the string line on the downstream stakes. You should have 2 sets of stakes and string lines stretched across the stream, approximately 20-feet apart (Figure 3-35).
5. Using the string line as your guide, measure the wetted stream channel across the upstream set of stakes. Hold the tape measure as close to the surface of the stream as possible and make sure the tape is stretched tightly (Figure 3-36). The wetted channel is the width of the stream where the water just touches the land. Record this information at the top of the Stream Flow Field Sheet (Figure 3-37 on pg. 3e-11).
6. Attach the loose end of the tape measure to one of the stakes using the spring clamp provided in the field kit. Have one of your teammates stretch and attach the tape measure to the stake on the opposite stream bank with the second spring clamp. The tape measure should be placed directly beside the string line and stretched tightly.
This will be the starting line for the stream flow velocity trials.
7. Have one person take the stadia rod to measure the depth of the water at 1-foot intervals across the stream, use the tape measure to establish these points. Continue to measure at 1-foot intervals until you reach the edge of the water on the opposite side of the stream bank. Call out the depth measurements at every 1-foot interval so it can be recorded on the Stream Flow Field Sheet. The upstream string line is Cross section and wetted width # 1.
Reading the Stadia Rod
Hold the stadia rod plumb (straight up and down) and on the stream bottom. You are taking measurements at every foot along the horizontal tape measure that is stretched across the stream.The team is measuring at the four foot mark on the tape measure in (Figure 3-35). The stadia rod touches the top of the stream water at the 2.75 inch mark (Figure 3-36). Record 2.75 inches on the Stream Flow Field Sheet in the box directly beside the # 4 box.
Note: Each line on the stadia rod is equal to 0.25 inches.
Friends of the San Gabriel River Field ManualPage 3e - 10

Section 3e
8. Repeat steps 4-6 at the second set of stakes located 20-feet downstream.
This is the finish line for your stream flow velocity trials. Do not remove the string line until after velocity trials.
9. Add up the columns for cross section 1 and 2 and place your result in the boxes labeled “Sum of section1 and 2” on the Stream Flow Field Sheet. In the example on pg. 3e-11, the "Sum of section 1 and 2 “are 69 and 110.
10. If your stadia rod is in feet and inches divide the sum of each section by 12 to convert to decimal feet. 69/12= 5.75 and 110/12 = 9.17
11. Add the converted Sum of each cross section and divide by 2 to calculate the “Average Cross Sectional Area.” In the example (5.75 + 9.17 = 14.92) (14.92/2= 7.46)
Now you are ready for the velocity float trial part of the stream flow test.
1. Peel the orange provided in your Field Kit into pieces the size of a quarter. It is suggested that you peel at least 10 quarter size pieces.
Note: Be sure to eat the delicious orange that was lovingly selected by your monitoring program leader. Please share the orange with your team.
2. Record the distance between the start line and the finish line on the Stream Flow Velocity Trials Field Sheet (Figure 3-39 on pg. 3e-11). This distance should be 20-feet.
3. One team member stands in the stream at the starting line with an orange peel. Another team member stands downstream at the finish line waiting to retrieve the orange peel as it crosses the finish line. A third team member is standing on the bank next to the start line with a stopwatch and clipboard.
4. The team member at the starting line drops an orange peel and as it passes the starting line, the person on the bank starts the stopwatch. The person with the stop watch walks ahead to the finish line and stops the watch as the orange peel passes it. The orange peel is retrieved, and the time is recorded on the Stream Flow Field Sheet.
5. Repeat this test five times moving from left to right across the entire stream channel. The first velocity trial should be along the slow moving left edge of the stream. The last velocity trial should be along the slow moving right edge of the stream. It is critical that we calculate velocity on the slower stream edges and the fast moving middle. Doing this will give you a more representative depiction of stream flow.
Friends of the San Gabriel River Field ManualPage 3e - 11
Section 3e
6. Add up the times for each of the velocity float trials and divide by the number of trials (5) to get an “Average Velocity” (Figure 3-39 pg. 3e 12). Record the results on the Stream Flow Field Sheet.
7. Use the Stream Flow Field Sheet to calculate surface velocity (Figure 3-38). Divide “distance” (20-feet) by “Average Velocity” to get “Average Surface Velocity” in feet per second. Next, multiply this result by the velocity correction factor of 0.8 to get “Average Corrected Velocity”. The velocity correction factor has been added to adjust for the fact that water velocity at the surface is faster than water velocity closer to the bottom of a stream.
8. Finally, calculate stream flow by multiplying “Average Corrected Velocity” by “Average Cross Sectional Area”. Your result will be in CFS (cubic feet per second). Record this number on the Stream Flow Field Sheet (Figure 3-39).
Friends of the San Gabriel River Field ManualPage 3e - 12

Section 3e
Figure 3-38: Stream Flow Field Sheet
Friends of the San Gabriel River Field ManualPage 3e - 13

Section 3e
Figure 3-39: Stream Flow Velocity Float Trials Field Sheet
Friends of the San Gabriel River Field ManualPage 3e - 14

Section 3e
FLOW OBSERVATIONS IN MARINE AND ESTUARINE ENVIRONMENTS
In estuaries and beaches, or areas where it is not feasible to enter the water, we can make visual observations that describe the flow and current. Wind conditions, surf height, sea state conditions, and tidal flows are useful to describe flow.
Measuring Current DirectionCurrent is determined by watching what direction a floating object moves in relation to the beach. Use the following instructions to measure the direction of the current at your monitoring site.
1. Peel the orange provided in your Field Kit into pieces the size of a quarter. It is suggested that you peel at least 3 quarter size pieces.
2. Stand on the beach or shoreline facing the waterbody. Draw a line in the sand or dirt to mark your starting position.
3. Throw each of the three orange peels into the water, waiting fifteen seconds in between each peel.
4. Stand on the start line that was drawn on the shoreline. Watch the orange peels to determine which direction they are moving. Wait at least two minutes to determine the direction of the current by observing the orange peels.
5. If possible, find and retrieve the orange peels.
6. Record the direction of the current on your field sheet by circling the correct direction. Choices are: upcoast (North), Downcoast (South), or None if the orange peel does not appear to move in either direction.
Estimating Surf HeightSurf height is a visual estimate of the wave height from the bottom of the wave (trough) to the peak. Use the following instructions to visually estimate the surf height at your monitoring site.
1. Stand on the beach or shoreline facing the waterbody.
2. Visually estimate the height of surf from the bottom (trough) of the wave to its peak.
3. Circle the answer on the field sheet that best describes the surf height. Flat = 0 - 1 ft, Low = 1 - 3 ft, Medium = 3 - 7 ft, and High is 7 ft or larger.
Friends of the San Gabriel River Field ManualPage 3e - 15

Section 3e
Sea State ConditionsSelect the answer that best describes the sea state conditions and circle it on your field sheet. Choose one of the following: Calm, Swell, Choppy, or White Caps. The monitoring leader will train you to identify the different “Sea State” conditions.
Determining Tidal ConditionsIt is critical to know what the tidal conditions are at the time you are sampling. Use the Tide Chart provided in your field kit to determine the tidal conditions. Tide charts show the two high tides and two low tides that occur every 24 hours.
Reading the Tide ChartTide charts show the time and height of low and high tides for a given area. Imagine you are collecting your sample at 8:56 am on Saturday August 2nd. Using the tide chart below, find the high or low tide that most closely approximates 8:56 am. In this example, the high tide occurred at 2:54 am and low tide will occur at 9:08 am. The tide is moving from high to low. The result would be recorded on the field sheet as low tide because it is within 15 minutes of the posted time. Choose the answer on the field sheet that best describes the tide at the time you are sampling. High tides on August 2nd would occur between 2:39 - 3:09 am and 3:12 - 3:42 pm. Low tides would occur between 8:53 - 9:23 am and 9:21 - 9:51 pm. Ebb tides occur when the tide is changing from high to low. For example, from 3:09 am - 9:23 am would be an ebb tide. Flood tides occur when the tide is going from low to high, for example, from 9:21 pm - 2:39 am.
Date High Low
August hgt (ft) AM hgt (ft.) PM hgt (ft.) AM hgt (ft.) PM
Friday 1 2:08 10.3 2:42 9.5 8:31 -0.5 8:47 0.3
Sat 2 2:54 10.2 3:27 9.7 9:08 -0.4 9:36 0.1
Figure 3-40: Tide Chart
1. Look up the date and time of the sampling on the tide chart.
2. Record the tidal conditions on the field sheet by circling the answer of the correct condition.
Wind ConditionsWind plays an important role in determining wave height and sea state conditions in the ocean, and currents in estuaries. A scale known as the Beaufort scale was created to quantify wind strength (Figure 3-41). Freshwater And Marine Team volunteers will use the Beaufort scale to quantify the wind strength at their marine and estuary sampling locations.
Friends of the San Gabriel River Field ManualPage 3e - 16

Section 3e
Number Description Wind Speed(MPH)
Sea Surface
0 Calm 0 Like a mirror, smoke risesvertically
1 Light Air 1-3 Ripples, smoke driftsslightly
2 Light Breeze 4-7Small wavelets, not
breaking, leaves on treesrustle, wind felt on face
3 Gentle Breeze 8-12Larger wavelets, scatteredwhite caps, flags extended
4 Moderate Breeze 13-18
Small waves, numerouswhitecaps, loose leaves, litter
and dust raised up
5 Fresh Breeze 19-24Moderate waves, manywhitecaps, some spray
6 Strong Breeze 25-31Large waves, whitecapseverywhere, more spray,large tree branches sway,wind whistling in wires
7 Moderate Gale 32-38Foam from breaking waves
blown in streaks, wholetrees move, resistance felt
when walking against wind
8 Fresh Gale 39-46
Moderate high waves ofgreater length, twigs and
small branches broken offtrees, progress impeded
when walking9 Strong Gale 47-54
High waves, sea begins toroll, spray reduce visibility,
roof tiles blown off
10 Whole Gale 55-63
Very high waves withoverhanging crests, heavy
rolling , poor visibility,trees broken or uprooted
Figure 3-41: Beaufort Scale for Wind Conditions
Friends of the San Gabriel River Field ManualPage 3e - 17

Section 3e
Measuring Wind Conditions (Beaufort Scale)Select the Beaufort Scale Number that best represents the wind conditions at your site.
1. Look up the Beaufort scale on pg. 3e-15 in the Freshwater and Marine Team Field Guide.
2. Select the appropriate Beaufort Scale number from the “Number” column that best reflects the wind conditions at the monitoring site using the “Description” column, “Wind Speed” column, and “Sea Surface” column.
3. Record the appropriate Beaufort scale “Number” on the field sheet.
Friends of the San Gabriel River Field ManualPage 3e - 18


![Cross sectional study.pptx [Read-Only]...Descriptive cross-sectional study Analytic cross-sectional study Repeated cross-sectional study 7 Descriptive Collected number of cases and](https://static.fdocuments.in/doc/165x107/5f0c07f77e708231d43368fd/cross-sectional-studypptx-read-only-descriptive-cross-sectional-study-analytic.jpg)