SECTION 5.2 THE BINOMIAL DISTRIBUTION Copyright ©2014 The McGraw-Hill Companies, Inc. Permission...
34
SECTION 5.2 THE BINOMIAL DISTRIBUTION Copyright ©2014 The McGraw-Hill Companies, Inc. Permission required for reproduction or display. Copyright ©2014 The McGraw-Hill Companies, Inc. Permission required for reproduction or display.
-
Upload
cecil-booth -
Category
Documents
-
view
213 -
download
1
Transcript of SECTION 5.2 THE BINOMIAL DISTRIBUTION Copyright ©2014 The McGraw-Hill Companies, Inc. Permission...
Copyright ©2014 The McGraw-Hill Companies, Inc. Permission required for reproduction or display.
SECTION 5.2THE BINOMIAL DISTRIBUTION
Copyright ©2014 The McGraw-Hill Companies, Inc. Permission required for reproduction or display.

Objectives
1. Determine whether a random variable is binomial
2. Determine the probability distribution of a binomial random variable
3. Compute binomial probabilities
4. Compute the mean and variance of a binomial random variable
Copyright ©2014 The McGraw-Hill Companies, Inc. Permission required for reproduction or display.

Determine whether a random variable is binomial
Objective 1
Copyright ©2014 The McGraw-Hill Companies, Inc. Permission required for reproduction or display.

Binomial Distribution
Suppose that your favorite fast food chain is giving away a coupon with every purchase of a meal. Twenty percent of the coupons entitle you to a free hamburger, and the rest of them say “better luck next time.” Ten of you order lunch at this restaurant.
What is the probability that three of you win a free hamburger? In general, if we let X be the number of people out of ten that win a free hamburger. What is the probability distribution of X?
In this section, we will learn that X has a distribution called the binomial distribution, which is one of the most useful probability distributions.
Copyright ©2014 The McGraw-Hill Companies, Inc. Permission required for reproduction or display.

Binomial Distribution
In the problem just described, each time we examine a coupon, we call it a “trial,” so there are 10 trials. When a coupon is good for a free hamburger, we will call it a “success.” The random variable X represents the number of successes in 10 trials.
A random variable that represents the number of successes in a series of trials has a probability distribution called the binomial distribution. The conditions are. A fixed number of trials are conducted. There are two possible outcomes for each trial. One is
labeled “success” and the other is labeled “failure.” The probability of success is the same on each trial. The trials are independent. This means that the outcome of
one trial does not affect the outcomes of the other trials. The random variable X represents the number of successes
that occur.Copyright ©2014 The McGraw-Hill Companies, Inc. Permission required for reproduction or display.
Notation
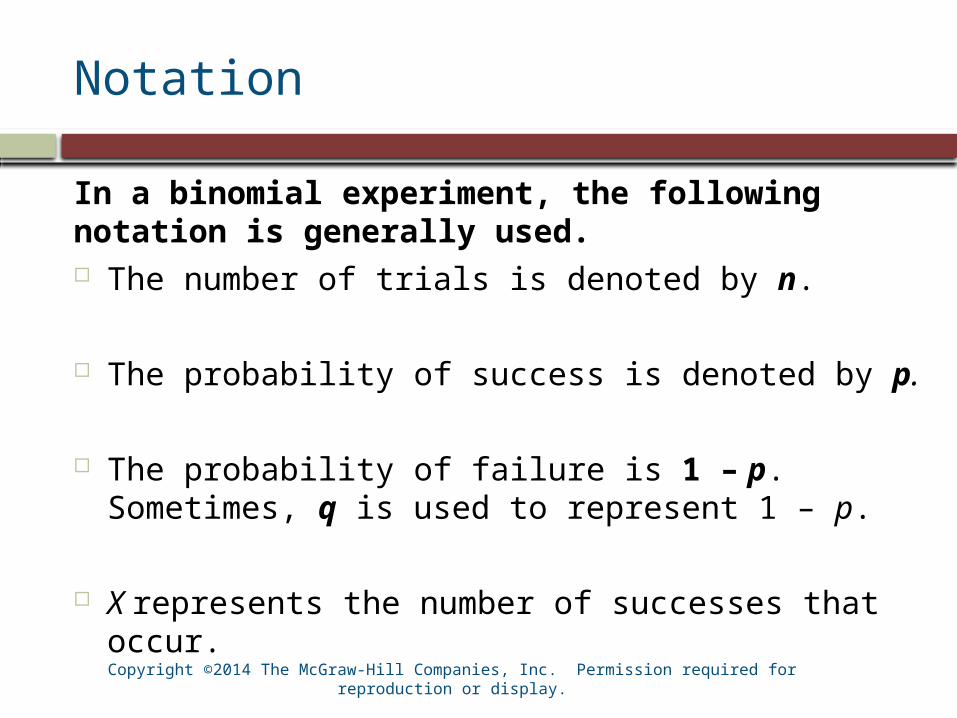
In a binomial experiment, the following notation is generally used. The number of trials is denoted by n.
The probability of success is denoted by p.
The probability of failure is 1 – p. Sometimes, q is used to represent 1 – p.
X represents the number of successes that occur.
Copyright ©2014 The McGraw-Hill Companies, Inc. Permission required for reproduction or
display.
Example
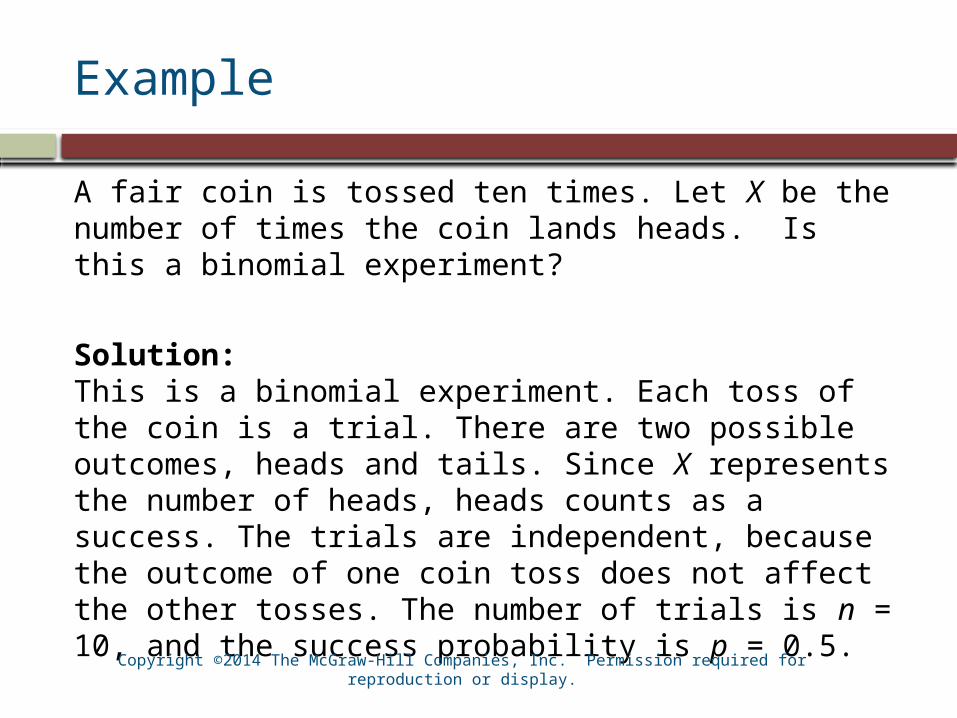
A fair coin is tossed ten times. Let X be the number of times the coin lands heads. Is this a binomial experiment?
Solution:This is a binomial experiment. Each toss of the coin is a trial. There are two possible outcomes, heads and tails. Since X represents the number of heads, heads counts as a success. The trials are independent, because the outcome of one coin toss does not affect the other tosses. The number of trials is n = 10, and the success probability is p = 0.5.Copyright ©2014 The McGraw-Hill Companies, Inc. Permission required for reproduction or
display.

Example
Five basketball players each attempt a free throw. Let X be the number of free throws made. Is this a binomial experiment?
Solution:This is not a binomial experiment. The probability of success (making a shot) differs from player to player, because they will not all be equally skilled at making free throws.
Copyright ©2014 The McGraw-Hill Companies, Inc. Permission required for reproduction or display.

Example
Ten cards are in a box. Five are red and five are green. Three of the cards are drawn at random. Let X be the number of red cards drawn. Is this a binomial experiment?
Solution:This is not a binomial experiment because the trials are not independent.
Copyright ©2014 The McGraw-Hill Companies, Inc. Permission required for reproduction or display.

Determine the probability distribution of a binomial random variable
Objective 2
Copyright ©2014 The McGraw-Hill Companies, Inc. Permission required for reproduction or display.

The Binomial Probability Distribution
We will determine the probability distribution of a binomial random variable by considering a simple example.
A biased coin has probability 0.6 of coming up heads. The coin is tossed three times. Let X be the number of heads that come up. Since X is the number of heads, coming up heads is a success. Then X is binomial, with n = 3 trials and success probability p = 0.6. We will compute P(2), the probability that exactly two of the tosses are heads.
Copyright ©2014 The McGraw-Hill Companies, Inc. Permission required for reproduction or display.

The Binomial Probability Distribution
There are three arrangements of two heads in three tosses of a coin, HHT, HTH, and THH. We first compute the probability of HHT. The event HHT is a sequence of independent events.
H on the first toss, H on the second toss, T on the third toss.
We know the probabilities of each of these events separately.
P(H on the first toss)=0.6P(H on the second toss)=0.6
P(T on the third toss)=0.4
Since the events are independent, the Multiplication Rule for Independent Events tells us that the probability that they all occur is equal to the product of their probabilities. Therefore P(HHT)=(0.6)(0.6)(0.4)=(0.6)2(0.4)1. Similarly, P(HTH) = (0.6)(04)(0.6) = (0.6)2(0.4), and P(THH) = (0.4)(0.6)(0.6) = (0.6)2(0.4)1. We can see that all the different arrangements of two heads and one tail have the same probability.
Copyright ©2014 The McGraw-Hill Companies, Inc. Permission required for reproduction or display.
The Binomial Probability Distribution
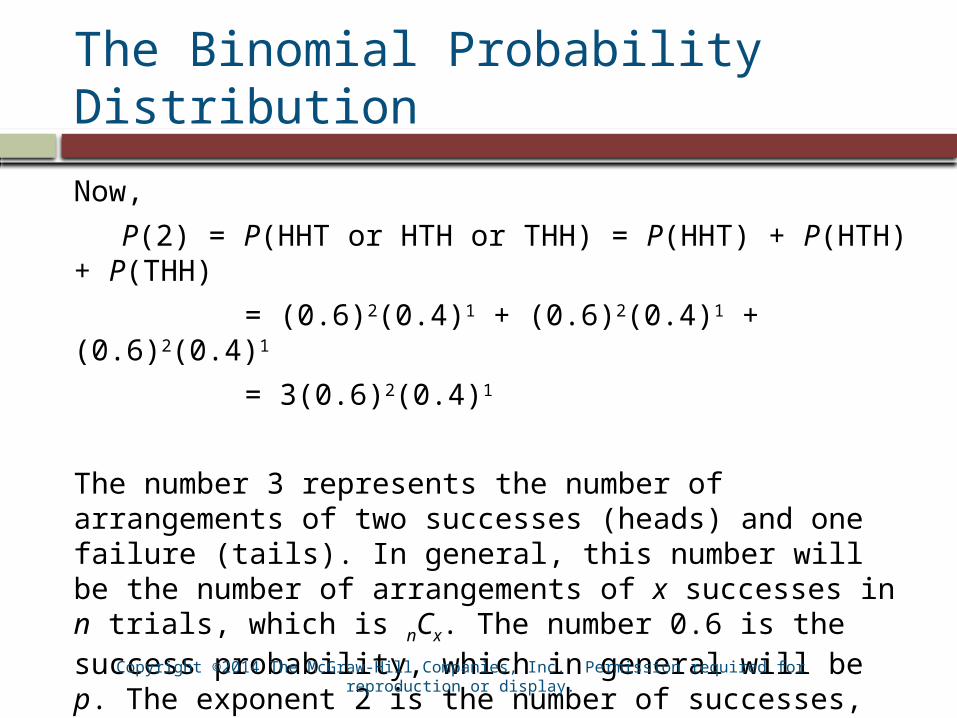
Now,
P(2) = P(HHT or HTH or THH) = P(HHT) + P(HTH) + P(THH)
= (0.6)2(0.4)1 + (0.6)2(0.4)1 + (0.6)2(0.4)1
= 3(0.6)2(0.4)1
The number 3 represents the number of arrangements of two successes (heads) and one failure (tails). In general, this number will be the number of arrangements of x successes in n trials, which is nCx. The number 0.6 is the success probability, which in general will be p. The exponent 2 is the number of successes, which in general will be x. The number 0.4 is the failure probability, which is 1– p, and the exponent 1 is the number of failures, which is n – x.
Copyright ©2014 The McGraw-Hill Companies, Inc. Permission required for reproduction or display.
The Binomial Probability Distribution
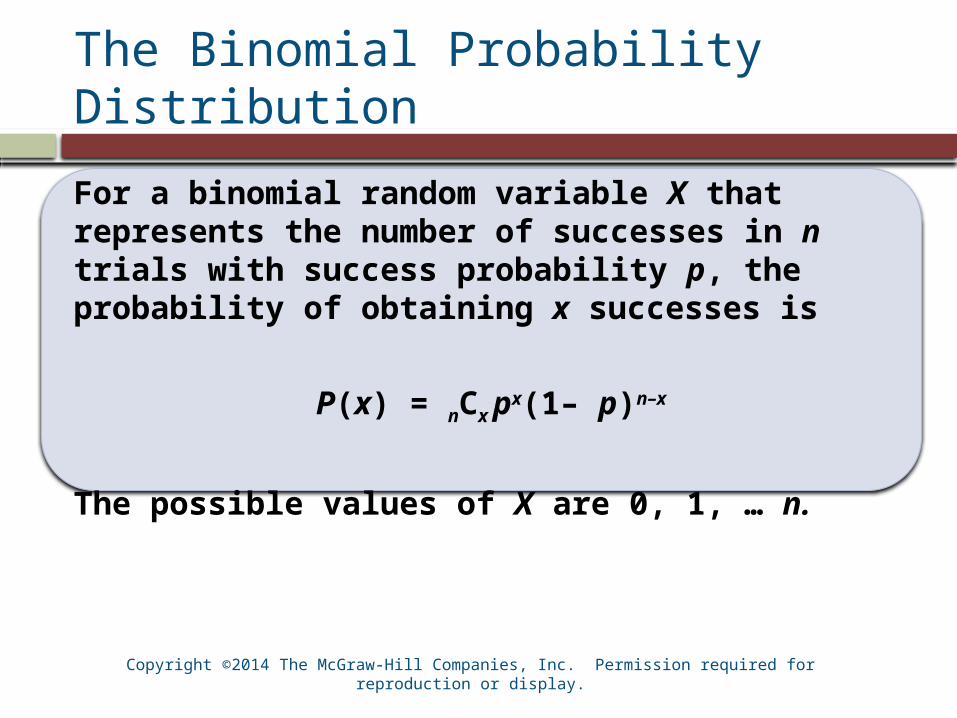
For a binomial random variable X that represents the number of successes in n trials with success probability p, the probability of obtaining x successes is
P(x) = nCx px(1– p)n–x
The possible values of X are 0, 1, … n.
Copyright ©2014 The McGraw-Hill Companies, Inc. Permission required for reproduction or display.

Compute binomial probabilities
Objective 3
Copyright ©2014 The McGraw-Hill Companies, Inc. Permission required for reproduction or display.

Binomial Probabilities on the TI-84 PLUS
In the TI-84 PLUS Calculator, there are two primary commands for computing binomial probabilities. These are binompdf and binomcdf. These commands are on the DISTR (distributions) menu accessed by pressing 2nd, VARS.
The binompdf command is used when finding the probability that the binomial random variable X is equal to a specific value, x.
The binomcdf command is used when finding the probability that the binomial random variable X is less than or equal to a specified value, x.
Copyright ©2014 The McGraw-Hill Companies, Inc. Permission required for reproduction or display.

Binomial Probabilities on the TI-84 PLUS
binompdf
To compute the probability that the random variable X equals the value x given the parameters n and p, use the binompdf command with the following format:
binompdf(n,p,x)
binomcdfTo compute the probability that the random variable X is less than or equal to the value x given the parameters n and p, use the binomcdf command with the following format:
binomcdf(n,p,x)Copyright ©2014 The McGraw-Hill Companies, Inc. Permission required for reproduction or
display.

Example
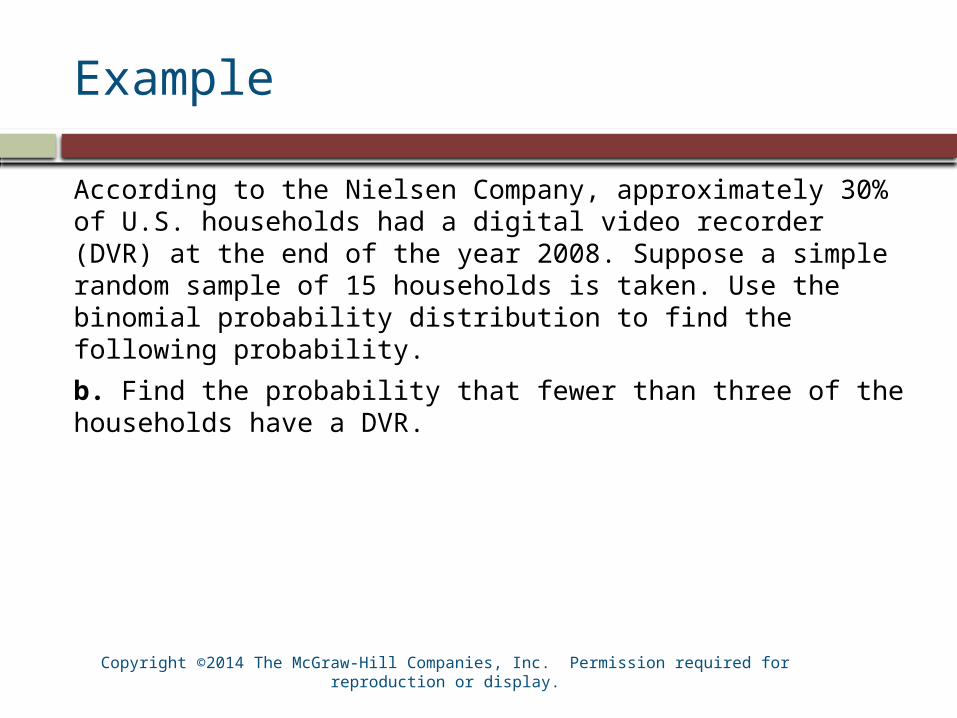
According to the Nielsen Company, approximately 30% of U.S. households had a digital video recorder (DVR) at the end of the year 2008. Suppose a simple random sample of 15 households is taken. Use the binomial probability distribution to find the following probability.
a. Find the probability that exactly four of the sampled households have a DVR.
Copyright ©2014 The McGraw-Hill Companies, Inc. Permission required for reproduction or display.

Solution
We use the binomial probability distribution with n = 15, p = 0.3, and x = 4.
Copyright ©2014 The McGraw-Hill Companies, Inc. Permission required for reproduction or display.

TI-84 PLUS: Example
According to the Nielsen Company, approximately 30% of U.S. households had a digital video recorder (DVR) at the end of the year 2008. Suppose a simple random sample of 15 households is taken. Use the binomial probability distribution to find the following probability.
a. Find the probability that exactly four of the sampled households have a DVR.
Solution:Since we are finding the probability that x equals 4, we use the binompdf command with n = 15, p = 0.3, and x = 4. We find the probability that exactly four households have a DVR is 0.219.
Copyright ©2014 The McGraw-Hill Companies, Inc. Permission required for reproduction or display.
Example
According to the Nielsen Company, approximately 30% of U.S. households had a digital video recorder (DVR) at the end of the year 2008. Suppose a simple random sample of 15 households is taken. Use the binomial probability distribution to find the following probability.
b. Find the probability that fewer than three of the households have a DVR.
Copyright ©2014 The McGraw-Hill Companies, Inc. Permission required for reproduction or display.

Solution
The possible numbers of households that are fewer than three are 0, 1, and 2. So, we need to find P(0 or 1or 2).
0 1
2
13
(0 1 2) (0) (1) (2)15 0 15 10.3 1 0.3 0.3 1 0.315 0 15 115 20.3 1 0.315 2
15! 15!0 115 140.3 (0.7) 0.3 (0.7)0!(15 0)! 1!(15 1)!
15! 20.3 (0.7)2!(15 2)!
0 1 215 14 131 0.3 (0.7) 15 0.3 (0.7) 105 0.3 (0.7)
0.0047
P or or P P P
C C
C
0.0305 0.09160.127
Copyright ©2014 The McGraw-Hill Companies, Inc. Permission required for reproduction or display.

TI-84 PLUS: Example
According to the Nielsen Company, approximately 30% of U.S. households had a digital video recorder (DVR) at the end of the year 2008. Suppose a simple random sample of 15 households is taken. Use the binomial probability distribution to find the following probability.
b. Find the probability that fewer than three of the households have a DVR.
Solution:The binomcdf command computes the probability that there are less than or equal to x successes. The event “fewer than three” is equivalent to “less than or equal to two”.
We run the command binomcdf(15, 0.3, 2) to find that the probability that that fewer than three of the households have a DVR is 0.1268.
Copyright ©2014 The McGraw-Hill Companies, Inc. Permission required for reproduction or display.

Example
According to the Nielsen Company, approximately 30% of U.S. households had a digital video recorder (DVR) at the end of the year 2008. Suppose a simple random sample of 15 households is taken. Use the binomial probability distribution to find the following probability.
c. Find the probability that more than one household has a DVR.
Copyright ©2014 The McGraw-Hill Companies, Inc. Permission required for reproduction or display.
Solution
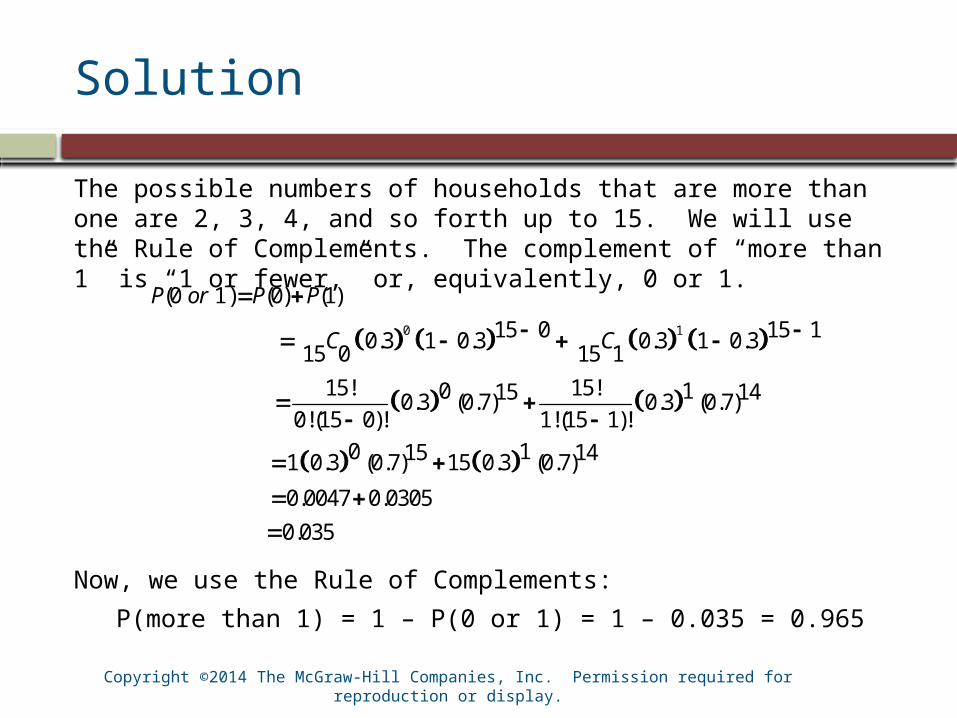
The possible numbers of households that are more than one are 2, 3, 4, and so forth up to 15. We will use the Rule of Complements. The complement of “more than 1” is “1 or fewer,” or, equivalently, 0 or 1.
Now, we use the Rule of Complements:
P(more than 1) = 1 – P(0 or 1) = 1 – 0.035 = 0.965
0 1
(0 1) (0) (1)15 0 15 10.3 1 0.3 0.3 1 0.315 0 15 1
15! 15!0 115 140.3 (0.7) 0.3 (0.7)0!(15 0)! 1!(15 1)!
0 115 141 0.3 (0.7) 15 0.3 (0.7)
0.0047 0.03050.035
P or P P
C C
Copyright ©2014 The McGraw-Hill Companies, Inc. Permission required for reproduction or display.

TI-84 PLUS: Example
According to the Nielsen Company, approximately 30% of U.S. households had a digital video recorder (DVR) at the end of the year 2008. Suppose a simple random sample of 15 households is taken. Use the binomial probability distribution to find the following probability.
c. Find the probability that more than one household has a DVR.
Solution:We will use the Rule of Complements. The complement of “more than 1” is “1 or fewer”. We use the commandbinomcdf(15, 0.3, 1) to first find the probability that 1 or fewer households have a DVR, and then subtract this value from 1 to find the probability that more than one household has a DVR. The result is approximately 0.965.
Copyright ©2014 The McGraw-Hill Companies, Inc. Permission required for reproduction or display.

Example
According to the Nielsen Company, approximately 30% of U.S. households had a digital video recorder (DVR) at the end of the year 2008. Suppose a simple random sample of 15 households is taken. Use the binomial probability distribution to find the following probability.
d. Find the probability that the number of households that have a DVR is between 1 and 4, inclusive.
Copyright ©2014 The McGraw-Hill Companies, Inc. Permission required for reproduction or display.

Solution
Between 1 and 4 inclusive means 1, 2, 3, or 4.
1 2
13
(1 2 3 4) (1) (2) (3) (4)15 1 15 20.3 1 0.3 0.3 1 0.315 1 15 2
3 15 3 4 15 40.3 1 0.3 0.3 1 0.315 3 15 415! 15!1 2140.3 (0.7) 0.3 (0.7)
1!(15 1)! 2!(15 2)!15! 15!3 412 10.3 (0.7) 0.3 (0.7)
3!(15 3)! 4!(15 4)!
P or or or P P P P
C C
C C
1
1 2 314 13 1215 0.3 (0.7) 105 0.3 (0.7) 455 0.3 (0.7)
4 111365 0.3 (0.7)
0.0305 0.0916 0.1700 0.21860.511
Copyright ©2014 The McGraw-Hill Companies, Inc. Permission required for reproduction or display.

TI-84 PLUS: Example
According to the Nielsen Company, approximately 30% of U.S. households had a digital video recorder (DVR) at the end of the year 2008. Suppose a simple random sample of 15 households is taken. Use the binomial probability distribution to find the following probability.
d. Find the probability that the number of households that have a DVR is between 1 and 4, inclusive.
Solution:Because P(Between 1 and 4) = P(4 or less) – P(0), we can find the probability using the commands binomcdf(15, 0.30, 4) – binompdf(15, 0.30, 0). Theresult is approximately 0.511.
Copyright ©2014 The McGraw-Hill Companies, Inc. Permission required for reproduction or display.

Compute the mean and variance of a binomial random variable
Objective 4
Copyright ©2014 The McGraw-Hill Companies, Inc. Permission required for reproduction or display.
Mean, Variance, and Standard Deviation
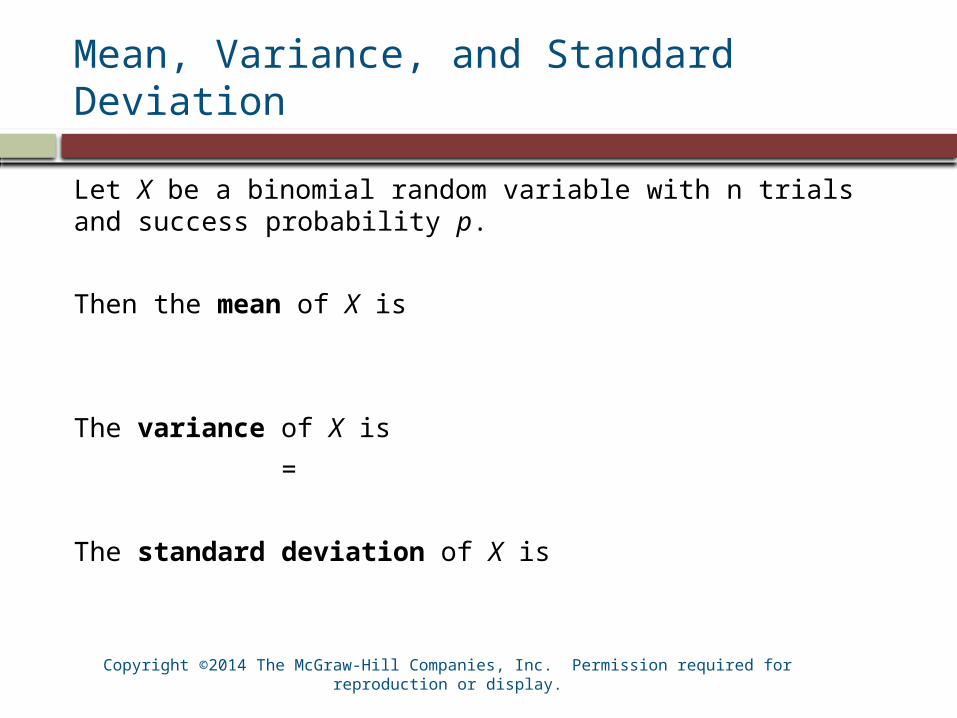
Let X be a binomial random variable with n trials and success probability p.
Then the mean of X is
The variance of X is
=
The standard deviation of X is
Copyright ©2014 The McGraw-Hill Companies, Inc. Permission required for reproduction or display.

Example
The probability that a new car of a certain model will require repairs during the warranty period is 0.15. A particular dealership sells 25 such cars. Let X be the number that will require repairs during the warranty period.
Find the mean and standard deviation of X.
Copyright ©2014 The McGraw-Hill Companies, Inc. Permission required for reproduction or display.
Solution
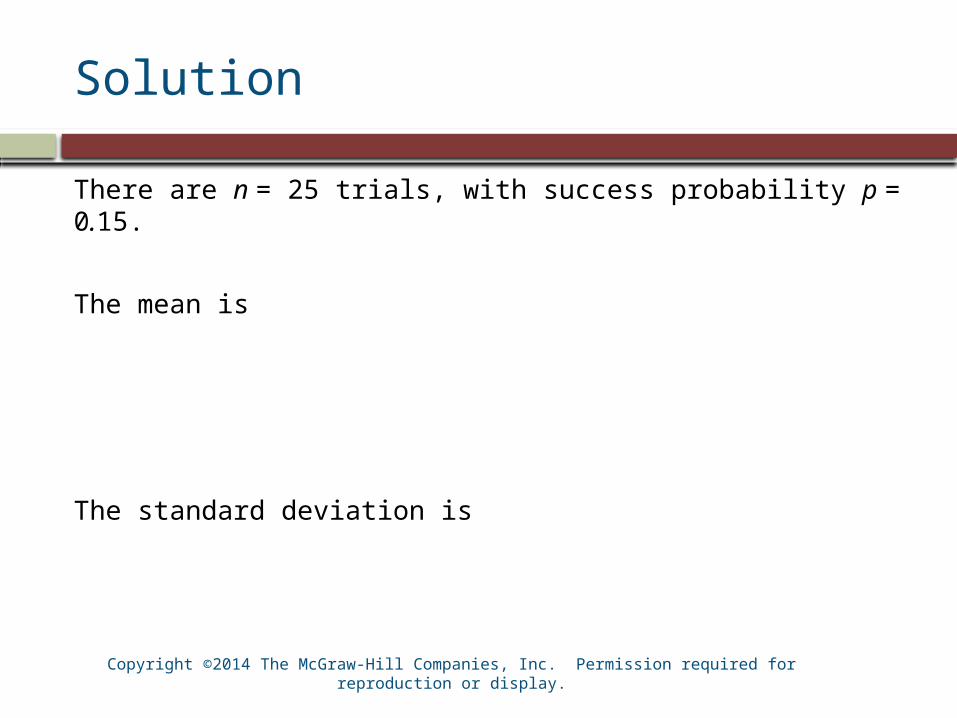
There are n = 25 trials, with success probability p = 0.15.
The mean is
The standard deviation is
Copyright ©2014 The McGraw-Hill Companies, Inc. Permission required for reproduction or display.

Do You Know…
• How to determine whether a random variable is binomial?
• The notation for a binomial experiment?• How to determine the probability distribution
of a binomial random variable?• How to compute binomial probabilities?• How to compute the mean and variance of a
binomial random variable?
Copyright ©2014 The McGraw-Hill Companies, Inc. Permission required for reproduction or display.