Section 4.1 What is Probability ? Larson/Farber 4th ed 1.
100
Section 4.1 What is Probability ? Larson/Farber 4th ed 1
-
Upload
berenice-oliver -
Category
Documents
-
view
237 -
download
1
Transcript of Section 4.1 What is Probability ? Larson/Farber 4th ed 1.
Section 4.1
What is Probability ?
Larson/Farber 4th ed 1
Section 4.1 Objectives
• Identify the sample space of a probability experiment• Identify simple events• Distinguish among classical probability, empirical
probability, and subjective probability• Determine the probability of the complement of an
event• Use a tree diagram to find probabilities
Larson/Farber 4th ed 2
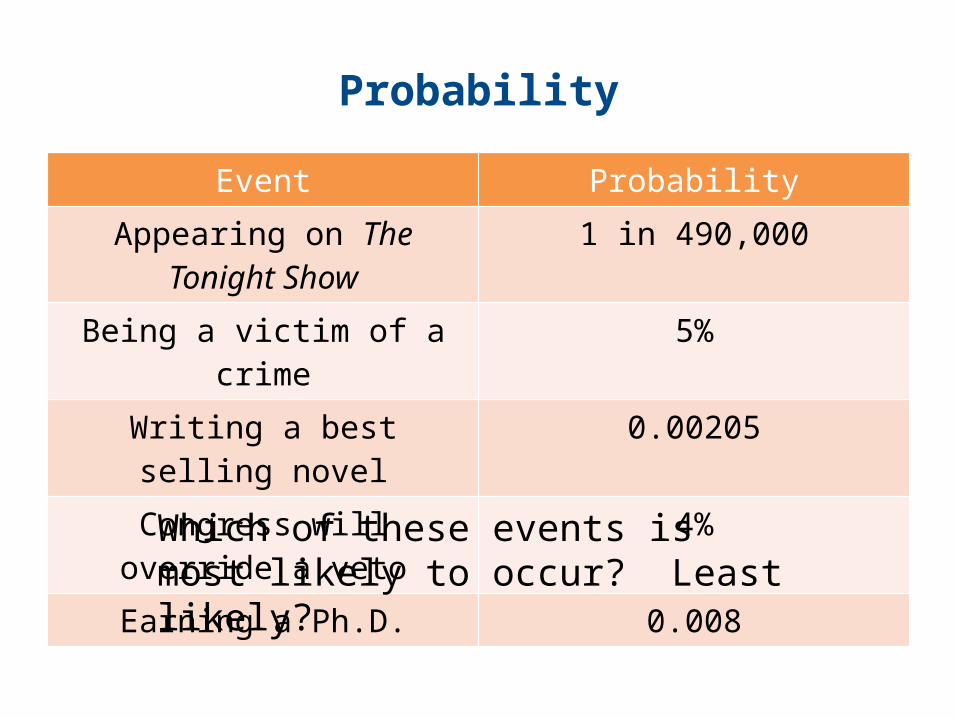
Probability
Event Probability
Appearing on The Tonight Show
1 in 490,000
Being a victim of a crime 5%
Writing a best selling novel 0.00205
Congress will override a veto 4%
Earning a Ph.D. 0.008
Which of these events is most likely to occur? Least likely?

Probability
• Probability is a numerical measure that indicates the likelihood of an event
• All probabilities are between 0 and 1, inclusive• A probability of 0 means the event is impossible • A probability of 1 means the event is certain to occur• Events with probabilities near 1 are likely to occur

Probability
• Events can be named with capital letters:A, B, C…
• P(A) means the probability of A occurring. P(A) is read “P of A” 0 ≤ P(A) ≤ 1
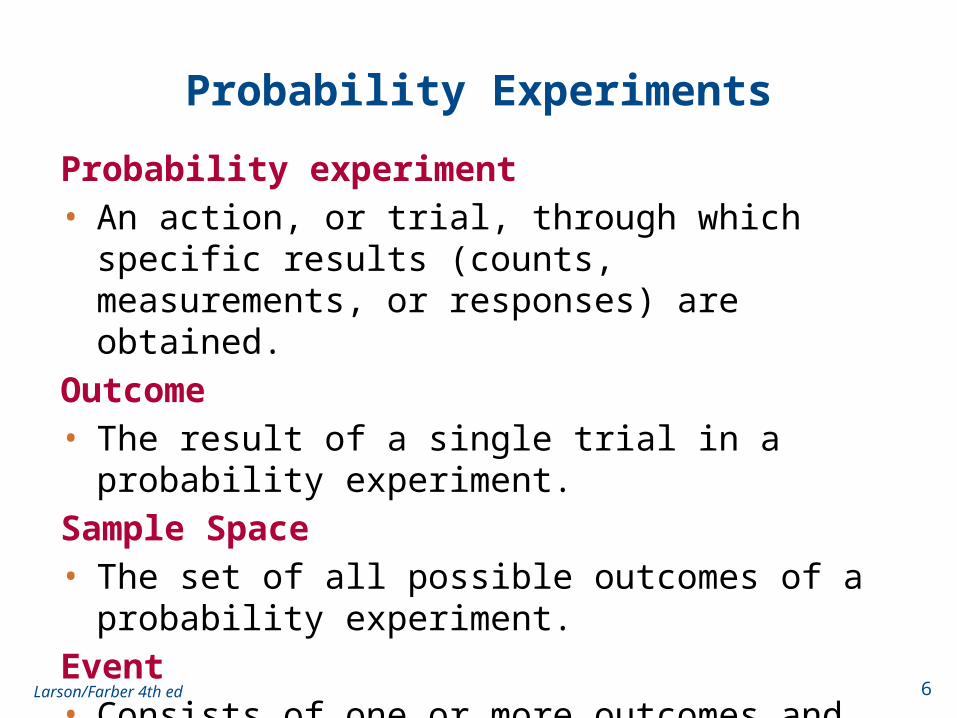
Probability Experiments
Probability experiment• An action, or trial, through which specific results (counts,
measurements, or responses) are obtained.
Outcome• The result of a single trial in a probability experiment.
Sample Space• The set of all possible outcomes of a probability
experiment.
Event• Consists of one or more outcomes and is a subset of the
sample space.
Larson/Farber 4th ed 6
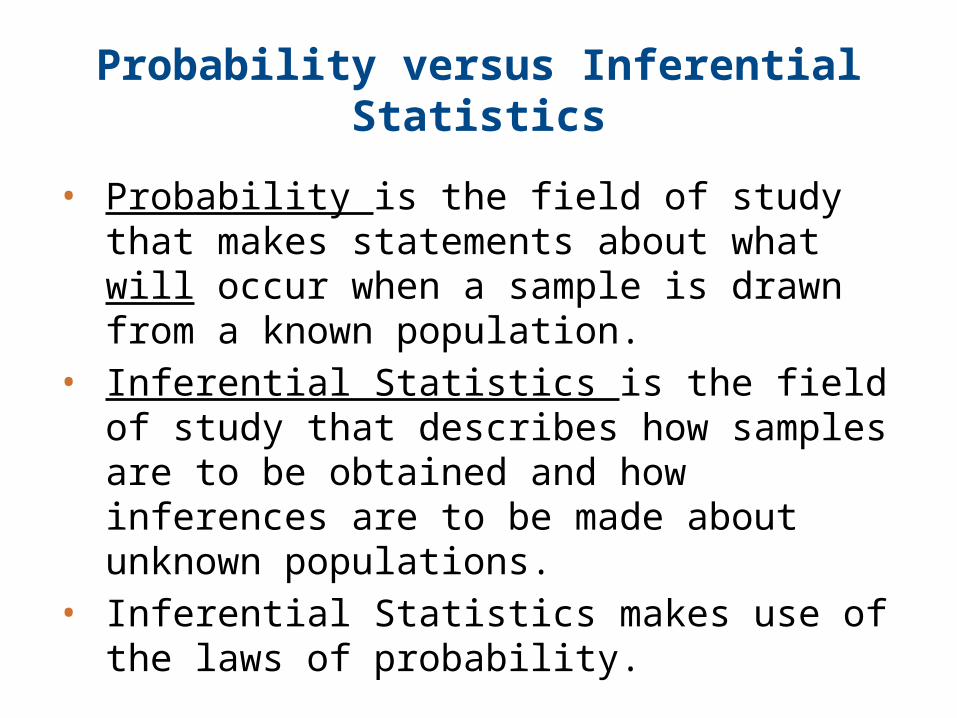
Probability versus Inferential Statistics
• Probability is the field of study that makes statements about what will occur when a sample is drawn from a known population.
• Inferential Statistics is the field of study that describes how samples are to be obtained and how inferences are to be made about unknown populations.
• Inferential Statistics makes use of the laws of probability.
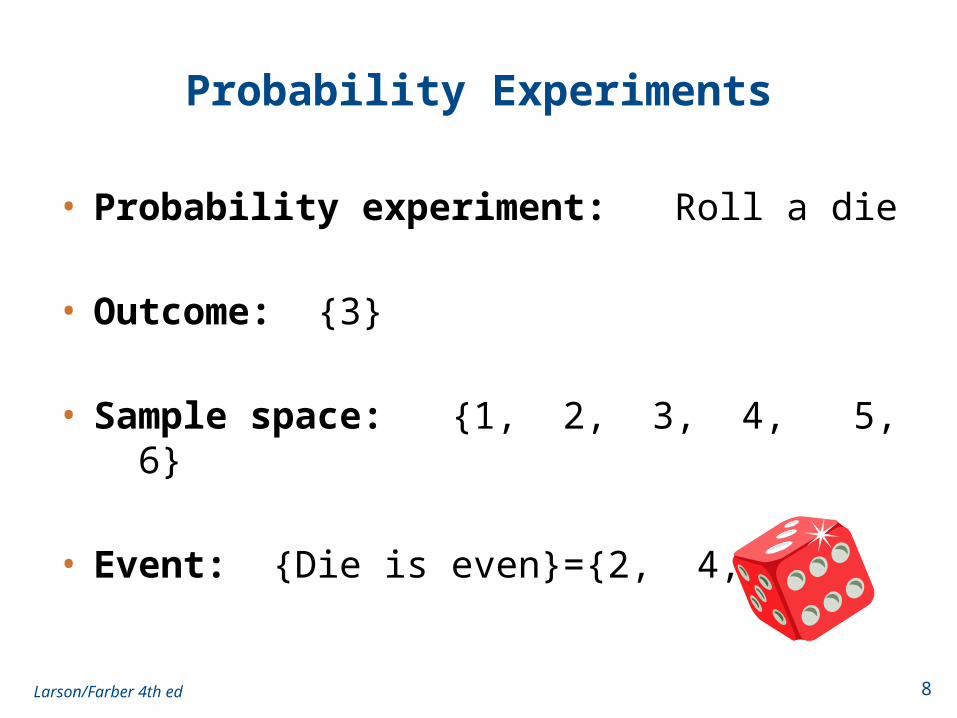
Probability Experiments
• Probability experiment: Roll a die
• Outcome: {3}
• Sample space: {1, 2, 3, 4, 5, 6}
• Event: {Die is even}={2, 4, 6}
Larson/Farber 4th ed 8

Exercise 1: Identifying the Sample Space
A probability experiment consists of tossing a coin and then rolling a six-sided die. Describe the sample space.
Larson/Farber 4th ed 9
Solution:There are two possible outcomes when tossing a coin: a head (H) or a tail (T). For each of these, there are six possible outcomes when rolling a die: 1, 2, 3, 4, 5, or 6. One way to list outcomes for actions occurring in a sequence is to use a tree diagram.
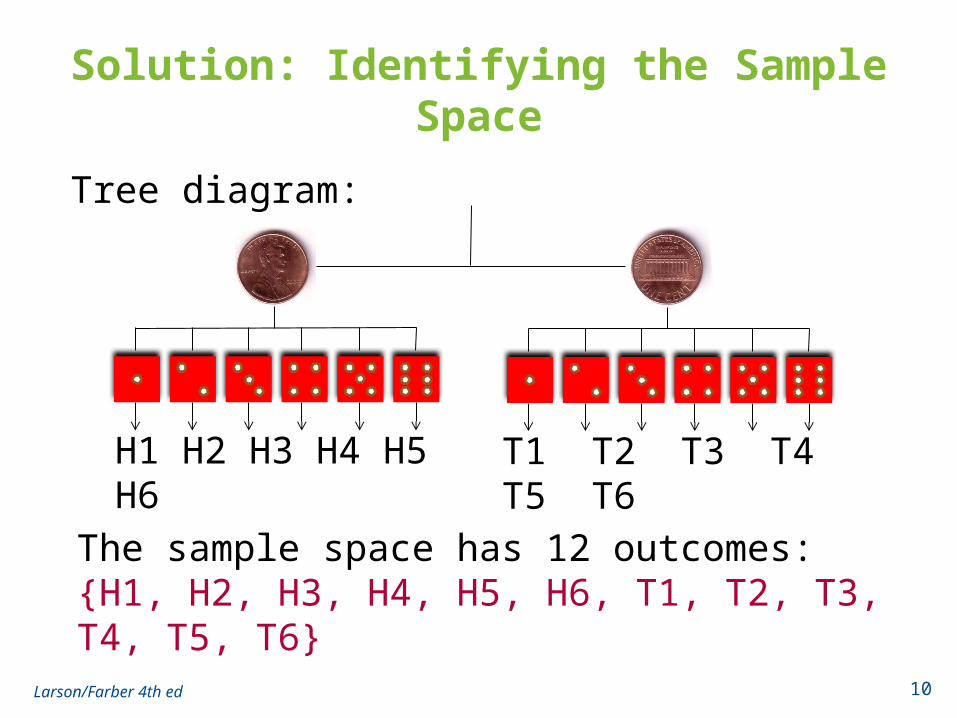
Solution: Identifying the Sample Space
Larson/Farber 4th ed 10
Tree diagram:
H1 H2 H3 H4 H5 H6 T1 T2 T3 T4 T5 T6
The sample space has 12 outcomes:{H1, H2, H3, H4, H5, H6, T1, T2, T3, T4, T5, T6}
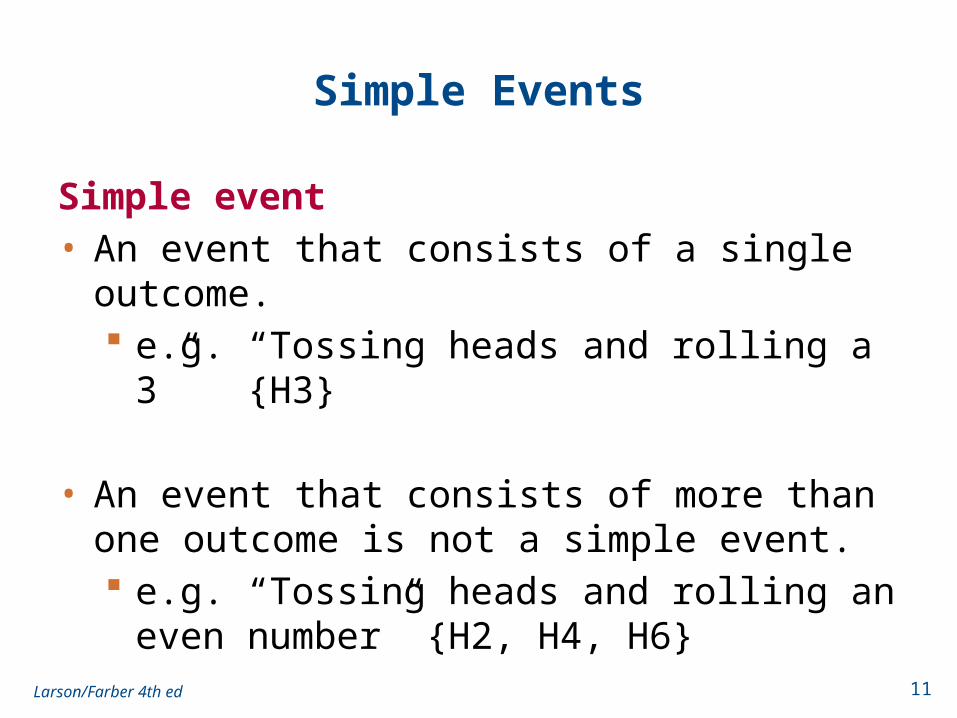
Simple Events
Simple event• An event that consists of a single outcome.
e.g. “Tossing heads and rolling a 3” {H3}
• An event that consists of more than one outcome is not a simple event. e.g. “Tossing heads and rolling an even number”
{H2, H4, H6}
Larson/Farber 4th ed 11
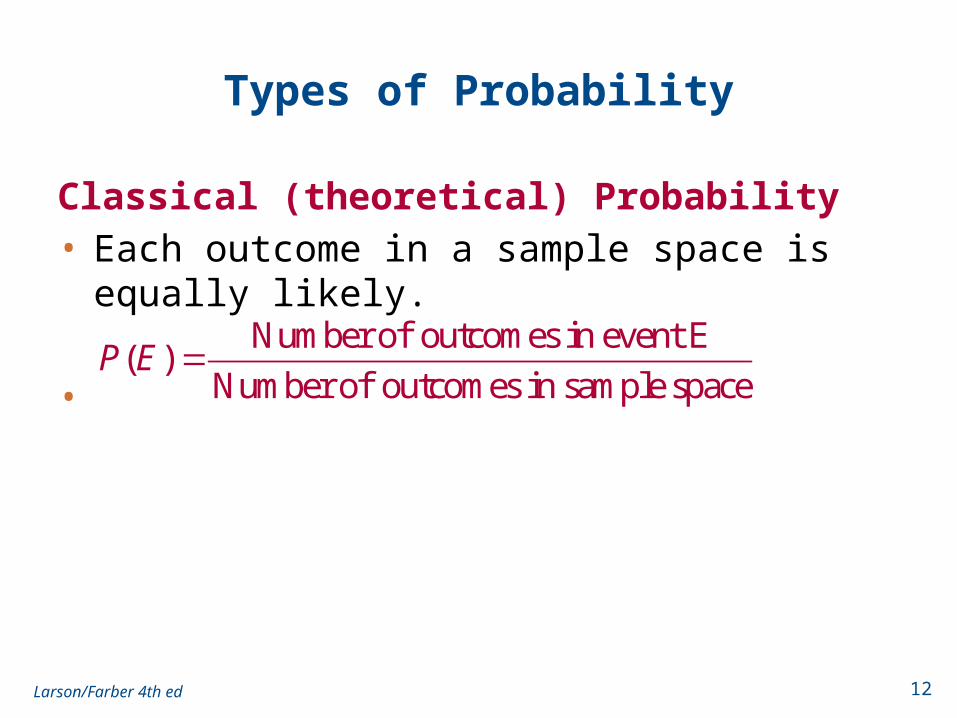
Types of Probability
Classical (theoretical) Probability• Each outcome in a sample space is equally likely.
•
Larson/Farber 4th ed 12
Number of outcomes in event E( )
Number of outcomes in sample spaceP E
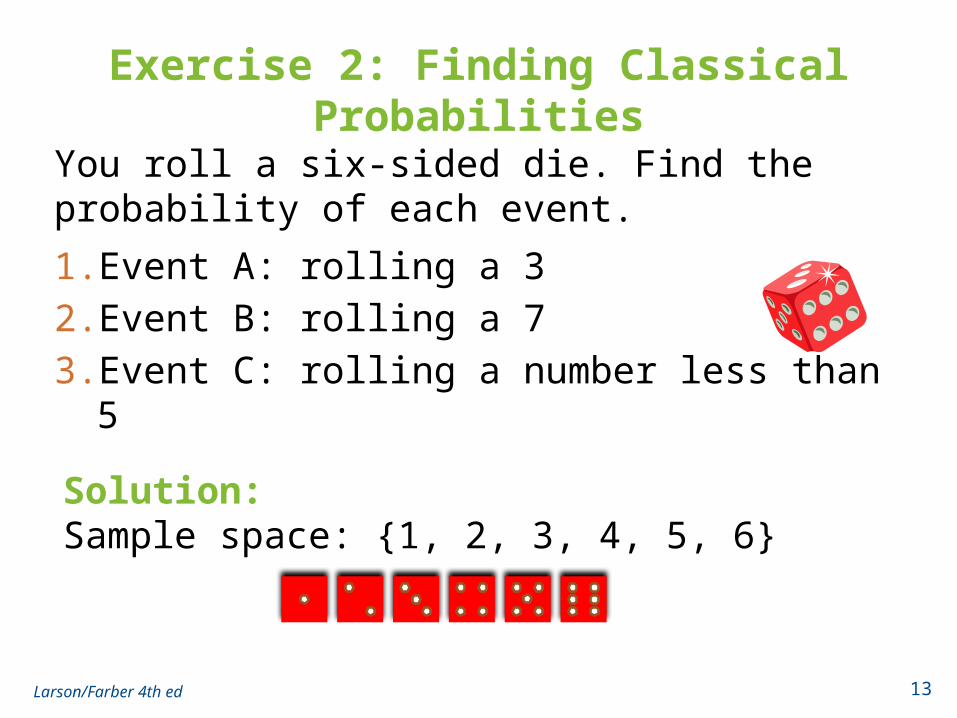
Exercise 2: Finding Classical Probabilities
1. Event A: rolling a 3
2. Event B: rolling a 7
3. Event C: rolling a number less than 5
Larson/Farber 4th ed 13
Solution:Sample space: {1, 2, 3, 4, 5, 6}
You roll a six-sided die. Find the probability of each event.
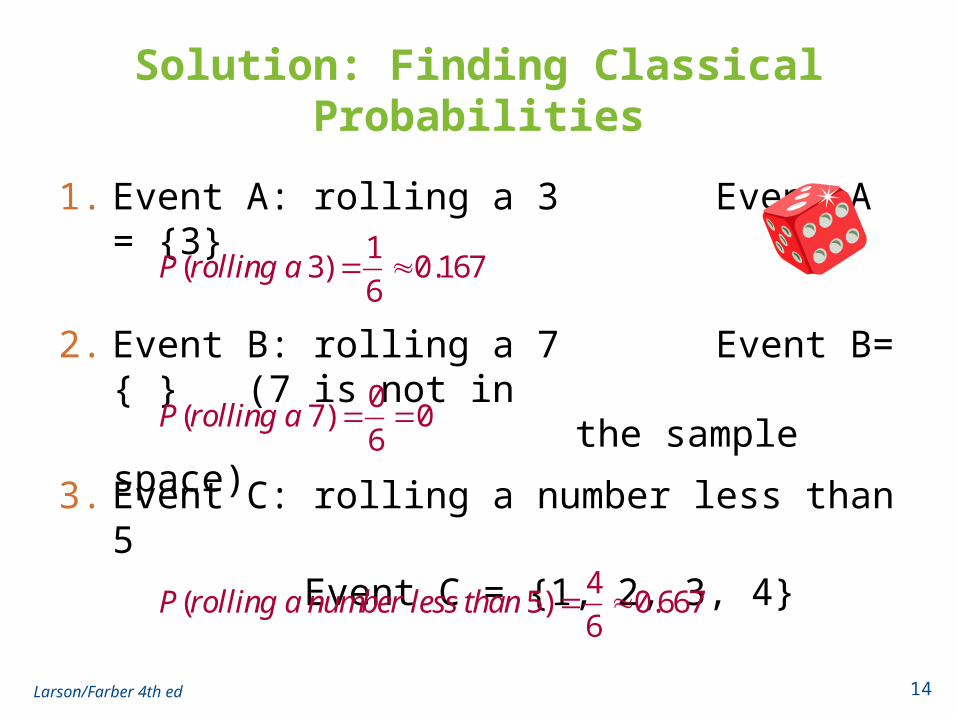
Solution: Finding Classical Probabilities
1. Event A: rolling a 3 Event A = {3}
Larson/Farber 4th ed 14
1( 3) 0.167
6P rolling a
2. Event B: rolling a 7 Event B= { } (7 is not in the sample
space)0
( 7) 06
P rolling a
3. Event C: rolling a number less than 5
Event C = {1, 2, 3, 4}4
( 5) 0.6676
P rolling a number less than
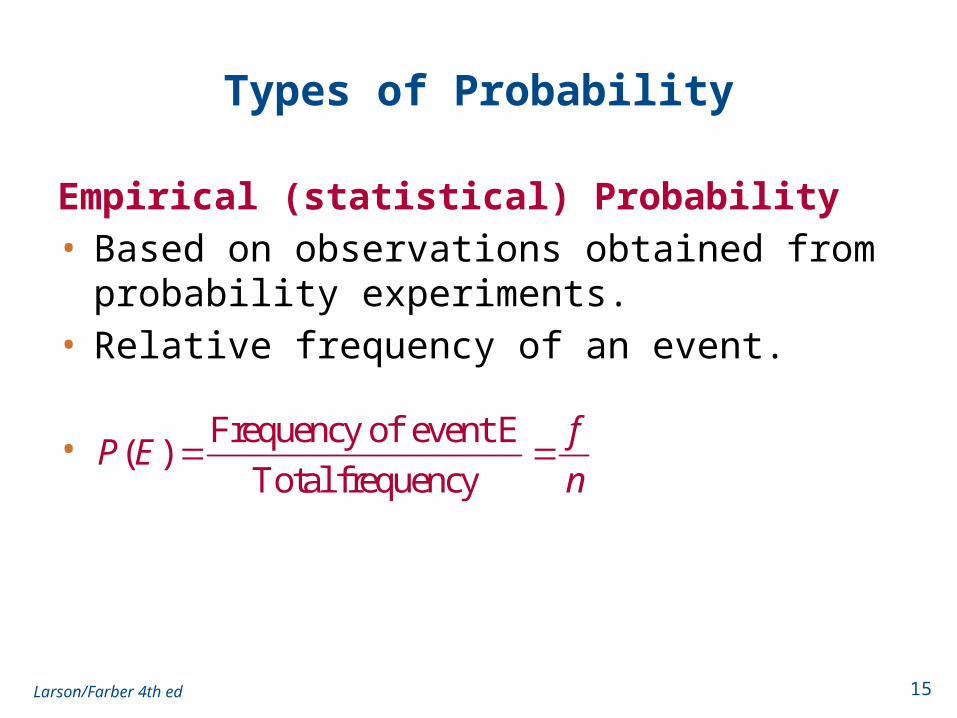
Types of Probability
Empirical (statistical) Probability• Based on observations obtained from probability
experiments.• Relative frequency of an event.
•
Larson/Farber 4th ed 15
Frequency of event E( )
Total frequency
fP E
n
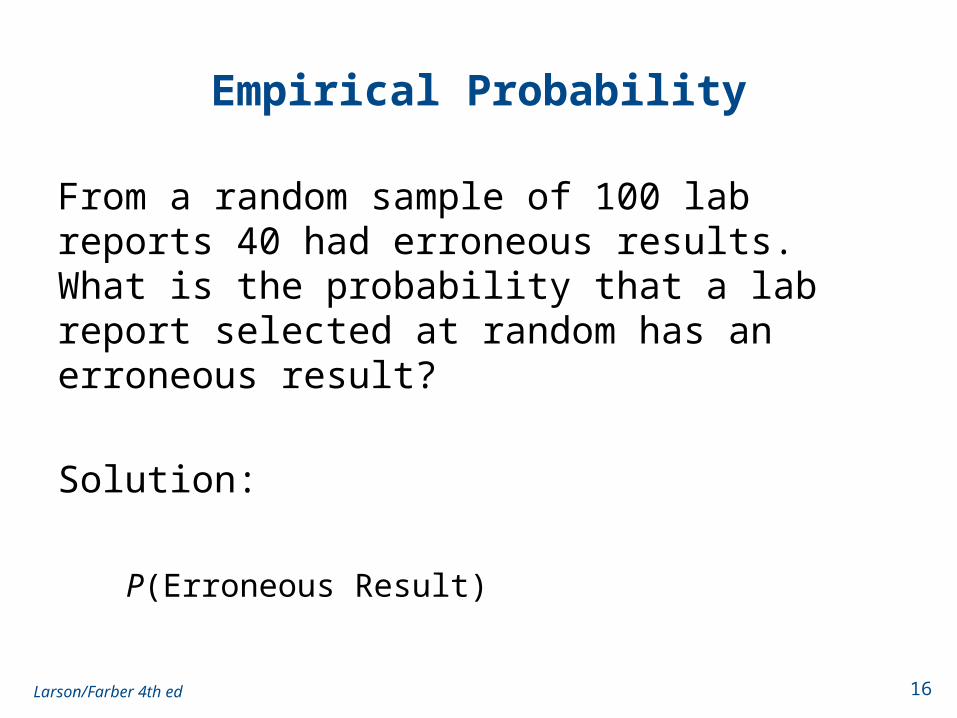
Empirical Probability
From a random sample of 100 lab reports 40 had erroneous results. What is the probability that a lab report selected at random has an erroneous result?
Solution:
P(Erroneous Result)
Larson/Farber 4th ed 16
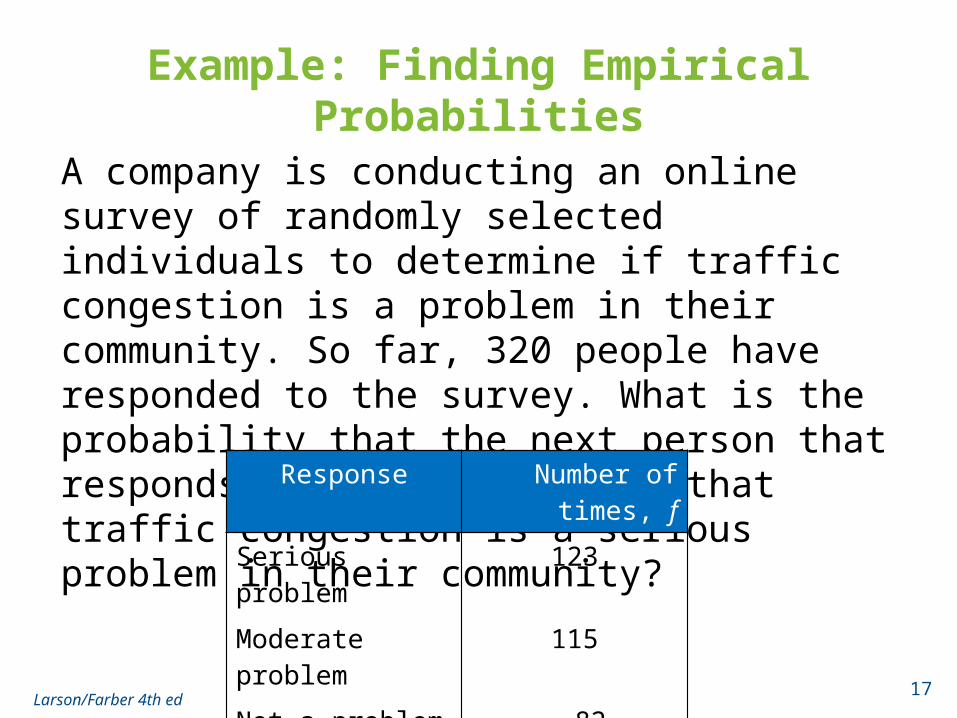
Example: Finding Empirical Probabilities
A company is conducting an online survey of randomly selected individuals to determine if traffic congestion is a problem in their community. So far, 320 people have responded to the survey. What is the probability that the next person that responds to the survey says that traffic congestion is a serious problem in their community?
Larson/Farber 4th ed17
Response Number of times, f
Serious problem 123
Moderate problem 115
Not a problem 82
Σf = 320
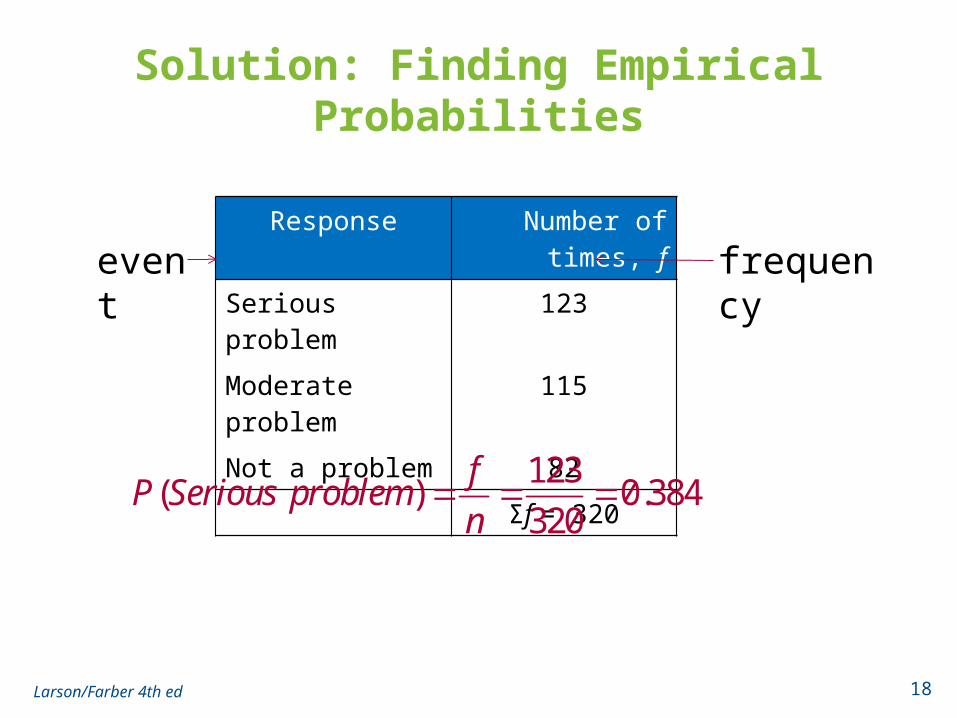
Solution: Finding Empirical Probabilities
Larson/Farber 4th ed 18
Response Number of times, f
Serious problem 123
Moderate problem 115
Not a problem 82
Σf = 320
event frequency
123( ) 0.384
320
fP Serious problem
n
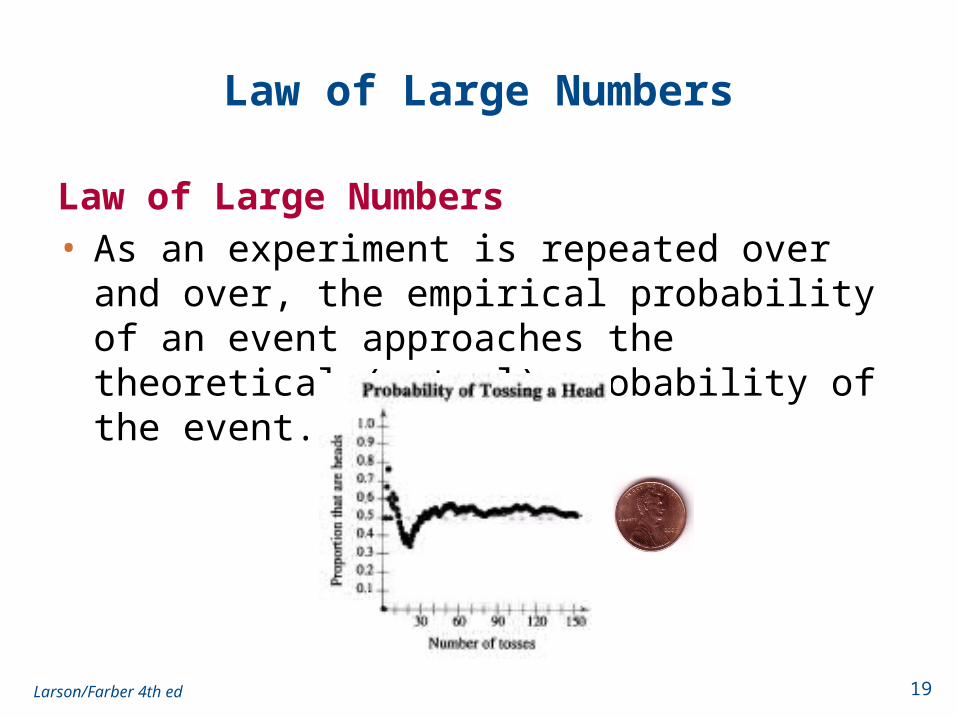
Law of Large Numbers
Law of Large Numbers• As an experiment is repeated over and over, the
empirical probability of an event approaches the theoretical (actual) probability of the event.
Larson/Farber 4th ed 19
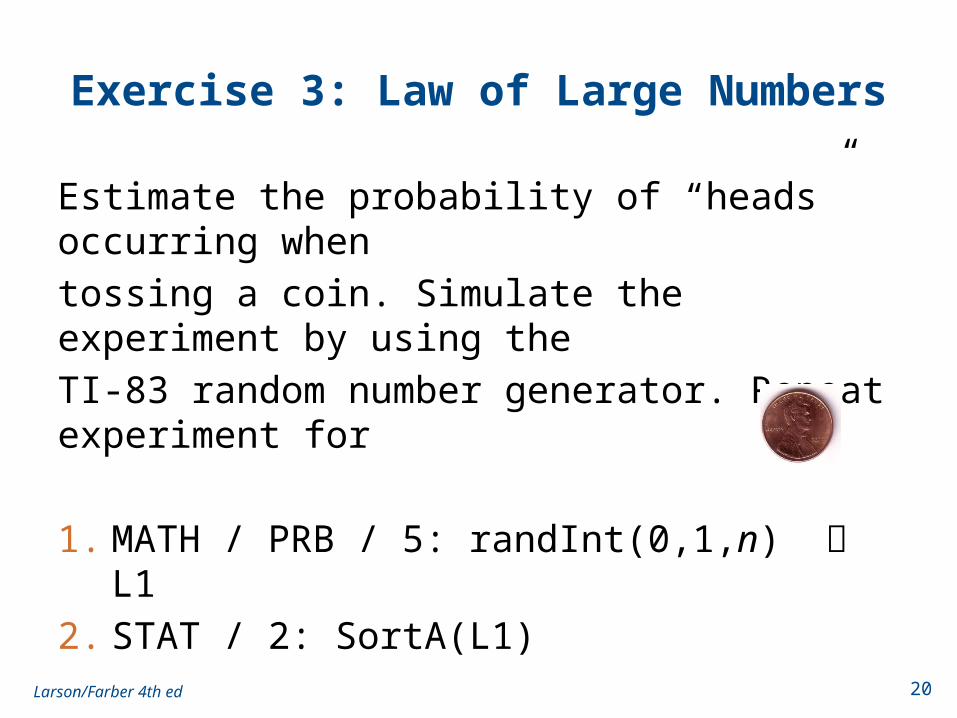
Exercise 3: Law of Large Numbers
Estimate the probability of “heads” occurring when
tossing a coin. Simulate the experiment by using the
TI-83 random number generator. Repeat experiment for
1. MATH / PRB / 5: randInt(0,1,n) L1
2. STAT / 2: SortA(L1)
Larson/Farber 4th ed 20
Types of Probability
Subjective Probability • Intuition, educated guesses, and estimates.• e.g. A doctor may feel a patient has a 90% chance of a
full recovery.
Larson/Farber 4th ed 21
Example: Classifying Types of Probability
Classify the statement as an example of classical, empirical, or subjective probability.
Larson/Farber 4th ed 22
Solution:
Subjective probability (most likely an educated guess)
This is probability based on intuition.
1. The probability that you will be married by age 30 is 0.50.
Example: Classifying Types of Probability
Classify the statement as an example of classical, empirical, or subjective probability.
Larson/Farber 4th ed 23
Solution:Empirical probability (most likely based on a survey)
2. The probability that a voter chosen at random will vote Republican is 0.45.
3. The probability of winning a 1000-ticket raffle with one ticket is .
Example: Classifying Types of Probability
Classify the statement as an example of classical, empirical, or subjective probability.
Larson/Farber 4th ed 24
1
1000
Solution:Classical probability (equally likely outcomes)This is also known as theoretical probability.
Range of Probabilities Rule
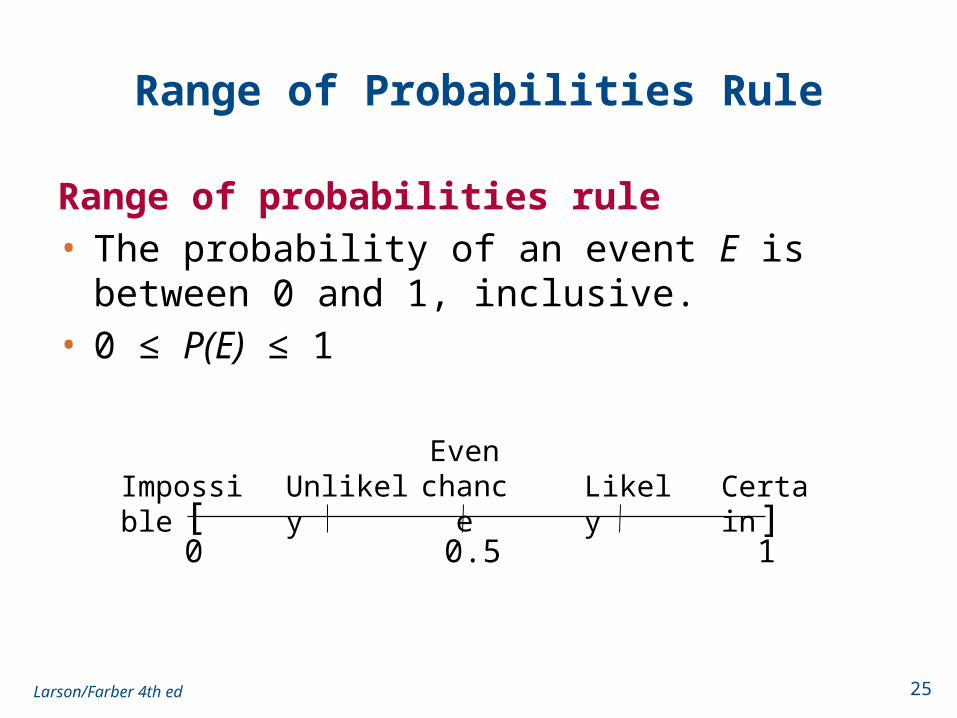
Range of probabilities rule• The probability of an event E is between 0 and 1,
inclusive.• 0 ≤ P(E) ≤ 1
Larson/Farber 4th ed 25
[ ]0 0.5 1
Impossible UnlikelyEven
chance Likely Certain
Complementary Events
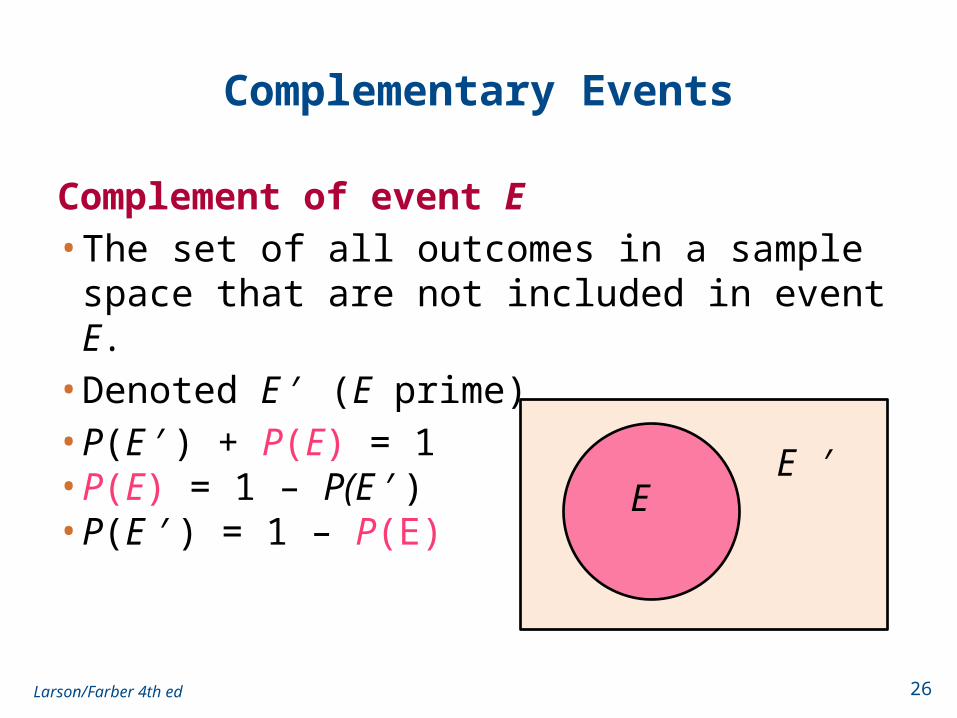
Complement of event E• The set of all outcomes in a sample space that are not
included in event E.• Denoted E ′ (E prime)• P(E ′) + P(E) = 1• P(E) = 1 – P(E ′)• P(E ′) = 1 – P(E)
Larson/Farber 4th ed 26
E ′E
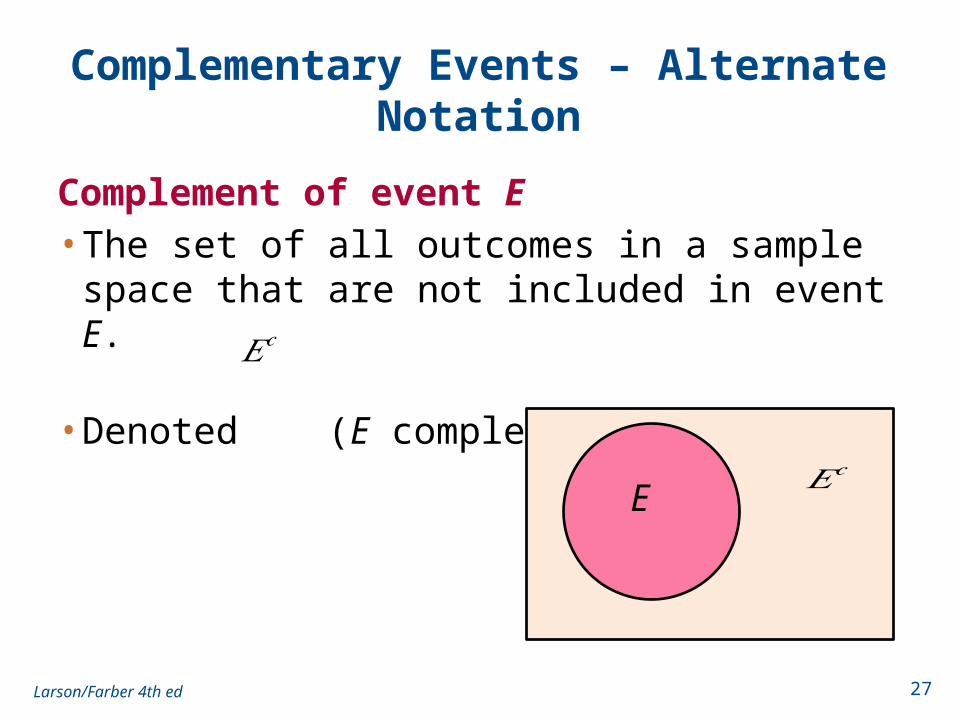
Complementary Events – Alternate Notation
Complement of event E• The set of all outcomes in a sample space that are not
included in event E. • Denoted (E complement)
Larson/Farber 4th ed 27
EEEcE
𝐸𝑐
𝐸𝑐
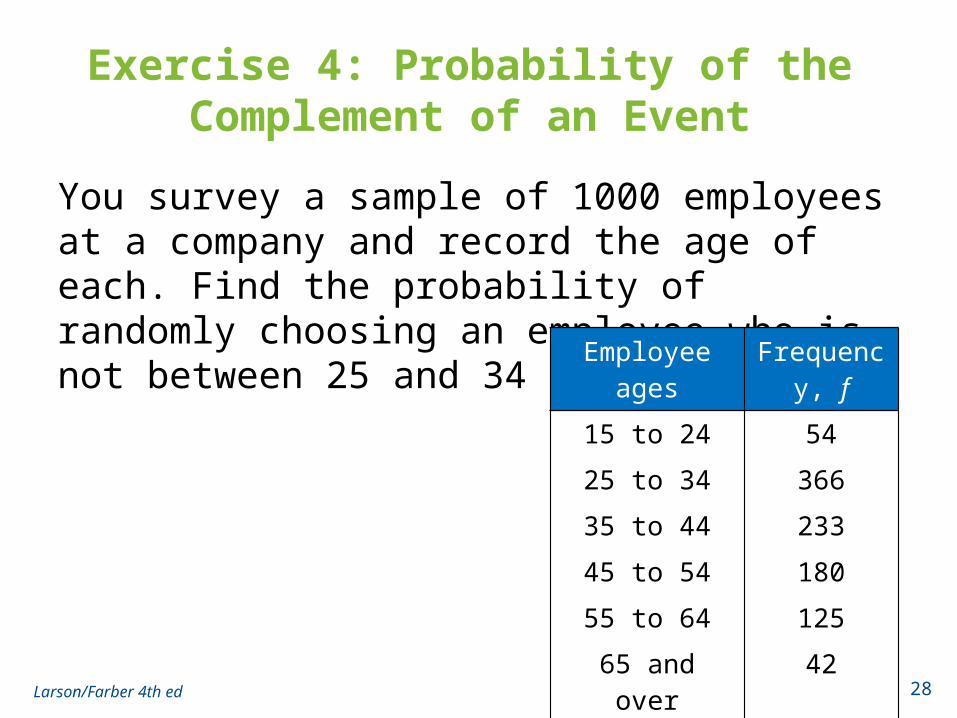
Exercise 4: Probability of the Complement of an Event
You survey a sample of 1000 employees at a company and record the age of each. Find the probability of randomly choosing an employee who is not between 25 and 34 years old.
Larson/Farber 4th ed 28
Employee ages Frequency, f
15 to 24 54
25 to 34 366
35 to 44 233
45 to 54 180
55 to 64 125
65 and over 42
Σf = 1000
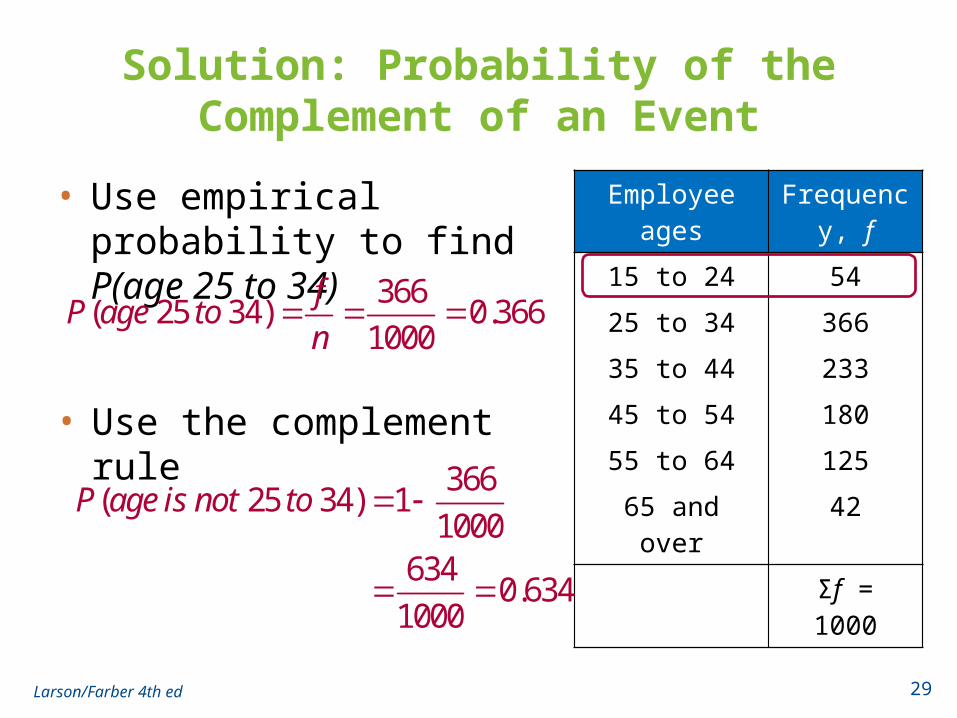
Solution: Probability of the Complement of an Event
• Use empirical probability to find P(age 25 to 34)
Larson/Farber 4th ed 29
Employee ages Frequency, f
15 to 24 54
25 to 34 366
35 to 44 233
45 to 54 180
55 to 64 125
65 and over 42
Σf = 1000
366( 25 34) 0.366
1000
fP age to
n
• Use the complement rule
366( 25 34) 1
1000634
0.6341000
P age is not to
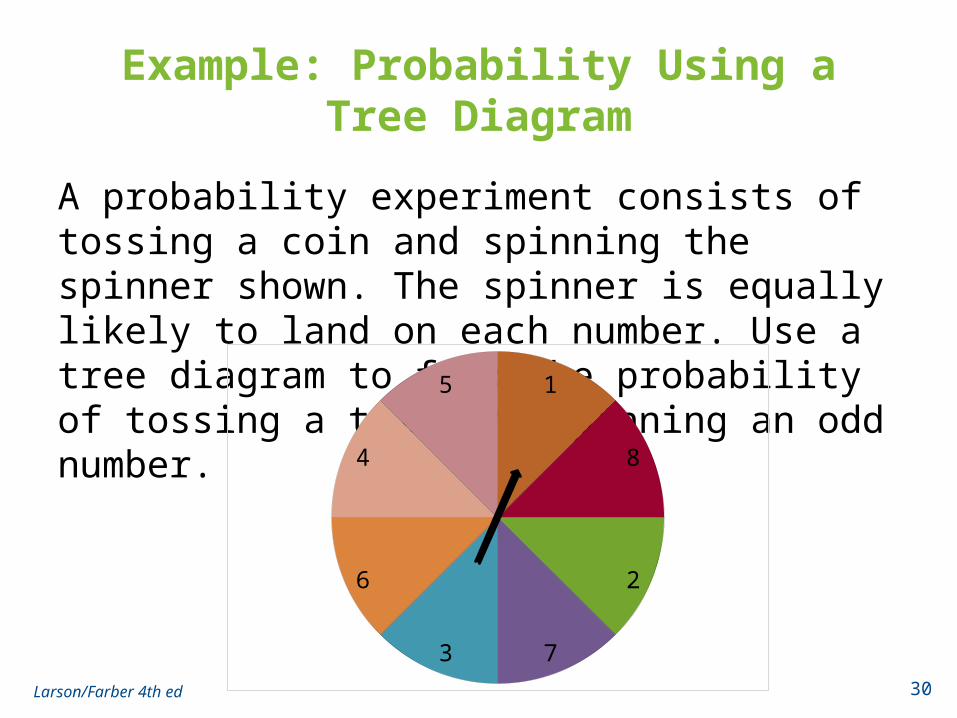
Example: Probability Using a Tree Diagram
A probability experiment consists of tossing a coin and spinning the spinner shown. The spinner is equally likely to land on each number. Use a tree diagram to find the probability of tossing a tail and spinning an odd number.
Larson/Farber 4th ed 30
1
8
2
73
6
4
5
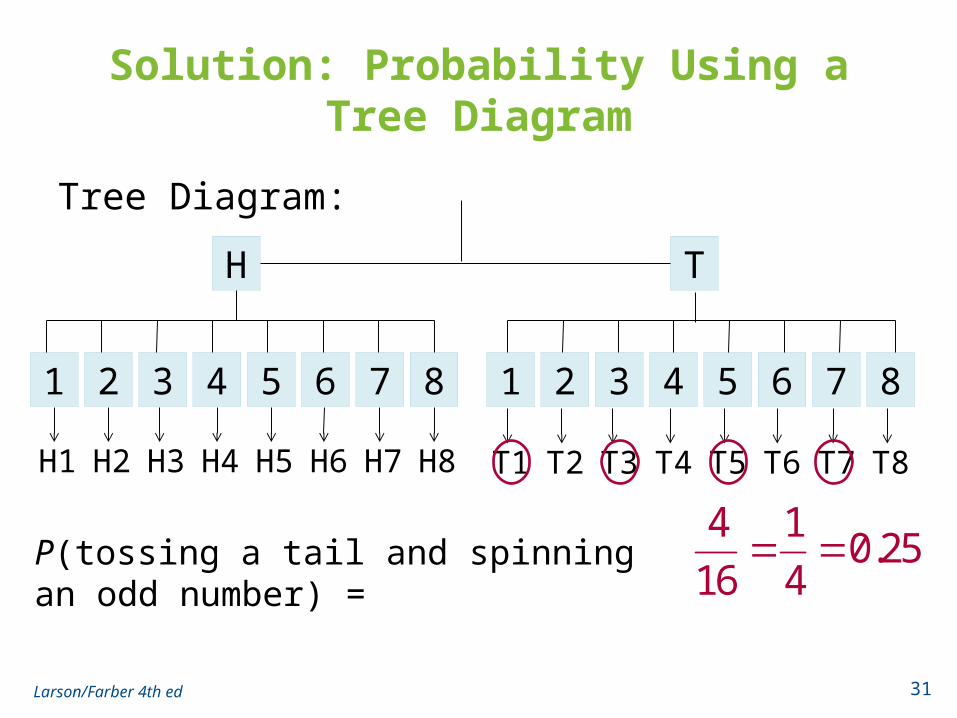
Solution: Probability Using a Tree Diagram
Tree Diagram:
Larson/Farber 4th ed 31
H T
1 2 3 4 5 76 8 1 2 3 4 5 76 8
H1 H2 H3 H4 H5 H6 H7 H8 T1 T2 T3 T4 T5 T6 T7 T8
P(tossing a tail and spinning an odd number) = 4 1
0.2516 4
Section 4.1 Summary
• Identified the sample space of a probability experiment
• Identified simple events• Distinguished among classical probability, empirical
probability, and subjective probability• Determined the probability of the complement of an
event• Used a tree diagram to find probabilities
Larson/Farber 4th ed 32
Section 4.2 Objectives
• Determine conditional probabilities• Distinguish between independent and dependent
events• Use the Multiplication Rule to find the probability of
two events occurring in sequence• Use the Multiplication Rule to find conditional
probabilities
Larson/Farber 4th ed 33
Section 4.2
Multiplication Rule
Larson/Farber 4th ed 34
Conditional Probability
Conditional Probability• The probability of an event occurring, given that
another event has already occurred• Denoted P(B | A) (read “probability of B, given A”)
Larson/Farber 4th ed 35
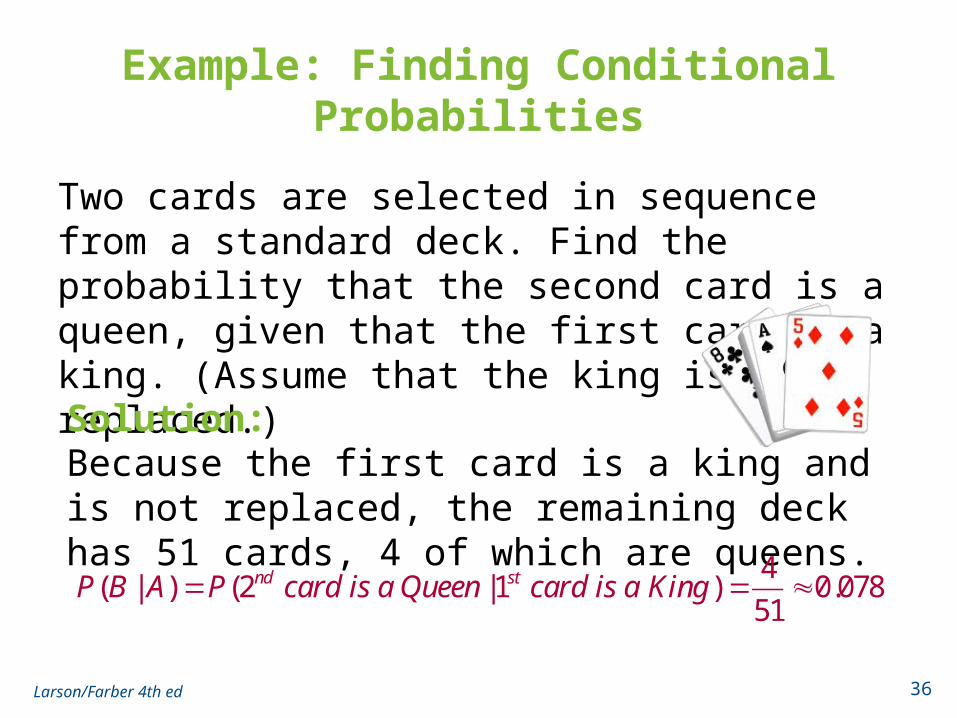
Example: Finding Conditional Probabilities
Two cards are selected in sequence from a standard deck. Find the probability that the second card is a queen, given that the first card is a king. (Assume that the king is not replaced.)
Larson/Farber 4th ed 36
Solution:Because the first card is a king and is not replaced, the remaining deck has 51 cards, 4 of which are queens.
4( | ) (2 |1 ) 0.078
51nd stP B A P card is a Queen card is a King
Exercise 1: Finding Conditional Probabilities
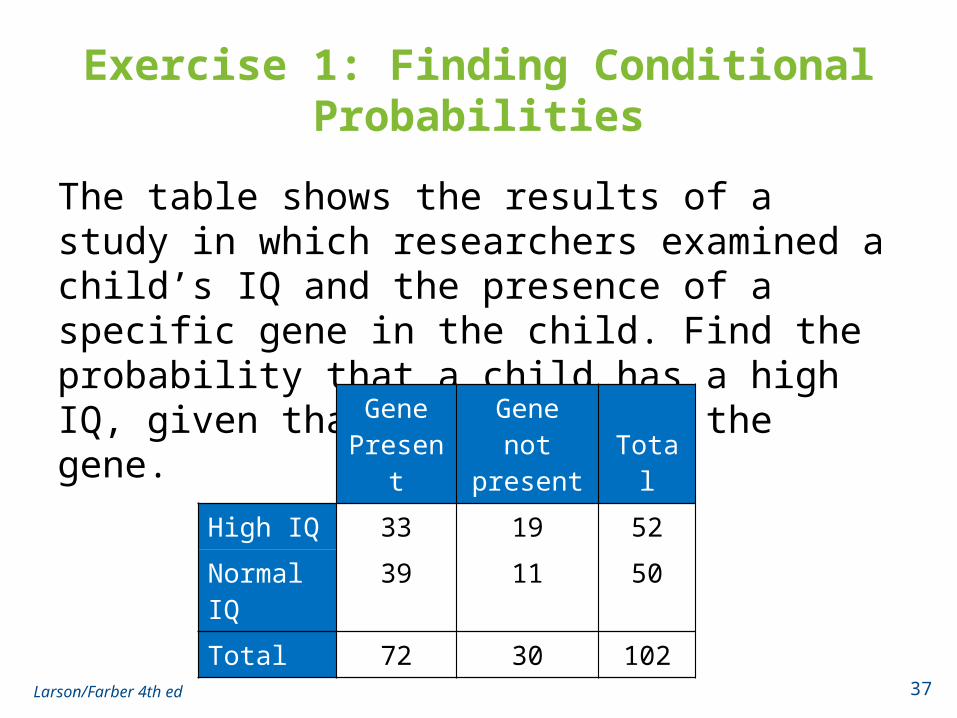
The table shows the results of a study in which researchers examined a child’s IQ and the presence of a specific gene in the child. Find the probability that a child has a high IQ, given that the child has the gene.
Larson/Farber 4th ed 37
Gene Present
Gene not present Total
High IQ 33 19 52
Normal IQ 39 11 50
Total 72 30 102
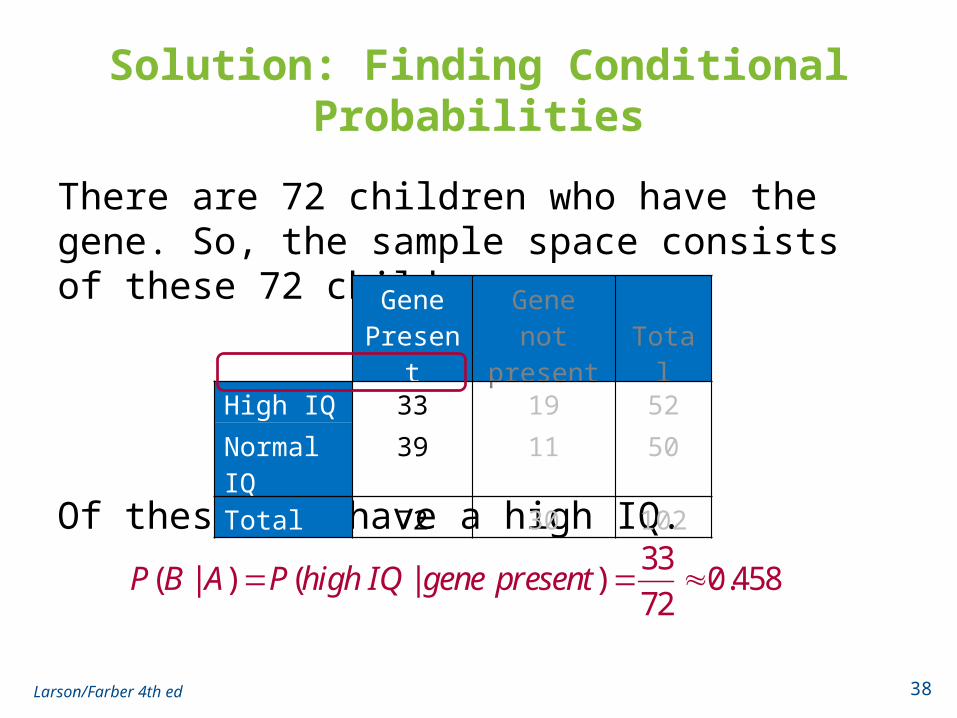
Solution: Finding Conditional Probabilities
There are 72 children who have the gene. So, the sample space consists of these 72 children.
Larson/Farber 4th ed 38
33( | ) ( | ) 0.458
72P B A P high IQ gene present
Of these, 33 have a high IQ.
Gene Present
Gene not present Total
High IQ 33 19 52
Normal IQ 39 11 50
Total 72 30 102
Independent and Dependent Events
Independent events• The occurrence of one of the events does not affect
the probability of the occurrence of the other event• P(B | A) = P(B) or P(A | B) = P(A)• Events that are not independent are dependent
Larson/Farber 4th ed 39
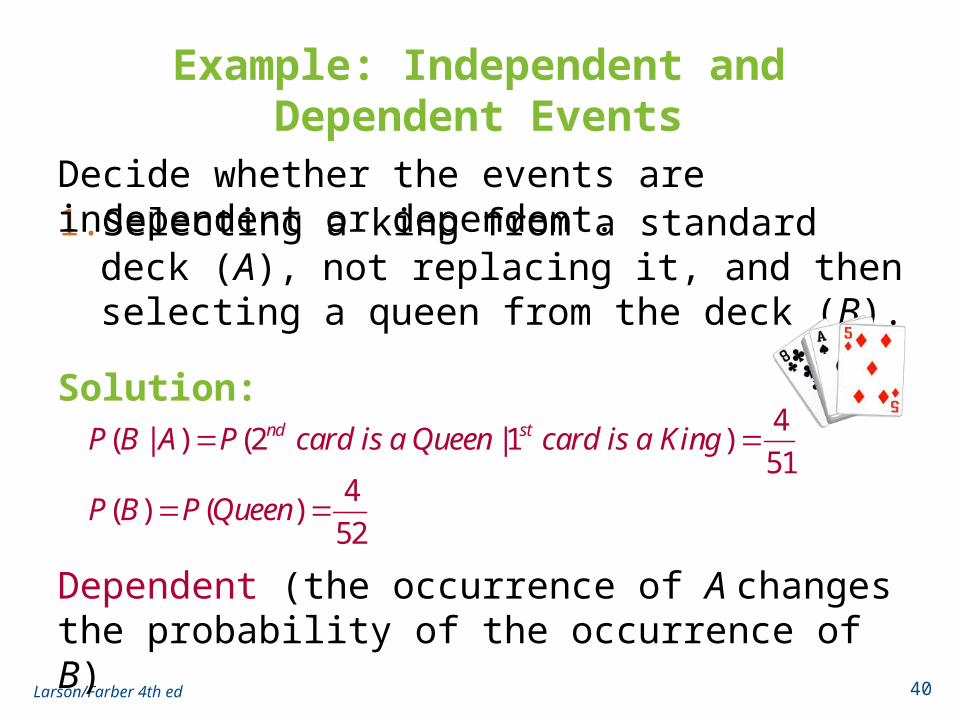
Example: Independent and Dependent Events
1. Selecting a king from a standard deck (A), not replacing it, and then selecting a queen from the deck (B).
Larson/Farber 4th ed 40
4( | ) (2 |1 )
51nd stP B A P card is a Queen card is a King
4( ) ( )
52P B P Queen
Dependent (the occurrence of A changes the probability of the occurrence of B)
Solution:
Decide whether the events are independent or dependent.
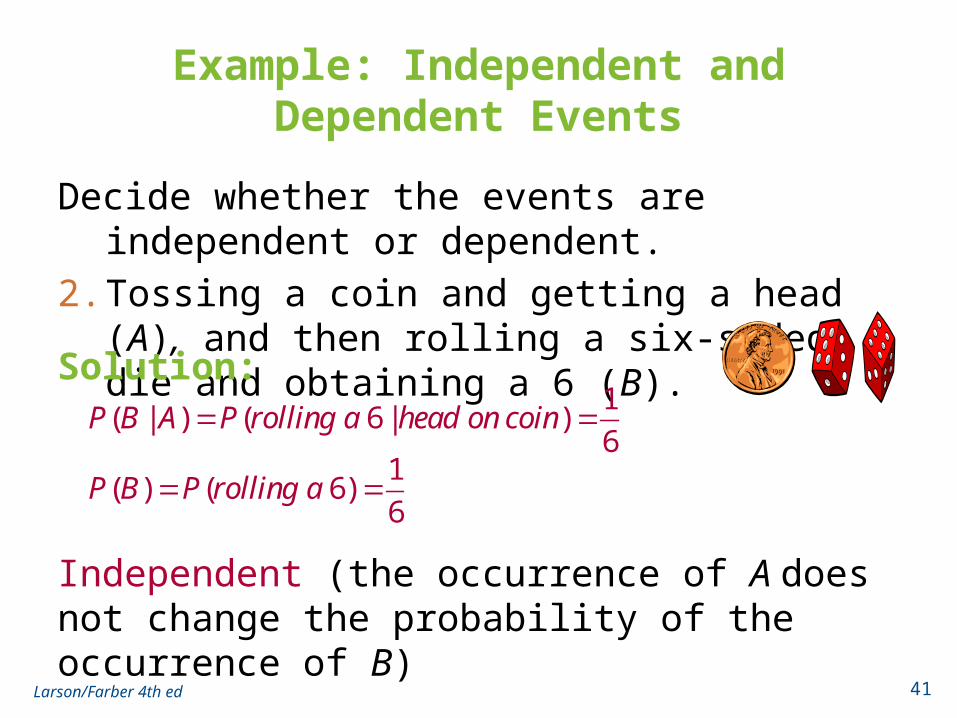
Example: Independent and Dependent Events
Decide whether the events are independent or dependent.
2. Tossing a coin and getting a head (A), and then rolling a six-sided die and obtaining a 6 (B).
Larson/Farber 4th ed 41
1( | ) ( 6 | )
6P B A P rolling a head on coin
1( ) ( 6)
6P B P rolling a
Independent (the occurrence of A does not change the probability of the occurrence of B)
Solution:
The Multiplication Rule
Multiplication rule for the probability of A and B• The probability that two events A and B will occur in
sequence is P(A and B) = P(A) ∙ P(B | A)
• For independent events the rule can be simplified to P(A and B) = P(A) ∙ P(B) Can be extended for any number of independent
events
Larson/Farber 4th ed 42
Exercise 2: Using the Multiplication Rule
Two cards are selected, without replacing the first card, from a standard deck. Find the probability of selecting a king and then selecting a queen.
Larson/Farber 4th ed 43
Solution:Because the first card is not replaced, the events are dependent.
( ) ( ) ( | )
4 4
52 5116
0.0062652
P K and Q P K P Q K
Example: Using the Multiplication Rule
A coin is tossed and a die is rolled. Find the probability of getting a head and then rolling a 6.
Larson/Farber 4th ed 44
Solution:The outcome of the coin does not affect the probability of rolling a 6 on the die. These two events are independent.
( 6) ( ) (6)
1 1
2 61
0.08312
P H and P H P
Exercise 3: Using the Multiplication Rule
The probability that a particular knee surgery is successful is 0.85. Find the probability that three knee surgeries are successful.
Larson/Farber 4th ed 45
Solution:The probability that each knee surgery is successful is 0.85. The chance for success for one surgery is independent of the chances for the other surgeries.
P(3 surgeries are successful) = (0.85)(0.85)(0.85) ≈ 0.614
Exercise 3: Using the Multiplication Rule
Find the probability that none of the three knee surgeries is successful.
Larson/Farber 4th ed 46
Solution:Because the probability of success for one surgery is 0.85. The probability of failure for one surgery is 1 – 0.85 = 0.15
P(none of the 3 surgeries is successful) = (0.15)(0.15)(0.15) ≈ 0.003

Exercise 3: Using the Multiplication Rule
Find the probability that none of the three knee surgeries is successful.
Larson/Farber 4th ed 47
Solution:Because the probability of success for one surgery is 0.85. The probability of failure for one surgery is 1 – 0.85 = 0.15
P(none of the 3 surgeries is successful) = (0.15)(0.15)(0.15) ≈ 0.003
Exercise 3: Using the Multiplication Rule
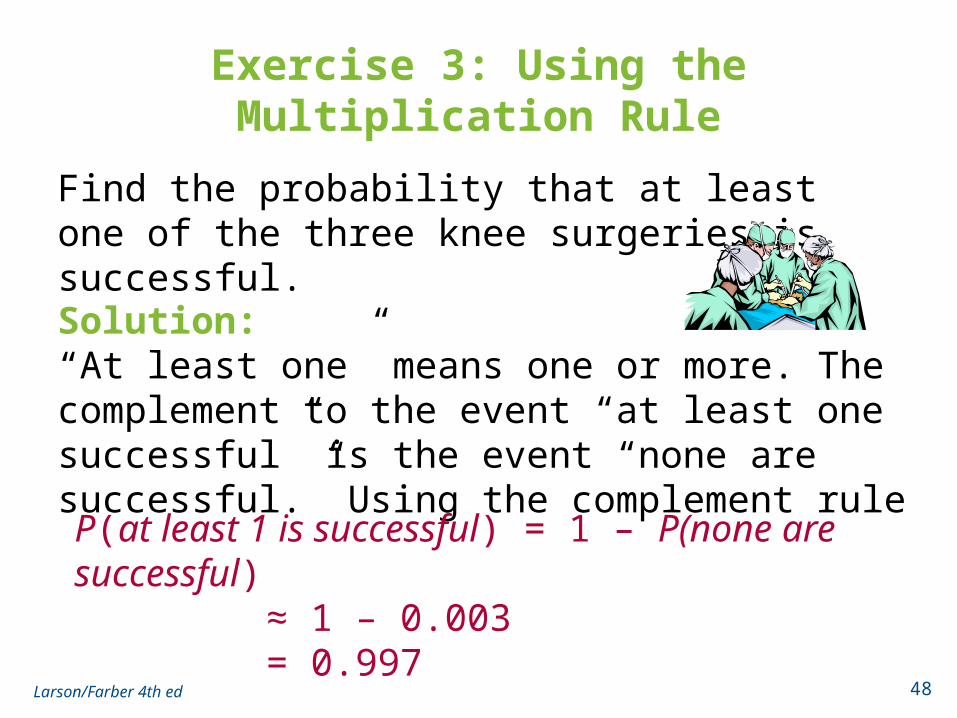
Find the probability that at least one of the three knee surgeries is successful.
Larson/Farber 4th ed 48
Solution:“At least one” means one or more. The complement to the event “at least one successful” is the event “none are successful.” Using the complement rule
P(at least 1 is successful) = 1 – P(none are successful)≈ 1 – 0.003= 0.997
Exercise 4: Using the Multiplication Rule to Find Probabilities
More than 15,000 U.S. medical school seniors applied to residency programs in 2007. Of those seniors
• 93% were matched to a residency position• Seventy-four percent of the seniors matched to a residency position were matched to one of their top two choices
Medical students electronically rank the residency programs in their order of preference.
The term “match” refers to the process where a student’s preference list and program director’s preference list overlap, resulting in a placement
. Larson/Farber 4th ed 49
Exercise 4: Using the Multiplication Rule to Find Probabilities
1. Find the probability that a randomly selected senior was matched a residency position and it was one of the senior’s top two choices.
Larson/Farber 4th ed 50
Solution:R = {matched to residency position}T = {matched to one of two top choices}
P(R) = 0.93 and P(T | R) = 0.74
P(R and T) = P(R)∙P(T | R) = (0.93)(0.74) ≈ 0.688dependent events
Exercise 4: Using the Multiplication Rule to Find Probabilities
2. Find the probability that a randomly selected senior that was matched to a residency position did not get matched with one of the senior’s top two choices.
Larson/Farber 4th ed 51
Solution:Use the complement:
P(T ′ | R) = 1 – P(T | R)
= 1 – 0.74 = 0.26
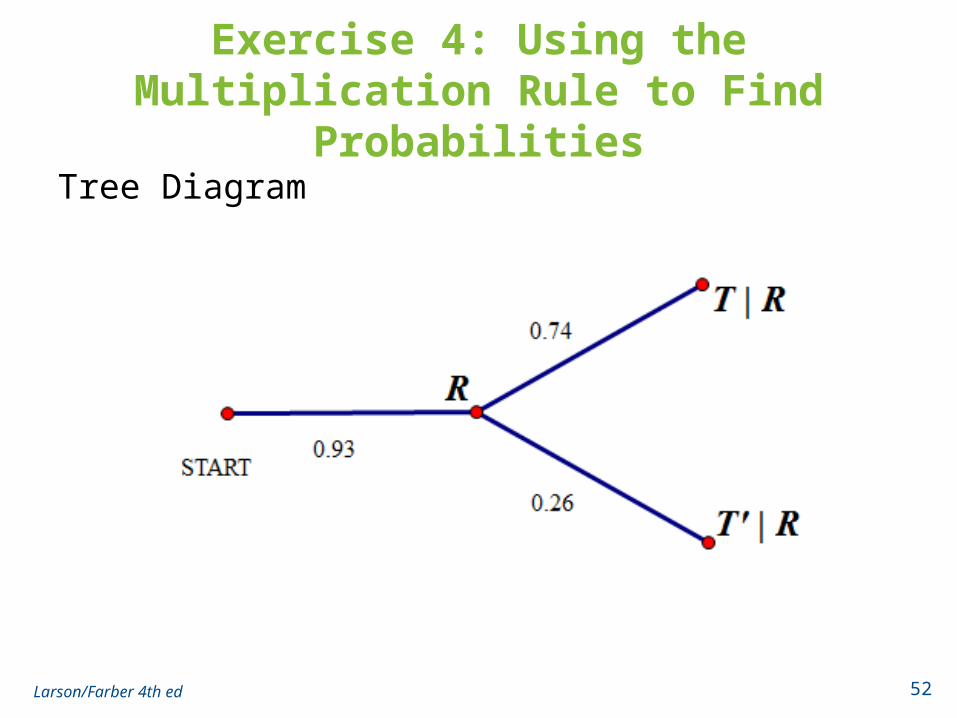
Exercise 4: Using the Multiplication Rule to Find Probabilities
Tree Diagram
Larson/Farber 4th ed 52
Section 4.2
Addition Rule
Larson/Farber 4th ed 53
Section 4.2 Objectives
• Determine if two events are mutually exclusive• Use the Addition Rule to find the probability of two
events
Larson/Farber 4th ed 54
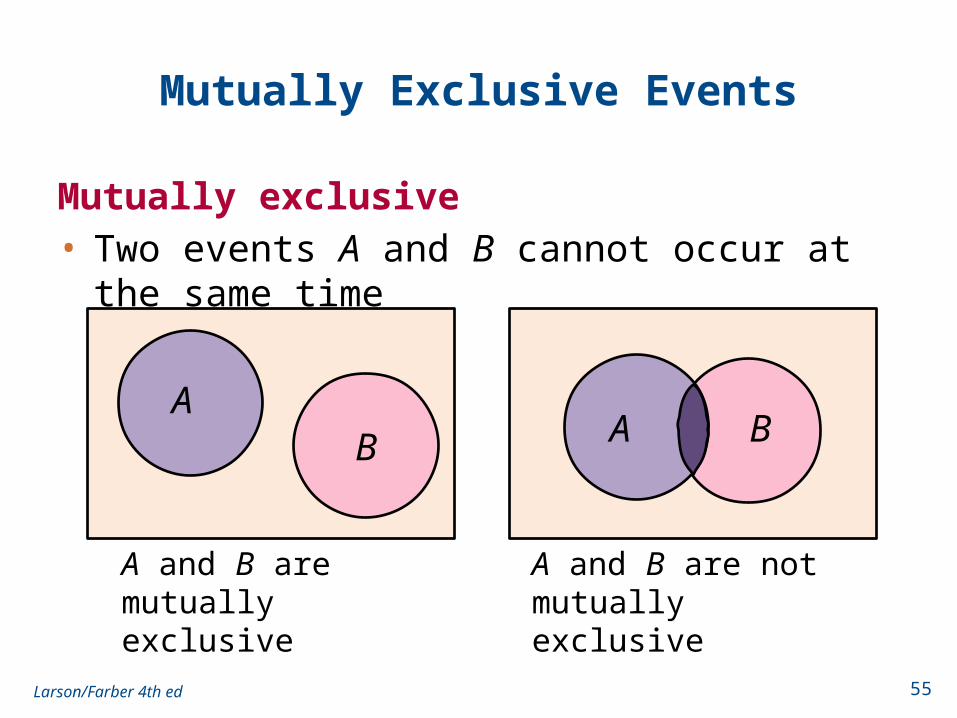
Mutually Exclusive Events
Mutually exclusive• Two events A and B cannot occur at the same time
Larson/Farber 4th ed 55
AB A B
A and B are mutually exclusive
A and B are not mutually exclusive
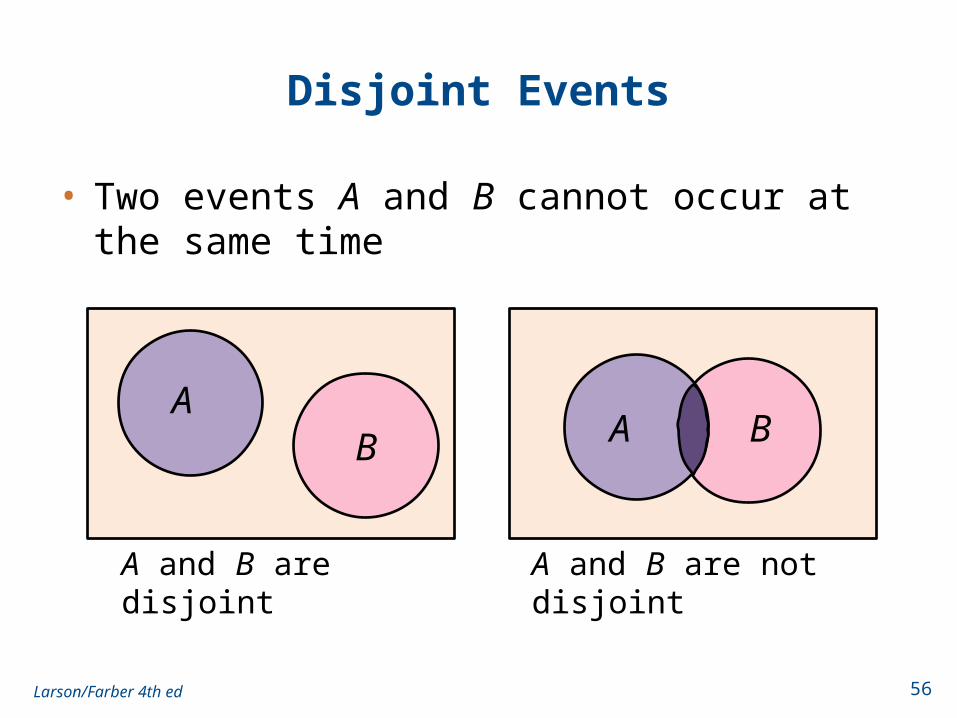
Disjoint Events
• Two events A and B cannot occur at the same time
Larson/Farber 4th ed 56
AB A B
A and B are disjoint A and B are not disjoint

Example: Mutually Exclusive Events
Decide if the events are mutually exclusive.
Event A: Roll a 3 on a die.
Event B: Roll a 4 on a die.
Larson/Farber 4th ed 57
Solution:Mutually exclusive (The first event has one outcome, a 3. The second event also has one outcome, a 4. These outcomes cannot occur at the same time.)
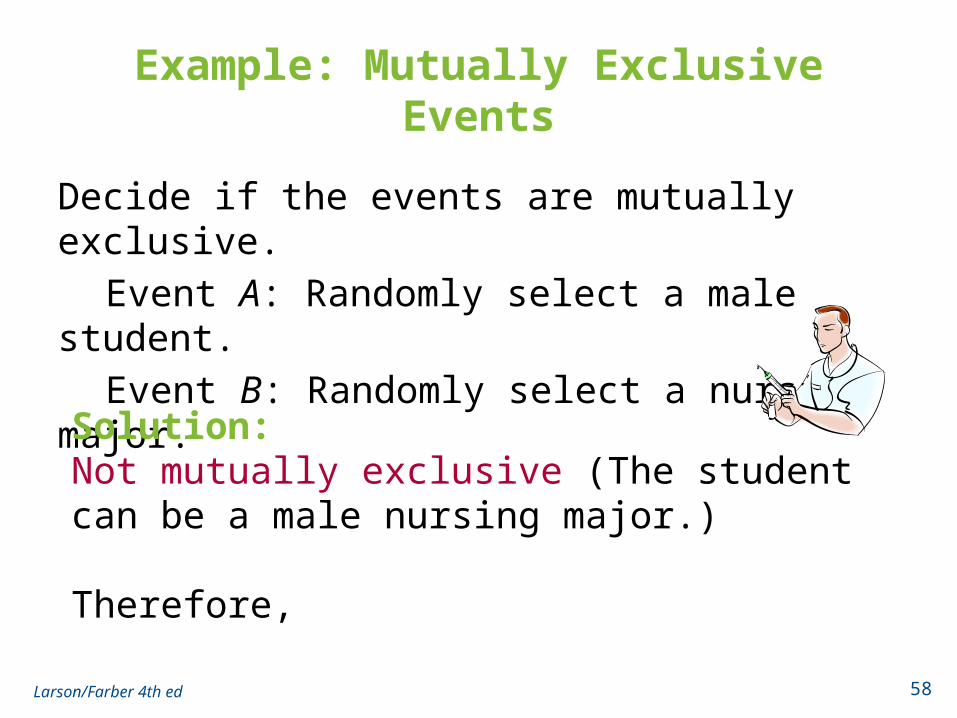
Example: Mutually Exclusive Events
Decide if the events are mutually exclusive.
Event A: Randomly select a male student.
Event B: Randomly select a nursing major.
Larson/Farber 4th ed 58
Solution:Not mutually exclusive (The student can be a male nursing major.)
Therefore,

The Addition Rule
Addition rule for the probability of A or B• The probability that events A or B will occur is
P(A or B) = P(A) + P(B) – P(A and B)• For mutually exclusive events A and B, the rule can
be simplified to P(A or B) = P(A) + P(B) Can be extended to any number of mutually
exclusive events
Larson/Farber 4th ed 59

Exercise 1: Using the Addition Rule
You select a card from a standard deck. Find the probability that the card is a 4 or an ace.
Larson/Farber 4th ed 60
Solution:The events are mutually exclusive (if the card is a 4, it cannot be an ace)
(4 ) (4) ( )
4 4
52 528
0.15452
P or ace P P ace
4♣4♥
4♦4♠ A♣
A♥
A♦
A♠
44 other cards
Deck of 52 Cards
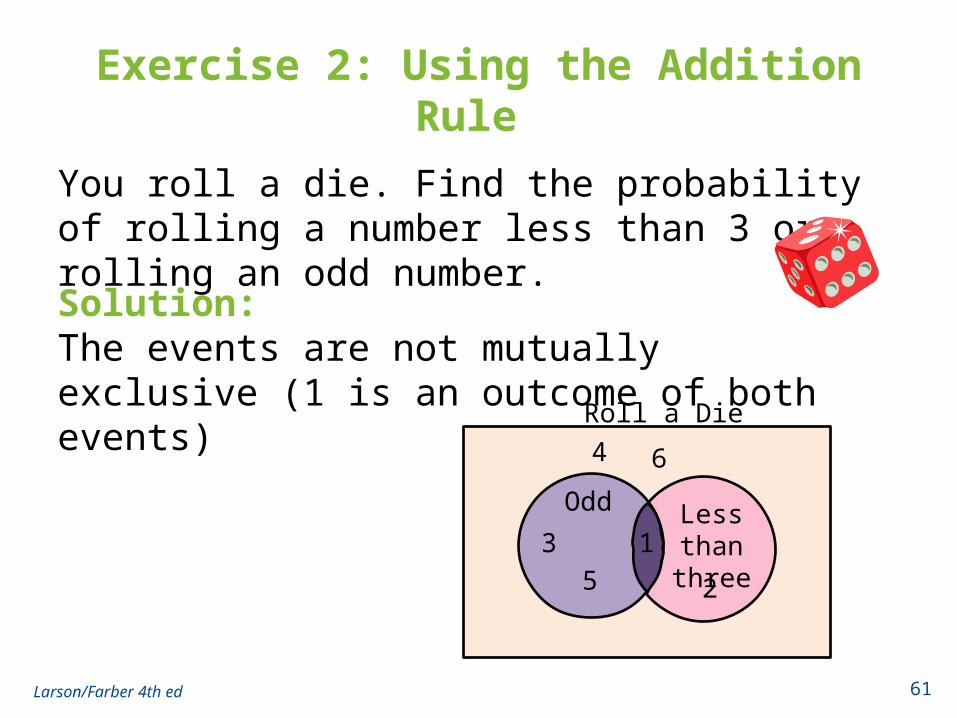
Exercise 2: Using the Addition Rule
You roll a die. Find the probability of rolling a number less than 3 or rolling an odd number.
Larson/Farber 4th ed 61
Solution:The events are not mutually exclusive (1 is an outcome of both events)
Odd
5
3 1
2
4 6
Less than three
Roll a Die
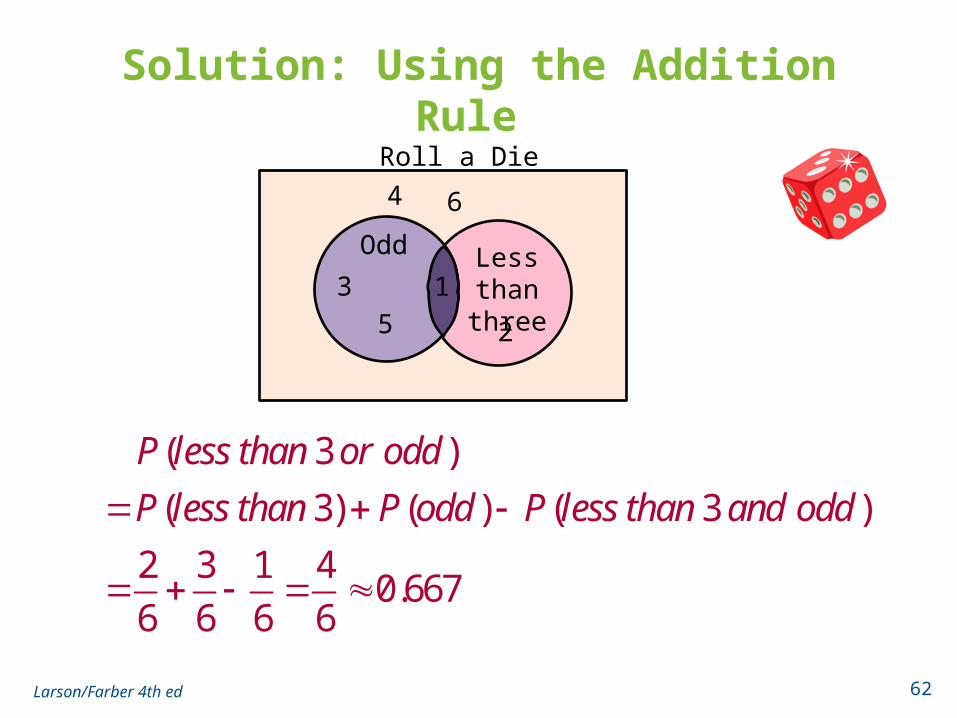
Solution: Using the Addition Rule
Larson/Farber 4th ed 62
( 3 )
( 3) ( ) ( 3 )
2 3 1 40.667
6 6 6 6
P less than or odd
P less than P odd P less than and odd
Odd
5
3 1
2
4 6
Less than three
Roll a Die
Example: Using the Addition Rule
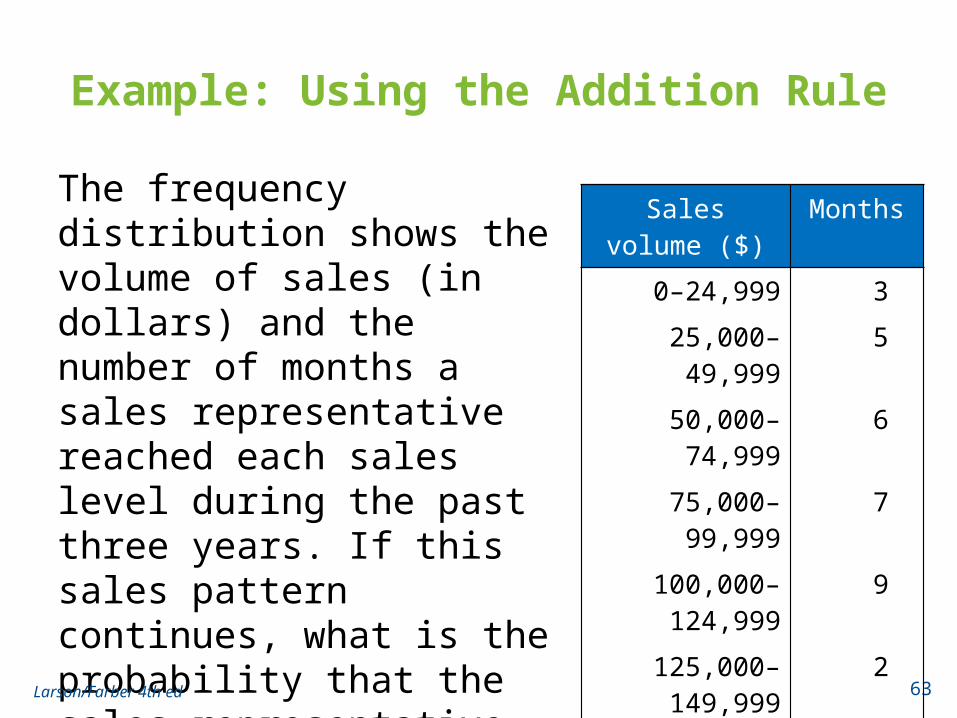
The frequency distribution shows the volume of sales (in dollars) and the number of months a sales representative reached each sales level during the past three years. If this sales pattern continues, what is the probability that the sales representative will sell between $75,000 and $124,999 next month?
Larson/Farber 4th ed 63
Sales volume ($) Months
0–24,999 3
25,000–49,999 5
50,000–74,999 6
75,000–99,999 7
100,000–124,999 9
125,000–149,999 2
150,000–174,999 3
175,000–199,999 1
TOTAL 36
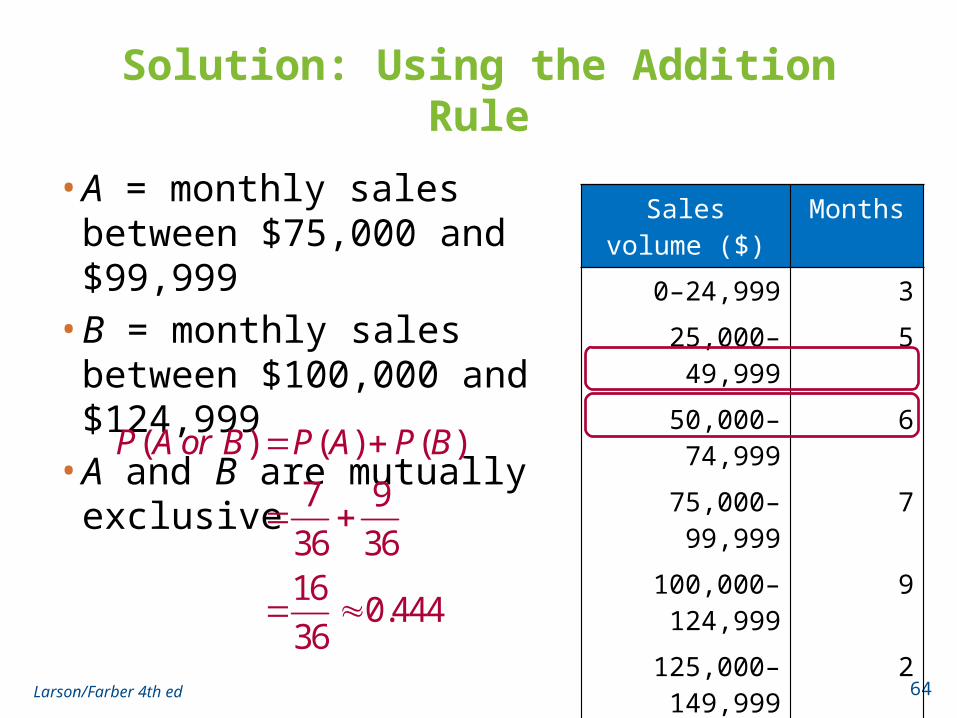
Solution: Using the Addition Rule
• A = monthly sales between $75,000 and $99,999
• B = monthly sales between $100,000 and $124,999
• A and B are mutually exclusive
Larson/Farber 4th ed 64
Sales volume ($) Months
0–24,999 3
25,000–49,999 5
50,000–74,999 6
75,000–99,999 7
100,000–124,999 9
125,000–149,999 2
150,000–174,999 3
175,000–199,999 1
TOTAL 36
( ) ( ) ( )
7 9
36 3616
0.44436
P A or B P A P B
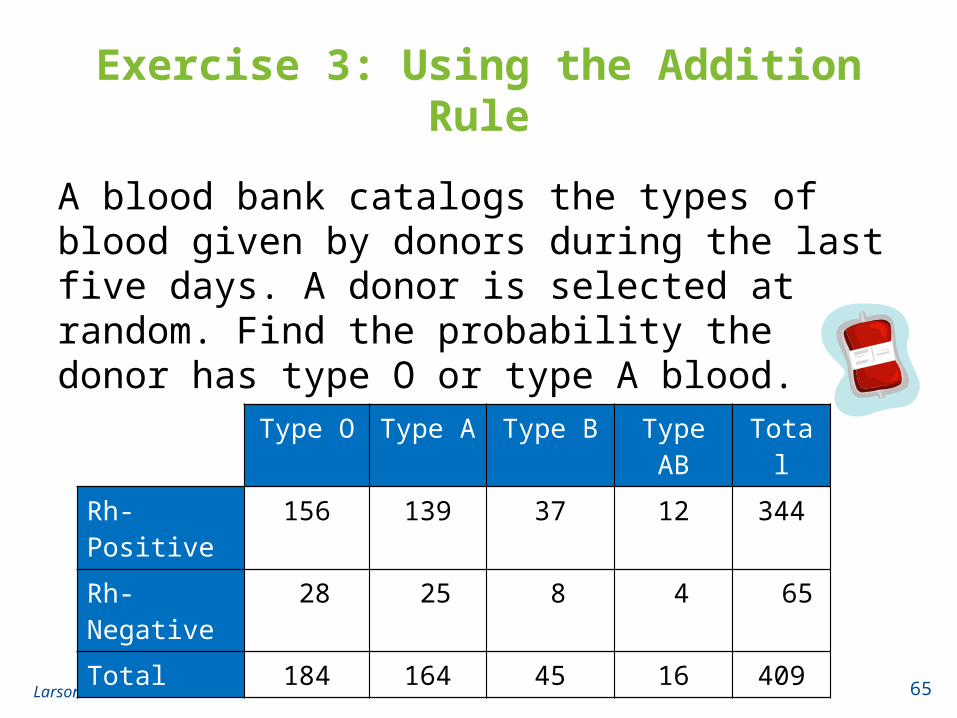
Exercise 3: Using the Addition Rule
A blood bank catalogs the types of blood given by donors during the last five days. A donor is selected at random. Find the probability the donor has type O or type A blood.
Larson/Farber 4th ed 65
Type O Type A Type B Type AB Total
Rh-Positive 156 139 37 12 344
Rh-Negative 28 25 8 4 65
Total 184 164 45 16 409
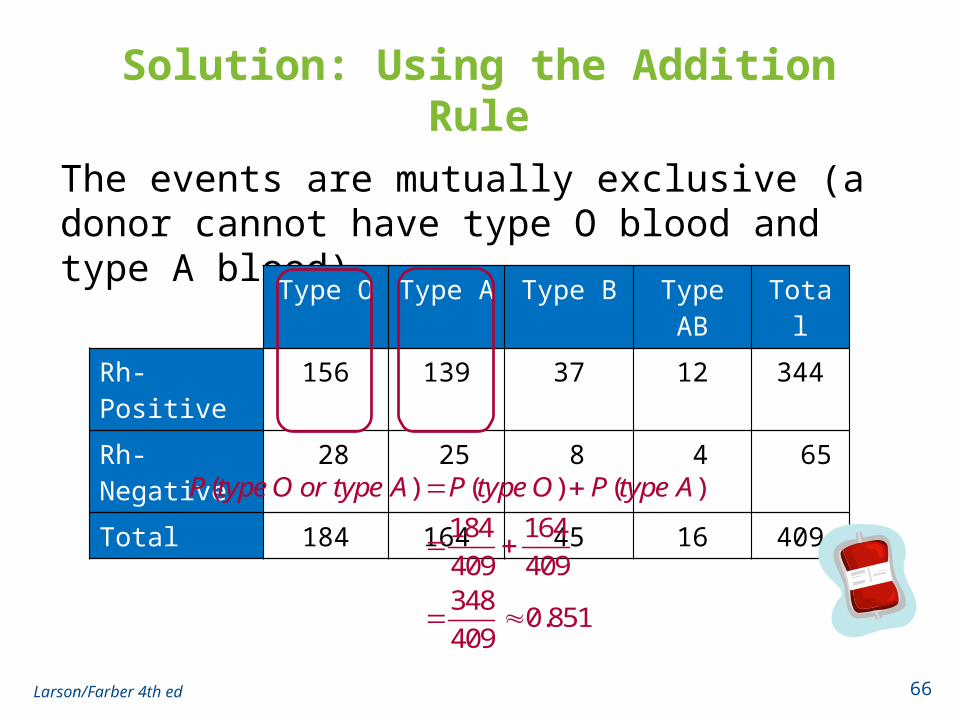
Solution: Using the Addition Rule
Larson/Farber 4th ed 66
The events are mutually exclusive (a donor cannot have type O blood and type A blood)
Type O Type A Type B Type AB Total
Rh-Positive 156 139 37 12 344
Rh-Negative 28 25 8 4 65
Total 184 164 45 16 409
( ) ( ) ( )
184 164
409 409348
0.851409
P type O or type A P type O P type A

Exercise 4: Using the Addition Rule
Find the probability the donor has type B or is Rh-negative.
Larson/Farber 4th ed 67
Solution:
The events are not mutually exclusive (a donor can have type B blood and be Rh-negative)
Type O Type A Type B Type AB Total
Rh-Positive 156 139 37 12 344
Rh-Negative 28 25 8 4 65
Total 184 164 45 16 409
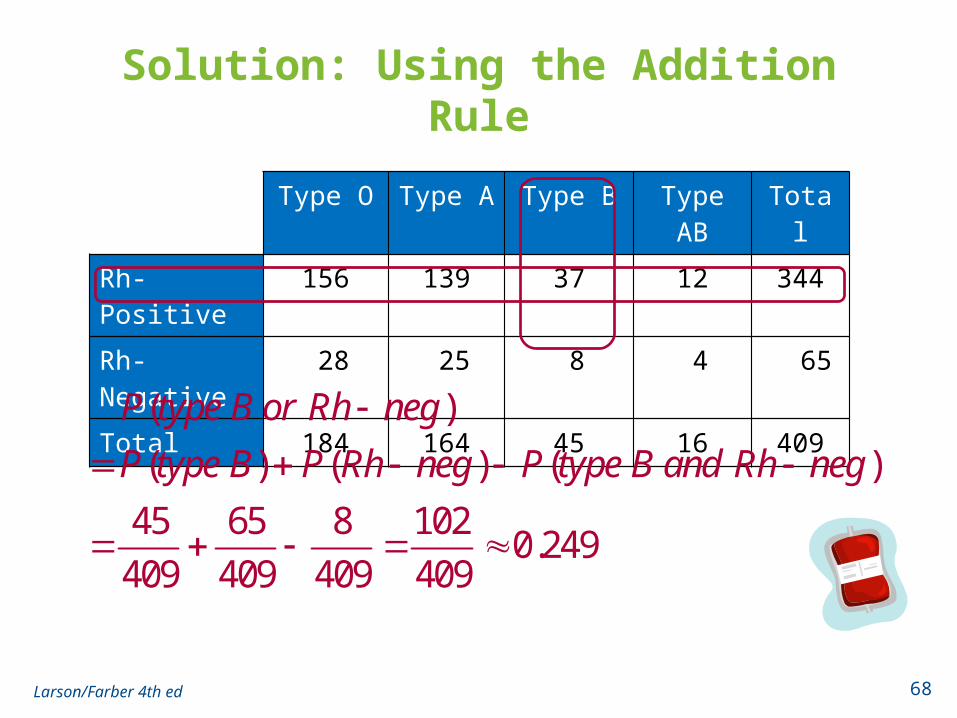
Solution: Using the Addition Rule
Larson/Farber 4th ed 68
Type O Type A Type B Type AB Total
Rh-Positive 156 139 37 12 344
Rh-Negative 28 25 8 4 65
Total 184 164 45 16 409
( )
( ) ( ) ( )
45 65 8 1020.249
409 409 409 409
P type B or Rh neg
P type B P Rh neg P type B and Rh neg

Exercise 5: Venn Diagrams
Larson/Farber 4th ed 69
In a program to prepare for a high school equivalency exam it is found that 80% of the students need work in math, 70% in English, and 55% in both areas. Draw a Venn diagram and find the probability that a randomly selected student will need work in
a. Math and Englishb. Math or Englishc. Math, but not Englishd. English, but not Mathe. Neither Math nor English
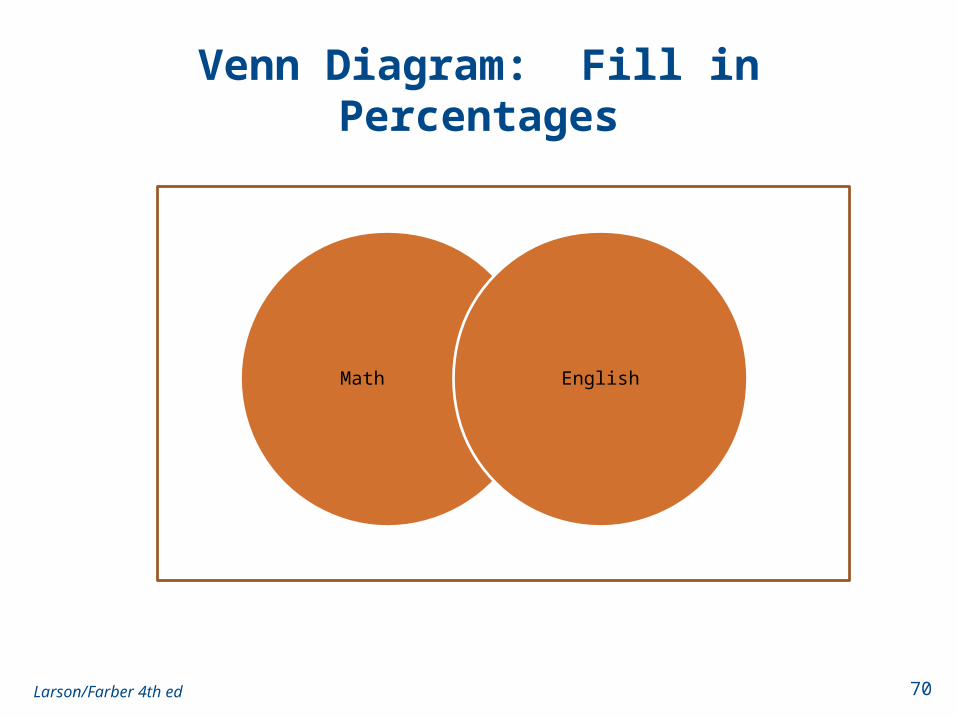
Venn Diagram: Fill in Percentages
Larson/Farber 4th ed 70
Math English
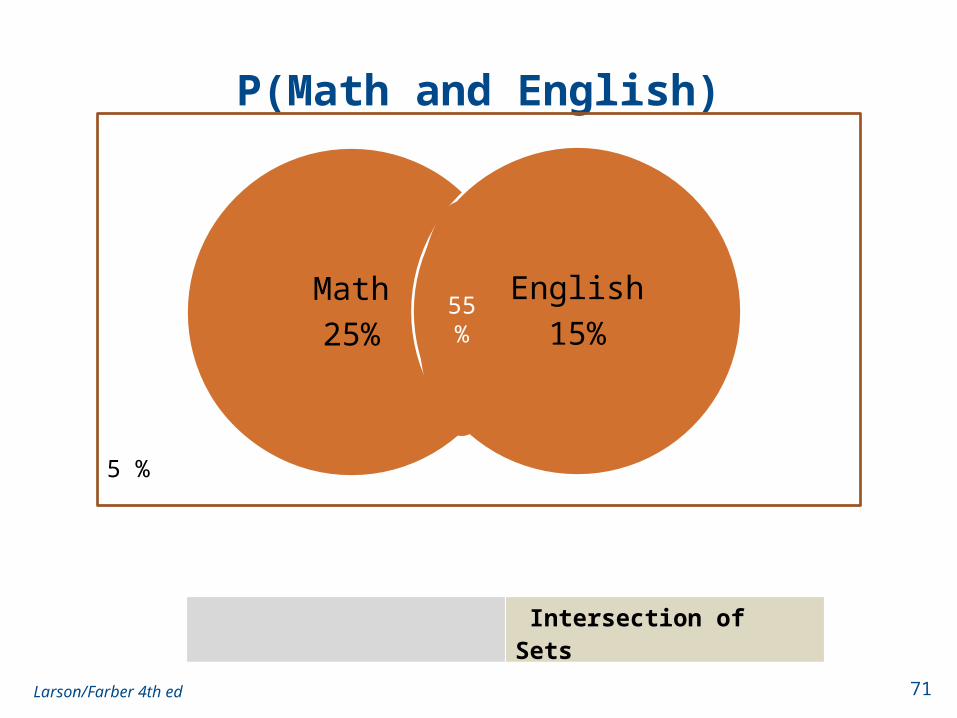
P(Math and English)
Larson/Farber 4th ed 71
Math
25%
English
15%55%
Intersection of Sets
5%55
5 %

P(Math or English)
Larson/Farber 4th ed 72
Math
25%
English
15%55%
This is inclusive OR. Add appropriate pieces.
5%55
5 %
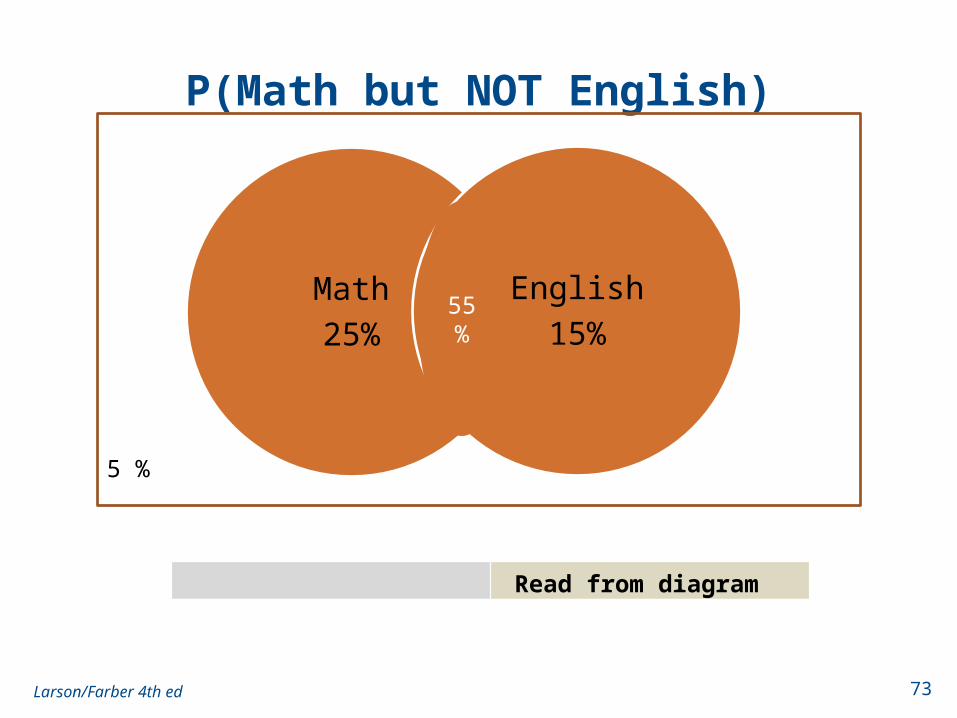
P(Math but NOT English)
Larson/Farber 4th ed 73
Math
25%
English
15%55%
Read from diagram
5%55
5 %
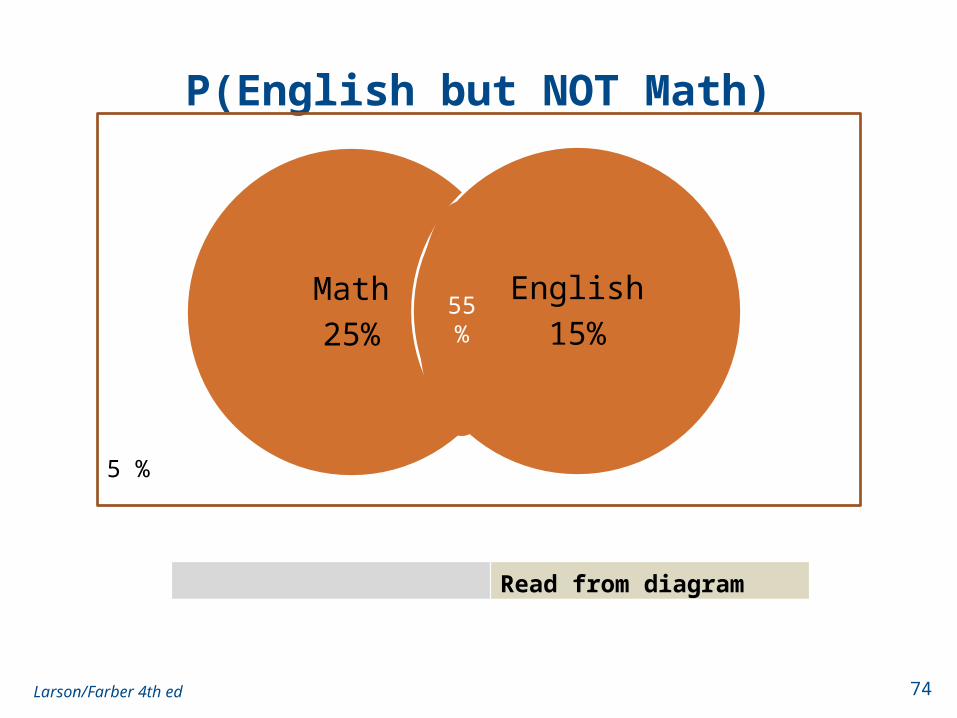
P(English but NOT Math)
Larson/Farber 4th ed 74
Math
25%
English
15%55%
Read from diagram
5%55
5 %
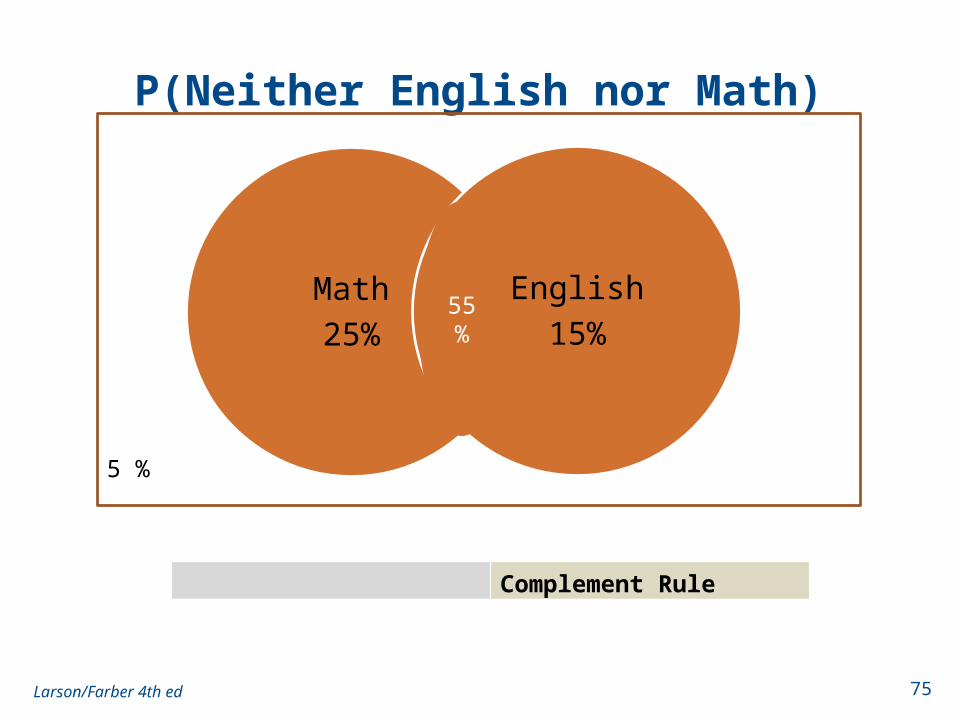
P(Neither English nor Math)
Larson/Farber 4th ed 75
Math
25%
English
15%55%
Complement Rule
5%55
5 %
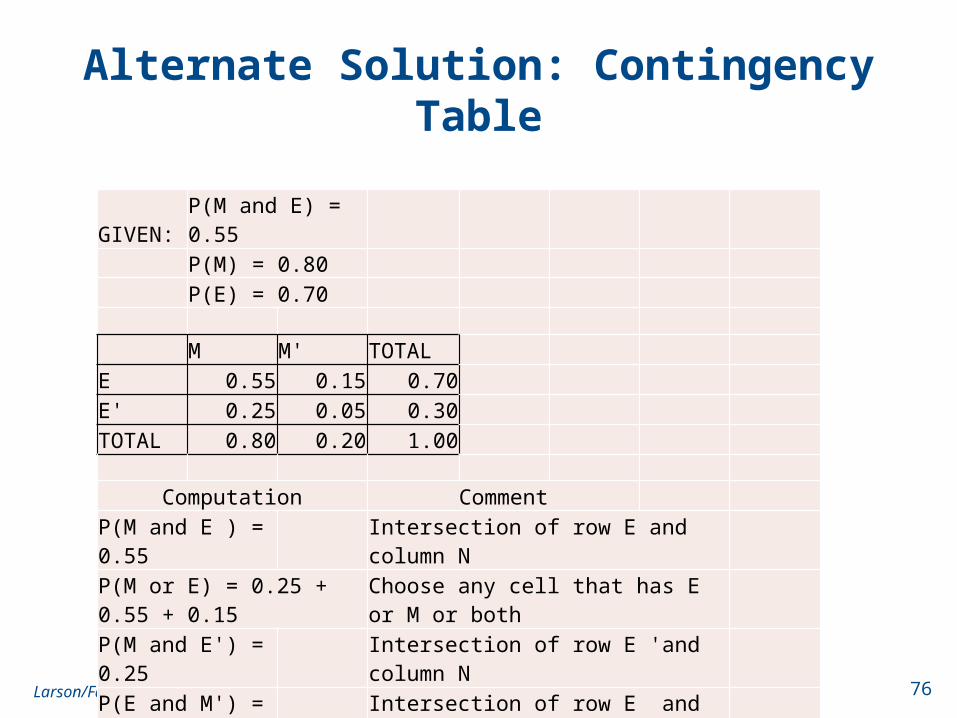
Alternate Solution: Contingency Table
Larson/Farber 4th ed 76
GIVEN: P(M and E) = 0.55P(M) = 0.80P(E) = 0.70
M M' TOTALE 0.55 0.15 0.70E' 0.25 0.05 0.30TOTAL 0.80 0.20 1.00
Computation CommentP(M and E ) = 0.55 Intersection of row E and column NP(M or E) = 0.25 + 0.55 + 0.15 Choose any cell that has E or M or bothP(M and E') = 0.25 Intersection of row E 'and column NP(E and M') = 0.15 Intersection of row E and column M'P(E' and M') = 0.05 Intersection of row E ' and column M'P(M| E) = 0.55/0.70 = 0.786P(E | M) = 0.55/0.80 = 0.688

Section 4.2 Summary
• Determined if two events are mutually exclusive• Used the Addition Rule to find the probability of two
events
Larson/Farber 4th ed 77
Section 4.3 Objectives
• Use a tree diagram and the Fundamental Counting Principle to find probabilities
• Determine the number of ways a group of objects can be arranged in order
• Determine the number of ways to choose several objects from a group without regard to order
• Use the counting principles to find probabilities
Larson/Farber 4th ed 78
Fundamental Counting Principle
Fundamental Counting Principle• If one event can occur in m ways and a second event
can occur in n ways, the number of ways the two events can occur in sequence is m*n.
• Can be extended for any number of events occurring in sequence.
Larson/Farber 4th ed 79

Example: Fundamental Counting Principle
You are purchasing a new car. The possible manufacturers, car sizes, and colors are listed.
Manufacturer: Ford, GM, Honda
Car size: compact, midsize
Color: white (W), red (R), black (B), green (G)
How many different ways can you select one manufacturer, one car size, and one color? Use a tree diagram to check your result.
Larson/Farber 4th ed 80
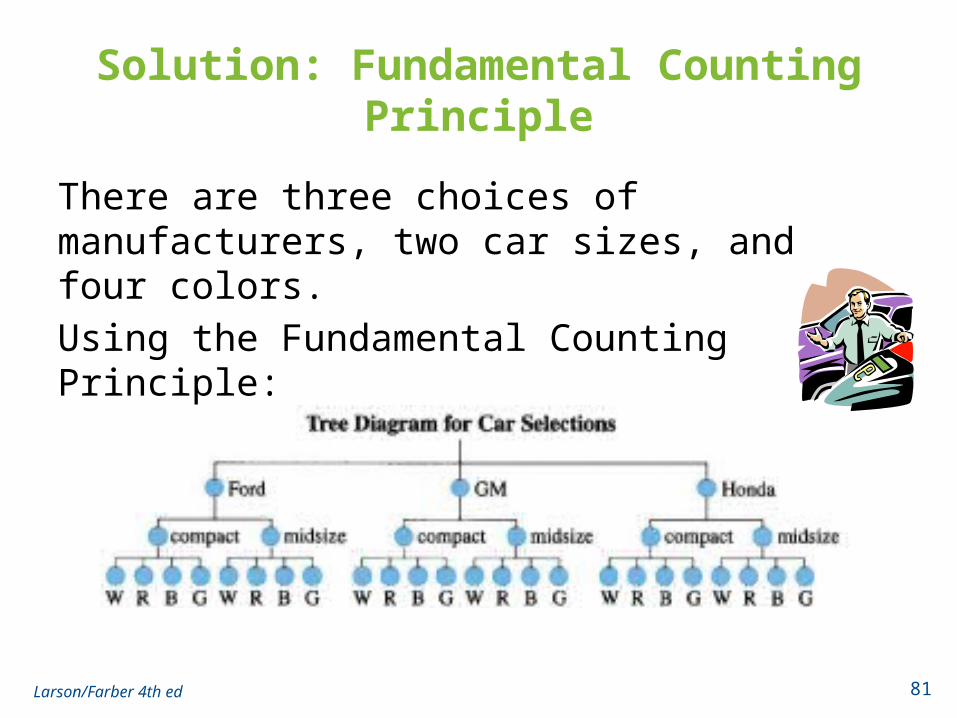
Solution: Fundamental Counting Principle
There are three choices of manufacturers, two car sizes, and four colors.
Using the Fundamental Counting Principle:
3 ∙ 2 ∙ 4 = 24 ways
Larson/Farber 4th ed 81
Permutations
Permutation• An ordered arrangement of objects• The number of different permutations of n distinct
objects is n! (n factorial) n! = n∙(n – 1)∙(n – 2)∙(n – 3)∙ ∙ ∙3∙2 ∙1 0! = 1 Examples:
• 6! = 6∙5∙4∙3∙2∙1 = 720• 4! = 4∙3∙2∙1 = 24
Larson/Farber 4th ed 82
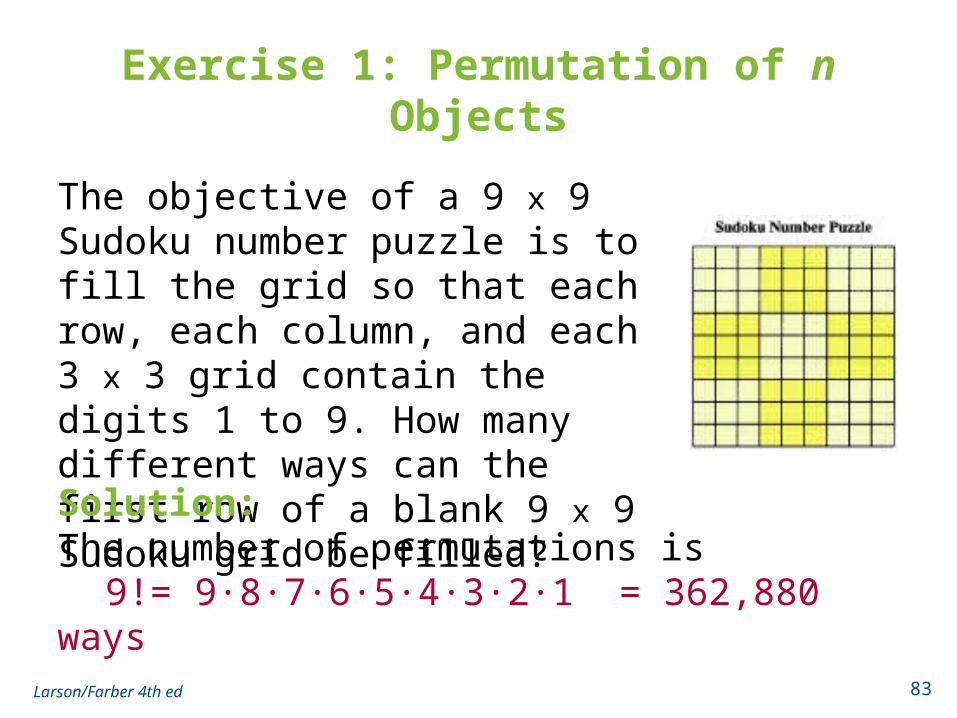
Exercise 1: Permutation of n Objects
The objective of a 9 x 9 Sudoku number puzzle is to fill the grid so that each row, each column, and each 3 x 3 grid contain the digits 1 to 9. How many different ways can the first row of a blank 9 x 9 Sudoku grid be filled?
Larson/Farber 4th ed 83
Solution:The number of permutations is
9!= 9∙8∙7∙6∙5∙4∙3∙2∙1 = 362,880 ways
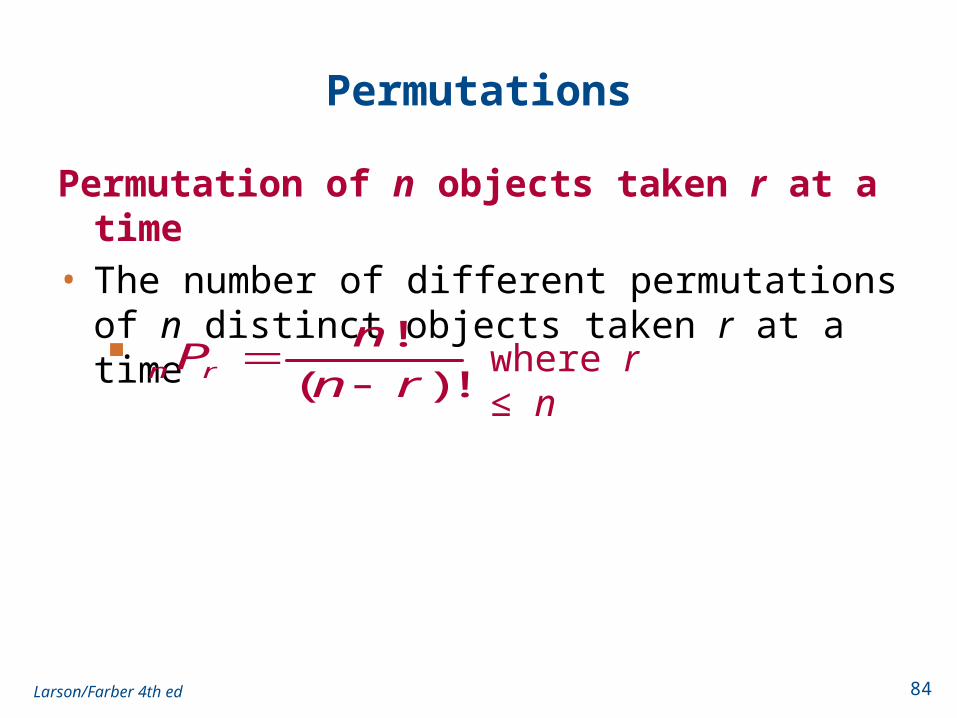
Permutations
Permutation of n objects taken r at a time• The number of different permutations of n distinct
objects taken r at a time
Larson/Farber 4th ed 84
!
( )!n r
nP
n r
■ where r ≤ n
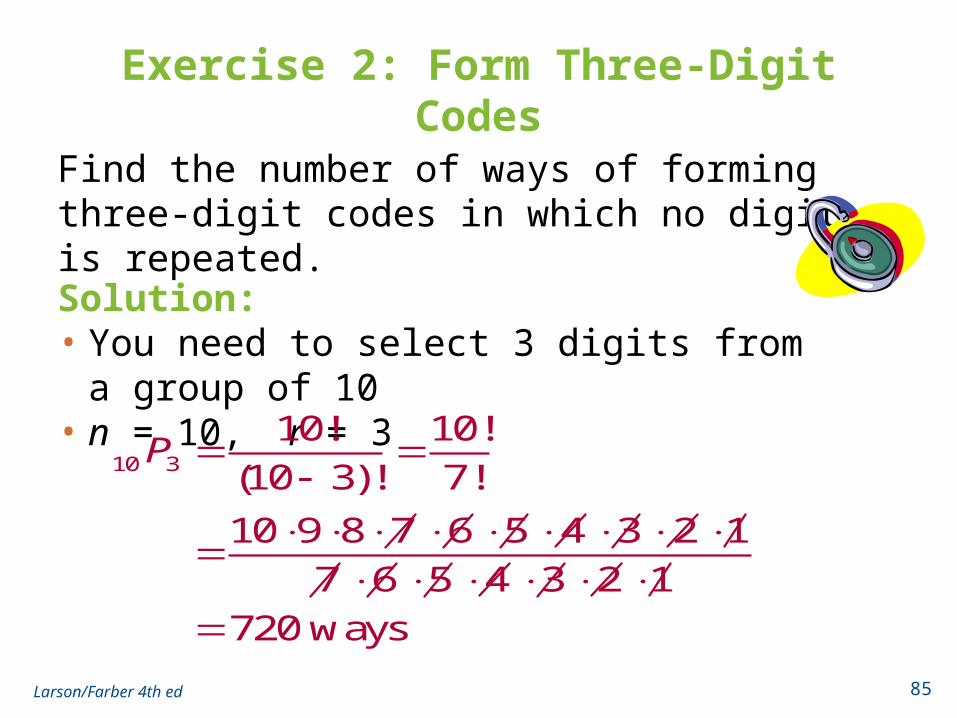
Exercise 2: Form Three-Digit Codes
Find the number of ways of forming three-digit codes in which no digit is repeated.
Larson/Farber 4th ed 85
Solution:• You need to select 3 digits from a group of 10• n = 10, r = 3
10 3
10! 10!
(10 3)! 7!
10 9 8 7 6 5 4 3 2 1
7 6 5 4 3 2 1
720 ways
P

Exercise 3: Finding nPr
Forty-three race cars started the 2007 Daytona 500. How many ways can the cars finish first, second, and third?
Larson/Farber 4th ed 86
Solution:• You need to select 3 cars from a group of 43• n = 43, r = 3
43 3
43! 43!
(43 3)! 40!
43 42 41
74,046 ways
P
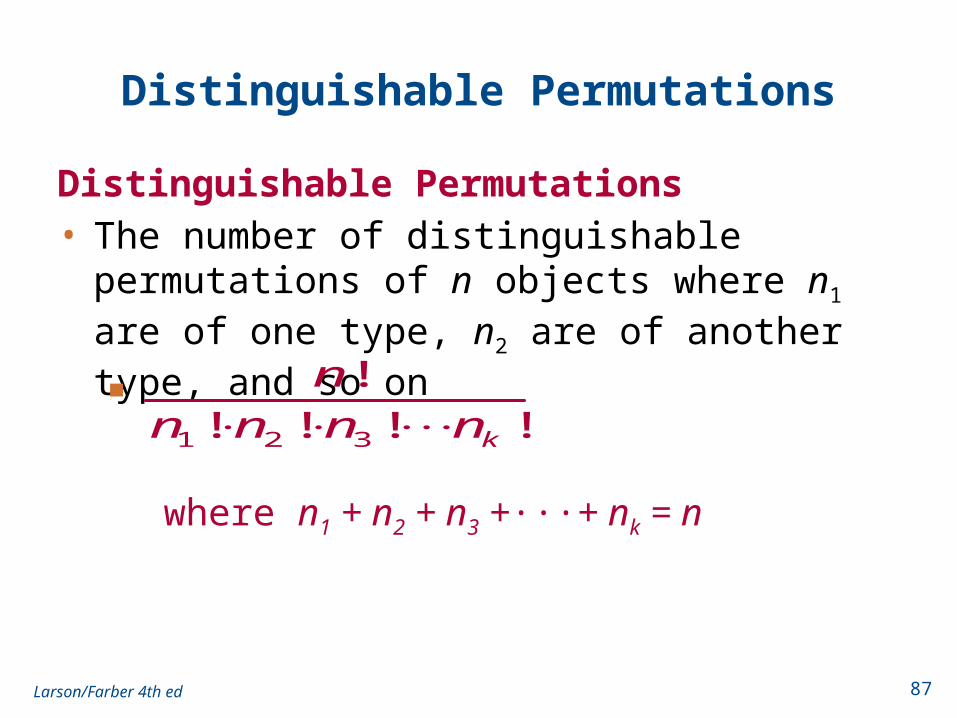
Distinguishable Permutations
Distinguishable Permutations• The number of distinguishable permutations of n
objects where n1 are of one type, n2 are of another type, and so on
Larson/Farber 4th ed 87
1 2 3
!
! ! ! !k
n
n n n n ■
where n1 + n2 + n3 +∙∙∙+ nk = n
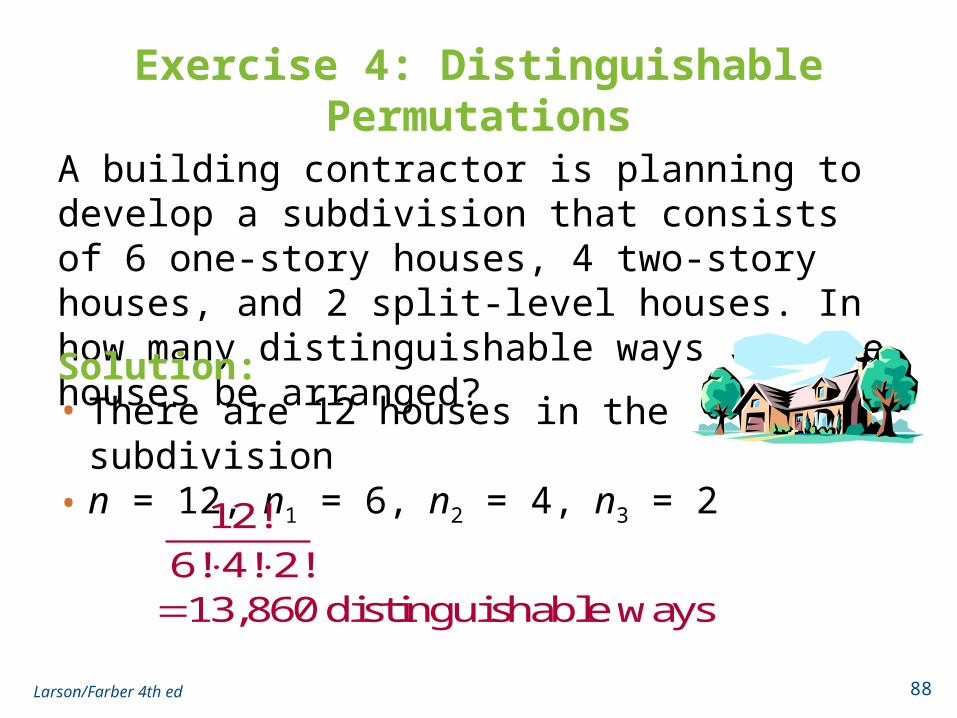
Exercise 4: Distinguishable Permutations
A building contractor is planning to develop a subdivision that consists of 6 one-story houses, 4 two-story houses, and 2 split-level houses. In how many distinguishable ways can the houses be arranged?
Larson/Farber 4th ed 88
Solution:• There are 12 houses in the subdivision• n = 12, n1 = 6, n2 = 4, n3 = 2
12!
6! 4! 2!13,860 distinguishable ways
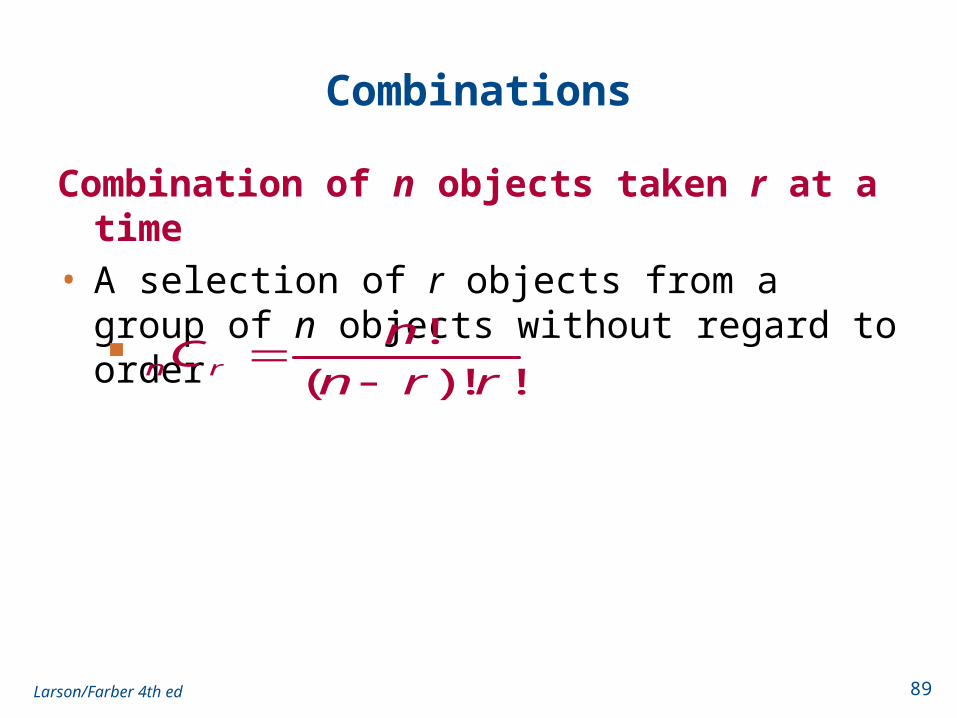
Combinations
Combination of n objects taken r at a time• A selection of r objects from a group of n objects
without regard to order
Larson/Farber 4th ed 89
!
( )! !n r
nC
n r r
■
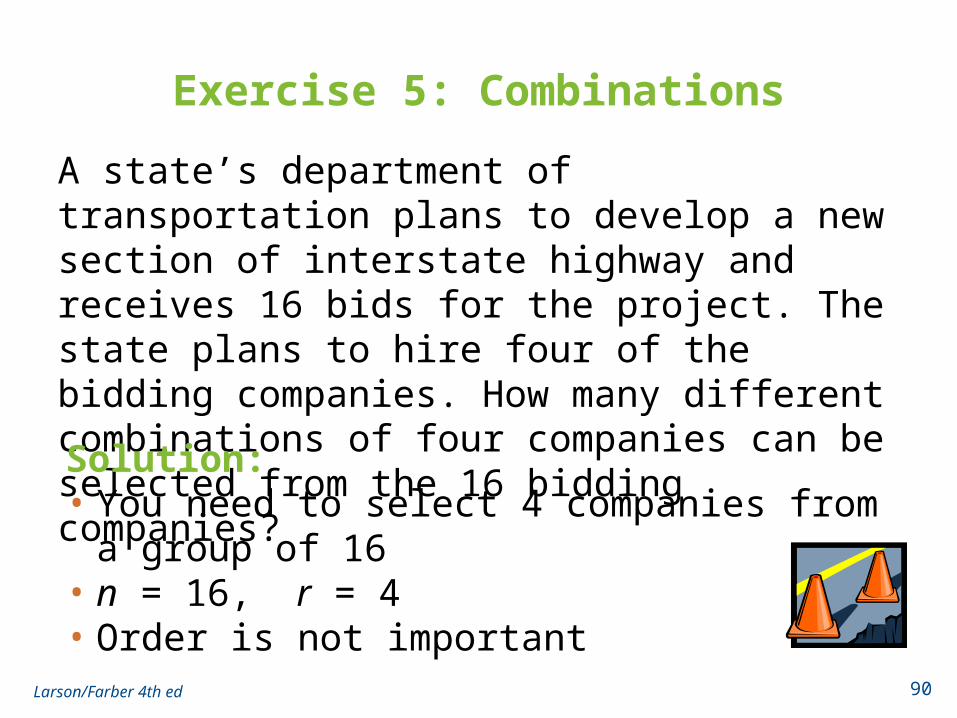
Exercise 5: Combinations
A state’s department of transportation plans to develop a new section of interstate highway and receives 16 bids for the project. The state plans to hire four of the bidding companies. How many different combinations of four companies can be selected from the 16 bidding companies?
Larson/Farber 4th ed 90
Solution:• You need to select 4 companies from a group of 16• n = 16, r = 4• Order is not important
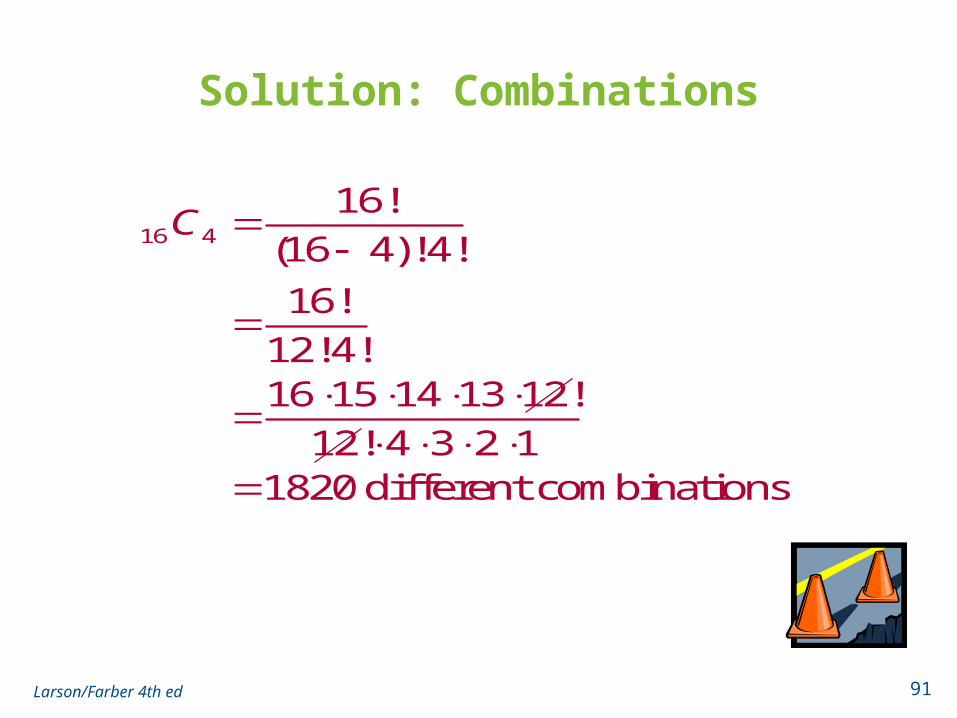
Solution: Combinations
Larson/Farber 4th ed 91
16 4
16!
(16 4)!4!
16!
12!4!16 15 14 13 12!
12! 4 3 2 11820 different combinations
C
Exercise 6: Finding Probabilities
A student advisory board consists of 17 members. Three members serve as the board’s chair, secretary, and webmaster. Each member is equally likely to serve any of the positions. What is the probability of selecting at random the three members that hold each position?
Larson/Farber 4th ed 92
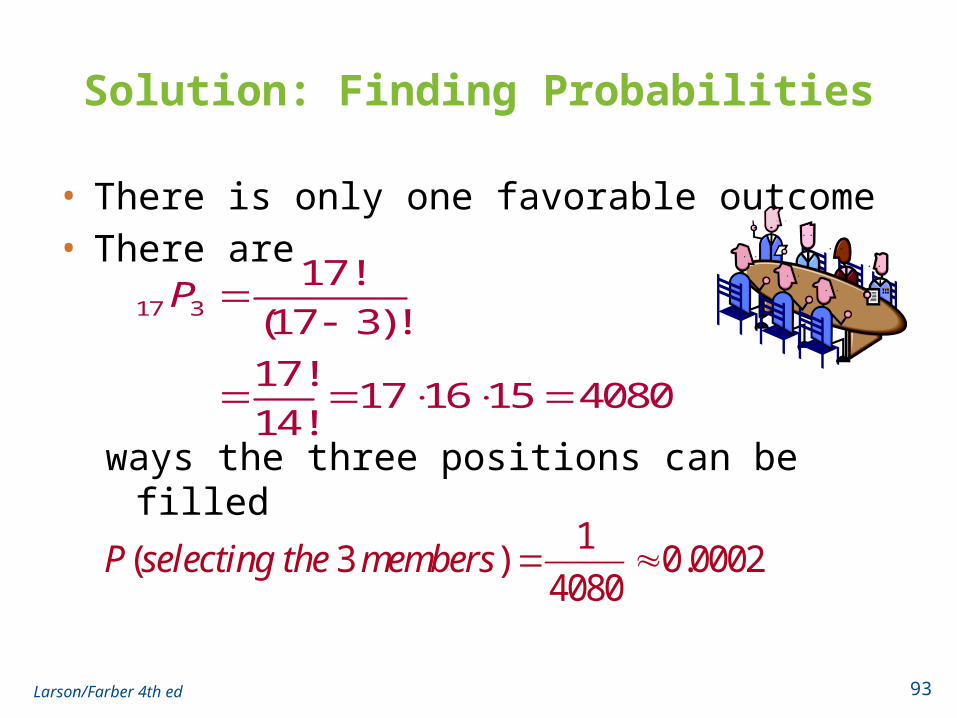
Solution: Finding Probabilities
• There is only one favorable outcome• There are
ways the three positions can be filled
Larson/Farber 4th ed 93
17 3
17!
(17 3)!
17!17 16 15 4080
14!
P
1( 3 ) 0.0002
4080P selecting the members
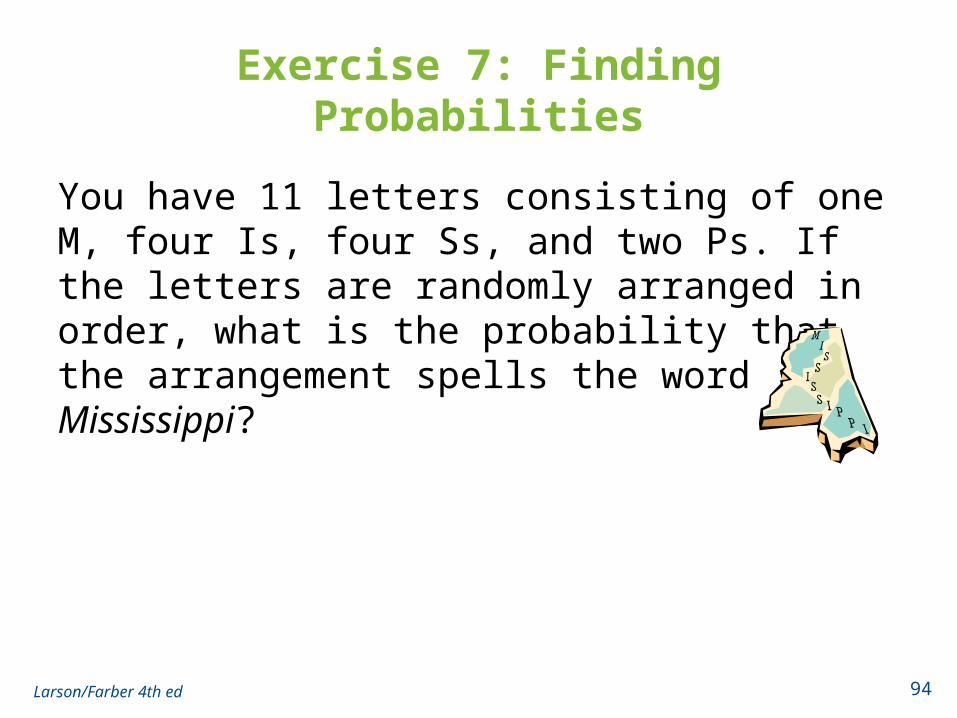
Exercise 7: Finding Probabilities
You have 11 letters consisting of one M, four Is, four Ss, and two Ps. If the letters are randomly arranged in order, what is the probability that the arrangement spells the word Mississippi?
Larson/Farber 4th ed 94
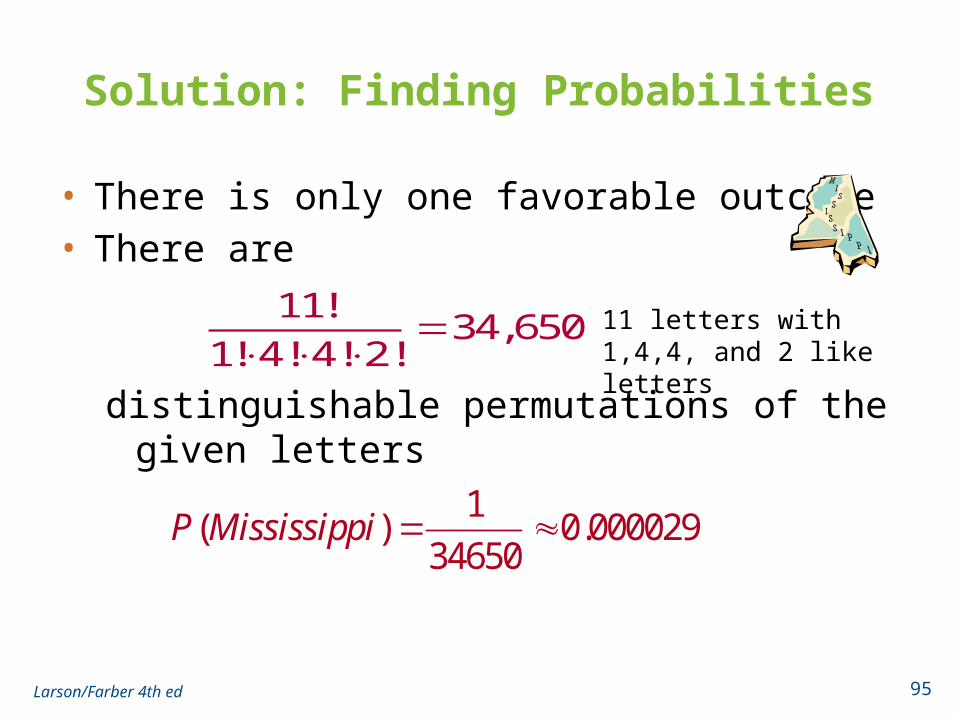
Solution: Finding Probabilities
• There is only one favorable outcome• There are
distinguishable permutations of the given letters
Larson/Farber 4th ed 95
11!34,650
1! 4! 4! 2!
1( ) 0.000029
34650P Mississippi
11 letters with 1,4,4, and 2 like letters
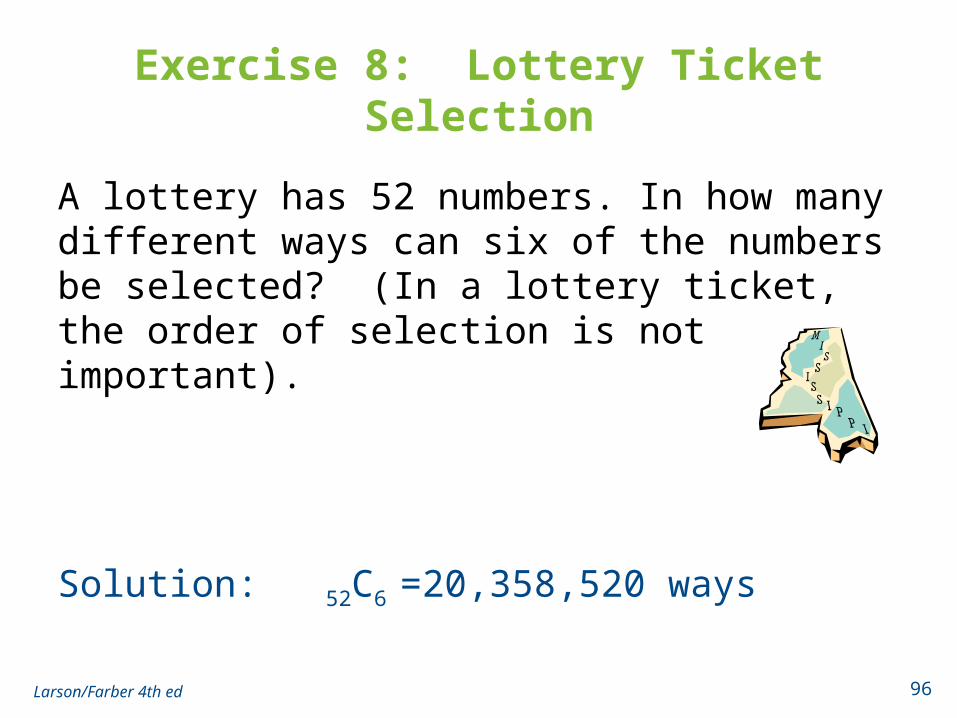
Exercise 8: Lottery Ticket Selection
A lottery has 52 numbers. In how many different ways can six of the numbers be selected? (In a lottery ticket, the order of selection is not important).
Solution: 52C6 =20,358,520 ways
Larson/Farber 4th ed 96
Exercise 9: Finding Probabilities
A food manufacturer is analyzing a sample of 400 corn kernels for the presence of a toxin. In this sample, three kernels have dangerously high levels of the toxin. If four kernels are randomly selected from the sample, what is the probability that exactly one kernel contains a dangerously high level of the toxin?
Larson/Farber 4th ed 97
Solution: Finding Probabilities
• The possible number of ways of choosing one toxic kernel out of three toxic kernels is
3C1 = 3
• The possible number of ways of choosing three nontoxic kernels from 397 nontoxic kernels is
397C3 = 10,349,790
• Using the Multiplication Rule, the number of ways of choosing one toxic kernel and three nontoxic kernels is
3C1 ∙ 397C3 = 3 ∙ 10,349,790 3 = 31,049,370
Larson/Farber 4th ed 98
Solution: Finding Probabilities
• The number of possible ways of choosing 4 kernels from 400 kernels is
400C4 = 1,050,739,900
• The probability of selecting exactly 1 toxic kernel is
Larson/Farber 4th ed 99
3 1 397 3
400 4
(1 )
31,049,3700.0296
1,050,739,900
C CP toxic kernel
C

Section 4.3 Summary
• Determined the number of ways a group of objects can be arranged in order
• Determined the number of ways to choose several objects from a group without regard to order
• Used the counting principles to find probabilities
Larson/Farber 4th ed 100