Chapter 1 Introduction to Statistics 1 Larson/Farber 4th ed.
Ch1 Larson/Farber 1
1
Elementary Statistics Larson Farber
Introduction to Statistics As you view these slides be sure to have paper, pencil, a calculator and your text handy. Click to advance to
the slide show.
An Overview of Statistics
Section 1.1
After you see the slides for each section, do the Try It Yourself problems in your text for that section to see if you understood the material. Then, do the assigned problems for that section.
What is Statistics?
Statistics is the science of collecting, organizing,
analyzing, and interpreting data in order to make decisions.
Ch1 Larson/Farber 4
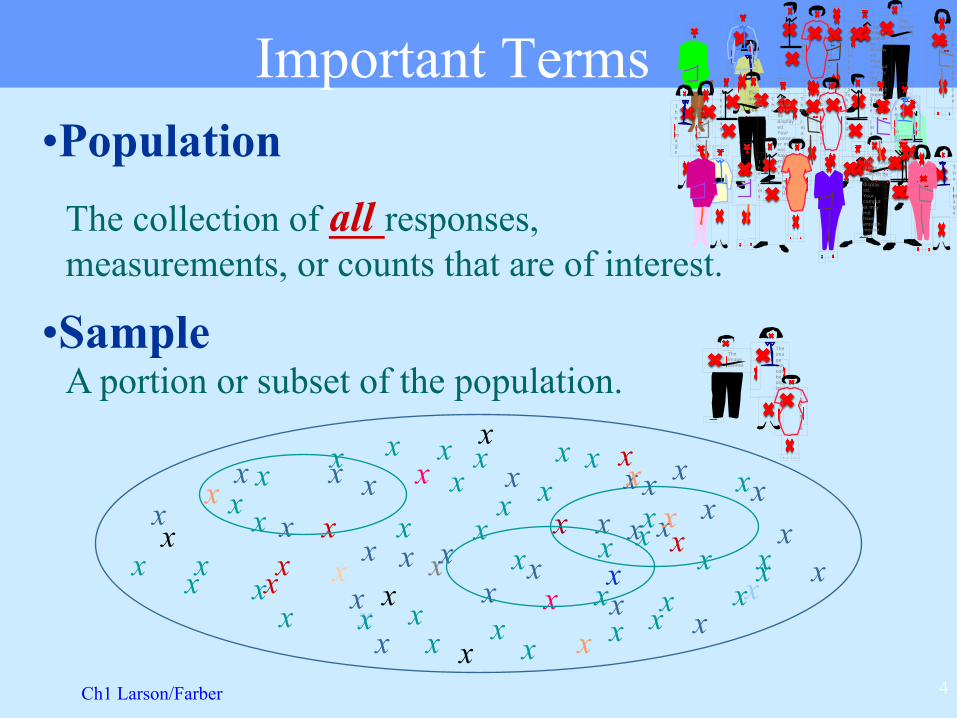
Important Terms • Population
The collection of all responses, measurements, or counts that are of interest.
• Sample A portion or subset of the population.
The image cannot
The image cannot be displaye
The imag
x x x
x
x
x
x x
x x
x
x x
x x
x x
x x x
x
x x
x
x x
x x
x x x
x x x
x
x
x x x
x
x x
x x
x x
x
x x
x
x
x
x x
x
x
x x
x x
x x
x x x x x
x x x
x x x
x
x x
x x
x
x
x
x x
x
The image cannot be
The imag
The imag
The image
The image
The image can
The image cannot be
The ima
The
The image cannot be displayed. Your computer may not have enough memory to
The imag
The image can
The image
The imag
The ima
The image
The image can
The image cannot be
The ima
The
The image cannot be displayed. Your computer may not have enough memory to
The imag
The image can
The
The image cannot be displayed. Your computer may not have enough memory to
The imag
The ima
Ch1 Larson/Farber 5
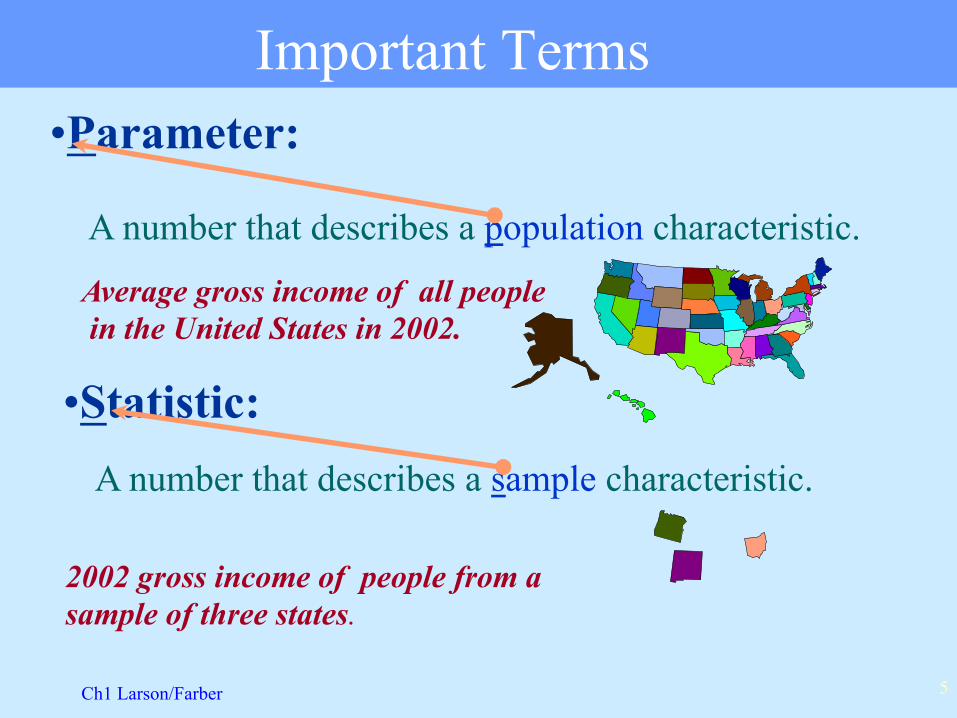
Important Terms • Parameter:
A number that describes a population characteristic.
• Statistic: A number that describes a sample characteristic.
Average gross income of all people in the United States in 2002.
2002 gross income of people from a sample of three states.
Ch1 Larson/Farber 6
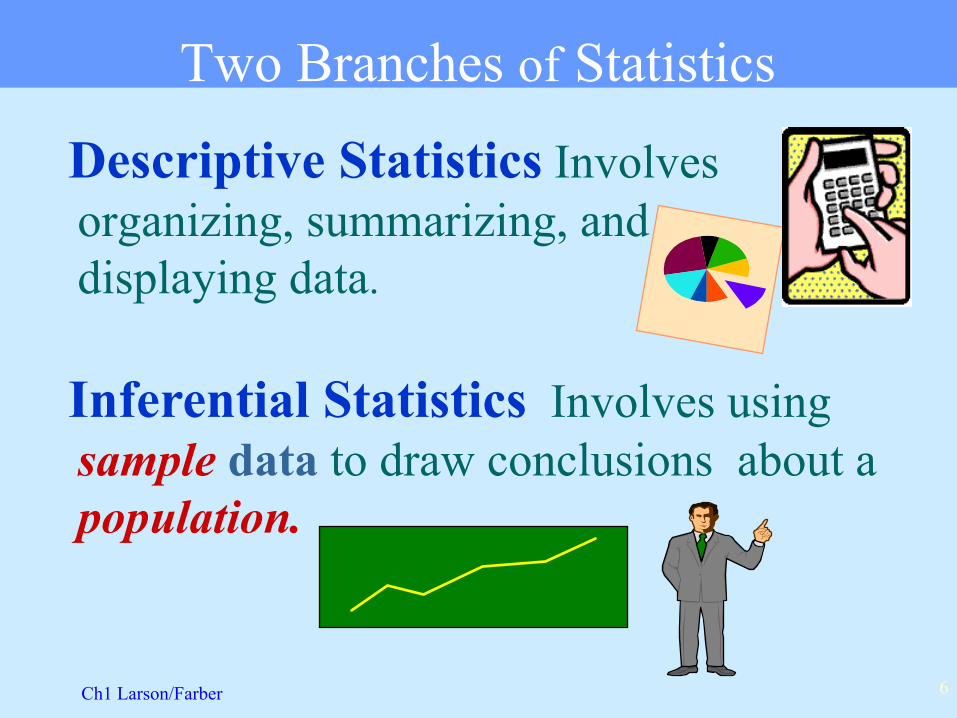
Inferential Statistics Involves using sample data to draw conclusions about a population.
Two Branches of Statistics
Descriptive Statistics Involves organizing, summarizing, and displaying data.
Data Classification
Section 1.2
Ch1 Larson/Farber 8
Levels of Measurement
1. Nominal
2. Ordinal
3. Interval
4. Ratio
A data set can be classified according to the highest level of measurement that applies. The four levels of measurement, listed from lowest to highest are:
Ch1 Larson/Farber 9
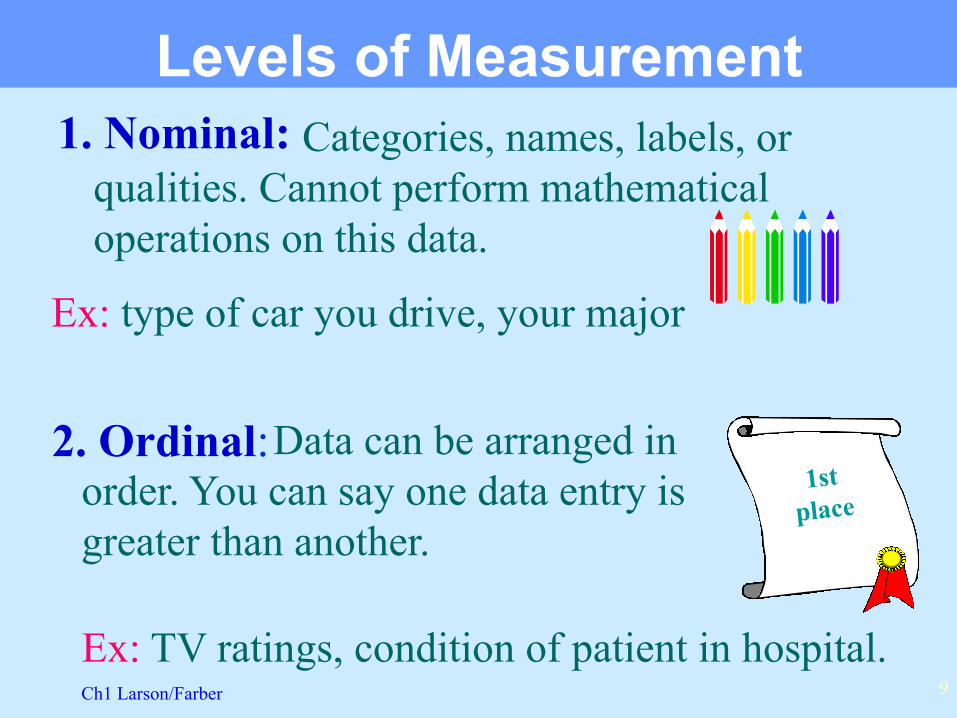
Levels of Measurement Categories, names, labels, or
qualities. Cannot perform mathematical operations on this data.
Data can be arranged in order. You can say one data entry is greater than another.
1. Nominal:
Ex: type of car you drive, your major
2. Ordinal:
Ex: TV ratings, condition of patient in hospital.
1st place
Ch1 Larson/Farber 10
Levels of Measurement
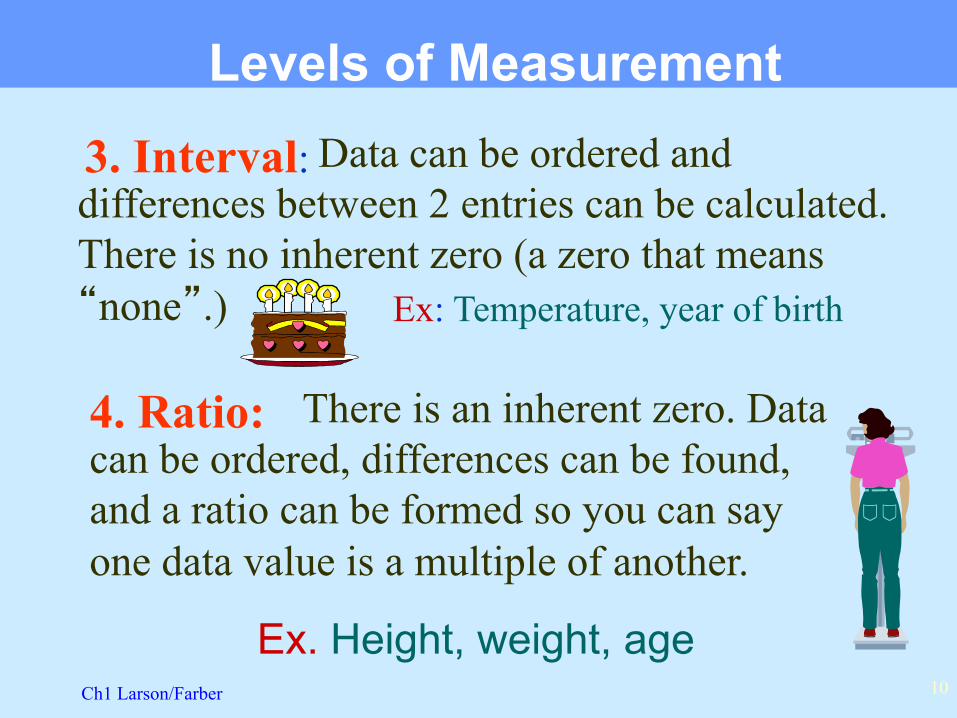
There is an inherent zero. Data can be ordered, differences can be found, and a ratio can be formed so you can say one data value is a multiple of another.
3. Interval:
4. Ratio:
Ex. Height, weight, age
Data can be ordered and differences between 2 entries can be calculated. There is no inherent zero (a zero that means “none”.) Ex: Temperature, year of birth

Experimental Design
Section 1.3
x x x x x
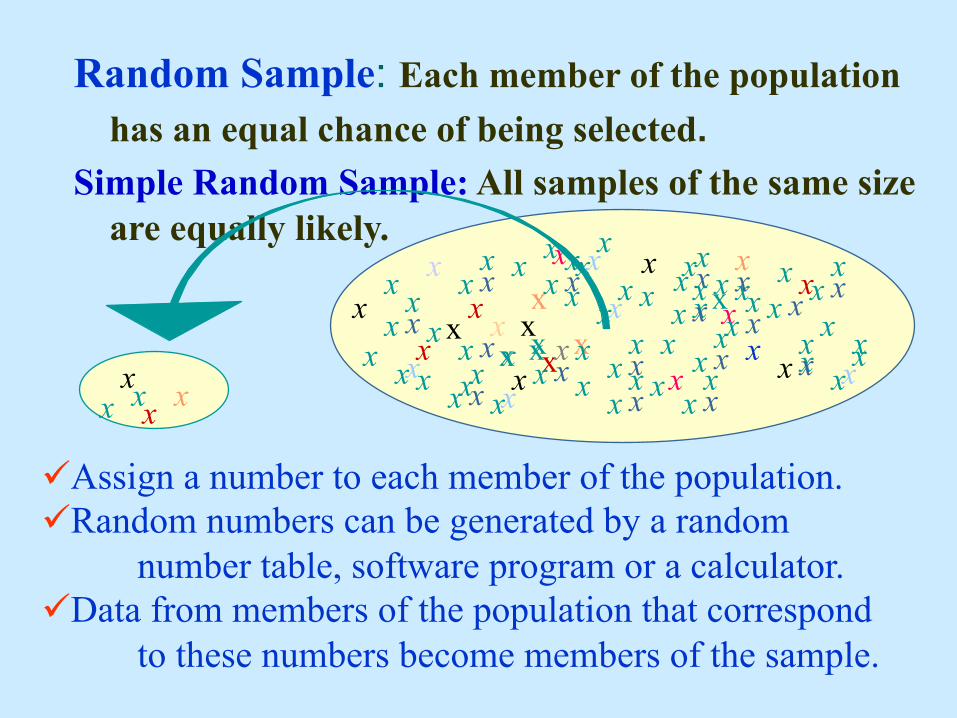
Random Sample: Each member of the population has an equal chance of being selected.
Simple Random Sample: All samples of the same size are equally likely.
x x
x x
x
x x
x x
x
x x
x x x
x x
x
x x x x x
x x
x
x x x
x x x
x
x x
x x x
x x
x
x x x x x
x x
x
x x
x x
x x
x
x x
x x x
x x
x
x x x x x
x x
x x x
x x x
x
x x
x x x
x x
x
x x x x x
x x
x x
x x x x x
x x x
x
ü Assign a number to each member of the population. ü Random numbers can be generated by a random
number table, software program or a calculator. ü Data from members of the population that correspond
to these numbers become members of the sample.
Ch1 Larson/Farber 13
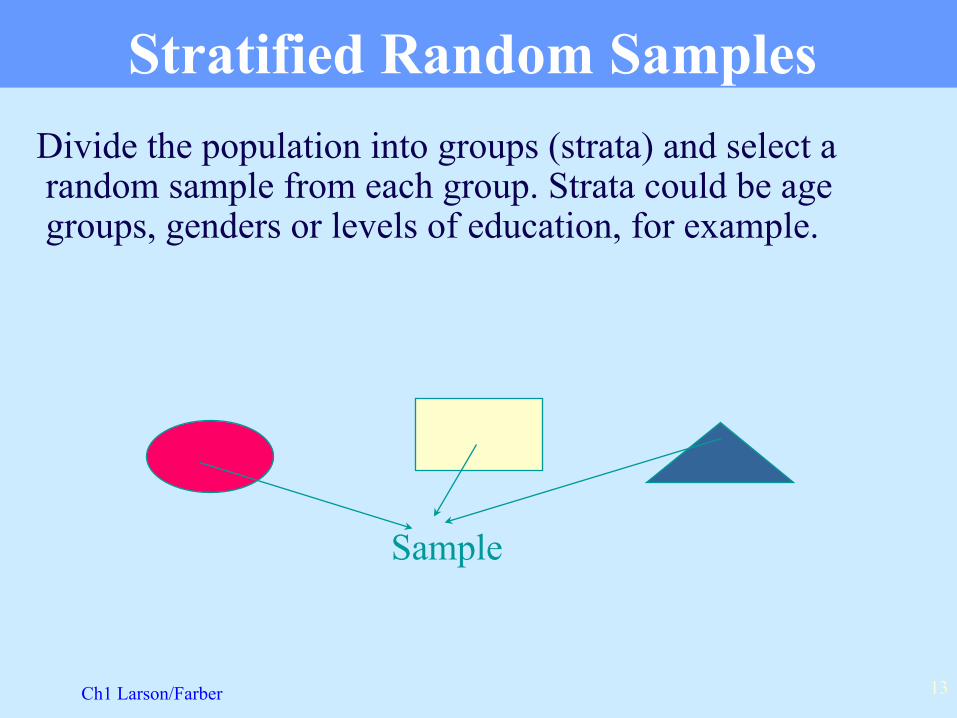
Stratified Random Samples Divide the population into groups (strata) and select a
random sample from each group. Strata could be age groups, genders or levels of education, for example.
Sample
Ch1 Larson/Farber 14
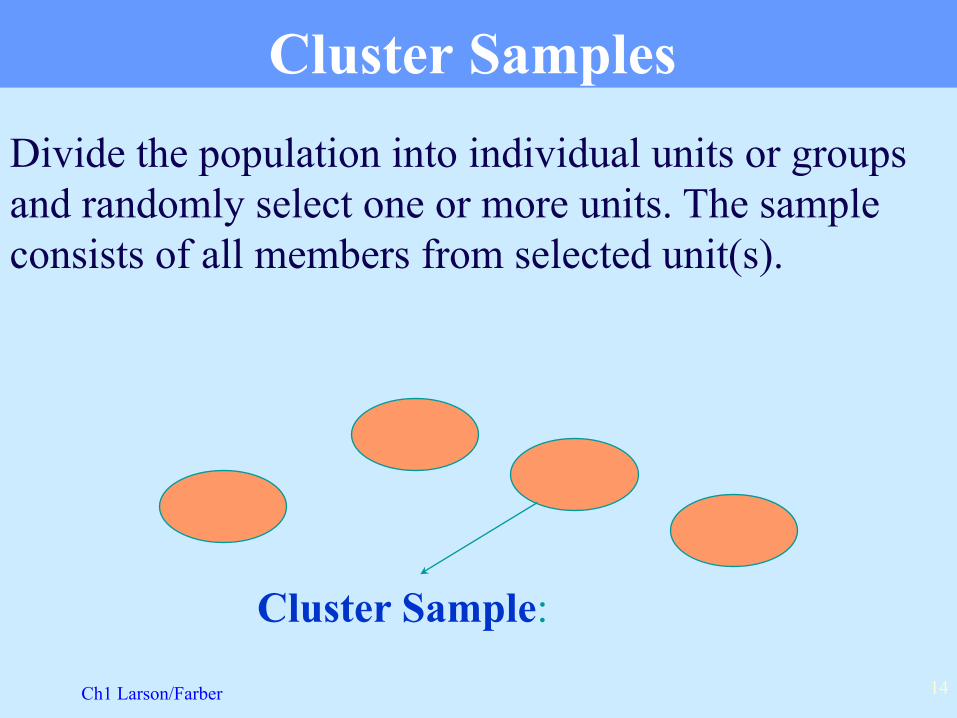
Cluster Samples Divide the population into individual units or groups and randomly select one or more units. The sample consists of all members from selected unit(s).
Cluster Sample:
Ch1 Larson/Farber 15
Systematic Samples
x x x x x x x x x x x x x x x x x x x x x x x x x x x x x x x x x x x x x x x x x x x x x x x x x x x x x x x x x x x x x x x x x x x x x x x x x x x x x x x x x x x x x x x x x x x x x x x x x x x x x x x x x
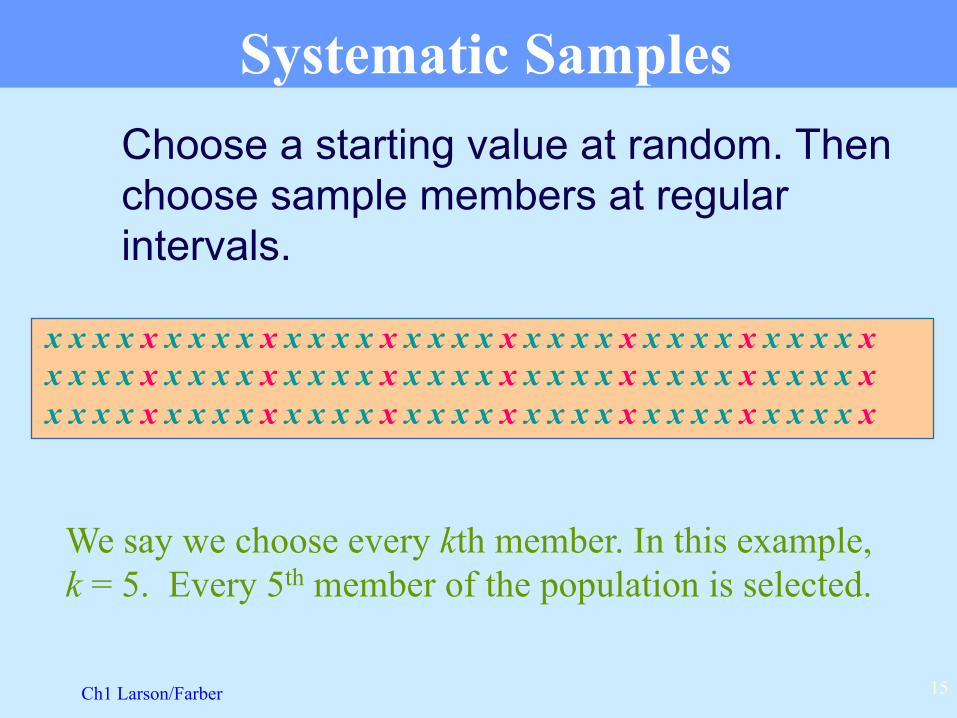
Choose a starting value at random. Then choose sample members at regular intervals.
We say we choose every kth member. In this example, k = 5. Every 5th member of the population is selected.
Ch1 Larson/Farber 16
Other Samples
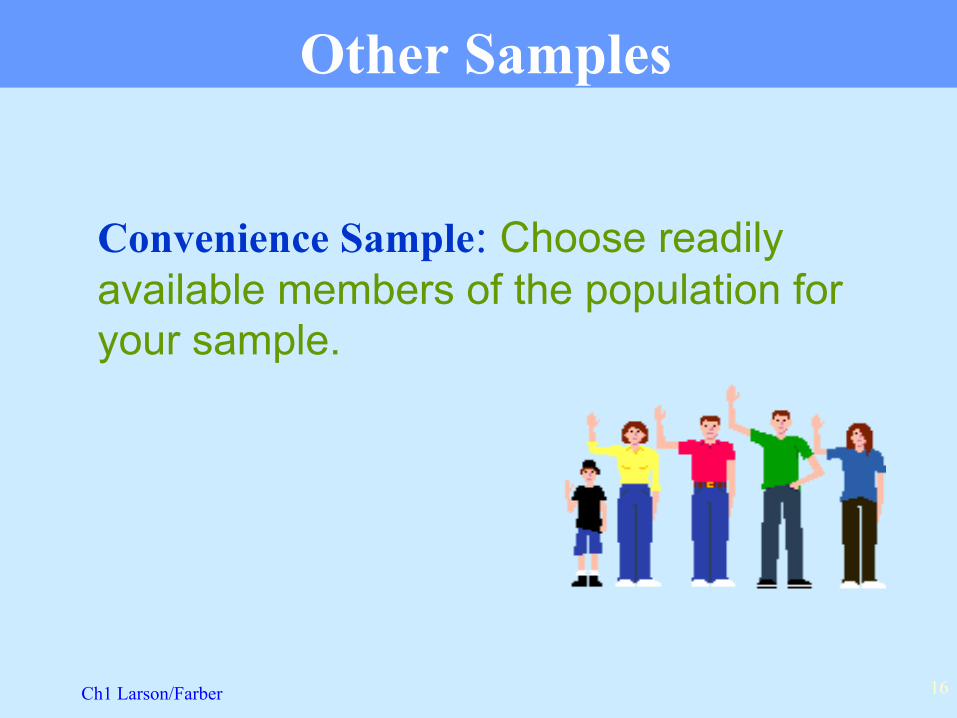
Convenience Sample: Choose readily available members of the population for your sample.
Ch1 Larson/Farber 17
Data Collection
A count or measure of part of the population.
• Experiment: Apply a treatment to a part of the group.
• Simulation: Use a mathematical model (often with a computer) to reproduce condition.
• Census: A count or measure of the entire population
• Sampling: