Section 4 Water Resources - Yucaipa Valley Water...
8
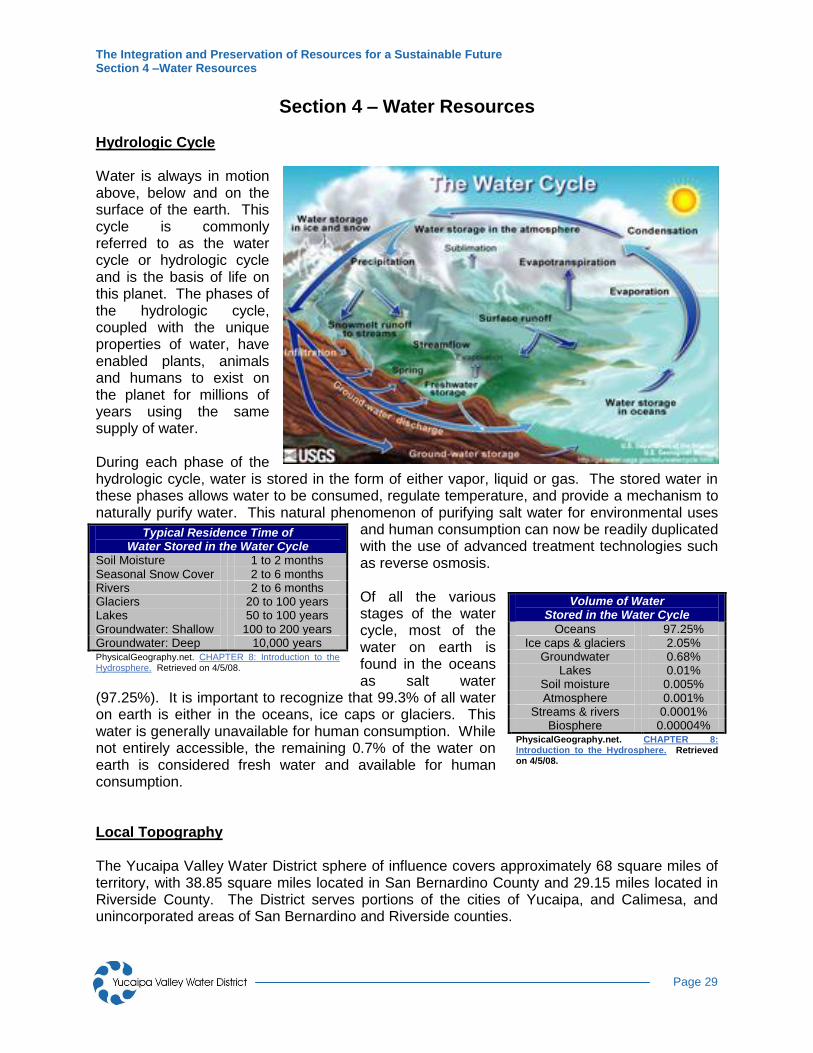
The Integration and Preservation of Resources for a Sustainable Future Section 4 –Water Resources Page 29 Section 4 – Water Resources Hydrologic Cycle Water is always in motion above, below and on the surface of the earth. This cycle is commonly referred to as the water cycle or hydrologic cycle and is the basis of life on this planet. The phases of the hydrologic cycle, coupled with the unique properties of water, have enabled plants, animals and humans to exist on the planet for millions of years using the same supply of water. During each phase of the hydrologic cycle, water is stored in the form of either vapor, liquid or gas. The stored water in these phases allows water to be consumed, regulate temperature, and provide a mechanism to naturally purify water. This natural phenomenon of purifying salt water for environmental uses and human consumption can now be readily duplicated with the use of advanced treatment technologies such as reverse osmosis. Of all the various stages of the water cycle, most of the water on earth is found in the oceans as salt water (97.25%). It is important to recognize that 99.3% of all water on earth is either in the oceans, ice caps or glaciers. This water is generally unavailable for human consumption. While not entirely accessible, the remaining 0.7% of the water on earth is considered fresh water and available for human consumption. Local Topography The Yucaipa Valley Water District sphere of influence covers approximately 68 square miles of territory, with 38.85 square miles located in San Bernardino County and 29.15 miles located in Riverside County. The District serves portions of the cities of Yucaipa, and Calimesa, and unincorporated areas of San Bernardino and Riverside counties. Typical Residence Time of Water Stored in the Water Cycle Soil Moisture 1 to 2 months Seasonal Snow Cover 2 to 6 months Rivers 2 to 6 months Glaciers 20 to 100 years Lakes 50 to 100 years Groundwater: Shallow 100 to 200 years Groundwater: Deep 10,000 years PhysicalGeography.net. CHAPTER 8: Introduction to the Hydrosphere. Retrieved on 4/5/08. Volume of Water Stored in the Water Cycle Oceans 97.25% Ice caps & glaciers 2.05% Groundwater 0.68% Lakes 0.01% Soil moisture 0.005% Atmosphere 0.001% Streams & rivers 0.0001% Biosphere 0.00004% PhysicalGeography.net. CHAPTER 8: Introduction to the Hydrosphere. Retrieved on 4/5/08.
Transcript of Section 4 Water Resources - Yucaipa Valley Water...
The Integration and Preservation of Resources for a Sustainable Future Section 4 –Water Resources
Page 29
Section 4 – Water Resources Hydrologic Cycle Water is always in motion above, below and on the surface of the earth. This cycle is commonly referred to as the water cycle or hydrologic cycle and is the basis of life on this planet. The phases of the hydrologic cycle, coupled with the unique properties of water, have enabled plants, animals and humans to exist on the planet for millions of years using the same supply of water. During each phase of the hydrologic cycle, water is stored in the form of either vapor, liquid or gas. The stored water in these phases allows water to be consumed, regulate temperature, and provide a mechanism to naturally purify water. This natural phenomenon of purifying salt water for environmental uses
and human consumption can now be readily duplicated with the use of advanced treatment technologies such as reverse osmosis. Of all the various stages of the water cycle, most of the water on earth is found in the oceans as salt water
(97.25%). It is important to recognize that 99.3% of all water on earth is either in the oceans, ice caps or glaciers. This water is generally unavailable for human consumption. While not entirely accessible, the remaining 0.7% of the water on earth is considered fresh water and available for human consumption. Local Topography The Yucaipa Valley Water District sphere of influence covers approximately 68 square miles of territory, with 38.85 square miles located in San Bernardino County and 29.15 miles located in Riverside County. The District serves portions of the cities of Yucaipa, and Calimesa, and unincorporated areas of San Bernardino and Riverside counties.
Typical Residence Time of Water Stored in the Water Cycle
Soil Moisture 1 to 2 months Seasonal Snow Cover 2 to 6 months Rivers 2 to 6 months Glaciers 20 to 100 years Lakes 50 to 100 years Groundwater: Shallow 100 to 200 years Groundwater: Deep 10,000 years PhysicalGeography.net. CHAPTER 8: Introduction to the Hydrosphere. Retrieved on 4/5/08.
Volume of Water Stored in the Water Cycle
Oceans 97.25% Ice caps & glaciers 2.05%
Groundwater 0.68% Lakes 0.01%
Soil moisture 0.005% Atmosphere 0.001%
Streams & rivers 0.0001% Biosphere 0.00004%
PhysicalGeography.net. CHAPTER 8: Introduction to the Hydrosphere. Retrieved on 4/5/08.
The Integration and Preservation of Resources for a Sustainable Future Section 4 –Water Resources
Page 30
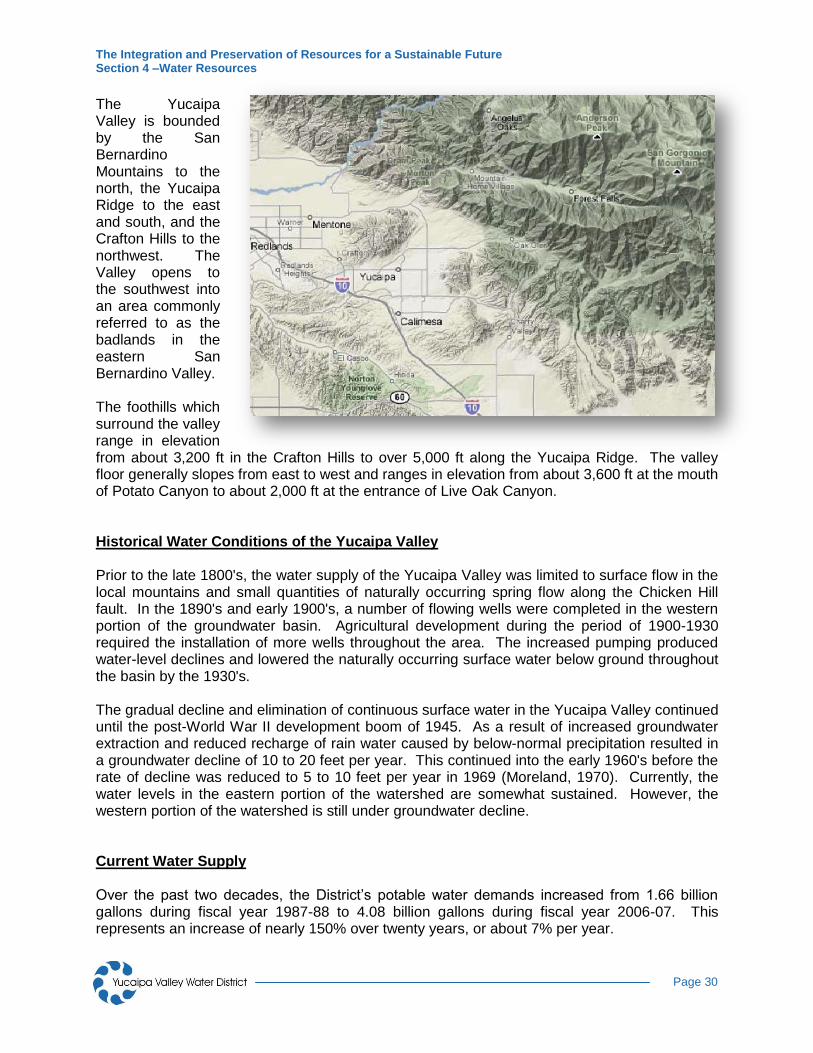
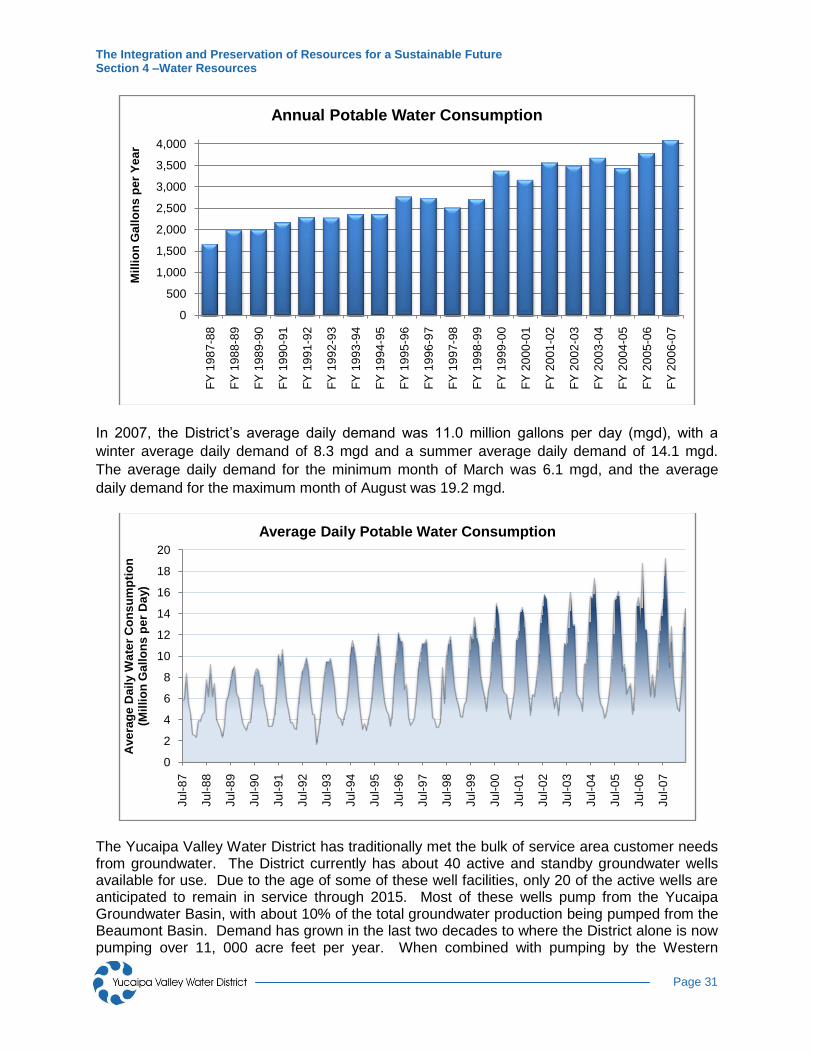
The Yucaipa Valley is bounded by the San Bernardino Mountains to the north, the Yucaipa Ridge to the east and south, and the Crafton Hills to the northwest. The Valley opens to the southwest into an area commonly referred to as the badlands in the eastern San Bernardino Valley. The foothills which surround the valley range in elevation from about 3,200 ft in the Crafton Hills to over 5,000 ft along the Yucaipa Ridge. The valley floor generally slopes from east to west and ranges in elevation from about 3,600 ft at the mouth of Potato Canyon to about 2,000 ft at the entrance of Live Oak Canyon. Historical Water Conditions of the Yucaipa Valley Prior to the late 1800's, the water supply of the Yucaipa Valley was limited to surface flow in the local mountains and small quantities of naturally occurring spring flow along the Chicken Hill fault. In the 1890's and early 1900's, a number of flowing wells were completed in the western portion of the groundwater basin. Agricultural development during the period of 1900-1930 required the installation of more wells throughout the area. The increased pumping produced water-level declines and lowered the naturally occurring surface water below ground throughout the basin by the 1930's. The gradual decline and elimination of continuous surface water in the Yucaipa Valley continued until the post-World War II development boom of 1945. As a result of increased groundwater extraction and reduced recharge of rain water caused by below-normal precipitation resulted in a groundwater decline of 10 to 20 feet per year. This continued into the early 1960's before the rate of decline was reduced to 5 to 10 feet per year in 1969 (Moreland, 1970). Currently, the water levels in the eastern portion of the watershed are somewhat sustained. However, the western portion of the watershed is still under groundwater decline. Current Water Supply Over the past two decades, the District’s potable water demands increased from 1.66 billion gallons during fiscal year 1987-88 to 4.08 billion gallons during fiscal year 2006-07. This represents an increase of nearly 150% over twenty years, or about 7% per year.
The Integration and Preservation of Resources for a Sustainable Future Section 4 –Water Resources
Page 31
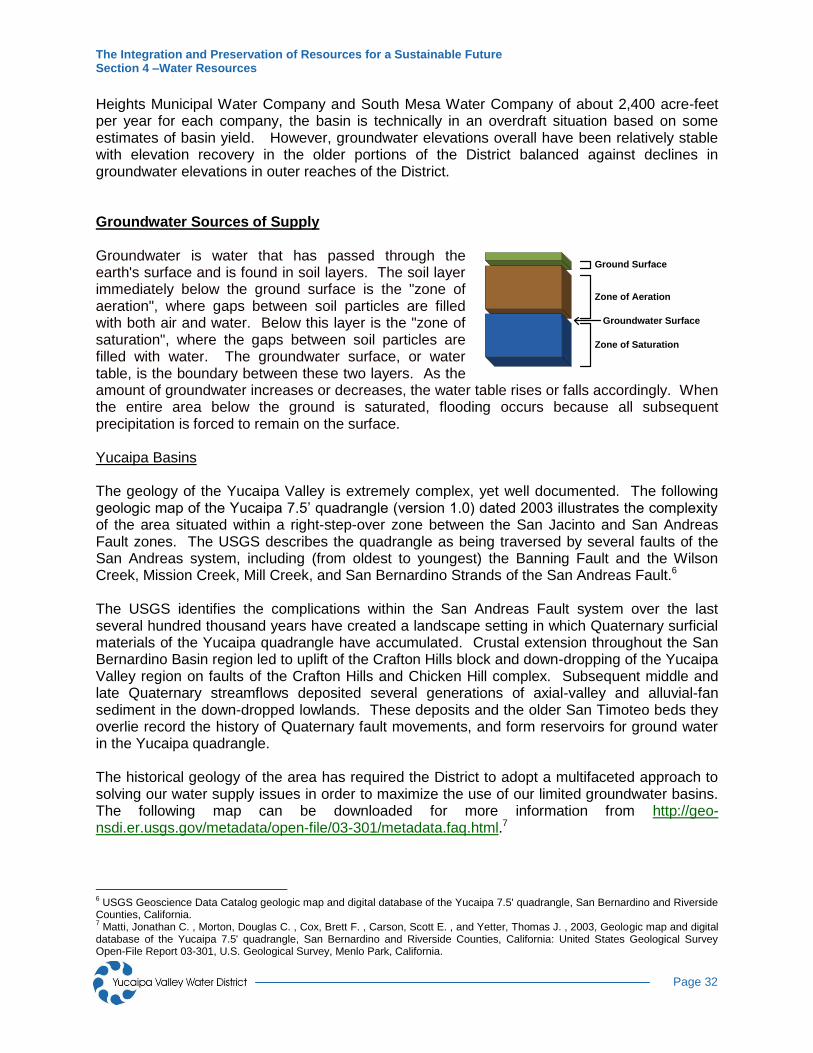
In 2007, the District’s average daily demand was 11.0 million gallons per day (mgd), with a
winter average daily demand of 8.3 mgd and a summer average daily demand of 14.1 mgd.
The average daily demand for the minimum month of March was 6.1 mgd, and the average
daily demand for the maximum month of August was 19.2 mgd.
The Yucaipa Valley Water District has traditionally met the bulk of service area customer needs from groundwater. The District currently has about 40 active and standby groundwater wells available for use. Due to the age of some of these well facilities, only 20 of the active wells are anticipated to remain in service through 2015. Most of these wells pump from the Yucaipa Groundwater Basin, with about 10% of the total groundwater production being pumped from the Beaumont Basin. Demand has grown in the last two decades to where the District alone is now pumping over 11, 000 acre feet per year. When combined with pumping by the Western
0
500
1,000
1,500
2,000
2,500
3,000
3,500
4,000
FY
19
87
-88
FY
19
88
-89
FY
19
89
-90
FY
19
90
-91
FY
19
91
-92
FY
19
92
-93
FY
19
93
-94
FY
19
94
-95
FY
19
95
-96
FY
19
96
-97
FY
19
97
-98
FY
19
98
-99
FY
19
99
-00
FY
20
00
-01
FY
20
01
-02
FY
20
02
-03
FY
20
03
-04
FY
20
04
-05
FY
20
05
-06
FY
20
06
-07
Mil
lio
n G
all
on
s p
er
Ye
ar
Annual Potable Water Consumption
0
2
4
6
8
10
12
14
16
18
20
Ju
l-8
7
Ju
l-8
8
Ju
l-8
9
Ju
l-9
0
Ju
l-9
1
Ju
l-9
2
Ju
l-9
3
Ju
l-9
4
Ju
l-9
5
Ju
l-9
6
Ju
l-9
7
Ju
l-9
8
Ju
l-9
9
Ju
l-0
0
Ju
l-0
1
Ju
l-0
2
Ju
l-0
3
Ju
l-0
4
Ju
l-0
5
Ju
l-0
6
Ju
l-0
7
Ave
rag
e D
ail
y W
ate
r C
on
su
mp
tio
n(M
illi
on
Ga
llo
ns
pe
r D
ay)
Average Daily Potable Water Consumption
The Integration and Preservation of Resources for a Sustainable Future Section 4 –Water Resources
Page 32
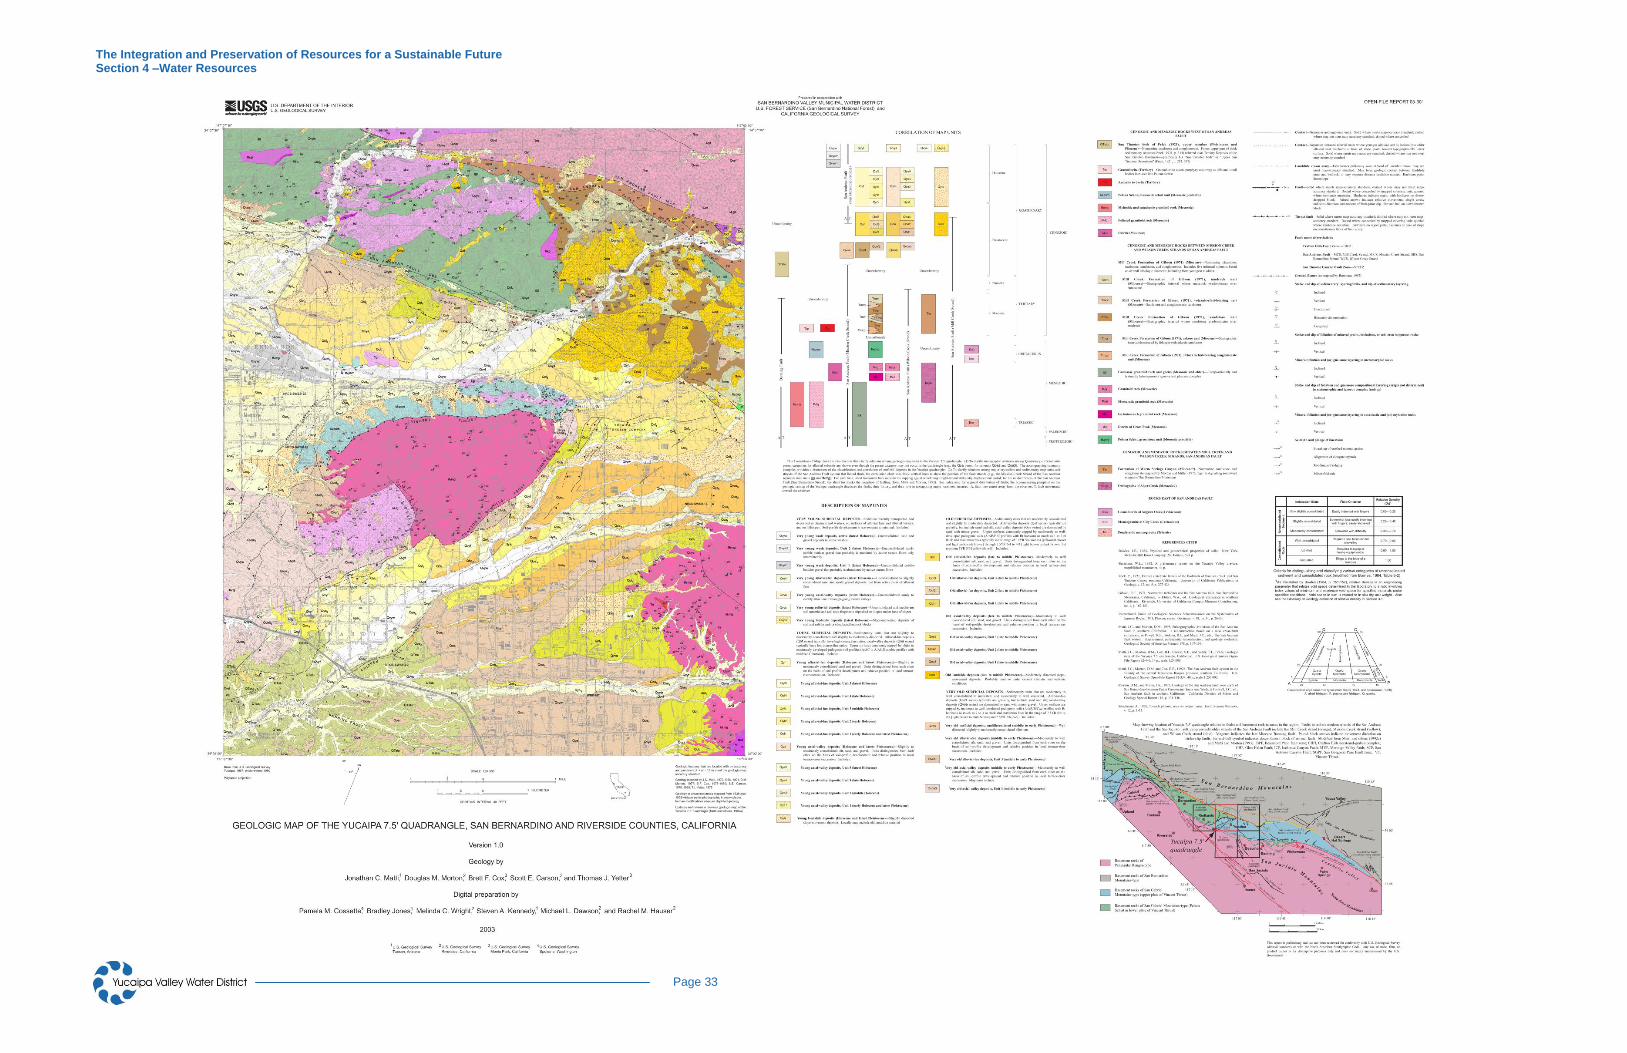
Heights Municipal Water Company and South Mesa Water Company of about 2,400 acre-feet per year for each company, the basin is technically in an overdraft situation based on some estimates of basin yield. However, groundwater elevations overall have been relatively stable with elevation recovery in the older portions of the District balanced against declines in groundwater elevations in outer reaches of the District. Groundwater Sources of Supply Groundwater is water that has passed through the earth's surface and is found in soil layers. The soil layer immediately below the ground surface is the "zone of aeration", where gaps between soil particles are filled with both air and water. Below this layer is the "zone of saturation", where the gaps between soil particles are filled with water. The groundwater surface, or water table, is the boundary between these two layers. As the amount of groundwater increases or decreases, the water table rises or falls accordingly. When the entire area below the ground is saturated, flooding occurs because all subsequent precipitation is forced to remain on the surface. Yucaipa Basins The geology of the Yucaipa Valley is extremely complex, yet well documented. The following geologic map of the Yucaipa 7.5’ quadrangle (version 1.0) dated 2003 illustrates the complexity of the area situated within a right-step-over zone between the San Jacinto and San Andreas Fault zones. The USGS describes the quadrangle as being traversed by several faults of the San Andreas system, including (from oldest to youngest) the Banning Fault and the Wilson Creek, Mission Creek, Mill Creek, and San Bernardino Strands of the San Andreas Fault.6 The USGS identifies the complications within the San Andreas Fault system over the last several hundred thousand years have created a landscape setting in which Quaternary surficial materials of the Yucaipa quadrangle have accumulated. Crustal extension throughout the San Bernardino Basin region led to uplift of the Crafton Hills block and down-dropping of the Yucaipa Valley region on faults of the Crafton Hills and Chicken Hill complex. Subsequent middle and late Quaternary streamflows deposited several generations of axial-valley and alluvial-fan sediment in the down-dropped lowlands. These deposits and the older San Timoteo beds they overlie record the history of Quaternary fault movements, and form reservoirs for ground water in the Yucaipa quadrangle. The historical geology of the area has required the District to adopt a multifaceted approach to solving our water supply issues in order to maximize the use of our limited groundwater basins. The following map can be downloaded for more information from http://geo-nsdi.er.usgs.gov/metadata/open-file/03-301/metadata.faq.html.7
6 USGS Geoscience Data Catalog geologic map and digital database of the Yucaipa 7.5' quadrangle, San Bernardino and Riverside
Counties, California. 7 Matti, Jonathan C. , Morton, Douglas C. , Cox, Brett F. , Carson, Scott E. , and Yetter, Thomas J. , 2003, Geologic map and digital
database of the Yucaipa 7.5' quadrangle, San Bernardino and Riverside Counties, California: United States Geological Survey Open-File Report 03-301, U.S. Geological Survey, Menlo Park, California.
Ground Surface
Zone of Aeration
Zone of Saturation
Groundwater Surface
The Integration and Preservation of Resources for a Sustainable Future Section 4 –Water Resources
Page 33
The Integration and Preservation of Resources for a Sustainable Future Section 4 –Water Resources
Page 34
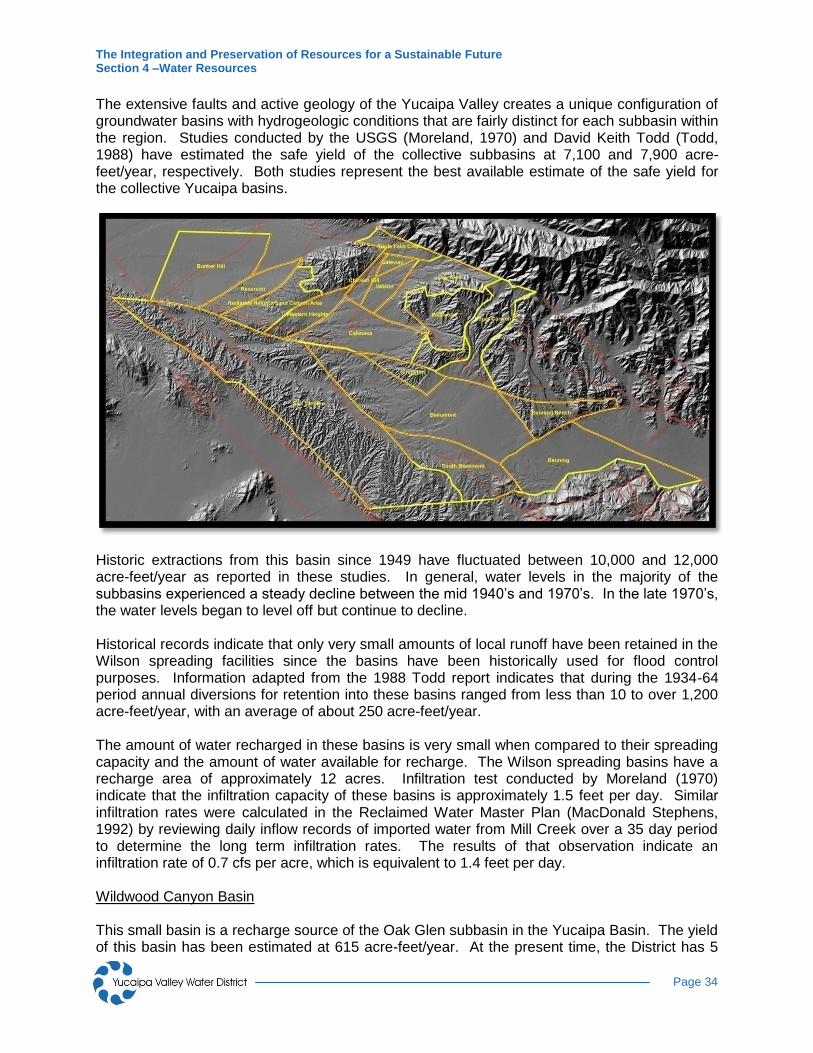
The extensive faults and active geology of the Yucaipa Valley creates a unique configuration of groundwater basins with hydrogeologic conditions that are fairly distinct for each subbasin within the region. Studies conducted by the USGS (Moreland, 1970) and David Keith Todd (Todd, 1988) have estimated the safe yield of the collective subbasins at 7,100 and 7,900 acre-feet/year, respectively. Both studies represent the best available estimate of the safe yield for the collective Yucaipa basins.
Historic extractions from this basin since 1949 have fluctuated between 10,000 and 12,000 acre-feet/year as reported in these studies. In general, water levels in the majority of the subbasins experienced a steady decline between the mid 1940’s and 1970’s. In the late 1970’s, the water levels began to level off but continue to decline. Historical records indicate that only very small amounts of local runoff have been retained in the Wilson spreading facilities since the basins have been historically used for flood control purposes. Information adapted from the 1988 Todd report indicates that during the 1934-64 period annual diversions for retention into these basins ranged from less than 10 to over 1,200 acre-feet/year, with an average of about 250 acre-feet/year. The amount of water recharged in these basins is very small when compared to their spreading capacity and the amount of water available for recharge. The Wilson spreading basins have a recharge area of approximately 12 acres. Infiltration test conducted by Moreland (1970) indicate that the infiltration capacity of these basins is approximately 1.5 feet per day. Similar infiltration rates were calculated in the Reclaimed Water Master Plan (MacDonald Stephens, 1992) by reviewing daily inflow records of imported water from Mill Creek over a 35 day period to determine the long term infiltration rates. The results of that observation indicate an infiltration rate of 0.7 cfs per acre, which is equivalent to 1.4 feet per day. Wildwood Canyon Basin This small basin is a recharge source of the Oak Glen subbasin in the Yucaipa Basin. The yield of this basin has been estimated at 615 acre-feet/year. At the present time, the District has 5
The Integration and Preservation of Resources for a Sustainable Future Section 4 –Water Resources
Page 35
wells in this basin producing approximately 180 acre-feet/year. Currently, the District does not have any plans to continue developing this basin because of the poor performance of the existing wells in the area. In 1992, the District acquired a mutual water company which serves the upper portions of Wildwood Canyon. This system is composed of 11 wells with a minimum combined summer production of about 300 gpm. Production from this area is only enough to supply the current localized demand and does not represent a significant source of supply to the system. The majority of the wells in this area have erratic production since they extract from a layer in the aquifer composed mostly of fractured rock. Surface Water Sources of Supply The District currently collects surface water from several sources in the Oak Glen area. The sources include surface flows from the Oak Glen, Birch, and Back Canyon creeks and their tributaries, and subsurface flows collected in the Adams, Clark, Edward’s, and Worthington tunnels. The flows from these sources are highly seasonal and depend on the amount of rainfall and snow melt in the area. Oak Glen and Birch creeks provide the majority of the surface flows, however their production has decreased significantly; production from these sources has declined from about 1,000 ac-ft/yr. in the early 1980’s to today’s levels of 200 to 300 ac-ft/yr.(CDM Master Plan, 1994). Surface water collected from Ford Creek, Birch Creek, Back Creek and several tunnels is treated at the Oak Glen Surface Water Filtration Facility and delivered to the Pressure Zones 18, 17 and 16. Subsurface flows include collections from the Worthington and Adams tunnel. The Adams Tunnel has partially collapsed, but its water is now pumped by a shallow well set into the tunnel. Similar to the surface flows, production from these sources has declined over the last decade, but not at the same rate as the surface flows. In the early 1980’s, production from the Adams Tunnel was in the 400 to 450 acre-feet/year range while the Worthington Tunnel produced approximately 75 acre-feet/year. Current production volumes for these two sources are in the 200 to 300 acre-feet/year for the Adams Tunnel and below 5 acre-feet/year for the Worthington facility. Recycled Water Recycled water represents a key source of the District’s non-potable water supply. The Henry N. Wochholz Regional Water Recycling Facility produces advanced tertiary treated recycled water at a current rated capacity of 6.7 mgd, but it is anticipated that the capacity will be re-rated to 8.0 mgd based on a re-evaluation of the tertiary treatment microfiltration membranes and disinfection facilities. The majority of the recycled water produced from this facility is now discharged to San Timoteo Creek under the current Regional Board Order No. R8-2007-0012 (NPDES CA01056190) which allows the discharge of up to 6.7 million gallons per day (mgd) or tertiary recycled water to the creek. The current discharge to the creek averages approximately 3 mgd. Recently completed environmental studies indicate that a future discharge of 1.6 mgd will be sufficient to maintain the habitat that has become established in the creek as a result of the historical creek discharge. This 1.6 mgd flow can be provided through a combination of
The Integration and Preservation of Resources for a Sustainable Future Section 4 –Water Resources
Page 36
recycled water, untreated imported water, or local groundwater. Consistent with the RWQCB Basin Plan and Maximum Benefit obligations, the District proposes to decrease future recycled water discharges to the creek, making more recycled water available for non-potable use. Additional non-potable water supplies include backwash from the Yucaipa Valley Regional Water Filtration Plant and untreated imported water from the State Water Project (SWP). Water Use Efficiency (Conservation) Water conservation, or water use efficiency, is an important aspect of water resource management. There are several case studies of water being used more efficiently in urbanized areas. For example, from 1975 to 2005 the population of Los Angeles grew 33 percent in thirty years without an increase in total water use.8 By comparison, in June 2007, Los Angeles Mayor Antonio Villaraigosa called for voluntary 10% reduction in water consumption to help minimize water demand during a record dry year. Despite the public relations effort to encourage water conservation, the Los Angeles Times reported that water use remained fairly constant compared to the same period in the prior year. In fact, the article explained that according to data from the Department of Water and Power, city consumers used almost 1% more water from June through October than they did during the same period in the prior year.9 From a water management perspective, there appears to be a difference between the long-term water use efficiency and short-term efficiency. Arguably, the long-term water conservation may have been realized with more active conservation practices like low-flow toilets, improved irrigation systems, and education programs. While the short-term voluntary request for conservation was more passive in nature by asking customers to alter their behavior. Asking customers to reduce the number of times they water their lawn and wash their cars may show signs of an immediate reduction in water demands when news articles are printed, but this behavioral change is often not permanent
8 Lois Wolk and Jared Huffman (2007). “California’s water future – 21
st century solutions”, San Francisco Chronicle (March 23).
9 Deborah Schooch, (2007). “L.A.’s water savings are just a drop in the bucket”, Los Angeles Times (December 10).