Section 13.4-1 Copyright © 2014, 2012, 2010 Pearson Education, Inc. Lecture Slides Elementary...
15
Section 13.4-1 Copyright © 2014, 2012, 2010 Pearson Education, Inc. Lecture Slides Elementary Statistics Twelfth Edition and the Triola Statistics Series by Mario F. Triola
-
Upload
harvey-ward -
Category
Documents
-
view
219 -
download
6
Transcript of Section 13.4-1 Copyright © 2014, 2012, 2010 Pearson Education, Inc. Lecture Slides Elementary...

Section 13.4-1Copyright © 2014, 2012, 2010 Pearson Education, Inc.
Lecture Slides
Elementary Statistics Twelfth Edition
and the Triola Statistics Series
by Mario F. Triola

Section 13.4-2Copyright © 2014, 2012, 2010 Pearson Education, Inc.
Chapter 13Nonparametric Statistics
13-1 Review and Preview
13-2 Sign Test
13-3 Wilcoxon Signed-Ranks Test for Matched Pairs
13-4 Wilcoxon Rank-Sum Test for Two Independent Samples
13-5 Kruskal-Wallis Test
13-6 Rank Correction
13-7 Runs Test for Randomness

Section 13.4-3Copyright © 2014, 2012, 2010 Pearson Education, Inc.
Key Concept
The Wilcoxon rank-sum test uses ranks of values from two independent samples to test the null hypothesis that the two populations have equal medians.
The basic idea underlying the Wilcoxon rank-sum test is this: If two samples are drawn from identical populations and the individual values are all ranked as one combined collection of values, then the high and low ranks should fall evenly between the two samples.
If the low ranks are found predominantly in one sample and the high ranks are found predominantly in the other sample, we suspect that the two populations have different medians.
Section 13.4-4Copyright © 2014, 2012, 2010 Pearson Education, Inc.
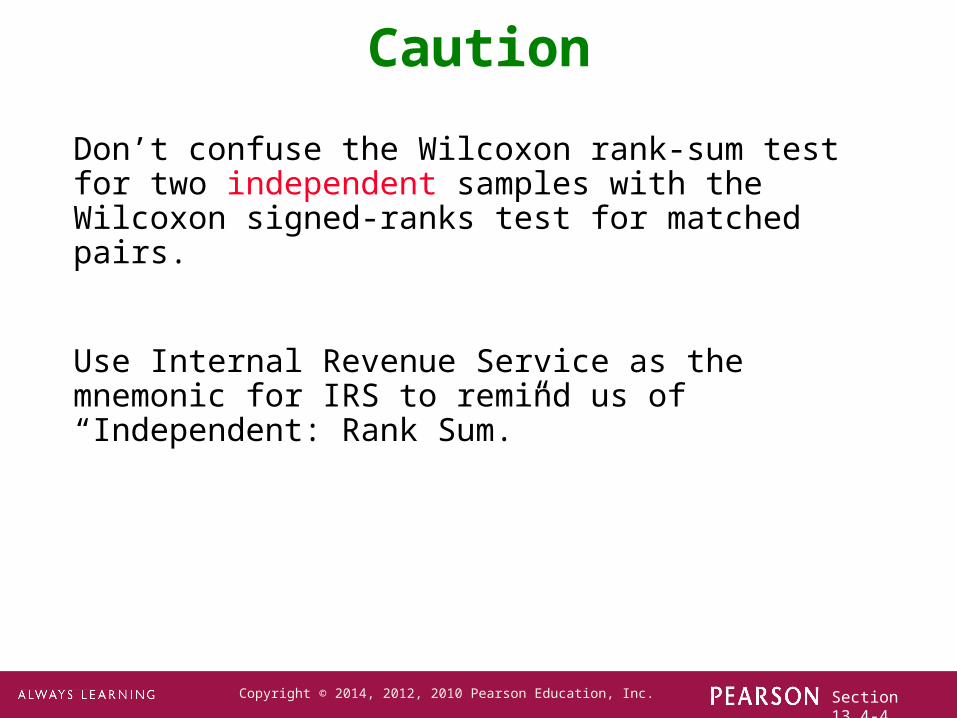
Caution
Don’t confuse the Wilcoxon rank-sum test for two independent samples with the Wilcoxon signed-ranks test for matched pairs.
Use Internal Revenue Service as the mnemonic for IRS to remind us of “Independent: Rank Sum.”

Section 13.4-5Copyright © 2014, 2012, 2010 Pearson Education, Inc.
The Wilcoxon rank-sum test is a nonparametric test that uses ranks of sample data from two independent populations.
It is used to test the null hypothesis that the two independent samples come from populations with equal medians.
Definition
Section 13.4-6Copyright © 2014, 2012, 2010 Pearson Education, Inc.
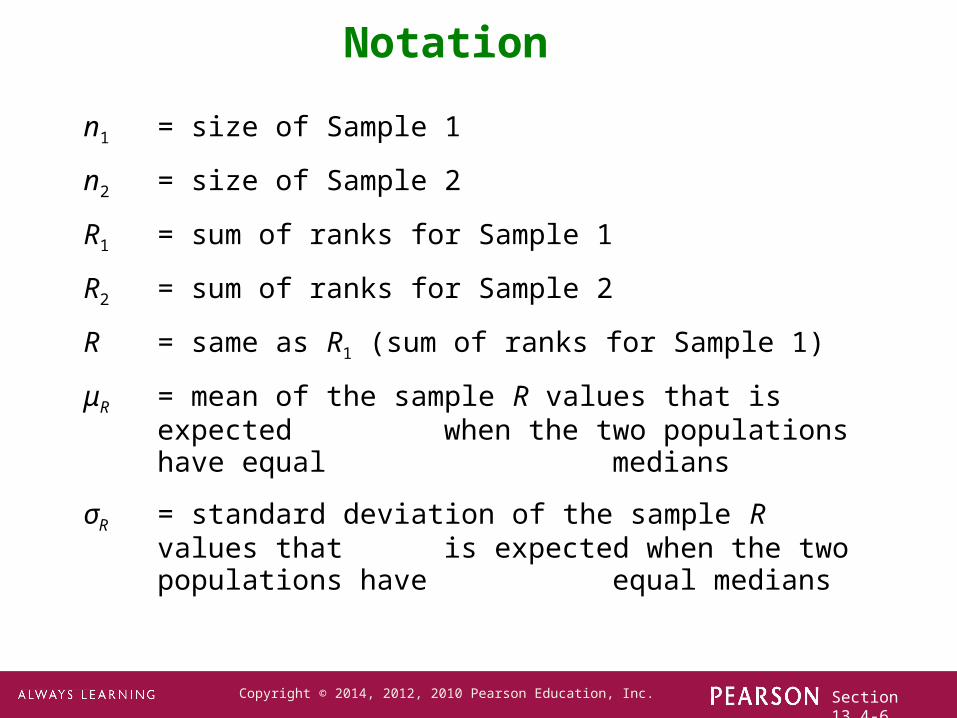
n1 = size of Sample 1
n2 = size of Sample 2
R1 = sum of ranks for Sample 1
R2 = sum of ranks for Sample 2
R = same as R1 (sum of ranks for Sample 1)
μR = mean of the sample R values that is expected when the two populations have equal medians
σR = standard deviation of the sample R values that is expected when the two populations
have equal medians
Notation
Section 13.4-7Copyright © 2014, 2012, 2010 Pearson Education, Inc.
Requirements
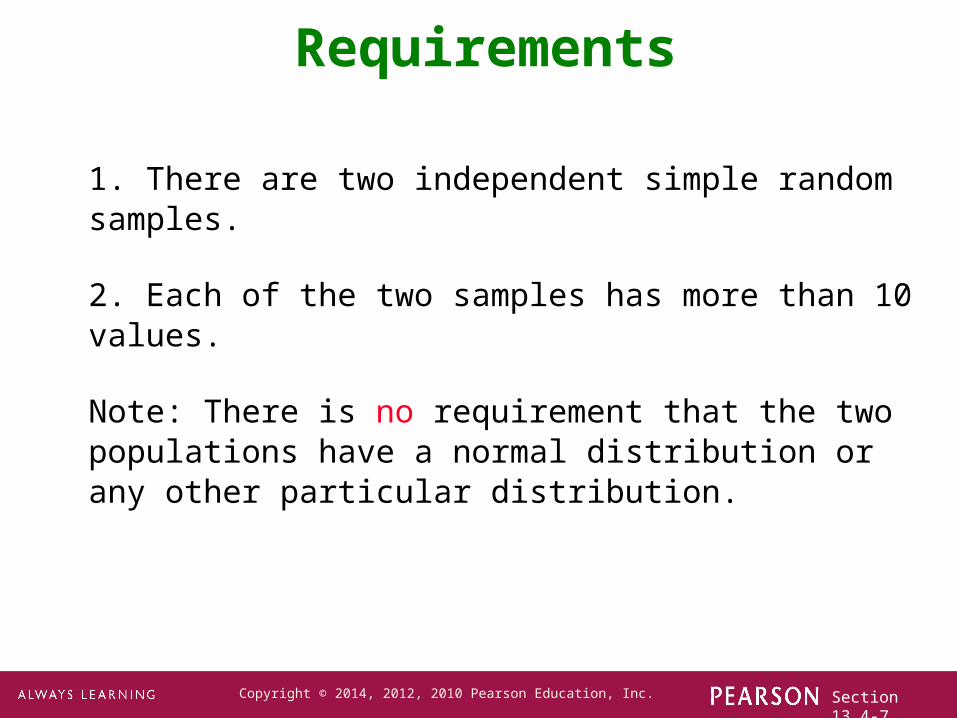
1. There are two independent simple random samples.
2. Each of the two samples has more than 10 values.
Note: There is no requirement that the two populations have a normal distribution or any other particular distribution.

Section 13.4-8Copyright © 2014, 2012, 2010 Pearson Education, Inc.
Test Statistic
where
n1 = size of the sample from which the rank sum R is foundn2 = size of the other sampleR = sum of ranks of the sample with size n1

Section 13.4-9Copyright © 2014, 2012, 2010 Pearson Education, Inc.
P-Values can be found using the z test statistic and Table A-2.
Critical values can be found in Table A-2 (because the test statistic is based on the normal distribution).
P-Values / Critical Values
Section 13.4-10Copyright © 2014, 2012, 2010 Pearson Education, Inc.
Procedure for Finding the Value of the Test Statistic
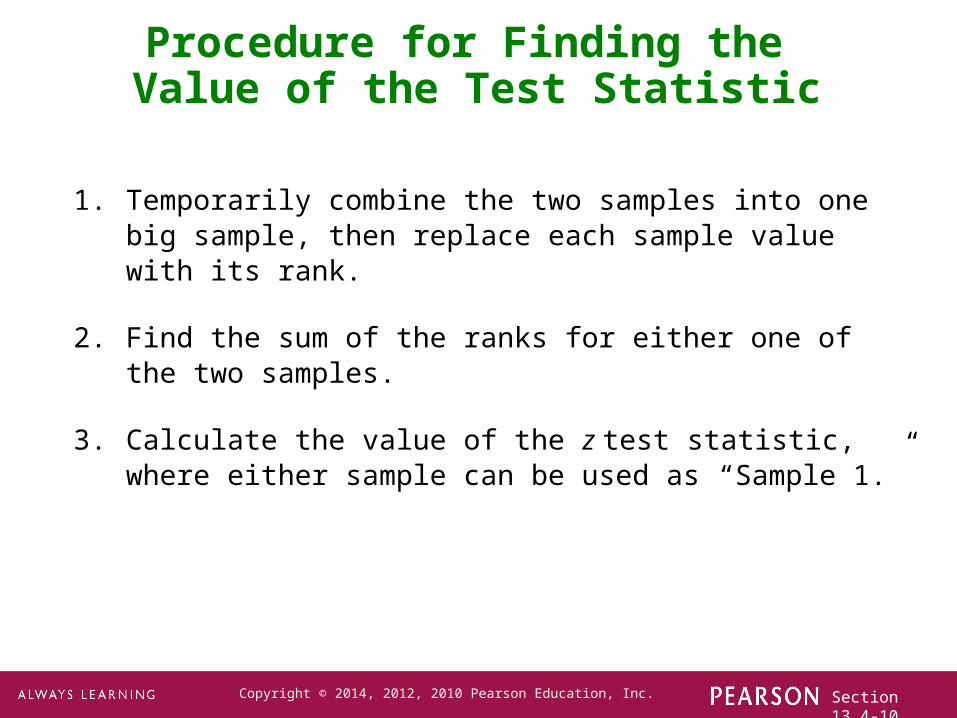
1. Temporarily combine the two samples into one big sample, then replace each sample value with its rank.
2. Find the sum of the ranks for either one of the two samples.
3. Calculate the value of the z test statistic, where either sample can be used as “Sample 1.”
Section 13.4-11Copyright © 2014, 2012, 2010 Pearson Education, Inc.
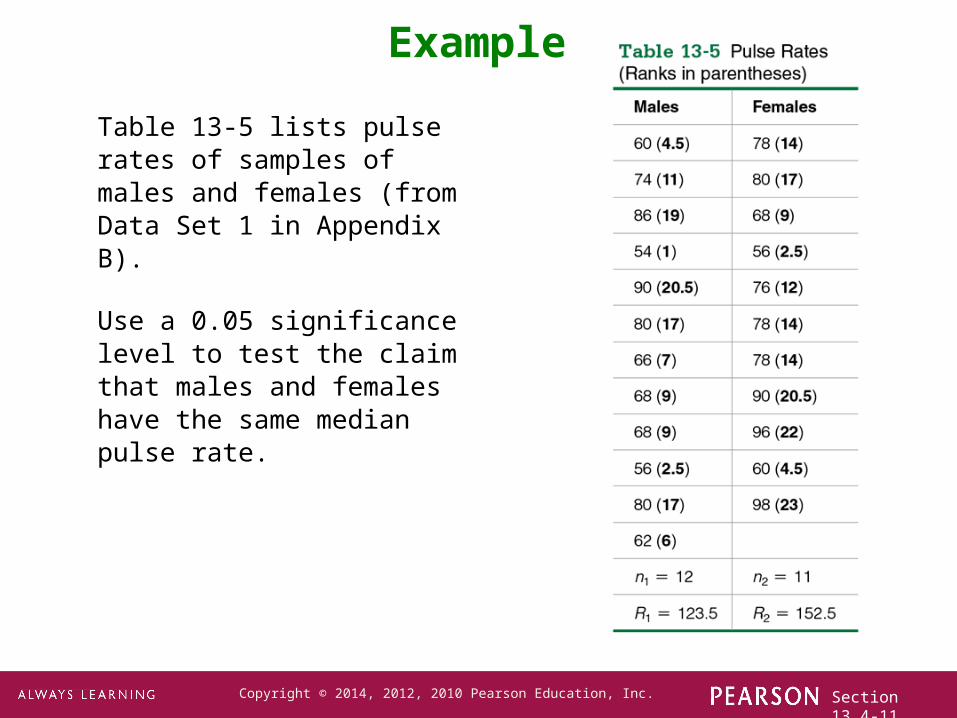
Example
Table 13-5 lists pulse rates of samples of males and females (from Data Set 1 in Appendix B).
Use a 0.05 significance level to test the claim that males and females have the same median pulse rate.

Section 13.4-12Copyright © 2014, 2012, 2010 Pearson Education, Inc.
Example - Continued
Requirement Check: The sample data are two independent random samples, and the sample sizes are 12 and 11, which both exceed 10.
The hypotheses are:

Section 13.4-13Copyright © 2014, 2012, 2010 Pearson Education, Inc.
Example - Continued
Rank the combined 23 pulse rates – refer to the table in the previous slide.
If we choose the pulse rates of males as Sample 1, we get:
Also, n1 = 12, n2 = 11, and we can find the values of μR, σR,
and the test statistic z.

Section 13.4-14Copyright © 2014, 2012, 2010 Pearson Education, Inc.
Example - Continued
Section 13.4-15Copyright © 2014, 2012, 2010 Pearson Education, Inc.
Example - Continued
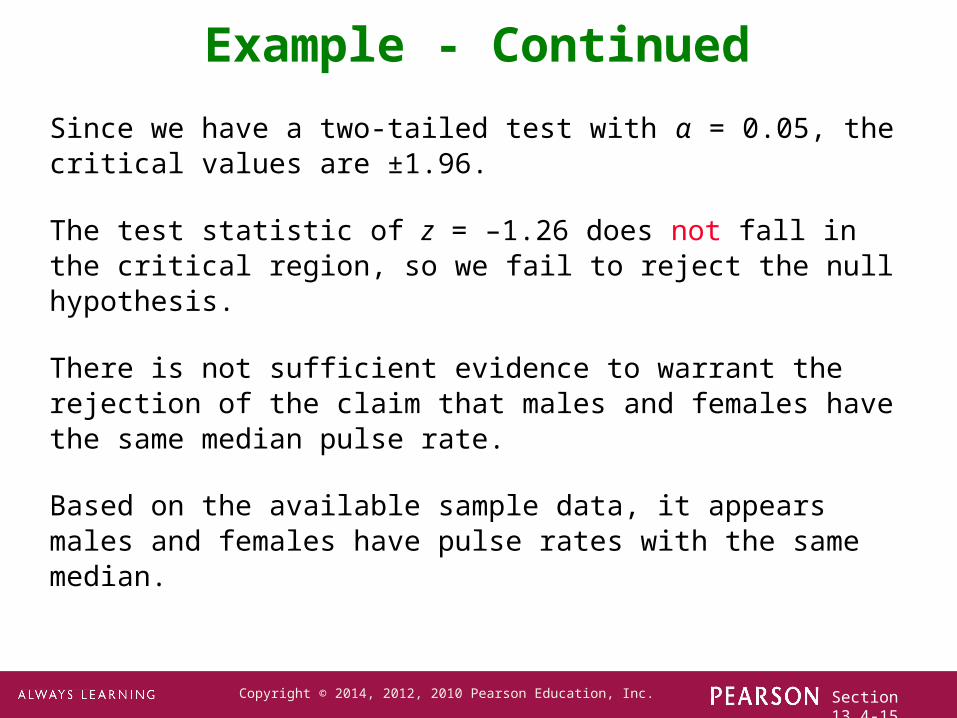
Since we have a two-tailed test with α = 0.05, the critical values are ±1.96.
The test statistic of z = –1.26 does not fall in the critical region, so we fail to reject the null hypothesis.
There is not sufficient evidence to warrant the rejection of the claim that males and females have the same median pulse rate.
Based on the available sample data, it appears males and females have pulse rates with the same median.