Secrets of UAV photomapping - iRevolutions · Reducing crab angle vs reducing crab angle changes...
69
Secrets of UAV photomapping by Krzysztof Bosak
Transcript of Secrets of UAV photomapping - iRevolutions · Reducing crab angle vs reducing crab angle changes...

Secrets of UAV
photomapping
by Krzysztof Bosak

Page 2/69 Secrets of UAV photomapping www.pteryx.eu
‘Make things as simple as possible, but not simpler’
A. Einstein
Title page: 4.5km2 ortophotomap at 10cm/pix created with
Presented satellite maps © CNES/Spotimage
All rights reserved. No part of this book may be reproduced or transmitted in any form by any means, electronic or mechanical, including photocopying, recording or by any information storage or retrieval system without permission from the author, except for the inclusion of brief quotations in a review.

Page 3/69 Secrets of UAV photomapping www.pteryx.eu
1. GPS and IMU precision ..................................................................................................... 4 2. Full scale aviation vs small UAV imaginery ..................................................................... 5 3. Satellite vs small UAV imaginery...................................................................................... 7 4. Resolution, megapixels and flight altitude......................................................................... 9 5. Camera settings and exposition time................................................................................ 10 6. Surface, map shape and flight altitude ............................................................................. 12 7. Side photo overlap............................................................................................................ 15 8. Importance of stabilized head .......................................................................................... 16 9. Along photo overlap......................................................................................................... 18 10. Number of overlapping photos..................................................................................... 21 11. Number of photos taken and data quantity................................................................... 23 12. Flight speed, wind penetration and endurance ............................................................. 25 13. Flying with variable airspeed ....................................................................................... 27 14. Crab angle .................................................................................................................... 29 15. Reducing crab angle vs reducing crab angle changes.................................................. 32 16. Battery count vs payload and endurance...................................................................... 36 17. What if the motor stops working in the air................................................................... 39 18. Flight safety.................................................................................................................. 41 19. Clearing the obstacles................................................................................................... 45 20. Probability of successful campaign.............................................................................. 50 21. Using dual camera and probability of success ............................................................. 53 22. Calculating growth factors for precision agriculture.................................................... 56 23. Robustness and materials ............................................................................................. 60 24. On efficiency of winged platforms............................................................................... 61 25. Answers to FAQ........................................................................................................... 62 26. Summing it up all together ........................................................................................... 69 27. Final word .................................................................................................................... 69

Page 4/69 Secrets of UAV photomapping www.pteryx.eu
1. GPS and IMU precision
We are frequently asked about usefulness of advanced DGPS solutions to be used for
referencing having ‘more precise solution’ or more precise IMU.
Bad news is that airborne GPS or IMU in small flying objects are never going to be as precise
as stationary GPS. This is because the measurements are less correlated in time and the
object is subject to constant vertical accelerations due to atmospheric turbulence.
Good news is it is not needed as the precision comes from imaginery, up to three thousand
photos, each tagged with its own position and orientation. The measurements are so
precisely linked together that their large number provides accuracy.
Operational practice says that using DGPS would only add unnecessary complexity to the
system, requiring robust long range uplink that cannot be provided given power restriction
for regular (non-registered amateurs) modem users in most countries, for typical operational
distances. GPS in Pteryx UAV is using existing WAAS, MSAS and EGNOS ionospheric
transmittance correction data which are transmitted by the satellites. It has capability of
tracking up to 22 out of max 66 acquired satellites simultaneously when they enter service,
2.5m precision with 10Hz update rate.
GPS and IMU precision is not a factor defining successful UAV mapping system. It is
capability of delivering sharp, contrasted, undistorted photos with high overlap that yields
geometric precision and height data.
500-2500m flight altitude
Wide coverage, but less features per object
to correct orientation.
Typically 100-300m flight altitude
Large numbers of GPS measurements
matching on terrain feature provide
enhanced precision.
Traditional GPS surveying:
Each measurement point is static, but
uncorrelated to neighboring measurements
therefore highest precision is desirable.
More than a thousand features link each
neighboring image, creating a map with
global sub-pixel geometric accuracy.
Optional 3-4 control points can shift the
map, reducing error from a few meters to
stationary GPS precision (around 10cm).

Page 5/69 Secrets of UAV photomapping www.pteryx.eu
2. Full scale aviation vs small UAV imaginery
2011, recent equipment aboard airplane,
flight altitude around 1500m,
visible green cast on the whole map.
10cm/pixel resolution. Shadows have severe
impact on data.
Pteryx, flight altitude 300m AGL
Much less air between the sensor and
target, same resolution, significantly better
color definition.
More information per pixel!
All buildings are often uniformly tilted to the
side, however at small angle as long as flight
altitude is high.
Distortion is removed thanks to photos
covering the target from all angles.
True ortophoto is a standard!

Page 6/69 Secrets of UAV photomapping www.pteryx.eu
Full scale airplane Pteryx UAV
Flight duration Up to 2 hours Up to 2 hours
Personnel involvement 2 pilots typically with bi-
engine qualifications CPL(A),
IFR, MEP(L),
1 onboard system operator
1 pilot, sometimes with
1 helper/observer
Area coverage per flight Hundreds of square
kilometers
Around 9km2 (900ha) for
rectangular map per flight,
Up to 72km2 (7200ha) for
straight-line flight
(depending on resolution).
Resolution 500-2500m AGL
Lower altitude limited by
noise, regulations and risk
involved (urban areas, time
to ground).
4cm/pix at 100m AGL
11cm/pix at 300m AGL
Upper altitude limit often
imposed by air traffic laws.
Capital investment Custom-equipped, typically
4-place bi-motor general
aviation aircraft.
100..200 times less capital
investment, the UAV reuses
existing computers, possible
subscription to online cloud
processing service,
the sensor is high quality
consumer market camera.
Environmental impact Noise limits. Uses aviation
fuel.
Completely inaudible above
200m, except at night
without any wind.
Rechargeable electric power.
Mission readiness Must return to airfield. Can be stored close to
mission area waiting for
clear weather.
UAV can deliver better quality maps, where using full scale aviation would be a nuisance.
UAV operates locally, but covers areas inaccessible to occasional aerial solutions including
paraplanes, ad-hoc RC airplane installations or kites.
Typical UAV flight path

Page 7/69 Secrets of UAV photomapping www.pteryx.eu
3. Satellite vs small UAV imaginery
While satellite data is gathered regularly, its main problem is long availability time reaching
months. Every piece of terrain must be cleared by national authorities for publication. This is
amplified by typically large surfaces involved – satellite data are negotiated and published ‘in
volume’ thus augmenting the number of clearances required for every object in the area.
Since delaying the time from acquisition to publication is considered as one more method of
enforcing the security by the military, authorities and established institutions have no reason
to significantly speed up the process.
Quality problems with satellite imaginery • Low, medium and high-altitude clouds entirely obscure areas, particularly in
equatorial regions where clouds form more often. With low altitude maps, the clouds
will either obscure the view less or more uniformly or will not be present at all.
• Given low color definition, the cloud’s shadow is making neighboring areas
unacceptably dark with very little contrast. The shadow problem is much less a
problem for UAV high-color definition photos with much better dynamics.
• Random object between satellite and terrain is projected on the map.
• Bulk processing of maps can provide recent data, but from different seasons across
your area of interest.
Anything between ground and satellite
orbit appears on the map.
This time we have a flying replica of
WW2 bomber projected in the middle
of one of UK towns.
If it were an UAV data, you would
simply delete a single photo before
processing.
Overlapping images from UAV provide automatic
elimination of random objects: a moving car is
visible on all four consecutive photos… but on the
final map it is visible only when it passes closest to
optical axis. With development of processing
methods a complete traffic removal will be
possible using exactly the same input data.

Page 8/69 Secrets of UAV photomapping www.pteryx.eu
A cloud visible on satellite image is obscuring
certain objects. The cloud shadow is highly
visible.
UAV map: winter, low light, overcast
changing all the time between 1/8 to 7/8
(from left to right). Color balance suffers,
but the contrast and detail is still well
defined since modern mass-market
cameras provide better color depth than
many large scale aircraft scanners.
Widely available satellite imaginery can be
recent, but hoping for the most universal map
the color cast is arbitrary. Still, the borders
between maps delivered at different time are
hard to use.
In reality, the world is changing significantly
from season to season. The key to success
is to have a map of desired object made at
the right moment.

Page 9/69 Secrets of UAV photomapping www.pteryx.eu
4. Resolution, megapixels and flight altitude
Pteryx Pro has built-in 10MPIX camera, using standard lens.
This translates into 66 deg horizontal viewing angle.
The user selects flight altitude in order to
• avoid obstacles with at least 80m clearance
• assure comfortable angular distance to obstacles (visual contact)
• meet law requirements (max altitude either 400ft, 300m or other, depending on
country, specific location and ATC rules, consult aviation maps)
In general one chooses to fly as high as possible in order to fly shorter missions.
The altitude indicated is approximate, since terrain altitude variations are present. On the
other hand geometric precision is not reduced because each point of geometry is shared
among many photos providing ample reserve of accuracy. Of course ground-projected
texture resolution will degrade in mountain regions.
For 10MPIX digital camera:
Altitude
[m] (ft)
Resolution
[cm/pix] (in/pix)
Ground photo width
[m] (ft)
100 (330) 3.5 (1.4) 129 (423)
122 (400) 4.3 (1.7) 157 (515)
140 (460) 5 (2.0) 180 (590)
200 (660) 7.1 (2.8) 257 (843)
280 (920) 10 (3.9) 360 (1181)
420 (1380) 15 (5.9) 540 (1771)
560 (1840) 20 (7.9) 720 (2362)
Linear ground resolution depends on megapixel count using square root law,
For example switching from 10 to 14mpix camera yields only %1810
14 = more linear
resolution. Alternatively one could have 18% higher altitude, 18% more sparse mapping
pattern but in practice only 10-15% more area coverage (because one must include climb
time). Therefore our camera choice is motivated mainly by lens properties. All this assuming
that 14MPIX camera will have not worse noise properties than 10MPIX camera.
For given UAV (fixed optimal flying speed), surface coverage also rises only with square
root of camera resolution, as only side overlap can be adjusted (along overlap is kept as
redundant as it gets for given shooting rate). Megapixels vs ground resolution gain
0%
10%
20%
30%
40%
50%
60%
70%
80%
90%
100%
110%
120%130%
140%
150%
160%
170%
5 6 7 8 9 10 11 12 13 14 15 16 17 18 19 20 21 22 23 24
MPIX
Line
ar g
roun
d re
solu
tion
rela
tive
to 1
0MP
IX
Page 10/69 Secrets of UAV photomapping www.pteryx.eu
5. Camera settings and exposition time
One must assure there will be no blur on the photos. Therefore the best strategy is to keep
the exposition time constant, fix white balance or use RAW format, allow automatic
aperture selection, focusing fixed to infinity.
RAW mode and exposure selection
Before takeoff, using RAW format with 10 or 12bits per channel it is best to select seriously
underexposed settings. One must take into account significant exposition changes due to
low level clouds and avoid overexposure. Underexposure can be handled without
information loss with post-processing, the signal bandwidth will not be lost relative to classic
8bit JPG image even if upper 2-4 bits of the data will never be counted by the sensor.
It takes more time for RAW images to be captured, therefore continuous camera shooting
rate of some cameras might drop to as low as 6s. This will affect minimal along-overlap and
minimal useful flight altitude, consequently the resolution.
Avoiding blur by exposition time
Because the plane moves over ground, it travels certain pixel distance during taking the
photo. A reasonable condition of having no perceived blur is to assure the travelled distance
during making the photo is not larger than half size of the pixel resolution.
Worst case scenario occurs when the plane travels with the wind, with increased
groundspeed.
Rotating the camera by 90 deg along its optical axis is not making the effect any less
important since the linear resolution is the same in horizontal and vertical direction.
For given selection of ground resolution, we get the following maximum exposition times
(each camera has its own set of rounded values, like 1/800, 1/1000, 1/1250, 1/1600).
One must be aware that in general for given lens angle width, the cameras with more
megapixels are more prone to blur on the images since for them each pixel spans smaller
conical angle. This means that selecting dark lenses, higher pixel count and higher flight
altitude is not a good practice in bad weather.
Verify before takeoff
It is your job to verify before takeoff, that for reasonable aperture sizes, facing down, the
camera is able to make well-lit photos without exceeding mentioned exposition times (this
test is not strictly simulating the situation in the air since focusing distance is shorter and
there is no shaking due to turbulence). If not, you may be forced to switch to a camera with
larger digital sensor surface, or higher ISO rating, or wait for sunny weather.

Page 11/69 Secrets of UAV photomapping www.pteryx.eu
For 50km/s cruise speed:
Resolution
[cm/pix] (in/pix)
Longest possible exposition
time, no wind [1/s] (rounded)
Longest possible exposition time,
with 7m/s wind [1/s] (rounded)
3.5 (1.4) 787 (1/800) 1184 (1/1250)
4.3 (1.7) 645 (1/640) 971 (1/1000)
5 (2.0) 562 (1/640) 846 (1/1000)
7.1 (2.8) 394 (1/400) 592 (1/640)
10 (3.9) 281 (1/320) 423 (1/500)
15 (5.9) 187 (1/200) 282 (1/320)
20 (7.9) 141 (1/160) 211 (1/250)
Note that the table above doesn’t depend on flight altitude. Whatever is the flight altitude
necessary to achieve desired pixel resolution, it is the pixel resolution itself, airspeed and
max wind speed plus air turbulence (not accounted for in this study) that matters when
selecting exposition time. Obviously, the exposition times are shorter than you would
normally use for pleasure photo shooting – the reason is that you rarely make photos from a
riding bus expecting sharp pictures; this translates to extra noise compared to photos you
make on the ground from your hand.
Fulfilling the condition is not a guarantee of sharp photos, because the UAV is subject to
wind gusts in three dimensions. Rather, you will get occasional blur that you can remove by
deleting photos (typically 0-2% of all photos), provided you have additional along-overlap.
Flying high is beneficial for photo quality for several reasons:
- pixel resolution is lower, therefore for given exposition times, there will be less blur
due to translational movement
- longer exposition times mean less noise in the image itself, consider using RAW
photo mode in order to record all valuable data
- more along overlap at high altitude permits deleting blurred photo post-flight
- side overlap is easier to satisfy given fixed flight time constraint, this provides extra
elevation precision
- ground-level turbulence is not affecting the plane
Unfortunately equal amount of turbulence is producing blurred photos regardless on
altitude (it depends solely on ground pixel size and roll rate coming from short, violent
gusts). Blur could be reduced in windy weather only by reducing a priori selected resolution,
even more by flying high above terrain obstacles and avoiding mountainous areas.
The disadvantage is, that average wind at high altitude is higher therefore expected flight
time will be slightly longer, one must also factor in climb time into battery usage and it might
be forbidden in many areas of interest. Gliding down is consuming around 1/10..1/20th of
cruise power, therefore can be neglected for power usage calculation.

Page 12/69 Secrets of UAV photomapping www.pteryx.eu
6. Surface, map shape and flight altitude
I you are mapping a
linear object,
doubling the altitude
you are doubling
surface coverage
If decided to make 2 passes
hoping to improve geometry
matching, because of
overlap requirement, flying
high you are reducing flight
time only by about 1/3,
because outside regions
have valid bitmap but poor
geometry.
With regular map shape and multiple
passes, flying 2 times higher needs 2
less passes and flight time and
provides extra surface at map edges.
However, the area should be flat as
there will be no multi-angle
information allowing to
orthonormalize high objects along
the edges.
It is easy to witness large mapping areas with UAV flying straight. In fact, flying straight with
Pteryx for 2 hours at 50km/h at altitude of 560m, yields 20cm resolution and ground photo
width of 720m.
Using the formula:
widthphotogroundkmW
groundoverspeedhkmV
timeflighthT
WVTkmS FLIGHTSTRAIGHT
−−
−
⋅⋅=
][
]/[
][
][ 2_
One easily can deduce 72km2 map surface in a single direction straight flight.
However, assuming returning flight and only 60% overlap, one gets
(100%+40%)*720m=1008m strip width and only one hour of flying in one direction.
This yields only 50.4km2 map surface with returning flight.
A single-leg mission. Typical
along-overlap is high, around
75..90%.
Two-leg mission. Typical 60%
side-overlap shown.
Along-overlap 75..90%.
Three-leg mission.
Typical 60% side-overlap
shown.
In the following plots, square map exhibits similar properties as 9…10 leg maps.

Page 13/69 Secrets of UAV photomapping www.pteryx.eu
Note: 1km2=100ha=247 acre=0.386sq mi=10764sq ft
Assuming typical 60% overlap, 50km/h airspeed, no wind and 2h flight, we get the following
surface figures depending on number of legs:
Map area vs number of legs, 2h flight, 60% overlap
0
10
20
30
40
50
60
70
80
1 2 3 4 5 6 7 8 9 10 11 12 13 14 15 16 17 18 19 20 21 22 23 24
Number of legs
Ma
p s
urf
ace
km
2
100m AGL
122m AGL
140m AGL
280m AGL
420m AGL
560m AGL
Same plot, zoomed in:
Map area vs number of legs, 2h flight, 60% overlap
0
5
10
15
20
25
30
1 2 3 4 5 6 7 8 9 10 11 12 13 14 15 16 17 18 19 20 21 22 23 24
Number of legs
Ma
p s
urf
ace
km
2
100m AGL
122m AGL
140m AGL
280m AGL
420m AGL
560m AGL

Page 14/69 Secrets of UAV photomapping www.pteryx.eu
Assuming typical 60% overlap, 50km/h airspeed, no wind and 1h flight
or
80% overlap for demanding applications, 50km/h airspeed, no wind and 2h flight,
divide the surface roughly by two (note that 1-leg flight surface is unaffected by overlap):
Map area vs number of legs,
1h flight, 60% overlap
or 2h flight, 80% overlap
0
10
20
30
40
50
60
70
80
1 2 3 4 5 6 7 8 9 10 11 12 13 14 15 16 17 18 19 20 21 22 23 24
Number of legs
Map
su
rfac
e k
m2
100m AGL
122m AGL
140m AGL
280m AGL
420m AGL
560m AGL
Same plot, zoomed in:
Map area vs number of legs,
1h flight, 60% overlap
or 2h flight, 80% overlap
0
5
10
15
20
25
30
1 2 3 4 5 6 7 8 9 10 11 12 13 14 15 16 17 18 19 20 21 22 23 24
Number of legs
Map
su
rfac
e k
m2
100m AGL
122m AGL
140m AGL
280m AGL
420m AGL
560m AGL

Page 15/69 Secrets of UAV photomapping www.pteryx.eu
7. Side photo overlap
In Pteryx the camera is arranged with base parallel to wings.
Map surface vs side overlap, relative to 60% overla p
0.0%
50.0%
100.0%
150.0%
200.0%
250.0%
0% 10% 20% 30% 40% 50% 60% 70% 80% 90% 100%
Side overlap
Rel
ativ
e m
ap s
urfa
ce
For regular map shape when flight legs must
overlap, the surface mapped in unit of time
diminishes with growing overlap.
Flight duration vs side overlap, relative to 60% ov erlap
0%
50%
100%
150%
200%
250%
300%
350%
400%
0% 10% 20% 30% 40% 50% 60% 70% 80% 90% 100%
Side overlapF
light
dur
atio
n fo
r fly
ing
cons
tant
sur
face
Inevitably, flight duration rises dramatically
with overlap. It is crucial to find and always
satisfy minimal overlap required by
processing software.
While using smallest possible overlap is tempting, it may lead to increased data processing
failure rate over specific terrain, with low contrast. It is necessary to keep slightly higher
overlap in urban areas; this is subject to experimentation with specific choice of processing
software and requested precision during orthonormalization.
Our experience indicates that:
• 40% side overlap is sufficient only in exceptional cases with high contrast terrain, but
it must be flat since protruding objects like building will highly distort area around
them, i.e. roads. Therefore it would be sufficient for agriculture, if not the fact that
the subject is monotonous and low overlap may generate false matches. Because of
this we do not recommend mapping with such low overlap. It also leaves no room for
a blurred photo to be removed before stitching.
• 60% side overlap is acceptable in rural areas, agriculture and in forestry. It is also
sufficient for 3D terrain mapping if the main goal is volume/profile measurement.
• 70-80% side overlap is preferred in built-up areas with towers, 5-story buildings or in
sloped mountains where specific features must retain resolution and precision.

Page 16/69 Secrets of UAV photomapping www.pteryx.eu
8. Importance of stabilized head
Since increasing overlap is so costly in mission time and so important in urban areas,
Pteryx uses roll-stabilized head and has aerodynamic design successfully attenuating
oscillations in pitch and yaw axes.
The use or roll-stabilized head increases useful surface during turns and increases processing
success rate thanks to overall more predictable photo properties.
Unfortunately all smart-looking small flying objects are also small relative to typical size of
turbulent cell in the air, therefore their roll and pitch depends more on wind conditions.
Stiff automated control of small aerial platforms with active control surfaces leads to
significant short-term movements, causing occasional blur in the photos. Stabilized head and
special aerodynamics layout with exceptional damping properties comes to the rescue.
With stabilized head, the
overlap stays guaranteed,
even in turns.
Without stabilized head,
typical deviations of a few
degrees already require
extra few percents of
overlap pre-planned. This is
costly in terms of flight time
and worsens significantly
during windy weather.
Without stabilized head,
photos taken during turns
are completely useless for
reconstruction, typically
overlapping by few degrees
and only in corners. No
airplane can make a full turn
that is flat (with reasonable
radius). Those photos cannot
contribute to enhancing map
geometry inside the area of
interest.
Both small UAV like flying wings and even large UAV with several meters wingspan tend to
respond for navigation with changing 0-5 deg roll both directions even when ordered to ‘fly
straight’ over ground. The reason is, while ground path is straight, the wind blows in any
direction, usually as much as 45 deg different at altitude than at ground level, with little
direction change but much more wind speed variation. This means the UAV has to bank left
and right all the time in order to stay on its path. On the other hand we have seen earlier
that increasing number of legs costs flying time, therefore it is possible (and implemented in
Pteryx UAV) but highly impractical to rotate elongated flying pattern against the wind.

Page 17/69 Secrets of UAV photomapping www.pteryx.eu
Using stabilized head, we are freeing you from one more mission planning factor: you fly in
the direction you like.
It is interesting to think how all types of small flying things perform in this area. RC flying
models notoriously bank at 45deg and fly uneven path +/- 10deg roll both sides until the
pilot is in good mood. Kites are worst, tumbling in all direction requiring many photos to be
taken and the good one chosen. It is impractical to select one thousand photos among
several thousand per few square kilometers.
Assuming 66.5 deg wide view angle determining the leg spacing, at any altitude or airspeed,
this amount or roll on X axis (the fuselage) can occur in each direction (left or right):
Non-stabilised head leading to surface loss,
Increased flight time is required to compensate
for lost overlap due to roll oscillations
0.0%
2.0%
4.0%
6.0%
8.0%
10.0%
12.0%
14.0%
16.0%
18.0%
20.0%
0 1 2 3 4 5 6 7 8 9 10
Roll oscillation amplitude due to turbulence [+/- deg]
Surf
ace
co
vera
ge l
oss
[%
]
Roll turbulence [deg]
The effect is nominally not large until you assume a priori the correct spacing and resulting
reduced flight time before takeoff. There are no strategies available to correct this in
flight, if you over-optimize leaving large spacing, failed overlap reveals itself post-flight.
That is, if you don’t have stabilized head.
If you fail to plan ahead, while weather worsens, the processing result might be as follows:
Non-stabilized head, locally reduced overlap led to mismatched road geometry.
Pteryx UAV is completely free from those troubles.

Page 18/69 Secrets of UAV photomapping www.pteryx.eu
9. Along photo overlap
Along photo overlap is a result of high rate of shooting of the camera. The worst case occurs
when the plane flies with the wind, when the overlap diminishes below acceptable margin,
we assume here 60% as the limit of comfort but it depends on processing software. At high
altitude, the overlap is so high that continuous shooting yields beneficial backup photos,
allowing deleting any single blurred photo. One can conclude, that in windy weather, when
ground-induced turbulence is highest at lower altitude and more blur is expected there is no
room for backup photos. Flying at higher airspeed only worsens the situation; flying at lower
airspeed drastically reduces area covered due to headwind. The camera continuous shooting
rate is the limit.
It should be noted that camera’s truly continuous shooting rates are never published –
each single camera make has to be tested individually as we are talking about 2 hours of
continuous shooting. It has to be determined during flight trials as it depends on focusing
time when the background is moving at a pattern typical to what is seen from the UAV.
Pteryx data:
Along photo overlap vs altitude, 3.5s shooting rate, 50km/h
0%
10%
20%
30%
40%
50%
60%
70%
80%
90%
100%
100 200 300 400 500 600
Altitude [m]
Alo
ng p
hoto
ove
rlap
[%]
Overlap w ith no w ind [%]
Overlap w ith 2m/s w ind [%]
Overlap w ith 4m/s w ind [%]
Overlap w ith 6m/s w ind [%]
Overlap w ith 8m/s w ind [%]
As you can see the system can guarantee 60% along-overlap during the winds up to 7m/s
flying at minimum practical altitude of 100m.
It should be noted that with practical overlap below strict 50% there is no data about terrain
elevation change across the tiny strip that is shot with only one photo. This is why we often
consider 60% overlap as the limiting value.
All the plots published assume the camera placed long side along the wings – the reason is
that for most situations along-coverage is sufficient, yet the side-overlap significantly
affects surface coverage per flight, therefore affecting overall profitability.

Page 19/69 Secrets of UAV photomapping www.pteryx.eu
It can be seen that flying fast in order to improve wind penetration at the cost of flight
endurance, also limits achievable resolution. It is not possible to assure 60% overlap below
200m altitude flying at 8m/s wind with a hypothetical system flying at cruise speed of
65km/h, provided the shooting rate 1/3.5s is achievable for one hour.
Along photo overlap vs altitude, 3.5s shooting rate, 65km/h
0%
10%
20%
30%
40%
50%
60%
70%
80%
90%
100%
100 200 300 400 500 600
Altitude [m]
Alo
ng p
hoto
ove
rlap
[%]
Overlap w ith no w ind [%]
Overlap w ith 2m/s w ind [%]
Overlap w ith 4m/s w ind [%]
Overlap w ith 6m/s w ind [%]
Overlap w ith 8m/s w ind [%]
Flying at 75km/h extends penetrable winds above 8m/s, but achievable overlap is even
worse.
Along photo overlap vs altitude, 3.5s shooting rate, 75km/h
0%
10%
20%
30%
40%
50%
60%
70%
80%
90%
100%
100 200 300 400 500 600
Altitude [m]
Alo
ng p
hoto
ove
rlap
[%]
Overlap w ith no w ind [%]
Overlap w ith 2m/s w ind [%]
Overlap w ith 4m/s w ind [%]
Overlap w ith 6m/s w ind [%]
Overlap w ith 8m/s w ind [%]

Page 20/69 Secrets of UAV photomapping www.pteryx.eu
Using internal interval timer of the camera is limiting shooting rate typically to 5s, besides
the fact that it is much more difficult to synchronize the data with GPS positions as the
clocks of autopilot and camera may drift.
Along photo overlap vs altitude, 5s shooting rate, 75km/h
0%
10%
20%
30%
40%
50%
60%
70%
80%
90%
100%
100 200 300 400 500 600
Altitude [m]
Alo
ng p
hoto
ove
rlap
[%]
Overlap w ith no w ind [%]
Overlap w ith 2m/s w ind [%]
Overlap w ith 4m/s w ind [%]
Overlap w ith 6m/s w ind [%]
Overlap w ith 8m/s w ind [%]
Using internal camera shutter is limiting drastically minimal flying altitude in case of high
winds and high speed airframe
Along photo overlap vs altitude, 5s shooting rate, 50km/h
0%
10%
20%
30%
40%
50%
60%
70%
80%
90%
100%
100 200 300 400 500 600
Altitude [m]
Alo
ng p
hoto
ove
rlap
[%]
Overlap w ith no w ind [%]
Overlap w ith 2m/s w ind [%]
Overlap w ith 4m/s w ind [%]
Overlap w ith 6m/s w ind [%]
Overlap w ith 8m/s w ind [%]
Using camera’s interval shutter (instead of autopilot triggering) at 5s shooting rate with
Pteryx UAV is technically possible, but the minimal altitude in order to guarantee 60%
overlap varies from 122m to 240m depending on wind speed. Many cameras have 5s
interval self-timer limitation.
Canon S90 has no self-triggering option unless CHKD custom firmware is installed by the
user, what otherwise would limit max SD card size to 4GB, making this option less
interesting.

Page 21/69 Secrets of UAV photomapping www.pteryx.eu
10. Number of overlapping photos Now when we understand various factors affecting side and along overlap, a question arises
‘how many photos on average share a single point on the surface’.
Imagine a researcher says: my method requires 8 photos for generating the best DSM
model. Or the other way: a processing method is displaying a statistics and it shows ‘good’
where we have at least 5 photos per point. We want to have ‘clean’ datasets so when
additional processing anomalies are spotted, we want the statistics to be ‘all green’ in order
to be able to focus on solving the anomaly.
If the linear overlap in some direction is %N , mean distance between any point in the
picture in this direction, is )%100( N− .
In short for any width or height of a picture, we get )%100(
1
N− common points
per unit distance.
If overlap is uniform, in 2D space, we get
2
)%100(
1
− Ncommon points
per unit surface.
Using similar reasoning, having N for side overlap and M for along overlap, average photo
density at any given point of the mosaic is
)%100()%100(
1
MN −⋅−
Now since we remember we can extract all gradients in given directions only with at least
50% overlap, let’s assume we have only 50% along overlap and see how we have to adjust
side overlap in order to get a specific number of photo density.
The formula is symmetric with respect to N and M i.e. side and along overlap. While we
can adjust side overlap by flight planning, along overlap is mostly given by resolution,
therefore a combination of altitude, groundspeed and camera shooting rate.

Page 22/69 Secrets of UAV photomapping www.pteryx.eu
Assuming fixed 50% overlap in one direction,
what is the photo density
0123456789
1011121314151617181920
0% 10% 20% 30% 40% 50% 60% 70% 80% 90% 100%
Side overlap[%]
Nu
mb
er
of
ph
oto
s p
er
po
int
50%
Often stated requirement of having at least 5 photos per pixel is theoretically satisfied by
50% overlap in on direction and 60% in the other (or 55% in both directions – but this
ignores changing crab angle during the flight).
For practical applications a combination of at least 60% side overlap and 60% along
overlap therefore yields the desired good processing statistics for several processing
solutions.
While the formula is symmetric, our liberty to chose side and along overlap is not. Therefore let’s observe the curves that tell us the number of overlapping photos, while fixing one of the overlaps (presumably along overlap, for the reasons mentioned before).
Photo density vs overlap,
for several fixed along overlap choices
0123456789
1011121314151617181920
0% 10% 20% 30% 40% 50% 60% 70% 80% 90% 100%
Side overlap[%]
Nu
mb
er
of
ph
oto
s p
er
po
int
20%
30%
40%
50%
60%
66%
70%
80%
90%

Page 23/69 Secrets of UAV photomapping www.pteryx.eu
11. Number of photos taken and data quantity
It is recommended to use the least compression possible. However, many processing
systems are more convenient using EXIF data from JPG format. Upload time is better when
using some compression. For Canon S90 at typical flight altitude the compression artifacts
are significantly smaller than contrast loss for aviation medium-altitude data.
Assumed shooting rate 3.5s as it requires focusing without any missed data.
Using remote services is limited mainly by upload speed of ADSL connections.
Source data size
Photo size Canon S90 10MPIX [MB]: 3 14
Flight time [min] Photo count JPG photo estd. max size [GB] Raw photo estd. max size [GB]30 515 1.6 7.140 686 2.1 9.450 858 2.6 11.860 1029 3.1 14.170 1200 3.6 16.580 1372 4.1 18.890 1543 4.6 21.1
100 1715 5.1 23.5110 1886 5.6 25.8120 2058 6.1 28.2
Typical upload times: Bandwidth: 512kbps 512kbps 1Mbps 1Mbps 2Mbps 2Mbps 10Mbps 10Mbps
512 512 1024 1024 2048 2048 10240 10240Flight time [min] Photo count JPG time[h] Raw time[h] JPG time[h] Raw time[h] JPG time[h] Raw time[h] JPG time[h] Raw time[h]
30 515 7.3 32.3 3.6 16.2 1.8 8.1 0.4 1.640 686 9.6 42.8 4.8 21.4 2.4 10.7 0.5 2.150 858 11.8 53.7 5.9 26.9 3.0 13.4 0.6 2.760 1029 14.1 64.2 7.1 32.1 3.5 16.0 0.7 3.270 1200 16.4 75.1 8.2 37.5 4.1 18.8 0.8 3.880 1372 18.7 85.6 9.3 42.8 4.7 21.4 0.9 4.390 1543 20.9 96.0 10.5 48.0 5.2 24.0 1.0 4.8100 1715 23.2 107.0 11.6 53.5 5.8 26.7 1.2 5.3110 1886 25.5 117.4 12.7 58.7 6.4 29.4 1.3 5.9120 2058 27.8 128.3 13.9 64.2 6.9 32.1 1.4 6.4
Using RAW data is possible only with exceptional speeds, or locally. Local processing requires
significant investment both in software and manpower. Agreements about placing
processing centers abroad are negotiable with cluster computing service providers.

Page 24/69 Secrets of UAV photomapping www.pteryx.eu
Result data size
There exist offline and online (web based) processing services. Data size matters most for
online methods. Resulting data size is largely independent on resolution and flight altitude,
because as already shown the linear resolution is inversely proportional to altitude. However
because of flight time, one can expect fewer gigapixels (and less along overlap) from high
altitude flight.
For 2h Pteryx flight one gets 5-10GPIX depending on pattern shape. Using RGB encoding,
24bpp, one has about 15-30GB to download if the data is uncompressed. In fact a factor of 5
lossless compression of the output data is usually achieved, leading to input data size being
comparable with output data size. The demand for having DEM roughly doubles the data
quantity.
Typical download times:
RESULTS Bandwidth --> 1Mbps 5Mbps 10Mbps 20Mbps
Ortophoto only kbps 1024 5120 10240 20480kBps 128 640 1280 2560
Flight time [min] Source photo count Time[h] Time[h] Time[h] Time[h]30 515 3.6 0.7 0.4 0.240 686 4.8 1.0 0.5 0.250 858 5.9 1.2 0.6 0.360 1029 7.1 1.4 0.7 0.470 1200 8.2 1.6 0.8 0.480 1372 9.3 1.9 0.9 0.590 1543 10.5 2.1 1.0 0.5100 1715 11.6 2.3 1.2 0.6110 1886 12.7 2.5 1.3 0.6120 2058 13.9 2.8 1.4 0.7
RESULTS Bandwidth --> 1Mbps 5Mbps 10Mbps 20Mbps
Ortophoto and DEM kbps 1024 5120 10240 20480kBps 128 640 1280 2560
Flight time [min] Source photo count Time[h] Time[h] Time[h] Time[h]30 515 7.3 1.5 0.7 0.440 686 9.6 1.9 1.0 0.550 858 11.8 2.4 1.2 0.660 1029 14.1 2.8 1.4 0.770 1200 16.4 3.3 1.6 0.880 1372 18.7 3.7 1.9 0.990 1543 20.9 4.2 2.1 1.0100 1715 23.2 4.6 2.3 1.2110 1886 25.5 5.1 2.5 1.3120 2058 27.8 5.6 2.8 1.4
While the network download/upload time is dominant, this is mostly because of the speed
of processing cluster. Local processing of several km2 might easily take days on the most
powerful PC in existence.
The proposed processing service is state of the art design. Hence one might observe that
sometimes quoted on-site processing is possible only for the smallest areas that typically do
not exceed 0.5km2 with additional restrictions on resolution.

Page 25/69 Secrets of UAV photomapping www.pteryx.eu
12. Flight speed, wind penetration and endurance
Contrary to intuition, wind speed is never ‘helping’ enough to catch up the flight time lost
flying in headwind. An extreme example occurs when airspeed is equal to wind speed. In
such case flying time with the wind is two times shorter, but flying against the wind is not
advancing terrain coverage at all, leading to infinite required flight time.
One must remember official limitation of 7m/s wind speed for using Pteryx.
It is important to note that this figure means wind speed at flight altitude,
what as a best guess is 2-3m/s more than on ground level.
This is a practical rule limited by:
• limited camera shooting rate when flying with the wind at low altitude
• high turbulence and high probability of blurred photos associated with stronger
winds, more pronounced angular movement at high altitude (this is greatly reduced
by platform layout)
• required flight endurance growing to unreasonable periods of time (this is mitigated
by ample endurance reserve)
• less precise parachute planning in case of manually triggered landings
• more risky, less comfortable manual piloting leading to mishaps; forcing using
parachute for landing all the time
The combination of above factors affects all small UAVs. Pteryx is offering balanced ‘failed
mission’ probability evenly distributed among before mentioned factors. The wind speed
limit is a combination of mission planning and luck plus human factors and as such can be
easily exceeded, but it is unreasonable to exceed this limit during regular business
operations for which the machine has been designed.
Let’s assume flying fixed distance with, then against the wind, also taking into account that
for airplane of this size+speed energy consumption rises as third power of airspeed. It can be
clearly seen that flying at high speed is beneficial practically only in manual mode at full
throttle when one must return to base being caught unaware by coming storm (wind speeds
above 8m/s), in this scenario Pteryx is able to cruise at around 22m/s for a few minutes.
Relative energy consumption flying over fixed length terrain,
against then with the wind
100%
150%
200%
250%
300%
350%
400%
450%
500%
0 1 2 3 4 5 6 7 8 9 10
Wind speed [m/s]
Re
lati
ve
po
we
r co
nsu
mp
tio
n [
%] 40km/h airspeed
45km/h airspeed
50km/h airspeed
55km/h airspeed
60km/h airspeed
75km/h airspeed

Page 26/69 Secrets of UAV photomapping www.pteryx.eu
Things get a little more optimistic when we take into account, that flying faster is consuming
more energy, but also the linear distance flown, no matter the wind, is increasing linearly. In
this case, energy consumption per distance flown raises only as a square of airspeed.
Relative energy consumption per ground distance covered, flying over fixed length
terrain, against then with the wind
100%
150%
200%
250%
300%
350%
400%
450%
500%
0 1 2 3 4 5 6 7 8 9 10
Wind speed [m/s]
Re
lati
ve p
ow
er
con
sum
pti
on
[%
]
40km/h airspeed
45km/h airspeed
50km/h airspeed
55km/h airspeed
60km/h airspeed
75km/h airspeed
In this plot we see that flying very light Pteryx at around 40km/h might give 25% efficiency
advantage in totally calm weather with null windspeed at altitude, but because such thing
never happens during daytime, differences in efficiency between unloaded Pteryx and
heaviest configuration with around 4m/s wind speed are almost void. Once again above
around 7m/s it is no more beneficial to continue the mission with Pteryx Pro, with Pteryx Lite
flight time and efficiency becoming very low requiring switching to manual mode and
returning home immediately.
In both cases we see that a hypothetical system flying at 75km/h is largely immune to winds
up to 10m/s, but is horribly inefficient for typical wind speeds when the turbulence is
acceptable, in the region 0-6m/s.
Page 27/69 Secrets of UAV photomapping www.pteryx.eu
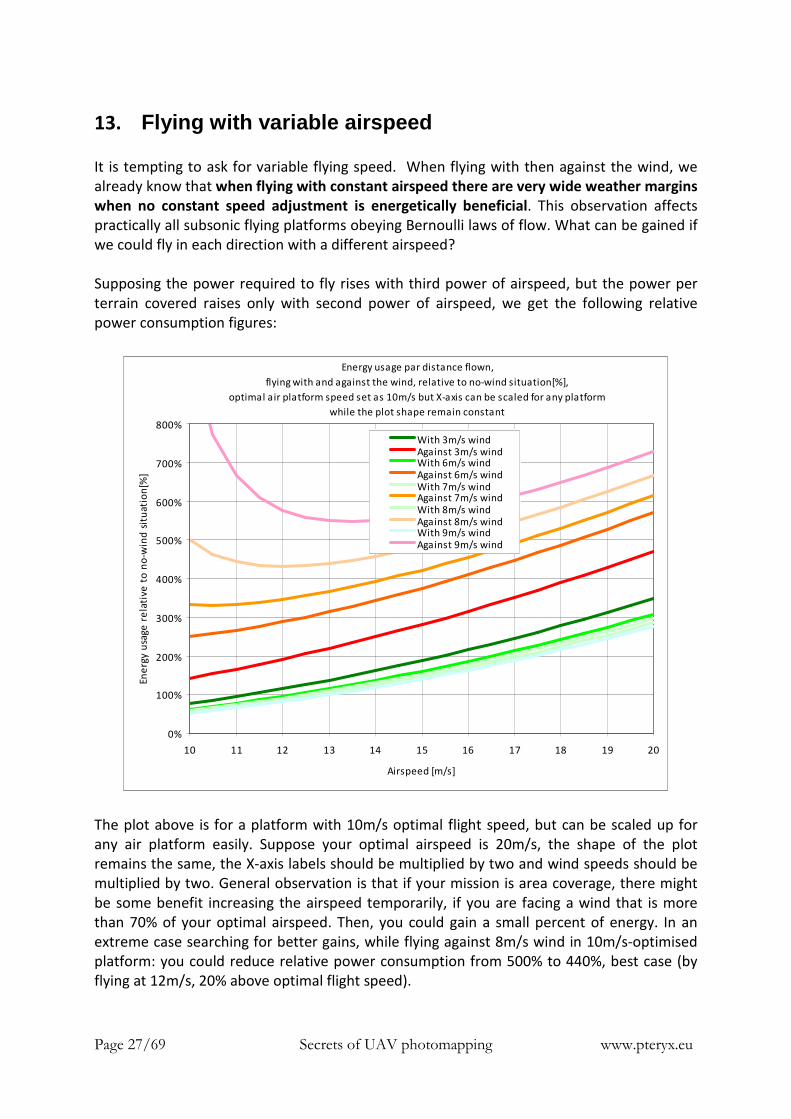
13. Flying with variable airspeed It is tempting to ask for variable flying speed. When flying with then against the wind, we
already know that when flying with constant airspeed there are very wide weather margins
when no constant speed adjustment is energetically beneficial. This observation affects
practically all subsonic flying platforms obeying Bernoulli laws of flow. What can be gained if
we could fly in each direction with a different airspeed?
Supposing the power required to fly rises with third power of airspeed, but the power per
terrain covered raises only with second power of airspeed, we get the following relative
power consumption figures:
Energy usage par distance flown,
flying with and against the wind, relative to no-wind situation[%],
optimal air platform speed set as 10m/s but X-axis can be scaled for any platform
while the plot shape remain constant
0%
100%
200%
300%
400%
500%
600%
700%
800%
10 11 12 13 14 15 16 17 18 19 20
Airspeed [m/s]
En
erg
y u
sage
re
lati
ve
to
no
-win
d s
itu
ati
on
[%]
With 3m/s windAgainst 3m/s windWith 6m/s windAgainst 6m/s windWith 7m/s windAgainst 7m/s windWith 8m/s windAgainst 8m/s windWith 9m/s windAgainst 9m/s wind
The plot above is for a platform with 10m/s optimal flight speed, but can be scaled up for
any air platform easily. Suppose your optimal airspeed is 20m/s, the shape of the plot
remains the same, the X-axis labels should be multiplied by two and wind speeds should be
multiplied by two. General observation is that if your mission is area coverage, there might
be some benefit increasing the airspeed temporarily, if you are facing a wind that is more
than 70% of your optimal airspeed. Then, you could gain a small percent of energy. In an
extreme case searching for better gains, while flying against 8m/s wind in 10m/s-optimised
platform: you could reduce relative power consumption from 500% to 440%, best case (by
flying at 12m/s, 20% above optimal flight speed).

Page 28/69 Secrets of UAV photomapping www.pteryx.eu
Same plot for Pteryx Pro, now the plot shape is different at first look because we haven’t
plotted the bands representing wind speeds as high as 80% of the optimal speed. In fact it is
identical to scaling the previous plot X-axis by 140% and changing wind speed labels:
Energy usage par distance flown,
flying with and against the wind, relative to no-wind situation[%],
optimal air platform speed set as 14m/s (Pteryx Pro)
0%
50%
100%
150%
200%
250%
300%
350%
400%
450%
500%
14 15 16 17 18 19 20 21 22 23 24
Airspeed [m/s]
En
erg
y u
sage
re
lati
ve
to
no
-win
d s
itu
ati
on
[%]
With 3m/s windAgainst 3m/s windWith 6m/s windAgainst 6m/s windWith 7m/s windAgainst 7m/s windWith 8m/s windAgainst 8m/s windWith 9m/s windAgainst 9m/s wind
We have to add the definition of optimal airspeed: it is the speed at which airship can fly the
maximal distance. This is a global optimum; in the sense flying either slower or faster than
optimal airspeed, will guarantee flying shorter distance relative to air mass. Therefore
flying at lower airspeed with the wind is not saving any energy; we can only use the bonus
wind speed in order to travel over terrain a little faster.
Flying slower with the wind could only increase the flight time, as minimal descent rate is
corresponding to airspeed a little lower than the optimal airspeed, therefore such strategy is
used by glider pilots looking for thermals. It is useless for mapping UAV as we cannot afford
deviating from prescribed flight path.
We have demonstrated, that even temporary changes of the cruising airspeed in flight are
not beneficial for any mapping airplane, except when the wind speed exceeds around 70%
of its optimal cruise speed. At those conditions, however, covering the terrain against the
wind is already 340% more energy-consuming than in calm weather, making this flight
regime useless in practice due to low endurance, low area coverage, potential of blurred
photos due to turbulence and also often associated varying lighting conditions due to fast-
moving low altitude clouds.
As a result, Pteryx flies at constant, optimal airspeed and we are sometimes refusing naïve
requirements for varying the airspeed.

Page 29/69 Secrets of UAV photomapping www.pteryx.eu
14. Crab angle
The crabs are nice animals that walk ‘sideways’ on their path. All winged aircrafts always do
the same in order to maintain straight path over terrain. What is not intuitive from ground
perspective is that winds at altitude never vanish and every platform in fact always tries to
fly with its optimal speed into the air, the groundspeed and course being merely side-effect
of air mass moving over terrain. The effect affects not only all winged platforms, but also
helicopters and multicopters, since the latter also have the preferred direction in which they
fly more efficiently.
Surprisingly, multicopters are never fully symmetric because even using counter-rotating
propellers means one is working in propwash of the other, the upper propeller working
typically in more favorable condition. Even when the airflows equalize during hover, the
propwash of leading pair of propellers creates different lift conditions for the rear ones
depending on combination of their turning directions. As a result even in quadcopters, once
you have a platform that is fully mastered, measured and optimized, you still have a
preferred direction of flying what is reflected in internals of the autopilot.
Deviating the optimal fuselage direction form flight path ‘just enough, only minimally’ to
maintain course over ground is exactly the source of crab angle. There is no ‘cheating’
about it.
In Pteryx UAV, there is a unique option of rotating the whole pattern automatically in
flight, after a wind direction is detected overhead. However, it must be noted, the strategy
works only for regular, almost-square patterns otherwise the area covered might change
drastically. Just imagine preparing to map a road then rotate the pattern. Rotating the leg
orientation is not an option either, as the number of legs and time spent on turns rises
dramatically with increasing leg number, as shown before. The option of automatic rotation
allows reducing crab angles to a few degrees. During a typical mission, however, one flies
with a noticeable crab angle depending on wind direction that cannot be eliminated.
Worst-case example of crab angle: the wind
blows from one side, exactly 90 degrees
from desired flight path
Side overlap reduction due to crab angle.
The width of photographed strip diminishes,
reducing surface yield.
Along-overlap is similarly affected, mean
photo witdh and height are reduced.

Page 30/69 Secrets of UAV photomapping www.pteryx.eu
Before, we have analyzed the case when the wind blows along flight legs, what might
prevent the mission from terminate successfully because of lack of energy. What happens
when the fuselage is not exactly parallel to flight path and the camera is fixed to it? The
photos are rotated.
This has two consequences:
• Pre-flight: the turned images mean that average width of photographed area
diminishes and in order to maintain the same side overlap required for processing
software, one might be forced to diminish leg spacing in advance.
Is it worth the pre-flight planning effort? (NO)
• Post-flight: some image mosaicking software designed for ground work might have
trouble mosaicking the data. Can it be eliminated? (NO)
Crab angle[deg] resulting from side wind speed[m/s], for different airspeeds[km/h]
0
10
20
30
40
50
60
70
80
90
0 1 2 3 4 5 6 7 8 9 10 11
Side wind speed [m/s]
Cra
b a
ngl
e [
de
g]
40
45
50
55
60
75
What we see that for operational wind speeds, the crab angle is never vanishing even for
hypothetical, otherwise inefficiently fast, flying system. In fact you can use the crab angle as
visual indication that the wind speed is getting too strong and the plane will most likely
not finish its mission because of lack of energy.
For example, when you have a Pteryx Lite tuned at 40km/h and see a crab angle of 40deg,
you are sure the wind is at least 7m/s, or it could be more if the wind is not 90degrees to the
programmed flight path (what is very often the case). Obviously 40km/h is 11m/s, crab
angle approaches 90deg for 11m/s wind speed and then the plane cannot advance along its
flight path. At this point taking manual RC control and speeding up to 22m/s or deploying a
parachute immediately is the safest option.
For Pteryx Pro with typical load at 50km/h, 30deg is the visual indication of approaching
recommended safe usage limits (7m/s).
A hypothetical system flying at 75km/h still exhibits important 20deg crab angle in 7m/s side
winds, so there is no way to make the effect negligible without resorting to jet propulsion.

Page 31/69 Secrets of UAV photomapping www.pteryx.eu
You cannot reduce crab angle to a few degrees in non-cooperating weather without using
airplane that flies like a rocket (say 200-300km/h) and takes off/lands like a brick, with all
consequences for reliability and endurance. As a result all UAV-compatible mosaicking
systems are accepting wide range of crab angles, by design. This is not affecting the final
map quality, but is a restriction on available processing methods.
The software made for real planes flying several times faster often omits this effect, being
not easily adaptable to relatively slowly flying objects.
How it affects required mission time? Along-photo overlap is equally affected as side-overlap
(rotating a photo reduces its average length and width); however there are ample margins
on along-overlap thanks to high camera shooting rates. Side overlap, however, might need
to be pre-adjusted in advance for worst case weather, if the effect is judged to be significant.
Photo strip width loss [%] resulting from side wind speed[m/s], for different airspeeds[km/h]
0%
5%
10%
15%
20%
25%
30%
0 1 2 3 4 5 6 7 8 9 10 11
Side wind speed [m/s]
Photo
str
ip w
idth
loss
[%
]
40
45
50
55
60
75
From the plot above we can deduce that in the worst case operational conditions, Pteryx Pro
flying at 50km/h, 7m/s wind speed flying directly side to flight pattern, the loss of overlap is
about 12%.
For a hypothetical system flying at 75km/h the loss is still in the order of 7%.
Mathematically, in order to counter 12% overlap loss due to side-wind induced crab angle,
you should diminish leg spacing by said 12%. This would result in 12% surface coverage per
unit of time reduction. In practice, the margins of acceptance for overlap are wide:
Suppose one requests 60% overlap, reduced by as much as 12% there is still 52% overlap
remaining. If one requests 80% overlap, reduced by as much as 12% there is still 70% overlap
remaining, all worst case. All this is not a problem for processing software we have tested.
Conclusion: crab angle has negligible impact on endurance due to flexibility of processing
methods. We are not aware of any system adjusting the flight leg spacing because of side
wind speed and we do not recommend doing so, as when needed, one can reduce crab
angle in Pteryx UAV by turning the whole pattern in flight – if the area is a square.
A significant difference between overlap loss due to rolling plane and due to crab angle is
that crab angle produces quasi-constant, limited loss without localized map geometry
degradation/distortion, while roll due to turbulence plus usually required tight navigation
has significantly larger range (can eliminate overlap completely) and has random nature.
Therefore roll axis is stabilized while yaw axis doesn’t have to be, what would lead to
oversized fuselage and unreliable mechanics.

Page 32/69 Secrets of UAV photomapping www.pteryx.eu
15. Reducing crab angle vs reducing crab angle changes Let’s analyze more general case, when the wind can blow at any angle to the desired flight
path (course over ground, or simply course between waypoints).
Cra b a ngle vs wind di rection for di fferent wind speeds , a irspeed 14m/s
0.0
10.0
20.0
30.0
40.0
50.0
60.0
70.0
80.0
90.0
0 10 20 30 40 50 60 70 80 90
Wind direction vs desired course over ground
Cra
b a
ngle
[de
g]
1 m/s wind
2 m/s wind
3 m/s wind
4 m/s wind
5 m/s wind
6 m/s wind
7 m/s wind
8 m/s wind
9 m/s wind
10 m/s wind
11 m/s wind
12 m/s wind
13 m/s wind
14 m/s wind
Assuming 14m/s flight speed, once again we see that the crab angle is the largest with the
wind blowing exactly sideways to flight legs. We know that we can rotate the flight pattern
automatically in flight along the wind direction in order to bring the crab angles near zero.
However, if the flight direction changes typically 10deg during even 0.5h flight, we can
witness extra 0-6deg crab angle reappearing (see orange line, 7m/s). We know from
previous chapters this cannot be countered by increased airspeed without increasing takeoff
complexity and landing damage.
What is a little counterintuitive, flying with maximum crab angle significantly reduces crab
angle changes due to wind direction change: you can see that the plot is nearly flat for wind
speed vs course close to 90 deg. Since the initial wind estimation is never perfect anyway,
because of requested overlap we cannot change the pattern rotation further during the
flight, it is an option to consider flying this way if the processing software requires limited
yaw angle changes yet the absolute value of the photo rotation is less important.
One has to remember that while wind direction remains nearly constant in practice, the
wind speed has occasional periods of limited speed much like holes in the wind speed. This
translates to worse flight tracking and some inevitable pitch angle oscillations when flying
with high crab angles (flying into the wind that is not parallel to flight line).

Page 33/69 Secrets of UAV photomapping www.pteryx.eu
Flying Pteryx Pro at around 14m/s we have the following flight time increase depending at
what angle the wind happens to blow, relative to leg direction. Please note this plot is
naturally periodic beyond 90deg: we assume flying both ways with constant speed, crab
angle is only reducing side component of the wind, therefore it doesn’t matter if the along-
path wind component is locally helping or disturbing since we fly both ways.
Fl ight time increase both wa ys vs wind direction for di fferent wind s peeds , a i rspeed 14m/s
100%
200%
300%
400%
500%
600%
700%
800%
0 10 20 30 40 50 60 70 80 90
Wind direction vs desired course over ground
Fli
gh
t ti
me
in
cre
ase
[%
]
1 m/s wind
2 m/s wind
3 m/s wind
4 m/s wind
5 m/s wind
6 m/s wind
7 m/s wind
8 m/s wind
9 m/s wind
10 m/s wind
11 m/s wind
12 m/s wind
13 m/s wind
From the plot above, it is clear that linear distance will be covered faster flying with side
wind (angle difference around 90deg).
It would be a good idea to plan 1-leg go+return flight side to the wind for max area coverage
or record-braking purposes. For safety reasons however we prefer such missions to be
planned against then returning with the wind, since the wind speed might increase during
the flight. This way you will assure the wind will be helping to return home.
Unfortunately, the whole idea has one serious drawback: you cannot rotate a river to be
mapped or a road to match the wind direction.

Page 34/69 Secrets of UAV photomapping www.pteryx.eu
The practical application of the plot is that since ground-level wind direction will vary
typically up to 45deg from cruise altitude wind direction, you can guess from the plot
associated flight duration increase. While Pteryx is analyzing its battery status and will
return in case of problems, looking at the plot you are avoiding one more surprise from the
ground perspective.
We repeat the previous plot in larger scale for better readout:
Fl ight time increase both wa ys vs wind direction for di fferent wind s peeds , a i rspeed 14m/s
100%
110%
120%
130%
140%
150%
160%
170%
180%
190%
200%
0 10 20 30 40 50 60 70 80 90
Wind direction vs desired course over ground
Fli
gh
t ti
me
in
cre
ase
[%
]
1 m/s wind
2 m/s wind
3 m/s wind
4 m/s wind
5 m/s wind
6 m/s wind
7 m/s wind
8 m/s wind
9 m/s wind
10 m/s wind
11 m/s wind
At extreme operational conditions of 7m/s and 14m/s cruise speed:
* with parallel wind the terrain is covered only 33% slower than without the wind
* with side wind and max crab angle, the flight will be 18% longer than without the wind

Page 35/69 Secrets of UAV photomapping www.pteryx.eu
Inspired by the plots before, one could ask flying with max crab angle all the time in order to
increase terrain coverage for all patterns. Unfortunately, one has to include overlap loss due
to rotated camera. Because of the cosinus law, unfortunately, side overlap loss due to crab
angle is exactly nullifying any potential ground speed increase when flying with said crab
angle. On the other hand, shorter flight per leg leaves less time to change lighting conditions
along the flight leg, if post-processing method is allowing large crab angles. But there will be
more flight legs due to reduced side overlap.
If you plan your mission leg spacing correctly, including the wind speed into calculation, you
will have the same flight time for all direction of flight vs wind speed when you fly in both
directions. In those optimally planned conditions flight time increase is the following:
Fl ight time increas e corrected for reduced s trip width due to crab angle,
both ways , is independent on wind di rection, for di fferent wind s peeds , a i rspeed 14m/s
100%
150%
200%
250%
300%
350%
400%
0 1 2 3 4 5 6 7 8 9 10 11 12
Wind speed[m/s]
Fli
gh
t ti
me
in
cre
ase
[%
]
The plot is made by connecting the dots for wind exactly parallel to flight lines (angle=0 deg),
from the plots before.
As usually, up to Pteryx operational conditions of 7m/s wind, no more than flight time 33%
increase will be witnessed, if the leg spacing was optimized for the wind speed. This is
however rarely done: we recommend flying in reasonably small wind and using constant
leg spacing (dictated by requested side overlap) for best results, using Pteryx surplus
endurance for easier life.

Page 36/69 Secrets of UAV photomapping www.pteryx.eu
16. Battery count vs payload and endurance
In Pteryx Pro, you can fit up to 3 batteries under the wing and additional one in rotating
head. The user has to paralellize LiPo 3S batteries, they are produced by different
manufacturers, have different connectors (Pteryx uses Deans T-shape connectors). Batteries
in the range of LiPo 3S 4.8Ah to 5.8Ah are available, pick brand name 20C ratings or budget
30C rating. When using single or double battery and max payload, brand name LiPo and 30C
rating is required for comfortably safe takeoff thrust, also in manual mode. Using a single
battery may shorten its life, if the plane is carrying heavy load that requires long climb time.
It is important to parallelize only batteries of the same internal resistance (same brand,
make and if possible, same batch). What you obtain is designated 3S2P, 3S3P or 3S4P (3 in
Series, 2..4 in Parallel).
In Pteryx Lite, 2 batteries fit in belly and one optional in camera head. However Pteryx Lite
takeoff weight from hand is 4kg and the empty weight is also smaller due to smaller belly,
lack of tow hook, lack of takeoff buttons+dials and lack of parachute. Pteryx Lite data is not
included in those plots but the endurance is roughly half of Pteryx Pro because of better
gliding properties that are limiting the handicap of limited battery compartment and small
takeoff weight required for hand launching.
Trying to keep minimal payload and max endurance one has the following mass distribution:
Takeoff weight vs number of cells, minimal payload 450g
0
500
1000
1500
2000
2500
3000
3500
4000
4500
5000
1 2 3 4Number of 5Ah 3S LiPo cells (4th cell in head)
AU
W[g
] Payload[g]
Battery weight[g]
Empty weight[g]
N cells Battery capacity [Ah] Empty weight[g] Battery weight[g] Payload[g] AUW[g]
1 5 2750 383 450 35832 10 2750 575 450 37753 15 2750 1150 450 43504 20 2750 1533 450 4733

Page 37/69 Secrets of UAV photomapping www.pteryx.eu
Using maximum takeoff weight one has the following mass distribution:
Takeoff weight vs number of cells, maximum payload
0
500
1000
1500
2000
2500
3000
3500
4000
4500
5000
1 2 3 4Number of 5Ah 3S LiPo cells (4th cell in head)
AU
W[g
] Payload[g]
Battery weight[g]
Empty weight[g]
N cells Battery capacity [Ah] Empty weight[g] Battery weight[g] Payload[g] AUW[g]
1 5 2750 383 1867 50002 10 2750 575 1675 50003 15 2750 1150 1100 50004 20 2750 1533 717 5000

Page 38/69 Secrets of UAV photomapping www.pteryx.eu
Experimentally found endurance figures for max endurance setup are:
Endurance vs number of cells, minimal payload 450g
0
10
20
30
40
50
60
70
80
90
100
110
120
1 2 3 4Number of 5Ah 3S LiPo cells (4th cell in head)
Fli
gh
t d
ura
tio
n[m
in]
Endurance[min]
Endurance[min]-10min reserve
For max payload setup, the endurance is limited:
Endurance vs number of cells, maximal payload
0
10
20
30
40
50
60
70
80
90
100
110
120
1 2 3 4Number of 5Ah 3S LiPo cells (4th cell in head)
Flig
ht
du
rati
on
[min
]
Endurance[min]
Endurance[min]-10min reserve
In general, the following curve relates payload to endurance. Minimal payload is 450g
because of the need to have proper center of gravity. This is more than single Pteryx Pro
camera setup which weights around 280g. In general max useful payload is around 1kg.
Endurance vs payload
0
20
40
60
80
100
120
450 550 650 750 850 950 1050 1150 1250 1350 1450 1550 1650 1750 1850
Payload[g]
Fli
gh
t d
ura
tio
n[m
in]
Flight endurance[min]
Flight endurance[min]-10min reserve
Exceeding battery load is neither safe (difficult handling, less resistant to crash landing) nor
beneficial (max flight time remains constant as wings operate in suboptimal conditions).

Page 39/69 Secrets of UAV photomapping www.pteryx.eu
17. What if the motor stops working in the air
In general, nothing serious but one must have pre-planned action for that.
One must note that due to the fact the motor operates at 30-40% of its max power during
flight, its lifespan counts into thousands of flying hours, probably much more. It is protected
from dirt, requires no greasing and is probably the most robust element of the plane. This is
a huge contrast to gas engines which require pre-storage maintenance, retuning before new
season, checking after transport etc.
Atop of that, Pteryx electronic components have 200-300% power safety margins so the
functioning of the propulsion is assured even in hot climate. Therefore in 100% of cases we
assume for operational purposes: when motor stops working in the air it is because it has
been ordered to do so.
Motor cutoff can occur because of:
• autopilot detecting low battery status
• brushless motor controller itself detecting insufficient correlation of RPM vs input
power (physical obstacle, decomposed propeller, disconnected motor power cable)
• brushless motor controller detecting low battery status before the autopilot detects
it (rare case only in extreme heat, the autopilot detects it by altitude drop)
• strong radio interference from external sources causing the plane to switch to
manual mode with throttle off, as a result of initial operator’s mistake to set wrong
fail-safe settings on the RC transmitter
First of all, the system has a range of protections in the autopilot that direct the plane to
takeoff position when the battery level is nearing to depleted. There are other protection
logic like flight time, distances and various altitudes, all of them are custom and can be
adjusted to reflect exactly user’s mission profile and battery setup.
Finally, the autopilot cuts off the motor at extreme low voltage no matter the plane position
but continue navigating. It will remain able to glide for another 2-8 hours should it be sucked
by extreme thermal updrafts. Moreover, after a few minutes of gliding, part of the battery
energy restores and it is possible to use a few s bursts of throttle when landing in manual
mode.
At that point it is still possible to take manual RC control, deploy the parachute at distance,
or just wait until it glides home at lower altitude than usually.
When gliding one can assume 10:1 glide ratio (L/D or Lift/Drag ratio), it means exactly 1m
altitude lost for every 10m flown when gliding. This is a pessimistic assumption for safety
purposes. The ratio mentioned is much worse than for a full-scale glider (competition SZD-56
Diana around 48:1, trainer SZD-50 Puchacz around 30:1) but not worse than best small scale
RC gliders (some 16:1 to 12:1) – the reason is the same as when explaining low rotorcraft
efficiency, small relative size of flying surfaces compared to mean air particle distance,
relatively less smooth surfaces etc. Pteryx layout is extending the safety using classic layout
that provides good efficiency during both powered and unpowered flight. For example,
flying wings when unpowered, fly far from their optimal speed and have much worse
efficiency.

Page 40/69 Secrets of UAV photomapping www.pteryx.eu
How high you need to fly in order to make sure the plane glides back if you know the wind
speed at altitude?
Glide distance[km] from altitude[m] vs windspeed[m/s]
0.000
1.000
2.000
3.000
4.000
5.000
6.000
0 100 200 300 400 500 600
Initial glide altitude above takeoff ground[m]
Gli
de
dis
tan
ce
un
til
50
m a
ltit
ud
e r
eac
he
d[k
m] Max distance flown[km] no wind
Max distance flown[km] against 1m/s wind
Max distance flown[km] against 2m/s wind
Max distance flown[km] against 3m/s wind
Max distance flown[km] against 4m/s wind
Max distance flown[km] against 5m/s wind
Max distance flown[km] against 6m/s wind
Max distance flown[km] against 7m/s wind
It is clear that from below 200m altitude with strong wind and even from 300m in
exceptional cases, the ‘maximum safety’ mission radius must be limited or additional risk to
be accepted. We assume gliding until 50m altitude above takeoff point; at that point one
must prepare for manual landing (1-3 full turns remaining) or deploy the parachute
immediately.
Additional reason for 50m limit: 30m is the height of many trees or constructions.
Even if they are not hit, they create severe local air turbulence and can obscure the plane.
Glide distance[km] vs windspeed[m/s], for given initial altitude[m]
0.000
0.250
0.500
0.750
1.000
1.250
1.500
1.750
2.000
2.250
2.500
2.750
3.000
3.250
3.500
3.750
4.000
4.250
4.500
4.750
5.000
5.250
5.500
0 1 2 3 4 5 6 7Winds speed[m/s]
Gli
de
dis
tan
ce
un
til
50
m a
ltit
ud
e r
each
ed
[km
]
100
122
140
200
280
420
560
Here we have selected typical altitudes corresponding to round ground pixel resolutions.
It is clear that the chase for the smallest pixel sometimes eliminates one backup chance of
recovery (gliding home). The conclusion is that using automatic parachute deployment is
necessary for long range high resolution missions. Pteryx battery failure recovery strategies
are therefore very safe compared to rotorcrafts or other less glide-capable platforms.

Page 41/69 Secrets of UAV photomapping www.pteryx.eu
18. Flight safety
Active safety
• The pilot can deploy a parachute using old-fashioned and very reliable RC transmitter
• The autopilot can deploy the parachute by itself upon detecting serious anomaly or
low altitude
• Manual flying as RC plane is possible and easy: special wing design prevents stalling;
the plane is very agile for its size, has strong turbulence damping and very strong
positive stability. Backup steering method is often requested by the laws, i.e. in
Germany.
Passive safety
• Low kinetic energy: worst-case damage is limited and in par with smaller platforms,
thanks to keeping limited flying speed for its weight.
• Propeller configuration prevents impacting into target first, less breaking force; user’s
hands are far from propeller in all phases of takeoff.
• Stabilized head is controlled crash zone, sliding into the fuselage.
• Wings are large but do not cut obstacles, they break from the fuselage dissipating
energy into rotational motion and breaking the nylon screws.
• Pitot tube never remains obscured by the rain, dust or bugs because there is none!
• The surfaces do not deform in the rain, the only wooden part is plastic-covered
horizontal stabilizer; once the weather clears, there are no surprises during takeoff
• The plane is light, but relatively large. For good business return you really want to
have a backup steering option, one that bypasses all things that might get wrong on
communication channels, modems, laptop and event the autopilot. Manual RC
control provides just that, and is using proven technology with 30-years operational
history. But you must be able to tell plane orientation and distance from takeoff
location.
The absence of Pitot Tube, used for measuring airspeed, requires additional explanation.
Contrary to intuition, the role of airspeed sensor in autopilots is not as much for controlling
airspeed, but for assuring the orientation sensor can detect properly the horizon line. If Pitot
Tube is obscured in flight in any way, or the connecting tubing fails, it is inevitable that
during deep turn the plane will not be able to sense if the plane is spiraling down (even in a
full scale real plane, you can make a roll without spilling coffee therefore sensing gravity
without kinematic model is not enough). A failure of this sensor is practically a guarantee of
heavy crash if we let the plane loiter at some point of mission, sometimes just for one turn.
This can occur during heavy rain; also a bug or dust can enter the tube during takeoff making
it one more failure point.
The autopilot used in Pteryx is a custom design which incorporates the airplane kinematic
model, making Pitot Sensor not necessary for this platform. Knowing the risks associated
with failure of such sensor inspired us to make extra effort on delivering you both the
autopilot and the platform – with one less thing to worry about.

Page 42/69 Secrets of UAV photomapping www.pteryx.eu
Visual identification
The plane is always darker than the sky (since the light source always passes the clouds from
above) and is itself a low-contrast object. The difference between painting the plane in black
and white is almost insignificant, while painting on bright and contrasted colors makes
finding the plane in high grass much easier. White color is also preventing overheating the
surfaces and preserves their geometry on the sun, is therefore preferred color in aviation.
The major source of orientation for the RC pilot is plane shape and size.
Pteryx UAV has distinct shape that among other features supports vertical placement of RC
transmitter antenna, extending the RC range, but also providing easy flight direction
identification:
The sequence above is what the RC pilot is able to see at about 1km distance. It is hard to
tell the difference with slightly outgoing flight and ingoing flight, as with all RC planes. The
only solution is to have naturally stable plane that keeps flying straight and level once sticks
are released, giving you time to guess flying direction what can take up to 5-10s of
observation at extreme range cases. Please note that identifying a quadcopter or flying wing
in similar conditions would be completely impossible, therefore eliminating one more
steering option.
The sequence above shows real advantage of Pteryx layout: you can tell quickly if a
dangerous situation is developing because you can tell if the plane is flying up or down.
When it falls for some reason, the fuselage becomes straight line giving a hint to open the
parachute manually, or correct your manual flying.
For comparison, see two typical flying wing designs with 1m wingspan drawn in the same
scale as Pteryx and large industrial quadcopter with similar payload but half the endurance.
None of them offer fully manual recovery piloting mode at this distance and visual
confirmation of their orientation is not possible without groundstation, despite being within
visual range.

Page 43/69 Secrets of UAV photomapping www.pteryx.eu
With Pteryx we have witnessed surprisingly good visual identification distances. We compare
the experimental results for Pteryx UAV to extrapolated down to hypothetical 1m wingspan
Pteryx, therefore assuming the same, ID-favorable shape. Note: the flight altitude is 300m,
altitudes below 150m tend to produce ‘flat image’ impression and reduce flyable distance in
manual mode.
Without additional spotter, immobile pilot/operator, 300m AGL, flat visual distances:
Object Traceable distance Comfortably flyable
in assisted mode
Comfortably flyable
in manual mode
Pteryx UAV, clear
weather
1700m 1400m 1200m
Pteryx UAV, late
afternoon, imperfect
visibility
1200m 900m 600m
1m ‘nano-pteryx’,
clear weather
600m 500m 430m
1m ‘nano-pteryx’,
late afternoon,
imperfect visibility
400m 350m 300m
It should be noted that using optical aid like binoculars is not really helpful in practice if the
binoculars are not high-end, optically stabilized and do not have adjustable zoom, the
reason is that one must find a reference point at small zoom then close-up and follow a
small object with large zoom (there are no references on clear sky). Besides, the laws usually
forbid using optical aid in determining visual range, what is compatible with operational
practice. It is much more practical having secondary observer at edges of flying field that
simply notifies the pilot in case of dangerous situation, in which case the pilot simply opens
the parachute before a problem develops.
For the same reason, enhancing ‘visual range’ with FPV (First Person View, wireless link) is
pointless as it is forbidden to be used by the laws. It also creates tunnel vision and very
limited situational awareness, is active RF interference source, one more component to fail,
consumes power and most of all, requires one more operator besides the one using his
own eyes. Also, the frequencies used in video transmitter (GHz) are higher than we
recommend for RC control (MHz) therefore interfere more on obstacles: as a result first you
lose video control, then the plane hides visually behind an obstacle (straight Line of Sight),
then (several km away) you lose active parachute and autopilot+RC assisted steering control,
at the end the plane is still navigating by itself monitoring safety parameters and flight plan.
Conclusion:
Pteryx remains within visual range without moving the observer up to 1.7km away what
allows flying 2.4x2.4km mission that yields well above 5km2 map surface because of
photo-margin around flight path.
With a single complementary observer and/or moving pilot, the UAV having a parachute,
one can easily manage airspace separation up to 3-4km from takeoff point without much
effort and without using a car for transport. It is possible to put the UAV in loiter at any
given time using RC transmitter while the operator and observer transit to better spotting
place, while mission termination logic is supervising remaining distance and endurance the
whole time.

Page 44/69 Secrets of UAV photomapping www.pteryx.eu
At worst case if you get lost in a bush, you will find your Pteryx Pro at takeoff position,
parachuted.
Pteryx Lite would loiter around takeoff position until battery ends, then would glide down in
shallow turn usually causing no major harm to anybody, but could become damaged if hits a
tree.
Kinetic energy of selected objects
240
416511
425 450 454
4467
0
500
1000
1500
2000
2500
3000
3500
4000
4500
Kin
eti
c energ
y [K
J]
Pteryx Lite UAV 2.8m 3.6kg 42km/h
Pteryx Pro typical load 2.8m 4.4kg 50km/h
Pteryx Pro full load 2.8m 5kg 52km/h
Fast 'flying wing' UAV 1m 2kg 75km/h
White Stork 2m 4kg 55km/h
A boy on a bicycle 30kg 20km/h
Military gas powered UAV 4m 21kg 75km/h
Not only Pteryx UAV has similar kinetic energy to birds or smaller UAV, but its size means
that upon impact components can start rotating motion dissipating the energy.
It has to be remembered that even the modest UAV can entangle in forward control lines of
a paraglider leading it to stall and irrecoverable loss of altitude, which leads to the
conclusion that all together: manual flying capability, autopilot-assisted manual flying
capability, operator not tied to the groundstation, easy visual identification and possibility
to open parachute all form a set of options for non-registered air traffic avoidance.
Pteryx UAV aerodynamic concept is highly self stabilizing and vertically asymmetric, meaning
even if the most unthinkable damage occurs in flight, it never falls down like a bomb.
As a result the speed is not increasing dramatically.

Page 45/69 Secrets of UAV photomapping www.pteryx.eu
19. Clearing the obstacles In real life, we are flying from an open terrain, as flat as possible for having manual landing
option, soft (for minimal damage during parachute landing).
Typically a football stadium is too small: the reason it is very uncomfortable to control
visually the plane with high obstacles around you.
Obstacle clearance angle
Depending on obstacle height, distances from the transmitter/observer and flight altitude,
different effects limit the operation of mapping UAVs.
It turns out that the visual range in clear weather is much higher that the distance you can
afford flying a low level mission.
Subjectively, we have selected the following classes of obstacles required for safe operation:
• obstacle height 2m (car or persons) 200m away
• obstacle height 15m (tall forest, medium buildings) 200m away
• obstacle height 25m (10-story building) 200m away
We use the following empirical data for RC control range, transmitter antenna facing side to
the plane (almost vertical, optimal range, transmitter held high at hands away from the body
or placed on metal roof of the car):
Empirical reliable RC reception range, vertical antenna
0.0
0.5
1.0
1.5
2.0
2.5
3.0
3.5
4.0
4.5
5.0
0 50 100 150 200 250 300 350 400 450 500
Flight altitude [m]
Dis
tan
ce [
km
]
Best MHz RC system
Best 2.4 GHz RC system
Average MHz RC system
We have always observed serious range degradation for 2.4 GHz systems close to ground.

Page 46/69 Secrets of UAV photomapping www.pteryx.eu
Subjectively, we have selected the following clearance angle values required for safe
operation:
• 35/40/41/72 MHz RC transmitters are supposed to operate within line of sight, when
hold up, can operate without degradation over straight line, 2 deg clearance angle
required (it is good to avoid reflected wave sources like trees behind the transmitter)
• 2.4GHz RC transmitters and eventual wireless video links are badly affected and
interfere on leaves and bushes. 10 deg clearance angle required.
• Manual control requires comfortable visual spacing to the object, leaving time for
maneuvering. 15 deg clearance required.
Safe RC range distance for the best MHz transmitters in presence of obstacles(active RC control+parachute,f light modes), 2 deg clearance
0
500
1000
1500
2000
2500
3000
3500
4000
4500
100 150 200 250 300 350 400 450 500
Flight altitude[m]
Saf
e R
C ra
nge[
m]
A car 200m aw ay
A house or a forest 200m aw ay
A city, 10-story building 200m aw ay
MHz range systems are best, even if you don’t see the plane, you can still order it to go
home, set locally in loiter mode or open a parachute.
Safe RC range distance for the best 2.4GHz transmitters or w ireless video in presence of obstacles(active RC control+parachute,f light modes or FPV), 10 deg clearance
0
200
400
600
800
1000
1200
1400
1600
1800
100 150 200 250 300 350 400 450 500
Flight altitude[m]
Saf
e R
C/v
ideo
rang
e[m
]
A car 200m aw ay
A house or a forest 200m aw ay
A city, 10-story building 200m aw ay

Page 47/69 Secrets of UAV photomapping www.pteryx.eu
No matter if you have potentially available high-power video transmitter, its range is limited
by surrounding obstacles. We are not recommending fitting Pteryx with wireless video, but
the user can install it.
Safe visual range distance for manual RC flying in presence of obstacles(full manual f lying), 15 deg clearance
0
200
400
600
800
1000
1200
1400
1600
1800
2000
100 150 200 250 300 350 400 450 500
Flight altitude[m]
Saf
e vi
sual
rang
e[m
]
A car 200m aw ay
A house or a forest 200m aw ay
A city, 10-story building 200m aw ay
You can fly Pteryx in assisted mode. That means you keep the autopilot enable, while usual
rudder and elevator controls change plane turning direction and altitude. It is a good thing,
considering that plane visual range is mostly limited by surrounding obstacles, not the
atmosphere. It is wise to always position yourself in such a way that you can see the plane at
all times. Even if the laws are locally relaxed, keep visual distance as a rule.
Pteryx UAV is offering both mission preview and log output in Google Earth in 3D.
It is important to verify clearance angles in advance. In this specific case we have added DSM
reconstruction of the forest in order to warn you that imprecise terrain model usually hides
important obstacles, therefore you must plane with ample operational margins.
Since the plane loiter diameter is around 120m, the comfortable, safe feeling for classic
landing zone size is as much as 300x400m, along the wind direction. It is the max of what we
can ask flying in most areas in Europe, but also guarantees safe operation for fresh Pteryx
users.

Page 48/69 Secrets of UAV photomapping www.pteryx.eu
If we consider landing in manual mode at high distance in apparently flat terrain, we will
encounter serious effect of screening the line of sight.
We analyze 2 scenarios over very slightly undulating area and few trees:
1. 35MHz transmitter with long antenna is held high in the air at 2.5m above ground
(vertical antenna, box held at hands), the receiver is at 1m height (light green)
2. 2.4GHz transmitter with short antenna is held high in the air at 2m above ground, the
receiver is at 0.5m above ground (cyan)
This simulates landing the plane. Fresnel zone screening applies.
Typical RC and modem range at ground level.
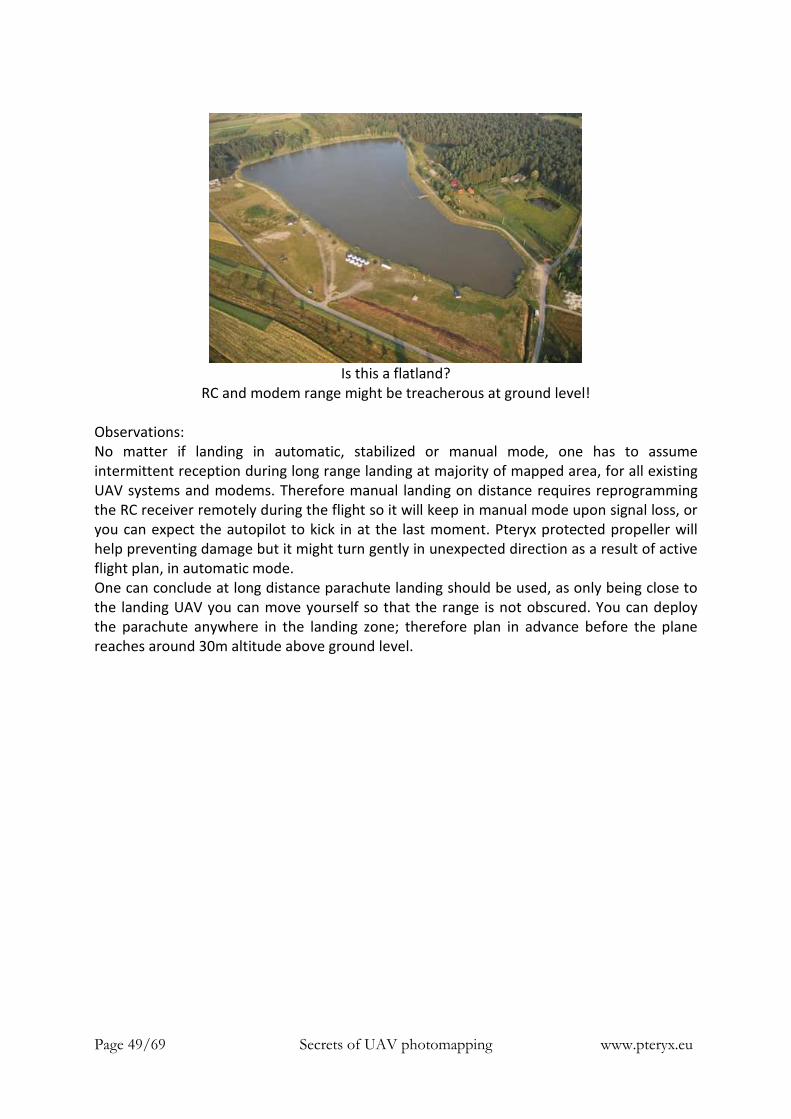
Page 49/69 Secrets of UAV photomapping www.pteryx.eu
Is this a flatland?
RC and modem range might be treacherous at ground level!
Observations:
No matter if landing in automatic, stabilized or manual mode, one has to assume
intermittent reception during long range landing at majority of mapped area, for all existing
UAV systems and modems. Therefore manual landing on distance requires reprogramming
the RC receiver remotely during the flight so it will keep in manual mode upon signal loss, or
you can expect the autopilot to kick in at the last moment. Pteryx protected propeller will
help preventing damage but it might turn gently in unexpected direction as a result of active
flight plan, in automatic mode.
One can conclude at long distance parachute landing should be used, as only being close to
the landing UAV you can move yourself so that the range is not obscured. You can deploy
the parachute anywhere in the landing zone; therefore plan in advance before the plane
reaches around 30m altitude above ground level.

Page 50/69 Secrets of UAV photomapping www.pteryx.eu
20. Probability of successful campaign
Statistics often gives counter-intuitive results. Let’s revise some theory and plot simulation
results in order to answer the basic question: when it is good to fly several shorter missions
(‘the more I try, the more chances to win’?) or is it good to try to fly much larger missions.
The first observation, also valid for full-scale aviation, is that most failures occur during
takeoffs and landings. Indeed, at cruise altitude the plane uses fewer power, is rarely
turning, flies far from the ground, the reception ranges are good. Landing, however, has
some risks that are both small, difficult to assess but can build up quickly. Assume we have a
small percent of a chance to fail: be it 1% failure because the plane can hit a stump or a large
rock upon landing. Let’s suppose this is not destructive for the system, but will cause a
failure for the mission since it cannot be repaired in the field. The build-up of risks is the
following:
The probability of flying multiple missions without a failure,
for different chances of NON-RECOVERING FAILURE in a single flight
0%
10%
20%
30%
40%
50%
60%
70%
80%
90%
100%
1 2 3 4 5 6 7 8 9 10 11 12 13 14 15 16Number of flights
Pro
bab
ilit
y o
f n
o f
ailu
res
[%]
Single flight failure probability 1%
Single flight failure probability 2%
Single flight failure probability 5%
It can be seen, that requirement to fly 16 missions in a row without failure is quite
demanding. Let’s say 1% chance of landing in narrow valley atop of the only building in the
middle, repeated 16 times in a row gives only 85% of not causing major mishap. If you have
two buildings or twice that many trees, the campaign success rate melts to 72%. If the
chance of failure is 5% because the landing field is very rocky and you cannot make minor
repairs in the field, you have more than 50% of chances the plane will occur damage before
completing the campaign.
CONCLUSION: Flying several small missions makes you very vulnerable to even most
improbable mishaps requiring small repairs for which you are just not prepared in the field
be it because you lack voltmeter, specific screwdriver and connector or if the glue requires
a few hours to harden.

Page 51/69 Secrets of UAV photomapping www.pteryx.eu
What is the situation when you know something happens periodically like clouds that will
appear only on the photos once downloaded, and you have to discard the result then, yet
the weather is changing all the time? Let’s suppose you have booked a hotel for two days
and want to fly with a system that could make 8 short missions each day.
The probability of flying at least K missions without a failure,
the failure is RECOVERING (you try max N=16 times until you succeed)
0.00%
10.00%
20.00%
30.00%
40.00%
50.00%
60.00%
70.00%
80.00%
90.00%
100.00%
1 2 3 4 5 6 7 8 9 10 11 12 13 14 15 16K - the minimal number of successes in 16 trials
Pro
ba
bil
ity
of
su
cc
ess
ful
ca
mp
aig
n [
%]
Single flight failure probability 1%Single flight failure probability 2%Single flight failure probability 3%Single flight failure probability 4%Single flight failure probability 5%Single flight failure probability 6%Single flight failure probability 7%Single flight failure probability 8%Single flight failure probability 9%Single flight failure probability 10%Single flight failure probability 20%Single flight failure probability 30%Single flight failure probability 40%Single flight failure probability 50%
The first observation is that when the clouds appear only 3% of the time, you have only
about 60% chances no mission will be wasted (16 successes in a row) and about 92% that
you will have at least 15 good missions.
Things get worse when you know you got unfavorable cloud cover 50% of the time but you
expect half of the surface to be mapped. Unfortunately, the chance of succeeding 8 missions
in 16 trials is only 60%. If you want to be ‘sure’ with say 97% final probability to ‘return
home’ with commercial results, you have to plan having only 5 useful missions. This is more
pessimistic than guessing ‘I have booked two days, fly 2 times more often, half of results
should be good’. Maybe they will, if you are lucky.
CONCLUSION: You cannot handle uncooperative weather with good success rate by using
simply many trials.

Page 52/69 Secrets of UAV photomapping www.pteryx.eu
Similar case as before, this time we have a small system that gives us 6 opportunities per
day, say 6 half-hour flights. Suppose you have to takeoff for a small place that is remote to
mission area, but in order to get there, you have to overfly local club airfield. You have short
window of opportunity and you can have go/no go permission once you are in the air. If not,
you have to land to give way for the traffic.
The probability of flying at least K missions without a failure,
the failure is RECOVERING (you try max N=6 times until you succeed)
0.00%
10.00%
20.00%
30.00%
40.00%
50.00%
60.00%
70.00%
80.00%
90.00%
100.00%
1 2 3 4 5 6K - the minimal number of successes in 6 trials
Pro
bab
ilit
y o
f s
uc
cess
ful
ca
mp
aig
n [
%]
Single flight failure probability 1%Single flight failure probability 2%Single flight failure probability 3%Single flight failure probability 4%Single flight failure probability 5%Single flight failure probability 6%Single flight failure probability 7%Single flight failure probability 8%Single flight failure probability 9%Single flight failure probability 10%Single flight failure probability 20%Single flight failure probability 30%Single flight failure probability 40%Single flight failure probability 50%
Let’s say it is enough to have 3 missions to succeed, once we did this in any order, we go
home with the data. If you are given permission only with 50% of probability, surprisingly
you have only 67% chances to succeed.
Now imagine you have a larger UAV that can map the area that is 3 times larger in a single
flight. First, you will get similar number of chances that is 6. Probability of bringing the data
home is high as you need only 1 success. This is very close to 98%.
Let’s reformulate the problem: the camera dies in half of the cases as you discover in the
field. It looks as it happens during takeoff, the failure probability is high, maybe something
disconnects but once you are not shaking it – it works then. You can fly with small missions
having said 67% chance of success, 3 times not necessarily in a row.
Or just fly 2 large missions (each takes time slot required for 3 smaller missions). This time
you get chance of failure per mission 50%, but the chance that both will fail is only 25%. This
means with larger mission you still get comparable 75% success rate.
CONCLUSION: For recovering and erratic failures that ‘just happen’, subdividing
the problem into several missions is not increasing the reliability in any way, only brings
probabilities closer to their theoretical limits of infinite number of tries. On the other hand
it is easy to find real-life scenarios when flying long mission has high advantage over
shorter missions. The fear of potential frustration ‘what if I fly for two hours and it is
useless afterwards’ is unjustified. If you fail with long mission, you would fail with several
smaller ones and this just means bad flight/business planning relying on luck.

Page 53/69 Secrets of UAV photomapping www.pteryx.eu
21. Using dual camera and probability of success
Pteryx thanks to its payload and head size can carry two cameras. Such use is recommended
only for the users with previous single-camera experience due to reasons we outline below.
There are several possible motivations of using dual camera; some are not useful in practice:
1. Shooting object at different angles simultaneously
this reason is not valid for Pteryx, which has dual trigger logic acting upon the same
servo output. Also the head is rotating as much as 45 deg both sides, this allows
taking building facades with a single flight, using a single camera: it is sufficient to
setup both trigger logic so that impair shots are rotating the head to the left, the
other is rotating the head to the right.
2. Improving redundancy of the system. Using both classic cameras in hope one of them
will work, yielding the correct result. Unfortunately this works only when camera
failures are independent: in practice if we assume that failure of one of the camera
will also cause a failure of the backup camera with probability 50%, we get the same
reliability as with single camera. Alas, it is almost always the case. The camera
failures are dependent for the following reasons:
- somebody has forgot or failed to erase memory cards, what is done by the same
person using the same card access software
- somebody failed to charge camera batteries
- a lens cover was not removed from both cameras
- a servo cable triggering both cameras has failed
- the dust from previous landing is present on the lens
- camera exposition time was set mistakenly too low, causing blur on almost all images
For those and many other reason failures of complex systems like digital camera, often
come in series due to innocent, shared reason
3. Using two cameras for IR photography and agriculture/forestry.
On one hand one can use single IR camera in order to define regions and surfaces of
worse growth, inspect them personally, define the color intensity corresponding to
damaged surface and using GIS software determine the surfaces, quantities and
regions to be treated.
More advanced scenario involves using two cameras, one in visual the other in IR
spectrum. In the latter case, the measurements can be quantified and calibrated, the
map in itself revealing numerical data. Unfortunately probability of success drops as
one must register correct photos from both cameras at once. Since the user’s
experience in setting up cameras for a specific weather is initially low, planning for
dual-cam IR mission since the beginning of operations is asking for trouble.
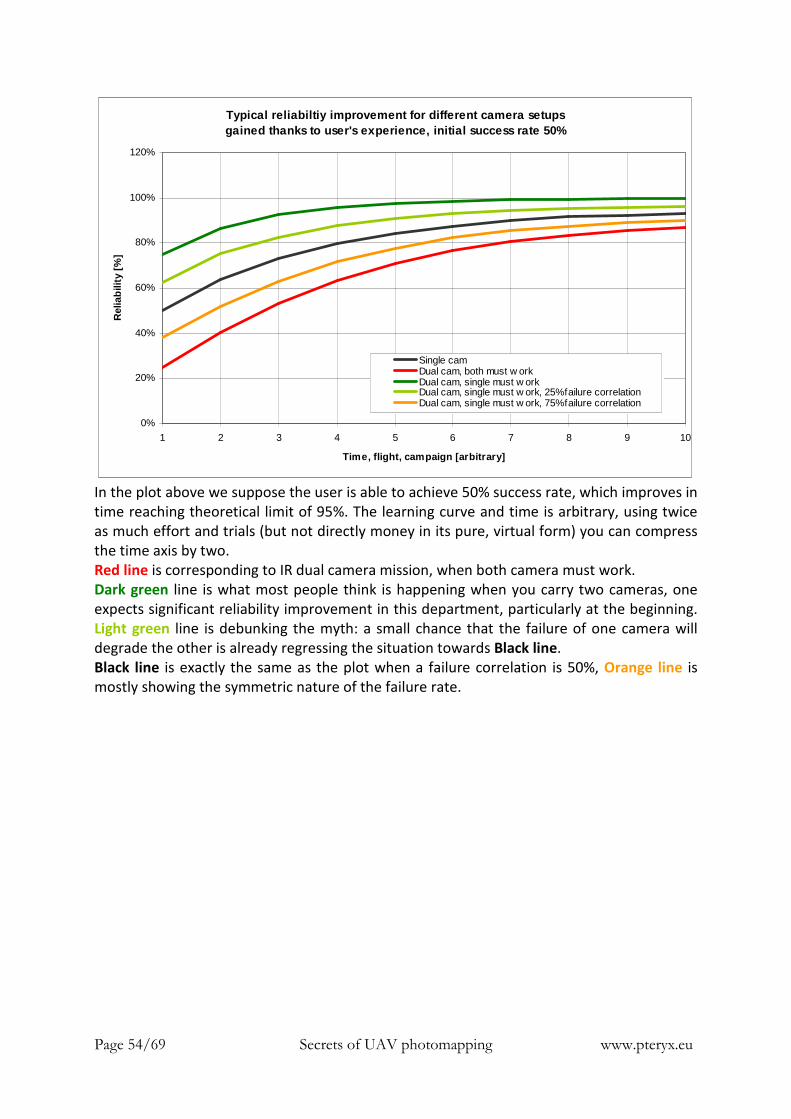
Page 54/69 Secrets of UAV photomapping www.pteryx.eu
Typical reliabiltiy improvement for different camer a setupsgained thanks to user's experience, initial success rate 50%
0%
20%
40%
60%
80%
100%
120%
1 2 3 4 5 6 7 8 9 10
Time, flight, campaign [arbitrary]
Rel
iabi
lity
[%]
Single camDual cam, both must w orkDual cam, single must w orkDual cam, single must w ork, 25%failure correlationDual cam, single must w ork, 75%failure correlation
In the plot above we suppose the user is able to achieve 50% success rate, which improves in
time reaching theoretical limit of 95%. The learning curve and time is arbitrary, using twice
as much effort and trials (but not directly money in its pure, virtual form) you can compress
the time axis by two.
Red line is corresponding to IR dual camera mission, when both camera must work.
Dark green line is what most people think is happening when you carry two cameras, one
expects significant reliability improvement in this department, particularly at the beginning.
Light green line is debunking the myth: a small chance that the failure of one camera will
degrade the other is already regressing the situation towards Black line.
Black line is exactly the same as the plot when a failure correlation is 50%, Orange line is
mostly showing the symmetric nature of the failure rate.

Page 55/69 Secrets of UAV photomapping www.pteryx.eu
Typical reliabiltiy improvement for different camer a setupsgained thanks to user's experience, initial success rate 75%
0%
20%
40%
60%
80%
100%
120%
1 2 3 4 5 6 7 8 9 10
Time, flight, campaign [arbitrary]
Rel
iabi
lity
[%]
Single camDual cam, both must w orkDual cam, single must w orkDual cam, single must w ork, 25%failure correlationDual cam, single must w ork, 75%failure correlation
Similar plot as before. Here we suppose the user is able to achieve higher success rate
initially (flying in cooperative weather, luck...). Still the evolution of success rate obeys the
same laws.
The most important results: using dual camera is not improving the reliability of
photomapping because the failure reasons are typically 50% dependent. If one of the
cameras delivers unsuccessful results, the other one will deliver the same in 50% of cases
because of external reasons.
If the failure of one camera would guarantee a failure of its backup (100% cross correlation
of failures), suppose the only known type of failure is to drain a power from common source,
or simply to explode destroying both cameras, then the chance of success is diminishing with
each camera installed.
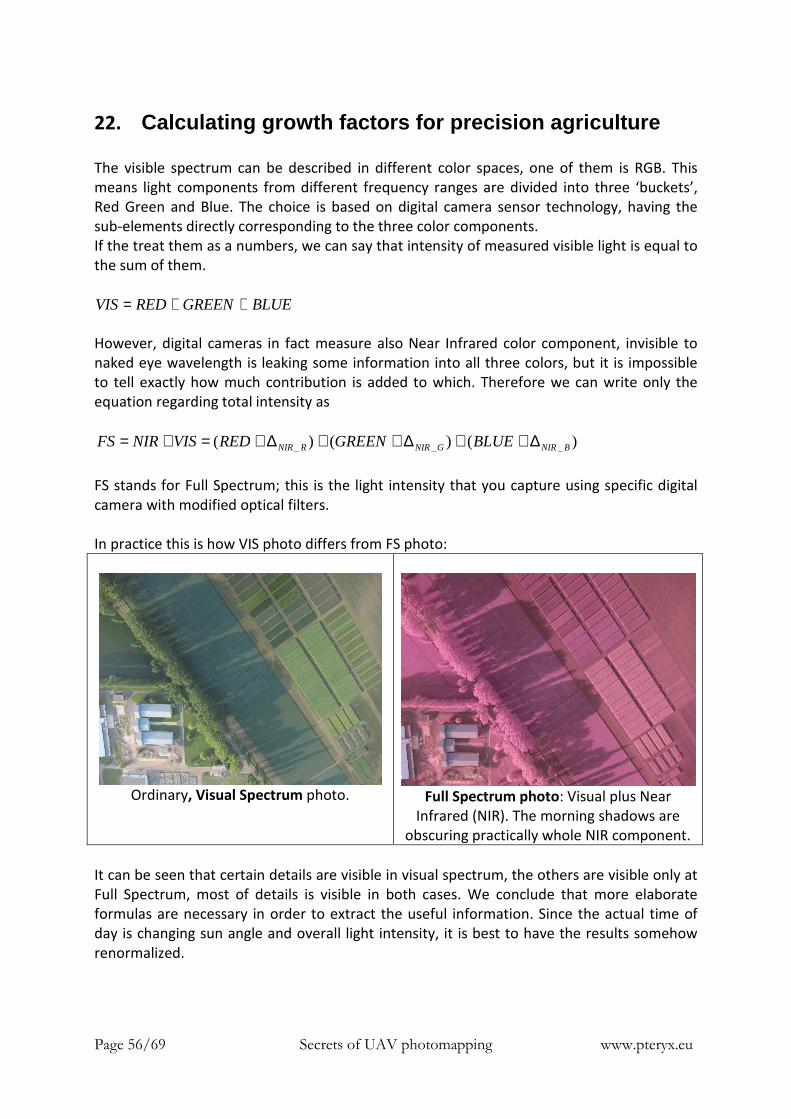
Page 56/69 Secrets of UAV photomapping www.pteryx.eu
22. Calculating growth factors for precision agricultu re
The visible spectrum can be described in different color spaces, one of them is RGB. This
means light components from different frequency ranges are divided into three ‘buckets’,
Red Green and Blue. The choice is based on digital camera sensor technology, having the
sub-elements directly corresponding to the three color components.
If the treat them as a numbers, we can say that intensity of measured visible light is equal to
the sum of them.
BLUEGREENREDVIS ++=
However, digital cameras in fact measure also Near Infrared color component, invisible to
naked eye wavelength is leaking some information into all three colors, but it is impossible
to tell exactly how much contribution is added to which. Therefore we can write only the
equation regarding total intensity as
)()()( ___ BNIRGNIRRNIR BLUEGREENREDVISNIRFS ∆++∆++∆+=+=
FS stands for Full Spectrum; this is the light intensity that you capture using specific digital
camera with modified optical filters.
In practice this is how VIS photo differs from FS photo:
Ordinary, Visual Spectrum photo.
Full Spectrum photo: Visual plus Near
Infrared (NIR). The morning shadows are
obscuring practically whole NIR component.
It can be seen that certain details are visible in visual spectrum, the others are visible only at
Full Spectrum, most of details is visible in both cases. We conclude that more elaborate
formulas are necessary in order to extract the useful information. Since the actual time of
day is changing sun angle and overall light intensity, it is best to have the results somehow
renormalized.

Page 57/69 Secrets of UAV photomapping www.pteryx.eu
At the same time, let’s look at detail of visual-spectrum only map:
One can conclude, for determining vegetation losses percentage visual spectrum is
sufficient. The mapped area doesn’t has even to be georeferenced as long as relative map
geometry is preserved.
How the digital camera can be used for growth factors that will provide us with normalized
data? Most popular is NDVI, now becoming obsolete. For dense vegetation applications EVI
is being proposed, along with EVI2 that requires less color bands for the input.
( ))( VISNIR
VISNIRNDVI
+−=
)15.76(
)(5.2
+⋅−⋅+−⋅=
BLUEREDNIR
REDNIREVI
)14.2(
)(5.22
+⋅+−⋅=
REDNIR
REDNIREVI
The actual value of scaling constants might vary from researcher to researcher, but the
invariant idea is that we need to calculate a difference between NIR component and visual
spectrum. This is impossible with a single camera.
What are our options for calculating the factors above?

Page 58/69 Secrets of UAV photomapping www.pteryx.eu
NDVI:
Option 1
A [VIS] One visible light unmodified camera
B [NIR+VIS] One Full Spectrum camera
The equation becomes
( ) ( )B
AB
B
AAB
VISNIR
VISNIRNDVI
ABNIR
2)(
)(
−=−−=+−=
−=
Visible light photo is available.
Problem:
NIR is small relative to B and A, both cameras shooting at slightly different angle and time,
NIR becoming imprecise.
Option 2
A [NIR] One NIR camera (full spectrum camera with visible-block filter)
B [NIR+VIS] One Full Spectrum camera
The equation becomes
( ) ( )B
BA
B
ABA
VISNIR
VISNIRNDVI
ABVIS
−=−−=+−=
−=2)(
)(
More costly than before, both cameras need to be non-stock versions.
Focusing time and noise level is high for NIR-only camera as very little light passes into the
sensor.
Visible light photo is not available.
Advantage: NIR+VIS setup is very sensitive offering best exposition time.
Option 3
A [NIR] One NIR camera (full spectrum camera with visible-block filter)
B [VIS] One standard camera
The equation becomes
( )BA
BA
VISNIR
VISNIRNDVI
ABVIS
+−=
+−=
−=
)(
Less expensive setup than before.
Visible light photo is available.
Focusing time and noise level is high for NIR-only camera as very little light passes into the
sensor, but the value itself is measured directly. Noise is reduced by reducing the resolution.
EVI and EVI2:
Since both formulas use RED component explicitly, you need onboard a visible light camera.
This channel cannot be polluted with NIR contribution, therefore Full Spectrum camera is
out of question. Good news is that having visual spectrum camera we always have BLUE
component, therefore we can avoid using approximate EVI2.
One concludes that both Visible Light and NIR-only camera must be onboard.

Page 59/69 Secrets of UAV photomapping www.pteryx.eu
Consequences for flying Pteryx UAV are the following:
- Using two cameras is removing one extra battery from camera head (3 instead of 4 in
total), slightly reducing flight endurance according to the plots you find in this book
- The payload is never less than 650g in this scenario
- One of the cameras must be pure NIR, therefore you need to mount a custom visible-block
filter on one of the cameras; this requires custom filter attachment
- It is practical to conserve one camera as Full Spectrum (all IR blocking filters removed,
visible block filter detachable) since you can use it anytime for crop damage assessment with
good result, with visible-block filter installed it would be useful for calculating growth factors
- You have to setup two cameras with different lighting requirements and get non-blurred
results at the same time. The associated success rate probability drop has been analyzed in
earlier sections.
- Sun angle is very important. It might happen that you will have to fly twice in order to avoid
the shadows and mix the photos before mosaicking (this may require merging your
processing software input files, easy job as they are ASCII format and generally readable).
Because the overall lighting would also change from flight to flight, both flights must carry
two cameras.
Once can conclude that application for agriculture where the area of damages has to be
assessed is among the simplest when even free image stitching software works fine over
small fields,
the application where quantified data has to be available is exactly the opposite, requiring
two separately mapped and georeferenced ortophotomaps plus image manipulation on
the two, NIR map being usually downgraded to lower resolution for noise removal.
Pteryx dual camera head is optional and has already been delivered. With our system two
compact cameras can operate simultaneously.

Page 60/69 Secrets of UAV photomapping www.pteryx.eu
23. Robustness and materials
Pteryx construction is high-end fiberglass, significantly more durable than cheap fiberglass
used in RC planes. It requires much less attention and minor repairs after each flight. Major
crashes are limited by presence of parachute. Major crash presents a problem for every UAV
as the autopilot is typically adjusted for specific geometry. This in turn requires experienced
RC pilot for the first test-flight to teach the autopilot to fly, what requires simply trimming
the plane at mid-throttle to fly straight in manual mode – if everything goes right as usual,
what is not obvious after a heavy crash and refit. We make a test flight after a major refit,
we also test fly (a few times if necessary) every new Pteryx Pro. Typical platform life is about
200 flights, but landing in manual mode on the meadow by experienced RC pilot allows
robustness well into 1000 flights. Such intensity of operations is inaccessible for RC planes.
Repairs of the smaller cracks in the fuselage are possible by the user using fiberglass from RC
hobby shops, but are much less frequent than in RC models. Those repairs are not difficult as
the fuselage interior is spacious and is easily accessible by brush, the inner surface having
regular, porous structure.
As a rule there are no elements that using scotch tape or anything that can melt/slide in hot
weather. The wings are made entirely of fiberglass with Styrofoam core, making them
completely resistant to water. Compared to multicopters, the engine is not a major weight
factor and is only half-loaded in flight. Added with 100-200% power rating margins in all
components has proved to be fully robust in direct sunlight and 42C external temperature
without detectable heat during several flights. The nominal temperature rating on critical
electronics is +85C.
Resistant to water, to sun, but also
resistant to low temperatures.

Page 61/69 Secrets of UAV photomapping www.pteryx.eu
24. On efficiency of winged platforms
In general, winged platforms have larger moving surfaces relative to mean distance between
air particles. Because of complexity and nonlinearity of properties of compressible fluids for
small flying objects, rotor aircrafts have always worse efficiency for given amount of fuel and
mass. This is particularly visible for small UAVs, where the difference of safe endurance per
mass is about half for rotorcrafts compared to airplanes. The smaller and less elongated
blades the worse is efficiency ratio.
Contrary to rotorcrafts, Pteryx returns gently with glide ratio of about 10:1 with all
equipment installed. This means, from 300m altitude it can fly 3km with no wind, less in
headwind, more with tailwind.
Pteryx Pro has also a parachute, therefore should low battery situation occur, Pteryx Pro will
always return automatically but parachute will give extra comfort not forcing to land in
manual mode with no second try option. As a consequence, safety margins are in the order
of 10min what amounts to 8-16% of flight time, as opposed to 30% commonly used in
rotorcrafts (which cannot deploy parachute without entangling it).
It is important to understand that the geometric information extracted from the photos
requires moving parallel to the object, as opposed to shooting panoramas. Ability of
rotorcrafts to hover and take multiple photos at given location adds nothing to
reconstruction geometry, could only increase pixel count. This however can easily be
achieved using 1kg of Pteryx payload and putting several compact cameras in the head, so
once again being stationary at certain points in the air has no benefits.
Multiple photos from the same
position yield no additional
information about geometry.
No extra depth information is
gained from stationary
quadcopter, helicopter,
balloon, mast or kite.
Using aircraft for geometry
reconstruction is good as
differences in angle of view
yield height information.
Using low flying UAV for
geometry reconstruction is
even better because
relative angle differences
due to height change are
larger and the object is
seen from many angles.
As seen above, alternative strategy to minimize distortion around high buildings or
structures near to map edges, while staying concentrated on suburban areas is:
fly as high as permitted, deliberately diminishing legs spacing and accepting skewed
buildings as skew angle diminishes with altitude.

Page 62/69 Secrets of UAV photomapping www.pteryx.eu
25. Answers to FAQ
What is in the package and what has to be added in order to fly?
Pteryx Lite:
• UAV platform fully integrated with autopilot (1.5km range limit)
• Stabilized camera head, no camera
• Without RC controller (country-specific, integrated by the user following autopilot
instructions what involves setting up channels/mixers according to RC system
manual)
• The user integrates mission payload (camera) of choice or any other sensor
Pteryx Pro:
• UAV platform fully integrated with autopilot, unlimited range, one-button operation
and multi-mission preset selectors
• Stabilized camera head with camera installed
• Towing hook, large belly and parachute bay
• Integrated with user-supplied RC and transmitter (again, country specific)
• Test-flown
• Takeoff rails and nails, bungee, rails carrying case
• UAV carrying case with space for RC transmitter
• A parachute
Both:
The user supplies:
• LiPo 3S batteries and chargers (available in most RC shops). The quantity depends on
intensity of operations and required number of spares in the field. For continuous
flying, one needs 3 sets of batteries: one in flight, two charging. Using two-three 5Ah
batteries per battery set is most comfortable for safe flying of a novice, without
reaching for maximal mass or range+endurance.
• At office, a PC computer for mission simulation, USB printer cable.
• RC transmitter with PCM or 2.4GHz system, compatible with permissions in your
country.
• On the field, having a Netbook allows downloading the logs and multiple flights if the
memory is exceeded (the autopilot can be configured in such a way it can store 12h
or more data at reduced rate and up to 8192 photo positions, that corresponds to 8h
flight time, however we prefer to download after each flight as it documents any
problems building up and makes data processing better organized)
• A toolbox. Details in the next answer.
Note: Pteryx Lite is less expensive only because it is faster to assembly on our part and many
risk factors are taken away. This means we do not perform custom RC integration, no
camera, less complex. We do not blend the two projects together, because it would cause all
the disruptions on supply line and manufacturing that allow price reduction. Pteryx Lite is
recommended for the users with flying RC model experience in integrating custom
electronics. We do not recommend reinventing the wheel bringing Lite to Pro level, finding
progressively the necessity of each component during intensive operations.

Page 63/69 Secrets of UAV photomapping www.pteryx.eu
What are test & maintenance tools and pilot’s equipment required on the field?
Single mission equipment:
• Portable voltmeter, preferably pen style for diagnosing battery levels
• Hand-held hanging electronics scale, 20kg range (measuring takeoff weight
(5kg) and static thrust (3kg), measuring bungee tension (10-12kg); it is ok to hang
by vertical stabilizer)
• Flat screwdriver 6-10mm head width for unmounting stabilized head and attaching
wings (may be very short like 6cm, it fits in the pocket)
• Pen and paper for taking notes about issues and mission details
• Hex key #3 (3mm) for propeller
• Spare car hood type screws, 10…12mm long (belly mounting, servo mounting)
• Sun protective glasses
• Anti-mosquito spray for more relaxed evening flying
• First aid kit against propeller-induced injuries or small cuts
• Extra rubber bands (6x1mm, 150mm circumference) for horizontal stabilizer
• Fiberglass-reinforced adhesive tape from RC shops, scissors
• Anemometer as the ultimate reference of no-go condition
• Stopwatch (may be already built in RC transmitter)
• WD40 spray, mostly for bungee rails but also for other applications
• Medium speed/density (15s) cyanoacrylate glue plus accelerator for quick fixes
• Spare wing screws and bolts (in case the originals are lost in the luggage)
• Use cheap portable camera for documenting takeoffs, this helps analyzing near
misses for further analysis
Pteryx Pro only:
• 2kg hammer for bungee attachment
• 10mm camera wrench (mounting screw in camera base)
• 8mm wrench for takeoff hook
Multiple mission equipment extras:
• Netbook (choose max battery life, preferably more than 5h, scratch-proof case)
• USB-B (large) printer style cable, preferably in flexible silicon, more than 1.5m
long becomes difficult to handle in the field
• Spare batteries (charging in the field is time consuming and destroys car battery
because of full capacity cycling per day)
Pteryx Pro only:
• USB-B mini cable for camera
• Spare SD cards (more reliable than erasing in-place)
Spare camera batteries (the camera supplied lasts for 2h in full manual settings)
What is the data necessary for processing after the flight?
• Pictures on SD card of the camera
• Logs in the autopilot
• User input: time offset camera vs GPS or the number in filename of the first photo
• Optional: position of about 4-8 landmarks visible from the sky, preferably on ground
level (use geodesic grade GPS if possible)

Page 64/69 Secrets of UAV photomapping www.pteryx.eu
How do you match the photos from the camera to GPS positions?
Using either numbered photo filename or EXIF timestamp.
The autopilot uses high quality GPS enhanced with inertial navigation unit. It saves the
positions in autopilot log along with UTC time of the event.
The camera records files under unique names with its own timestamp in EXIF data.
Pteryx software allows both strategies:
• match photos to event using filename which contains a number, the user provides
the number of the first photo
• match photos to event using Creation timestamp from EXIF, the user must provide
time offset between internal camera time and GPS UTC time in seconds (the software
selects nearest match)
Can I use camera with built-in GPS?
It is counter-productive as the position quality will be insufficient, positions and altitudes
jumping all over the place. The reason is that all camera GPS antennas are in fact directional,
pointing towards the sky with limited gain directly towards the horizon. As a result, when
tilted down for several minutes while in move, the choice of satellites used for fitting will
change dramatically, particularly during turns. Placing the camera GPS under carbon fiber
reinforced head, the GPS reception would be erratic at best.
Theoretically it is possible for the camera to use the GPS in order to automatically adjust its
clock so that it would be easier to synchronize the photos with log positions using
timestamps; no daily 1s drift would be observed – yet the actual implementation in a
particular camera yet has to be witnessed.
Additional problem with GPS is its battery consumption, making the camera inoperable in
less than 2h of flight even when shooting in ‘fully manual’ mode, therefore without
switching off the GPS one typically would need to modify the camera in order to use the
external battery.
Is the output compatible with autopilot/system XYZ?
Pteryx uses custom high-end autopilot. While it is not emulating other designs, it produces
all the data that is widely recognized by processing software. Standards like NMEA, GPX,
CSV, EXIF tags, Google Earth KML and text outputs are the common denominator.
Besides, it always creates custom outputs for the most commonly used mosaicking software.
The system being developed specifically with photo mapping in mind, special effort has been
made to generate most rich and compatible outputs among available autopilot designs.
Therefore it provides immediate replacement or complement in any existing UAV
photography processing chain.

Page 65/69 Secrets of UAV photomapping www.pteryx.eu
What is the output from the software included with UAV?
If the user provides time offset (camera vs GPS) and the list of photo filenames,
the output is:
• Inflight black box autopilot data as Google Earth kml, csv
• Flight statistics and all emergency events as csv and txt
• Photos overlaid in kml for overlap preview
• Photo positions as gpx, NMEA csv formats
• Additional input data tested with major processing solutions:
o Pix4D cloud computing and stand-alone
o Dronemapper
o Agisoft Photoscan
o Enso Mosaic from MosaicMill
o Icaros
o Giscat
• Using free GeoSetter software with graphical interface, using the gpx/NMEA
positions, one can update EXIF data in the images to contain photo positions
What is the time required to process the data?
All parameters for decoding the logs are constant, except camera time offset varying slightly
each week.
• about 1…3min to download all logs
• about 5s…2min to process the logs with supplied software depending on content
• about 15min to verify photo overlap
• about 15min to update EXIF data if necessary
(at this point the photos are georeferenced with about 5m positional error)
• 30min to specify and re-check around 3-6 ground control points visible on one of the
photos
• 30min…12h to upload the data to processing services (up to gigabytes)
• 15min…24h of image stitching with external service or software
• 15min…24h of data download (up to gigabytes)
(at this photos full orthorectified and georeferenced map and 3D model is available)
The process of rectification of naturally time consuming and requires the most powerful
personal PC available. We advise using cluster processing services in order to reduce user’s
spending on infrastructure and processing staff.
How is mission planning done?
The autopilot in Pteryx Pro has around 30 preprogrammed missions which can be selected
on the field using rotary connectors and 6 unused slots.
A few missions require entering target coordinates from the console connected via USB port,
while most of the missions are patterns evaluated automatically relative to takeoff position;
therefore no laptop is required in the field, as no keyboard has to be used. The UAV knows
where it started moving thanks to its own propulsion and the mission begins, regardless on
which continent you are! The emergency return position is always above takeoff point as
well; only a clean, successful mission can end on designated remote point if you explicitly
designate one.
Simple modifications of the mission like leg rotation (degrees) can be entered from the
console on the field if specific order of mapping is desired.

Page 66/69 Secrets of UAV photomapping www.pteryx.eu
All missions can be reprogrammed to a customer-specific mission. There is Excel spreadsheet
available that automatically optimizes space taken by waypoint memory, all the user has to
do specify is overlap, flights speed, camera resolution, requested pixel resolution and map
size; it is sufficient to copy-paste a produced table into the autopilot’s console to update the
family of missions. It is also possible to easily reshape family of missions in the spreadsheet,
entering mapped rectangle width and height by km.
This means you can arrive on the field equipped with not just plan B, but some 36 backup
plans under each mission slot, previously planned and reviewed with Google Earth in 3D.
If somebody asks you to map one more field in the afternoon before you leave, you can
switch to a standard plan and takeoff a large mission near the middle of the bonus target; all
this at 1 minute notice, when a laptop would be already low on battery and unavailable for
time-consuming mission upload, the sun moving closer and closer to the horizon with each
minute.
What camera is being used?
It is Canon S90 10MPIX camera. The camera shutter used and mounting supports many
different cameras up to about 800-1000g. Possible other choices that can be installed by the
customer are:
-single Canon S90/S95/S100
-dual Canon S90/S95/S100
-a single Canon G9… G12 series
-most versions of Sony NEX like NEX3N, NEX5, all NEX C[3-7] etc
-low resolution Canon S series also tends to provide excellent pictures with reduced noise,
the linear ground resolution can be improved with lower flight altitude (more flight time per
surface)
The cameras we propose are fit for the job; it is not advised to choose a camera based solely
on ground shooting experience.
How does the camera operate?
The autopilot has camera shutter output that can be customized. It can support the
following shuttering method:
-universal mount using mechanical lever using RC servo (installed in Pteryx Pro)
-IR shutter using the camera manufacturer’s pilot
-TTL signal on the wires routed directly to modified camera trigger button
-modified USB connector and modified Canon with custom CHDK firmware (limits SD card
size to 4GB due to FAT16, max around 80min flight time with 10MPIX camera, JPEG only)
Several methods and their configuration are mentioned in autopilot manual available for our
clients. The skills required are not different than for any other autopilot system.
Any activation of the mentioned system is logged in the memory of the autopilot together
with timestamp, position and orientation data.

Page 67/69 Secrets of UAV photomapping www.pteryx.eu
How many images it can take?
Assuming shooting images at maximum possible rate (we use it for having backup photos)
Each 3.5s, supposing max flight time of 2h we have 2*3600/3.5=2058 max photos (one must
include a dozen test photos and assume the camera shutter will start working before takeoff
due to user mistake requesting a direct activation). Average mission is around one thousand
photos.
How do I control number of images taken?
While it is possible to disable camera at end of each leg and control shooting rate, distance
between images, in practice it is most beneficial to take as much images as possible,
restricted by camera shooting rate. Therefore we recommend using the standard autopilot
settings and shooting the photos in regular time intervals, this provides important
redundancy.
How robust is Pteryx?
Typical platform life is about 200 flights, but landing in manual mode on the meadow by
experienced RC pilot allows robustness well into 1000 flights. Using the parachute during
every landing lessens platform life in not easily quantifiable and somewhat random way,
requires replacement of battery bay.
How precise it resulting ortophotomap?
Without using ground control points expect a few (1-5m) global map offset (typical GPS
precision 2.5m), sub-pixel global geometric accuracy with some 1-10 pixel local geometric
distortions around tall objects (the last parameter depends strongly on image overlap).
Global map offset drops to sub-pixel precision after introducing around 4-6 Control points
measured with good quality geodesic GPS system. Major advantage, however, is more
contrast and color definition of the map, each pixel carrying more information that with
other technologies.
Vertical accuracy of associated 3D model (DSM) is typically triple the horizontal resolution.
DSM is built at 10m to 25cm triangular mesh resolution, depending on processing
technology.
What are the dimensions and key Pteryx Pro specifications?
What is the flight speed?
Around 50km/h=31mph=27kts=14m/s.
The heavier the faster: an optimal airspeed is kept by the autopilot all the time.

Page 68/69 Secrets of UAV photomapping www.pteryx.eu
What is the maximum wind speed it can fly in?
About 25km/h=15mph=13kts=7m/s at flight altitude. The limit is not sharp, it is discussed
earlier. The wind is associated with degraded photo quality and has impact on flight safety
and business model. The choice is arbitrary but affects all small UAVs as the limitation is also
linked to camera sensitivity/exposition time vs turbulence, associated with higher winds.
This condition is not easily quantifiable as it depends on terrain and topology of mapped
region.
Do you supply Ground Control Station?
No. Our mapping experience shows it is not needed as it distracts the user from observing
the plane, it decreases overall situational awareness (visual contact is also required by the
law). Every decision that could be taken by the pilot observing the GCS is taken by the
autopilot automatically. An anomaly that is severe enough to require human intervention is
not feasible using GCS because of low update rate of long range modems, while the required
data refresh rate for manual control is around 20-25Hz (similar to TV update rate). Having
onboard video is not solving the problem as in practice it is one of the weakest elements due
to weight, power consumption and interference sensitivity, while providing yet another very
exotic perspective with narrow field of view, still, making practical navigation over unknown
terrain almost impossible. Ground stations with extensive data display are impossible to
read during mildest sunlight and are popular mostly because all autopilots designed for UAV
research require them. For mature systems, the simple mission return decisions are taken
more reliably by automated onboard electronics as they can take more inter-related
variables into account. At the same time changing the flight plan made of about 100 points
in the air is impractical flying typical mapping mission. Variables like flight altitudes are
dependent mainly on customer requirement (the higher the better for yield, resolution and
laws being the limit), therefore are changed once per month at best. As a final note, having a
groundstation in practice requires full-time presence of two highly trained persons during
the whole flight, since diverting one’s eyes to the groundstation is dramatically changing the
perspective leaving the plane visually unattended, while reverse transition might be
impossible if anything is different than usual or the plane is simply a small dot on the sky.
Can I buy spare parts?
Yes, we offer a range of spare parts that are custom built by us; this includes wings and all
elements.
Some elements are trivial to be replaced by RC modeler, like horizontal stabilizer.
Some elements haunting reliability of other UAVs are not present at all (no wing servos, no
wing connectors, no Pitot tube).
Other elements are practically indestructible (engine, propeller, ESC, the autopilot).
The advanced user is allowed and encouraged to perform eventual minor repairs by adding
localized fiberglass patches from RC hobby shops to the interior part of the fuselage
(overnight repair), yet the fiberglass and resin grade we use is already far above hobby
quality/resistance.
We also offer fuselage refit (after serious crash) which includes replacing all servos, testing
the autopilot and changing the fuselage. Due to complexity this requires final test flight,
which we perform.

Page 69/69 Secrets of UAV photomapping www.pteryx.eu
26. Summing it up all together Pteryx design has been dictated by making compatible best practices and existing
heterogeneous laws. The technology bent to match providing you with options to continue
business for years to come.
• When you are forced to fly low, you need surprisingly high endurance to satisfy
photo overlap. Pteryx provides that.
• When you are forced to fly low and close, you have low time to ground and still need
a parachute. Pteryx Pro has that capability.
• There are operational limits from wind speed, Pteryx layout fits into them following
extensive analysis of the real conditions and five years of trials with alternative
platforms.
• Once the laws evolve requiring a transponder, you have both payload to lift it up or
low kinetic energy to fit among the smallest UAVs.
• Mechanical simplicity with sophisticated electronics, self diagnosing and preventing
small mishaps instead of accepting continuous wear for the illusion of easy
replacement.
• Autopilot, platform and choice of components made for the civilian mapping task,
instead of migrating laptop-centric approach from military and research systems.
• The interdependence of available parameters is enormous and has counter-intuitive
consequences, therefore we have made sure the best aeronautics engineers worked
on the project.
27. Final word
Pteryx operations can yield higher quality photos than existing systems, or can work in
situations when noisy aircraft operation is forbidden or risky.
Main limiting factor is wind and associated turbulence, which has been addressed without
compromises to the point here no further ‘simple’ improvements are possible, because we
must stay within reasonable weight and airspeed allowing us to operate from unprepared
sites anywhere in the country.
It has been shown that all aspects, advantages but also limitations of existing cameras have
been analyzed and used to create outstanding quality maps within widest operational
margins possible.
Precise analysis of business requirements can be made using the charts presented, showing
opportunities and flexibility of the system to create various map surfaces and map
resolutions.