Second quarter and first half 2014 results1 · In the second quarter 2014, the Brent price averaged...
36
1 Paris, July 30, 2014 Second quarter and first half 2014 results 1 2Q14 Change vs 2Q13 1H14 Change vs 1H13 Adjusted net income 2 - in billions of dollars (B$) - in dollars per share 3.2 1.38 -12% -12% 6.5 2.84 -11% -11% Net income 3 of 3.1 B$ in 2Q14 and 6.4 B$ in 1H14 Net-debt-to-equity ratio of 27.1% at June 30, 2014 Hydrocarbon production of 2,054 kboe/d in 2Q14 Interim dividend for 2Q14 of 0.61 €/share payable in December 2014 4 Commenting on the results, Chairman and CEO Christophe de Margerie said: “Growing geopolitical tensions marked the second quarter environment and, despite the stability of the Brent price, drew attention to the sensitive balance of the oil markets. In this context, the Group reported adjusted net income of $3.2 billion, slightly less than in the previous quarter, essentially due to exceptionally heavy maintenance in the Upstream. The highlight of the quarter was the start-up of CLOV in deep-offshore Angola, which demonstrates yet again the excellence of the Group in major project management. Going forward, we are fully mobilized and focused on starting up the next set of operated projects. In addition, the final investment decisions to launch Kaombo in Angola and Edradour in the UK, approved only after rigorous cost reductions, illustrate the Group’s capital discipline and strengthen its production profile through 2017. The Group performed relatively well in the downstream, despite an unfavorable environment for refining and marketing in Europe and scheduled turnarounds for maintenance on several sites. Every segment is playing a role in optimizing the asset portfolio. The sales of Shah Deniz in Azerbaijan, the coal mines in South Africa and Totalgaz have been announced. Finally, all the segments have progressed in setting detailed cost reduction targets within the framework of the 3-year plan announced at the beginning of the year. This plan, which is essential to the Group’s performance and in keeping with the commitments on safety and environment, will bear its first fruits in 2015.” 1 TOTAL changed the presentation currency of the Group’s Consolidated Financial Statements from the euro to the US dollar, effective January 1, 2014, to make its financial information more readable by better reflecting the performance of its activities, which are carried out mainly in US dollars. Comparative 2013 information has been restated. 2 Definition of adjusted results on page 2 – euro amounts represent dollar amounts converted at the average €-$ exchange rate for the period: 1.3711 $/€ in the second quarter 2014, 1.3062 $/€ in the second quarter 2013, 1.3696 $/€ in the first quarter 2014, 1.3703 $/€ in the first half 2014 and 1.3134 $/€ in the first half 2013. 3 Group share. 4 The ex-dividend date will be December 15, 2014, and the payment date will be December 17, 2014. News Release Communiqué de Presse 2, place Jean Millier Arche Nord Coupole/Regnault 92 400 Courbevoie France Tel. : +44 (0)207 719 7962 Fax : +44 (0)207 719 7959 Martin DEFFONTAINES Karine KACZKA Magali PAILHE Patrick GUENKEL Robert HAMMOND (U.S.) Tel. : +1 713-483-5070 Fax : +1 713-483-5629 TOTAL S.A. Capital 5 945 861 837,50 euros 542 051 180 R.C.S. Nanterre www.total.com
Transcript of Second quarter and first half 2014 results1 · In the second quarter 2014, the Brent price averaged...
1
TOTAL 2, place de la Coupole La Défense 6 92 400 Courbevoie France Tel. : 33 (1) 47 44 58 53 Fax : 33 (1) 47 44 58 24 Jérôme SCHMITT Philippe HERGAUX Sandrine SABOUREAU Laurent KETTENMEYER Robert HAMMOND (U.S.) Tel. : (1) 201 626 3500 Fax : (1) 201 626 4004 TOTAL S.A Capital 5 981 907 382 euros 542 051 180 R.C.S. Nanterre www.total.com
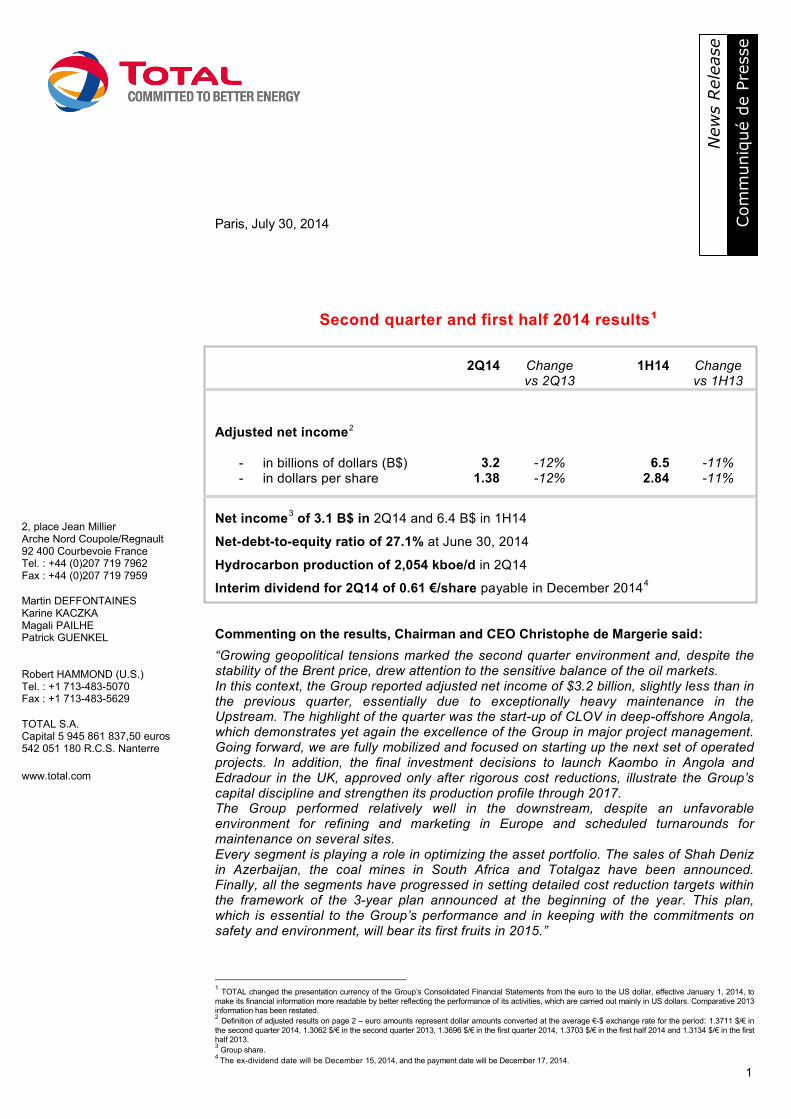
Paris, July 30, 2014
Second quarter and first half 2014 results1
2Q14 Change vs 2Q13
1H14
Change vs 1H13
Adjusted net income2
- in billions of dollars (B$) - in dollars per share
3.2 1.38
-12% -12%
6.5 2.84
-11% -11%
Net income3 of 3.1 B$ in 2Q14 and 6.4 B$ in 1H14
Net-debt-to-equity ratio of 27.1% at June 30, 2014
Hydrocarbon production of 2,054 kboe/d in 2Q14
Interim dividend for 2Q14 of 0.61 €/share payable in December 20144 Commenting on the results, Chairman and CEO Christophe de Margerie said:
“Growing geopolitical tensions marked the second quarter environment and, despite the stability of the Brent price, drew attention to the sensitive balance of the oil markets. In this context, the Group reported adjusted net income of $3.2 billion, slightly less than in the previous quarter, essentially due to exceptionally heavy maintenance in the Upstream. The highlight of the quarter was the start-up of CLOV in deep-offshore Angola, which demonstrates yet again the excellence of the Group in major project management. Going forward, we are fully mobilized and focused on starting up the next set of operated projects. In addition, the final investment decisions to launch Kaombo in Angola and Edradour in the UK, approved only after rigorous cost reductions, illustrate the Group’s capital discipline and strengthen its production profile through 2017. The Group performed relatively well in the downstream, despite an unfavorable environment for refining and marketing in Europe and scheduled turnarounds for maintenance on several sites. Every segment is playing a role in optimizing the asset portfolio. The sales of Shah Deniz in Azerbaijan, the coal mines in South Africa and Totalgaz have been announced. Finally, all the segments have progressed in setting detailed cost reduction targets within the framework of the 3-year plan announced at the beginning of the year. This plan, which is essential to the Group’s performance and in keeping with the commitments on safety and environment, will bear its first fruits in 2015.”
1 TOTAL changed the presentation currency of the Group’s Consolidated Financial Statements from the euro to the US dollar, effective January 1, 2014, to make its financial information more readable by better reflecting the performance of its activities, which are carried out mainly in US dollars. Comparative 2013 information has been restated. 2 Definition of adjusted results on page 2 – euro amounts represent dollar amounts converted at the average €-$ exchange rate for the period: 1.3711 $/€ in the second quarter 2014, 1.3062 $/€ in the second quarter 2013, 1.3696 $/€ in the first quarter 2014, 1.3703 $/€ in the first half 2014 and 1.3134 $/€ in the first half 2013. 3 Group share. 4 The ex-dividend date will be December 15, 2014, and the payment date will be December 17, 2014.
New
s Rel
ease
Com
mun
iqué
de
Pres
se
2, place Jean Millier Arche Nord Coupole/Regnault 92 400 Courbevoie France Tel. : +44 (0)207 719 7962 Fax : +44 (0)207 719 7959 Martin DEFFONTAINES Karine KACZKA Magali PAILHE Patrick GUENKEL Robert HAMMOND (U.S.) Tel. : +1 713-483-5070 Fax : +1 713-483-5629 TOTAL S.A. Capital 5 945 861 837,50 euros 542 051 180 R.C.S. Nanterre www.total.com

2
TOTAL 2, place de la Coupole La Défense 6 92 400 Courbevoie France Tel. : 33 (1) 47 44 58 53 Fax : 33 (1) 47 44 58 24 Jérôme SCHMITT Philippe HERGAUX Sandrine SABOUREAU Laurent KETTENMEYER Robert HAMMOND (U.S.) Tel. : (1) 201 626 3500 Fax : (1) 201 626 4004 TOTAL S.A Capital 5 981 907 382 euros 542 051 180 R.C.S. Nanterre www.total.com
Key figures5
2Q14 1Q14 2Q13 2Q14
vs 2Q13
Expressed in millions dollars except earnings per share and number of shares 1H14 1H13
1H14 vs
1H13
62,561 60,687 61,345 +2% Sales 123,248 124,906 -1%
5,583 6,182 6,708 -17% Adjusted operating income from business segments 11,765 14,211 -17%
3,824 3,699 4,005 -5% Adjusted net operating income from business segments 7,523 8,031 -6%
3,051 3,092 3,041 - Upstream 6,143 6,298 -2%
401 346 518 -23% Refining & Chemicals 747 955 -22%
372 261 446 -17% Marketing & Services 633 778 -19%
3,151 3,327 3,581 -12% Adjusted net income 6,478 7,279 -11%
1.38 1.46 1.57 -12% Adjusted fully-diluted earnings per share (dollars) 2.84 3.20 -11%
1.00 1.07 1.21 -17% Adjusted fully-diluted earnings per share (euro) 2.07 2.44 -15%
2,281 2,277 2,274 - Fully-diluted weighted-average shares (millions) 2,279 2,272 -
3,104 3,335 3,364 -8% Net income (Group share) 6,439 5,312 +21%
8,723 5,865 7,459 +17% Investments6 14,588 15,363 -5%
631 1,840 1,750 -64% Divestments 2,471 2,563 -4%
7,966 4,025 5,716 +39% Net investments7 11,991 12,336 -3%
5,277 5,338 4,838 +9% Cash flow from operations 10,615 9,751 +9%
5,931 6,204 6,625 -10% Adjusted cash flow from operations 12,135 13,380 -9%
Highlights since the beginning of the second quarter 20148
• Started up the deep-offshore CLOV oil field in Angola
• Launched the developments of Kaombo in ultra-deep offshore Angola and Edradour in the West of Shetland area of the UK
• Discovered oil on Ivory Coast deep-offshore block CI-514
• Acquired a 60% interest in the Glenlivet gas field in the West of Shetland area of the UK
• Announced the sales of the Group’s interests in the Shah Deniz field in Azerbaijan and coal mines in South Africa
• Announced agreements to sell Totalgaz and CCP Composites
• Signed an agreement for long-term sales of LNG to Singapore
5 Adjusted results are defined as income using replacement cost, adjusted for special items, excluding the impact of changes for fair value. Adjusted cash flow from operations is defined as cash flow from operations before changes in working capital at replacement cost; adjustment items are on page 16 and the inventory valuation effect is explained on page 13. 6 Including acquisitions. 7 Net investments = investments including acquisitions – asset sales – other transactions with non-controlling interests. 8 Certain transactions referred to in the highlights are subject to approval by authorities or to other conditions as per the agreements.

3
TOTAL 2, place de la Coupole La Défense 6 92 400 Courbevoie France Tel. : 33 (1) 47 44 58 53 Fax : 33 (1) 47 44 58 24 Jérôme SCHMITT Philippe HERGAUX Sandrine SABOUREAU Laurent KETTENMEYER Robert HAMMOND (U.S.) Tel. : (1) 201 626 3500 Fax : (1) 201 626 4004 TOTAL S.A Capital 5 981 907 382 euros 542 051 180 R.C.S. Nanterre www.total.com
Second quarter 2014 results
> Net operating income from business segments
In the second quarter 2014, the Brent price averaged 109.7 $/b, an increase of 7% compared to the second quarter 2013 and 1% compared to the first quarter 2014. The Group’s European refining margin indicator (ERMI) averaged 10.9 $/t compared to 24.1 $/t in the second quarter 2013 and 6.6 $/t in the first quarter 2014. The effective tax rate9 for the business segments was 48.8% in the second quarter 2014 compared to 53.2% in the second quarter 2013, reflecting mainly the benefit of tax allowances in the UK. Adjusted net operating income from the business segments was 3,824 M$ in the second quarter 2014 compared to 4,005 M$ in the second quarter 2013, a decrease of 5% mainly due to weaker performance from Refining & Chemicals, which faced a deteriorated refining environment in Europe, and less favorable conditions for certain Marketing & Services activities. In the Upstream, adjusted net operating income was stable despite a high level of maintenance, notably thanks to a lower effective tax rate this quarter.
> Net income (Group share)
Adjusted net income was 3,151 M$ compared to 3,581 M$ in the second quarter 2013, a decrease of 12%. Adjusted net income excludes the after-tax inventory effect, the effect of changes in fair value and special items10:
• The after-tax inventory effect had a positive impact on net income of 80 M$ in the second quarter 2014 compared to a negative impact of 525 M$ in the second quarter 2013.
• Changes in fair value had a negative impact on net income of 29 M$ in the second quarter 2014 compared to a negative impact of 31 M$ in the second quarter 2013.
• Special items11 had a negative impact on net income of 98 M$ in the second quarter 2014 compared to a positive impact of 339 M$ in the second quarter in 2013.
Net income (Group share) was 3,104 M$ compared to 3,364 M$ in the second quarter 2013. The effective tax rate for the Group was 55.1% in the second quarter 2014 compared to 55.3% in the second quarter 2013. On June 30, 2014, there were 2,284 million fully-diluted shares compared to 2,277 million shares on June 30, 2013. Adjusted fully-diluted earnings per share, based on 2,281 million fully-diluted weighted-average shares, was $1.38 compared to $1.57 in the second quarter 2013. Expressed in euro, adjusted fully-diluted earnings per share was €1.00, a 17% decrease.
9 Defined as: (tax on adjusted net operating income) / (adjusted net operating income - income from equity affiliates - dividends received from investments + tax on adjusted net operating income). 10 Detail shown on page 13. 11 Detail shown on page 16.

4
TOTAL 2, place de la Coupole La Défense 6 92 400 Courbevoie France Tel. : 33 (1) 47 44 58 53 Fax : 33 (1) 47 44 58 24 Jérôme SCHMITT Philippe HERGAUX Sandrine SABOUREAU Laurent KETTENMEYER Robert HAMMOND (U.S.) Tel. : (1) 201 626 3500 Fax : (1) 201 626 4004 TOTAL S.A Capital 5 981 907 382 euros 542 051 180 R.C.S. Nanterre www.total.com
> Investments – divestments12
Investments, excluding acquisitions and including changes in non-current loans, were 7.2 B$ in the second quarter 2014, an increase of 12% compared to 6.4 B$ in the second quarter 2013. Acquisitions were 1,100 M$ in the second quarter 2014, essentially comprised of the acquisition of an interest in the Elk and Antelope discoveries in Papua New Guinea, the acquisition of additional Novatek13 shares and the carry on the Utica gas and condensate field in the United States. Asset sales in the second quarter 2014 were 201 M$. Net investments14 were 8.0 B$ in the second quarter 2014 compared to 5.7 B$ in the second quarter 2013. The sale of Usan was not completed with Sinopec. The Group is actively pursuing the sale process for this asset.
> Cash flow
Cash flow from operations was 5,277 M$ in the second quarter 2014, an increase of 9% compared to the second quarter 2013. Adjusted cash flow from operations15 was 5,931 M$ in the second quarter 2014, a decrease of 10% compared to the second quarter 2013. The Group’s net cash flow16
in the second quarter 2014 was negative 2,689 M$ compared to negative 878 M$ in the second quarter 2013, reflecting essentially an increase in net investments between the two periods. The net-debt-to-equity ratio was 27.1% on June 30, 2014, compared to 23.5% on March 31, 2014, and 27.6% on June 30, 201317.
12 Detail shown on page 17. 13 The Group’s interest in Novatek was 18.0% at June 30, 2014. 14 Net investments = investments including acquisitions and changes in non-current loans – asset sales – other transactions with non-controlling interests. 15 Cash flow from operations at replacement cost before changes in working capital. 16 Net cash flow = cash flow from operations - net investments (including other transactions with non-controlling interests). 17 Detail shown on page 18.

5
TOTAL 2, place de la Coupole La Défense 6 92 400 Courbevoie France Tel. : 33 (1) 47 44 58 53 Fax : 33 (1) 47 44 58 24 Jérôme SCHMITT Philippe HERGAUX Sandrine SABOUREAU Laurent KETTENMEYER Robert HAMMOND (U.S.) Tel. : (1) 201 626 3500 Fax : (1) 201 626 4004 TOTAL S.A Capital 5 981 907 382 euros 542 051 180 R.C.S. Nanterre www.total.com
First half 2014 results
> Net operating income from business segments
In the first half 2014, the price of Brent averaged 108.9 $/b compared to 107.5 $/b in the first half 2013. The ERMI was 8.7 $/t compared to 25.5 $/t in the first half 2013.
The effective tax rate18 for the business segments was 52.5% in the first half 2014 compared to 56.0% in the first half 2013, reflecting mainly the benefit of tax allowances in the UK. Adjusted net operating income from the business segments was 7,523 M$ in the first half 2014 compared to 8,031 M$ in the first half 2013, a decrease of 6% that was mainly due to the weaker performance of the downstream in a much weaker European refining environment. In the Upstream, adjusted net operating income was stable despite a high level of maintenance, notably thanks to a lower effective tax rate this half.
> Net income (Group share)
Adjusted net income was 6,478 M$ compared to 7,279 M$ in the first half 2013, a decrease of 11%. Adjusted net income excludes the after-tax inventory effect, the effect of changes in fair value and special items19: • The after-tax inventory effect had a negative impact on net income of 57 M$ in the first
half 2014 compared to negative impact of 593 M$ in the first half 2013.
• Changes in fair value had a negative impact on net income of 8 M$ in the first half 2014 compared to a negative impact of 30 M$ in the first half 2013.
• Special items20 had a positive impact on net income of 26 M$ in the first half 2014, including mainly the gain on the sale (partial IPO) of an interest in Gaztransport & Technigaz (GTT) partially offset by the impairment of the Shtokman project in Russia. Special items had a negative impact on net income of 1,344 M$ in the first half 2013.
Net income (Group share) was 6,439 M$ compared to 5,312 M$ in the first half 2013. The effective tax rate for the Group was 56.5% in the first half 2014 compared to 57.4% in the first half 2013, reflecting mainly the benefit of tax allowances in the UK, and, effective January 1, 2014, due to its fiscal situation in France, the Group is no longer recognizing the benefit of tax credits related to net operating losses in France. On June 30, 2014, there were 2,284 million fully-diluted shares compared to 2,277 million shares on June 30, 2013. Adjusted fully-diluted earnings per share, based on 2,279 million fully-diluted weighted-average shares, was $2.84 in the first half 2014 compared to $3.20 in the first half 2013. Expressed in euro, adjusted fully-diluted earnings per share was €2.07, a decrease of 15%.
18 Defined as: (tax on adjusted net operating income) / (adjusted net operating income - income from equity affiliates - dividends received from investments + tax on adjusted net operating income). 19 Detail shown on page 13. 20 Detail shown on page 16.

6
TOTAL 2, place de la Coupole La Défense 6 92 400 Courbevoie France Tel. : 33 (1) 47 44 58 53 Fax : 33 (1) 47 44 58 24 Jérôme SCHMITT Philippe HERGAUX Sandrine SABOUREAU Laurent KETTENMEYER Robert HAMMOND (U.S.) Tel. : (1) 201 626 3500 Fax : (1) 201 626 4004 TOTAL S.A Capital 5 981 907 382 euros 542 051 180 R.C.S. Nanterre www.total.com
> Investments – divestments21
Investments, excluding acquisitions and including changes in non-current loans, were 12.4 B$ in the first half 2014, a decrease of 4% compared to 12.9 B$ in the first half 2013. Acquisitions were 1,399 M$ in the first half 2014, essentially comprised of the acquisition of an interest in the Elk and Antelope discoveries in Papua New Guinea, the acquisition of additional Novatek22 shares and the carry on the Utica gas and condensate field in the United States. Asset sales in the first half 2014 were 1,677 B$, essentially comprised of the sale of block 15/06 in Angola and the sale (partial IPO) of an interest in Gaztransport & Technigaz (GTT). Net investments23 were 12.0 B$ in the first half 2014, compared to 12.3 B$ in the first half 2013. The sale of Usan was not completed with Sinopec. The Group is actively pursuing the sale process for this asset.
> Cash flow
Cash flow from operations was 10,615 M$ in the first half 2014, an increase of 9% compared to the first half 2013. Adjusted cash flow from operations24 was 12,135 M$, a decrease of 9% compared to the first half 2013. The Group’s net cash flow25
was negative 1,376 M$ compared to negative 2,585 M$ in the first half 2013, reflecting essentially a decrease in investments and an increase in cash flow between the two periods. The net-debt-to-equity ratio was 27.1% on June 30, 2014, compared to 27.6% on June 30, 201326.
21 Detail shown on page 17. 22 The Group’s interest in Novatek was 18.0% at June 30, 2014 23 Net investments = investments including acquisitions and changes in non-current loans – asset sales – other transactions with non-controlling interests. 24 Cash flow from operations at replacement cost before changes in working capital. 25 Net cash flow = cash flow from operations - net investments (including other transactions with non-controlling interests). 26 Detail shown on page 18.
7
TOTAL 2, place de la Coupole La Défense 6 92 400 Courbevoie France Tel. : 33 (1) 47 44 58 53 Fax : 33 (1) 47 44 58 24 Jérôme SCHMITT Philippe HERGAUX Sandrine SABOUREAU Laurent KETTENMEYER Robert HAMMOND (U.S.) Tel. : (1) 201 626 3500 Fax : (1) 201 626 4004 TOTAL S.A Capital 5 981 907 382 euros 542 051 180 R.C.S. Nanterre www.total.com
Analysis of business segment results
Upstream
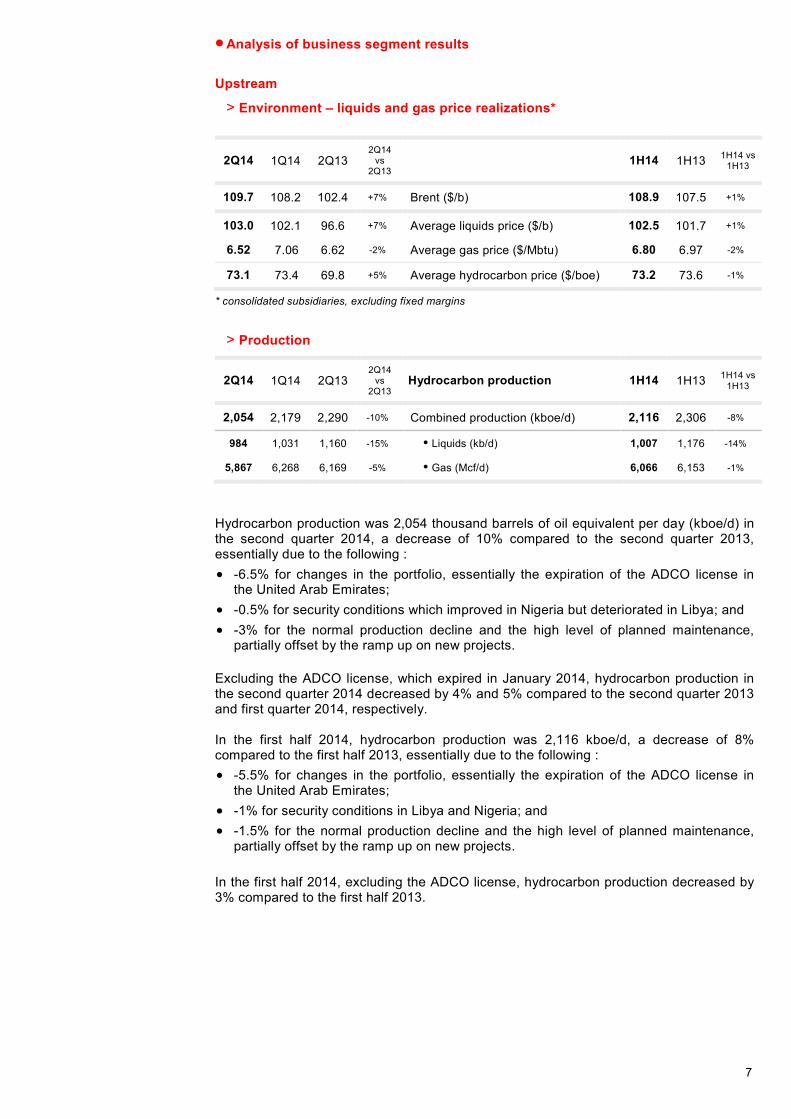
> Environment – liquids and gas price realizations*
2Q14 1Q14 2Q13 2Q14
vs 2Q13
1H14 1H13 1H14 vs 1H13
109.7 108.2 102.4 +7% Brent ($/b) 108.9 107.5 +1%
103.0 102.1 96.6 +7% Average liquids price ($/b) 102.5 101.7 +1%
6.52 7.06 6.62 -2% Average gas price ($/Mbtu) 6.80 6.97 -2%
73.1 73.4 69.8 +5% Average hydrocarbon price ($/boe) 73.2 73.6 -1%
* consolidated subsidiaries, excluding fixed margins
> Production
2Q14 1Q14 2Q13 2Q14
vs 2Q13
Hydrocarbon production 1H14 1H13 1H14 vs 1H13
2,054 2,179 2,290 -10% Combined production (kboe/d) 2,116 2,306 -8%
984 1,031 1,160 -15% Liquids (kb/d) 1,007 1,176 -14%
5,867 6,268 6,169 -5% Gas (Mcf/d) 6,066 6,153 -1%
Hydrocarbon production was 2,054 thousand barrels of oil equivalent per day (kboe/d) in the second quarter 2014, a decrease of 10% compared to the second quarter 2013, essentially due to the following : • -6.5% for changes in the portfolio, essentially the expiration of the ADCO license in
the United Arab Emirates; • -0.5% for security conditions which improved in Nigeria but deteriorated in Libya; and • -3% for the normal production decline and the high level of planned maintenance,
partially offset by the ramp up on new projects.
Excluding the ADCO license, which expired in January 2014, hydrocarbon production in the second quarter 2014 decreased by 4% and 5% compared to the second quarter 2013 and first quarter 2014, respectively. In the first half 2014, hydrocarbon production was 2,116 kboe/d, a decrease of 8% compared to the first half 2013, essentially due to the following : • -5.5% for changes in the portfolio, essentially the expiration of the ADCO license in
the United Arab Emirates; • -1% for security conditions in Libya and Nigeria; and • -1.5% for the normal production decline and the high level of planned maintenance,
partially offset by the ramp up on new projects. In the first half 2014, excluding the ADCO license, hydrocarbon production decreased by 3% compared to the first half 2013.

8
TOTAL 2, place de la Coupole La Défense 6 92 400 Courbevoie France Tel. : 33 (1) 47 44 58 53 Fax : 33 (1) 47 44 58 24 Jérôme SCHMITT Philippe HERGAUX Sandrine SABOUREAU Laurent KETTENMEYER Robert HAMMOND (U.S.) Tel. : (1) 201 626 3500 Fax : (1) 201 626 4004 TOTAL S.A Capital 5 981 907 382 euros 542 051 180 R.C.S. Nanterre www.total.com
> Results
2Q14 1Q14 2Q13 2Q14
vs 2Q13
In millions of dollars 1H14 1H13 1H14 vs 1H13
4,810 5,501 5,621 -14% Adjusted operating income* 10,311 12,170 -15%
3,051 3,092 3,041 - Adjusted net operating income* 6,143 6,298 -2%
769 733 687 +12% • includes income from equity affiliates 1,502 1,524 -1%
7,999 5,311 6,603 +21% Investments 13,310 13,544 -2%
568 1,799 1,456 -61% Divestments 2,367 2,174 +9%
4,805 3,811 2,764 +74% Cash flow from operations 8,616 8,245 +4%
4,841 5,133 5,595 -13% Adjusted cash flow from operations 9,974 11,123 -10%
* detail of adjustment items shown in the business segment information annex to financial statements. Adjusted net operating income from the Upstream segment was 3,051 M$ in the second quarter 2014, stable compared to the second quarter 2013. The negative impact of the decrease in hydrocarbon production and the increase in costs due to the high level of planned maintenance was offset mainly by the higher realized price for liquids and the lower tax rate. The effective tax rate for the Upstream segment was 52.3% compared to 58.2% in the second quarter 2013. This decrease is mainly due to tax allowances in the UK, notably on the Laggan field, recognized in the second quarter 2014. Adjusted net operating income from the Upstream segment in the first half 2014 was 6,143 M$ compared to 6,298 M$ in the first half 2013, a decrease of 2% reflecting essentially the lower production and higher costs due to the high level of planned maintenance, partially offset by the lower tax rate. The return on average capital employed (ROACE27) for the Upstream segment was 13% for the twelve months ended June 30, 2014, compared to 13% for the twelve months ended March 31, 2014, and 14% for the full-year 2013.
27 Calculated based on adjusted net operating income and average capital employed, using replacement cost, as shown on page 19.

9
TOTAL 2, place de la Coupole La Défense 6 92 400 Courbevoie France Tel. : 33 (1) 47 44 58 53 Fax : 33 (1) 47 44 58 24 Jérôme SCHMITT Philippe HERGAUX Sandrine SABOUREAU Laurent KETTENMEYER Robert HAMMOND (U.S.) Tel. : (1) 201 626 3500 Fax : (1) 201 626 4004 TOTAL S.A Capital 5 981 907 382 euros 542 051 180 R.C.S. Nanterre www.total.com
Refining & Chemicals
> Refinery throughput and utilization rates*
2Q14 1Q14 2Q13 2Q14
vs 2Q13
1H14 1H13 1H14
vs 1H13
1,622 1,700 1,772 -8% Total refinery throughput (kb/d) 1,662 1,769 -6%
634 617 729 -13% France 626 678 -8%
695 787 781 -11% Rest of Europe 741 824 -10%
293 296 262 +12% Rest of world 295 267 +10%
Utlization rates**
72% 77% 83% - Based on crude only 72% 83% -
74% 83% 87% - Based on crude and other feedstock 76% 86% -
* includes share of TotalErg. Results for refineries in South Africa, French Antilles and Italy are reported in the Marketing & Services segment. ** based on distillation capacity at the beginning of the year.
In the second quarter 2014, refinery throughput decreased by 8% compared to the second quarter 2013, reflecting essentially the turnarounds at Leuna and Vlissingen as well as voluntary shutdowns in response to weak refining margins in Europe. Included in June are the first runs from the new Satorp refinery, where all the units are now operational. In the first half 2014, refinery throughput decreased by 6% compared to the first half 2013, reflecting essentially the turnarounds at Grandpuits, Leuna and Vlissingen, as well as voluntary shutdowns in response to weak refining margins in Europe.
> Results
2Q14 1Q14 2Q13 2Q14
vs 2Q13
In millions of dollars (except the ERMI) 1H14 1H13
1H14 vs
1H13
10.9 6.6 24.1 -55% European refining margin indicator - ERMI ($/t) 8.7 25.5 -66%
368 328 520 -29% Adjusted operating income* 696 958 -27%
401 346 518 -23% Adjusted net operating income* 747 955 -22%
174 139 146 +18% • contribution of Specialty chemicals** 313 265 +18%
475 250 499 -5% Investments 725 1,202 -40%
15 11 272 -94% Divestments 26 308 -92%
(133) 1,593 1,713 na Cash flow from operations 1,460 1,331 +10%
683 617 800 -15% Adjusted cash flow from operations 1,300 1,441 -10%
* detail of adjustment items shown in the business segment information annex to financial statements. ** Hutchinson, Bostik, Atotech. The ERMI averaged 10.9 $/t in the second quarter 2014, a decrease of 55% compared to the second quarter 2013. Petrochemical margins remained high in the United States but retreated in Europe and Asia. Adjusted net operating income from the Refining & Chemicals segment was 401 M$ in the second quarter 2014, compared to 518 M$ in the second quarter 2013, reflecting essentially the deterioration of the European refining environment, partially offset by the ongoing implementation of synergy and efficiency plans between the two periods.

10
TOTAL 2, place de la Coupole La Défense 6 92 400 Courbevoie France Tel. : 33 (1) 47 44 58 53 Fax : 33 (1) 47 44 58 24 Jérôme SCHMITT Philippe HERGAUX Sandrine SABOUREAU Laurent KETTENMEYER Robert HAMMOND (U.S.) Tel. : (1) 201 626 3500 Fax : (1) 201 626 4004 TOTAL S.A Capital 5 981 907 382 euros 542 051 180 R.C.S. Nanterre www.total.com
Adjusted net operating income from the Refining & Chemicals segment for the first half 2014 was 747 M$, a decrease of 22% compared to the first half 2013, reflecting essentially the strong deterioration of the European refining environment. The ROACE28 for the Refining & Chemicals segment was 8% for the twelve months ended June 30, 2014, compared to 9% for the twelve months ended March 31, 2014, and 9% for the full-year 2013.
Marketing & Services
> Refined product sales
2Q14 1Q14 2Q13 2Q14
vs 2Q13
Sales in kb/d*
1H14 1H13 1H14
vs 1H13
1,102 1,058 1,150 -4% Europe 1,080 1,129 -4%
731 593 633 +15% Rest of world 662 620 +7%
1,833 1,651 1,783 +3% Total Marketing & Services sales 1,742 1,749 -
* excludes trading and bulk Refining sales, includes share of TotalErg In the second quarter 2014, sales increased by 3% compared to the second quarter last year, mainly due to higher network sales, particularly in Africa, Middle East and Europe, partially offset by lower sales of domestic fuels and LPGs. Sales volumes for the first half 2014 were stable compared to the first half 2013, due to the offsetting effects of a 4% decrease in European sales and net growth outside of Europe, particularly in the Americas and Middle East.
> Results
2Q14 1Q14 2Q13 2Q14
vs 2Q13
In millions of dollars 1H14 1H13 1H14
vs 1H13
28,213 26,470 26,851 +5% Sales 54,683 54,583 -
405 353 567 -29% Adjusted operating income* 758 1,083 -30%
372 261 446 -17% Adjusted net operating income* 633 778 -19%
(8) 28 - na • contribution of New Energies 20 (17) na
203 276 318 -36% Investments 479 564 -15%
28 26 16 +75% Divestments 54 66 -18%
304 89 542 -44% Cash flow from operations 393 422 -7%
551 379 704 -22% Adjusted cash flow from operations 930 1,255 -26%
* detail of adjustment items shown in the business segment information annex to financial statements.
28 Calculated based on adjusted net operating income and average capital employed, using replacement cost, as shown on page 19.

11
TOTAL 2, place de la Coupole La Défense 6 92 400 Courbevoie France Tel. : 33 (1) 47 44 58 53 Fax : 33 (1) 47 44 58 24 Jérôme SCHMITT Philippe HERGAUX Sandrine SABOUREAU Laurent KETTENMEYER Robert HAMMOND (U.S.) Tel. : (1) 201 626 3500 Fax : (1) 201 626 4004 TOTAL S.A Capital 5 981 907 382 euros 542 051 180 R.C.S. Nanterre www.total.com
The Marketing & Services segment’s sales were 28 B$ in the second quarter 2014, an increase of 5% compared to the second quarter 2013. Adjusted net operating income from the Marketing & Services segment was 372 M$ in the second quarter 2014, a decrease of 17% compared to the second quarter 2013, reflecting in particular less favorable margins in Europe related to weather conditions. Adjusted net operating income from the Marketing & Services segment in the first half 2014 was 633 M$, a decrease of 19% compared to the first half 2013, essentially due to the impact of weather conditions on sales and a less favorable trend in European margins, partially offset by a global increase in the marketing of petroleum products in growing markets. The ROACE29 for the Marketing & Services segment was 14% for the twelve months ended June 30, 2014, compared to 15% for the twelve months ended March 31, 2014, and 16% for the full-year 2013.
29 Calculated based on adjusted net operating income and average capital employed, using replacement cost, as shown on page 19.

12
TOTAL 2, place de la Coupole La Défense 6 92 400 Courbevoie France Tel. : 33 (1) 47 44 58 53 Fax : 33 (1) 47 44 58 24 Jérôme SCHMITT Philippe HERGAUX Sandrine SABOUREAU Laurent KETTENMEYER Robert HAMMOND (U.S.) Tel. : (1) 201 626 3500 Fax : (1) 201 626 4004 TOTAL S.A Capital 5 981 907 382 euros 542 051 180 R.C.S. Nanterre www.total.com
TOTAL S.A. parent company accounts
Net income for TOTAL S.A., the parent company, was 3,397 M€ in the first half 2014, compared to 3,876 M€ in the first half 2013.
Summary and outlook The ROACE30 for the Group for the twelve months ended June 30, 2014, was 12%. This compares with 12% for the twelve months ended March 31, 2014, and 13% for the full-year 2013. Return on equity for the twelve months ended June 30, 2014, was 14%. In the Upstream, before the end of this year, CLOV should reach its production plateau of 160 kb/d, and the Group should start up Laggan-Tormore and Ofon Phase 2. In exploration, results are expected in the coming months from high-potential wells currently drilling in Angola’s Kwanza basin, in South Africa and in Indonesia. In the downstream, all of the units at the Satorp refinery in Saudi Arabia are operational. Since the start of the third quarter 2014, European refining margins have improved compared to the very low levels in the first half 2014, but remain very volatile. Several asset sales have been announced this year, and, as they are closed, the program total will be well within the objective of $15-20 billion for the 2012-14 period. In addition, all of the teams are involved in the finalization of the announced cost reduction plan, which will be presented at the Investors’ day on September 22, 2014. As approved by the Board of Directors on April 29, 2014, Total will pay a first quarter 2014 interim dividend of 0.61 €/share on September 26, 2014.
♦ ♦ ♦ To listen to CFO Patrick de La Chevardière’s conference call with financial analysts today at 14:00 (London time) please log on to www.total.com or call +44 (0)203 364 5196 in Europe or +1 855 255 3886 in the United States. For a replay, please consult the website or call +44 (0)203 367 9460 in Europe or +1 877 642 3018 in the United States (code: 288310).
30 Calculated based on adjusted net operating income and average capital employed, using replacement cost, as shown on page 19.

13
TOTAL 2, place de la Coupole La Défense 6 92 400 Courbevoie France Tel. : 33 (1) 47 44 58 53 Fax : 33 (1) 47 44 58 24 Jérôme SCHMITT Philippe HERGAUX Sandrine SABOUREAU Laurent KETTENMEYER Robert HAMMOND (U.S.) Tel. : (1) 201 626 3500 Fax : (1) 201 626 4004 TOTAL S.A Capital 5 981 907 382 euros 542 051 180 R.C.S. Nanterre www.total.com
This document does not constitute the Financial Report for the first half which will be separately published, in accordance with article L.451-1-2 III of the French Code monétaire et financier, and is available on the Total website www.total.com.. This press release presents the first half 2014 results from the consolidated financial statements of TOTAL S.A. as of June 30, 2014. The notes to these consolidated financial statements (unaudited) are available on the TOTAL web site (www.total.com). This document may contain forward-looking information on the Group (including objectives and trends), as well as forward-looking statements within the meaning of the Private Securities Litigation Reform Act of 1995, notably with respect to the financial condition, results of operations, business, strategy and plans of TOTAL. These data do not represent forecasts within the meaning of European Regulation No. 809/2004. Such forward-looking information and statements included in this document are based on a number of economic data and assumptions made in a given economic, competitive and regulatory environment. They may prove to be inaccurate in the future, and are subject to a number of risk factors that could lead to a significant difference between actual results and those anticipated, including currency fluctuations, the price of petroleum products, the ability to realize cost reductions and operating efficiencies without unduly disrupting business operations, environmental regulatory considerations and general economic and business conditions. Certain financial information is based on estimates particularly in the assessment of the recoverable value of assets and potential impairments of assets relating thereto. Neither TOTAL nor any of its subsidiaries assumes any obligation to update publicly any forward-looking information or statement, objectives or trends contained in this document whether as a result of new information, future events or otherwise. Further information on factors, risks and uncertainties that could affect the Company’s financial results or the Group’s activities is provided in the most recent Registration Document filed by the Company with the French Autorité des Marchés Financiers and annual report on Form 20-F filed with the United States Securities and Exchange Commission (“SEC”). Financial information by business segment is reported in accordance with the internal reporting system and shows internal segment information that is used to manage and measure the performance of TOTAL. Performance indicators excluding the adjustment items, such as adjusted operating income, adjusted net operating income, and adjusted net income are meant to facilitate the analysis of the financial performance and the comparison of income between periods. These adjustment items include: (i) Special items Due to their unusual nature or particular significance, certain transactions qualified as "special items" are excluded from the business segment figures. In general, special items relate to transactions that are significant, infrequent or unusual. However, in certain instances, transactions such as restructuring costs or asset disposals, which are not considered to be representative of the normal course of business, may be qualified as special items although they may have occurred within prior years or are likely to occur again within the coming years. (ii) Inventory valuation effect The adjusted results of the Refining & Chemicals and Marketing & Services segments are presented according to the replacement cost method. This method is used to assess the segments’ performance and facilitate the comparability of the segments’ performance with those of its competitors. In the replacement cost method, which approximates the LIFO (Last-In, First-Out) method, the variation of inventory values in the statement of income is, depending on the nature of the inventory, determined using either the month-end price differentials between one period and another or the average prices of the period rather than the historical value. The inventory valuation effect is the difference between the results according to the FIFO (First-In, First-Out) and the replacement cost. (iii) Effect of changes in fair value The effect of changes in fair value presented as an adjustment item reflects for some transactions differences between internal measures of performance used by TOTAL’s management and the accounting for these transactions under IFRS. IFRS requires that trading inventories be recorded at their fair value using period-end spot prices. In order to best reflect the management of economic exposure through derivative transactions, internal indicators used to measure performance include valuations of trading inventories based on forward prices. Furthermore, TOTAL, in its trading activities, enters into storage contracts, which future effects are recorded at fair value in Group’s internal economic performance. IFRS precludes recognition of this fair value effect. The adjusted results (adjusted operating income, adjusted net operating income, adjusted net income) are defined as replacement cost results, adjusted for special items, excluding the effect of changes in fair value. Euro amounts presented herein represent dollar amounts converted at the average euro-dollar exchange rate for the applicable period and are not the result of financial statements prepared in euros. Cautionary Note to U.S. Investors – The SEC permits oil and gas companies, in their filings with the SEC, to separately disclose proved, probable and possible reserves that a company has determined in accordance with SEC rules. We may use certain terms in this presentation, such as resources, that the SEC’s guidelines strictly prohibit us from including in filings with the SEC. U.S. investors are urged to consider closely the disclosure in our Form 20-F, File N° 1-10888, available from us at 2, Place Jean Millier – Arche Nord Coupole/Regnault - 92078 Paris-La Défense Cedex, France, or at our website: www.total.com. You can also obtain this form from the SEC by calling 1-800-SEC-0330 or on the SEC’s website: www.sec.gov.

14
TOTAL 2, place de la Coupole La Défense 6 92 400 Courbevoie France Tel. : 33 (1) 47 44 58 53 Fax : 33 (1) 47 44 58 24 Jérôme SCHMITT Philippe HERGAUX Sandrine SABOUREAU Laurent KETTENMEYER Robert HAMMOND (U.S.) Tel. : (1) 201 626 3500 Fax : (1) 201 626 4004 TOTAL S.A Capital 5 981 907 382 euros 542 051 180 R.C.S. Nanterre www.total.com
Operating information by segment for the second quarter and first half 2014
Upstream
2Q14 1Q14 2Q13 2Q14 vs 2Q13
Combined liquids and gas production by region (kboe/d) 1H14 1H13 1H14 vs
1H13
329 394 383 -14% Europe 361 388 -7%
618 655 688 -10% Africa 637 690 -8%
380 405 527 -28% Middle East 393 535 -27%
91 82 70 +30% North America 86 71 +21%
157 159 171 -8% South America 158 172 -8%
238 242 229 +4% Asia-Pacific 240 232 +3%
241 242 222 +9% CIS 241 218 +11%
2,054 2,179 2,290 -10% Total production 2,116 2,306 -8%
544 583 678 -20% Includes equity affiliates 563 679 -17%
2Q14 1Q14 2Q13 2Q14 vs 2Q13 Liquids production by region (kb/d) 1H14 1H13 1H14 vs
1H13
159 172 154 +3% Europe 165 160 +3%
482 508 542 -11% Africa 495 547 -10%
190 203 320 -41% Middle East 197 324 -39%
40 34 27 +48% North America 37 27 +37%
50 50 55 -9% South America 50 56 -11%
29 30 29 - Asia-Pacific 29 30 -3%
34 34 33 +3% CIS 34 32 +6%
984 1,031 1,160 -15% Total production 1,007 1,176 -14%
197 208 323 -39% Includes equity affiliates 202 324 -38%

15
TOTAL 2, place de la Coupole La Défense 6 92 400 Courbevoie France Tel. : 33 (1) 47 44 58 53 Fax : 33 (1) 47 44 58 24 Jérôme SCHMITT Philippe HERGAUX Sandrine SABOUREAU Laurent KETTENMEYER Robert HAMMOND (U.S.) Tel. : (1) 201 626 3500 Fax : (1) 201 626 4004 TOTAL S.A Capital 5 981 907 382 euros 542 051 180 R.C.S. Nanterre www.total.com
2Q14 1Q14 2Q13 2Q14 vs 2Q13 Gas production by region (Mcf/d) 1H14 1H13 1H14 vs
1H13
936 1,215 1,285 -27% Europe 1,075 1,250 -14%
710 748 741 -4% Africa 729 724 +1%
1,042 1,104 1,105 -6% Middle East 1,073 1,135 -5%
285 266 242 +18% North America 276 246 +12%
601 609 649 -7% South America 605 643 -6%
1,188 1,202 1,121 +6% Asia-Pacific 1,194 1,136 +5%
1,105 1,124 1,026 +8% CIS 1,114 1,019 +9%
5,867 6,268 6,169 -5% Total production 6,066 6,153 -1%
1,895 2,029 1,900 - Includes equity affiliates 1,962 1,911 +3%
2Q14 1Q14 2Q13 2Q14 vs 2Q13 Liquefied natural gas 1H14 1H13 1H14 vs
1H13
2.93 3.12 2.89 +1% LNG sales* (Mt) 6.05 5.82 +4%
* sales, Group share, excluding trading; 2013 data restated to reflect volume estimates for Bontang LNG in Indonesia based on the 2013 SEC coefficient.
Downstream (Refining & Chemicals and Marketing & Services)
2Q14 1Q14 2Q13 2Q14
vs 2Q13
Refined product sales by region (kb/d)* 1H14 1H13 1H14
vs 1H13
2,017 2,005 2,074 -3% Europe ** 2,011 2,077 -3%
587 475 442 +33% Africa 531 445 +19%
643 474 544 +18% Americas 559 513 +9%
611 573 520 +18% Rest of world 592 513 +15%
3,858 3,528 3,580 +8% Total consolidated sales 3,693 3,547 +4%
576 634 635 -9% Includes bulk sales 605 629 -4%
1,449 1,243 1,162 +25% Includes trading 1,346 1,169 +15%
* includes share of TotalErg.
** restated historical amounts.
16
TOTAL 2, place de la Coupole La Défense 6 92 400 Courbevoie France Tel. : 33 (1) 47 44 58 53 Fax : 33 (1) 47 44 58 24 Jérôme SCHMITT Philippe HERGAUX Sandrine SABOUREAU Laurent KETTENMEYER Robert HAMMOND (U.S.) Tel. : (1) 201 626 3500 Fax : (1) 201 626 4004 TOTAL S.A Capital 5 981 907 382 euros 542 051 180 R.C.S. Nanterre www.total.com
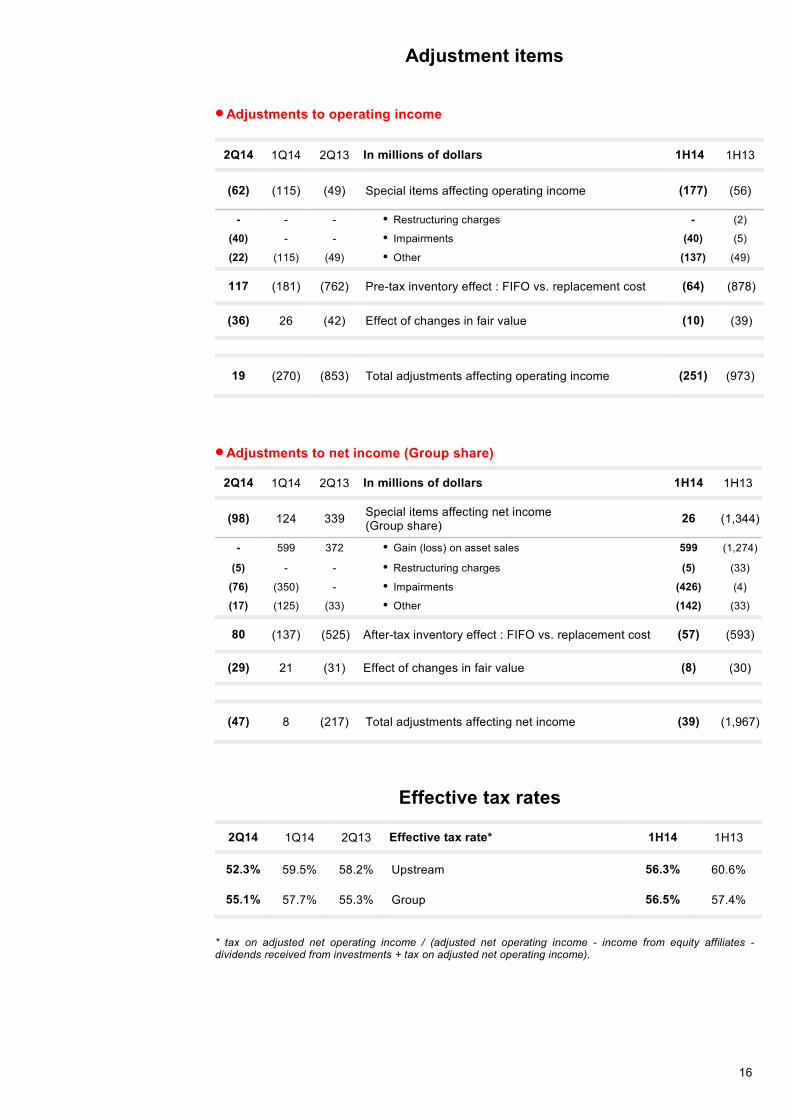
Adjustment items
Adjustments to operating income
2Q14 1Q14 2Q13 In millions of dollars 1H14 1H13
(62) (115) (49) Special items affecting operating income (177) (56)
- - - Restructuring charges - (2)
(40) - - Impairments (40) (5)
(22) (115) (49) Other (137) (49)
117 (181) (762) Pre-tax inventory effect : FIFO vs. replacement cost (64) (878)
(36) 26 (42) Effect of changes in fair value (10) (39)
19 (270) (853) Total adjustments affecting operating income (251) (973)
Adjustments to net income (Group share)
2Q14 1Q14 2Q13 In millions of dollars 1H14 1H13
(98) 124 339 Special items affecting net income (Group share) 26 (1,344)
- 599 372 Gain (loss) on asset sales 599 (1,274)
(5) - - Restructuring charges (5) (33)
(76) (350) - Impairments (426) (4)
(17) (125) (33) Other (142) (33)
80 (137) (525) After-tax inventory effect : FIFO vs. replacement cost (57) (593)
(29) 21 (31) Effect of changes in fair value (8) (30)
(47) 8 (217) Total adjustments affecting net income (39) (1,967)
Effective tax rates
2Q14 1Q14 2Q13 Effective tax rate* 1H14 1H13
52.3% 59.5% 58.2% Upstream 56.3% 60.6%
55.1% 57.7% 55.3% Group 56.5% 57.4%
* tax on adjusted net operating income / (adjusted net operating income - income from equity affiliates - dividends received from investments + tax on adjusted net operating income).

17
TOTAL 2, place de la Coupole La Défense 6 92 400 Courbevoie France Tel. : 33 (1) 47 44 58 53 Fax : 33 (1) 47 44 58 24 Jérôme SCHMITT Philippe HERGAUX Sandrine SABOUREAU Laurent KETTENMEYER Robert HAMMOND (U.S.) Tel. : (1) 201 626 3500 Fax : (1) 201 626 4004 TOTAL S.A Capital 5 981 907 382 euros 542 051 180 R.C.S. Nanterre www.total.com
Investments - Divestments
2Q14 1Q14 2Q13 2Q14
vs 2Q13
Expressed in millions of dollars 1H14 1H13 1H14
vs 1H13
7,193 5,202 6,449 +12% Investments excluding acquisitions 12,395 12,864 -4%
362 319 518 -30% • Capitalized exploration 681 996 -32%
1,075 261 367 x3 • Increase in non-current loans 1,336 991 +35%
(430) (364) (357) +20% • Repayment of non-current loans (794) (616) +29%
1,100 299 653 +68% Acquisitions 1,399 1,883 -26%
201 1,476 1,393 -86% Asset sales 1,677 1,947 -14%
126 - (7) na Other transactions with non-controlling interests 126 464 -73%
7,966 4,025 5,716 +39% Net investments* 11,991 12,336 -3%
* Net investments = investments including acquisitions – asset sales – other transactions with non-
controlling interests.

18
TOTAL 2, place de la Coupole La Défense 6 92 400 Courbevoie France Tel. : 33 (1) 47 44 58 53 Fax : 33 (1) 47 44 58 24 Jérôme SCHMITT Philippe HERGAUX Sandrine SABOUREAU Laurent KETTENMEYER Robert HAMMOND (U.S.) Tel. : (1) 201 626 3500 Fax : (1) 201 626 4004 TOTAL S.A Capital 5 981 907 382 euros 542 051 180 R.C.S. Nanterre www.total.com
Net-debt-to-equity ratio
in millions of dollars 6/30/2014 3/31/2014 6/30/2013
Current borrowings 13,525 11,676 13,119
Net current financial assets (531) (522) (609)
Net financial assets classified as held for sale (62) (17) 1,014
Non-current financial debt 39,433 37,506 29,557
Hedging instruments of non-current debt (1,973) (1,758) (1,708)
Cash and cash equivalents (22,166) (22,787) (15,118)
Net debt 28,226 24,098 26,255
Shareholders’ equity 102,872 103,136 94,790
Estimated dividend payable (1,894) (3,817) (1,750)
Non-controlling interests 3,344 3,248 2,225
Equity 104,322 102,567 95,265
Net-debt-to-equity ratio 27.1% 23.5% 27.6%
2014 sensitivities*
Scenario Change Impact on adjusted operating income
(e)
Impact on adjusted net operating income
(e)
Dollar 1.30 $/€ +0.1 $ per € -0.7 B$ -0.3 B$
Brent 100 $/b +1 $/b +0.30 B$ +0.15 B$
European refining margin index (ERMI) 30 $/t +1 $/t +0.08 B$ +0.05 B$
*Sensitivities are revised once per year upon publication of the previous year’s fourth quarter results. Following the change to dollar-denominated reporting, effective January 1, 2014, the €-$ sensitivity has been changed. The impact of the €-$ sensitivity on operating income and on net operating income is 60% and 80% attributable to the Refining & Chemicals segment, respectively.
Sensitivities are estimates based on assumptions about the Group’s portfolio in 2014. Actual results could vary significantly from estimates based on the application of these sensitivities.

19
TOTAL 2, place de la Coupole La Défense 6 92 400 Courbevoie France Tel. : 33 (1) 47 44 58 53 Fax : 33 (1) 47 44 58 24 Jérôme SCHMITT Philippe HERGAUX Sandrine SABOUREAU Laurent KETTENMEYER Robert HAMMOND (U.S.) Tel. : (1) 201 626 3500 Fax : (1) 201 626 4004 TOTAL S.A Capital 5 981 907 382 euros 542 051 180 R.C.S. Nanterre www.total.com
Return on average capital employed
Twelve months ended June 30, 2014
in millions of dollars Upstream Refining & Chemicals
Marketing & Services
Group
Adjusted net operating income 12,295 1,649 1,409 14,431
Capital employed at 6/30/2013* 91,097 20,924 9,838 118,852
Capital employed at 6/30/2014* 103,572 19,265 10,324 129,967
ROACE 12.6% 8.2% 14.0%
11.6%
Twelve months ended March 31, 2014
in millions of dollars Upstream Refining &
Chemicals Marketing & Services
Group
Adjusted net operating income 12,285 1,766 1,483 14,863
Capital employed at 3/31/2013* 86,034 21,860 9,610 116,094
Capital employed at 3/31/2014* 97,924 18,516 10,314 126,068
ROACE 13.4% 8.7% 14.9% 12.3%
Full-year 2013
in millions of dollars Upstream Refining & Chemicals
Marketing & Services
Group
Adjusted net operating income 12,450 1,857 1,554 15,230
Capital employed at 12/31/2012* 84,260 20,783 9,232 111,080
Capital employed at 12/31/2013* 95,529 19,752 10,051 122,451
ROACE 13.8% 9.2% 16.1% 13.0%
* at replacement cost (excluding after-tax inventory effect).
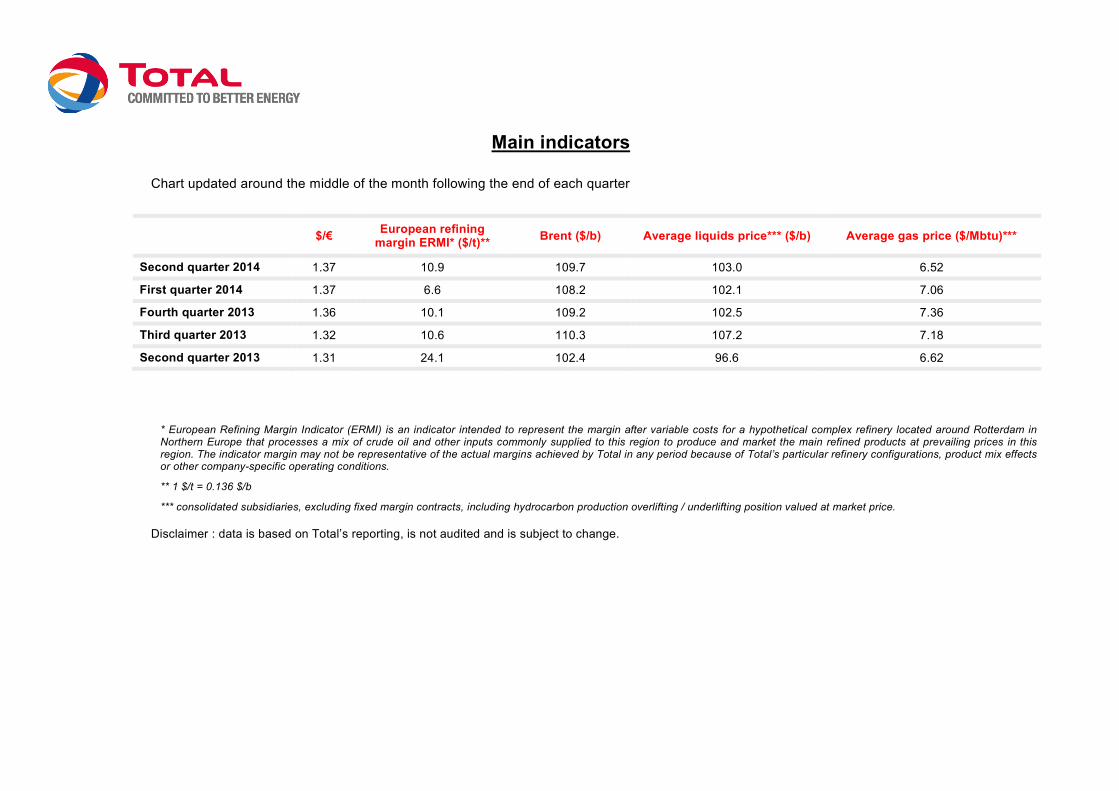
Main indicators
Chart updated around the middle of the month following the end of each quarter
$/€ European refining margin ERMI* ($/t)** Brent ($/b) Average liquids price*** ($/b) Average gas price ($/Mbtu)***
Second quarter 2014 1.37 10.9 109.7 103.0 6.52
First quarter 2014 1.37 6.6 108.2 102.1 7.06
Fourth quarter 2013 1.36 10.1 109.2 102.5 7.36
Third quarter 2013 1.32 10.6 110.3 107.2 7.18
Second quarter 2013 1.31 24.1 102.4 96.6 6.62
* European Refining Margin Indicator (ERMI) is an indicator intended to represent the margin after variable costs for a hypothetical complex refinery located around Rotterdam in Northern Europe that processes a mix of crude oil and other inputs commonly supplied to this region to produce and market the main refined products at prevailing prices in this region. The indicator margin may not be representative of the actual margins achieved by Total in any period because of Total’s particular refinery configurations, product mix effects or other company-specific operating conditions.
** 1 $/t = 0.136 $/b
*** consolidated subsidiaries, excluding fixed margin contracts, including hydrocarbon production overlifting / underlifting position valued at market price. Disclaimer : data is based on Total’s reporting, is not audited and is subject to change.
Total financial statements Second quarter 2014 consolidated accounts, IFRS
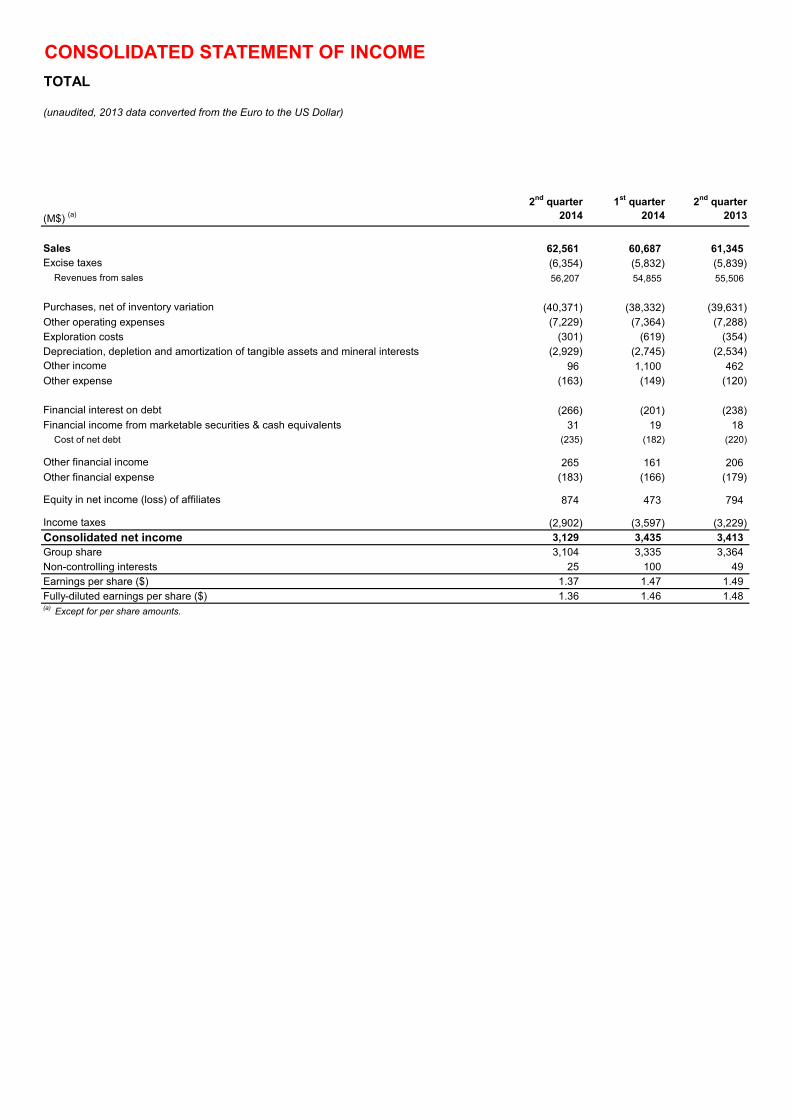
CONSOLIDATED STATEMENT OF INCOMETOTAL
(M$) (a)2nd quarter
20141st quarter
20142nd quarter
2013
Sales 62,561 60,687 61,345Excise taxes (6,354) (5,832) (5,839)
Revenues from sales 56,207 54,855 55,506
Purchases, net of inventory variation (40,371) (38,332) (39,631)Other operating expenses (7,229) (7,364) (7,288)Exploration costs (301) (619) (354)Depreciation, depletion and amortization of tangible assets and mineral interests (2,929) (2,745) (2,534)Other income 96 1,100 462Other expense (163) (149) (120)
Financial interest on debt (266) (201) (238)Financial income from marketable securities & cash equivalents 31 19 18
Cost of net debt (235) (182) (220)
Other financial income 265 161 206Other financial expense (183) (166) (179)
Equity in net income (loss) of affiliates 874 473 794
Income taxes (2,902) (3,597) (3,229)Consolidated net income 3,129 3,435 3,413Group share 3,104 3,335 3,364Non-controlling interests 25 100 49Earnings per share ($) 1.37 1.47 1.49 Fully-diluted earnings per share ($) 1.36 1.46 1.48 (a) Except for per share amounts.
(unaudited, 2013 data converted from the Euro to the US Dollar)
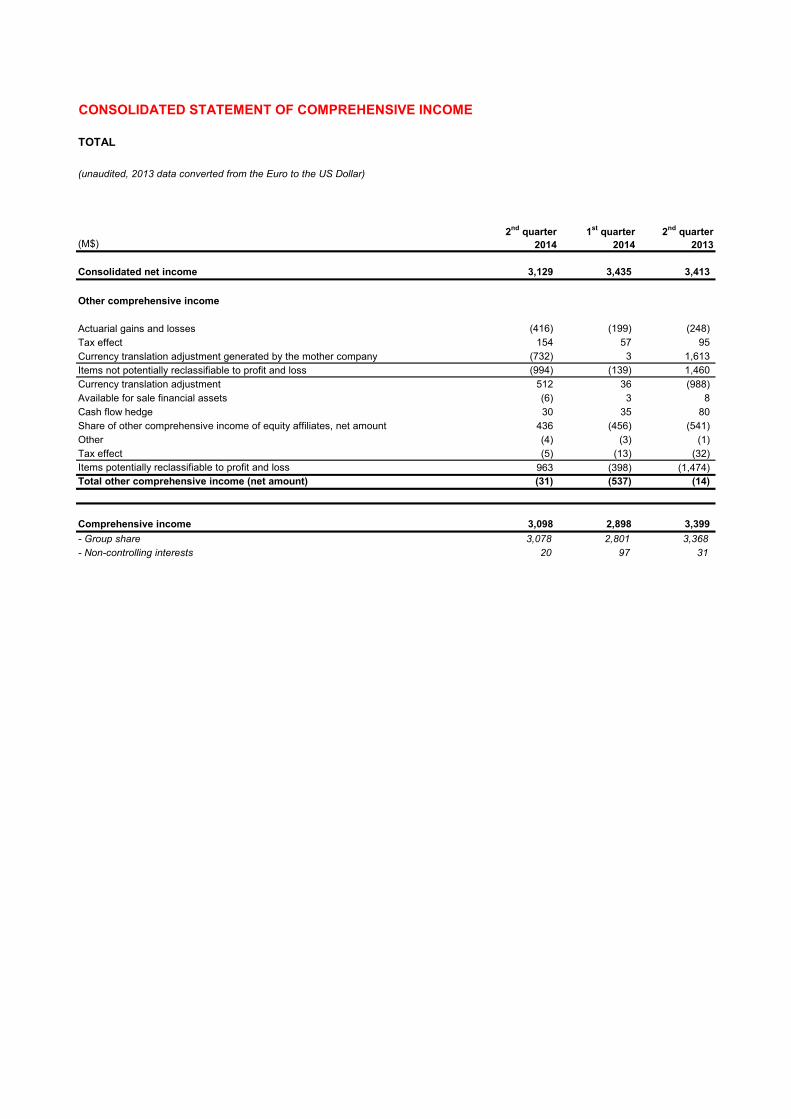
CONSOLIDATED STATEMENT OF COMPREHENSIVE INCOME
TOTAL
(M$)2nd quarter
20141st quarter
20142nd quarter
2013
Consolidated net income 3,129 3,435 3,413
Other comprehensive income
Actuarial gains and losses (416) (199) (248)Tax effect 154 57 95Currency translation adjustment generated by the mother company (732) 3 1,613Items not potentially reclassifiable to profit and loss (994) (139) 1,460Currency translation adjustment 512 36 (988)Available for sale financial assets (6) 3 8Cash flow hedge 30 35 80Share of other comprehensive income of equity affiliates, net amount 436 (456) (541)Other (4) (3) (1)Tax effect (5) (13) (32)Items potentially reclassifiable to profit and loss 963 (398) (1,474)Total other comprehensive income (net amount) (31) (537) (14)
Comprehensive income 3,098 2,898 3,399- Group share 3,078 2,801 3,368- Non-controlling interests 20 97 31
(unaudited, 2013 data converted from the Euro to the US Dollar)
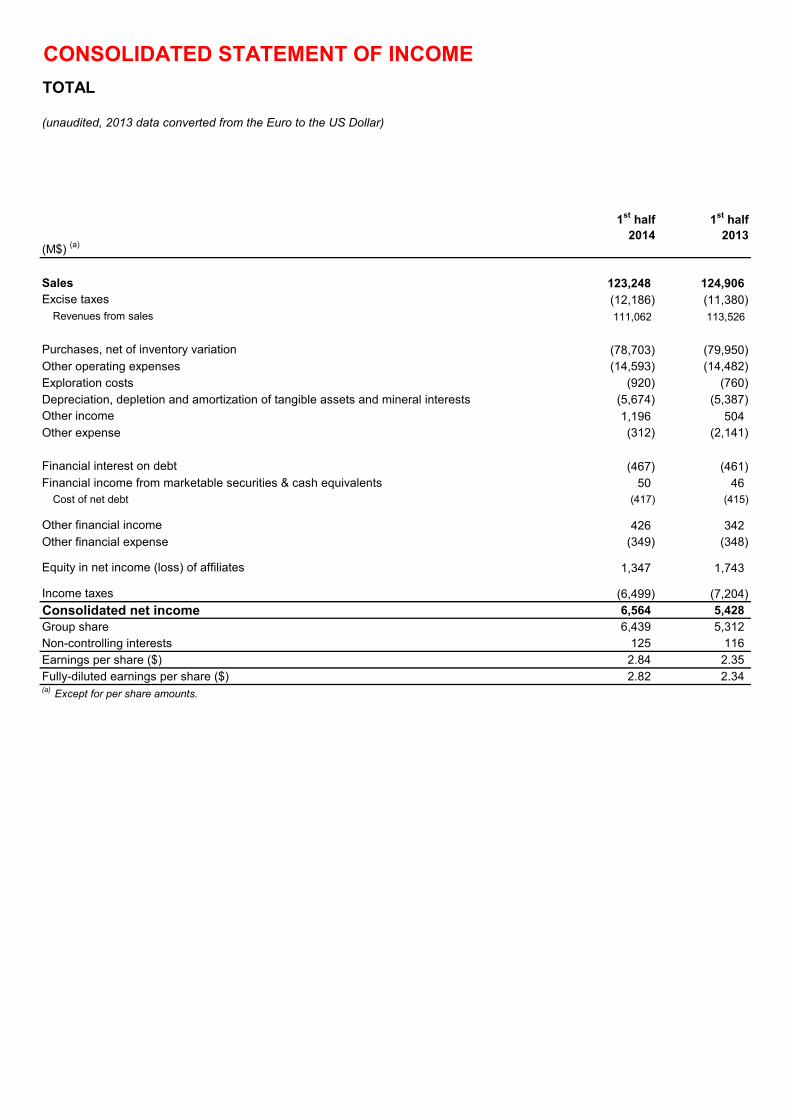
CONSOLIDATED STATEMENT OF INCOMETOTAL
(M$) (a)
1st half2014
1st half2013
Sales 123,248 124,906Excise taxes (12,186) (11,380)
Revenues from sales 111,062 113,526
Purchases, net of inventory variation (78,703) (79,950)Other operating expenses (14,593) (14,482)Exploration costs (920) (760)Depreciation, depletion and amortization of tangible assets and mineral interests (5,674) (5,387)Other income 1,196 504Other expense (312) (2,141)
Financial interest on debt (467) (461)Financial income from marketable securities & cash equivalents 50 46
Cost of net debt (417) (415)
Other financial income 426 342Other financial expense (349) (348)
Equity in net income (loss) of affiliates 1,347 1,743
Income taxes (6,499) (7,204)Consolidated net income 6,564 5,428Group share 6,439 5,312Non-controlling interests 125 116Earnings per share ($) 2.84 2.35 Fully-diluted earnings per share ($) 2.82 2.34 (a) Except for per share amounts.
(unaudited, 2013 data converted from the Euro to the US Dollar)

CONSOLIDATED STATEMENT OF COMPREHENSIVE INCOME
TOTAL
(M$)
1st half2014
1st half2013
Consolidated net income 6,564 5,428
Other comprehensive income
Actuarial gains and losses (615) (25)Tax effect 211 8Currency translation adjustment generated by the mother company (729) (599)Items not potentially reclassifiable to profit and loss (1,133) (616)Currency translation adjustment 548 (391)Available for sale financial assets (3) 3Cash flow hedge 65 95Share of other comprehensive income of equity affiliates, net amount (20) (494)Other (7) (12)Tax effect (18) (35)Items potentially reclassifiable to profit and loss 565 (834)Total other comprehensive income (net amount) (568) (1,450)
Comprehensive income 5,996 3,978- Group share 5,879 3,908- Non-controlling interests 117 70
(unaudited, 2013 data converted from the Euro to the US Dollar)

CONSOLIDATED BALANCE SHEETTOTAL
(M$)
June 30, 2014
(unaudited)
March 31, 2014
(unaudited)
December 31, 2013
(unaudited)
June 30, 2013
(unaudited)
ASSETS
Non-current assetsIntangible assets, net 18,995 18,899 18,395 17,424Property, plant and equipment, net 108,468 106,377 104,480 93,387Equity affiliates : investments and loans 21,256 19,951 20,417 19,037Other investments 1,786 2,091 1,666 1,583Hedging instruments of non-current financial debt 1,973 1,758 1,418 1,708Deferred income taxes 2,842 2,933 3,838 3,704Other non-current assets 4,263 4,265 4,406 3,813
Total non-current assets 159,583 156,274 154,620 140,656
Current assetsInventories, net 23,484 21,755 22,097 20,196Accounts receivable, net 21,698 23,359 23,422 25,587Other current assets 16,519 15,873 14,892 14,850Current financial assets 1,003 872 739 668Cash and cash equivalents 22,166 22,787 20,200 15,118Assets classified as held for sale 4,317 2,472 3,253 5,104
Total current assets 89,187 87,118 84,603 81,523
Total assets 248,770 243,392 239,223 222,179
LIABILITIES & SHAREHOLDERS' EQUITY
Shareholders' equityCommon shares 7,511 7,496 7,493 7,490Paid-in surplus and retained earnings 101,100 101,568 98,254 94,637Currency translation adjustment (1,436) (1,625) (1,203) (3,063)Treasury shares (4,303) (4,303) (4,303) (4,274)
Total shareholders' equity - Group Share 102,872 103,136 100,241 94,790
Non-controlling interests 3,344 3,248 3,138 2,225
Total shareholders' equity 106,216 106,384 103,379 97,015
Non-current liabilitiesDeferred income taxes 16,397 17,045 17,850 16,736Employee benefits 4,725 4,362 4,235 4,751Provisions and other non-current liabilities 17,445 17,582 17,517 14,464Non-current financial debt 39,433 37,506 34,574 29,557
Total non-current liabilities 78,000 76,495 74,176 65,508
Current liabilitiesAccounts payable 28,902 28,621 30,282 26,380Other creditors and accrued liabilities 19,994 19,097 18,948 18,162Current borrowings 13,525 11,676 11,193 13,119Other current financial liabilities 472 350 381 59Liabilities directly associated with the assets classified as held for sale 1,661 769 864 1,936
Total current liabilities 64,554 60,513 61,668 59,656
Total liabilities and shareholders' equity 248,770 243,392 239,223 222,179
(unaudited, 2013 data converted from the Euro to the US Dollar)

CONSOLIDATED STATEMENT OF CASH FLOWTOTAL
(M$)
2nd quarter2014
1st quarter2014
2nd quarter2013
CASH FLOW FROM OPERATING ACTIVITIES
Consolidated net income 3,129 3,435 3,413Depreciation, depletion and amortization 3,087 3,174 2,759Non-current liabilities, valuation allowances and deferred taxes (156) 399 (108)Impact of coverage of pension benefit plans - - -(Gains) losses on disposals of assets (17) (1,023) (363)Undistributed affiliates' equity earnings (125) 11 94(Increase) decrease in working capital (771) (685) (1,025)Other changes, net 130 27 68Cash flow from operating activities 5,277 5,338 4,838
CASH FLOW USED IN INVESTING ACTIVITIES
Intangible assets and property, plant and equipment additions (6,800) (5,448) (6,836)Acquisitions of subsidiaries, net of cash acquired (414) - -Investments in equity affiliates and other securities (434) (156) (256)Increase in non-current loans (1,075) (261) (367)Total expenditures (8,723) (5,865) (7,459)Proceeds from disposals of intangible assets and property, plant and equipment 135 1,020 1,106Proceeds from disposals of subsidiaries, net of cash sold - - 264Proceeds from disposals of non-current investments 66 456 23Repayment of non-current loans 430 364 357Total divestments 631 1,840 1,750Cash flow used in investing activities (8,092) (4,025) (5,709)
CASH FLOW USED IN FINANCING ACTIVITIES
Issuance (repayment) of shares: - Parent company shareholders 304 33 432 - Treasury shares - - -Dividends paid: - Parent company shareholders (1,901) (1,835) (1,772) - Non-controlling interests (139) (7) (92)Other transactions with non-controlling interests 126 - (7)Net issuance (repayment) of non-current debt 2,931 4,189 734Increase (decrease) in current borrowings 956 (1,167) (894)Increase (decrease) in current financial assets and liabilities 65 (117) 6Cash flow used in financing activities 2,342 1,096 (1,593)Net increase (decrease) in cash and cash equivalents (473) 2,409 (2,464)Effect of exchange rates (148) 178 404Cash and cash equivalents at the beginning of the period 22,787 20,200 17,178Cash and cash equivalents at the end of the period 22,166 22,787 15,118
(unaudited, 2013 data converted from the Euro to the US Dollar)

CONSOLIDATED STATEMENT OF CASH FLOWTOTAL
(M$)
1st half2014
1st half2013
CASH FLOW FROM OPERATING ACTIVITIES
Consolidated net income 6,564 5,428Depreciation, depletion and amortization 6,261 5,805Non-current liabilities, valuation allowances and deferred taxes 243 (49)Impact of coverage of pension benefit plans - -(Gains) losses on disposals of assets (1,040) 1,510Undistributed affiliates' equity earnings (114) (372)(Increase) decrease in working capital (1,456) (2,751)Other changes, net 157 180Cash flow from operating activities 10,615 9,751
CASH FLOW USED IN INVESTING ACTIVITIES
Intangible assets and property, plant and equipment additions (12,248) (13,325)Acquisitions of subsidiaries, net of cash acquired (414) (21)Investments in equity affiliates and other securities (590) (1,026)Increase in non-current loans (1,336) (991)Total expenditures (14,588) (15,363)Proceeds from disposals of intangible assets and property, plant and equipment 1,155 1,660Proceeds from disposals of subsidiaries, net of cash sold - 264Proceeds from disposals of non-current investments 522 23Repayment of non-current loans 794 616Total divestments 2,471 2,563Cash flow used in investing activities (12,117) (12,800)
CASH FLOW USED IN FINANCING ACTIVITIES
Issuance (repayment) of shares: - Parent company shareholders 337 432 - Treasury shares - -Dividends paid: - - - Parent company shareholders (3,736) (3,532) - Non-controlling interests (146) (94)Other transactions with non-controlling interests 126 464Net issuance (repayment) of non-current debt 7,120 4,499Increase (decrease) in current borrowings (211) (5,162)Increase (decrease) in current financial assets and liabilities (52) 1,184Cash flow used in financing activities 3,438 (2,209)Net increase (decrease) in cash and cash equivalents 1,936 (5,258)Effect of exchange rates 30 (33)Cash and cash equivalents at the beginning of the period 20,200 20,409Cash and cash equivalents at the end of the period 22,166 15,118
(unaudited, 2013 data converted from the Euro to the US Dollar)
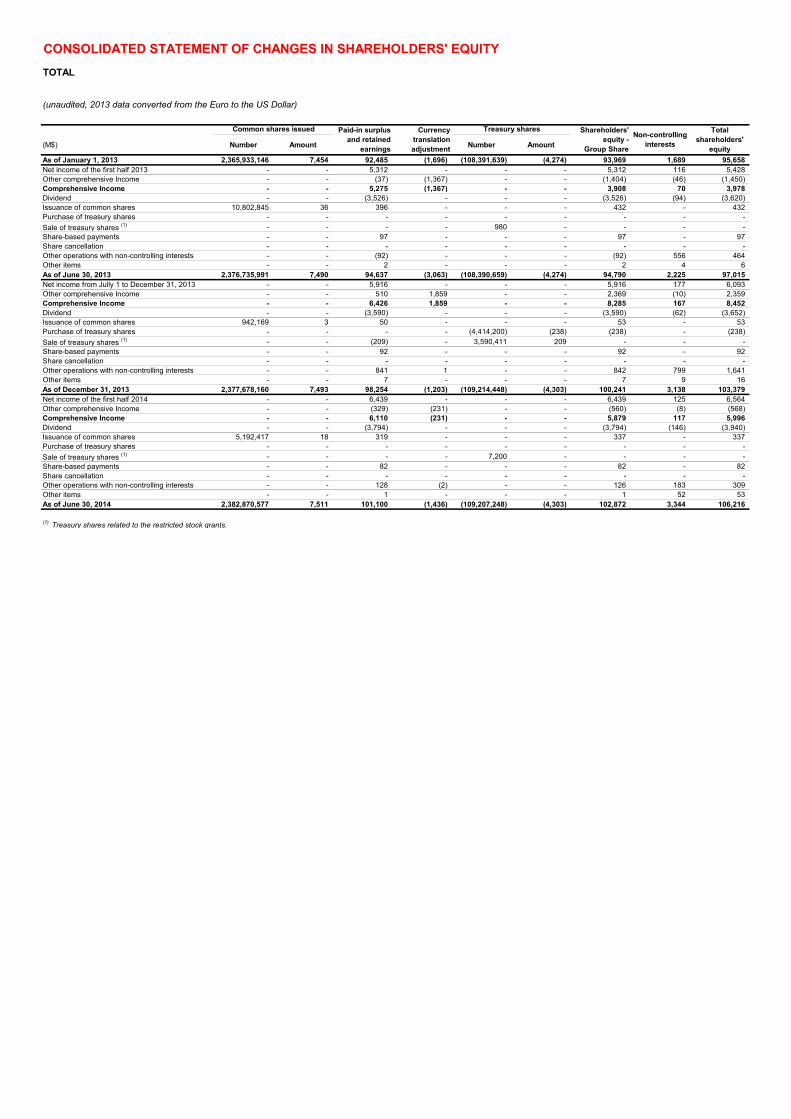
CONSOLIDATED STATEMENT OF CHANGES IN SHAREHOLDERS' EQUITYTOTAL
(unaudited, 2013 data converted from the Euro to the US Dollar)
(M$) Number Amount Number Amount
As of January 1, 2013 2,365,933,146 7,454 92,485 (1,696) (108,391,639) (4,274) 93,969 1,689 95,658Net income of the first half 2013 - - 5,312 - - - 5,312 116 5,428Other comprehensive Income - - (37) (1,367) - - (1,404) (46) (1,450)Comprehensive Income - - 5,275 (1,367) - - 3,908 70 3,978Dividend - - (3,526) - - - (3,526) (94) (3,620)Issuance of common shares 10,802,845 36 396 - - - 432 - 432Purchase of treasury shares - - - - - - - - -Sale of treasury shares (1) - - - - 980 - - - -Share-based payments - - 97 - - - 97 - 97Share cancellation - - - - - - - - -Other operations with non-controlling interests - - (92) - - - (92) 556 464Other items - - 2 - - - 2 4 6As of June 30, 2013 2,376,735,991 7,490 94,637 (3,063) (108,390,659) (4,274) 94,790 2,225 97,015Net income from Jully 1 to December 31, 2013 - - 5,916 - - - 5,916 177 6,093Other comprehensive Income - - 510 1,859 - - 2,369 (10) 2,359Comprehensive Income - - 6,426 1,859 - - 8,285 167 8,452Dividend - - (3,590) - - - (3,590) (62) (3,652)Issuance of common shares 942,169 3 50 - - - 53 - 53Purchase of treasury shares - - - - (4,414,200) (238) (238) - (238)Sale of treasury shares (1) - - (209) - 3,590,411 209 - - -Share-based payments - - 92 - - - 92 - 92Share cancellation - - - - - - - - -Other operations with non-controlling interests - - 841 1 - - 842 799 1,641Other items - - 7 - - - 7 9 16As of December 31, 2013 2,377,678,160 7,493 98,254 (1,203) (109,214,448) (4,303) 100,241 3,138 103,379Net income of the first half 2014 - - 6,439 - - - 6,439 125 6,564Other comprehensive Income - - (329) (231) - - (560) (8) (568)Comprehensive Income - - 6,110 (231) - - 5,879 117 5,996Dividend - - (3,794) - - - (3,794) (146) (3,940)Issuance of common shares 5,192,417 18 319 - - - 337 - 337Purchase of treasury shares - - - - - - - - -Sale of treasury shares (1) - - - - 7,200 - - - -Share-based payments - - 82 - - - 82 - 82Share cancellation - - - - - - - - -Other operations with non-controlling interests - - 128 (2) - - 126 183 309Other items - - 1 - - - 1 52 53As of June 30, 2014 2,382,870,577 7,511 101,100 (1,436) (109,207,248) (4,303) 102,872 3,344 106,216
(1) Treasury shares related to the restricted stock grants.
Total shareholders'
equity
Shareholders' equity -
Group Share
Common shares issued Treasury sharesPaid-in surplus and retained
earnings
Currency translation adjustment
Non-controlling interests

BUSINESS SEGMENT INFORMATIONTOTAL(unaudited, 2013 data converted from the Euro to the US Dollar)
2nd quarter 2014(M$)
Upstream Refining & Chemicals
Marketing & Services Corporate Intercompany Total
Non-Group sales 6,205 28,143 28,213 - - 62,561Intersegment sales 8,057 11,740 402 46 (20,245) -Excise taxes - (1,281) (5,073) - - (6,354)Revenues from sales 14,262 38,602 23,542 46 (20,245) 56,207Operating expenses (7,174) (37,744) (22,966) (262) 20,245 (47,901)Depreciation, depletion and amortization of tangible assets and mineral interests (2,314) (408) (198) (9) - (2,929)Operating income 4,774 450 378 (225) - 5,377Equity in net income (loss) of affiliates and other items 719 65 98 7 - 889Tax on net operating income (2,471) (114) (128) (218) - (2,931)Net operating income 3,022 401 348 (436) - 3,335Net cost of net debt (206)Non-controlling interests (25)Net income 3,104
2nd quarter 2014 (adjustments) (a)
(M$)Upstream Refining &
ChemicalsMarketing &
Services Corporate Intercompany Total
Non-Group sales (36) - - - - (36)Intersegment sales - - - - - -Excise taxes - - - - - -Revenues from sales (36) - - - - (36)Operating expenses - 122 (27) - - 95Depreciation, depletion and amortization of tangible assets and mineral interests - (40) - - - (40)Operating income (b) (36) 82 (27) - - 19Equity in net income (loss) of affiliates and other items - (32) (7) - - (39)Tax on net operating income 7 (50) 10 - - (33)Net operating income (b) (29) - (24) - - (53)Net cost of net debt -Non-controlling interests 6Net income (47)
On operating income - 122 (5) -On net operating income - 77 (3) -
(2,478) (64) (138) (218)
2nd quarter 2014 (adjusted)(M$) (a) Upstream Refining &
ChemicalsMarketing &
Services Corporate Intercompany Total
Non-Group sales 6,241 28,143 28,213 - - 62,597Intersegment sales 8,057 11,740 402 46 (20,245) -Excise taxes - (1,281) (5,073) - - (6,354)Revenues from sales 14,298 38,602 23,542 46 (20,245) 56,243Operating expenses (7,174) (37,866) (22,939) (262) 20,245 (47,996)Depreciation, depletion and amortization of tangible assets and mineral interests (2,314) (368) (198) (9) - (2,889)Adjusted operating income 4,810 368 405 (225) - 5,358Equity in net income (loss) of affiliates and other items 719 97 105 7 - 928Tax on net operating income (2,478) (64) (138) (218) - (2,898)Adjusted net operating income 3,051 401 372 (436) - 3,388Net cost of net debt (206)Non-controlling interests (31)Adjusted net income 3,151Adjusted fully-diluted earnings per share ($) 1.38(a) Except for earnings per share.
2nd quarter 2014(M$)
Upstream Refining & Chemicals
Marketing & Services Corporate Intercompany Total
Total expenditures 7,999 475 203 46 - 8,723Total divestments 568 15 28 20 - 631Cash flow from operating activities 4,805 (133) 304 301 - 5,277
(a) Adjustments include special items, inventory valuation effect and the effect of changes in fair value.
(b) Of which inventory valuation effect

BUSINESS SEGMENT INFORMATIONTOTAL(unaudited, 2013 data converted from the Euro to the US Dollar)
1st quarter 2014(M$)
Upstream Refining & Chemicals
Marketing & Services Corporate Intercompany Total
Non-Group sales 6,666 27,539 26,470 12 - 60,687Intersegment sales 7,436 11,956 408 49 (19,849) -Excise taxes - (1,160) (4,672) - - (5,832)Revenues from sales 14,102 38,335 22,206 61 (19,849) 54,855Operating expenses (6,514) (37,792) (21,689) (169) 19,849 (46,315)Depreciation, depletion and amortization of tangible assets and mineral interests (2,176) (378) (182) (9) - (2,745)Operating income 5,412 165 335 (117) - 5,795Equity in net income (loss) of affiliates and other items 1,327 54 (8) 46 - 1,419Tax on net operating income (3,492) 6 (80) (74) - (3,640)Net operating income 3,247 225 247 (145) - 3,574Net cost of net debt (139)Non-controlling interests (100)Net income 3,335
1st quarter 2014 (adjustments) (a)
(M$)Upstream Refining &
ChemicalsMarketing &
Services Corporate Intercompany Total
Non-Group sales 26 - - - - 26Intersegment sales - - - - - -Excise taxes - - - - - -Revenues from sales 26 - - - - 26Operating expenses (115) (163) (18) - - (296)Depreciation, depletion and amortization of tangible assets and mineral interests - - - - - -Operating income (b) (89) (163) (18) - - (270)Equity in net income (loss) of affiliates and other items 280 (8) - - - 272Tax on net operating income (36) 50 4 - - 18Net operating income (b) 155 (121) (14) - - 20Net cost of net debt -Non-controlling interests (12)Net income 8
On operating income - (163) (18) -On net operating income - (111) (14) -
(3,456) (44) (84) (74)
1st quarter 2014 (adjusted)(M$) (a) Upstream Refining &
ChemicalsMarketing &
Services Corporate Intercompany Total
Non-Group sales 6,640 27,539 26,470 12 - 60,661Intersegment sales 7,436 11,956 408 49 (19,849) -Excise taxes - (1,160) (4,672) - - (5,832)Revenues from sales 14,076 38,335 22,206 61 (19,849) 54,829Operating expenses (6,399) (37,629) (21,671) (169) 19,849 (46,019)Depreciation, depletion and amortization of tangible assets and mineral interests (2,176) (378) (182) (9) - (2,745)Adjusted operating income 5,501 328 353 (117) - 6,065Equity in net income (loss) of affiliates and other items 1,047 62 (8) 46 - 1,147Tax on net operating income (3,456) (44) (84) (74) - (3,658)Adjusted net operating income 3,092 346 261 (145) - 3,554Net cost of net debt (139)Non-controlling interests (88)Adjusted net income 3,327Adjusted fully-diluted earnings per share ($) 1.46(a) Except for earnings per share.
1st quarter 2014(M$)
Upstream Refining & Chemicals
Marketing & Services Corporate Intercompany Total
Total expenditures 5,311 250 276 28 - 5,865Total divestments 1,799 11 26 4 - 1,840Cash flow from operating activities 3,811 1,593 89 (155) - 5,338
(a) Adjustments include special items, inventory valuation effect and the effect of changes in fair value.
(b) Of which inventory valuation effect

BUSINESS SEGMENT INFORMATIONTOTAL(unaudited, 2013 data converted from the Euro to the US Dollar)
2nd quarter 2013(M$)
Upstream Refining & Chemicals
Marketing & Services Corporate Intercompany Total
Non-Group sales 6,240 28,160 26,851 94 - 61,345Intersegment sales 8,508 12,809 1,058 35 (22,410) -Excise taxes - (1,091) (4,748) - - (5,839)Revenues from sales 14,748 39,878 23,161 129 (22,410) 55,506Operating expenses (7,195) (39,672) (22,541) (275) 22,410 (47,273)Depreciation, depletion and amortization of tangible assets and mineral interests (1,974) (390) (160) (10) - (2,534)Operating income 5,579 (184) 460 (156) - 5,699Equity in net income (loss) of affiliates and other items 1,022 62 51 28 - 1,163Tax on net operating income (3,160) 88 (138) (57) - (3,267)Net operating income 3,441 (34) 373 (185) - 3,595Net cost of net debt (182)Non-controlling interests (49)Net income 3,364
2nd quarter 2013 (adjustments) (a)
(M$)Upstream Refining &
ChemicalsMarketing &
Services Corporate Intercompany Total
Non-Group sales (42) - - - - (42)Intersegment sales - - - - - -Excise taxes - - - - - -Revenues from sales (42) - - - - (42)Operating expenses - (704) (107) - - (811)Depreciation, depletion and amortization of tangible assets and mineral interests - - - - - -Operating income (b) (42) (704) (107) - - (853)Equity in net income (loss) of affiliates and other items 331 (48) - - - 283Tax on net operating income 111 200 34 - - 345Net operating income (b) 400 (552) (73) - - (225)Net cost of net debt -Non-controlling interests 8Net income (217)
On operating income - (655) (107) -On net operating income - (460) (73) -
(3,271) (112) (172) (57)
2nd quarter 2013 (adjusted)(M$) (a) Upstream Refining &
ChemicalsMarketing &
Services Corporate Intercompany Total
Non-Group sales 6,282 28,160 26,851 94 - 61,387Intersegment sales 8,508 12,809 1,058 35 (22,410) -Excise taxes - (1,091) (4,748) - - (5,839)Revenues from sales 14,790 39,878 23,161 129 (22,410) 55,548Operating expenses (7,195) (38,968) (22,434) (275) 22,410 (46,462)Depreciation, depletion and amortization of tangible assets and mineral interests (1,974) (390) (160) (10) - (2,534)Adjusted operating income 5,621 520 567 (156) - 6,552Equity in net income (loss) of affiliates and other items 691 110 51 28 - 880Tax on net operating income (3,271) (112) (172) (57) - (3,612)Adjusted net operating income 3,041 518 446 (185) - 3,820Net cost of net debt (182)Non-controlling interests (57)Adjusted net income 3,581Adjusted fully-diluted earnings per share ($) 1.57(a) Except for earnings per share.
2nd quarter 2013(M$)
Upstream Refining & Chemicals
Marketing & Services Corporate Intercompany Total
Total expenditures 6,603 499 318 39 - 7,459Total divestments 1,456 272 16 6 - 1,750Cash flow from operating activities 2,764 1,713 542 (181) - 4,838
(a) Adjustments include special items, inventory valuation effect and the effect of changes in fair value.
(b) Of which inventory valuation effect

BUSINESS SEGMENT INFORMATIONTOTAL(unaudited, 2013 data converted from the Euro to the US Dollar)
1st half 2014(M$)
Upstream Refining & Chemicals
Marketing & Services Corporate Intercompany Total
Non-Group sales 12,871 55,682 54,683 12 - 123,248Intersegment sales 15,493 23,696 810 95 (40,094) -Excise taxes - (2,441) (9,745) - - (12,186)Revenues from sales 28,364 76,937 45,748 107 (40,094) 111,062Operating expenses (13,688) (75,536) (44,655) (431) 40,094 (94,216)Depreciation, depletion and amortization of tangible assets and mineral interests (4,490) (786) (380) (18) - (5,674)Operating income 10,186 615 713 (342) - 11,172Equity in net income (loss) of affiliates and other items 2,046 119 90 53 - 2,308Tax on net operating income (5,963) (108) (208) (292) - (6,571)Net operating income 6,269 626 595 (581) - 6,909Net cost of net debt (345)Non-controlling interests (125)Net income 6,439
1st half 2014 (adjustments) (a)
(M$)Upstream Refining &
ChemicalsMarketing &
Services Corporate Intercompany Total
Non-Group sales (10) - - - - (10)Intersegment sales - - - - - -Excise taxes - - - - - -Revenues from sales (10) - - - - (10)Operating expenses (115) (41) (45) - - (201)Depreciation, depletion and amortization of tangible assets and mineral interests - (40) - - - (40)Operating income (b) (125) (81) (45) - - (251)Equity in net income (loss) of affiliates and other items 280 (40) (7) - - 233Tax on net operating income (29) - 14 - - (15)Net operating income (b) 126 (121) (38) - - (33)Net cost of net debt -Non-controlling interests (6)Net income (39)
On operating income - (41) (23) -On net operating income - (34) (17) -
(5,934) (108) (222) (292)
1st half 2014 (adjusted)(M$) (a) Upstream Refining &
ChemicalsMarketing &
Services Corporate Intercompany Total
Non-Group sales 12,881 55,682 54,683 12 - 123,258Intersegment sales 15,493 23,696 810 95 (40,094) -Excise taxes - (2,441) (9,745) - - (12,186)Revenues from sales 28,374 76,937 45,748 107 (40,094) 111,072Operating expenses (13,573) (75,495) (44,610) (431) 40,094 (94,015)Depreciation, depletion and amortization of tangible assets and mineral interests (4,490) (746) (380) (18) - (5,634)Adjusted operating income 10,311 696 758 (342) - 11,423Equity in net income (loss) of affiliates and other items 1,766 159 97 53 - 2,075Tax on net operating income (5,934) (108) (222) (292) - (6,556)Adjusted net operating income 6,143 747 633 (581) - 6,942Net cost of net debt (345)Non-controlling interests (119)Adjusted net income 6,478Adjusted fully-diluted earnings per share ($) 2.84(a) Except for earnings per share.
1st half 2014(M$)
Upstream Refining & Chemicals
Marketing & Services Corporate Intercompany Total
Total expenditures 13,310 725 479 74 - 14,588Total divestments 2,367 26 54 24 - 2,471Cash flow from operating activities 8,616 1,460 393 146 - 10,615
(a) Adjustments include special items, inventory valuation effect and the effect of changes in fair value.
(b) Of which inventory valuation effect
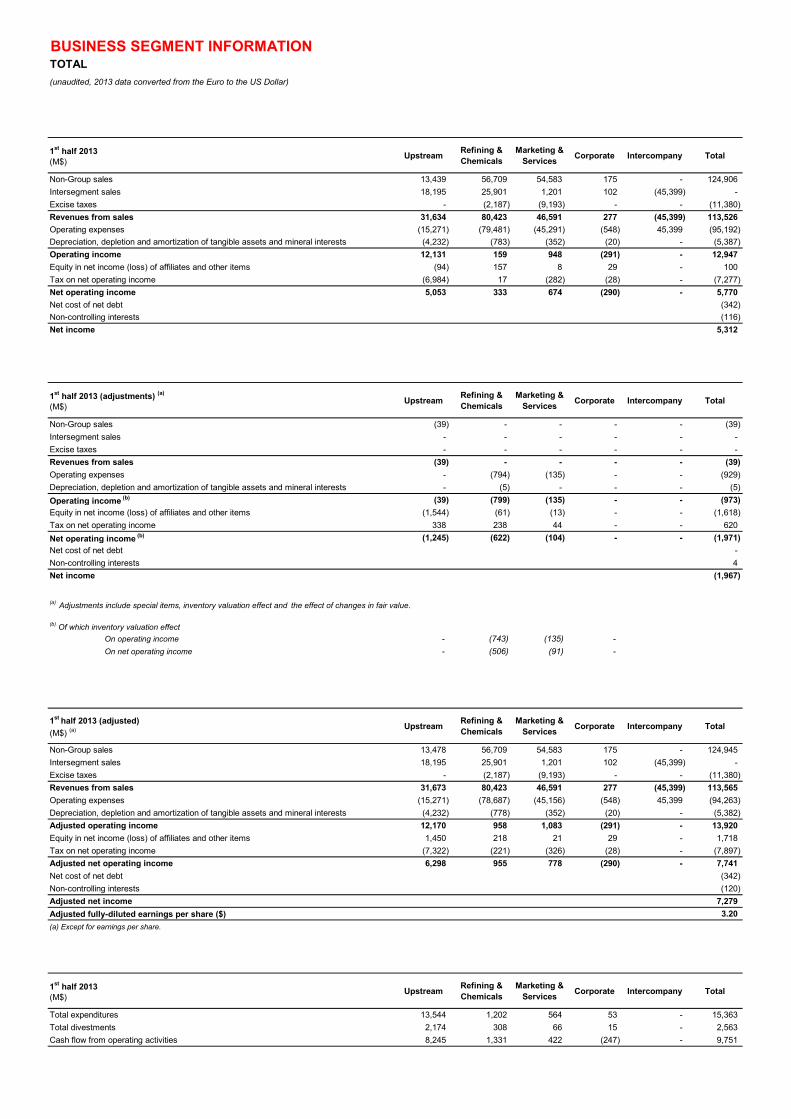
BUSINESS SEGMENT INFORMATIONTOTAL(unaudited, 2013 data converted from the Euro to the US Dollar)
1st half 2013(M$)
Upstream Refining & Chemicals
Marketing & Services Corporate Intercompany Total
Non-Group sales 13,439 56,709 54,583 175 - 124,906Intersegment sales 18,195 25,901 1,201 102 (45,399) -Excise taxes - (2,187) (9,193) - - (11,380)Revenues from sales 31,634 80,423 46,591 277 (45,399) 113,526Operating expenses (15,271) (79,481) (45,291) (548) 45,399 (95,192)Depreciation, depletion and amortization of tangible assets and mineral interests (4,232) (783) (352) (20) - (5,387)Operating income 12,131 159 948 (291) - 12,947Equity in net income (loss) of affiliates and other items (94) 157 8 29 - 100Tax on net operating income (6,984) 17 (282) (28) - (7,277)Net operating income 5,053 333 674 (290) - 5,770Net cost of net debt (342)Non-controlling interests (116)Net income 5,312
1st half 2013 (adjustments) (a)
(M$)Upstream Refining &
ChemicalsMarketing &
Services Corporate Intercompany Total
Non-Group sales (39) - - - - (39)Intersegment sales - - - - - -Excise taxes - - - - - -Revenues from sales (39) - - - - (39)Operating expenses - (794) (135) - - (929)Depreciation, depletion and amortization of tangible assets and mineral interests - (5) - - - (5)Operating income (b) (39) (799) (135) - - (973)Equity in net income (loss) of affiliates and other items (1,544) (61) (13) - - (1,618)Tax on net operating income 338 238 44 - - 620Net operating income (b) (1,245) (622) (104) - - (1,971)Net cost of net debt -Non-controlling interests 4Net income (1,967)
On operating income - (743) (135) -On net operating income - (506) (91) -
(7,322) (221) (326) (28)
1st half 2013 (adjusted)(M$) (a) Upstream Refining &
ChemicalsMarketing &
Services Corporate Intercompany Total
Non-Group sales 13,478 56,709 54,583 175 - 124,945Intersegment sales 18,195 25,901 1,201 102 (45,399) -Excise taxes - (2,187) (9,193) - - (11,380)Revenues from sales 31,673 80,423 46,591 277 (45,399) 113,565Operating expenses (15,271) (78,687) (45,156) (548) 45,399 (94,263)Depreciation, depletion and amortization of tangible assets and mineral interests (4,232) (778) (352) (20) - (5,382)Adjusted operating income 12,170 958 1,083 (291) - 13,920Equity in net income (loss) of affiliates and other items 1,450 218 21 29 - 1,718Tax on net operating income (7,322) (221) (326) (28) - (7,897)Adjusted net operating income 6,298 955 778 (290) - 7,741Net cost of net debt (342)Non-controlling interests (120)Adjusted net income 7,279Adjusted fully-diluted earnings per share ($) 3.20(a) Except for earnings per share.
1st half 2013(M$)
Upstream Refining & Chemicals
Marketing & Services Corporate Intercompany Total
Total expenditures 13,544 1,202 564 53 - 15,363Total divestments 2,174 308 66 15 - 2,563Cash flow from operating activities 8,245 1,331 422 (247) - 9,751
(a) Adjustments include special items, inventory valuation effect and the effect of changes in fair value.
(b) Of which inventory valuation effect
* Reclassification of intercompany transactions between Upstream and Corporate for €823 million with no impact on the total of cash flow from operating activities

Reconciliation of the information by business segment with consolidated financial statements
TOTAL
2nd quarter 2014(M$)
Adjusted Adjustments (a) Consolidated statement of income
Sales 62,597 (36) 62,561Excise taxes (6,354) - (6,354)
Revenues from sales 56,243 (36) 56,207
Purchases, net of inventory variation (40,488) 117 (40,371)Other operating expenses (7,207) (22) (7,229)Exploration costs (301) - (301)Depreciation, depletion and amortization of tangible assets and mineral interests (2,889) (40) (2,929)Other income 96 - 96Other expense (133) (30) (163)
Financial interest on debt (266) - (266)Financial income from marketable securities & cash equivalents 31 - 31
Cost of net debt (235) - (235)
Other financial income 265 - 265Other financial expense (183) - (183)
Equity in net income (loss) of affiliates 883 (9) 874
Income taxes (2,869) (33) (2,902)Consolidated net income 3,182 (53) 3,129Group share 3,151 (47) 3,104Non-controlling interests 31 (6) 25
(a) Adjustments include special items, inventory valuation effect and the effect of changes in fair value.
2nd quarter 2013(M$)
Adjusted Adjustments (a) Consolidated statement of income
Sales 61,387 (42) 61,345Excise taxes (5,839) - (5,839)
Revenues from sales 55,548 (42) 55,506
Purchases, net of inventory variation (38,869) (762) (39,631)Other operating expenses (7,239) (49) (7,288)Exploration costs (354) - (354)Depreciation, depletion and amortization of tangible assets and mineral interests (2,534) - (2,534)Other income 131 331 462Other expense (89) (31) (120)
Financial interest on debt (238) - (238)Financial income from marketable securities & cash equivalents 18 - 18
Cost of net debt (220) - (220)
Other financial income 206 - 206Other financial expense (179) - (179)
Equity in net income (loss) of affiliates 811 (17) 794
Income taxes (3,574) 345 (3,229)Consolidated net income 3,638 (225) 3,413Group share 3,581 (217) 3,364Non-controlling interests 57 (8) 49
(a) Adjustments include special items, inventory valuation effect and the effect of changes in fair value.
(unaudited, 2013 data converted from the Euro to the US Dollar)

Reconciliation of the information by business segment with consolidated financial statements
TOTAL
(unaudited, 2013 data converted from the Euro to the US Dollar)
1st half 2014(M$)
Adjusted Adjustments (a) Consolidated statement of income
Sales 123,258 (10) 123,248Excise taxes (12,186) - (12,186)
Revenues from sales 111,072 (10) 111,062
Purchases, net of inventory variation (78,639) (64) (78,703)Other operating expenses (14,456) (137) (14,593)Exploration costs (920) - (920)Depreciation, depletion and amortization of tangible assets and mineral interests (5,634) (40) (5,674)Other income 548 648 1,196Other expense (263) (49) (312)
Financial interest on debt (467) - (467)Financial income from marketable securities & cash equivalents 50 - 50
Cost of net debt (417) - (417)
Other financial income 426 - 426Other financial expense (349) - (349)
Equity in net income (loss) of affiliates 1,713 (366) 1,347
Income taxes (6,484) (15) (6,499)Consolidated net income 6,597 (33) 6,564Group share 6,478 (39) 6,439Non-controlling interests 119 6 125
(a) Adjustments include special items, inventory valuation effect and the effect of changes in fair value.
1st half 2013(M$)
Adjusted Adjustments (a) Consolidated statement of income
Sales 124,945 (39) 124,906Excise taxes (11,380) - (11,380)
Revenues from sales 113,565 (39) 113,526
Purchases, net of inventory variation (79,072) (878) (79,950)Other operating expenses (14,431) (51) (14,482)Exploration costs (760) - (760)Depreciation, depletion and amortization of tangible assets and mineral interests (5,382) (5) (5,387)Other income 173 331 504Other expense (216) (1,925) (2,141)
Financial interest on debt (461) - (461)Financial income from marketable securities & cash equivalents 46 - 46
Cost of net debt (415) - (415)
Other financial income 342 - 342Other financial expense (348) - (348)
Equity in net income (loss) of affiliates 1,767 (24) 1,743
Income taxes (7,824) 620 (7,204)Consolidated net income 7,399 (1,971) 5,428Group share 7,279 (1,967) 5,312Non-controlling interests 120 (4) 116
(a) Adjustments include special items, inventory valuation effect and the effect of changes in fair value.