Second Quarterin the second quarter, compared to net earnings of $373 million, or $0.23 per share,...
14
1 Bristol-Myers Squibb Reports Second Quarter Financial Results • Increases Second Quarter Revenues 10% to $6.3 Billion • Posts Second Quarter GAAP EPS of $0.87 and Non-GAAP EPS of $1.18 • Announces Topline Results for CheckMate -227 Part 1a and Part 2 • Continues to Advance Celgene Integration Planning and Transaction Closing • Updates 2019 GAAP and Non-GAAP EPS Guidance (NEW YORK, July 25, 2019) – Bristol-Myers Squibb Company (NYSE:BMY) today reported results for the second quarter of 2019, which were highlighted by strong sales for Eliquis (apixaban) and Opdivo (nivolumab) and a robust operating performance across the portfolio. “We had a very good second quarter where we delivered strong financial results while also advancing our integration planning for the acquisition of Celgene,” said Giovanni Caforio, M.D., chairman and chief executive officer, Bristol-Myers Squibb. “Through strong commercial execution and financial discipline we are establishing a solid foundation from which we can build the leading biopharma company, well-positioned to address the unmet needs of our patients and create long-term shareholder value.” Second Quarter $ amounts in millions, except per share amounts 2019 2018 Change Total Revenues $6,273 $5,704 10% GAAP Diluted EPS 0.87 0.23 ** Non-GAAP Diluted EPS 1.18 1.01 17% **In excess of +/- 100%
Transcript of Second Quarterin the second quarter, compared to net earnings of $373 million, or $0.23 per share,...

1
Bristol-Myers Squibb Reports Second Quarter Financial Results
• Increases Second Quarter Revenues 10% to $6.3 Billion
• Posts Second Quarter GAAP EPS of $0.87 and Non-GAAP EPS of $1.18
• Announces Topline Results for CheckMate -227 Part 1a and Part 2
• Continues to Advance Celgene Integration Planning and Transaction Closing
• Updates 2019 GAAP and Non-GAAP EPS Guidance
(NEW YORK, July 25, 2019) – Bristol-Myers Squibb Company (NYSE:BMY) today reported results
for the second quarter of 2019, which were highlighted by strong sales for Eliquis (apixaban) and Opdivo
(nivolumab) and a robust operating performance across the portfolio.
“We had a very good second quarter where we delivered strong financial results while also advancing
our integration planning for the acquisition of Celgene,” said Giovanni Caforio, M.D., chairman and chief
executive officer, Bristol-Myers Squibb. “Through strong commercial execution and financial discipline we are
establishing a solid foundation from which we can build the leading biopharma company, well-positioned to
address the unmet needs of our patients and create long-term shareholder value.”
Second Quarter $ amounts in millions, except per share amounts 2019 2018 Change Total Revenues $6,273 $5,704 10% GAAP Diluted EPS 0.87 0.23 ** Non-GAAP Diluted EPS 1.18 1.01 17%
**In excess of +/- 100%

2
SECOND QUARTER FINANCIAL RESULTS • Bristol-Myers Squibb posted second quarter 2019 revenues of $6.3 billion, an increase of 10% compared to
the same period a year ago. Revenues increased 13% when adjusted for foreign exchange impact.
• U.S. revenues increased 14% to $3.7 billion in the quarter compared to the same period a year ago.
International revenues increased 5%. When adjusted for foreign exchange impact, international revenues
increased 12%.
• Gross margin as a percentage of revenue decreased from 71.5% to 68.2% in the quarter primarily due to
product mix and a $109 million impairment charge in connection with the expected sale of manufacturing
and packaging operations in Anagni, Italy.
• Marketing, selling and administrative expenses decreased 5% to $1.1 billion in the quarter.
• Research and development expenses decreased 45% to $1.3 billion in the quarter primarily due to a $1.1
billion charge resulting from the Nektar collaboration in the second quarter last year. • The effective tax rate was 19.0% in the quarter, compared to 26.1% in the second quarter last year. The
lower tax rate was due to a non-deductible equity investment loss in the second quarter last year. • The company reported net earnings attributable to Bristol-Myers Squibb of $1.4 billion, or $0.87 per share,
in the second quarter, compared to net earnings of $373 million, or $0.23 per share, for the same period in
2018. The results for the second quarter of 2019 include $409 million of Celgene-related acquisition and
integration expenses.
• The company reported non-GAAP net earnings attributable to Bristol-Myers Squibb of $1.9 billion, or
$1.18 per share, in the second quarter, compared to net earnings of $1.6 billion, or $1.01 per share, for the
same period in 2018. An overview of specified items is discussed under the “Use of Non-GAAP Financial
Information” section.
• Cash, cash equivalents and marketable securities were $30.4 billion as of June 30, 2019, which includes
$18.8 billion of net proceeds from the issuance of new notes in May 2019. The net cash position was $5.4
billion as of June 30, 2019.
3
ACQUISITION OF CELGENE CORPORATION
• In June, the company announced plans to divest OTEZLA® in light of concerns expressed by the U.S.
Federal Trade Commission. The company expects to close the Celgene transaction by the end of 2019 or
beginning of 2020. (link)
• In June, the company announced the future leadership team of the combined company effective upon
completion of the company’s pending acquisition of Celgene. (link)
OTEZLA® is a trademark of Celgene Corporation.
SECOND QUARTER PRODUCT AND PIPELINE UPDATE
Product Sales/Business Highlights
Global revenues for the second quarter of 2019, compared to the second quarter of 2018, were driven by:
• Eliquis, which grew by $392 million or 24% increase • Opdivo, which grew by $196 million or 12% increase • Orencia, which grew by 9% • Sprycel, which grew by 2% • Yervoy, which grew by 17% Opdivo
Clinical
• In July, the company announced Part 1a of the Phase 3 Checkmate -227 study evaluating Opdivo plus
low dose Yervoy vs. chemotherapy met the co-primary endpoint of overall survival in first-line non-
small cell lung cancer (NSCLC) patients whose tumors express PD-L1 ≥1%. (link)
• In July, the company announced Part 2 of the Phase 3 Checkmate -227 study evaluating Opdivo plus
chemotherapy versus chemotherapy did not meet its primary endpoint of overall survival in first-line
non-squamous NSCLC patients regardless of PD-L1 status. (link)
• In June, the company announced results of the Phase 3 Checkmate -459 study evaluating Opdivo versus
sorafenib as a first-line treatment in patients with unresectable hepatocellular carcinoma (HCC). (link)
• In June, at the American Society of Clinical Oncology Annual Meeting 2019, the company announced
important new data and analysis from three studies evaluating Opdivo as monotherapy and in
combination with Yervoy (ipilimumab):
o Checkmate -040: Results from the Phase 1/2 study evaluating Opdivo plus Yervoy in patients
with advanced HCC previously treated with sorafenib.(link)

4
o CA209-004: Results from the Phase 1 study evaluating Opdivo plus Yervoy in patients with
previously treated or untreated advanced melanoma. (link)
o Checkmate -067: Results from the Phase 3 study evaluating patient reported quality of life during
extended therapy and following the discontinuation of therapy with Opdivo or Opdivo plus
Yervoy in patients with previously untreated unresectable or metastatic melanoma. (link)
• In May, the company announced results of the Phase 3 CheckMate -498 trial evaluating Opdivo plus
radiation versus temozolomide plus radiation in patients with newly diagnosed O6-methylguanine-DNA
methyltransferase-unmethylated glioblastoma multiforme. (link)
Orencia
Clinical
• In June, at the Annual European Congress of Rheumatology, the company announced results from the
Phase 4 mechanistic study exploring differences in the cellular and molecular mechanisms by which
Orencia (abatacept) and adalimumab interfere with disease progression in moderate-to-severe early
rheumatoid arthritis patients seropositive for certain autoantibodies. (link)
Empliciti
Clinical
• In June, at the Congress of the European Hematology Association, the company announced results from
the Phase 2 study evaluating Empliciti (elotuzumab) plus pomalidomide and dexamethasone versus
pomalidomide and dexamethasone alone in patients with relapsed or refractory multiple myeloma. (link)
SECOND QUARTER BUSINESS DEVELOPMENT UPDATE
• In July, the company, Bayer and Ono Pharmaceutical Co., Ltd. announced a clinical trial collaboration
to evaluate Opdivo in combination with Bayer’s Stivarga® in patients with micro-satellite stable
metastatic colorectal cancer.
• In July, the company announced the completion of its previously announced sale of its consumer health
business, UPSA, to Taisho Pharmaceutical Co., Ltd.
• In June, the company announced Catalent, Inc. has agreed to purchase its oral solid, biologics, and
sterile product manufacturing and packaging facility in Anagni, Italy.
Stivarga® is a trademark of Bayer.

5
2019 FINANCIAL GUIDANCE Bristol-Myers Squibb is decreasing its 2019 GAAP EPS guidance range from $3.84 - $3.94 to $3.73- $3.83 and
increasing its non-GAAP EPS guidance range from $4.10 - $4.20 to $4.20 - $4.30. Both GAAP and non-GAAP
guidance assume current exchange rates. Key revised 2019 GAAP and non-GAAP line-item guidance
assumptions are:
• Research and development expenses decreasing in the low-double digits for GAAP and increasing in the
mid-single digits for non-GAAP.
The financial guidance for 2019 excludes the impact of any potential future strategic acquisitions and
divestitures, including any impact of the pending Celgene acquisition other than expenses incurred in 2019, and
any specified items that have not yet been identified and quantified. The non-GAAP 2019 guidance also
excludes other specified items as discussed under “Use of Non-GAAP Financial Information.” Details
reconciling adjusted non-GAAP amounts with the amounts reflecting specified items are provided in
supplemental materials available on the company’s website.
Guidance inclusive of the Celgene acquisition will be provided after the close of the transaction.
Use of Non-GAAP Financial Information This earnings release contains non-GAAP financial measures, including non-GAAP earnings and related EPS information that are adjusted to exclude certain costs, expenses, gains and losses and other specified items that are evaluated on an individual basis. These items are adjusted after considering their quantitative and qualitative aspects and typically have one or more of the following characteristics, such as being highly variable, difficult to project, unusual in nature, significant to the results of a particular period or not indicative of future operating results. Similar charges or gains were recognized in prior periods and will likely reoccur in future periods, including acquisition and integration expenses, restructuring costs, accelerated depreciation and impairment of property, plant and equipment and intangible assets, R&D charges or other income resulting from up-front or contingent milestone payments in connection with the acquisition or licensing of third-party intellectual property rights, divestiture gains or losses, pension, legal and other contractual settlement charges, interest expense on the new notes issued in May 2019 in connection with our pending acquisition of Celgene and interest income earned on the net proceeds of the notes and debt redemption gains or losses, among other items. Deferred and current income taxes attributed to these items are also adjusted for considering their individual impact to the overall tax expense, deductibility and jurisdictional tax rates. Non-GAAP information is intended to portray the results of the company’s baseline performance, supplement or enhance management, analysts and investors overall understanding of the company’s underlying financial performance and facilitate comparisons among current, past and future periods. For example, non-GAAP earnings and EPS information is an indication of the company’s baseline performance before items that are considered by us to not be reflective of the company’s ongoing results. In addition, this information is among the primary indicators that we use as a basis for evaluating performance, allocating resources, setting incentive compensation targets and planning and

6
forecasting for future periods. This information is not intended to be considered in isolation or as a substitute for net earnings or diluted EPS prepared in accordance with GAAP and may not be the same as or comparable to similarly titled measures presented by other companies due to possible differences in method and in the items being adjusted. Company and Conference Call Information
Bristol-Myers Squibb is a global biopharmaceutical company whose mission is to discover, develop and
deliver innovative medicines that help patients prevail over serious diseases. For more information about
Bristol-Myers Squibb, visit us at BMS.com or follow us on LinkedIn, Twitter, YouTube and Facebook. For
more information about Bristol-Myers Squibb's pending acquisition of Celgene, please visit
https://bestofbiopharma.com.
There will be a conference call on July 25, 2019 at 8:30 a.m. ET during which company executives will
review financial information and address inquiries from investors and analysts. Investors and the general public
are invited to listen to a live webcast of the call at http://investor.bms.com or by calling the U.S. toll free 888-
254-3590 or international 323-994-2093, confirmation code: 9333832. Materials related to the call will be
available at the same website prior to the conference call. A replay of the call will be available beginning at
11:45 a.m. ET on July 25, 2019 through 11:45 a.m. ET on August 8, 2019. The replay will also be available
through http://investor.bms.com or by calling the U.S. toll free 888-203-1112 or international 719-457-0820,
confirmation code: 9333832.
For more information, contact: Media: Carrie Fernandez, 609-252-5222, [email protected];
Investor Relations: John Elicker, 609-252-4611, [email protected] or Tim Power, 609-252-7509,
Website Information We routinely post important information for investors on our website, BMS.com, in the “Investors” section. We may use this website as a means of disclosing material, non-public information and for complying with our disclosure obligations under Regulation FD. Accordingly, investors should monitor the Investors section of our website, in addition to following our press releases, SEC filings, public conference calls, presentations and webcasts. We may also use social media channels to communicate with our investors and the public about our company, our products and other matters, and those communications could be deemed to be material information. The information contained on, or that may be accessed through, our website or social media channels are not incorporated by reference into, and are not a part of, this document. Cautionary Statement Regarding Forward-Looking Statements This earnings release and the related attachments (as well as the oral statements made with respect to information contained in this release and the attachments) contain certain “forward-looking” statements within

7
the meaning of Section 27A of the Securities Act of 1933, as amended, and Section 21E of the Securities Exchange Act of 1934, as amended, regarding, among other things, statements relating to goals, plans and projections regarding the company’s financial position, results of operations, market position, product development and business strategy. These statements may be identified by the fact they use words such as “should,” “could,” “expect,” “anticipate,” “estimate,” “target,” “may,” “project,” “guidance,” “intend,” “plan,” “believe,” “will” and other words and terms of similar meaning and expression in connection with any discussion of future operating or financial performance, although not all forward-looking statements contain such terms. One can also identify forward-looking statements by the fact that they do not relate strictly to historical or current facts. These statements are likely to relate to, among other things, the company’s ability to execute successfully its strategic plans, including its business development strategy generally and in relation to its ability to complete the financing transactions in connection with and to realize the projected benefits of the company’s pending acquisition of Celgene, the expiration of patents or data protection on certain products, including assumptions about the company’s ability to retain patent exclusivity of certain products and the impact, and result of governmental investigations. No forward-looking statement can be guaranteed, including that the company’s future clinical studies will support the data described in this release, product candidates will receive necessary clinical and manufacturing regulatory approvals, pipeline products will prove to be commercially successful, clinical and manufacturing regulatory approvals will be sought or obtained within currently expected timeframes or contractual milestones will be achieved. Such forward-looking statements are based on historical performance and current expectations and projections about the company’s future financial results, goals, plans and objectives and involve inherent risks, assumptions and uncertainties, including internal or external factors that could delay, divert or change any of them in the next several years, that are difficult to predict, may be beyond the company’s control and could cause the company’s future financial results, goals, plans and objectives to differ materially from those expressed in, or implied by, the statements. Such risks, uncertainties and other matters include, but are not limited to, challenges inherent in new product development, including obtaining and maintaining regulatory approval; competitive developments affecting current products; difficulties and delays in product introduction and commercialization; industry competition from other manufacturers; the company’s ability to obtain and protect market exclusivity rights and enforce patents and other intellectual property rights; the risk of an adverse patent litigation decision or settlement and exposure to other litigation and/or regulatory actions; pricing controls and pressures (including changes in rules and practices of managed care organizations and institutional and governmental purchasers); the impact of any U.S. healthcare reform and legislation or regulatory action in the U.S. and markets outside the U.S. affecting pharmaceutical product pricing, reimbursement or access; changes in tax law and regulations, including the impact of the Tax Cuts and Jobs Act of 2017 and related guidance; any significant issues that may arise related to the company’s joint ventures and other third-party business arrangements; the company’s ability to execute its financial, strategic and operational plans or initiatives; the ability to attract and retain key personnel; the company’s ability to identify potential strategic acquisitions or transactions and successfully realize the expected benefits of such transactions, including with respect to the pending acquisition of Celgene; the conditions to closing the Celgene transaction will be satisfied and, if the transaction closes, the company’s ability to successfully integrate Celgene, manage the impact of the company’s increased indebtedness, achieve anticipated synergies and effectively address any risks that Celgene currently faces, including the loss of patent protection for any of its commercialized products and the failure to obtain approvals for its pipeline products; difficulties or delays in manufacturing, distribution or sale of products, including without limitation, interruptions caused by damage to the company’s and the company’s suppliers’ manufacturing sites; regulatory decisions impacting labeling, manufacturing processes and/or other matters; the impact on the company’s competitive position from counterfeit or unregistered versions of its products or stolen products; the adverse impact of cyber-attacks on the company’s information systems or products, including unauthorized disclosure of trade secrets or other confidential data stored in the company’s information systems and networks; political and financial instability of international economies and sovereign risk; and issuance of new or revised accounting standards.

8
Forward-looking statements in this earnings release should be evaluated together with the many risks and uncertainties that affect the company’s business and market, particularly those identified in the cautionary statement and risk factors discussion in the company’s Annual Report on Form 10-K for the year ended December 31, 2018, as updated by the company’s subsequent Quarterly Reports on Form 10-Q, Current Reports on Form 8-K and other filings with the Securities and Exchange Commission. The forward-looking statements included in this document are made only as of the date of this document and except as otherwise required by applicable law, the company undertakes no obligation to publicly update or revise any forward-looking statement, whether as a result of new information, future events, changed circumstances or otherwise.
9
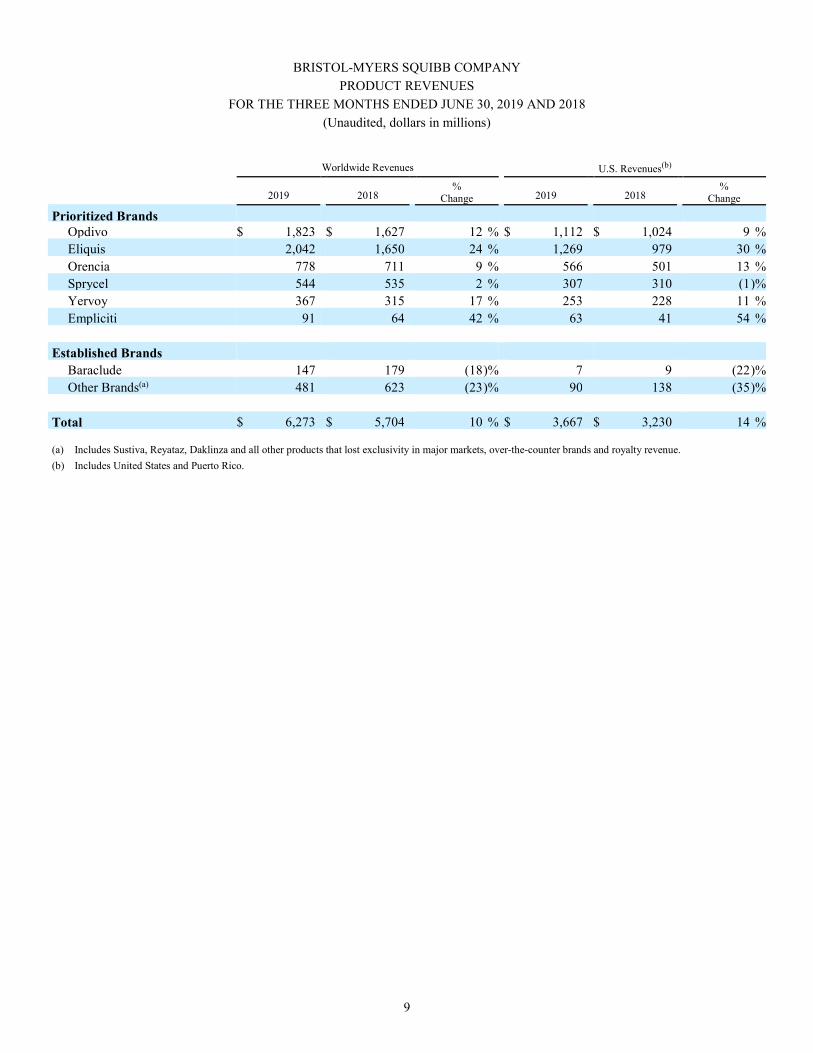
BRISTOL-MYERS SQUIBB COMPANY PRODUCT REVENUES
FOR THE THREE MONTHS ENDED JUNE 30, 2019 AND 2018 (Unaudited, dollars in millions)
Worldwide Revenues U.S. Revenues(b)
2019 2018 % Change 2019 2018 %
Change
Prioritized Brands Opdivo $ 1,823 $ 1,627 12 % $ 1,112 $ 1,024 9 % Eliquis 2,042 1,650 24 % 1,269 979 30 % Orencia 778 711 9 % 566 501 13 % Sprycel 544 535 2 % 307 310 (1 )% Yervoy 367 315 17 % 253 228 11 % Empliciti 91 64 42 % 63 41 54 %
Established Brands
Baraclude 147 179 (18 )% 7 9 (22 )% Other Brands(a) 481 623 (23 )% 90 138 (35 )%
Total $ 6,273 $ 5,704 10 % $ 3,667 $ 3,230 14 %
(a) Includes Sustiva, Reyataz, Daklinza and all other products that lost exclusivity in major markets, over-the-counter brands and royalty revenue. (b) Includes United States and Puerto Rico.

10
BRISTOL-MYERS SQUIBB COMPANY PRODUCT REVENUES
FOR THE SIX MONTHS ENDED JUNE 30, 2019 AND 2018 (Unaudited, dollars in millions)
Worldwide Revenues U.S. Revenues(b)
2019 2018 % Change 2019 2018 %
Change
Prioritized Brands Opdivo $ 3,624 $ 3,138 15 % $ 2,236 $ 1,962 14 % Eliquis 3,967 3,156 26 % 2,475 1,864 33 % Orencia 1,418 1,304 9 % 1,015 886 15 % Sprycel 1,003 973 3 % 547 524 4 % Yervoy 751 564 33 % 528 390 35 % Empliciti 174 119 46 % 121 78 55 %
Established Brands
Baraclude 288 404 (29 )% 14 19 (26 )% Other Brands(a) 968 1,239 (22 )% 180 285 (37 )%
Total $ 12,193 $ 10,897 12 % $ 7,116 $ 6,008 18 %
(a) Includes Sustiva, Reyataz, Daklinza and all other products that lost exclusivity in major markets, over-the-counter brands and royalty revenue. (b) Includes United States and Puerto Rico.

11
BRISTOL-MYERS SQUIBB COMPANY CONSOLIDATED STATEMENTS OF EARNINGS
FOR THE THREE AND SIX MONTHS ENDED JUNE 30, 2019 AND 2018 (Unaudited, dollars and shares in millions except per share data)
Three Months Ended June 30, Six Months Ended June 30,
2019 2018 2019 2018
Net product sales $ 6,031 $ 5,461 $ 11,744 $ 10,433 Alliance and other revenues 242 243 449 464
Total Revenues 6,273 5,704 12,193 10,897 Cost of products sold 1,992 1,625 3,836 3,209 Marketing, selling and administrative 1,076 1,131 2,082 2,111 Research and development 1,328 2,435 2,679 3,685 Other income (net) 101 (4 ) (159 ) (404 )
Total Expenses 4,497 5,187 8,438 8,601 Earnings Before Income Taxes 1,776 517 3,755 2,296 Provision for Income Taxes 337 135 601 419 Net Earnings 1,439 382 3,154 1,877 Noncontrolling Interest 7 9 12 18 Net Earnings Attributable to BMS $ 1,432 $ 373 $ 3,142 $ 1,859 Average Common Shares Outstanding:
Basic 1,636 1,633 1,635 1,633 Diluted 1,637 1,636 1,637 1,638
Earnings per Common Share
Basic $ 0.88 $ 0.23 $ 1.92 $ 1.14 Diluted 0.87 0.23 1.92 1.13
Other income (net)
Interest expense $ 123 $ 45 $ 168 $ 91 Investment income (119 ) (38 ) (175 ) (74 ) Equity investment (gains)/losses (71 ) 356 (246 ) 341 Provision for restructuring 10 37 22 57 Acquisition expenses 303 — 468 — Integration expenses 106 — 128 — Litigation and other settlements — (1 ) 1 (1 ) Equity in net income of affiliates — (27 ) — (51 ) Divestiture losses/(gains) 8 (25 ) 8 (70 ) Royalties and licensing income (303 ) (353 ) (611 ) (720 ) Transition and other service fees (2 ) (1 ) (4 ) (5 ) Pension and postretirement 26 (19 ) 70 (30 ) Intangible asset impairment 15 — 15 64 Other 5 22 (3 ) (6 )
Other income (net) $ 101 $ (4 ) $ (159 ) $ (404 )

12
BRISTOL-MYERS SQUIBB COMPANY SPECIFIED ITEMS
FOR THE THREE AND SIX MONTHS ENDED JUNE 30, 2019 AND 2018 (Unaudited, dollars in millions)
Three Months Ended June 30, Six Months Ended June 30,
2019 2018 2019 2018
Impairment charges $ 109 $ — $ 109 $ 10 Accelerated depreciation and other shutdown costs 30 14 42 17 Cost of products sold 139 14 151 27 Marketing, selling and administrative — — 1 1 License and asset acquisition charges 25 1,075 25 1,135 IPRD impairments — — 32 — Site exit costs and other 19 19 38 39 Research and development 44 1,094 95 1,174 Interest expense 83 — 83 — Investment income (54 ) — (54 ) — Equity investment (gains)/losses (71 ) 356 (246 ) 341 Provision for restructuring 10 37 22 57 Acquisition expenses 303 — 468 — Integration expenses 106 — 128 — Divestiture losses/(gains) 8 (25 ) 8 (68 ) Royalties and licensing income — (25 ) — (75 ) Pension and postretirement 44 37 93 68 Intangible asset impairment — — — 64 Other income (net) 429 380 502 387 Increase to pretax income 612 1,488 749 1,589 Income taxes on items above (105 ) (218 ) (148 ) (226 ) Income taxes attributed to U.S. tax reform — 3 — (29 ) Income taxes (105 ) (215 ) (148 ) (255 ) Increase to net earnings $ 507 $ 1,273 $ 601 $ 1,334
13
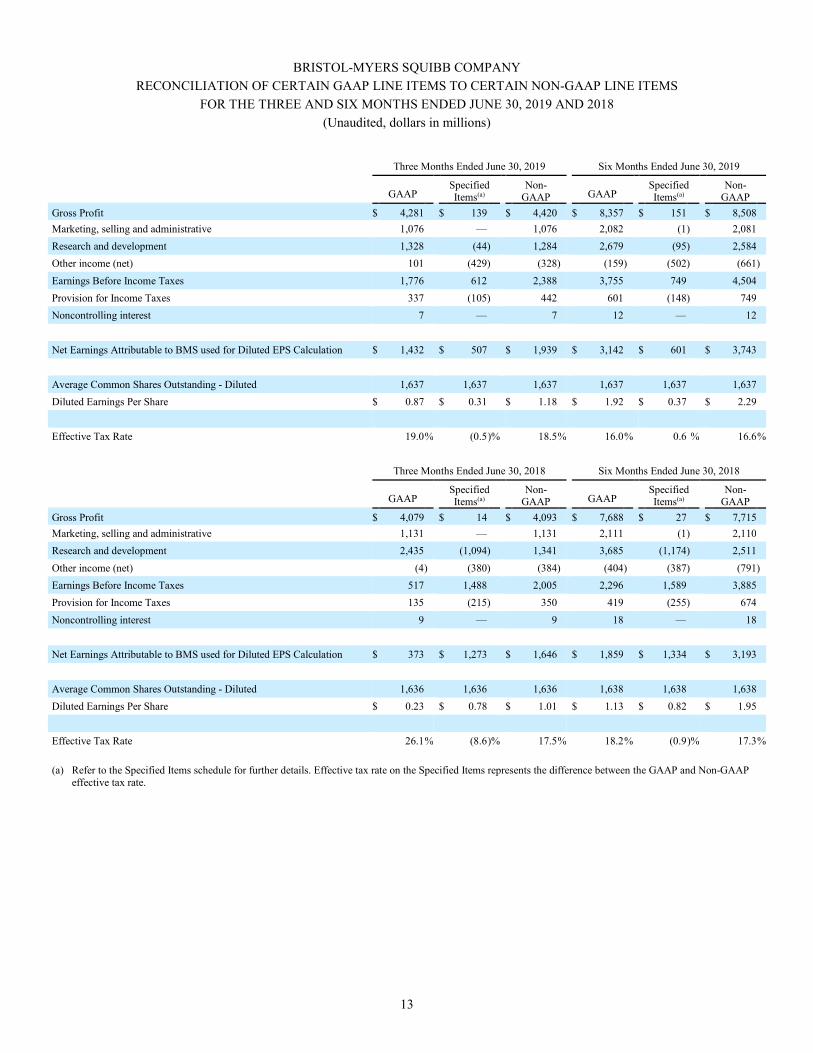
BRISTOL-MYERS SQUIBB COMPANY RECONCILIATION OF CERTAIN GAAP LINE ITEMS TO CERTAIN NON-GAAP LINE ITEMS
FOR THE THREE AND SIX MONTHS ENDED JUNE 30, 2019 AND 2018 (Unaudited, dollars in millions)
Three Months Ended June 30, 2019 Six Months Ended June 30, 2019
GAAP Specified Items(a) Non-
GAAP GAAP Specified Items(a) Non-
GAAP Gross Profit $ 4,281 $ 139 $ 4,420 $ 8,357 $ 151 $ 8,508 Marketing, selling and administrative 1,076 — 1,076 2,082 (1 ) 2,081 Research and development 1,328 (44 ) 1,284 2,679 (95 ) 2,584 Other income (net) 101 (429 ) (328 ) (159 ) (502 ) (661 ) Earnings Before Income Taxes 1,776 612 2,388 3,755 749 4,504 Provision for Income Taxes 337 (105 ) 442 601 (148 ) 749 Noncontrolling interest 7 — 7 12 — 12 Net Earnings Attributable to BMS used for Diluted EPS Calculation $ 1,432 $ 507 $ 1,939 $ 3,142 $ 601 $ 3,743 Average Common Shares Outstanding - Diluted 1,637 1,637 1,637 1,637 1,637 1,637 Diluted Earnings Per Share $ 0.87 $ 0.31 $ 1.18 $ 1.92 $ 0.37 $ 2.29 Effective Tax Rate 19.0 % (0.5 )% 18.5 % 16.0 % 0.6 % 16.6 %
Three Months Ended June 30, 2018 Six Months Ended June 30, 2018
GAAP Specified Items(a) Non-
GAAP GAAP Specified Items(a) Non-
GAAP Gross Profit $ 4,079 $ 14 $ 4,093 $ 7,688 $ 27 $ 7,715 Marketing, selling and administrative 1,131 — 1,131 2,111 (1 ) 2,110 Research and development 2,435 (1,094 ) 1,341 3,685 (1,174 ) 2,511 Other income (net) (4 ) (380 ) (384 ) (404 ) (387 ) (791 ) Earnings Before Income Taxes 517 1,488 2,005 2,296 1,589 3,885 Provision for Income Taxes 135 (215 ) 350 419 (255 ) 674 Noncontrolling interest 9 — 9 18 — 18 Net Earnings Attributable to BMS used for Diluted EPS Calculation $ 373 $ 1,273 $ 1,646 $ 1,859 $ 1,334 $ 3,193 Average Common Shares Outstanding - Diluted 1,636 1,636 1,636 1,638 1,638 1,638 Diluted Earnings Per Share $ 0.23 $ 0.78 $ 1.01 $ 1.13 $ 0.82 $ 1.95 Effective Tax Rate 26.1 % (8.6 )% 17.5 % 18.2 % (0.9 )% 17.3 %
(a) Refer to the Specified Items schedule for further details. Effective tax rate on the Specified Items represents the difference between the GAAP and Non-GAAP
effective tax rate.

14
BRISTOL-MYERS SQUIBB COMPANY NET CASH/(DEBT) CALCULATION
AS OF JUNE 30, 2019 AND DECEMBER 31, 2018 (Unaudited, dollars in millions)
June 30,
2019 December 31,
2018
Cash and cash equivalents $ 28,404 $ 6,911 Marketable securities - current 953 1,973 Marketable securities - non-current 994 1,775
Cash, cash equivalents and marketable securities 30,351 10,659 Short-term debt obligations (545 ) (1,703 ) Long-term debt (24,433 ) (5,646 )
Net cash position $ 5,373 $ 3,310