SECOND-QUARTER 2018 RESULTS -...
11
July 31, 2018 SECOND-QUARTER 2018 RESULTS
Transcript of SECOND-QUARTER 2018 RESULTS -...

J u l y 3 1 , 2 0 1 8
S E C O N D - Q U A R T E R 2 0 1 8 R E S U LT S

P A G E 2
FORWARD-LOOKING STATEMENTS
Statements contained in this presentation that include company expectations or predictions should be considered forward-looking statements that are
covered by the safe harbor protections provided under federal securities legislation and other applicable laws.
It is important to note that actual results could differ materially from those projected in such forward-looking statements. For additional information that
could cause actual results to differ materially from such forward-looking statements, refer to ONEOK’s Securities and Exchange Commission filings.
This presentation contains factual business information or forward-looking information and is neither an offer to sell nor a solicitation of an offer to buy any
securities of ONEOK.
All references in this presentation to financial guidance are based on news releases issued on Jan. 22, 2018, Feb. 26, 2018, May 1, 2018, and July 31,
2018, and are not being updated or affirmed by this presentation.

Mont Belvieu I fractionator — Gulf Coast
4
5
6
7
8
9
1 0
INDEX
FINANCIAL STRENGTH
NATURAL GAS LIQUIDS
NATURAL GAS GATHERING AND PROCESSING
NATURAL GAS PIPELINES
SECOND-QUARTER 2018 VS. FIRST-QUARTER 2018
SEGMENT VARIANCES
UPDATED 2018 FINANCIAL GUIDANCE
NON-GAAP RECONCILIATIONS

P A G E 4
◆ $1.2 billion equity offering in January 2018 prefunded a significant portion of ONEOK’s capital-growth projects, immediately reducing debt
◆ $1.25 billion senior notes issuance completed in July 2018 providing significant liquidity
◆ ONEOK does not expect to issue additional equity in 2018 and well into 2019 for ONEOK’s announced capital-growth projects
◆ Investment-grade credit ratings provide a competitive advantage S&P: BBB (stable); Moody’s: Baa3 (stable)
◆ Extensive asset footprint provides opportunity to invest capital at attractive returns to drive earnings growth
FINANCIAL STRENGTH INCREASING EXCESS CASH AND IMPROVED LEVERAGE METRICS
$65 $81 $80
$116 $126
Q2 2017 Q3 2017 Q4 2017 Q1 2018 Q2 2018
D i s t r i b u t a b l e C a s h F l o w ( D C F ) i n E x c e s s o f D i v i d e n d s P a i d
( $ i n m i l l i o n s )
$462.3
$517.2 $547.7
$570.3 $601.8
Q2 2017 Q3 2017 Q4 2017 Q1 2018 Q2 2018
A d j u s t e d E B I T D A G r o w t h ( $ i n m i l l i o n s )
5.1x 4.9x
4.6x
3.8x 3.7x
3.4x*
Q2 2017 Q3 2017 Q4 2017 Q1 2018 Q2 2018
D e b t - t o - E B I T D A R a t i o ( t r a i l i n g 1 2 m o n t h s )
*Q2 2018 adjusted EBITDA annualized

P A G E 5
NATURAL GAS LIQUIDS
*Includes transportation and fractionation
**Transportation only
VOLUME UPDATE
◆ 2018 volume growth expected to be driven primarily by increased producer activity in the STACK and SCOOP areas and increased ethane recovery in the Mid-Continent
Ethane volumes across ONEOK’s system increased 60,000 bpd compared with second quarter 2017
◆ Six to nine third-party natural gas processing plant connections expected in 2018
Two third-party plants connected in the STACK and SCOOP areas in the second quarter
One existing third-party plant connection in the STACK and SCOOP area was expanded in the first quarter
Region/Asset
First Quarter 2018 –
Average Gathered
Volumes
Second Quarter 2018
– Average Gathered
Volumes
Average
Bundled Rate
(per gallon)
Bakken NGL
Pipeline 136,000 bpd 138,000 bpd ~30 cents*
Mid-Continent 527,000 bpd 569,000 bpd < 9 cents*
West Texas LPG
system 192,000 bpd 196,000 bpd < 3 cents**
Total 855,000 bpd 903,000 bpd
533
769 770 812
850–1,000
2014 2015 2016 2017 2018G
G a t h e r e d Vo l u m e ( M B b l / d )
522 552 586 621
650-725
2014 2015 2016 2017 2018G
F r a c t i o n a t i o n Vo l u m e ( M B b l / d )

P A G E 6
NATURAL GAS GATHERING AND PROCESSING VOLUME UPDATE
Williston Basin ◆ Bear Creek natural gas processing plant expansion to 130 MMcf/d complete
◆ Expect to connect approximately 550 wells in 2018
322 well connects completed in the first half of 2018
◆ More than 25 rigs on ONEOK’s dedicated acreage
Mid-Continent ◆ Expect to connect approximately 130 wells in 2018
61 well connects completed in the first half of 2018
◆ More than 10 rigs on ONEOK’s dedicated acreage
662 780 841 875-975
862 781 839 965-1,075
2015 2016 2017 2018G*
G a t h e r e d Vo l u m e s ( M M c f / d )
Rocky Mountain Mid-Continent
622 756 829 890-960
658 653 723
860-940
2015 2016 2017 2018G**
P r o c e s s e d V o l u m e s ( M M c f / d )
Rocky Mountain Mid-Continent
1,524 1,561 1,680
*2018 guidance gathered volumes (BBtu/d): 2,430-2,700 **2018 guidance processed volumes (BBtu/d): 2,310-2,500
1,840 – 2,050
1,280 1,409
1,552
1,750 – 1,900
Region
First Quarter 2018
– Average
Gathered
Volumes
Second Quarter
2018 – Average
Gathered
Volumes
First Quarter 2018
– Average
Processed
Volumes
Second Quarter
2018 – Average
Processed
Volumes
Mid-Continent 965 MMcf/d 968 MMcf/d 845 MMcf/d 853 MMcf/d
Rocky Mountain 911 MMcf/d 948 MMcf/d 888 MMcf/d 932 MMcf/d
Total 1,876 MMcf/d 1,916 MMcf/d 1,733 MMcf/d 1,785 MMcf/d

P A G E 7
◆ Expect more than 95 percent fee-based earnings in 2018, and:
Approximately 95 percent of transportation capacity contracted
Approximately 65 percent of natural gas storage capacity contracted
◆ Firm demand-based contracts serving primarily investment-grade utility customers
◆ Recently announced natural gas takeaway projects out of the Permian Basin and STACK and SCOOP areas, including expansions of the ONEOK WesTex Transmission system, ONEOK Gas Transportation system and a bidirectional project on ONEOK’s Roadrunner Gas Transmission joint venture.
NATURAL GAS PIPELINES WELL-POSITIONED AND MARKET-CONNECTED
6,452 6,593 6,642 6,779 6,650
Q2 2017 Q3 2017 Q4 2017 Q1 2018 Q2 2018
N a t u r a l G a s T r a n s p o r t a t i o n C a p a c i t y C o n t r a c t e d ( M D t h / d )
92% 92% 94% 95%
2015 2016 2017 2018G
N a t u r a l G a s T r a n s p o r t a t i o n C a p a c i t y S u b s c r i b e d
P A G E 8
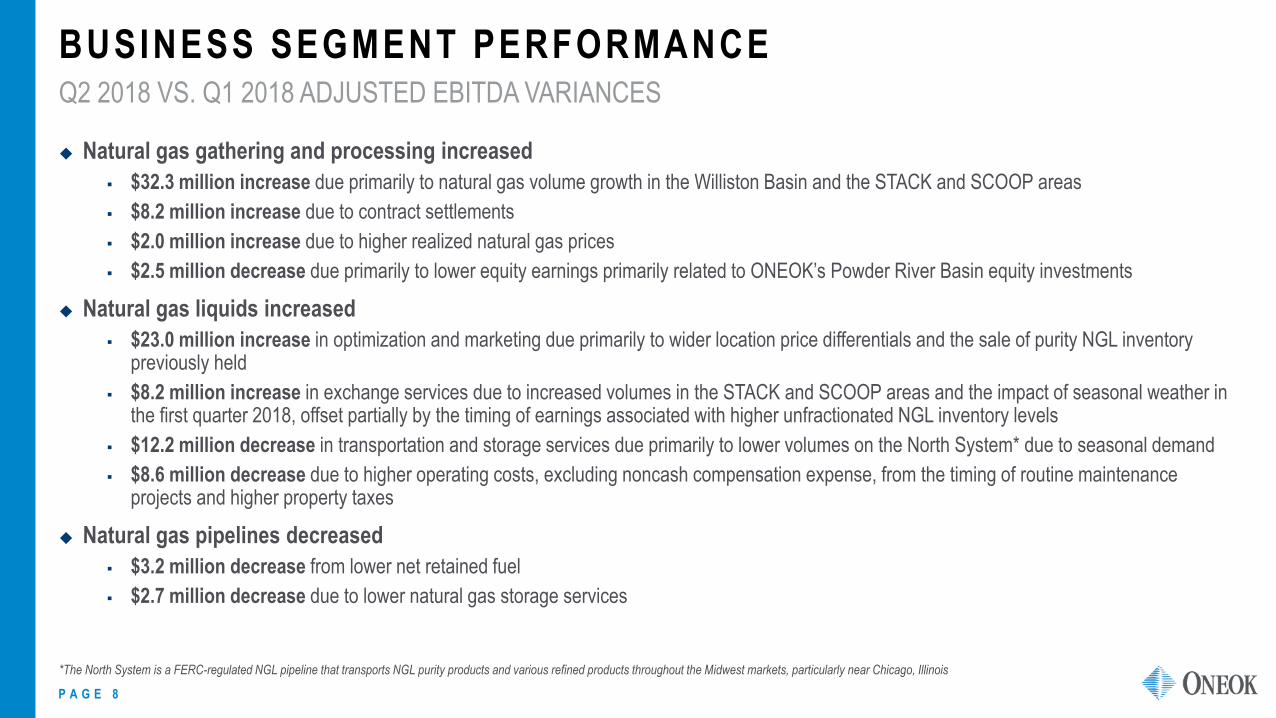
◆ Natural gas gathering and processing increased
$32.3 million increase due primarily to natural gas volume growth in the Williston Basin and the STACK and SCOOP areas
$8.2 million increase due to contract settlements
$2.0 million increase due to higher realized natural gas prices
$2.5 million decrease due primarily to lower equity earnings primarily related to ONEOK’s Powder River Basin equity investments
◆ Natural gas liquids increased
$23.0 million increase in optimization and marketing due primarily to wider location price differentials and the sale of purity NGL inventory previously held
$8.2 million increase in exchange services due to increased volumes in the STACK and SCOOP areas and the impact of seasonal weather in the first quarter 2018, offset partially by the timing of earnings associated with higher unfractionated NGL inventory levels
$12.2 million decrease in transportation and storage services due primarily to lower volumes on the North System* due to seasonal demand
$8.6 million decrease due to higher operating costs, excluding noncash compensation expense, from the timing of routine maintenance projects and higher property taxes
◆ Natural gas pipelines decreased
$3.2 million decrease from lower net retained fuel
$2.7 million decrease due to lower natural gas storage services
BUSINESS SEGMENT PERFORMANCE
*The North System is a FERC-regulated NGL pipeline that transports NGL purity products and various refined products throughout the Midwest markets, particularly near Chicago, Illinois
Q2 2018 VS. Q1 2018 ADJUSTED EBITDA VARIANCES

P A G E 9
2018 F INANCIAL GUIDANCE UPDATED JULY 31, 2018 NON-GAAP RECONCILIATION
2018 Updated Guidance Range (Millions of dollars)
Reconciliation of Net Income to Adjusted EBITDA and Distributable Cash Flow
Net Income $ 1,020 - $ 1,150
Interest expense, net of capitalized interest 485 - 465
Depreciation and amortization 425 - 435
Income taxes 315 - 335
Noncash compensation expense 40 - 30
Other noncash items and equity AFUDC - - -
Adjusted EBITDA 2,285 - 2,415
Interest expense, net of capitalized interest (485) - (465)
Maintenance capital (160) - (180)
Equity in net earnings from investments (140) - (160)
Distributions received from unconsolidated affiliates 175 - 205
Other - - (10)
Distributable cash flow $ 1,675 - $ 1,805

P A G E 1 0
NON-GAAP RECONCILIATION
2017 2018
($ in Millions) Q1 Q2 Q3 Q4 FY Q1 Q2
Reconciliation of Net Income to Adjusted EBITDA
Net income $186 $176 $167 $65 $594 $266 $282
Interest expense, net of capitalized interest 116 118 127 125 486 116 113
Depreciation and amortization 99 101 102 104 406 104 107
Impairment charges - - 20 - 20 - -
Income taxes 55 44 97 251 447 76 88
Noncash compensation expense 2 3 5 3 13 9 12
Other noncash items and equity AFUDC 2 20 (1) - 21 (1) -
Adjusted EBITDA $460 $462 $517 $548 $1,987 $570 $602
Interest expense, net of capitalized interest (116) (118) (127) (125) (486) (116) (113)
Maintenance capital (24) (23) (33) (67) (147) (30) (44)
Equity earnings from investments (40) (39) (40) (40) (159) (40) (37)
Distributions received from unconsolidated affiliates 47 50 49 50 196 50 48
Other (3) (2) (2) - (7) (2) (3)
Distributable Cash Flow $324 $330 $364 $366 $1,384 $432 $453
Dividends paid to preferred shareholders - - - (1) (1) - -
Distributions paid to public limited partners (135) (135) - - (270) - -
Distributable cash flow to shareholders $189 $195 $364 $365 $1,113 $432 $453
Dividends paid (130) (130) (283) (285) (828) (316) (327)
Distributable cash flow in excess of dividends paid 59 65 81 80 285 116 126
Dividends paid per share $0.615 $0.615 $0.745 $0.745 $2.720 $0.770 $0.795
Dividend coverage ratio 1.46 1.50 1.29 1.28 1.34 1.37 1.39
Number of shares used in computations (millions) 211 211 380 383 304 411 411

Bear Creek plant — Williston Basin