ONEOK and ONEOK Partners to Present at Houston Energy Financial
67
Houston Energy Financial Forum Houston Energy Financial Forum Houston Energy Financial Forum Houston Energy Financial Forum Houston, Texas | November 18, 2008
-
Upload
finance20 -
Category
Economy & Finance
-
view
832 -
download
4
Transcript of ONEOK and ONEOK Partners to Present at Houston Energy Financial
Houston Energy Financial ForumHouston Energy Financial ForumHouston Energy Financial ForumHouston Energy Financial ForumHouston, Texas | November 18, 2008
Jim KnealeJim KnealeJim KnealeJim KnealePresident and Chief Operating OfficerONEOK, Inc. | ONEOK Partners, L.P.
2
ONEOK, Inc. | ONEOK Partners, L.P.
ForwardForward--Looking StatementLooking Statement
Statements contained in this presentation that include company p p yexpectations or predictions should be considered forward-looking statements which are covered by the safe harbor provisions of the Securities Act of 1933 and the Securities and Exchange Act of 1934 Securities Act of 1933 and the Securities and Exchange Act of 1934. It is important to note that the actual results of company earnings could differ materially from those projected in such forward-looking statements. For additional information, refer to ONEOK’s and ONEOK Partners’ Securities and Exchange Commission Filings.
3
AgendaAgenda
Overview & VisionOverview & VisionOverview & VisionOverview & VisionDiversified AssetsDiversified AssetsFinancial HighlightsFinancial Highlights
4
Financial HighlightsFinancial Highlights
Overview & VisionOverview & Vision
5
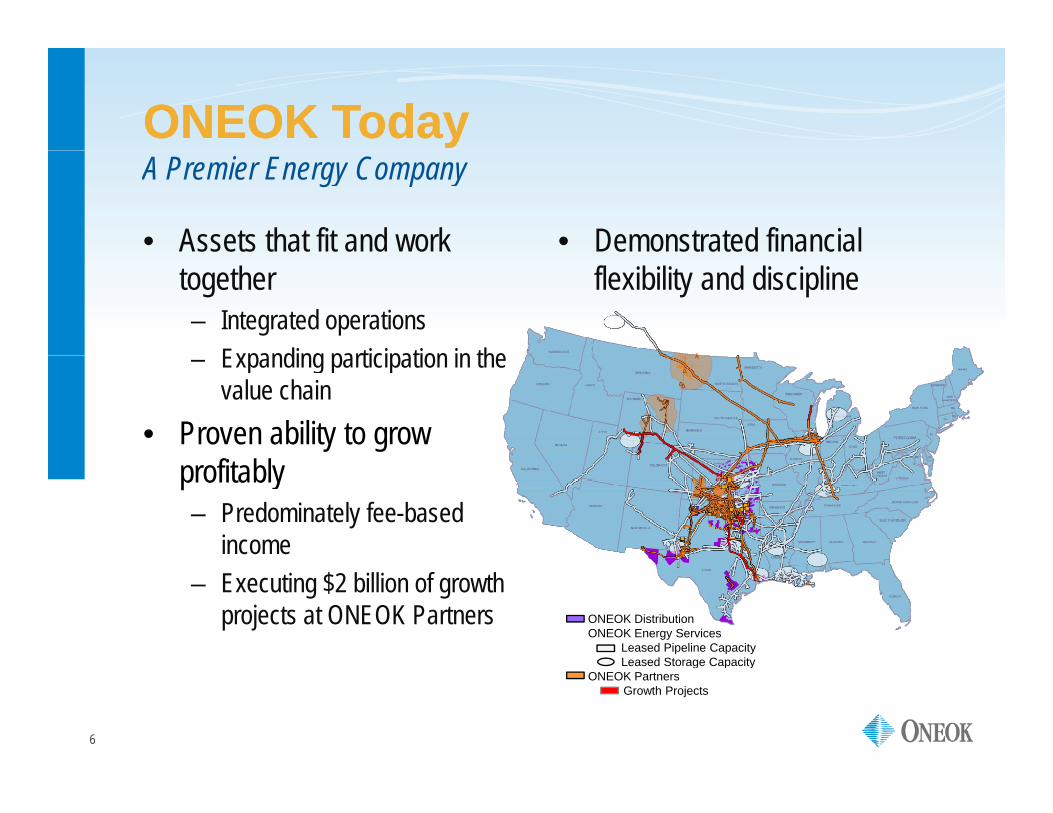
ONEOK TodayONEOK Today
• Assets that fit and work • Demonstrated financial
A Premier Energy Company
together– Integrated operations
Expanding participation in the
flexibility and discipline
– Expanding participation in the value chain
• Proven ability to grow profitably– Predominately fee-based
income– Executing $2 billion of growth
projects at ONEOK Partners ONEOK DistributionONEOK Energy Services
Leased Pipeline CapacityLeased Storage Capacity
6
Leased Storage Capacity ONEOK Partners
Growth Projects

Our VisionOur Vision
A premier energy company creating exceptional value for all
A Premier Energy Company
p gy p y g pstakeholders by:• Rebundling services across the value chain, primarily through
ti l i t ti t id t ith i i vertical integration, to provide customers with premium services at lower costs
• Applying our capabilities — as a gatherer, processor, transporter, Applying our capabilities as a gatherer, processor, transporter, marketer and distributor — to natural gas and natural gas liquids…
…and other commodities
7

A Journey By DesignA Journey By DesignRebundling the Value Chain and Applying Our Capabilities
MidstreamNatural Gas
MidstreamNGLs
Exploration & Production
Distribution MarketsMarketing
• Leading marketer of natural gas
• Gathering• Processing• Pipelines• Storage
• Gathering• Fractionation• Pipelines• Storage
• Serve 2 million customers in Oklahoma, Kansas & Texas
8
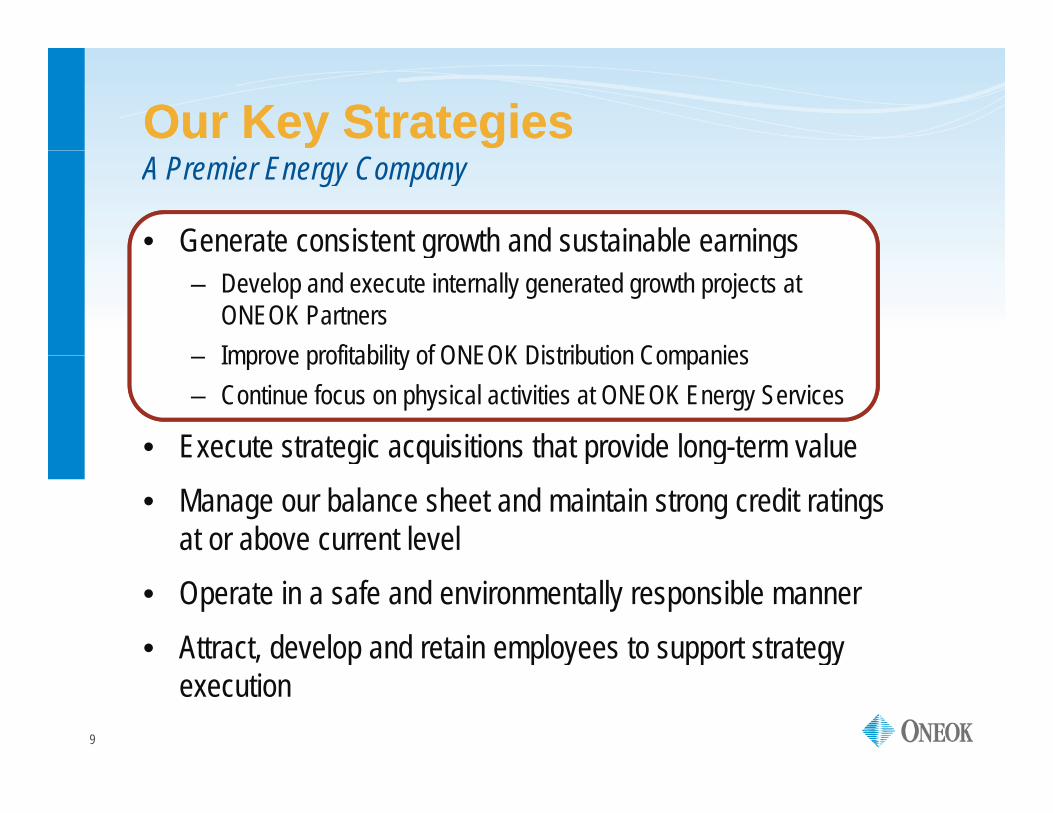
Our Key StrategiesOur Key StrategiesA Premier Energy Company
• Generate consistent growth and sustainable earningsg g– Develop and execute internally generated growth projects at
ONEOK PartnersImprove profitability of ONEOK Distribution Companies– Improve profitability of ONEOK Distribution Companies
– Continue focus on physical activities at ONEOK Energy Services
• Execute strategic acquisitions that provide long-term valueg q p g• Manage our balance sheet and maintain strong credit ratings
at or above current level• Operate in a safe and environmentally responsible manner• Attract, develop and retain employees to support strategy
9
p p y pp gyexecution
Diversified AssetsDiversified Assets
DistributionDistributionDistributionDistributionEnergy ServicesEnergy Services
10
ONEOK PartnersONEOK Partners

DistributionDistribution
• Growth
Sixth Largest Natural Gas Distributor in U.S.
– Efficient investments– Customers, volumes, rate base
• Earnings stabilizationg– Synchronized rates and regulatory actions– Innovative rate design and mechanisms– Operations and maintenance cost control
• Cost control– Standardization – Continuous process improvement p p– Utilize technology
• Serve more than two million customers in Oklahoma, Kansas and Texas
Revenues $2.1 billionAsset Base $2.7 billion
11
,Rate Base $1.7 billion
DistributionDistribution
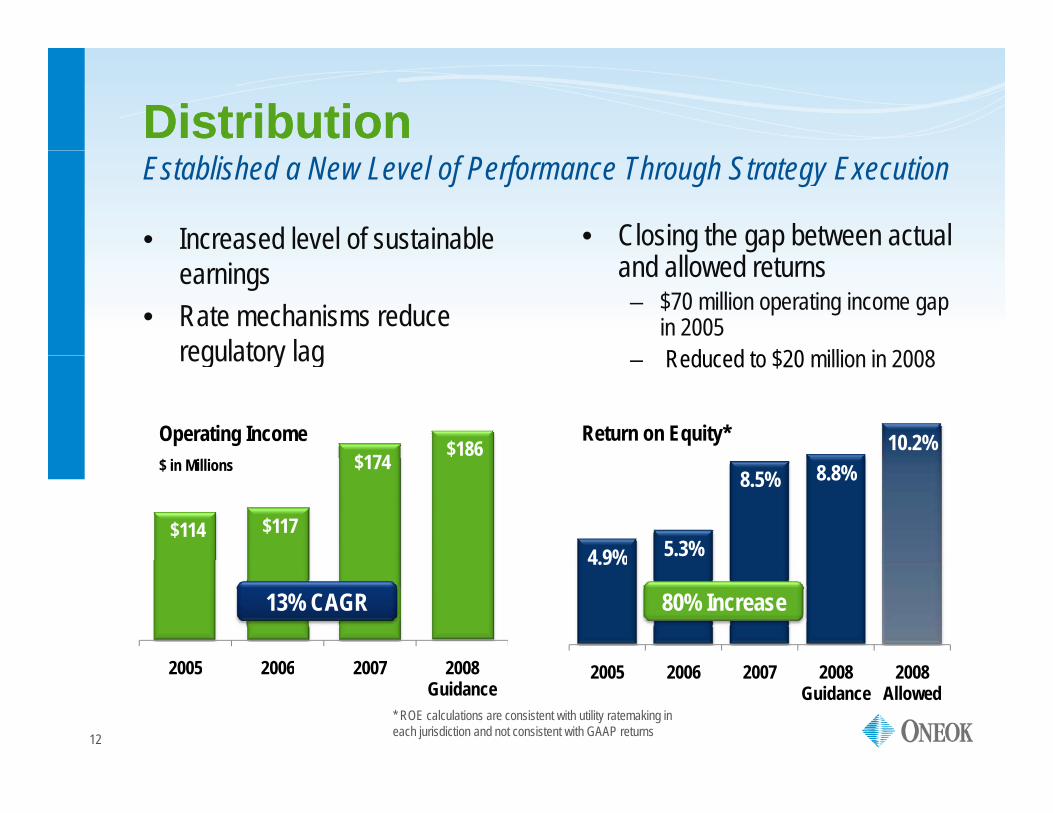
• Increased level of sustainable
Established a New Level of Performance Through Strategy Execution
• Closing the gap between actual earnings
• Rate mechanisms reduce regulatory lag
and allowed returns– $70 million operating income gap
in 2005Reduced to $20 million in 2008regulatory lag
10.2%Return on Equity*$174 $186
Operating Income
– Reduced to $20 million in 2008
4 9% 5.3%
8.5% 8.8%
$114 $117
$174 $ in Millions
4.9%
2005 2006 2007 2008
13% CAGR 80% Increase
12
2005 2006 2007 2008 Guidance
2008 Allowed
* ROE calculations are consistent with utility ratemaking in each jurisdiction and not consistent with GAAP returns
2005 2006 2007 2008 Guidance
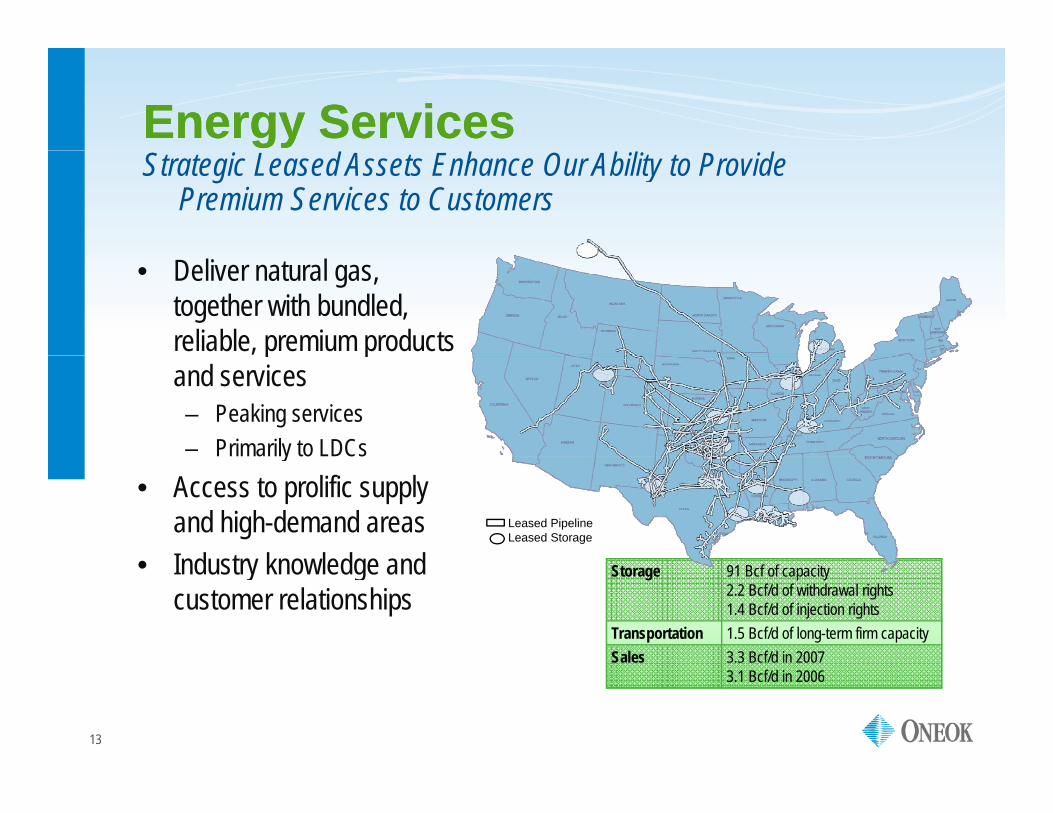
Energy ServicesEnergy ServicesStrategic Leased Assets Enhance Our Ability to Provide
Premium Services to Customers
• Deliver natural gas, together with bundled, reliable, premium products p pand services – Peaking services– Primarily to LDCsy
• Access to prolific supply and high-demand areas
• Industry knowledge and Leased PipelineLeased Storage
Storage 91 Bcf of capacity2.2 Bcf/d of withdrawal rights1.4 Bcf/d of injection rights
Transportation 1.5 Bcf/d of long-term firm capacitySales 3.3 Bcf/d in 2007
• Industry knowledge and customer relationships
13
3.1 Bcf/d in 2006

Energy ServicesEnergy Services
• $830 million of operating income in five years
Key Drivers
$830 million of operating income in five years• Seasonal storage and transportation differentials have the
greatest impact
$166
$229 $205
$200
$250
$4.00
$5.00
illion
s)
$139 $
$93 $100
$150
$2.00
$3.00
ing
Inco
me (
M
$/MMB
tu
$0
$50
$-
$1.00
2004 2005 2006 2007 2008 Guidance
Oper
at
14
2004 2005 2006 2007 2008 GuidanceRealized Storage Differential Rockies to Mid-Continent Differential Operating Income
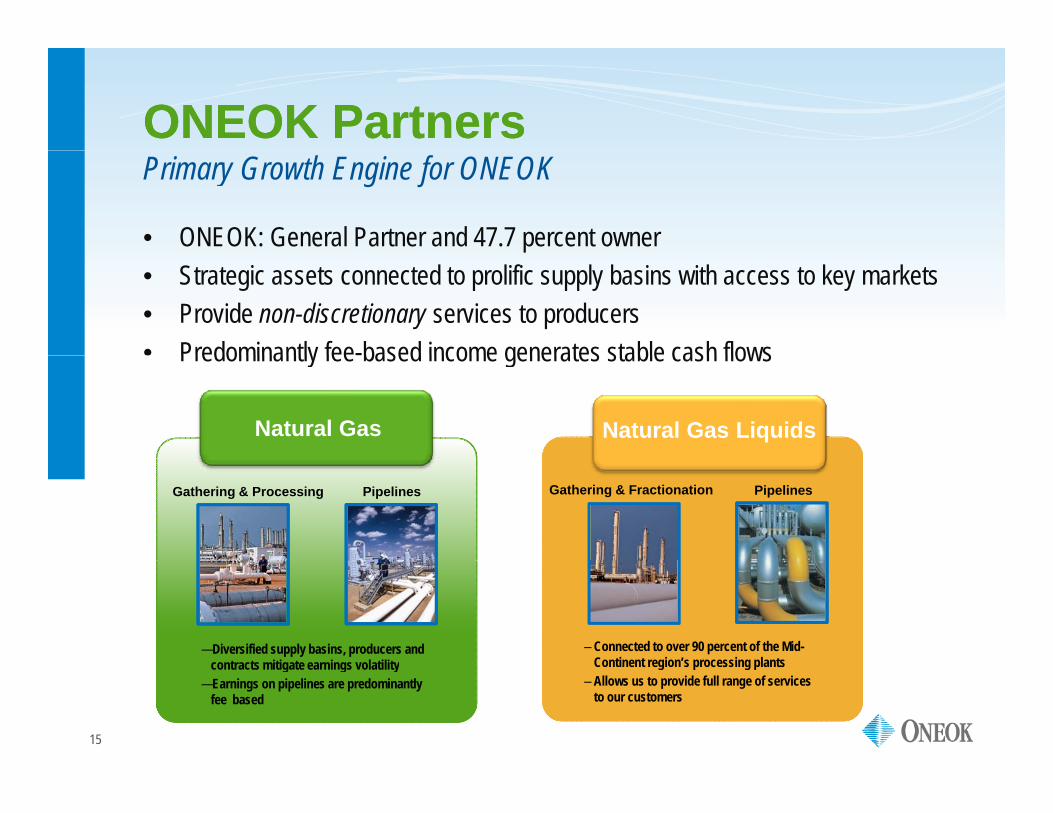
ONEOK PartnersONEOK Partners
• ONEOK: General Partner and 47.7 percent owner
Primary Growth Engine for ONEOK
• Strategic assets connected to prolific supply basins with access to key markets• Provide non-discretionary services to producers • Predominantly fee-based income generates stable cash flowsPredominantly fee-based income generates stable cash flows
Natural Gas Natural Gas Liquids
PipelinesGathering & Processing Gathering & Fractionation Pipelines
—Diversified supply basins, producers and contracts mitigate earnings volatility
– Connected to over 90 percent of the Mid-Continent region’s processing plants
15
contracts mitigate earnings volatility—Earnings on pipelines are predominantly
fee based
Continent region s processing plants– Allows us to provide full range of services
to our customers

ONEOK Partners ONEOK Partners -- Roadmap to GrowthRoadmap to Growth$2 Billion of Internal Growth Projects by 2009
Grasslands plant expansionplant expansion
$40-$45 million Guardian II Expansion
$277-$305 millionFort Union Gas Gathering Expansion
(37% owner)
Piceance Lateral
Overland Pass Pipeline
$575-$590 million
NGL & Refined Product System Acquisition
$300 million
(
D-J Lateral $70-$80 million
Lateral $110-$140 million NGL Upgrade
Projects $230-$240 million
Woodford
Midwestern Extension $69 million
Arbuckle Pipeline
$340-$360 million
Natural Gas Gathering & ProcessingNatural Gas PipelinesNatural Gas Liquids Gathering & FractionationNatural Gas Liquids Pipelines
Extension $36 million
2010 -2015 Internal Growth Projects:$300-500 million/year
l i iti
16
Natural Gas Liquids PipelinesGrowth Projects
plus acquisitions
ONEOK PartnersONEOK Partners
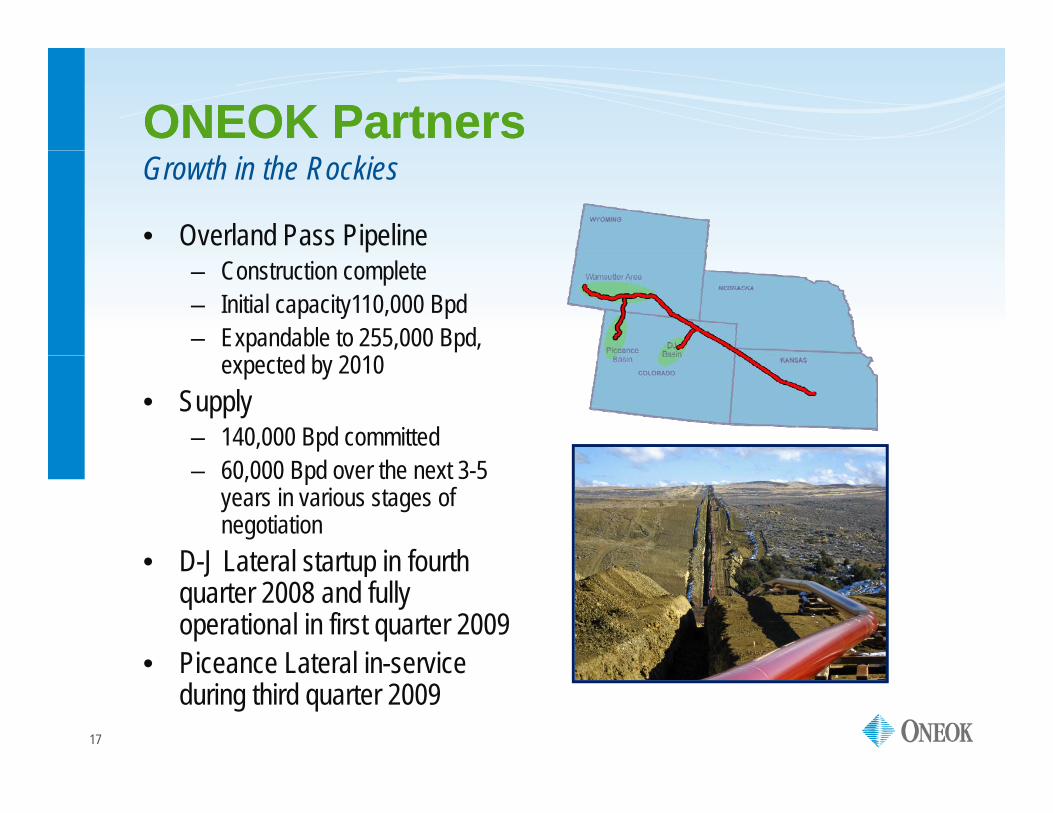
• Overland Pass Pipeline
Growth in the Rockies
– Construction complete– Initial capacity110,000 Bpd– Expandable to 255,000 Bpd,
d b 2010expected by 2010• Supply
– 140,000 Bpd committed– 60,000 Bpd over the next 3-5
years in various stages of negotiation
• D J Lateral startup in fourth • D-J Lateral startup in fourth quarter 2008 and fully operational in first quarter 2009
• Piceance Lateral in service
17
• Piceance Lateral in-service during third quarter 2009
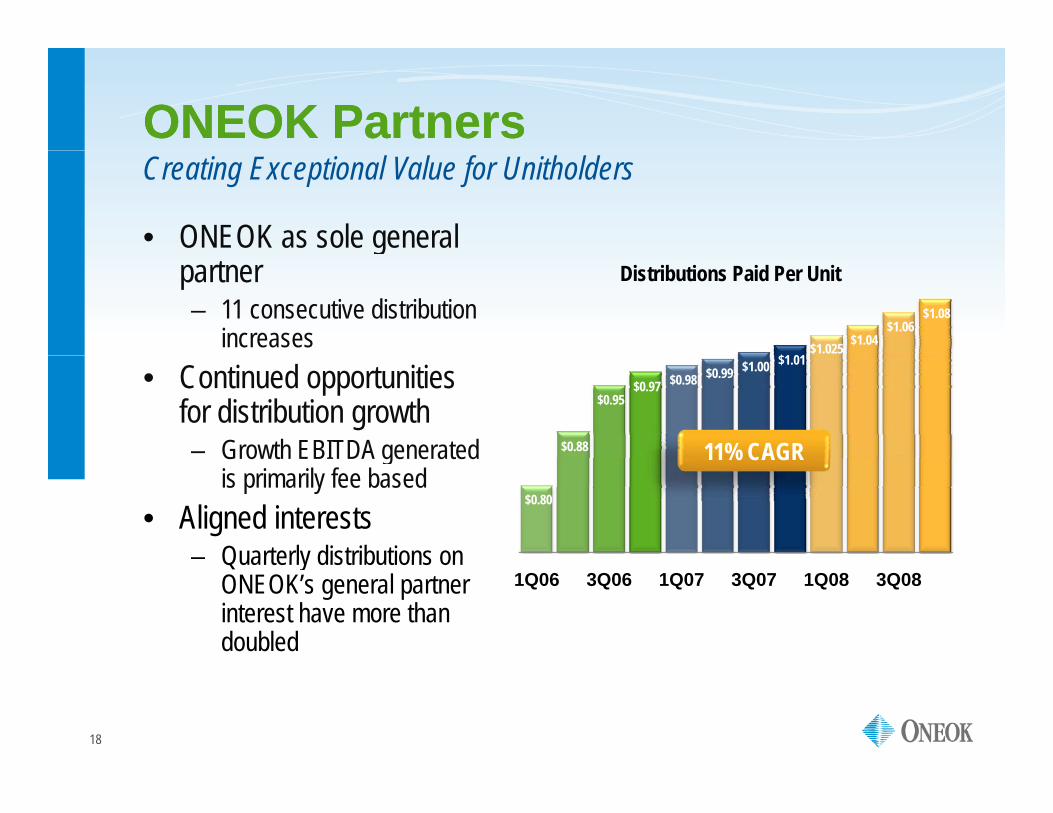
ONEOK PartnersONEOK Partners
• ONEOK as sole general
Creating Exceptional Value for Unitholders
gpartner– 11 consecutive distribution
increases$1 01
$1.025 $1.04 $1.06
$1.08
Distributions Paid Per Unit
• Continued opportunities for distribution growth– Growth EBITDA generated $0.88
$0.95 $0.97 $0.98 $0.99 $1.00 $1.01
11% CAGRGrowth EBITDA generated is primarily fee based
• Aligned interests– Quarterly distributions on
$0.80
11% CAGR
Quarterly distributions on ONEOK’s general partner interest have more than doubled
1Q06 3Q06 1Q07 3Q07 1Q08 3Q08
18
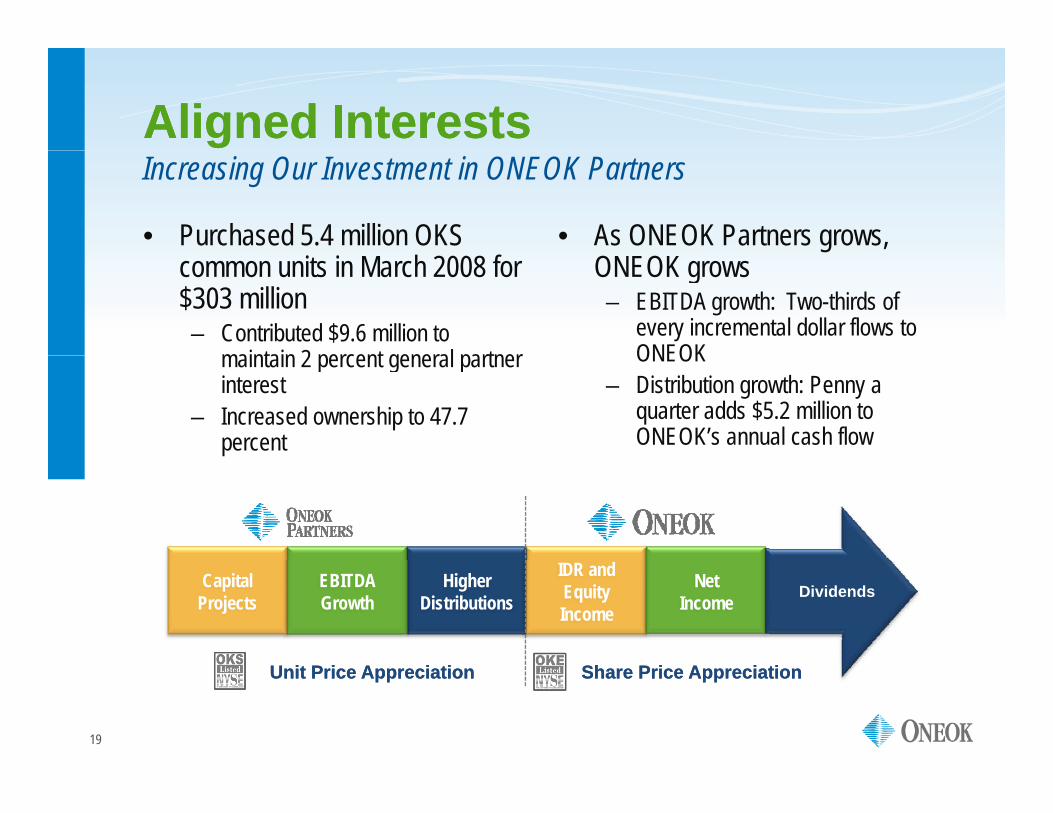
Aligned InterestsAligned Interests
• Purchased 5.4 million OKS • As ONEOK Partners grows,
Increasing Our Investment in ONEOK Partners
common units in March 2008 for $303 million– Contributed $9.6 million to
maintain 2 percent general partner
ONEOK grows– EBITDA growth: Two-thirds of
every incremental dollar flows to ONEOKmaintain 2 percent general partner
interest– Increased ownership to 47.7
percent
ONEOK– Distribution growth: Penny a
quarter adds $5.2 million to ONEOK’s annual cash flow
DividendsCapital Projects
EBITDA Growth
Higher Distributions
IDR and Equity Income
Net Income
19
Share Price AppreciationShare Price AppreciationUnit Price AppreciationUnit Price Appreciation

Financial HighlightsFinancial Highlights
20
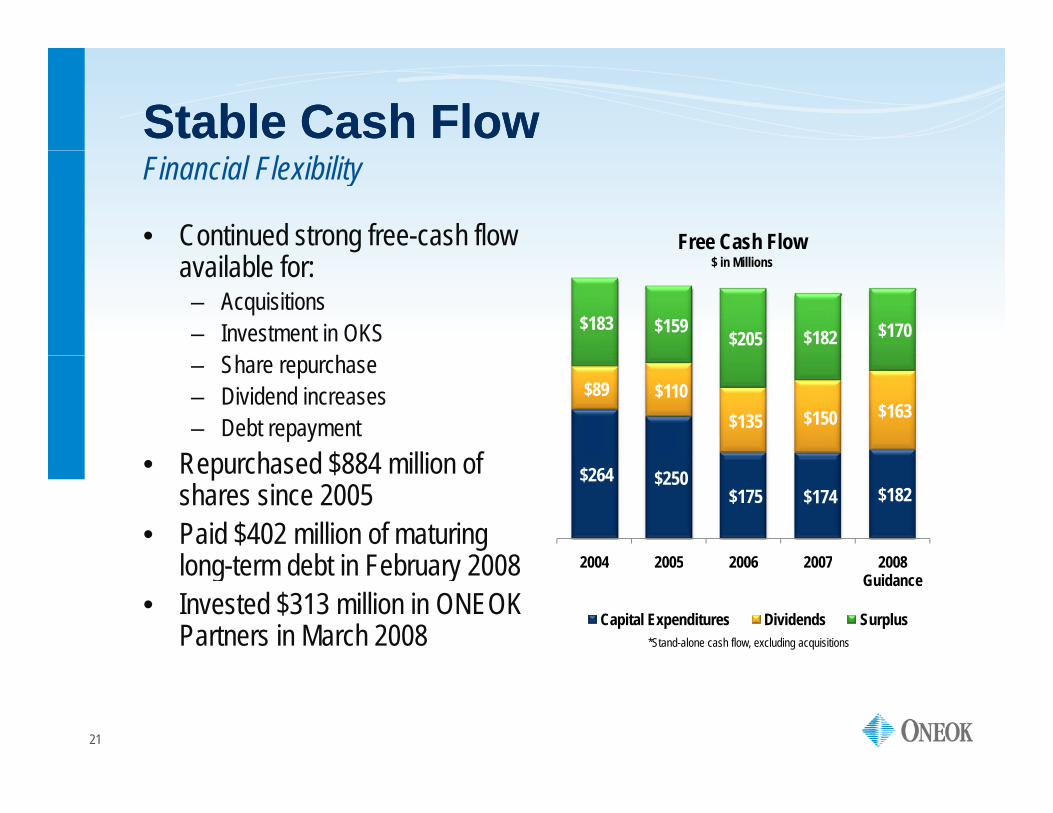
Stable Cash FlowStable Cash Flow
• Continued strong free-cash flow
Financial Flexibility
Free Cash Flowavailable for:– Acquisitions – Investment in OKS $183 $159 $205 $182 $170
$ in Millions
– Share repurchase– Dividend increases – Debt repayment
R h d $884 illi f
$89 $110 $135 $150 $163
• Repurchased $884 million of shares since 2005
• Paid $402 million of maturing long term debt in February 2008
$264 $250 $175 $174 $182
2004 2005 2006 2007 2008 long-term debt in February 2008• Invested $313 million in ONEOK
Partners in March 2008
2004 2005 2006 2007 2008 Guidance
Capital Expenditures Dividends Surplus*Stand-alone cash flow, excluding acquisitions
21
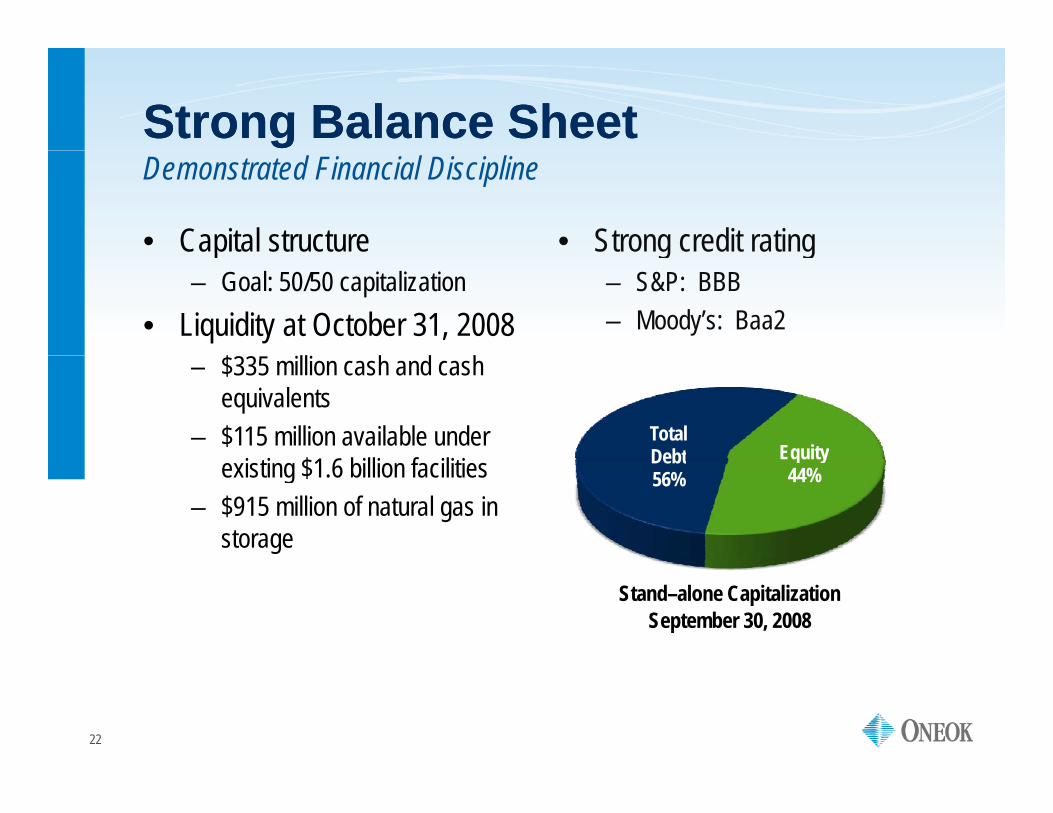
Strong Balance SheetStrong Balance Sheet
• Capital structure • Strong credit rating
Demonstrated Financial Discipline
p– Goal: 50/50 capitalization
• Liquidity at October 31, 2008$
g g– S&P: BBB– Moody’s: Baa2
EquityTotal Debt
– $335 million cash and cash equivalents
– $115 million available under $ Equity
44%Debt56%existing $1.6 billion facilities
– $915 million of natural gas in storage
Stand–alone Capitalization September 30, 2008
22

Shareholder ValueShareholder Value
Shareholder Return
Delivering Consistent Growth and Stable Earnings
Dividend Growth• 10 dividend increases in five years• Target: 50-55 percent of recurring
earnings
• Total return of 84 percent since 2004• Share price increase of 53 percent
since 2004
6 0.38
0.40
$47.40 160%
180%$50Share Price Total Return
.19
$0.2
1 $0
.23
$0.2
5
$0.2
8
$0.3
0 $0
.32
$0.3
4
$0.3
6
$0 $
$22 $26.02
$30.82 $34.02 $32.25
$37.79
$45.00 $47.40
$44.63
$34.40
80%
100%
120%
140%
160%
$20
$30
$40
84%16% CAGR
$0$
Q1 2004 Q1 2005 Q1 2006 Q1 2007 Q1 2008
$22.55
0%
20%
40%
60%
$0
$10
$20
S&P 500ONEOK, Inc.
16% CAGR
23
Q1 2004 Q1 2005 Q1 2006 Q1 2007 Q1 2008
Dividends Per Share1Q04 3Q04 1Q05 3Q05 1Q06 3Q06 1Q07 3Q07 1Q08 3Q08
Total Shareholder Return*Share prices are closing prices at last day of quarter

Key Investment ConsiderationsKey Investment Considerations
• Strong track record of creating value for both customers and
A Premier Energy Company
g ginvestors, through rebundling services across the value chain and applying our capabilities to other commoditiesSt t i t ti lifi l b i d k k t • Strategic assets connecting prolific supply basins and key markets
• Significant growth potential through continued strategy execution• Demonstrated financial discipline• Demonstrated financial discipline• Experienced and proven management team• Talented workforce dedicated to providing safe and reliable p g
service to all our customers
24

AppendixAppendix
ONEOKONEOKONEOKONEOK
26
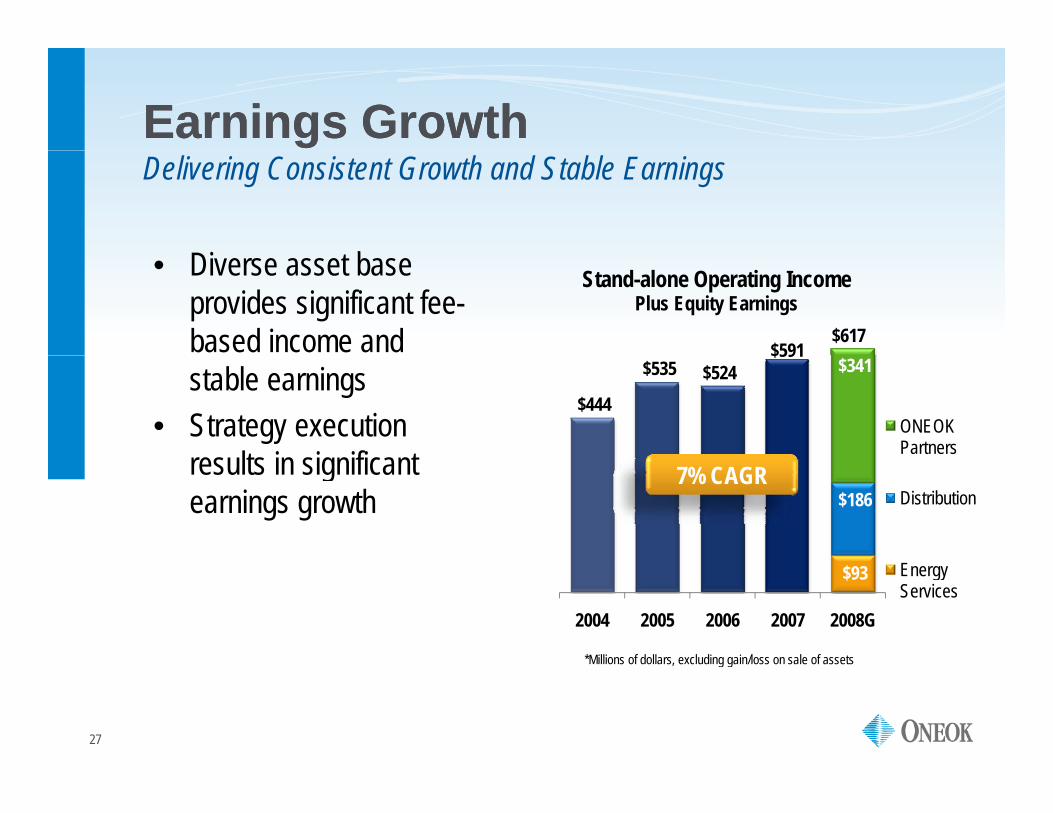
Earnings GrowthEarnings GrowthDelivering Consistent Growth and Stable Earnings
Di b
$591
Stand-alone Operating Income Plus Equity Earnings
$617
• Diverse asset base provides significant fee-based income and
$444
$535 $524 $591
$341
ONEOK Partners
stable earnings• Strategy execution
res lts in significant $186 Distribution
results in significant earnings growth
7% CAGR
$93
2004 2005 2006 2007 2008G
Energy Services
*Millions of dollars, excluding gain/loss on sale of assets
27
Millions of dollars, excluding gain/loss on sale of assets

Aligned InterestsAligned Interests
• Quarterly distributions to
Growth at ONEOK Partners Benefits ONEOK
$19.1 $20.9
$22.7 General Partner DistributionsQ yONEOK have increased in the past two years:
General partner interest $10.0
$11.6 $12.4 $13.3 $14.1 $14.9 $16.2 $19.1
39% CAGR $ in
Millio
ns
– General partner interest distributions have more than doubledLimited partner interest
2Q06 3Q06 4Q06 1Q07 2Q07 3Q07 4Q07 1Q08 2Q08 3Q08
39% CAGR $
– Limited partner interest distributions have increased more than $10 million
I t ll t d th $35.1 $35.9 $36.3 $36.6 $37.0 $37.4 $37.9
$44.1 $44.9 $45.8 Limited Partner Distributions
ns• Internally generated growth projects will result in additional growth
11% CAGR $ in
Millio
n
28
2Q06 3Q06 4Q06 1Q07 2Q07 3Q07 4Q07 1Q08 2Q08 3Q08
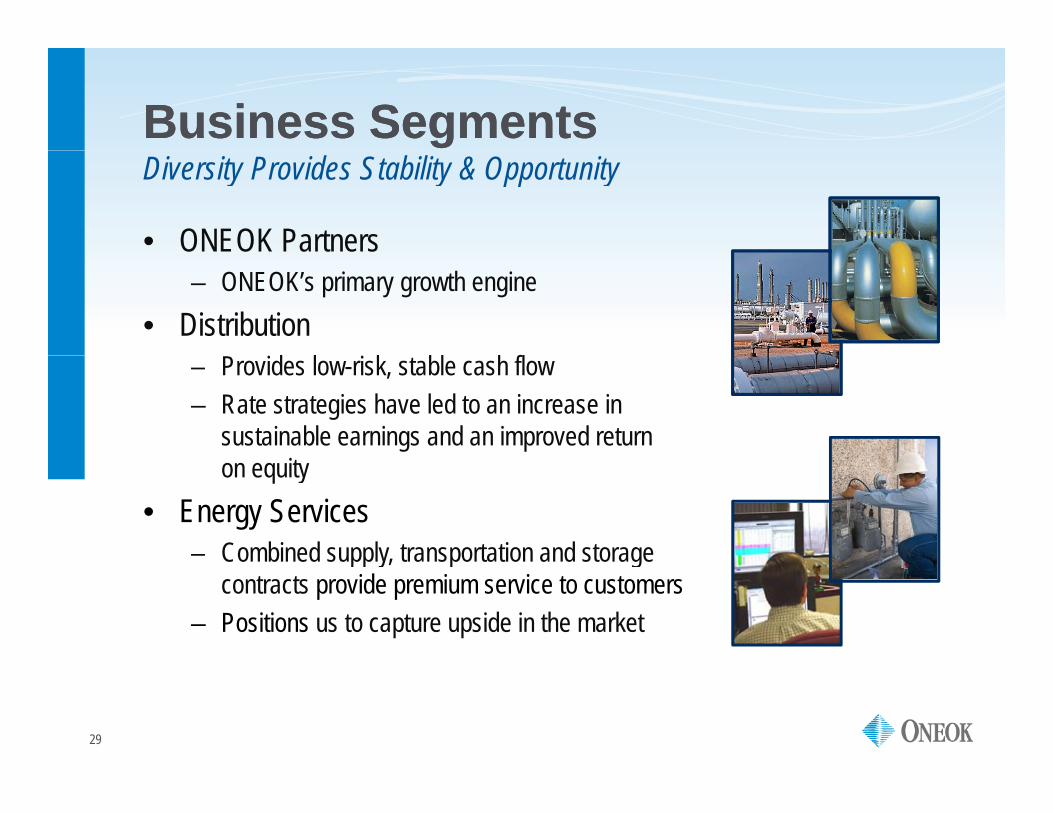
Business SegmentsBusiness Segments
• ONEOK Partners
Diversity Provides Stability & Opportunity
– ONEOK’s primary growth engine• Distribution
– Provides low-risk, stable cash flow– Rate strategies have led to an increase in
sustainable earnings and an improved return on equity
• Energy Services– Combined supply, transportation and storage Combined supply, transportation and storage
contracts provide premium service to customers– Positions us to capture upside in the market
29
DistributionDistribution
• Largest natural gas distributor in
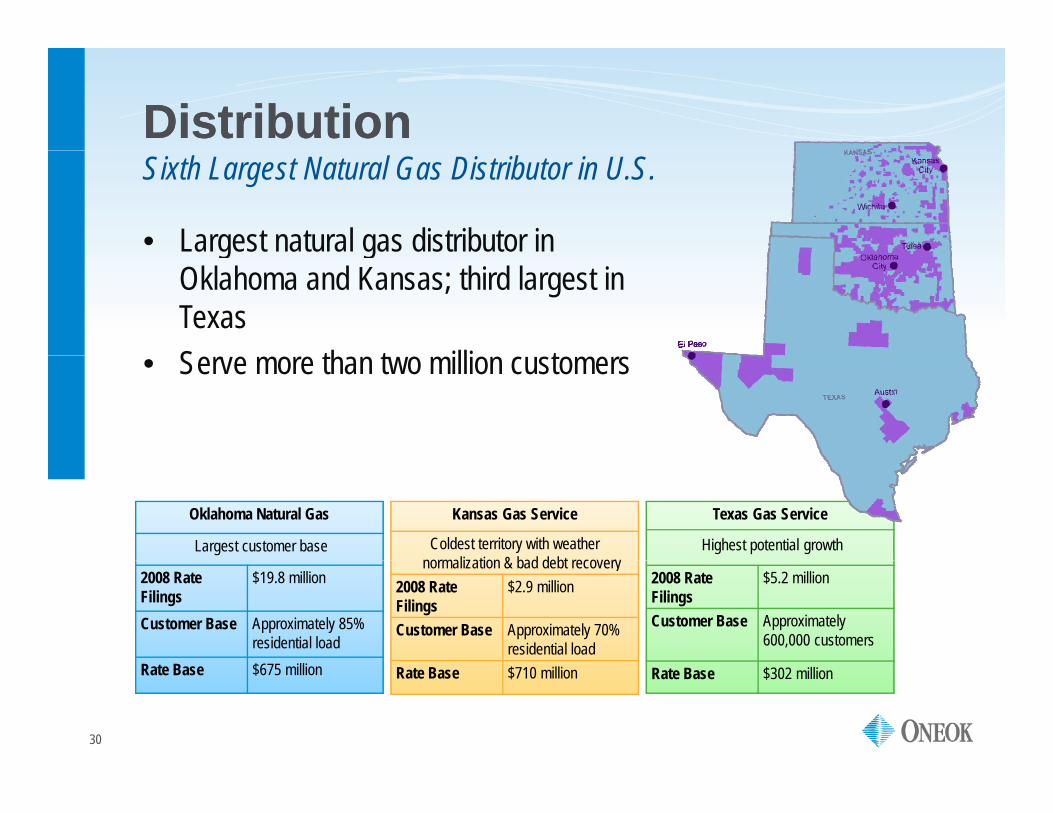
Sixth Largest Natural Gas Distributor in U.S.
g gOklahoma and Kansas; third largest in TexasS th t illi t• Serve more than two million customers
Texas Gas Service
Highest potential growth
Oklahoma Natural Gas
Largest customer base
Kansas Gas Service
Coldest territory with weather normalization & bad debt recovery
2008 Rate Filings
$5.2 million
Customer Base Approximately 600,000 customers
2008 Rate Filings
$19.8 million
Customer Base Approximately 85% residential load$
normalization & bad debt recovery2008 Rate Filings
$2.9 million
Customer Base Approximately 70% residential load
30
Rate Base $302 millionRate Base $675 million Rate Base $710 million
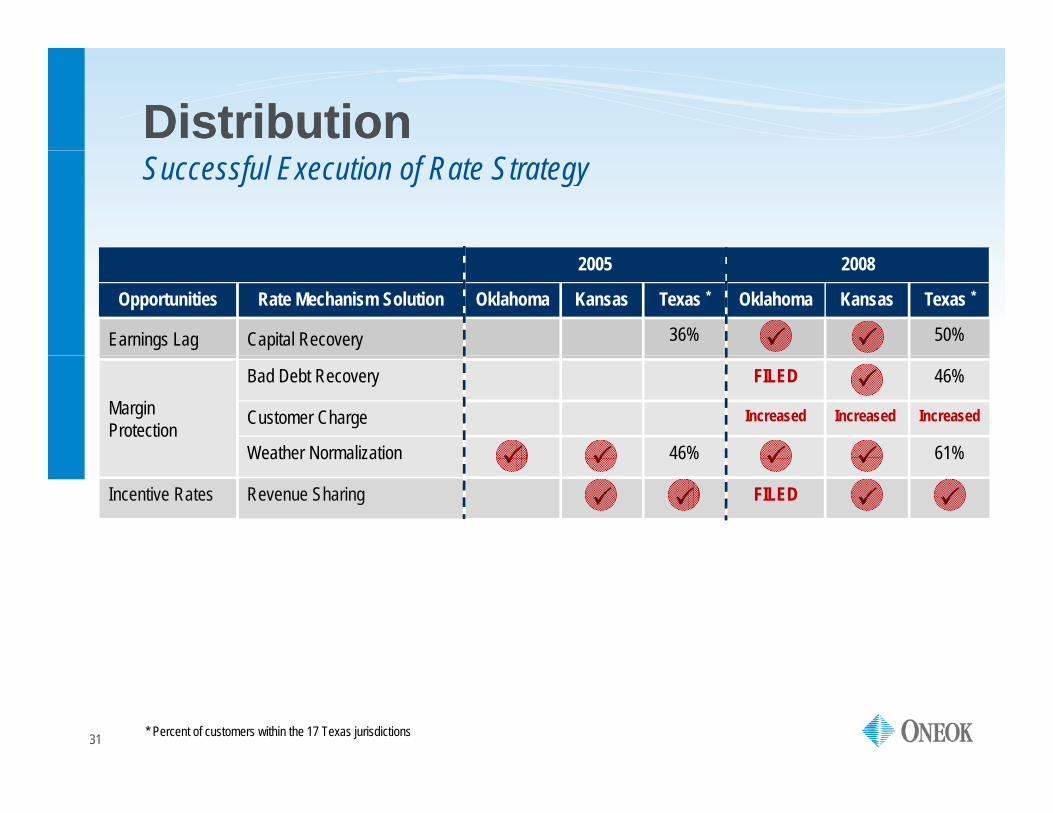
DistributionDistributionSuccessful Execution of Rate Strategy
2005
Opportunities Rate Mechanism Solution Oklahoma Kansas Texas *
Earnings Lag Capital Recovery 36%
2008
Oklahoma Kansas Texas *
50%
Margin Protection
Bad Debt Recovery
Customer Charge
Weather Normalization 46%
FILED 46%
Increased Increased Increased
61%Weather Normalization 46%
Incentive Rates Revenue Sharing
61%
FILED
31 * Percent of customers within the 17 Texas jurisdictions
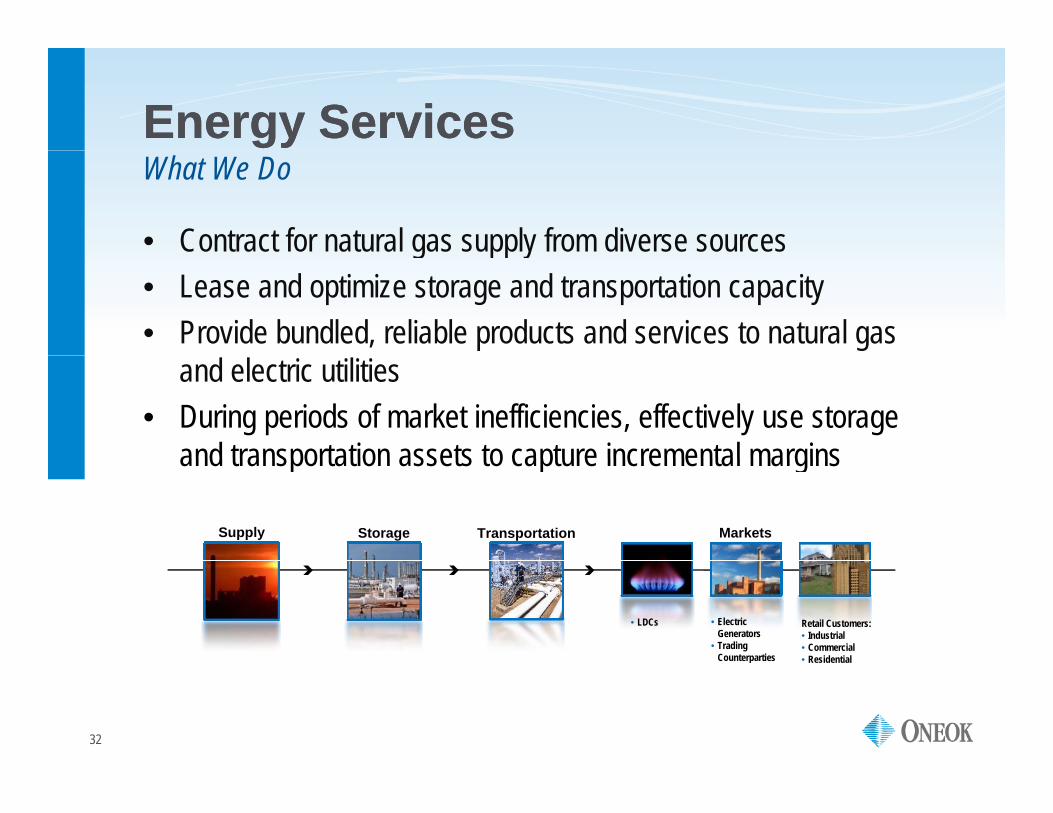
Energy ServicesEnergy Services
• Contract for natural gas supply from diverse sources
What We Do
g pp y• Lease and optimize storage and transportation capacity• Provide bundled, reliable products and services to natural gas
and electric utilities• During periods of market inefficiencies, effectively use storage
and transportation assets to capture incremental marginsand transportation assets to capture incremental margins
MarketsTransportationStorageSupply
• LDCs • Electric Generators
• Trading Counterparties
Retail Customers:• Industrial• Commercial• Residential
32
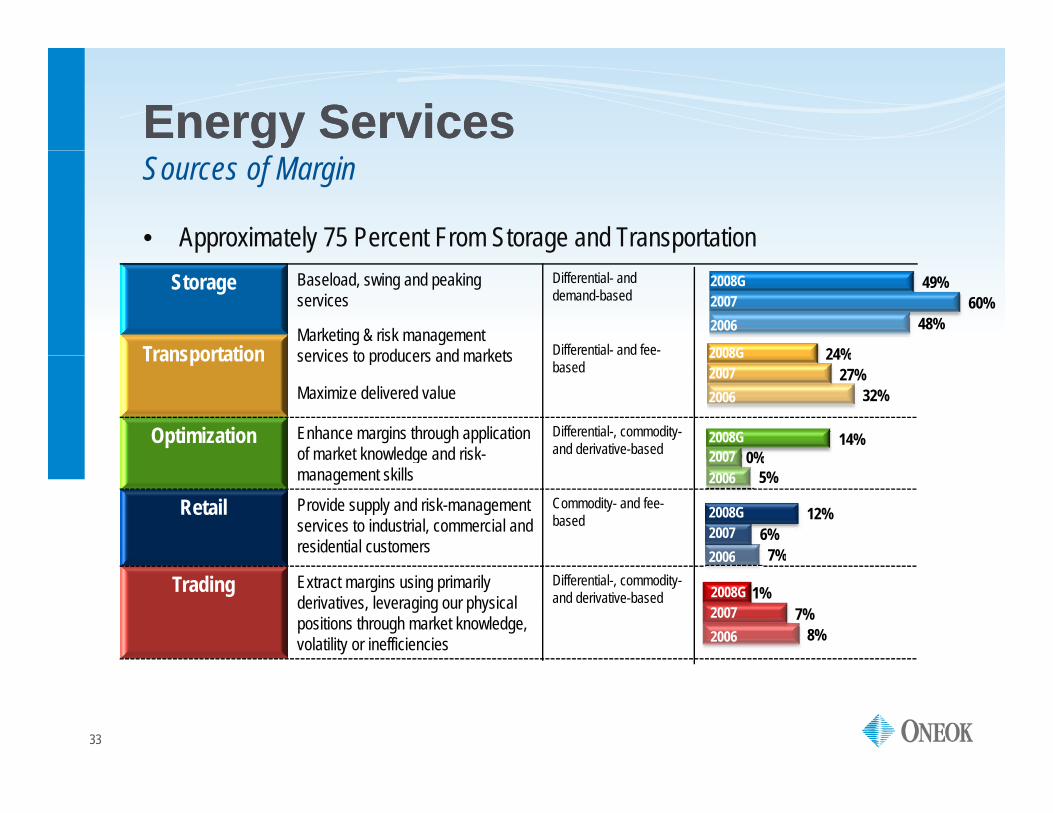
Energy ServicesEnergy Services
• Approximately 75 Percent From Storage and Transportation
Sources of Margin
Storage Baseload, swing and peakingservices
Differential- and demand-based
Transportation Differential- and fee-
48%60%
49%
24%
2008G20072006
2008GMarketing & risk management services to producers and marketsTransportationMaximize delivered value
based
Optimization Enhance margins through application of market knowledge and risk-
Differential-, commodity-and derivative-based 14%
32%27%
24%2008G20072006
2008G2007 0%
services to producers and markets
of market knowledge and riskmanagement skills
Retail Provide supply and risk-managementservices to industrial, commercial and residential customers
Commodity- and fee-based
5%
7%6%
12%
2006
2008G20072006
2007 0%
Trading Extract margins using primarily derivatives, leveraging our physical positions through market knowledge, volatility or inefficiencies
Differential-, commodity-and derivative-based
7%
8%7%
2006
20072006
2008G 1%
33

AppendixAppendix
ONEOK PartnersONEOK Partners
34
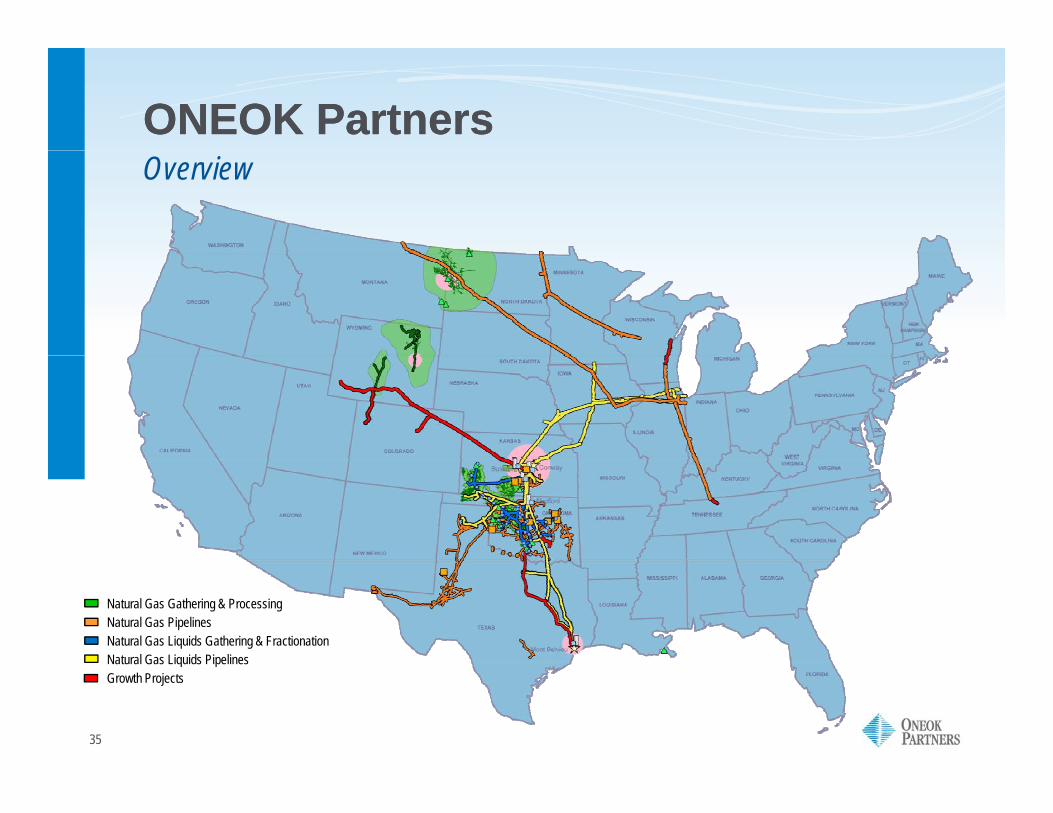
ONEOK PartnersONEOK PartnersOverview
Natural Gas Gathering & ProcessingNatural Gas PipelinesNatural Gas Liquids Gathering & FractionationNatural Gas Liquids Pipelines
35
Natural Gas Liquids PipelinesGrowth Projects

Earnings GrowthEarnings Growth
• Diverse asset base
Delivering Consistent Growth and Stable Earnings
provides significant fee-based income and stable earnings
$254 Operating Income*
Natural Gas
$653
stable earnings• Strategy execution
results in significant $253 $257
$396 $445
$130
Natural Gas Gathering & Processing
Natural Gas Pipelines
earnings growth– Particularly in NGL
Pipelines beginning
$253 $257 $214
NGL Gathering & Fractionation21% CAGR
pe es beg gin 2009 $57
2004 2005 2006 2007 2008G
NGL Pipelines
*Millions of dollars, excluding gain/loss on sale of assets
36

Stable Cash FlowStable Cash Flow
• Predominantly fee based
Financial Strength
y– Large growth projects increase
fee-based income• Commodity and spread risk 12% 13% 18%
Sources of Margin$1.2 Billion$896 Million$844 Million
• Commodity and spread risk is measured and managed within each segment
28% 27% 26%
18%
• Equity earnings are also primarily fee based– 2008 Guidance: $94 million
60% 60% 56%
– 2008 Guidance: $94 million
2006 2007 2008 GuidanceFee Commodity Spread
37
y p

Strong Balance SheetStrong Balance Sheet
• Disciplined approach to raising • Capital structure
Financial Discipline
p pp gcapital for growth
• Common unit offering in March 2008 generating net proceeds
p– Goal: 50/50 capitalization– Strong credit rating
• ONEOK interested in increasing 2008, generating net proceeds of $460 million
• Liquidity at October 31, 2008$396 illi h d h
• ONEOK interested in increasing ownership of ONEOK Partners
– $396 million cash and cash equivalents
– $130 million available under existing $1 billion revolver
Equity50%
Total Debt50%
existing $1 billion revolver
Capitalization
38
September 30, 2008
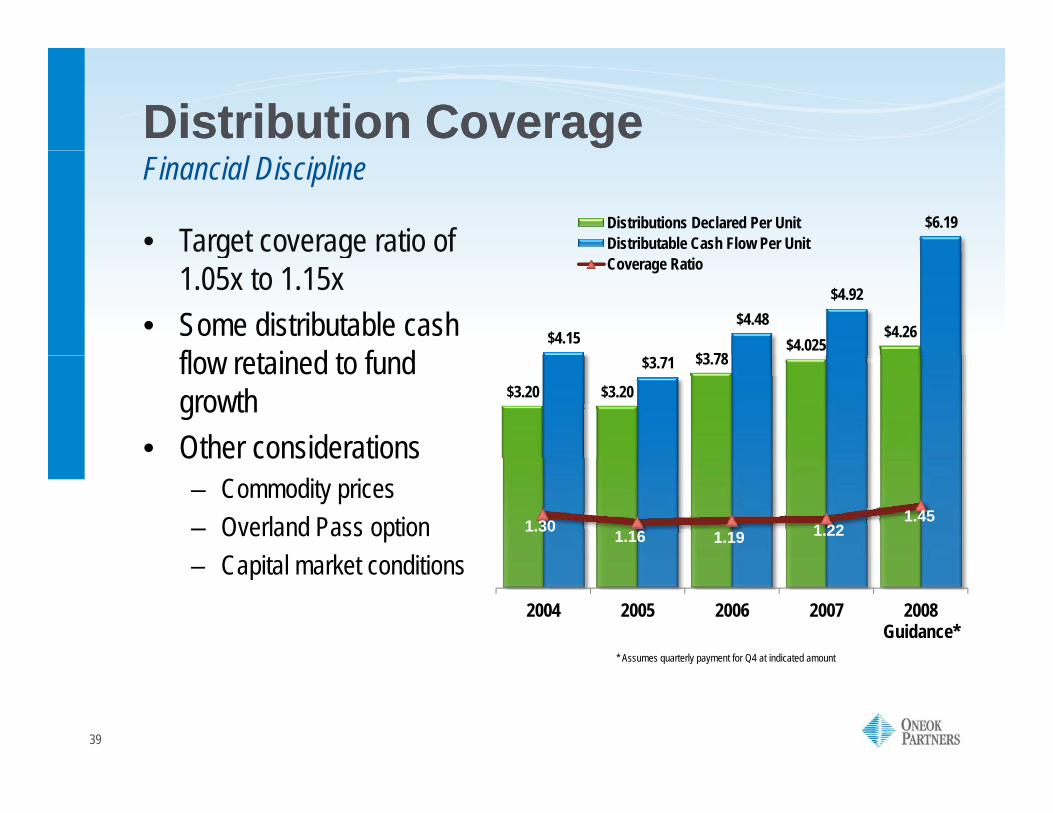
Distribution CoverageDistribution Coverage
$6.19 Distributions Declared Per UnitDistributable Cash Flow Per Unit• Target coverage ratio of
Financial Discipline
$3 78 $4.025
$4.26 $4.15 $4.48
$4.92
Coverage Ratiog g
1.05x to 1.15x• Some distributable cash
fl t i d t f d $3.20 $3.20
$3.78 $3.71 flow retained to fund growth
• Other considerations
1.30 1.16 1.19 1.221.45
Other considerations– Commodity prices– Overland Pass option
Capital market conditions2004 2005 2006 2007 2008
Guidance*
– Capital market conditions
* Assumes quarterly payment for Q4 at indicated amount
39
q y p y

Distribution GrowthDistribution Growth
• ONEOK as sole general
Creating Exceptional Value for Unitholders
gpartner– 11 consecutive distribution
increases $1 02 $1.04
$1.06 $1.08
Distributions Paid Per Unit
increases• Continued opportunities for
distribution growth$0 88
$0.95 $0.97 $0.98 $0.99 $1.00 $1.01
$1.025 $
$0.80
$0.88
11% CAGR
1Q06 3Q06 1Q07 3Q07 1Q08 3Q08
40

Value CreationValue Creation
• General partner with
Delivering Consistent Growth and Stable Earnings
T t l U ith ld R tpaligned interests
• Demonstrated financial di i li
$67.50120%
140%
$60
$70Unit Price Total Return
Total Unitholder Return
discipline • Visible growth profile
– $2 billion under way $42.10$45.75
$48.24$47.85 $47.92
$56.25
$59.46 $57.50
$50.73
80%
100%
120%
$40
$50
$60
79%$2 billion under way
– 2010–2015: $300 - $500 million per year
20%
40%
60%
$10
$20
$30
0%$01Q04 3Q04 1Q05 3Q05 1Q06 3Q06 1Q07 3Q07 1Q08 3Q08
ONEOK Partners Alerian MLP Index
*Unit prices are closing prices at last day of quarter
41

Natural GasNatural Gas
• Two segments
Diverse Asset BaseGrasslands Plant
Expansion Guardian II
– Natural Gas Gathering & Processing
– Natural Gas PipelinesFort Union Gas
Expansion
• Diverse supply basins, producers and contracts mitigate earnings volatility in
Fort Union Gas Gathering Expansion
gathering and processing• Earnings on pipelines are
predominantly fee basedMidwestern Extension
• More than $600 million of internal growth projects under way through 2009 Natural Gas Gathering Pipeline
GNatural Gas Processing Plant
G S
42
y gNatural Gas Interstate PipelineNatural Gas Intrastate PipelineNorthern Border Pipeline (50% interest)
Natural Gas StorageGrowth Projects

Natural Gas Gathering & ProcessingNatural Gas Gathering & Processing
GatheringM h 14 00 il f i li
Providing Non-discretionary Services to Producers
– More than 14,500 miles of pipeline– Approximately 9,000 meters– 1,060 MMcf/d* gathered
Williston
Compression– More than 625,000 Bhp Wind River Powder River
Treating– Removal of water and other
contaminants Kansas UpliftHugoton
Processing– 13 plants with 725 MMcf/d capacity– 555 MMcf/d* processed
Anadarko
43
555 MMcf/d processed*At third quarter 2008
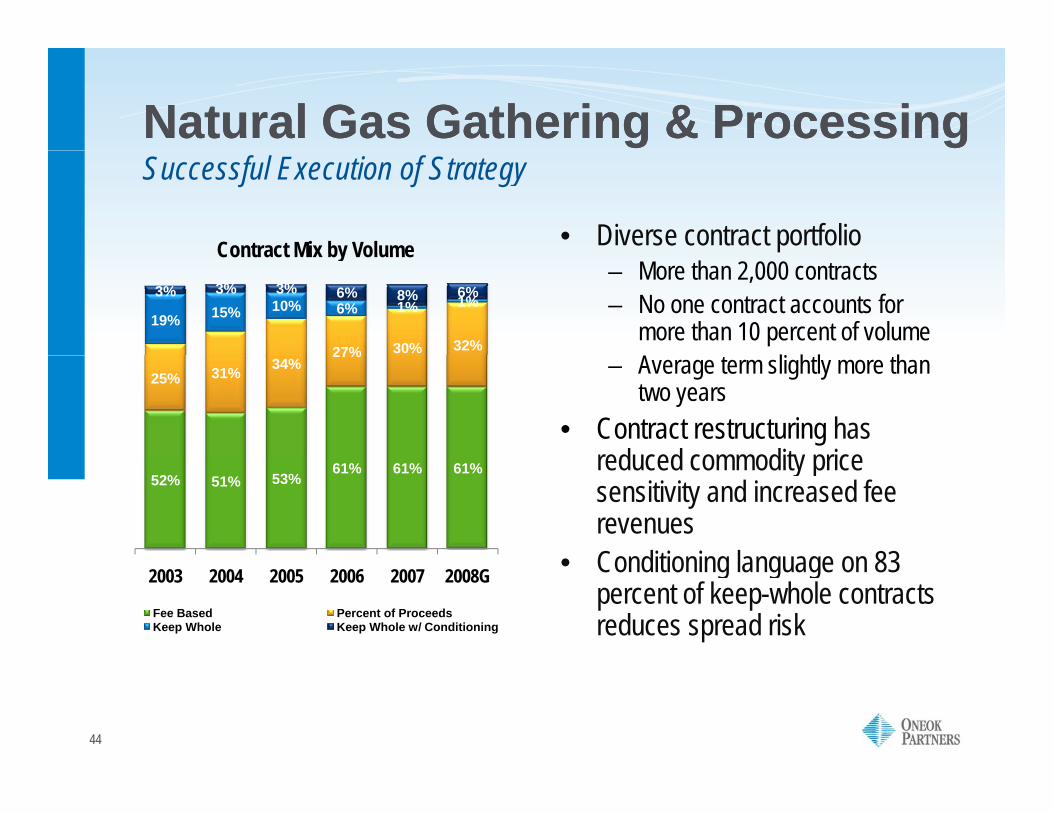
Natural Gas Gathering & ProcessingNatural Gas Gathering & Processing
• Diverse contract portfolio
Successful Execution of Strategy
Contract Mix by Volume– More than 2,000 contracts– No one contract accounts for
more than 10 percent of volume27% 30% 32%
19% 15% 10% 6% 1% 1%3% 3% 3% 6% 8% 6%
Contract Mix by Volume
– Average term slightly more than two years
• Contract restructuring has reduced commodity price
25% 31% 34%27%
reduced commodity price sensitivity and increased fee revenues
• Conditioning language on 83
52% 51% 53%61% 61% 61%
• Conditioning language on 83 percent of keep-whole contracts reduces spread risk
2003 2004 2005 2006 2007 2008G
Fee Based Percent of ProceedsKeep Whole Keep Whole w/ Conditioning
44

Natural Gas Gathering & ProcessingNatural Gas Gathering & Processing
• Contract portfolio
Risk Mitigation
Commodity Price Sensitivity*– Minimizes exposure to keep-whole
spread– NGL exposure diversified among
five individual products
$4.8 $4.5$3.8
y yMargin Impact ($ Millions)
p• Hedging strategy focuses on long
NGL, condensate and natural gas positions
-$0 1 $0.3 $0.4
$2.1$1.7 $1.5$1.1 $1.3 $1.0
$0.4$0.5
$0.9
– Target 75 percent of expected production
• Hedged position: -$3.5-$2.7
-$1.6
-$0.1
2003 2004 2005 2006 2007 2008
Commodity SensitivityNatural Gas Liquids 1 cent/gallon increase
Natural Gas 10 cent/MMBtu increase
Crude Oil $1/barrel increase2009
Fourth Quarter 2008
NGLs & Condensate 63% $1.37 / gallon
Natural Gas 56% $9.61 / MMBtu
45
Crude Oil $1/barrel increaseFull Year 2009:
NGLs & Condensate 21% $2.35 / gallon *Excludes effects of hedging
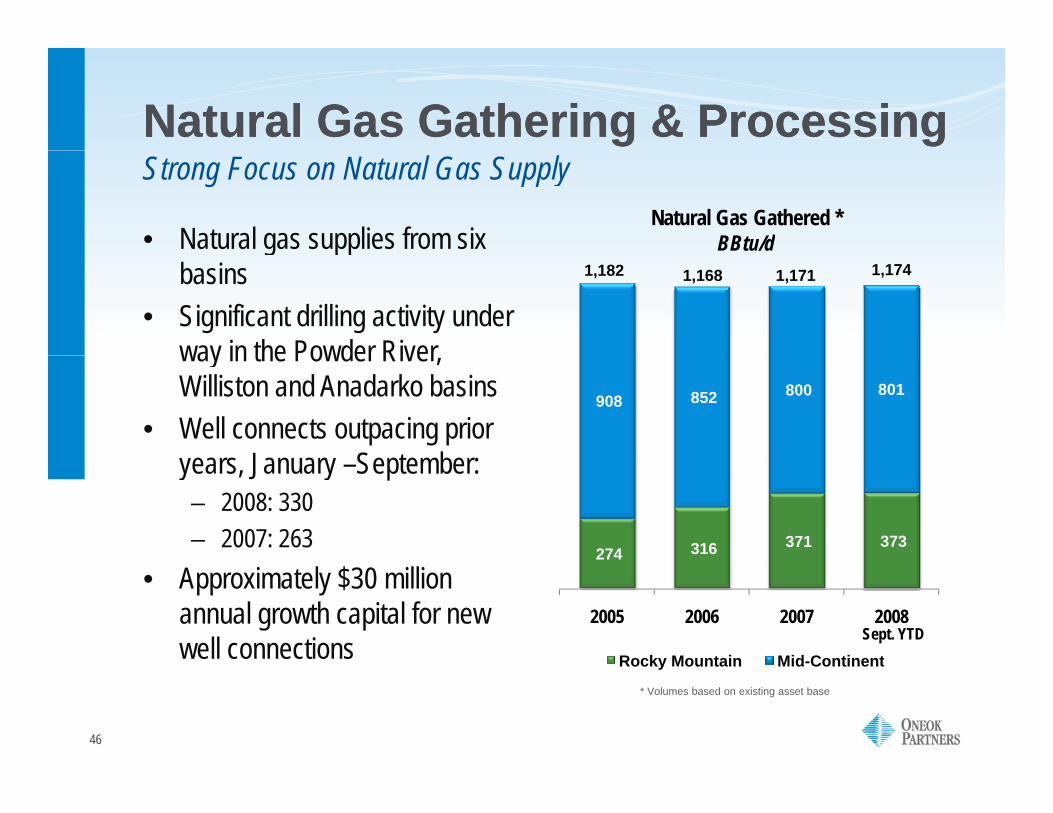
Natural Gas Gathering & ProcessingNatural Gas Gathering & Processing
Natural Gas Gathered * BBtu/d• Natural gas supplies from six
Strong Focus on Natural Gas Supply
g ppbasins
• Significant drilling activity under way in the Powder River
1,1711,1681,182 1,174
908 852 800 801
way in the Powder River, Williston and Anadarko basins
• Well connects outpacing prior J S t b
274 316 371 373
years, January –September:– 2008: 330– 2007: 263
2005 2006 2007 2008
Rocky Mountain Mid-Continent
• Approximately $30 million annual growth capital for new well connections Sept. YTD
46
Rocky Mountain Mid-Continent
* Volumes based on existing asset base
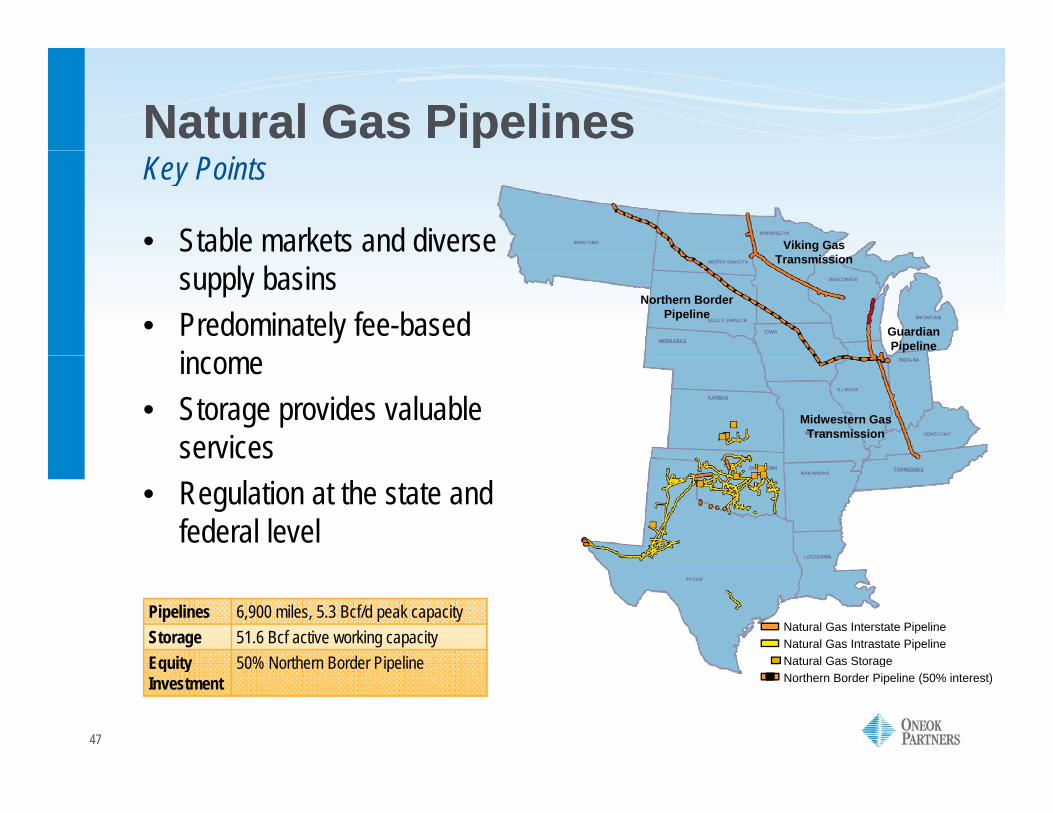
Natural Gas PipelinesNatural Gas Pipelines
• Stable markets and diverse
Key Points
Viking Gas
supply basins• Predominately fee-based
iGuardian Pipeline
Northern Border Pipeline
Transmission
income• Storage provides valuable
servicesMidwestern Gas
Transmissionservices• Regulation at the state and
federal level
Pipelines 6,900 miles, 5.3 Bcf/d peak capacityStorage 51.6 Bcf active working capacityEquity 50% Northern Border Pipeline
Natural Gas Interstate PipelineNatural Gas Intrastate PipelineNatural Gas Storage
47
Equity Investment
50% Northern Border Pipeline Natural Gas Storage Northern Border Pipeline (50% interest)
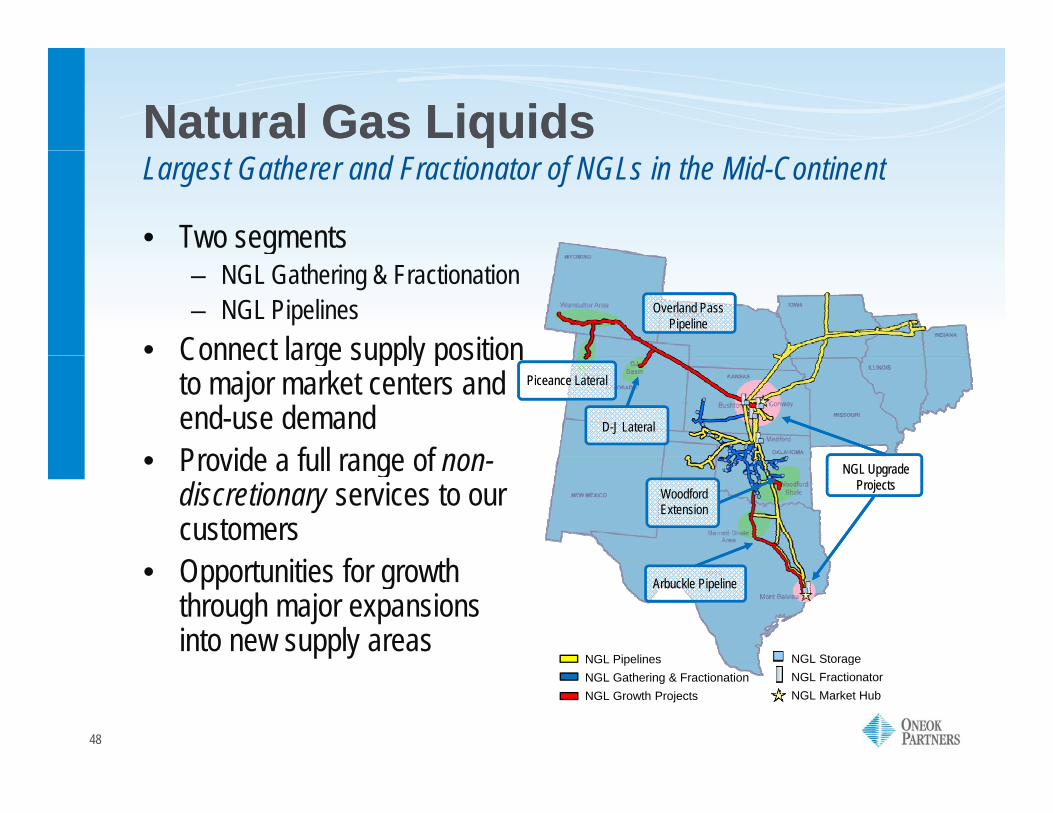
Natural Gas LiquidsNatural Gas Liquids
• Two segments
Largest Gatherer and Fractionator of NGLs in the Mid-Continent
g– NGL Gathering & Fractionation– NGL Pipelines
• Connect large supply position Overland Pass
Pipeline Overland Pass
Pipeline
Connect large supply position to major market centers and end-use demand
• Provide a full range of non
Piceance LateralPiceance Lateral
D-J Lateral
• Provide a full range of non-discretionary services to our customersO t iti f th
NGL Upgrade Projects
NGL Upgrade Projects Woodford
Extension
• Opportunities for growth through major expansions into new supply areas
NGL Pipelines NGL Storage
Arbuckle PipelineArbuckle Pipeline
48
NGL PipelinesNGL Gathering & FractionationNGL Growth Projects
gNGL FractionatorNGL Market Hub

NGL Gathering and FractionationNGL Gathering and Fractionation
GatheringM th 2 500 il f i li
Providing Non-discretionary Services to Customers
– More than 2,500 miles of pipeline– Access to 82 natural gas processing
plants, more than 90 percent of the Mid-Continent region’s plants
Fractionation– Approximately 550,000 Bpd (net)
capacity– Isomerization 9,000 Bpd capacity
Storage– Underground caverns with capacity
f 24 6 illi b lof 24.6 million barrels
Marketing– NGL products to end-users
NGL Market HubNGL FractionatorNGL StorageNGL G th i Pi li
49
NGL Gathering PipelineNGL Growth Projects

NGL Gathering & FractionationNGL Gathering & Fractionation
S f M i
Fee-based Earnings with Optimization Opportunities
Sources of Margin
Exchange & Storage Services
Gather, fractionate, transport and store NGLs and deliver to market hubs
Fee-based
78%73%
70%2008G
20062007
Marketing Purchase for resaleapproximately one-half of system supply in the Mid-Continent on an index-related basis
Differential-based
8%13%
6%2008G20072006
Optimization Obtain highest product price by directing product movement between market hubs
Differential-based
Isomerization Convert normal butane to Differential- and
5%8%
21%
3%
2008G20072006
2008GIsomerization Convert normal butane to isobutane
Differential- and fee-based
9%6%
3%20072006
2008G
50
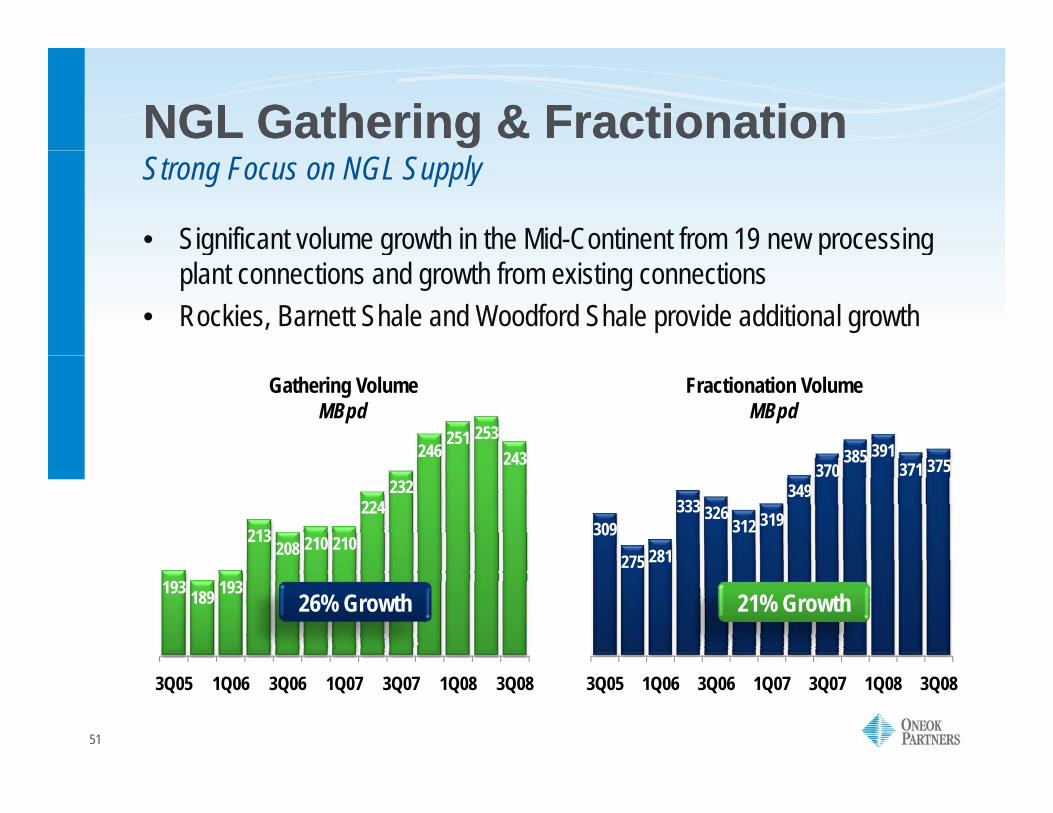
NGL Gathering & FractionationNGL Gathering & Fractionation
• Significant volume growth in the Mid-Continent from 19 new processing
Strong Focus on NGL Supply
g g p gplant connections and growth from existing connections
• Rockies, Barnett Shale and Woodford Shale provide additional growth
246251 253
243 385 391
Gathering VolumeMBpd
Fractionation VolumeMBpd
213208 210 210
224232
243
309
275 281
333 326312 319
349370
385371 375
193 189 193275 281
26% Growth 21% Growth
51
3Q05 1Q06 3Q06 1Q07 3Q07 1Q08 3Q08 3Q05 1Q06 3Q06 1Q07 3Q07 1Q08 3Q08

NGL PipelinesNGL Pipelines
• Links key NGL market
Key Points
ycenters at Conway, Kansas and Mont Belvieu, TexasN th S t t Mid
,
• North System connects Mid-Continent to upper Midwest refiners
• Developing links to the Rockies and Barnett Shale
NGL Distribution PipelineNGL Gathering PipelineGrowth ProjectsNGL Market HubNGL Fractionator
Distribution 3,350 miles of pipe with 434,000 Bpd capacity
Gathering 720 miles of pipe with 93,000 Bpd
NGL Storage
52
Gathering 720 miles of pipe with 93,000 Bpd capacity
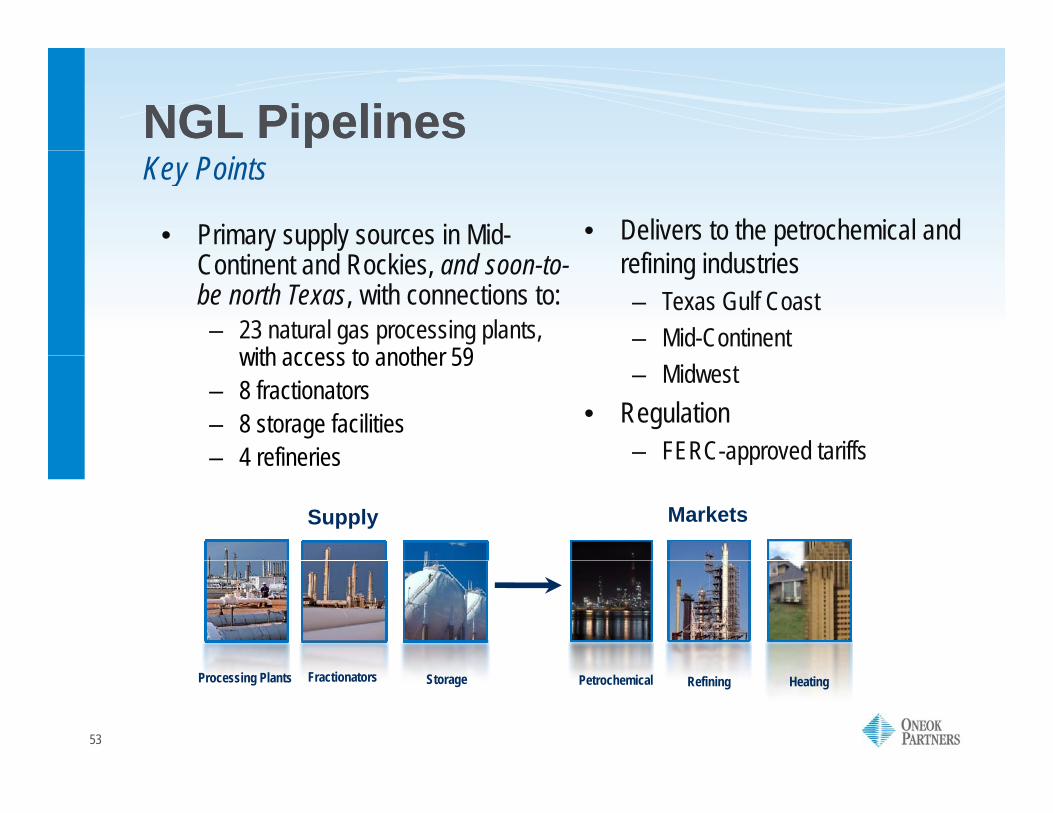
NGL PipelinesNGL Pipelines
• Delivers to the petrochemical and f
• Primary supply sources in Mid-
Key Points
refining industries– Texas Gulf Coast– Mid-Continent
Continent and Rockies, and soon-to-be north Texas, with connections to:– 23 natural gas processing plants,
with access to another 59– Midwest
• Regulation– FERC-approved tariffs
with access to another 59– 8 fractionators – 8 storage facilities
4 refineries FERC approved tariffs– 4 refineries
MarketsSupply
53
Petrochemical HeatingRefiningProcessing Plants Fractionators Storage

NGL Pipelines NGL Pipelines –– North SystemNorth SystemStrategic Acquisition Creating Value
• Extends distribution network into upper Midwest
• Connects to Mid-Continent supply and Bushton storagesupply and Bushton storage– Seasonal refinery-grade
butane and propane• Opportunities for growthOpportunities for growth
– Diluent and denaturant– Propylene
Adds refined petroleum
North SystemNGL Distribution PipelineNGL Gathering PipelineGrowth ProjectsNGL Market HubNGL Fractionator• Adds refined petroleum
products to value chainDistribution 1,630 miles of pipe
NGL FractionatorNGL Storage
54
Capacity for Purity & Refined Products
134,000 Bpd of transport978,000 Bbl of storage
AppendixAppendix
ONEOK PartnersONEOK Partners -- Growth ProjectsGrowth ProjectsONEOK Partners ONEOK Partners -- Growth ProjectsGrowth Projects
55

Capital ExpendituresCapital ExpendituresComplements Existing Infrastructure and Core Operating Capabilities
Current Growth Program, 2007-2009• $2 billion of internally generated
projects and routine growth• EBITDA* generated
$1,230
Growth Capital Expendituresg ,
EBITDA generated – Primarily fee based– 2009: $250 million
2010 $360 illi
$878
n M
illio
ns
$650$300-$500
$950 spent through Oct.-08
– 2010: $360 million
• $300 - $500 million of growth $188 $352
$132
$462 $233
$ In
$365 per year
Looking Forward, 2010-2015
projects per year– Two-thirds in Natural Gas
Liquids
2007 2008 2009 2010-2015
Natural Gas Liquids Natural Gas
56
q* EBITDA contributions assume projects are completed on schedule* Does not include WMB exercising its 50/50 option in OPPL, Piceance Lateral or D-J Lateral
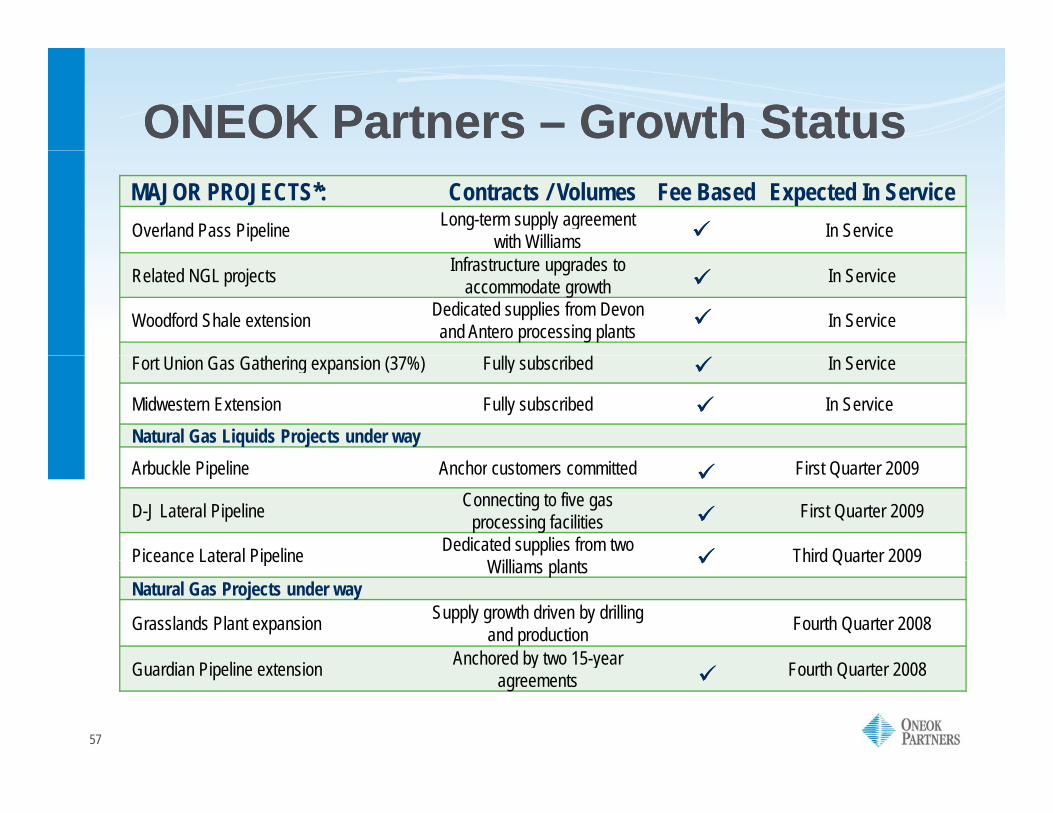
ONEOK Partners ONEOK Partners –– Growth StatusGrowth StatusMAJOR PROJECTS*: Contracts / Volumes Fee Based Expected In ServiceOverland Pass Pipeline Long-term supply agreement
with Williams In Service
Related NGL projects Infrastructure upgrades to accommodate growth In Service
Woodford Shale extension Dedicated supplies from Devonand Antero processing plants In Service
Fort Union Gas Gathering expansion (37%) Fully subscribed In Service
Midwestern Extension Fully subscribed In ServiceNatural Gas Liquids Projects under wayArbuckle Pipeline Anchor customers committed First Quarter 2009
D-J Lateral Pipeline Connecting to five gas processing facilities First Quarter 2009
Piceance Lateral Pipeline Dedicated supplies from two Willi l t Third Quarter 2009Piceance Lateral Pipeline Williams plants Third Quarter 2009
Natural Gas Projects under way
Grasslands Plant expansion Supply growth driven by drilling and production Fourth Quarter 2008
G di Pi li t i Anchored by two 15-year F th Q t 2008
57
Guardian Pipeline extension Anchored by two 15 year agreements Fourth Quarter 2008
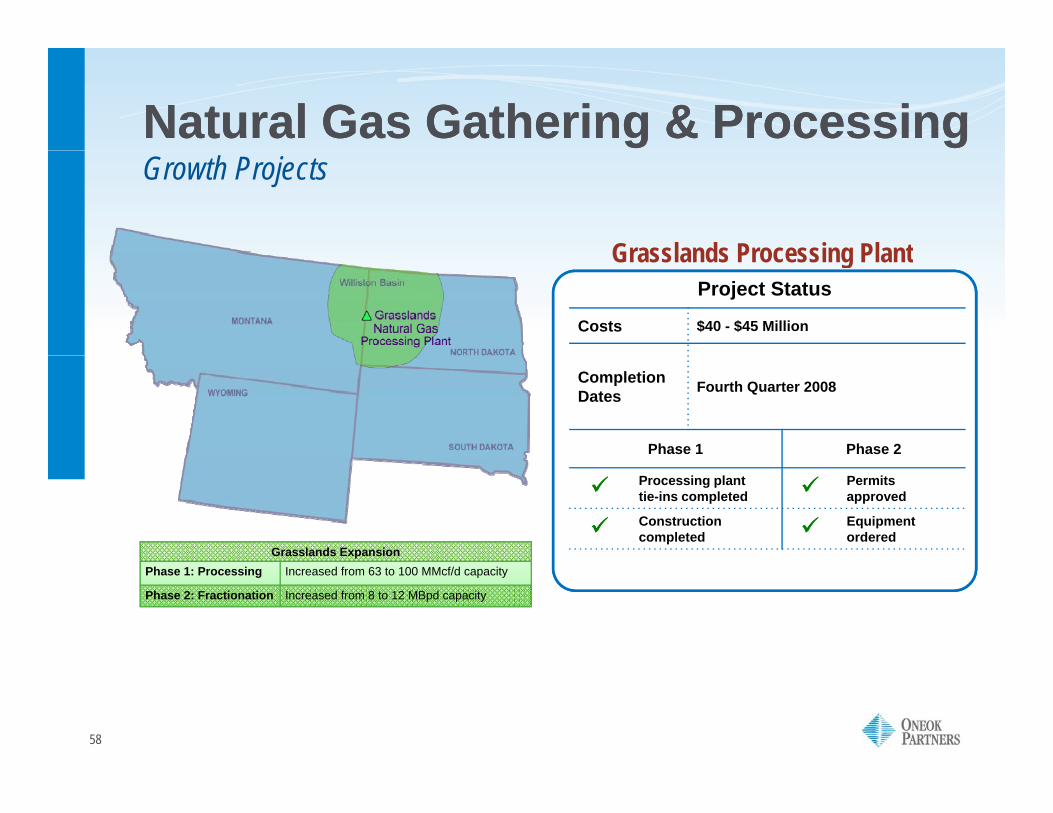
Natural Gas Gathering & ProcessingNatural Gas Gathering & Processing
Grasslands Processing Plant
Growth Projects
Grasslands Processing PlantProject Status
Costs $40 - $45 Million
Completion Dates Fourth Quarter 2008
Phase 1 Phase 2
Grasslands Expansion
Processing plant tie-ins completed
Permits approved
Construction completed
Equipment ordered
Phase 1: Processing Increased from 63 to 100 MMcf/d capacity
Phase 2: Fractionation Increased from 8 to 12 MBpd capacity
58

Natural Gas Gathering & ProcessingNatural Gas Gathering & ProcessingGrowth Projects
Fort Union Gas GatheringP j t St tProject Status
Costs $120 - $130 Million (Project Financed)
Completion Dates In ServiceDates
Phase 1 Phase 2
Customerscommitted *
Customerscommitted *
Constructioncomplete
Constructioncomplete
In service 11/07 In service 7/08
ONEOK Partners GatheringFort Union (37%)Lost Creek (35%)Big Horn (49%)
• Backed by volume commitments *• Doubled capacity
Fort Union Gas GatheringPhase 1: Adds 44 miles of pipe and 200 MMcf/d capacity
Phase 2: Adds 104 miles of pipe and 450 MMcf/d capacity
59
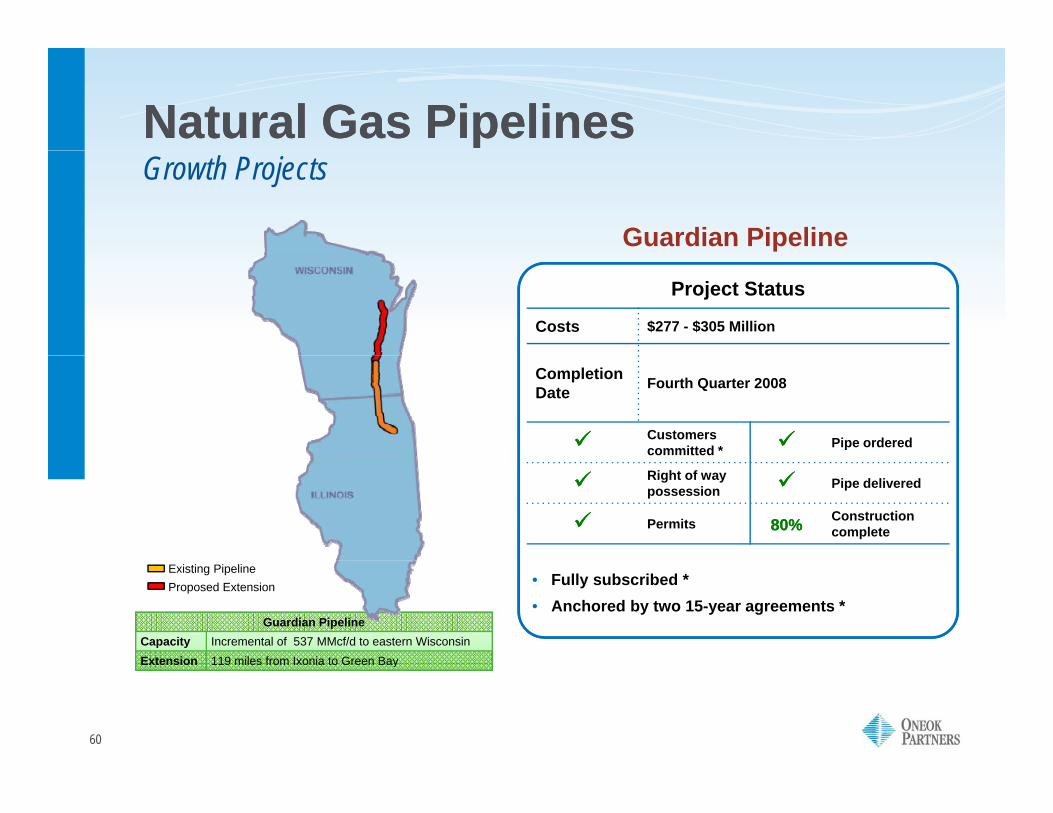
Natural Gas PipelinesNatural Gas Pipelines
Guardian Pipeline
Growth Projects
Project Status
Costs $277 - $305 Million
Completion Date Fourth Quarter 2008
Customerscommitted * Pipe ordered
Right of way possession Pipe delivered
Permits 80%80% Constructioncomplete
• Fully subscribed *• Anchored by two 15-year agreements *
Guardian PipelineCapacity Incremental of 537 MMcf/d to eastern WisconsinExtension 119 miles from Ixonia to Green Bay
Existing PipelineProposed Extension
60
Extension 119 miles from Ixonia to Green Bay
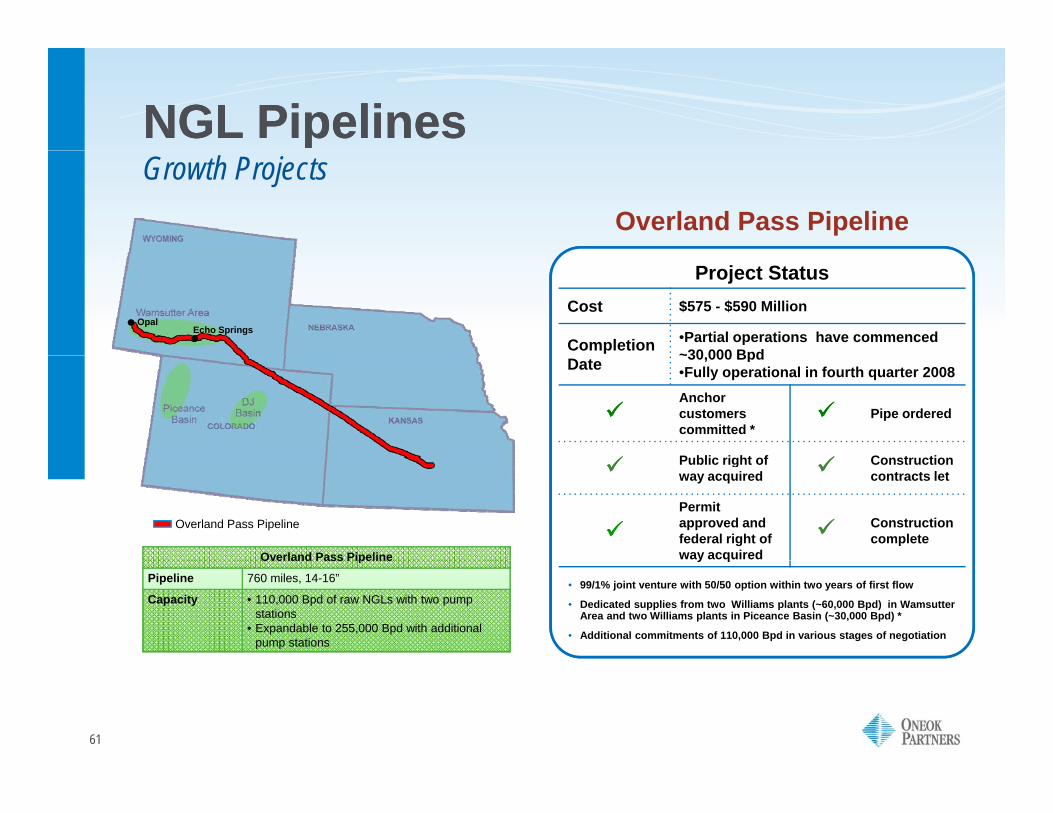
NGL PipelinesNGL PipelinesGrowth Projects
Overland Pass Pipeline
Project StatusCost $575 - $590 Million
Completion •Partial operations have commenced ~30 000 Bpd
OpalEcho Springs
Date ~30,000 Bpd•Fully operational in fourth quarter 2008Anchor customers committed *
Pipe ordered
Public right of Construction
Overland Pass Pipeline
Overland Pass Pipeline
Public right of way acquired
Constructioncontracts let
Permit approved and federal right of way acquired
Construction complete
Overland Pass Pipeline
Pipeline 760 miles, 14-16”
Capacity • 110,000 Bpd of raw NGLs with two pump stations
• Expandable to 255,000 Bpd with additional pump stations
• 99/1% joint venture with 50/50 option within two years of first flow
• Dedicated supplies from two Williams plants (~60,000 Bpd) in WamsutterArea and two Williams plants in Piceance Basin (~30,000 Bpd) *
• Additional commitments of 110,000 Bpd in various stages of negotiation
y q
61
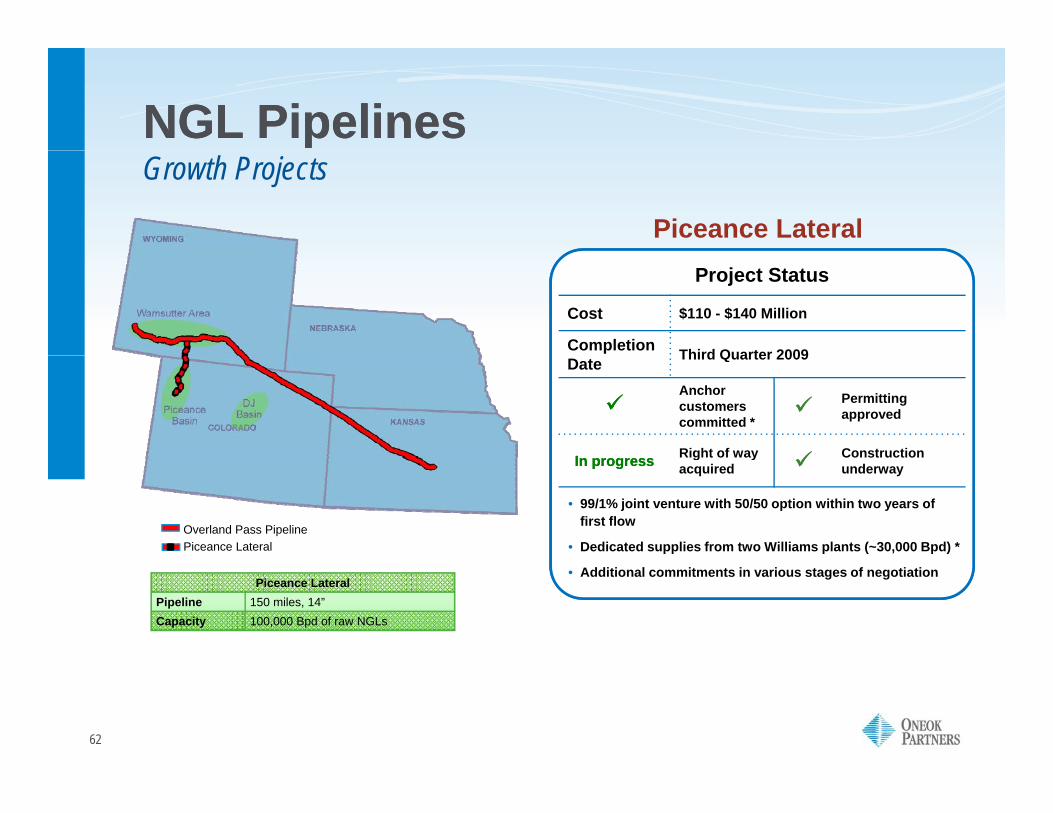
NGL PipelinesNGL PipelinesGrowth Projects
Piceance Lateral
Cost $110 - $140 Million
Completion Third Quarter 2009
Project Status
Date Third Quarter 2009
Anchor customers committed *
Permitting approved
II Right of way ConstructionIn progress In progress g yacquired underway
• 99/1% joint venture with 50/50 option within two years of first flow
• Dedicated supplies from two Williams plants (~30,000 Bpd) *Overland Pass PipelinePiceance Lateral
Piceance LateralPipeline 150 miles, 14”Capacity 100,000 Bpd of raw NGLs
• Additional commitments in various stages of negotiation
62
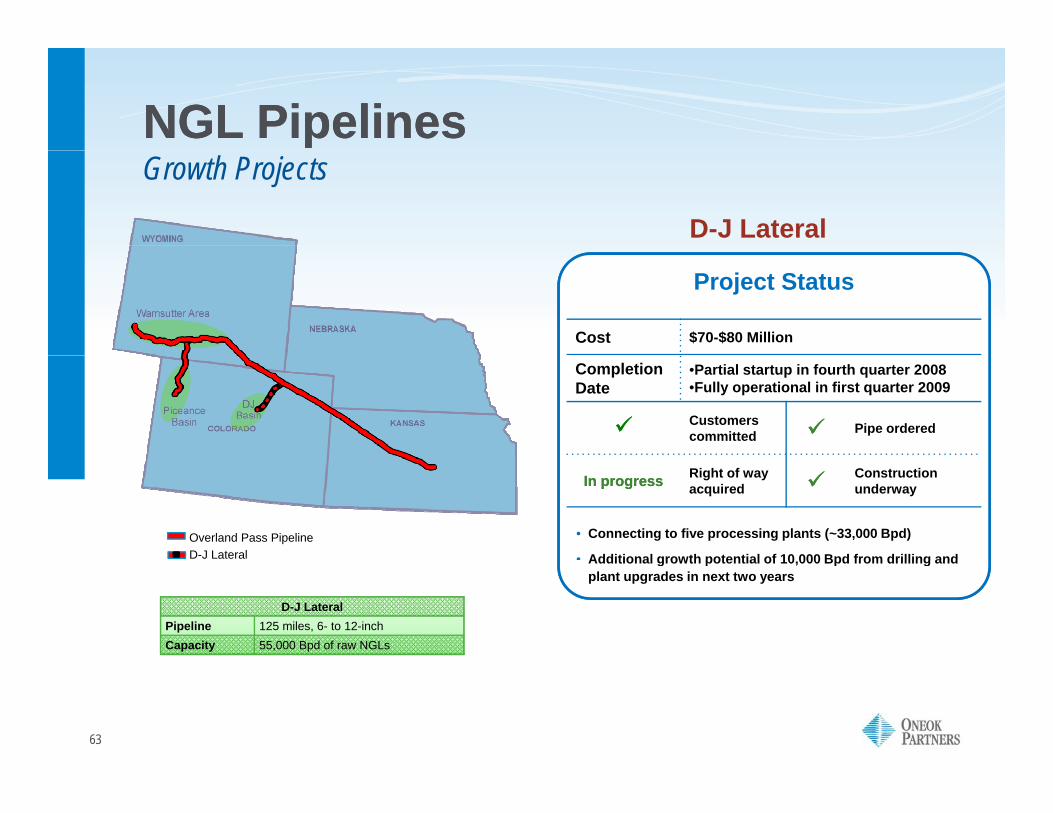
NGL PipelinesNGL PipelinesGrowth Projects
D-J Lateral
Cost $70-$80 Million
Project Status
Completion Date
•Partial startup in fourth quarter 2008•Fully operational in first quarter 2009
Customers committed Pipe ordered
In progress In progress Right of way acquired
Constructionunderway
• Connecting to five processing plants (~33,000 Bpd)
• Additional growth potential of 10 000 Bpd from drilling andOverland Pass PipelineD-J Lateral
D-J LateralPipeline 125 miles, 6- to 12-inchCapacity 55,000 Bpd of raw NGLs
Additional growth potential of 10,000 Bpd from drilling and plant upgrades in next two years
63

Natural Gas LiquidsNatural Gas LiquidsGrowth Projects
Infrastructure Upgrades
Cost $230 - $240 Million
Project Status
Infrastructure Upgrades
Bushton Fractionator
Expand facility from 80,000 to 150,000 BpdPhase I - complete
• Phase II – fourth quarter 2008
Bushton StorageUpgrade facility to accommodate additionalethane/propane mix
Construction complete
Bushton-to-Medford Pipeline
Construct 135-mile pipeline with a capacity of 120,000 Bpd of ethane/propane mix
Construction complete
Sterling Expansion Expand pipeline by 60,000 BpdConstruction completeg p Construction complete
Bushton-to-Conway Expansion
Expand pipeline by 14,000 BpdConstruction complete
NGL Gathering & FractionationNGL PipelinesNGL Storage
64
NGL FractionatorNGL Market Hub
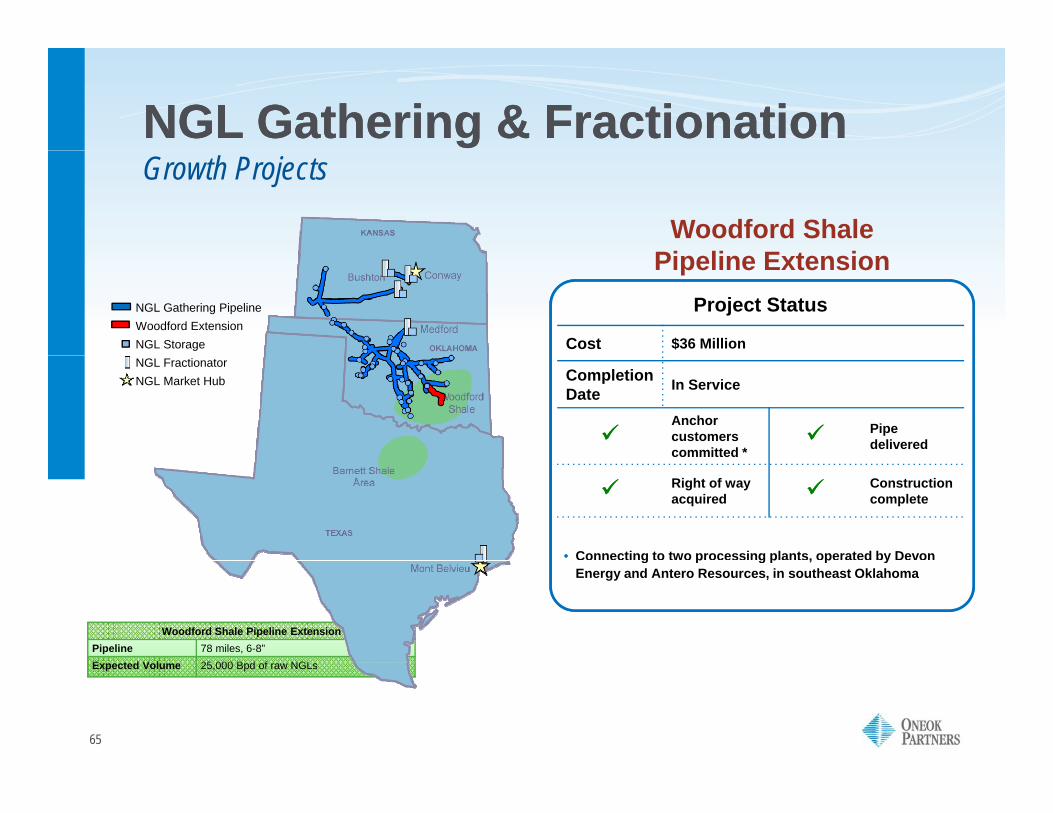
NGL Gathering & FractionationNGL Gathering & FractionationGrowth Projects
Woodford Shale Pi li E t i
Cost $36 Million
Project Status
Pipeline ExtensionNGL Gathering PipelineWoodford Extension NGL Storage
Completion Date In Service
Anchor customers committed *
Pipe delivered
NGL FractionatorNGL Market Hub
Right of way acquired
Construction complete
• Connecting to two processing plants, operated by Devon g p g p , p yEnergy and Antero Resources, in southeast Oklahoma
Woodford Shale Pipeline ExtensionPipeline 78 miles, 6-8”E t d V l 25 000 B d f NGL
65
Expected Volume 25,000 Bpd of raw NGLs
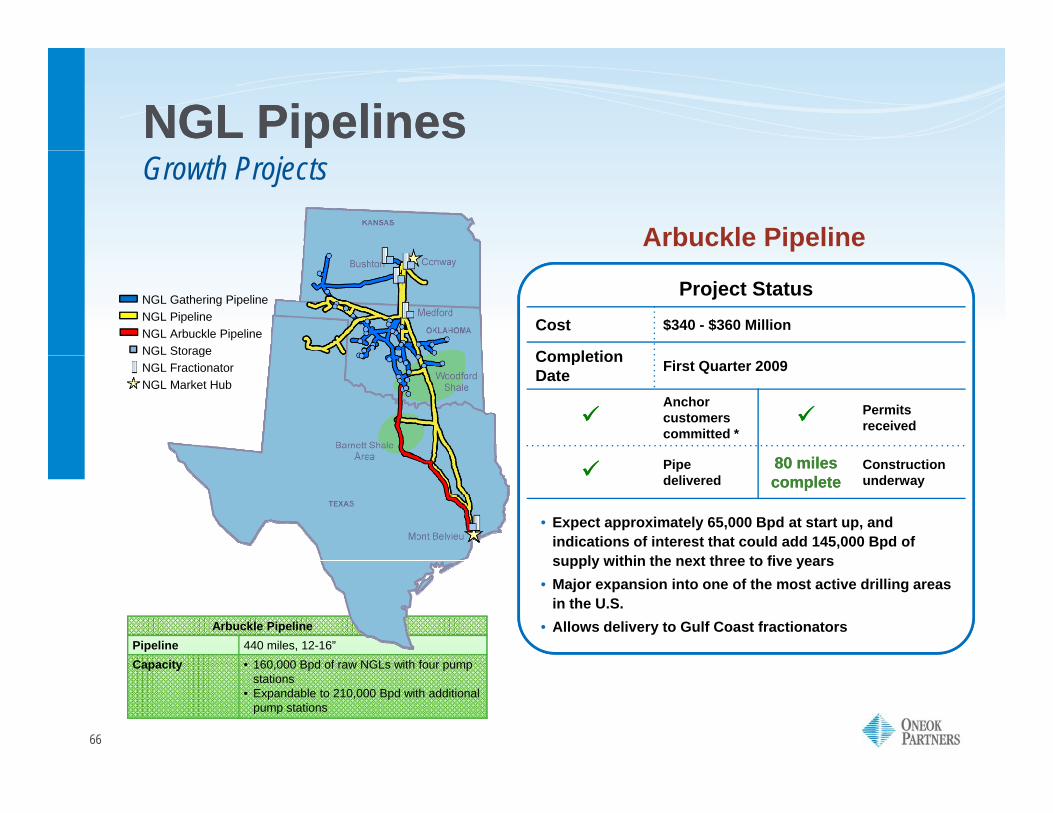
NGL PipelinesNGL PipelinesGrowth Projects
Arbuckle Pipeline
Cost $340 - $360 Million
Completion
Project StatusNGL Gathering PipelineNGL PipelineNGL Arbuckle PipelineNGL Storage Completion
Date First Quarter 2009
Anchor customers committed *
Permitsreceived
80 il80 il
gNGL FractionatorNGL Market Hub
Pipe delivered
80 miles 80 miles completecomplete
Constructionunderway
• Expect approximately 65,000 Bpd at start up, and indications of interest that could add 145,000 Bpd of supply within the next three to five yearssupply within the next three to five years
• Major expansion into one of the most active drilling areas in the U.S.
• Allows delivery to Gulf Coast fractionatorsArbuckle PipelinePipeline 440 miles, 12-16”Capacity • 160 000 Bpd of raw NGLs with four pump
66
Capacity • 160,000 Bpd of raw NGLs with four pump stations
• Expandable to 210,000 Bpd with additional pump stations