SECOND QUARTER 2017 PRESENTATION -...
20
SECOND QUARTER 2017 PRESENTATION
Transcript of SECOND QUARTER 2017 PRESENTATION -...

SECOND QUARTER 2017 PRESENTATION

SAFE HARBOR
Statements contained in this presentation that are not historical and reflect our views about future periods and events, including our future performance, constitute
“forward-looking statements” within the meaning of the Private Securities Litigation Reform Act of 1995. Forward-looking statements can be identified by words
such as “will,” “would,” “anticipate,” “expect,” “believe,” “plan,” “hope,” “estimates,” “suggests,” “has the potential to,” “projects,” “assumes,” “goal,” “targets,”
“likely,” “should” or “intend,” and other words and phrases of similar meanings, the negative of these terms, and similar references to anticipated or expected
events, activities, trends, future periods or results. Forward-looking statements are based on management’s current expectations and are subject to risks and
uncertainties that are difficult to predict and, accordingly, our actual results may differ materially from the results discussed or implied in our forward-looking
statements. Forward-looking statements are subject to a number of risks, uncertainties, and assumptions, including: our reliance on residential new construction,
residential repair/remodel, and commercial construction; our reliance on third-party suppliers and manufacturers; our ability to attract, develop and retain talented
personnel and our sales and labor force; our ability to maintain consistent practices across our locations; our ability to maintain our competitive position; our ability
to integrate acquisitions; changes in the costs of the products we install and/or distribute; increases in fuel costs; significant competition in our industry; seasonal
effects on our business; and the other risks described under the caption entitled “Risk Factors” in our most recent Annual Report on Form 10-K filed with the SEC
and under similar headings in our subsequently filed Quarterly Reports on Forms 10-Q and other filings with the SEC. Our forward-looking statements in this
presentation speak only as of the date of this presentation. Factors or events that could cause our actual results to differ may emerge from time to time, and it is not
possible for us to predict all of them. Unless required by law, we undertake no obligation to update publicly any forward-looking statements as a result of new
information, future events, or otherwise. The Company believes that the non-GAAP performance measures and ratios that are contained herein, which management
uses to manage our business, provide users of this financial information with additional meaningful comparisons between current results and results in our prior
periods. Non-GAAP performance measures and ratios should be viewed in addition, and not as an alternative, to the Company's reported results under accounting
principles generally accepted in the United States. Additional information about the Company is contained in the Company's filings with the SEC and is available on
TopBuild's website at www.topbuild.com.
2

SECOND QUARTER 2017 HIGHLIGHTS
» 9.9% revenue growth
» 250 bps adjusted operating margin expansion to 8.9%
» 48.1% increase in adjusted EBITDA
» 36.5% incremental EBITDA margin
» 55.8% increase in adjusted EPS
» Total liquidity of $395.2 million
3

KEY INITIATIVES DRIVING RESULTS
» Grow core residential insulation business
» Convert top-line growth to the bottom line
» Expand commercial business
» Acquire strategic partners to expand market share
» Return capital not required for internal growth and acquisitions to
our shareholders
4

ONE COMPANY LEVERAGING TWO
LEADING CHANNELS…
5
DistributionDistribute products to a variety
of customers
Access to
50K+Builders and General Contractors
Small Contractors,
Lumber Yards,
RetailScale Advantage
Building science expertise
InstallationProvide contractor services to
builders and general contractors

Jerry VolasChief Executive Officer
Steve RaiaSVP, Operations
Sean CusackPresident, Service Partners
Robert BuckPresident, COO
Dave ProcidaVP, Commercial Bus. Dev.
Bill ChristieVP, Business Development
John PetersonChief Financial Officer
Bob ManroeSVP, Operations
David CushenSVP, M&A
Key Presenters
Contact Tabitha Zane, VP Investor Relations, for details
386-763-8801, [email protected]
INVESTOR DAYTUESDAY, OCTOBER 3, 2017MIDTOWN, NYC
6

($ in 000s)Second Quarter
2017
Second Quarter
2016
SalesY-O-Y Change
$474,4589.9%
$431,589
Adjusted Operating Profit *Y-O-Y Change
$42,19953.8%
$27,437
Adjusted Operating Margin * Y-O-Y Change
8.9%250 bps
6.4%
Adjusted EBITDA *Y-O-Y Change
$48,20748.1%
$32,555
* See Slides 19 & 20 for adjusted EBITDA reconciliation and GAAP to non-GAAP reconciliation
Highlights
• Sales up 9.9%
• Gross margin expands 200 bps to 24.6%
• Adjusted EBITDA improves $15.7 million and adjusted margin improves
270 bps to 10.2%
• 36.5% EBITDA pull through on sales change
FINANCIAL OVERVIEW
7

Highlights
• Sales growth driven by acquisitions, volume and price improvement
• Margin improvement due to volume leverage, improved price, labor and sales
productivity, lower insurance and strong cost control
($ in 000s)Second Quarter
2017
Second Quarter
2016
SalesY-O-Y Change
$320,98411.4%
$288,042
Adjusted Operating Profit *Y-O-Y Change
$35,25754.2%
$22,863
Adjusted Operating Margin * Y-O-Y Change
11.0%310 bps
7.9%
* See slide 20 for GAAP to non-GAAP reconciliation
8
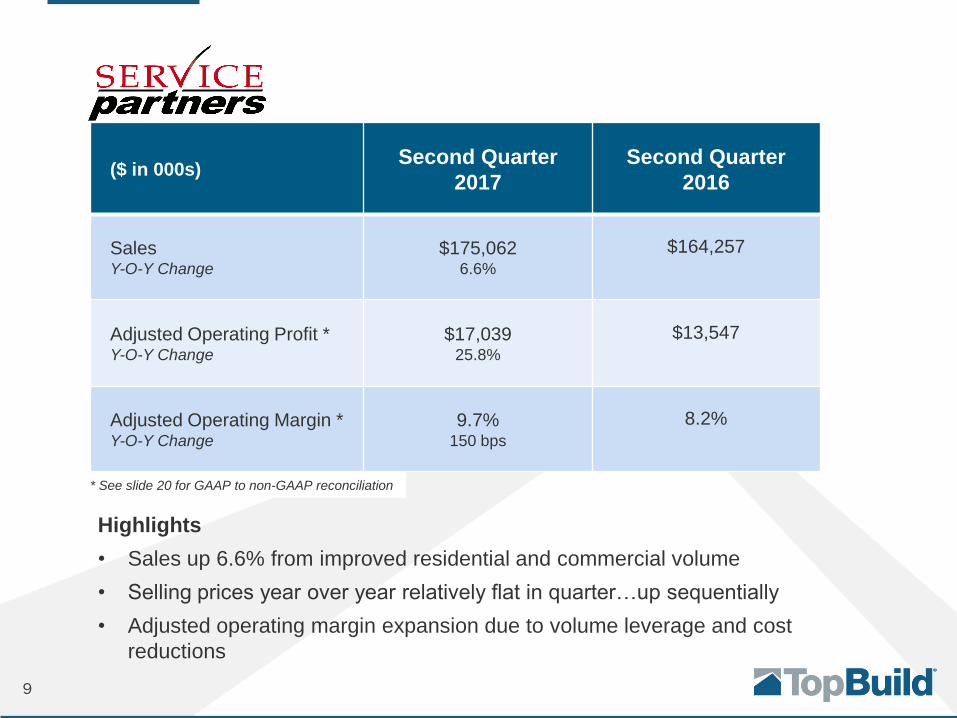
($ in 000s)Second Quarter
2017
Second Quarter
2016
SalesY-O-Y Change
$175,0626.6%
$164,257
Adjusted Operating Profit *Y-O-Y Change
$17,03925.8%
$13,547
Adjusted Operating Margin * Y-O-Y Change
9.7%150 bps
8.2%
Highlights
• Sales up 6.6% from improved residential and commercial volume
• Selling prices year over year relatively flat in quarter…up sequentially
• Adjusted operating margin expansion due to volume leverage and cost
reductions
* See slide 20 for GAAP to non-GAAP reconciliation
9

ADJUSTED EPS ($ in 000s)
10
Income from continuing operations before income taxes, as reported $ 37,897 $ 25,480 $ 33,171 $ 43,649
Significant legal settlement — — 30,000 —
Rationalization charges 1,258 647 2,995 1,655
Acquisition related costs 145 — 437 —
Loss on extinguishment of debt 1,086 — 1,086 —
Income from continuing operations before income taxes, as adjusted 40,386 26,127 67,689 45,304
Tax at 38% rate (15,347) (9,928) (25,722) (17,216)
Income from continuing operations, as adjusted $ 25,039 $ 16,199 $ 41,967 $ 28,088
Income per common share, as adjusted $ 0.67 $ 0.43 $ 1.12 $ 0.74
Average diluted common shares outstanding 37,191,299 37,976,703 37,404,193 37,938,108
Six Months Ended June 30, Three Months Ended June 30,
2017 2016 2017 2016

($ in 000s)Six Months ended
June 30, 2017
Six Months ended
June 30, 2016
CAPEX $8,571 $6,023
Working Capital % to sales
(using LTM sales)8.8% 8.4%
Operating Cash Flow $25,671 $6,146
Cash Balance $94,233 $102,090
Highlights
• CAPEX @ 0.9% of sales first six months
• Working capital as a % of LTM sales increases by 40 bps vs. prior year due to
initial inefficiencies from acquisitions on collections and payable terms
• Operating cash flow up $19.5 million primarily from working capital timing
CASH FLOW/WORKING CAPITAL &
CAPEX
11
OPERATING ENVIRONMENT
» Homebuilder sentiment positive
» Improving economy
» Household formations up
» New home inventories low
12

DRIVING OPERATIONAL EXCELLENCE
» Branches empowered
▪ Full P&L responsibility
▪ Local teams include production, sales and labor
▪ Products offered based on local demand
» Local relationships critical
▪ Community involvement
▪ Talent acquisition
▪ Customer service
» National resources
▪ Operating best practices
▪ Purchasing leverage
▪ Consolidated back office operations
13

OPERATIONAL IMPROVEMENTS DRIVING BOTTOM LINE RESULTS*
14*2Q 2017 compared to 2Q 2015

SEGMENT RESULTS STRONG
» Solid quarter for Service Partners
▪ Overall good topline performance
▪ Spray foam business up 25% YTD
▪ Material prices increasing as supply tightens
» TruTeam leveraging scale and footprint
▪ Driving selling price improvements
▪ Commercial business vibrant
▪ Labor remains tight
▪ Building lag extending
15

STRATEGIC AND ACCRETIVE ACQUISITIONS REMAIN A TOP PRIORITY
16
Company
Acquisition Date January 2017 February 2017 February 2017 March 2017 April 2017 June 2017
Annual Revenue ~$20M ~$23M ~$2M ~$7M ~$12M ~$28M
PresenceMidwest Colorado Springs/
Denver, CO
Norwalk, CT Sacramento, CA Seattle/Tacoma/
Bellevue, WA
Corona/San Diego/
Los Angeles/
Livermore, CA
Service Offerings
• Heavy
commercial
• Residential and
light commercial
• Residential • Residential • Residential • Heavy
Commercial
2017 Completed Acquisitions
ACCRETIVE ACQUISITIONS
» $20.8M revenue contribution 2Q 2017
» Successful track records
» Enhance TruTeam’s management
» Smooth and successful integration process
» Synergies from material purchasing power
» Pipeline of prospects robust

ANNUAL GOLF TOURNAMENT FOR
HABITAT FOR HUMANITY
17

APPENDIX
18

ADJUSTED EBITDA
RECONCILIATION
19
($ in 000s)
Net income, as reported $ 23,460 $ 15,615 $ 21,749 $ 26,731
Adjustments to arrive at EBITDA, as adjusted:
Interest expense and other, net 1,813 1,310 3,076 2,908
Income tax expense from continuing operations 14,437 9,865 11,422 16,918
Depreciation and amortization 3,605 3,013 6,835 5,908
Share-based compensation † 2,403 2,105 4,487 3,705
Significant legal settlement — — 30,000 —
Rationalization charges 1,258 647 2,995 1,655
Loss on extinguishment of debt 1,086 — 1,086 —
Acquisition related costs 145 — 437 —
EBITDA, as adjusted $ 48,207 $ 32,555 $ 82,087 $ 57,825
† Amounts for the three and six month periods ending June 30, 2017, exclude $0.6 million of share-based compensation included in the line item, rationalization
charges.
Three Months Ended June 30,
2017 2016
Six Months Ended June 30,
2017 2016

SEGMENT GAAP TO NON-GAAP RECONCILIATION
20
($ in 000s)
2017 2016 2017 2016
Installation
Sales $ 320,984 $ 288,042 11.4 % $ 611,870 $ 560,920 9.1 %
Operating profit, as reported $ 35,086 $ 22,797 $ 26,123 $ 36,303
Operating margin, as reported 10.9 % 7.9 % 4.3 % 6.5 %
Significant legal settlement — — 30,000 —
Rationalization charges 171 66 582 894
Operating profit, as adjusted $ 35,257 $ 22,863 $ 56,705 $ 37,197
Operating margin, as adjusted 11.0 % 7.9 % 9.3 % 6.6 %
Distribution
Sales $ 175,062 $ 164,257 6.6 % $ 345,306 $ 325,145 6.2 %
Operating profit, as reported $ 17,022 $ 13,547 $ 32,506 $ 27,880
Operating margin, as reported 9.7 % 8.2 % 9.4 % 8.6 %
Rationalization charges 17 — 17 83
Operating profit, as adjusted $ 17,039 $ 13,547 $ 32,523 $ 27,963
Operating margin, as adjusted 9.7 % 8.2 % 9.4 % 8.6 %
Change
Three Months Ended
June 30,
Six Months Ended
June 30,
Change