Book Review: Second World, Second Sex. Socialist Women’s ...
Upload
sharktale-johnCategory
view
224download
0description


Beat theOdds in
Forex Trading
ffirs.qxd 7/7/06 10:36 AM Page i

Founded in 1807, John Wiley & Sons is the oldest independent publishingcompany in the United States. With offices in North America, Europe, Aus-tralia, and Asia, Wiley is globally committed to developing and marketingprint and electronic products and services for our customers’ professionaland personal knowledge and understanding.
The Wiley Trading series features books by traders who have survivedthe market’s ever changing temperament and have prospered—some byreinventing systems, others by getting back to basics. Whether a novicetrader, professional, or somewhere in-between, these books will providethe advice and strategies needed to prosper today and well into the future.
For a list of available titles, please visit our web site at www.WileyFinance.com.
ffirs.qxd 7/7/06 10:36 AM Page ii

Beat theOdds in
Forex TradingHow to Identify and Profit
from High Percentage
Market Patterns
IGOR TOSHCHAKOV
John Wiley & Sons, Inc.
ffirs.qxd 7/7/06 10:36 AM Page iii
Copyright © 2006 by Igor Toshchakov. All rights reserved.
Published by John Wiley & Sons, Inc., Hoboken, New Jersey.Published simultaneously in Canada.
No part of this publication may be reproduced, stored in a retrieval system, or transmittedin any form or by any means, electronic, mechanical, photocopying, recording, scanning, or otherwise, except as permitted under Section 107 or 108 of the 1976 United States Copyright Act, without either the prior written permission of the Publisher, or authorizationthrough payment of the appropriate per-copy fee to the Copyright Clearance Center, Inc.,222 Rosewood Drive, Danvers, MA 01923, (978) 750-8400, fax (978) 646-8600, or on the webat www.copyright.com. Requests to the Publisher for permission should be addressed to thePermissions Department, John Wiley & Sons, Inc., 111 River Street, Hoboken, NJ 07030,(201) 748-6011, fax (201) 748-6008, or online at http://www.wiley.com/go/permissions.
Limit of Liability/Disclaimer of Warranty: While the publisher and author have used theirbest efforts in preparing this book, they make no representations or warranties with respectto the accuracy or completeness of the contents of this book and specifically disclaim anyimplied warranties of merchantability or fitness for a particular purpose. No warranty maybe created or extended by sales representatives or written sales materials. The advice andstrategies contained herein may not be suitable for your situation. You should consult with aprofessional where appropriate. Neither the publisher nor author shall be liable for any lossof profit or any other commercial damages, including but not limited to special, incidental,consequential, or other damages.
For general information on our other products and services or for technical support, pleasecontact our Customer Care Department within the United States at (800) 762-2974, outsidethe United States at (317) 572-3993 or fax (317) 572-4002.
Wiley also publishes its books in a variety of electronic formats. Some content that appearsin print may not be available in electronic books. For more information about Wileyproducts, visit our web site at www.wiley.com.
Library of Congress Cataloging-in-Publication Data:
Toshchakov, Igor, 1961–Beat the odds in Forex trading : how to identify and profit from high
percentage market patterns / Igor Toshchakov.p. cm.—(Wiley trading series)
Includes index.ISBN-13: 978-0-471-93331-1 (cloth)ISBN-10: 0-471-93331-7 (cloth)1. Foreign exchange market. 2. Foreign exchange futures. 3.
Speculation. I. Title. II. Series.HG3851.T67 2006332.4'5—dc22
2006004906
Printed in the United States of America.
10 9 8 7 6 5 4 3 2 1
ffirs.qxd 7/7/06 10:36 AM Page iv

v
Contents
Introduction vii
PART I Recommendations to Novice Traders 1
CHAPTER 1 How to Get Started 3
CHAPTER 2 Establishing a Trading Account 7
CHAPTER 3 Choosing the Right Dealer 15
PART II Developing a Trading Method 25
CHAPTER 4 Psychological Challenges of Speculative Trading 27
CHAPTER 5 Discretionary versus Mechanical Trading Systems 33
CHAPTER 6 Technical and Fundamental Analysis 37
PART III The Igrok Method 51
CHAPTER 7 Philosophy of the Igrok Method 53
CHAPTER 8 Evaluating Probabilities Using Technical Analysis 59
CHAPTER 9 Basic Trading Strategies and Techniques 77
CHAPTER 10 Choosing a Currency Pair to Trade 95
CHAPTER 11 Money Management Rules and Techniques 97
CHAPTER 12 Market Behavior and Trader Discipline 103
ftoc.qxd 7/7/06 10:37 AM Page v
PART IV Short-Term and Intraday TradingStrategies Using the Igrok Method 111
CHAPTER 13 Principles of the Intraday Trading Plan 113
CHAPTER 14 Entering the Market 117
CHAPTER 15 Exiting the Market 125
CHAPTER 16 The Importance of Timing 133
CHAPTER 17 Trading Strategy During the Central Bank Intervention 141
PART V Templates for Short-Term and Intraday Trading 145
CHAPTER 18 Average Daily Trading Range Templates 147
CHAPTER 19 Technical Formation Templates 159
CHAPTER 20 Trendlines, Support, and Resistance Templates 191
CHAPTER 21 A Sample Trade 207
Index 211
vi CONTENTS
ftoc.qxd 7/7/06 10:37 AM Page vi
vii
Introduction
Ibelieve an aspiring trader who applies the principles of this book willsave two or three years of practical education in the real market and atleast $20,000 of investment capital.
Over the period of time that I have been dealing with speculative cur-rency trade, I was lucky enough to have an opportunity not only to accu-mulate significant personal experience, but also to observe the work ofseveral hundred independent traders. In addition, I have more than adecade of experience in teaching the theory and practice of currency trad-ing to individual investors. I have also been studying the experience ofother traders personally, via books and other publications as well asthrough participating in discussions at various professional seminars andforums, and have corresponded with traders/colleagues from many coun-tries around the world. This additional experience has allowed me to con-duct my own comprehensive research on problems that all serious tradersrun into during their professional careers. I have also been able to gatherextensive material that has served as the initial base for this course andthat I have used to create my own trading method. Although nothing idealexists in nature, I believe my method of trading deserves some seriousconsideration by those who chose speculative currency trading as a pro-fession or just as a source of additional income.
I would like to start the introduction to this book by mentioning thatmy own experience as a FOREX speculative trader, and the experience ofmy respected colleagues whom I have met personally or through publica-tions, has shown that the problems all individual traders have to deal withare virtually the same. However, the number of solutions to the problemsis almost the same as the number of traders themselves. Over time, practi-cal results can range from complete triumph to complete desperation. Foreach participant, this business starts with a variation of a famous line fromShakespeare’s Hamlet: “To be a trader or not to be.” Is it worth riskingmoney, time and sometimes even a career built in another profession, inorder to reach success in a new field? If you join this market, how do youenter into that desirable 5 to 7 percent of participants who statistically
flast.qxd 7/7/06 10:38 AM Page vii

succeed? How do you reach success so that the money, time, and energyinvested into this business will not only be justified but will also bring yousignificant dividends? Each participant should be able to answer thesequestions personally; my task is more modest. For those who have alreadymade the choice in favor of “to be,” I offer my version of the secret abouthow to beat the odds and win the market game. I truly believe this bookwill allow novice traders to save a good deal of time and money that oth-erwise would be wasted by following the traditional trial-and-errormethod of learning from their own mistakes before gaining the necessaryexperience.1
viii INTRODUCTION
1Please also note that basic trading terminology, technical analysis terms, graphs,commonly known symbols, and abbreviations related to currency trading havebeen used in this book without detailed explanations of their meanings. Such in-formation (if needed) could easily be obtained from numerous textbooks and In-ternet sources, including my own web site at www.igrokforex.com.
flast.qxd 7/7/06 10:38 AM Page viii
1
PART I
Recommendationsto Novice Traders
Before conducting his first transaction on the real FOREX market,novice traders should spend some time familiarizing themselveswith this business, learning and also psychologically preparing for
participation in real trading. This initial stage can be divided into fivesteps:
1. Theoretical preparation and learning.
2. Choosing and acquiring the charting and analytical software, andsources of current market information (data vendors).
3. Developing practical skills and using acquired theoretical knowledge; de-veloping trading techniques and skills as well as trading strategies andsystems, on the virtual trading account under real market conditions.
4. Choosing the dealer or the broker company.
5. Defining the size of the investment capital and opening a trading account.
You should understand that the learning process could be more effec-tive and mutually enjoyable if you accept some of my preliminary adviceand recommendations. These tips are related to the preliminary self-trainingthat you have to conduct so you can better absorb the learning material.Therefore, the first part of the book is focused on general recommendationsfor novice traders.

3
CHAPTER 1
How toGet Started
The largest part of the theoretical materials regarding the FOREX mar-ket—including the main aspects of the theory of fundamental andtechnical analysis and also the general information—is not included
in this book. The theory of speculative currency trading can be studied us-ing the existing special literature. Before starting to study my tradingmethod, you must familiarize yourself with basic issues of the business inwhich you are attempting to participate or are already participating. Be-cause my trading method is different from the others that I call traditionalones, the theoretical preparation for my students has to have a specificcharacter. For preliminary preparation on the trade theory, I recommendstudying the following four issues:
1. History and development of the FOREX market.
2. Currency market participants, their roles and mutual relationships inthe process of trade.
3. Technology and terminology of speculative currency trade.
4. General principles of fundamental and technical analysis.
The main efforts should be focused on studying the technical analysiskey issues. The main focus should be on the following two subjects: Supportand Resistance Theory and Retracement Theories (Dow and Fibonacci). Mymethod uses only a relatively small part of the general theory of technicalanalysis and virtually does not employ fundamental analysis at all. However,I do not think it will hurt you to gain some knowledge of subjects that you
ccc_beat_003-006_ch01.qxd 6/8/06 2:31 PM Page 3
will most likely not need in the future. On the contrary, this knowledgeshould help you not just with better understanding of the offered method butinternal market tendencies as well.
INFORMATION, DATA FEED, AND TECHNICAL SUPPORT
I don’t have any special or particular requirements for computer software,charting programs, or data sources of real time and delayed marketquotes and other data. Moreover, my trade method requires only minimaldata means. That’s why any service (even the cheapest one) deliveringreal-time market data might be sufficient. It has to have the ability to cre-ate charts, a set of main technical indicators, and a minimum set ofgraphic tools for drawing trend lines, support, and resistance lines. As faras I know, such a service can even be received at no charge from some In-ternet sites. Long-term analysis requires more sophisticated software,which can be found today on the market at a relatively inexpensive priceand with quite acceptable quality.
I didn’t do any special research on this subject and cannot offer you acomparison analysis of today’s informative services and charting pro-grams. I just want to mention that for the purpose of analysis of long-termcharts, including daily, weekly, and monthly charts, I’m using SuperChartsby Omega Research and data feed of the Bridge/CRB. This software doesn’tenvisage any real-time mode, and the data is loaded from Bridge/CRBdaily at 11:00 P.M. GMT, after the end of each trading day. I am entirely sat-isfied with this service; it fulfills the requirements of my trade method, andI recommend something similar for your usage.
DUMMY TRADING
Before making the final decision to participate in real trade in the FOREXmarket, the majority of beginners go through the learning stage calleddummy trading. This presents a virtual market game, with only virtualcapital at risk. Mainly, this is the stage when a newcomer makes a final de-cision about whether to participate in real trading. His final decision isusually based on the results of such dummy trading. Considering such atraining method as a necessary element for the beginners, I must empha-size that the results received in virtual dummy trading are different fromthe real results of the same traders in the real market when someone dealswith real capital. The differences are always not in favor of the real trade.The psychological factor is mostly responsible for this. The risk of losing
4 RECOMMENDATIONS TO NOVICE TRADERS
ccc_beat_003-006_ch01.qxd 6/8/06 2:31 PM Page 4
real money influences the trader in the most negative way, triggering er-rors, some of which he was successfully avoiding while trading hisdummy account. Therefore, I would like to warn you not to be very hope-ful and overexcited if the results of working in the real market entirely co-incide with the results received in dummy trading. The negative factorbuilt into the trader’s psychology will reveal itself anyway. In order toreach a positive result in real trading, you must develop methods of lower-ing the psychological loads in the stressful situations of real trading. Do-ing so will constantly train and strengthen your psyche.
The majority of FOREX dealer and broker companies today offer on-line trading, which presents an optimum solution and a big advantage forthe majority of independent traders. Most of those companies also allowvirtual dummy trading. In this regard, I have only one recommendation: Itwould be better to have a dummy trading account with a dealer or a bro-ker you are planning to work with when starting real trading. This way,you generally will be able to evaluate the quality of the service; get used tothe manner in which your orders are filled by the dealer; and get used tothe peculiarities of this particular on line trading software. If you can inde-pendently determine the initial amount of the virtual account, it is desir-able for this amount to match the size of the real investment you haveplanned. Such an approach will allow you to achieve the closest proximityto the real situation you will soon have to deal with.
How to Get Started 5
ccc_beat_003-006_ch01.qxd 6/8/06 2:31 PM Page 5

ccc_beat_003-006_ch01.qxd 6/8/06 2:31 PM Page 6
7
CHAPTER 2
Establishing aTrading Account
FOREX market has some certain specific characteristics; withoutknowing them and taking them into consideration, the eventual suc-cess in speculative operations could be doubtful.
After the preliminary preparation stage is fulfilled and you think youare ready to participate in real trade in the FOREX market, you mustchoose a broker or dealer company to conduct your investment opera-tions. You must also determine the size of the initial investment that youwill have to transfer into the trade account opened with the chosendealer company. (Criteria for choosing the dealer company are pre-sented in Chapter 3). As is well known, this market has few specificcharacteristics; without considering them, success in speculative opera-tions is doubtful.
Unfortunately they are totally beyond the trader’s control. Those pe-culiarities result from conditions characterizing the FOREX market andfrom historically developed practices and rules followed by all the partici-pants. Some specifications on the FOREX market include high volatility ofmain currencies; the possibility of trading under conditions of low-inter-est margin; and relatively high minimum contract value. These conditionsare initially considered to be advantages and mainly attract investors intothe business. However, they also have a negative side and can be consid-ered as an additional source of risk for a trader. Everything depends onthe point of view of the observer, as in the well-known example of thehalf-empty and half-full glass.
I don’t have any doubts that, because you have made the decision to par-ticipate in the market, you are sufficiently informed about its advantages. My
ccc_beat_007-014_ch02.qxd 6/8/06 2:31 PM Page 7
task is to point out some hidden risks and dangers. Some mistakes mademainly by novice traders during the first stage of their careers are describedbelow. They are connected with insufficient initial capital or its incorrect dis-tribution and management. First, the beginner should be warned about twopossible mistakes that are typical and usually made at the very beginning ofthe trading career.
UNDERCAPITALIZATION RISK
Insufficient initial capital invested into trade is the first mistake made by amajority of newcomers, and it often turns out to be their last mistake.
I have witnessed many cases of full loss of capital invested into cur-rency operations during the first month, weeks, days, and even hours. Theinvested capital is lost before a novice trader has time and an opportunityfor learning.
This happens for a few key reasons. At the beginning of a career, anew trader has neither sufficient knowledge and experience nor the feel-ing of danger or risk limit that should not be surpassed. Also, at the verybeginning, there are some errors that could be avoided with the proper setup before conducting business. One of the frequent initial mistakes is in-sufficient investment in trading operations. Consider the condition whenthe average daily oscillation amplitude of the main currency in a percentratio is comparable to the margin offered to the currency investor bybanks, dealers, and brokers. (It is common nowadays to provide thetrader with such a condition when the initial margin does not exceed 2 to4 percent of the size of the contract for the daily trade.)
If the currency oscillates 1 to 1.5 percent on a daily average, the lossof a larger part or even the entire trading account within just a couple ofdays is possible. I must mention that most novice traders partially realizerisks they will have to deal with on the currency market, but are not al-ways capable of precisely formulating and evaluating them. Therefore,they often undertake incorrect actions for lowering them. Logical thinkingdictates that the simplest way of lowering the risk of potential losses is byinvesting the minimum possible amount into trade. At the same time, theidea and the plan are to increase the investment later as the necessary ex-perience, knowledge, and skills are acquired. From my experience, thisapproach to lower the risk is virtually ineffective and even harmful. Thesituation reminds me of one of my favorite anecdotes: A commission ar-rives in a psychiatric hospital to inspect the facility. The commissionmembers see an empty swimming pool into which the patients are diving
8 RECOMMENDATIONS TO NOVICE TRADERS
ccc_beat_007-014_ch02.qxd 6/8/06 2:31 PM Page 8
from the diving board. The commission members ask one of the patientswhy they are diving into an empty pool. The patient answers that the hos-pital administration promised to fill the pool with water immediately afterthe patients learn how to dive.
Usually, most novice traders partially realize the risks they will haveto deal with on the currency market, but they are not always capable ofprecisely formulating and evaluating these risks.
In the same way, many novices try to lower the risk of losses whilethey are expecting to acquire sufficient practical experience, in order toinvest larger amounts later on. They don’t understand that a small tradingaccount actually increases the risk of losses. By artificially decreasingthe initial investment capital, it is impossible to lower the risk. This is be-cause the size of the trading account and the risk degree of losing somepart of the investment capital are not proportionally related. I will illus-trate this statement with a simple example. Let’s assume there are twoaccounts. One of them has invested capital of $5,000 and the other$50,000. All other things being equal (such as minimum contract size of$100,000), the initial margin equals 4 percent, and during one trade only,one minimum contract is operated. It is clear that only after two or threeunsuccessful transactions (each resulting in a loss of an average of$1,000), the smaller account is practically inoperable and requires replen-ishment in order to continue participation in the market. See Figure 2.1.
The larger account in this situation remains absolutely sufficient forfurther operations. Restoring the loss is easier than in the small account.Equalizing the chances to win with large and small accounts is possibleonly by proportionally decreasing the minimum contract size for a smallaccount owner, or by the same proportional limitation of loss size. It ispractically impossible to accomplish either of these options.
The size of the trading account and the risk degree of losing some partof the investment capital are not proportionally related.
The minimum contract size for everyone who works with a gooddealer should not be below $100,000. It can be said that this amount is aminimum standard for small individual transactions. By putting short andtight stops, the trader increases the chances the stops will be triggeredmore often and the total loss will consist of many small losses.
Sometimes, novice traders gradually add money to the trading ac-count. By replacing the losses on the market, they keep the small accountinstead of immediately investing the large sum in order to lower the risk.As a result, considerable amounts are often lost, invested into the marketin small portions. One of the main reasons for these losses is insufficientcapital at the moment when it is most required. Therefore, the most fre-quent disadvantage is insufficient initial investment.
Establishing a Trading Account 9
ccc_beat_007-014_ch02.qxd 6/8/06 2:31 PM Page 9
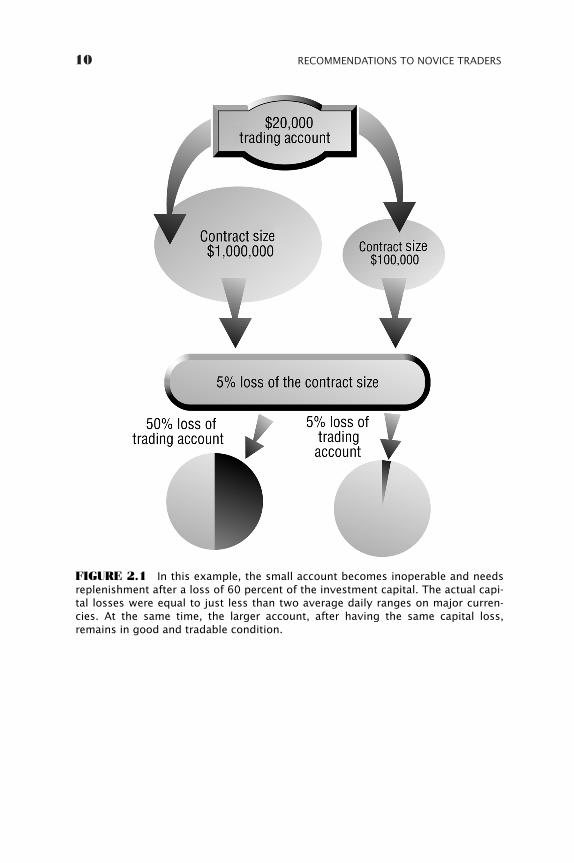
10 RECOMMENDATIONS TO NOVICE TRADERS
FIGURE 2.1 In this example, the small account becomes inoperable and needsreplenishment after a loss of 60 percent of the investment capital. The actual capi-tal losses were equal to just less than two average daily ranges on major curren-cies. At the same time, the larger account, after having the same capital loss,remains in good and tradable condition.
ccc_beat_007-014_ch02.qxd 6/8/06 2:31 PM Page 10
The trading account is a working tool for the trader, and it should corre-spond also to those business requirements under which it will have towork.
OVERTRADE RISK
The second mistake made by a majority of newcomers can be attributedto the overtrade risk. This problem is sometimes directly connected to in-sufficient trading capital. Quite often, though, the problem does not haveany relation to this. Rather, it can be explained by the trader’s lack ofknowledge of the main principles of money management, which means in-sufficient ability to control someone’s trading capital. A trader’s tradingcapital is his tool designed to earn money. In the first place, the trader hasto take care to keep this tool intact, because its loss or damage will imme-diately result in the inability to continue his trading operations.
YOU MUST DETERMINE THE LIMITS OF YOUR RISK IN ADVANCE
Overtrade most often reveals itself when the trader (hoping to receive themaximum possible profit) acquires an oversized contract, risking thelarger part of his trading capital in just a single transaction. In case a mar-ket starts moving against the trader’s position, possible losses can exceedthe acceptable limit. The result can be irreparable damage to the working
Establishing a Trading Account 11
Recommendation
The trading account (to the degree possible) should be sufficiently large,in order to correspond with market conditions and provide the requiredsecurity and flexibility in making trade decisions. The trading account is aworking tool for the trader. It should correspond not only to those tasksthat each trader sets for himself personally, but also to those business re-quirements under which he will have to work. It is not worth trying tolower the risk by artificially decreasing the initial invested capital. This tar-get should be achieved in a natural way—primarily by trading the con-tracts of the minimum possible size at each given moment, until the timewhen the trader acquires sufficient experience and self-reliance.
ccc_beat_007-014_ch02.qxd 6/8/06 2:31 PM Page 11
12 RECOMMENDATIONS TO NOVICE TRADERS
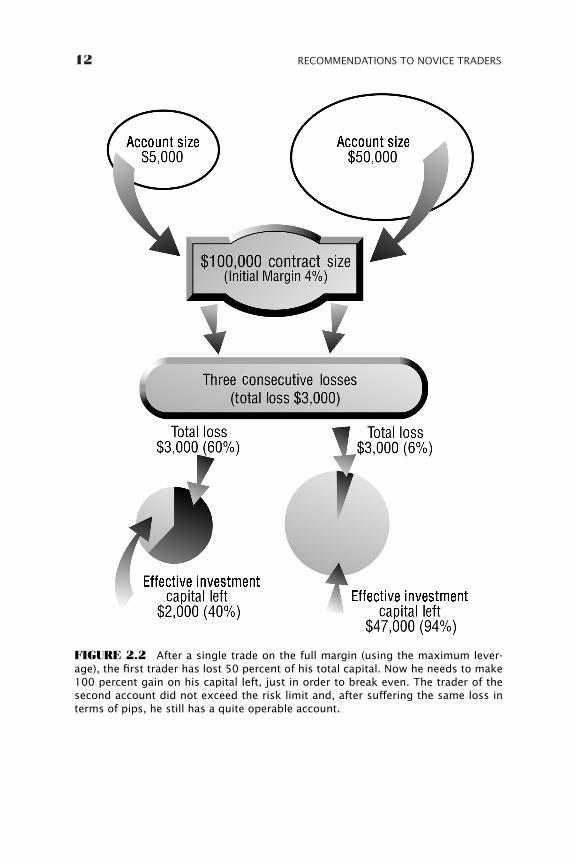
FIGURE 2.2 After a single trade on the full margin (using the maximum lever-age), the first trader has lost 50 percent of his total capital. Now he needs to make100 percent gain on his capital left, just in order to break even. The trader of thesecond account did not exceed the risk limit and, after suffering the same loss interms of pips, he still has a quite operable account.
ccc_beat_007-014_ch02.qxd 6/8/06 2:31 PM Page 12
capital, bringing the trading account to a condition unusable for furthertrade. The account will be unusable in a timely manner in the future, dueto the impossibility of covering those losses that occurred during just onetransaction. Under current conditions, many banks and dealers offer theirclients margin trading terms at a leverage ranging from 20:1 to 50:1 (andeven higher). The initial margin as an industry’s average is only 2 to 5 per-cent. Considering the average market activity during one day, it is easy tolose half or even a larger part of the trading capital. In order to avoid thisoccurrence, it is desirable to use certain margin self-limitation and not touse more than 5 to 10 percent of the trading capital during one trade.Traders should establish their individual limitation for the margin, andpossibly keep this limitation not below 10 to 20 percent as compared tothe size of the trade contract. In other words, for each $10,000 to $20,000of the size of your trading capital, only one contract of $100,000 should betraded at any time. See Figure 2.2.
This is the minimum for a majority of the dealers. More details on theproblem of overtrade will be presented in Chapter 11.
Establishing a Trading Account 13
Recommendation
From the very beginning, it is useful to remember that there is no capitalso large that it is impossible to lose during speculative operations in theFOREX market. The risk of losing part of or the entire investment capital isalways present where there is the possibility to earn. The currency marketis not an exception to this rule. In order to earn, the trader must take therisk of loss. In risking, though, traders must determine in advance the lim-its of their risk. They should never risk all or the largest part of their trad-ing capital at once. They should risk only that part whose loss they aresure will not result in catastrophic consequences for their trading ac-counts and the resulting inability to further participation in trading.
ccc_beat_007-014_ch02.qxd 6/8/06 2:31 PM Page 13

ccc_beat_007-014_ch02.qxd 6/8/06 2:31 PM Page 14
15
CHAPTER 3
Choosing theRight Dealer
A fter a positive decision is made to participate in speculative tradingin the FOREX market, a newcomer should first choose the dealerfor conducting a trade. The right choice greatly influences the final
success of the whole enterprise. Nowadays, the market is overcrowdedwith companies and banks offering their services to individual traders andinvestors to access the currency market. It is not easy to make the rightchoice without a certain set of criteria. These criteria best correspond tothe interests, preferences, and means of each individual trader, and to thetrade strategy and tactics chosen by him.
The best way to find the right dealer is to compose a list of questionsto ask the dealer, before making a final decision in favor of the preferredcompany or bank. The following are suggested questions that should beanswered by the dealer before you make the decision to open a trading ac-count. Included are my recommendations about the optimization of mar-ket operation conditions:
WHAT IS THE AMOUNT (VALUE) OF THE INTRADAY ANDOVERNIGHT MARGIN AND CORRESPONDING LEVERAGE?
Many reliable dealers (especially those who offer Internet trading) restrictthe margin by 2 to 5 percent, which provides money contract leverage be-tween 20:1 and 50:1. Such terms seem quite reasonable and acceptable,considering the risk/investment efficiency ratio. Higher margin require-
ccc_beat_015-024_ch03.qxd 6/8/06 2:32 PM Page 15
ments yield lower investment efficiency, whereas a lower margin meansthat the dealer bargains against his own clients and will do everythingpossible to prevent his clients from winning. It is difficult to work undersuch terms because you will confront even more trading problems.
WHAT IS THE MINIMAL CONTRACT SIZE?
Today, a minimal contract size of $100,000 is common for most dealercompanies offering their services to individual traders. This contractsize is quite affordable from all points of view. It allows traders to con-duct reasonably effective money management with limited capital. Italso makes it possible for small individual investors to participate inmoney speculation. Finally, it is a reasonable compromise between therequired minimal deposit amount and potential profit level in absolutemoney nomination.
WHAT ARE THE REQUIREMENTS FOR THE OPERATION ACCOUNT SIZE (MINIMUM DEPOSIT)?
Evidently, the more the investment capital, the easier, safer, more flexibleand more effective should be its management. The investment and finan-cial means of traders differ. It is a common situation when somebody will-ing to participate in speculative trading in a currency market simply doesnot have enough funds to open an account corresponding to the requiredsafety rules. Each trader has his or her own security level, but I think (al-though it is a debatable issue) that the operable account size for the indi-vidual speculative trader begins with a minimal amount of $30,000,assuming that the initial margin is 2 percent and the minimal contract sizeis $100,000. I think $30,000 is the required minimum amount correspond-ing to FOREX market conditions, considering the following:
• If trading a single minimal contract of $100,000, a trader loses a pipamount equal to an average daily swing corresponding to $600 to$1,000 (depending on the selected currency pair), then the loss of 2 to3 percent of the account per single transaction is rather painless. Thisloss cannot ruin the account, even in the case of a few consecutivelosses.
• Traders must consider that the market “noise” amplitude approxi-mates the amplitude of the average daily exchange rate fluctuation.Therefore, setting shorter stops while trading on a medium or longer
16 RECOMMENDATIONS TO NOVICE TRADERS
ccc_beat_015-024_ch03.qxd 6/8/06 2:32 PM Page 16
term is unreasonable, because these stops can be offset by incidentaloscillation ticks.
• Some trading strategies recommended in this course suggest positionreversal and doubling the contract size at the same time, which de-mands some additional margin for the safety of the correspondingworking capital.
• Traders should take into consideration that the trader’s job should beadequately reimbursed, including psychological stress, time, and ef-fort spent. There is no reason to spend up to 14 to 16 hours per daytrading if you can earn the same money in a less stressful job. Simplecalculation shows that even doubling of trading capital in one yearcan provide you with a secure income, but only in the case of an ade-quate initial investment.
WHAT ARE THE TERMS OF SETTING AND EXECUTING STOP AND LIMIT ORDERS?
The ideal option is considered to be a transaction execution of stop andlimit orders at a fixed price, regardless of the state of the market, itsspeed, and its direction at the moment. Some dealers guarantee thismethod of execution, whereas others reserve the right to fulfill an orderwith a slippage. The value of this slippage depends on the current state ofthe market, and can fluctuate from a few pips to tens of pips. The slippageevidently creates favorable conditions for abuse of a trader by the dealer,although it is practically impossible to arbitrate the price received fromthe dealer executing this transaction.
WHAT IS THE SPREAD SIZE AND ITS DEPENDENCE ON THE CONTRACT SIZE?
The spread is the difference between the “bid” and the “ask” prices givenat any moment on the trading terminal. The smaller the spread is, the bet-ter it is for the trader. The dealer’s spread size of five pips at the minimalcontract size of $100,000 in a steady market can be regarded as adequateand acceptable, because it does not exceed the 5 percent limit of averagedaily deviation of currency rates. Some dealers, when trading contracts of$500,000 or more, do offer a spread of less than five pips to their clients. Ifyou do not plan to trade contracts of $500,000 or more, you have to find adealer who can maintain the minimum spread provided for the contract—even under active and quickly changing market conditions.
Choosing the Right Dealer 17
ccc_beat_015-024_ch03.qxd 6/8/06 2:32 PM Page 17
WHAT IS THE OPPORTUNITY FOR ON-LINE TRADINGUSING THE INTERNET AND ADDITIONAL SERVICES:ANALYTICAL, DATA, NEWS, QUOTES, GRAPHICS, AND SUCH?
Many dealers now offer the opportunity for on-line trading, and more willdo so in the future. Internet trading has certain advantages over the tradi-tional telephone communication with a broker or a dealer. The main ad-vantages of on-line trading are:
• The opportunity to monitor market movements by following currentreal-time prices, graphics, and even news on a PC monitor. Usually, itis free and is included in the service and trading software offered by adealer.
• Dealer trading software as well as other options often provide thetrader with the opportunity to manipulate, modify, and customizegraphics; conduct technical analysis using indicators; and draw trendlines, support, and resistance lines. In addition to being convenient,this provides substantial money savings. It eliminates the necessity ofbuying an expensive market-quotes service, and analytical and chart-ing software for conducting technical analysis.
• Internet trading is supported by safe electronic registration data,which provides the necessary security and lowers the possibility ofconflict situations between a trader and a dealer. These conflicts aredue to probable human errors and slips of the tongue, which are com-mon during live phone communications.
IS IT NECESSARY TO PAY COMMISSIONS AND OTHER PAYMENTS AND DUES?
The most reputable dealer companies charge no commissions for trans-actions executed by their clients. Others charge some commissions, butusually not very high ones. Personally, I cannot excuse some dealerscharging so-called storage fees. In the financial world, the client is usu-ally paid when he stores his money—not the dealer. Reputable dealerstransferring an open position to the following day execute the rolloveroperation in accordance with the current LIBOR rates and reflect it in adaily statement.
Depending on the currency pair and direction in which the positionwas opened at the moment of its transfer to the next day, the client
18 RECOMMENDATIONS TO NOVICE TRADERS
ccc_beat_015-024_ch03.qxd 6/8/06 2:32 PM Page 18
could actually win as a result of the transfer. A certain amount wouldbe added to his account just for holding the position open for more thanone day.
Other dealer companies do not bother themselves with such calcu-lations but simply charge the client for the interest on the positiontransferred to the following day. There are numerous discussions aboutthe possibility of holding two opposite positions open when both longand short positions exist simultaneously. At a dealer’s statement in suchcase, both positions are shown to exist in reality. Each one generatesprofit and/or loss, and in such form they could be transferred to the fol-lowing day. I have met a few traders whose manner of trading envisagedsuch a condition or who used it as an important part of their tradingstrategy.
I think such arguments are useless and senseless. The positions can-not voluntarily be divided into new and liquidation—depending on atrader’s will. The market functions in accordance with certain rules, and itis arranged in such a manner that positions of the opposite tendencies forthe same currency pair and of the same size are offset automatically. Thespot part of the FOREX market provides the offset and self-liquidation ofall open positions by the end of each trading day. At the beginning of thenext day, only those positions are recovered that had not been offset dueto the lack of opposite (with opposite sign) transactions of correspondingsize. For example, if the trader during the day executed USD/CHF transac-tions for the total amount of $600,000 to buy and $400,000 to sell, then thelong USD/CHF position for the remaining $200,000 would be transferredto the next day. As you can see, this is accompanied by the offset of theopposite positions, and the corresponding gain/loss was deposited into ordeducted from the trader’s account.
There is a simple reason that some dealers allow and even encouragetheir clients to keep opposite positions for longer than one day. A dealercompany can charge interest for practically nonexisting positions. Adealer company can also create the illusion for the trader that the trader ispresent at the market and should find a way out of the situation and liqui-date both opposite positions, whereas, in reality, they are nonexistent.
Many traders consider the possibility of keeping these opposite posi-tions an advantage. This advantage allows them to hedge (or lock) theirlosing trades and to limit their losses in case the market moves againsttheir initial position. At the same time, this possibility creates the illusionthat loss of money is not final and that the money could be returned if the“right” way out of the situation was found. If you cannot stand the psycho-logical stress of trading without such useless “placebo” methods, then it isbetter to reconsider further participation in this business.
Choosing the Right Dealer 19
ccc_beat_015-024_ch03.qxd 6/8/06 2:32 PM Page 19
WHAT ARE THE RISKS OF DOING BUSINESS WITH “BUCKET SHOPS”?
Legal issues (i.e., a set of acts governing and controlling the functions ofbanks, dealers, and broker companies in the FOREX market, establishedby government agencies) are of primary importance because traders haveto entrust their money to the dealers. First, it is better for traders to makesure that their money is safe and that the breach of trust is impossible forthe dealer.
I am not a lawyer, so I have no right to advise my clients on legal mat-ters. The vast majority of dealer companies function in many countries,with various rules and regulations of which I am not aware. My recom-mendations are, therefore, based on my personal experience and prefer-ences. In any case, you had better survey the problem yourself andpreferably ask a lawyer for legal advice. The following sections outline mypersonal opinion concerning dealer choice, considering the security ofcapital invested in FOREX operations.
The Problem of Dealer and Broker CompaniesAbusing Client’s Trust Exists on a Large Scale
Many countries lack any legislative jurisdiction governing dealer-customerrelationships regarding the FOREX market, or government control overdealer and broker companies involved in speculative currency trading. Thatis the main cause of abuse of clients, especially when the client’s money isused for market speculation and when unlawful extortion is charged.
The Majority of Broker Companies—Especially Small Ones—are Bucket Shops
Bucket shops are companies that do not have direct relations with theFOREX market, and do not execute real transactions on the real market.What they do is create an illusion of trading operations whereas, in reality,they only make mutual bets around rate changes between a client-traderand themselves. These bets are based on real current market quotas, butactually have nothing to do with the real market. If the client wins, theclient gets paid from the broker company’s own funds. If the client loses,the money remains in the broker’s pocket.
In General, Operations of Bucket Shops Are Legal and Are Not Controlled by a Government
Many experienced traders know about practices of bucket shops but do notpay adequate attention to them. They think that the sources of gain or loss
20 RECOMMENDATIONS TO NOVICE TRADERS
ccc_beat_015-024_ch03.qxd 6/8/06 2:32 PM Page 20
coverage are of no great importance. However, in reality, this belief leads toserious mistakes. When brokers try to maximize clients’ losses, it aggravatescontradictions between a client-trader and a company offering brokerageservice. This can have very grave consequences for the client. Usually, suchbrokers do everything possible to make a client’s operations on the moneymarket difficult. They have at their disposal a wide variety of tools, rangingfrom various commission charges and other fees that the client is required topay for the supposedly offered services, to quota manipulations that offerthe client prices that are different from current market prices. There aresome cases in which such companies have been liquidated, and their ownershave disappeared with the clients’ money. On the Internet, you can find nu-merous reports of clients deceived by such companies.
How to Determine If a Broker Company Is a Bucket Shop
You can determine with great accuracy if a broker company is a bucketshop by conducting these basic features of the company:
• The minimum necessary trading account size is less than $10,000.• The initial margin is less than 2 to 4 percent or is not fixed at all.• Positions are transferred to the next day not in accordance with the
generally accepted rules based on the corresponding current LIBORrates but with some other plan, and a trader is required to pay the in-terest charge at some fixed or floating rates.
• There are some extra charges in the form of commissions for eachtransaction and/or storage fees.
• Both opposite positions can be kept indefinitely (the so-called lockor hedge) for the same currency rate that is reflected in the client’sstatement.
• The setting of automatic stop and limit orders is governed by certainunreasonable restrictions, preventing order setting too close to thecurrent market price if the fixed existing limit is exceeded, or by someother simulated restrictions on using automatically executed orders.
Bucket Shop Practices Are Widespread, Mainly among Dealer-Broker Companies in the United States, Eastern Europe, Southeast Asia, and Offshore Zones
Because bucket shop practices are so widespread, I would not recom-mend dealing with companies in the United States, Eastern Europe,Southeast Asia or offshore zones. It’s better to be safe than sorry. I think the
Choosing the Right Dealer 21
ccc_beat_015-024_ch03.qxd 6/8/06 2:32 PM Page 21
best area to open a trading account for FOREX operations is Western Eu-rope, especially Great Britain. The reputable and easily checked Europeancompanies, or the European subsidiaries of reputable international banks,are the best choices to provide reliable service. Furthermore, Great Britainhas a governmental agency—Securities and Futures Authority (SFA)—which overrules the dealer companies in the FOREX market as well.
Before Making a Final Decision, Remember toCheck the Terms of Opening the Trading Accountand Corresponding Transactions
The terms to consider, about opening a trading account and carrying outtransactions, include: adding interest to the deposit, the opportunity toopen a segregated account, the opportunity to trade under a bank guaran-tee, the time schedule for money transfers from one account to another,rules governing conflicts and settlements, and such. The right choice of adealer greatly influences the results of your trading operations.
RECENT INDUSTRY DEVELOPMENTS
Some significant changes, both positive and negative, took place in theFOREX trading world over the past few years.
First let me mention three positive changes:
1. By the year 2006 the industry of FOREX trading had become moregovernment regulated in the United States. Nowadays, the NFA regu-lates most of the dealers and introducing brokers conducting busi-ness in the United States, including foreign dealing companiesproviding services to U.S. customers. So, now the probability for atrader or an investor to become a fraud victim has greatly decreased.
2. Stronger competition among numerous dealing companies has madethem offer their customers better services that include more sophisti-cated trading software, lower spreads, and faster and more accuratetrade execution.
3. Reputable dealers now offer their customers the opportunity to tradecontracts as small as $10,000. This is good for beginners, who todaycan make real trades without risking too much money while learningthe business.
However, along with positive changes there also were two negative ones:First, the same competition among dealers that improved quality of
their services overall led to the situation that now almost every dealer
22 RECOMMENDATIONS TO NOVICE TRADERS
ccc_beat_015-024_ch03.qxd 6/8/06 2:32 PM Page 22
could be considered a bucket shop. Today the dealers routinely tradeagainst their customers, especially those individuals with smaller tradingcapital. In order to increase their revenues, some of the larger dealers on adaily basis carry an uncovered exposure totaling well over $100 million ofthe positions taken by their customers. At first glance it seems that thereshouldn’t be a problem. The rule of the game is that the house must al-ways win and there are reasons to believe that most of the clients’ tradingcapital sooner or later ends up in the dealer’s pocket anyway, pretty muchlike in the gambling industry. (Dealers’ back office statistics show that ap-proximately 60 percent of their clients’ total trading capital is being lost intrading annually.) However, unlike in the casino business where the houseis always able to control each and every aspect of the game, there couldbe some very dramatic and fast changes in the market that wouldn’t allowthe dealer to cover its exposure before it becomes too late. Unexpected,almost instantaneous, and sizeable shifts in currency exchange quotescould be damaging to the point where a dealer would not be able to fulfillits financial obligations toward its customers.
The other change that I consider to be rather negative is the trend ofmost dealers lowering their margin requirements. Today it is quite possi-ble to find a dealer offering to its customers a margin as low as 0.5 per-cent. Dealers present low-margin trading as an opportunity for customersto achieve greater profitability with smaller investment capital. It is true,but trading on full leverage also could easily cause the loss of the entiretrading capital in a single trade in a matter of minutes. It looks like tradingin the financial market is turning into a casino-style business, which is notgood in my view.
Choosing the Right Dealer 23
ccc_beat_015-024_ch03.qxd 6/8/06 2:32 PM Page 23

ccc_beat_015-024_ch03.qxd 6/8/06 2:32 PM Page 24
25
PART II
Developing aTrading Method
The most difficult process is adjusting the human psychological factor,because in real life it is impossible to completely get rid of the psy-chological factor influencing human activity.
I think it is very important for the reader of this book to follow me increating the method, beginning with the definition and identification of theproblems that need to be solved. Then, after initial ideas are formed, wewill continue to the development of effective trade principles and the cre-ation of an integrated conception of systematic trading methods. I wouldlike each trader to understand the essence and logic of my method, whichallows a transition from vague emotions and desires to specific targets, inorder to develop an effective trading technique. I think this approach totraining is the best. It allows the trader to not only follow my line ofthought but also, using the information acquired in this book, to extendeach trader’s individual (not only professional) experience, with the aim ofcritically evaluating the acquired information.
For this reason, I decided to violate the traditionally taught se-quence of many books, manuals, and training aids, and state my book inthe sequence of the development of my method. The first chapter (Chap-ter 4) in Part II is dedicated to trader psychology. The psychologicalproblems shared by many traders will be addressed, and the conclusionwill be proven that it is necessary to switch to a systematic tradingmethod without forming a rigid mechanical trading system. This desire,and the necessity to get rid of the excessive and permanent psychologi-cal stress that negatively influences the results of my everyday trading,
ccc_beat_025-026_pt02.qxd 6/8/06 2:33 PM Page 25
inspired me to develop the new systematic trading method I will pre-sent in this book.
In Chapter 5, the initial requirements for the optimal trade methodsand the consequent trade systems are formulated. Next, some basic ele-ments for the trade method development are described - using tradingtools corresponding to the basic principles of effective trading. Along withmy own ideas and elaboration, they will be used as the basic componentsof effective trading described in Chapter 7.
Each trader goes through mistakes, failures, and losses in his or herown way and in accordance with his or her personality and temper.
26 DEVELOPING A TRADING METHOD
ccc_beat_025-026_pt02.qxd 6/8/06 2:33 PM Page 26

27
CHAPTER 4
PsychologicalChallenges
of SpeculativeTrading
Asuccessful trader’s career mainly depends on his or her psychologicalstability in stressful situations, which are common in the processof trading. Theoretical knowledge can be acquired by reading pro-
fessional literature; practical skills and experience are acquired in theprocess of actual trading. The most difficult process is adjusting psycho-logical stress, because in real life it is impossible to completely elimi-nate the stress factor influencing human activity. Underestimating thestress factor could play a mean trick on traders and even completelyblock their abilities to make reasonable decisions in real trading situa-tions. The psychological stress of those trading in the FOREX (and anyother) market is extremely high. Traders must work under permanentpsychological pressure, making decisions in highly unpredictable anduncertain market situations.
Each trader goes through mistakes, failures, and losses in his or herown way, in accordance with his or her personality and temper. Somemight blame their failures on the market’s “wrong behavior,” which didn’tcomply with the trader’s brilliant forecast and caused the failure of themagnificently planned speculative combination. Others blame themselvesand their own inabilities to make right decisions in situations, which after-wards seem to be simple. It is an interesting fact that, in hindsight, tradersusually find the decision that should have been made at the lost criticalmoment and can reasonably prove their point of view. Why can they findthe right decision so easily and quickly in hindsight? Was the trader un-able to do so at the right moment? I don’t think it can be simply explainedby looking at yesterday’s situation from today’s point of view. I do not
ccc_beat_027-032_ch04.qxd 6/8/06 2:33 PM Page 27
think it can be explained by the fact that classical technical analysis al-lows for multiple explanations of almost any market situation. It is alwayspossible to find an appropriate basic explanation for any market shift afterthe event takes place. In the heat of the moment, however, the trader wasinfluenced by stress, and that stress caused the error. This is proven bythe fact that most novice traders show exceptionally good (and even phe-nomenal) results trading dummy accounts but can’t even come near thoseresults when trading with real money.
Being permanently under stress, a trader can often make insuffi-ciently considered, impulsive, and, therefore, wrong decisions that resultin losses or premature liquidation of profitable positions, that is, in lostprofit. Sometimes, after a few successive failures with various trades,traders becomes fearful of the market. They are in a state of psychologicalstupor, and even a simple market situation may cause panic. They cannotovercome their emotions or soberly evaluate the current situation, andthey are unable to make any decision—reasonable or otherwise. In manycases when the market situation shifts against the trader’s position, theycan only passively watch the growth of their losses, because they are un-able to make any decision at all. Often, after the market stabilizes andtraders have the opportunity to calmly analyze daily diagrams of currencyfluctuations, they come to the conclusion that the main cause of failurewas not the lack of knowledge or training but their own emotions. How-ever, the situation cannot be reversed. Time has passed, money has beenlost, and everything should be begun again.
Another problem that causes severe and even catastrophic conse-quences is the trader’s wishful thinking. In this case, traders are sure thattheir forecast of market trends is solely correct. They feel the market can-not and should not give any surprises. They do not consider other optionsthat could be helpful or they think of other options in a vague and uncer-tain form. Sometimes, traders consider a market shift against their posi-tion as short-term and temporary. They begin to average their positions.They acquire new contracts at a lower price in the hope that the marketsituation will come back, and all the positions will become highly prof-itable. Afterwards, as the situation worsens, they will be able to come outof the market without serious losses. Being sure they are right, traderslose the ability to critically evaluate the condition of the market and ac-cordingly their own position in the market. In this case, they consider onlythose basic and technical features that justify their wishful thinking, andthey discard the contradicting features. This wishful thinking costs themdearly and can lead to psychological frustration. The market’s “wrong be-havior” not only deprives traders of a certain amount of money and oftenruins their trading account, but also undermines their self-esteem andtheir hopes of being a winner in the trading battle.
28 DEVELOPING A TRADING METHOD
ccc_beat_027-032_ch04.qxd 6/8/06 2:33 PM Page 28
After such a loss, traders blame themselves, repeatedly going throughthe details of the unsuccessful trade. They blame the market for the“wrong behavior” or themselves for errors in what then seems an ab-solutely clear situation. Sometimes, the trader-market relationship takesthe form of a vendetta. Traders consider the market as their personal en-emy, treat it in an unfriendly way (even with hate) and dream of immediaterevenge. Doing so, they miss the fact that they are essentially blaming na-ture for changing sunny weather to rain. It is very important to be preparedbeforehand for this change. Trades should always have close at hand oneor a few options in case of sudden change of the situation/weather, so thattheir foresight assures their good time or good profit.
The third main psychological problem is trader uncertainty, especiallywhen traders are inexperienced in abilities and skills—specifically abouteach market position they hold. Immediately after each position is openedand a money contract is bought, traders start questioning their choices.This is revealed most vividly in the case of a moderately active market atthe moment of fluctuations close to the opening price of the position. Anymovement (even insignificant) against their position causes traders tohave an irresistible desire to sell the recently acquired contract to limitlosses, until it is too late and the market does not shift too far away fromtheir position opening price. On the other hand, an insignificant marketshift in the desirable direction causes the same desire to eliminate the po-sition, until it provides for any (even tiny) profit and before this profitdoes not turn into losses.
Scared and troubled traders rush and race about. They open and liqui-date their positions too often, and experience many small losses andgains. Within a short period of time, they turn intermittently into bulls orbears. As a result, they suffer losses on a dealer’s spread and/or commis-sions when there were no significant market changes, and all the marketfluctuations were no more than just regular market “noise.” Such lossesare typical for beginners and individual traders with small investment cap-ital or little experience and insufficient psychological preparation.
Not uncommon are cases of traders’ impulsive decisions on trading,without any plans or serious preliminary market analysis. The position isopened under an impulsive, invalid emotional reaction. Often, it can beexplained by traders’ fears of losing a brilliant opportunity to earn moneythey think is being offered by the market at that moment. I have witnessedthese attempts to jump onto the last carriage of a departing train, andsuch attempts have ruined a lot of traders. Many traders cannot calmlywatch any kind of market movements. Some of my students have con-firmed this reality. If they have no positions at the moment of more or lesssignificant market movement, they consider it as a lost opportunity to gainprofit. This can inflict a serious shock to them.
Psychological Challenges of Speculative Trading 29
ccc_beat_027-032_ch04.qxd 6/8/06 2:33 PM Page 29
When they have no position, they seem unable to realize that eachmarket movement can be considered both ways, and the opposite situa-tion can quite possibly develop. Statistics show that, at each market move-ment, the chances to lose are much higher than to profit. How does ithappen that reasonable people (who in everyday life, without any emo-tion, can watch a bank cashier counting other people’s money) considerthe fact of market movement as a threat to their own pockets? Why isother people’s money in the hands of a bank cashier not considered as alost profit, whereas capital shift on the market and the correspondingquote fluctuations are the causes of negative emotions? I think the answeris in the illusory simplicity of business itself, which is considered by manypeople as a good and simple opportunity to earn a lot of easy money. Sim-ilar notions are widely spread among novice currency traders. The soontraders abandon such ideas, the sooner they become professionally effi-cient traders.
The most difficult problem for every trader (regardless of their experi-ences) is to learn as quickly as possible how to recover quickly fromlosses, which are inevitable in this business. At the same time, they mustlearn to handle shocks and psychological damage inflicted by the losses,because these situations could negatively influence their future work.
The losses themselves and the fear of losing, both of which perma-nently torture traders, negatively influence their ability to make reasonabledecisions in a complicated situation. These factors also undermine traders’ability to follow their own rules about trade strategies and systems.
I have become personally acquainted with hundreds of traders andhave watched their activities. I have taught many students, and have had myown experience as a trader at various steps of my career in the currencymarket. Therefore, I have come to the conclusion that the main causes oftrader failures in speculative operations in the FOREX market are without adoubt those associated with psychological trauma—the inability to controltheir own emotions and to find an adequate way to fight stress.
I have explored ways of solving the psychological problems that arisefrom operations in the FOREX market, with the focus on increasing self-resistance to stressful situations and increasing trade effectiveness. As aresult of my research, I have managed to develop a trading method thatalso helps to withstand shocks and keep emotions under control. To solvethe problem of stress, I had to separate the problem into several parts andsolve them one by one.
First, it was necessary to develop the philosophical conception of myattitude toward market situations. By this I mean not only the generaltrade methods, which are discussed in the second part of the course, butalso my own conception of the market and associated psychological prob-lems, which most traders (including myself) have to overcome daily. The
30 DEVELOPING A TRADING METHOD
ccc_beat_027-032_ch04.qxd 6/8/06 2:33 PM Page 30
following formula is essential for my conception: I can’t be wrong if I don’thave an opinion.
I had this in mind as I thought about how to avoid unwanted stressand emotions that are associated with trading. When you find a way tomake reasonable decisions not based on your own opinion about futuremarket trends but in accordance with certain market signals, the problemof diminishing and almost completely eliminating psychological pressureand stress will be solved. The key issue in this case is a philosophical atti-tude about market trends—they are natural phenomena beyond humancontrol and forecast.
The trick was to develop a secure and effective trade strategy thatcould advantageously use these natural phenomena. This formula seemedlogical and could provide the basis for the development of a conceptualtrading strategy. In reality, however, this job took considerable time. Nev-ertheless, the formula was used as a base for the development of my sys-tem-trade methods that I called the method of discrete-systematic trading.
Moving from the basic formula and general philosophical ideathrough intermediate conclusions, I came to the development of the trademethod. This method provides for trading practically without emotions,and it became a very effective and profitable tool to earning money in cur-rency speculations.
The logical chain of my arguments and intermediate conclusions isthe following:
Idea 1. The main source of negative emotions and stresses is the un-fulfilled trader’s forecast, based on the trader’s notion about marketfuture trends.
Idea 2. To avoid unnecessary emotions and psychological pressure, itis better to completely abandon any notion about market futuretrends because this notion itself forms the forecast, which could bewrong.
Idea 3. The basic idea of the formula “I cannot be wrong if I don’t havean opinion” transfers the moral obligation for trading results from thetrader to the market. Now, the fluctuation of the market can be con-sidered as a manifestation of the so-called “God’s Will” or “Force ofNature,” so the trader cannot be responsible for that.
Idea 4. It is possible to abandon attempts to make forecasts and stillhave a profit only if one stops trying to foresee market trends but fol-lows them instead.
Idea 5. It is possible to follow market fluctuations using only the sys-tem-trade method and developing a trading strategy providing effec-tive monitoring of these fluctuations.
Psychological Challenges of Speculative Trading 31
ccc_beat_027-032_ch04.qxd 6/8/06 2:33 PM Page 31
Idea 6. One of the best methods of this approach could be the one pro-viding the objective evaluation of the possibility of the market’s move-ments at any moment in both possible directions.
Following this simple thought pattern, I was able to come to a final con-clusion, which is shown in the box that follows.
32 DEVELOPING A TRADING METHOD
Conclusion
The easiest way of solving psychological problems is to abandon attemptsto trade on the basis of personal notion and forecast. Only the systemtrade, while making decisions automatically according to the preset plan,provides this opportunity. Turning to the system trade helps to solve theproblem by decreasing psychological pressure on the trader and avoidinga lot of mistakes associated with psychological stress. The system trade it-self not only helps traders to make operational decisions to increase profit;it also provides great psychological comfort necessary for the trader.
ccc_beat_027-032_ch04.qxd 6/8/06 2:33 PM Page 32
33
CHAPTER 5
Discretionaryversus
MechanicalTrading Systems
Utilizing a mechanical trading-system trade not only helps traders tomake decisions and increase the profit, but also provides great psy-chological comfort for the trader.
There is nothing especially new in the conclusion of the previouschapter. The main idea is that I realized the necessity of switching to thesystem trade to try to lower the great psychological pressure I experi-enced when making every market transaction.
In reality, all traders use one or another system approaches to a trade;some of them use discrete methods whereas others prefer mechanicaltrade systems. However, the mechanical system lacks fundamental analy-sis elements, and the mechanical system’s set of rules can easily be trans-formed into computer software. The system then can generate tradingsignals easy understandable by each trader having access to the system.The creator of such a mechanical system then becomes just a user of asystem monitoring the computer-generated signals. The creative workends after the system has been developed. In everyday life, the discretetrader can be compared to an artist (each time composing a new piece ofart), whereas a system trader using a mechanical system is more like acraftsman (each time copying a masterpiece created by him- or herself orsomeone else).
Besides the many traders using their own trade systems, there aremany actively developing market systems for sale as computer pro-grams—the so-called gray and black boxes. Their prices vary widely, froma few hundred dollars to hundreds of thousands of dollars. Sometimes,these programs are developed for a certain corporation or bank. The only
ccc_beat_033-036_ch05.qxd 6/8/06 2:34 PM Page 33
significant thing about any program is that the trader should be able to ac-complish transactions in accordance with the signals generated by thecomputer software.
Considering the possibility of joining one or another group of traders,I had to analyze all the advantages and disadvantages of different ap-proaches to trade. At first, I paid attention to the fact that the majority ofsuccessful individual traders I knew were using self-developed mechani-cal trade systems. The majority of unsuccessful individual traders usesome sort of discrete trade method. Comparative analysis of the advan-tages and disadvantages of each approach gave me the ability to deter-mine the causes of this situation. The comparative analysis also revealedthe advantages and disadvantages of both approaches. You can conductyour own investigations, but I will share the conclusions that helped memake the decision to develop my own trading method.
The discrete method is known for the following two advantages:
1. Quick adaptability to market trend changes, which allows flexibility inchoosing trade strategy and tactics corresponding to the current mar-ket condition;
2. Possibility to customize the same trading technique, considering theindividual abilities of each trader such as size of his trading accountand the time spent in trading operations.
The main, very serious disadvantage of the discrete approach is theunstable trade results due to the stress factors influencing the trader. Inthis case, the trader’s mood and the state of his health are the primary im-portance and greatly influence the outcome of each trade.
Usually, a mechanical system used in trading almost completely elimi-nates the stress factor and reduces negative pressure on a trader, which isobviously a positive factor. However, it also prevents the trader fromquick adjustment of trade tactics in the case of the market changing someof its characteristics. It doesn’t allow flexible customization of the tradingsystem in case other situations change, for example, change of the size ofthe trading account.
Because of these factors, I took a great interest in creating my owntrading method that would contain the advantages of both different ap-proaches, but would not have their disadvantages.
Before proceeding to this task, I had to formulate this task accurately.If the final goal is known precisely, then the way to reach it is much easier.That is why I began to build my method by formulating the requirementsfor it, which could be used as a basis for trading systems developed in ac-cordance with my goals and tools available.
34 DEVELOPING A TRADING METHOD
ccc_beat_033-036_ch05.qxd 6/8/06 2:34 PM Page 34
In my mind, there are eight main requirements to the ideal tradingmethod:
1. It has to allow maximum adjustment to any trader’s psychologicalcharacter.
2. It should be universal, that is, effective and profitable regardless of amarket trend at any given moment or period of time.
3. The system structure must be simple and consist of logical and under-standable ready-to-use elements and units.
4. It has to generate specific price signals for the trader to open or closepositions at the levels chosen some time in advance.
5. It must leave some room for a trader’s creativity and allow the traderto choose certain tactical options in specific cases, so he would notconsider himself to be a dependent tool in his own trading system.
6. It has to have some degree of flexibility to let a trader modernize andadjust the system in accordance with periodically changing marketconditions, without violating the main principles and elements of thesystem’s structure.
7. The system should also relieve a trader from extra emotional and psy-chological stress, and make his job comfortable and routine.
8. It has to include a customization feature so different traders, regard-less of their experience, knowledge, training, size of trading account,and such could use the same method.
It would seem that these requirements for the trade method are ex-cessive. The experience of many traders using the systematic trade intheir operations shows that existing mechanical or other trading systemsare often unable to satisfy the complete list of the listed requirements. Forexample, many systems that are satisfactory in trend situations becomeineffective in a nontrending market. Change of market behavior couldlead to negative results from a previously effective trade system, whichobviously would then need replacement.
I am aware of many systems that are described by complex mathe-matical formulas, which are not completely understandable by a trader ifthe trader is not the author of the system. The common disadvantage ofvarious (mainly mechanical) trade systems is the negative balance be-tween profitable and unprofitable transactions. It is clear that the effec-tiveness of these systems can be maintained only in a case when theaverage profit of each transaction surpasses the average loss of each un-profitable trade.
Discretionary versus Mechanical Trading Systems 35
ccc_beat_033-036_ch05.qxd 6/8/06 2:34 PM Page 35
Corrections in many well-known systems in the process of the tradeare impossible. Therefore, the trader must accurately and unconditionallyfollow the initial demand enclosed into the system, without attempting toadjust it to the current market situation. The rejection of even a single ele-ment of the system leads to its complete ineffectiveness and failure.
The development of a single trade system satisfying all the aforemen-tioned requirements and fitting any state of the market seems difficult oreven impossible. I think the only way of satisfying these requirements isnot the development of a single trade system. Rather, it is necessary to de-velop a diversified system trade method consisting of a set of system unitsthat can be used as a basis for specific trade tactics at any given moment.It can be used according to a trader’s free choice and considering the indi-vidual situation. Trade systems based on these principles should be com-plex and adjustable. These factors are necessary to optimize thesystematic trading according to the current market situation and thetrader’s resources at any given moment. This optimization will provide theeffective evaluation of market shift and trends at any given moment. Theonly thing to do is to find the tools for this probability evaluation withmaximum accuracy and in minimum time. These ideas were then used asthe starting point for further development.
In the process of preliminary analysis of existing trading systems, Ipaid attention to the fact that purely statistical dependencies in most ofthe systems are considered as secondary factors. In cases with a high vol-ume of statistics, their true meaning is replaced by complicated mathe-matical calculations. I thought that if I managed to simplify andsystematize methods of statistical probability evaluation, then it would bepossible to develop the optimal trading technique combined with certainissues of technical and even fundamental analysis.
36 DEVELOPING A TRADING METHOD
ccc_beat_033-036_ch05.qxd 6/8/06 2:34 PM Page 36
37
CHAPTER 6
Technical andFundamental
Analysis
It would be unreasonable to try to invent something new without ana-lyzing everything already invented in this field with proven effective-ness and value. Previous experience has always been the basis for
further progress in any field of human activity, and trade is not the excep-tion. This chapter describes the process of choosing components for theestablishment of trading strategies and systems for the development ofthe discrete-systematic trading method using statistical dependencies.
The majority of traders who do not use system trade can be roughlydivided into two groups: the first group includes the proponents of amainly fundamental approach to market speculations; the second groupincludes traders making decisions based on technical analysis. There is athird (however not large) group of traders considering both approaches,but preferably using one of them. Disputes between the proponents ofvarious approaches are typical for the Internet forums where profession-als and amateurs meet to discuss urgent problems of the market. How-ever, these forums look like the principal dispute described in Gulliver’s
Travels, where the Lilliputian governments quarreled about the right endon which to crack eggs.
I consider these disputes useless, and I am sure that the positive re-sult itself is much more important than the means that helped to attain it.Both the fundamental and technical approaches in their classical formhave their own advantages and disadvantages, which are mainly avoidedor offset in the offered trading method. Let us begin with the problem fac-ing the proponents of both trade conceptions. In this chapter, I describesome paradoxes that are in my opinion worth thinking about.
ccc_beat_037-050_ch06.qxd 6/8/06 2:35 PM Page 37
ADVANTAGES AND DISADVANTAGES OF FUNDAMENTAL ANALYSIS
Despite the fact that the market moves mainly due to fundamental factors,the problem of fundamental analysis is not simple. A fundamental traderneeds to work hard to earn his bread. To carry out fundamental analysiseffectively, a trader needs to have a deep understanding of macroeconom-ics, international finances, and political and social processes. He needs toadequately evaluate certain events and consider their influence on a spe-cific currency rate, and he needs to forecast market trends in order to gainprofit from the results of previous political or economic changes. The in-fluence of each event or news should be estimated, considering all otherfactors affecting the market and a specific currency rate. However, evenskilled economists, financial experts, political scientists, and professionalmarket analysts are sometimes unable to complete this task. Also, the ma-jority of small individual speculators often cannot evaluate the impor-tance of a particular fundamental factor for the market.
In reality, market reaction to an obvious news event is often contradic-tory and unexpected. Chances of a correct forecast of market trends are in-versely proportional to the number of traders sharing the same point ofview. In other words, most traders are more often wrong than right in theirunderstanding of fundamental events and phenomena, and their forecast ofnear-future market movements based on the fundamental data is erroneous.
These are five paradoxes that I noticed regarding the issue of predict-ing the market.
Paradox 1
The vast majority of FOREX traders are unable (because of their limitedcompetence in macroeconomics and finances) to interpret correctly manyof the various fundamental factors influencing the market, but the specu-lative trade based on fundamental analysis is widespread among individ-ual traders-investors. Paradox 2 is interconnected with paradox 1.
Paradox 2
Despite the practical impossibility of forecasting market movements us-ing fundamental analysis, there is a simple, rational, and fundamental ex-planation of previous market events and shifts after all.
It is relatively simple for the individual speculative trader who watchesthe main economic data and has access to sources of financial information,to predict the general trend of economic development of various countries.Hence, it is simple to compare economic growth rates of two separate
38 DEVELOPING A TRADING METHOD
ccc_beat_037-050_ch06.qxd 6/8/06 2:35 PM Page 38
countries or regions. This allows the trader to determine the main trends inchanging national currency rates with greater probability. The disadvan-tage is the approximation used for the analysis, which is useless for short-term speculative operations because of the inaccurate determination oflevels of entering and exiting the market. This leads to the next paradox.
Paradox 3
The vast majority of traders use long-term global economic trends. Beingdeliberate or forced proponents1 of short-term speculations, they are un-able to benefit from their own long-term forecasts and analyses.
A trader wants to know exactly why the various events and marketmovements occur, but this knowledge cannot help him much. I think thequestion Why? is of less importance to a trader, and cannot be comparedto the importance of other questions that traders should answer beforemaking their decisions. Questions like Where? When? and How many?should be of more importance for a trader—especially those who tradeshort-term positions or are involved in daily trading. In many cases, infor-mation about various market movements is not important. If the traderwas late and did not take part in the previous movement, knowledge ofthe exact causes of the rate fluctuations does not help. Even if the prof-itable or unprofitable position was open at the moment of the marketmovement, the knowledge of the exact causes cannot help to reimburselosses or threaten the profit.
Sometimes, there could be certain exceptions to this rule, and theseexceptions do not upset the generally secondary importance of the ques-tion Why? Exceptions include situations in which the long-term influenceof news events on the market should be evaluated. Even in these rarecases, the trade operations based on the common sense method are possi-ble and preferable.
Paradox 4
Many traders, whom I know personally, usually spend much time discov-ering and discussing the causes of previous fluctuations in the money
Technical and Fundamental Analysis 39
1I call forced proponents of daily and short-term speculation those traders whosimply cannot afford long-term trade, despite their inclination to the positionaltrade. Their investment capital is not large enough to open and keep strategic po-sitions. In the positional trade, stop orders should be fixed at a considerable dis-tance from the initially opened position, and a single loss can completely ruin thetrading account if it’s a small one. Such traders often dream of multiplying the sizeof their trading account, so that they can switch into longer-term trading.
ccc_beat_037-050_ch06.qxd 6/8/06 2:35 PM Page 39
market. This knowledge has no practical value because by that time thetrain has gone and the market has already reacted to certain fundamentalstimuli and the exchange rate is adjusted accordingly.
ADVANTAGES AND DISADVANTAGES OF TECHNICAL ANALYSIS
The proponents of technical analysis and technical trading methods arenumerous—even though this science is relatively new. Their numbers growevery day, along with implantation of these revolutionary ideas into thearsenal of the vast majority of currency speculators. The founders of tech-nical analysis (such as John Murphy) stated that technical analysis couldbecome the only tool to forecast market movements and completely re-place fundamental analysis. The number of publications on this subject hasevolved, and now, even beginners can freely discuss head-and-shouldersformation. Technical analysis enjoys wide popularity among traders. Anycomputer software dealing with financial markets includes lots of indica-tors and other tools for technical analysis.
Technical indicators are used as the basis for the development of themajority of trade strategies and systems. Many traders skilled in mathemat-ics try to optimize existing indicators and oscillators, as well as to developnew ones. The so-called black and gray boxes, which are, in essence, soft-ware with input trade algorithms, are based on these technical elements.However, not everything is so clear and unclouded in technical analysis.The main difficulty of technical analysis is an uncertainty that allows inter-pretation of almost each specific market situation in several different ways.
Besides, the basic elements of technical analysis widely used in every-day work do not behave the same way as they were described in textbooksand publications. See Figure 6.1. This way, the market prevents everytrader (who has read the textbook and learned the scientific fundamentals)from profitable trading on the financial markets. Difficulties arise whentechnical analysis is used in daily short-term trading because of minor mar-ket fluctuations that, in essence, are just the market noise. This noise canbe compared with radio interference hindering clear reception. Unfortu-nately, the amplitude of this interference is too high to be ignored in short-term trading, and it disturbs the market harmony. See Figure 6.2.
Paradox 5
The forecast on markets with a minimum number of technical tradersamong other participants is much easier. For example, daily plots of theDJIA, NASDAQ, and S&P indices often provide a technical picture that is
40 DEVELOPING A TRADING METHOD
ccc_beat_037-050_ch06.qxd 6/8/06 2:35 PM Page 40
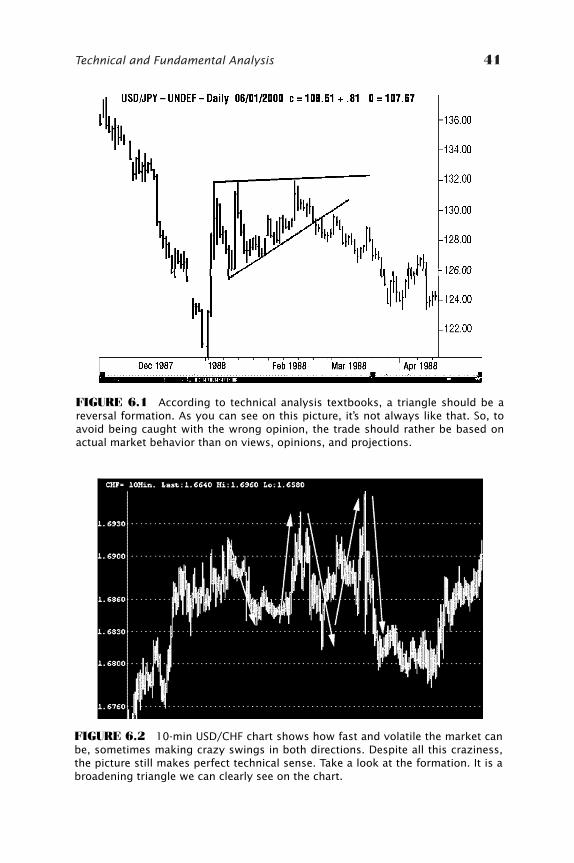
Technical and Fundamental Analysis 41
FIGURE 6.1 According to technical analysis textbooks, a triangle should be areversal formation. As you can see on this picture, it’s not always like that. So, toavoid being caught with the wrong opinion, the trade should rather be based onactual market behavior than on views, opinions, and projections.
FIGURE 6.2 10-min USD/CHF chart shows how fast and volatile the market canbe, sometimes making crazy swings in both directions. Despite all this craziness,the picture still makes perfect technical sense. Take a look at the formation. It is abroadening triangle we can clearly see on the chart.
ccc_beat_037-050_ch06.qxd 6/8/06 2:35 PM Page 41
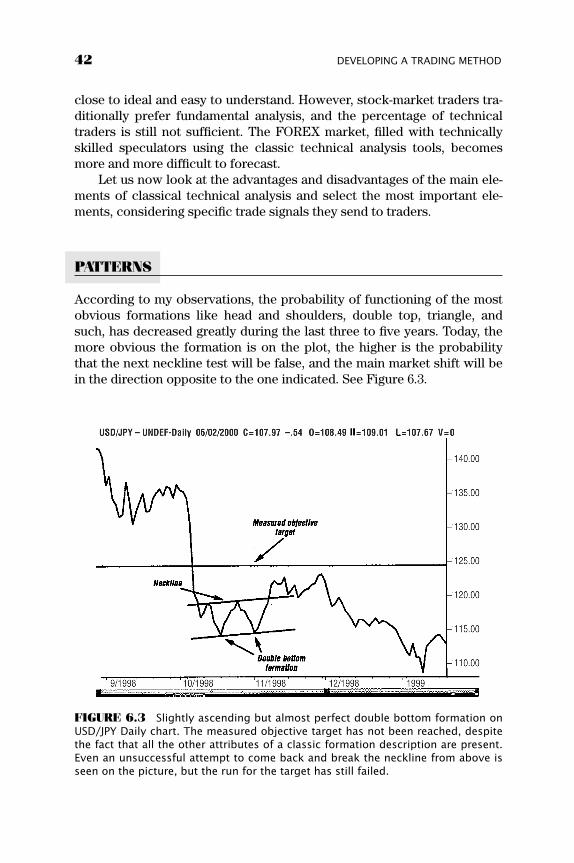
close to ideal and easy to understand. However, stock-market traders tra-ditionally prefer fundamental analysis, and the percentage of technicaltraders is still not sufficient. The FOREX market, filled with technicallyskilled speculators using the classic technical analysis tools, becomesmore and more difficult to forecast.
Let us now look at the advantages and disadvantages of the main ele-ments of classical technical analysis and select the most important ele-ments, considering specific trade signals they send to traders.
PATTERNS
According to my observations, the probability of functioning of the mostobvious formations like head and shoulders, double top, triangle, andsuch, has decreased greatly during the last three to five years. Today, themore obvious the formation is on the plot, the higher is the probabilitythat the next neckline test will be false, and the main market shift will bein the direction opposite to the one indicated. See Figure 6.3.
42 DEVELOPING A TRADING METHOD
FIGURE 6.3 Slightly ascending but almost perfect double bottom formation onUSD/JPY Daily chart. The measured objective target has not been reached, despitethe fact that all the other attributes of a classic formation description are present.Even an unsuccessful attempt to come back and break the neckline from above isseen on the picture, but the run for the target has still failed.
ccc_beat_037-050_ch06.qxd 6/8/06 2:35 PM Page 42
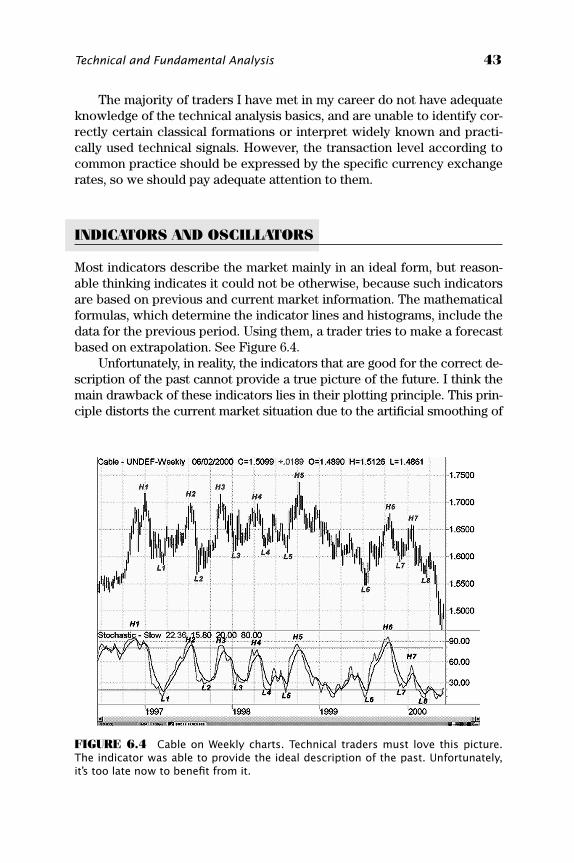
The majority of traders I have met in my career do not have adequateknowledge of the technical analysis basics, and are unable to identify cor-rectly certain classical formations or interpret widely known and practi-cally used technical signals. However, the transaction level according tocommon practice should be expressed by the specific currency exchangerates, so we should pay adequate attention to them.
INDICATORS AND OSCILLATORS
Most indicators describe the market mainly in an ideal form, but reason-able thinking indicates it could not be otherwise, because such indicatorsare based on previous and current market information. The mathematicalformulas, which determine the indicator lines and histograms, include thedata for the previous period. Using them, a trader tries to make a forecastbased on extrapolation. See Figure 6.4.
Unfortunately, in reality, the indicators that are good for the correct de-scription of the past cannot provide a true picture of the future. I think themain drawback of these indicators lies in their plotting principle. This prin-ciple distorts the current market situation due to the artificial smoothing of
Technical and Fundamental Analysis 43
FIGURE 6.4 Cable on Weekly charts. Technical traders must love this picture.The indicator was able to provide the ideal description of the past. Unfortunately,it’s too late now to benefit from it.
ccc_beat_037-050_ch06.qxd 6/8/06 2:35 PM Page 43
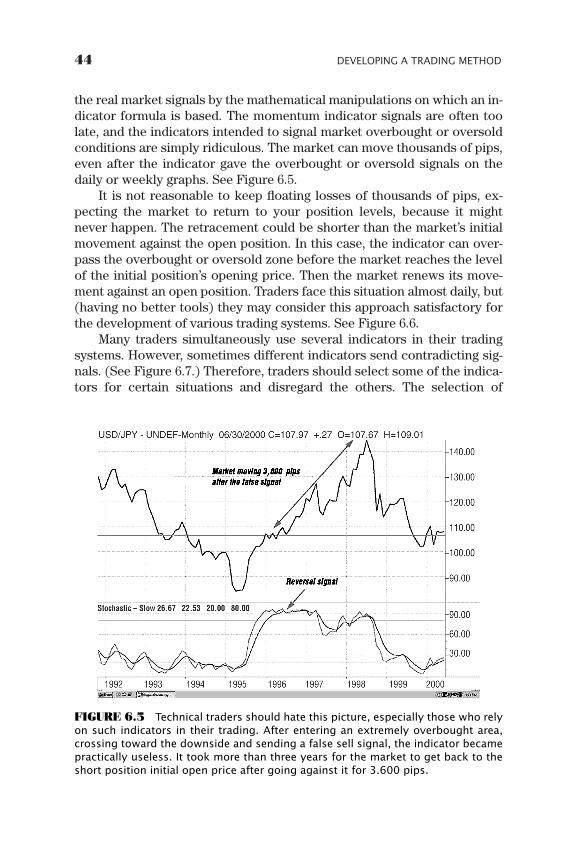
the real market signals by the mathematical manipulations on which an in-dicator formula is based. The momentum indicator signals are often toolate, and the indicators intended to signal market overbought or oversoldconditions are simply ridiculous. The market can move thousands of pips,even after the indicator gave the overbought or oversold signals on thedaily or weekly graphs. See Figure 6.5.
It is not reasonable to keep floating losses of thousands of pips, ex-pecting the market to return to your position levels, because it mightnever happen. The retracement could be shorter than the market’s initialmovement against the open position. In this case, the indicator can over-pass the overbought or oversold zone before the market reaches the levelof the initial position’s opening price. Then the market renews its move-ment against an open position. Traders face this situation almost daily, but(having no better tools) they may consider this approach satisfactory forthe development of various trading systems. See Figure 6.6.
Many traders simultaneously use several indicators in their tradingsystems. However, sometimes different indicators send contradicting sig-nals. (See Figure 6.7.) Therefore, traders should select some of the indica-tors for certain situations and disregard the others. The selection of
44 DEVELOPING A TRADING METHOD
FIGURE 6.5 Technical traders should hate this picture, especially those who relyon such indicators in their trading. After entering an extremely overbought area,crossing toward the downside and sending a false sell signal, the indicator becamepractically useless. It took more than three years for the market to get back to theshort position initial open price after going against it for 3.600 pips.
ccc_beat_037-050_ch06.qxd 6/8/06 2:35 PM Page 44
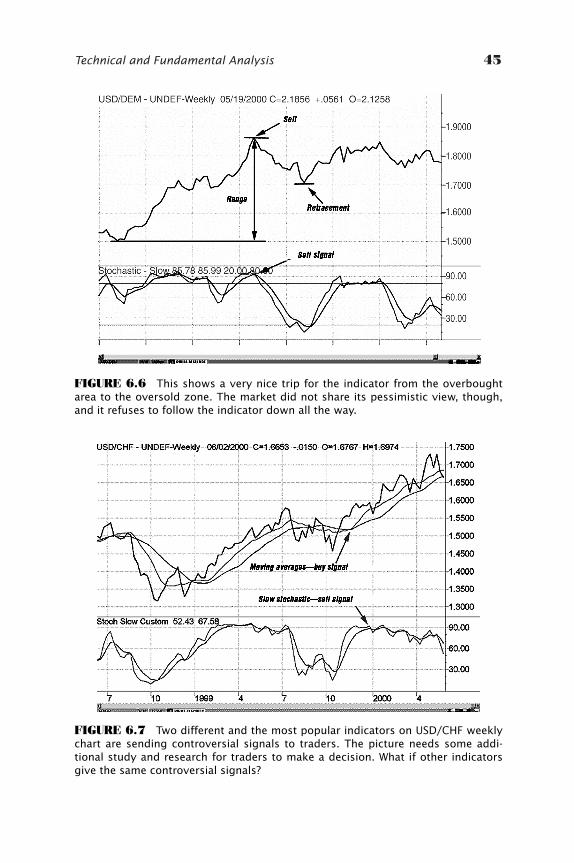
Technical and Fundamental Analysis 45
FIGURE 6.6 This shows a very nice trip for the indicator from the overboughtarea to the oversold zone. The market did not share its pessimistic view, though,and it refuses to follow the indicator down all the way.
FIGURE 6.7 Two different and the most popular indicators on USD/CHF weeklychart are sending controversial signals to traders. The picture needs some addi-tional study and research for traders to make a decision. What if other indicatorsgive the same controversial signals?
ccc_beat_037-050_ch06.qxd 6/8/06 2:35 PM Page 45
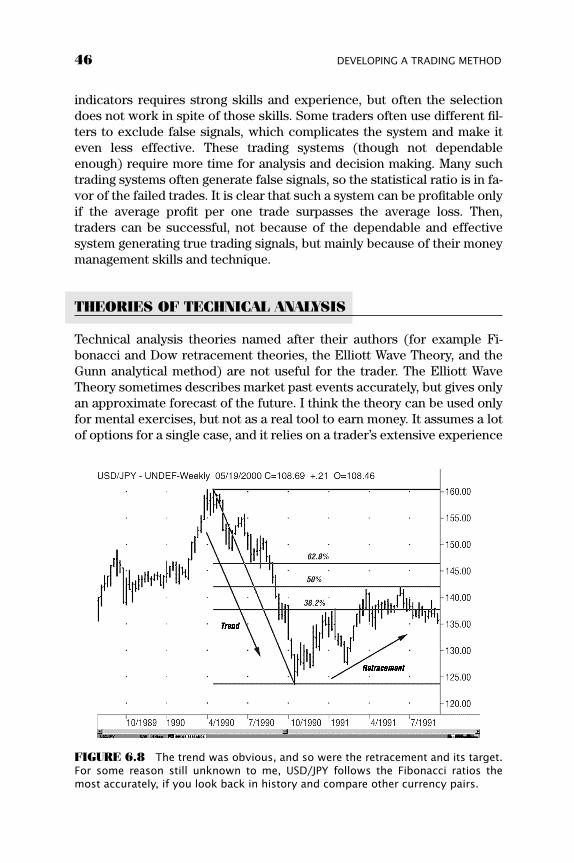
indicators requires strong skills and experience, but often the selectiondoes not work in spite of those skills. Some traders often use different fil-ters to exclude false signals, which complicates the system and make iteven less effective. These trading systems (though not dependableenough) require more time for analysis and decision making. Many suchtrading systems often generate false signals, so the statistical ratio is in fa-vor of the failed trades. It is clear that such a system can be profitable onlyif the average profit per one trade surpasses the average loss. Then,traders can be successful, not because of the dependable and effectivesystem generating true trading signals, but mainly because of their moneymanagement skills and technique.
THEORIES OF TECHNICAL ANALYSIS
Technical analysis theories named after their authors (for example Fi-bonacci and Dow retracement theories, the Elliott Wave Theory, and theGunn analytical method) are not useful for the trader. The Elliott WaveTheory sometimes describes market past events accurately, but gives onlyan approximate forecast of the future. I think the theory can be used onlyfor mental exercises, but not as a real tool to earn money. It assumes a lotof options for a single case, and it relies on a trader’s extensive experience
46 DEVELOPING A TRADING METHOD
FIGURE 6.8 The trend was obvious, and so were the retracement and its target.For some reason still unknown to me, USD/JPY follows the Fibonacci ratios themost accurately, if you look back in history and compare other currency pairs.
ccc_beat_037-050_ch06.qxd 6/8/06 2:35 PM Page 46
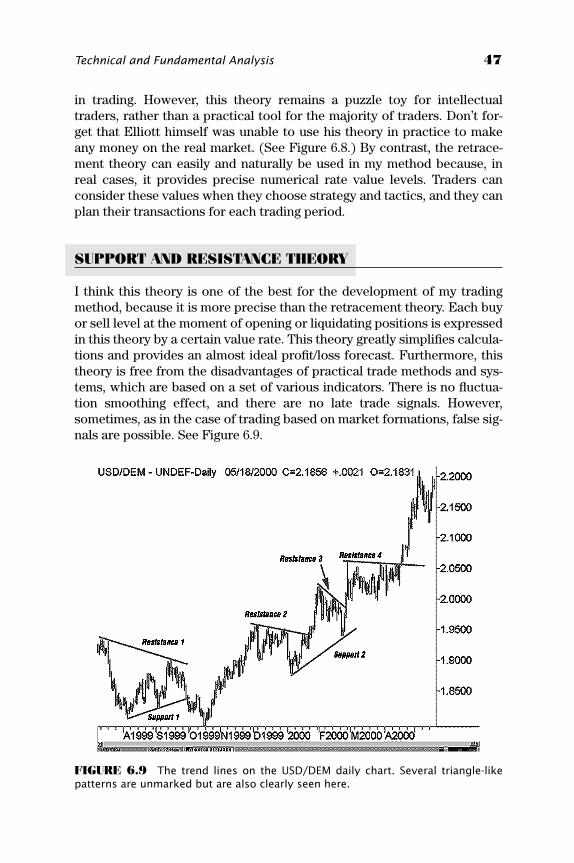
in trading. However, this theory remains a puzzle toy for intellectualtraders, rather than a practical tool for the majority of traders. Don’t for-get that Elliott himself was unable to use his theory in practice to makeany money on the real market. (See Figure 6.8.) By contrast, the retrace-ment theory can easily and naturally be used in my method because, inreal cases, it provides precise numerical rate value levels. Traders canconsider these values when they choose strategy and tactics, and they canplan their transactions for each trading period.
SUPPORT AND RESISTANCE THEORY
I think this theory is one of the best for the development of my tradingmethod, because it is more precise than the retracement theory. Each buyor sell level at the moment of opening or liquidating positions is expressedin this theory by a certain value rate. This theory greatly simplifies calcula-tions and provides an almost ideal profit/loss forecast. Furthermore, thistheory is free from the disadvantages of practical trade methods and sys-tems, which are based on a set of various indicators. There is no fluctua-tion smoothing effect, and there are no late trade signals. However,sometimes, as in the case of trading based on market formations, false sig-nals are possible. See Figure 6.9.
Technical and Fundamental Analysis 47
FIGURE 6.9 The trend lines on the USD/DEM daily chart. Several triangle-likepatterns are unmarked but are also clearly seen here.
ccc_beat_037-050_ch06.qxd 6/8/06 2:35 PM Page 47
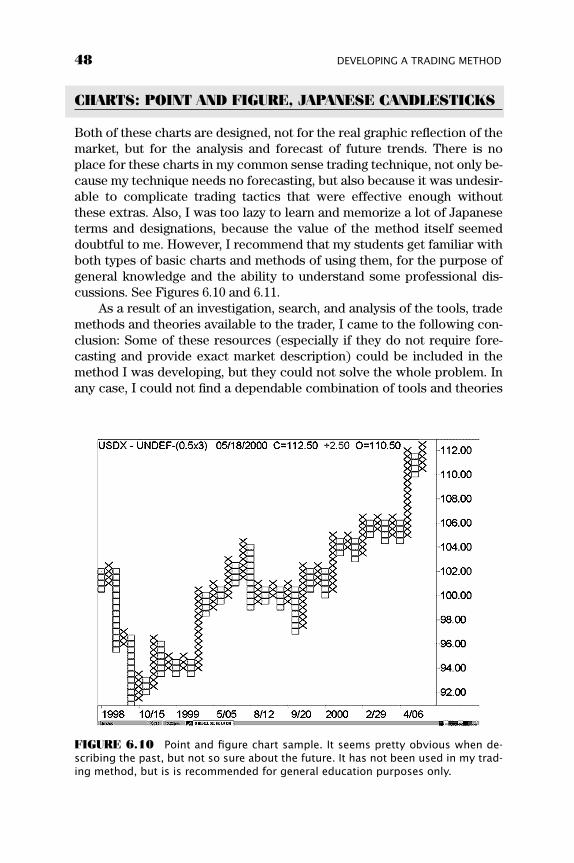
CHARTS: POINT AND FIGURE, JAPANESE CANDLESTICKS
Both of these charts are designed, not for the real graphic reflection of themarket, but for the analysis and forecast of future trends. There is noplace for these charts in my common sense trading technique, not only be-cause my technique needs no forecasting, but also because it was undesir-able to complicate trading tactics that were effective enough withoutthese extras. Also, I was too lazy to learn and memorize a lot of Japaneseterms and designations, because the value of the method itself seemeddoubtful to me. However, I recommend that my students get familiar withboth types of basic charts and methods of using them, for the purpose ofgeneral knowledge and the ability to understand some professional dis-cussions. See Figures 6.10 and 6.11.
As a result of an investigation, search, and analysis of the tools, trademethods and theories available to the trader, I came to the following con-clusion: Some of these resources (especially if they do not require fore-casting and provide exact market description) could be included in themethod I was developing, but they could not solve the whole problem. Inany case, I could not find a dependable combination of tools and theories
48 DEVELOPING A TRADING METHOD
FIGURE 6.10 Point and figure chart sample. It seems pretty obvious when de-scribing the past, but not so sure about the future. It has not been used in my trad-ing method, but is is recommended for general education purposes only.
ccc_beat_037-050_ch06.qxd 6/8/06 2:35 PM Page 48
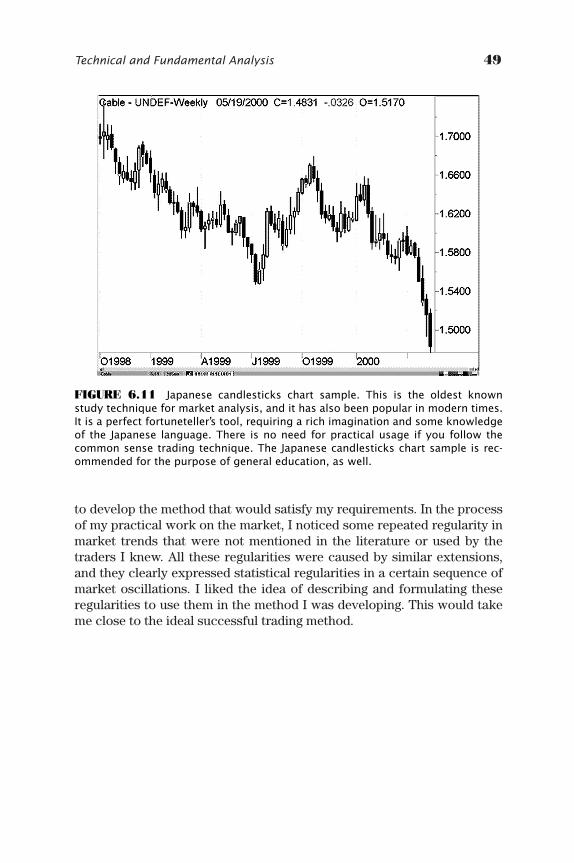
to develop the method that would satisfy my requirements. In the processof my practical work on the market, I noticed some repeated regularity inmarket trends that were not mentioned in the literature or used by thetraders I knew. All these regularities were caused by similar extensions,and they clearly expressed statistical regularities in a certain sequence ofmarket oscillations. I liked the idea of describing and formulating theseregularities to use them in the method I was developing. This would takeme close to the ideal successful trading method.
Technical and Fundamental Analysis 49
FIGURE 6.11 Japanese candlesticks chart sample. This is the oldest knownstudy technique for market analysis, and it has also been popular in modern times.It is a perfect fortuneteller’s tool, requiring a rich imagination and some knowledgeof the Japanese language. There is no need for practical usage if you follow thecommon sense trading technique. The Japanese candlesticks chart sample is rec-ommended for the purpose of general education, as well.
ccc_beat_037-050_ch06.qxd 6/8/06 2:35 PM Page 49

ccc_beat_037-050_ch06.qxd 6/8/06 2:35 PM Page 50
PART III
The Igrok Method
The basic principle of the “Igrok Discrete-Systematic Method” (which Ioften call the common sense trading technique) can be stated brieflyas follows: To speculate successfully on the FOREX market, traders
should master a trading technique based on natural and statistically justi-fied patterns of market behavior, to be able to effectively follow the mar-ket fluctuations without the necessity to foresee or forecast. The optimalsolution could be a trading system based on natural market features andregularities.
Thus, I state that successful and consistent trading results can beachieved by investigating natural market features, and by using purely sta-tistical estimation methods of market movement probability in any direc-tion at a given moment. This probability estimation is based on thestandard set of templates projected on the current currency chart. If a tem-plate coincides with the current market situation, I make the decision toenter the market. In every case, each trading position on the market is cho-sen in the most probable direction of the movement, which provides a pos-itive statistical balance in favor of profitable trades. In this chapter, wediscuss which features and regularities can be considered as natural mar-ket activities.
51
ccc_beat_051-052_pt03.qxd 6/8/06 2:35 PM Page 51

ccc_beat_051-052_pt03.qxd 6/8/06 2:35 PM Page 52
53
CHAPTER 7
Philosophyof the
Igrok Method
It is known that the technical analysis philosophy is based on threemain statements:
1. The market considers everything.
2. The market moves in accordance with trends.
3. History repeats itself.
Although I accept and share these statements, I offer my own philo-sophical conception on the basis of which I developed my trading methodbased on common sense. In general, it does not contradict technicalanalysis principles, rather it supplements them.
The following three main postulates are the philosophical basis of thenew method and supplement the philosophical principles of technicalanalysis:
1. There are only two possible directions of a market movement.
2. The market moves permanently.
3. The market forms its trading range daily.
THERE ARE ONLY TWO POSSIBLE DIRECTIONS OF A MARKET MOVEMENT
Most traders do not fully realize this obvious statement. Somehow, it evencontradicts the opinion widely held by traders that the side trend of mar-
ccc_beat_053-058_ch07.qxd 6/8/06 2:36 PM Page 53
ket movement is a kind of third direction. However, on close examination,this side trend only occurs when there are alternating oscillations: up ordown. The paradox is that the majority of traders cannot use that simplephenomenon to benefit from it. However, if you think about it, an accept-able trade strategy can be developed on the basis of this statement alone.
Some inferences from the first postulate turn out to be very importantin benefiting from market rate fluctuations. Let us use common sense andelementary logic to formulate and then analyze some of these inferencesaccording to their primary practical importance.
I consider the fact that there are only two possible directions of mar-ket movement very important because this limits the market options ofreducing a trader’s money. At any given moment, the trader has a mini-mum 50 percent statistical probability opening a new position in the rightdirection.
Here, I have to make a brief detour and somehow explain my positionabout a skeptic’s opposite point of view about the same fact. Why shouldwe consider the 50 percent probability of market movement in either di-rection as a negative factor, whereas the same probability about the traderis taken as positive? The reason for this seemingly contradiction is verysimple. We consider the market behavior as primary and the trader reac-tion as secondary because, in making decisions and taking positions, thetrader only responds to market changes.
So denying the assumption that trader activity causes market ratefluctuations, I suggest considering the market as spontaneously changingunder the influence of factors unknown and unrecognized by us. Then, itcan be concluded that a trader could survive in this environment only if headjusts to these conditions. He should not try to dictate his will to themarket, but only explore the ability to benefit from some of the market’sfeatures. One of these features is the market’s ability to move in either ofjust two possible directions.
If this statement is taken as a starting point, one thing is clear. For aspeculative trade on the FOREX or on any other market, it is necessary toknow that the statistical probability of all trade results should exceed 50percent to the trader’s benefit in order for the final result to be positive.(This assumes the condition that the average profit per any successfultrade exceeds the average loss per any unsuccessful trade). In fact, itwould be reasonable to conclude that, to get generally positive statisticalresults, the initial probability of achieving success from any new positionopened by the trader should exceed 50 percent. Positive statistical resultsneed an effective evaluation method for this objective probability calcula-tion at any given moment. For the development of such a probability eval-uation system, the following statements (which are the basis of thismethod) are of primary importance.
54 THE IGROK METHOD
ccc_beat_053-058_ch07.qxd 6/8/06 2:36 PM Page 54
A MARKET IS IN CONSTANT MOTION
This statement means that if a market is not moving in one direction, thenit is moving in the opposite direction. In other words, a market’s motion-less state is practically impossible. Any position opened in any directioncannot keep the trader uninformed about the result for a long time; in afew minutes or hours it will generate either an essential profit or an essen-tial loss.
An essential profit now and later means a profit equal to or exceeding25 percent of each trade’s trading capital (or initial margin). For the majorcurrency rates at an initial margin of 2 percent, it equals $500 for any min-imal standard contract of $100,000.
Because of specifics of money market trends, substantial fluctuationamplitude of each trend is a rule, whereas a narrow and more or less con-tinuous side trend is rather rare. Any taken position may generate profit orloss in a few days, which will be several times more than the initial marginsize. This particular feature of the money market allows everybody to con-duct a very interesting experiment/investigation. First, you should picturetwo parallel lines at a distance of 50 to 70 or even 100 pips from eachother, drawn on a randomly chosen area of a chart showing the prehistoryof any of the major currency rates (distinguished by their almost ideal liq-uidity and highest activity). Then, imagine that every time the marketcrosses this line in the upward direction, we open a long position. Then,imagine that every time the market crosses this line in its downward di-rection, we open our short position. In other words, the open short posi-tion is always below the lower line, and the open long position is alwaysabove the upper line. See what happens next. This simple experimenthelps to explain that, regardless of the initially opened position, this ac-tion will immediately bring a substantial, progressing profit. In anotherscenario, closed with a loss and being reversed in the opposite direction,the new position would sooner or later generate the same profit; or, as aminimum, would cover the initial losses by the subsequent profit. In thiscase, the multiple market movements up and down crossing the drawnhorizontal lines on the charts will cover the initial loss or any possible se-ries of consecutive losses. This is true even if the zone we use is optionaland we choose it in the very middle of any real horizontal trend seen inthe past—even the most prolonged in the trading history of any major cur-rency pair. See Figure 7.1.
There is a logical conclusion based on this simple experiment/investi-gation: Any random position opened at any randomly chosen price will al-low the trader either to get a substantial profit immediately or to be in abreak-even situation after a relatively short series of simple, automaticallyperformed transactions.
Philosophy of the Igrok Method 55
ccc_beat_053-058_ch07.qxd 6/8/06 2:36 PM Page 55
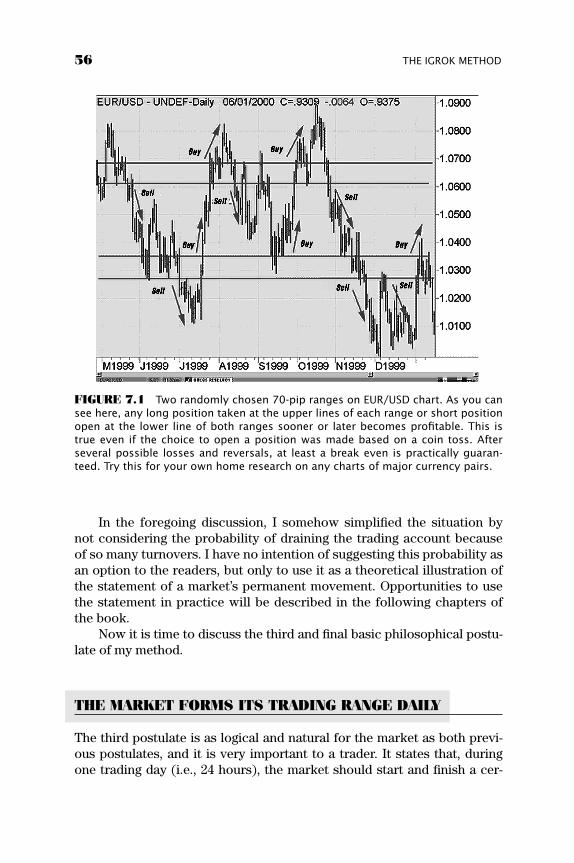
In the foregoing discussion, I somehow simplified the situation bynot considering the probability of draining the trading account becauseof so many turnovers. I have no intention of suggesting this probability asan option to the readers, but only to use it as a theoretical illustration ofthe statement of a market’s permanent movement. Opportunities to usethe statement in practice will be described in the following chapters ofthe book.
Now it is time to discuss the third and final basic philosophical postu-late of my method.
THE MARKET FORMS ITS TRADING RANGE DAILY
The third postulate is as logical and natural for the market as both previ-ous postulates, and it is very important to a trader. It states that, duringone trading day (i.e., 24 hours), the market should start and finish a cer-
56 THE IGROK METHOD
FIGURE 7.1 Two randomly chosen 70-pip ranges on EUR/USD chart. As you cansee here, any long position taken at the upper lines of each range or short positionopen at the lower line of both ranges sooner or later becomes profitable. This istrue even if the choice to open a position was made based on a coin toss. Afterseveral possible losses and reversals, at least a break even is practically guaran-teed. Try this for your own home research on any charts of major currency pairs.
ccc_beat_053-058_ch07.qxd 6/8/06 2:36 PM Page 56
tain trading range. This range can be simply calculated based on an analy-sis of each currency rate’s behavior on the preceding day even for a rela-tively short period. In other words, for any currency rate, there is theso-called daily operational task to fluctuate with amplitude of a certainvalue. This minimum to average fluctuation amplitude is not the same fordifferent currency pairs. Also, from time to time, it deviates for the samecurrency pair, depending upon market activity due to cyclic oscillations.Nevertheless, the intraday fluctuations mean amplitude is more or lessstable for each cycle. The duration of each cycle is measured in months,optimally providing the base for the approximate calculations of the mini-mum to average fluctuation amplitude. This calculation allows a trader toconduct an approximate advance forecast for the current day.
The practical use of the three basic postulates of the method will bediscussed in subsequent parts and chapters of this book.
After creation of a philosophical basis of the method, formulating thebasics strategy and tactics of a speculative trade was an easy job for me. Itinvolves six steps:
1. The fundamental nature of the exchange rates’ fluctuations is not de-nied by the method, but in practice it is not taken into considerationbecause it does not directly affect the trader’s one and only goal,which is to gain speculative profit on the basis of these fluctuations.
2. The basis of the method is the trader’s reaction to trading signals gen-erated by the market itself. The application of substitute and artificialderivatives such as indicators, oscillators, and other man-made instru-ments is essentially limited in this method. (In reality, for the marketanalysis, I use only two or three indicators, which have no indepen-dent significance and serve only to confirm basic signals in accor-dance with the principles of my trade methods.)
3. The signal’s identification on a buy and sell is based on a set of marketbehavioral models. The trade takes place when one of the tradingtemplates corresponds with a current market situation.
4. The templates represent a set of standard variants of a trader’s ac-tions executed in a certain sequence.
5. The basis of all templates used in the method is the estimation of a mar-ket movement probability in one or the other direction. The estimationof probability is made with the use of some rules of technical analysiscombined with money management elements in each of the templates.
6. Sometimes there is a possibility of using several different templates inthe same specific market situation. In this case, a final choice dependson the trader’s will, his individual desire to undertake an increasedrisk in exchange for an opportunity to gain an essential profit.
Philosophy of the Igrok Method 57
ccc_beat_053-058_ch07.qxd 6/8/06 2:36 PM Page 57
It is clear that the trader’s basic task is to be on the right side of the mar-ket at the right moment. Basically, it is supposed to be his only concern.
My trade method is based on probability evaluation of the market fu-ture behavior, which, as stated earlier, represents a set of templates thatare formulated in advance and then tested. The trade does not occur untilone of the templates corresponds with a current market situation. If andwhen a template corresponds with the real market situation, the decisionto open or to liquidate a position will be taken by trader almost automati-cally. In addition to some elements taken from technical analysis, I alsoapply some issues concerning money management. They are an impor-tant part of a trade strategy and serve as the additional insurance in theevent that the signal subsequently appears false and the market changesits direction.
Therefore, it is possible to tell that different templates representcombinations of trade signals received on the basis of the technicalanalysis, estimation of probability of common statistical laws, and moneymanagement.
58 THE IGROK METHOD
ccc_beat_053-058_ch07.qxd 6/8/06 2:36 PM Page 58
59
CHAPTER 8
EvaluatingProbabilities
Using TechnicalAnalysis
The probability evaluation technique is based on common marketlaws and is conducted in accordance with technical analysis rules.
It is clear that, at any given moment, the probability of the mar-ket moving in one direction or the other in the future is unequal. Alsounequal is the probability of a possible profit or loss receipts on any po-sition taken. This probability depends on many factors: time of day, se-quence and amplitude of the previous fluctuations, long-term andshort-term trend directions, current technical picture, direction andspeed of market’s movement at the present moment, and other factors.The various combinations of these factors can be identified, classified,and serve as the base for constructing standard models of the marketbehavior.
After this preliminary research is done, selecting effective tactics foreach concrete trade should not be too complicated. If you know and areable to identify these laws, objective probability evaluation will replacethe necessity of having your own opinion about future market behavior.Therefore, each new position taken by a trader in the market, from themoment of its opening, has to have a considerably high probability to be-come profitable rather than unprofitable.
For an initial and rough estimation of a direction probability of thenext market movement, I mostly use technical analysis with the exceptionof those elements that I consider insignificant or insufficiently accurate. Inparticular, I do not use any indicators with the exception of MACD andRSI; the only purpose of their use is to identify divergences on daily,weekly and monthly charts. See Figures 8.1 through 8.4.
ccc_beat_059-076_ch08.qxd 6/8/06 2:36 PM Page 59
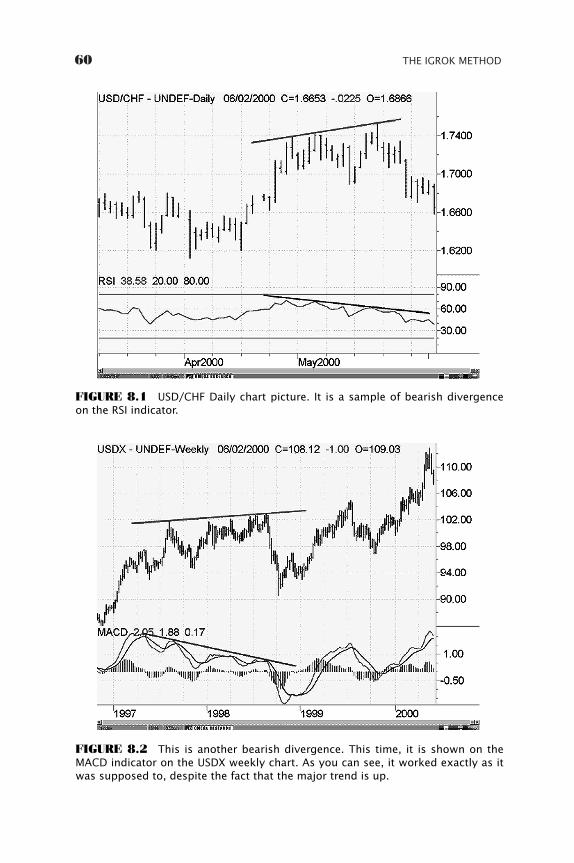
60 THE IGROK METHOD
FIGURE 8.1 USD/CHF Daily chart picture. It is a sample of bearish divergenceon the RSI indicator.
FIGURE 8.2 This is another bearish divergence. This time, it is shown on theMACD indicator on the USDX weekly chart. As you can see, it worked exactly as itwas supposed to, despite the fact that the major trend is up.
ccc_beat_059-076_ch08.qxd 6/8/06 2:36 PM Page 60
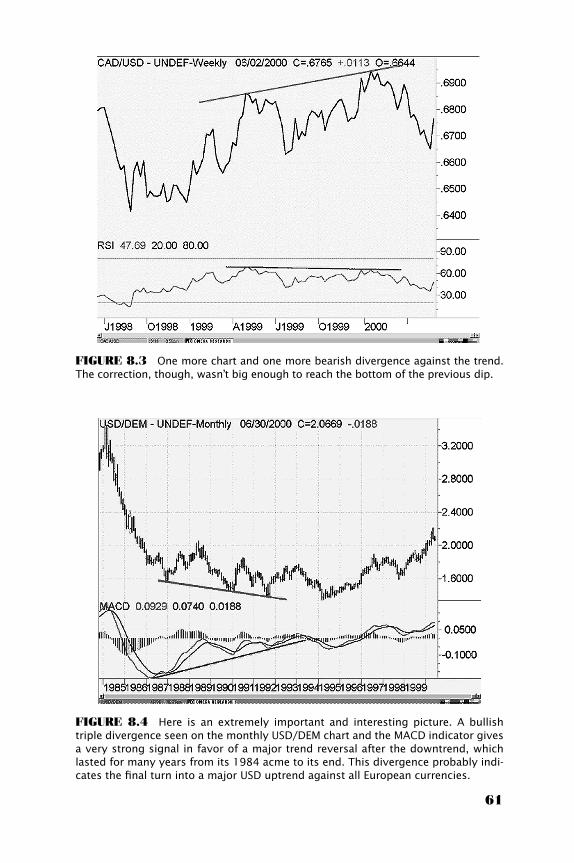
FIGURE 8.3 One more chart and one more bearish divergence against the trend.The correction, though, wasn’t big enough to reach the bottom of the previous dip.
FIGURE 8.4 Here is an extremely important and interesting picture. A bullishtriple divergence seen on the monthly USD/DEM chart and the MACD indicator givesa very strong signal in favor of a major trend reversal after the downtrend, whichlasted for many years from its 1984 acme to its end. This divergence probably indi-cates the final turn into a major USD uptrend against all European currencies.
61
ccc_beat_059-076_ch08.qxd 6/8/06 2:36 PM Page 61
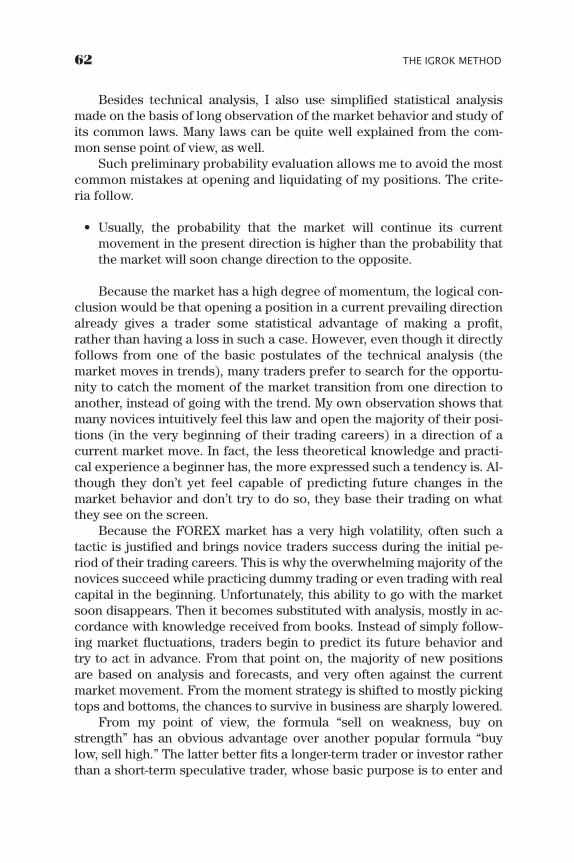
Besides technical analysis, I also use simplified statistical analysismade on the basis of long observation of the market behavior and study ofits common laws. Many laws can be quite well explained from the com-mon sense point of view, as well.
Such preliminary probability evaluation allows me to avoid the mostcommon mistakes at opening and liquidating of my positions. The crite-ria follow.
• Usually, the probability that the market will continue its currentmovement in the present direction is higher than the probability thatthe market will soon change direction to the opposite.
Because the market has a high degree of momentum, the logical con-clusion would be that opening a position in a current prevailing directionalready gives a trader some statistical advantage of making a profit,rather than having a loss in such a case. However, even though it directlyfollows from one of the basic postulates of the technical analysis (themarket moves in trends), many traders prefer to search for the opportu-nity to catch the moment of the market transition from one direction toanother, instead of going with the trend. My own observation shows thatmany novices intuitively feel this law and open the majority of their posi-tions (in the very beginning of their trading careers) in a direction of acurrent market move. In fact, the less theoretical knowledge and practi-cal experience a beginner has, the more expressed such a tendency is. Al-though they don’t yet feel capable of predicting future changes in themarket behavior and don’t try to do so, they base their trading on whatthey see on the screen.
Because the FOREX market has a very high volatility, often such atactic is justified and brings novice traders success during the initial pe-riod of their trading careers. This is why the overwhelming majority of thenovices succeed while practicing dummy trading or even trading with realcapital in the beginning. Unfortunately, this ability to go with the marketsoon disappears. Then it becomes substituted with analysis, mostly in ac-cordance with knowledge received from books. Instead of simply follow-ing market fluctuations, traders begin to predict its future behavior andtry to act in advance. From that point on, the majority of new positionsare based on analysis and forecasts, and very often against the currentmarket movement. From the moment strategy is shifted to mostly pickingtops and bottoms, the chances to survive in business are sharply lowered.
From my point of view, the formula “sell on weakness, buy onstrength” has an obvious advantage over another popular formula “buylow, sell high.” The latter better fits a longer-term trader or investor ratherthan a short-term speculative trader, whose basic purpose is to enter and
62 THE IGROK METHOD
ccc_beat_059-076_ch08.qxd 6/8/06 2:36 PM Page 62
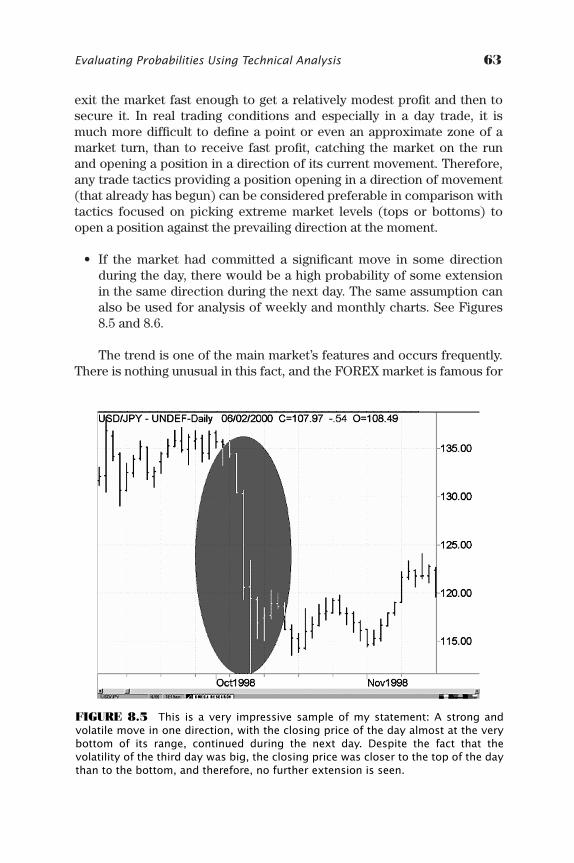
exit the market fast enough to get a relatively modest profit and then tosecure it. In real trading conditions and especially in a day trade, it ismuch more difficult to define a point or even an approximate zone of amarket turn, than to receive fast profit, catching the market on the runand opening a position in a direction of its current movement. Therefore,any trade tactics providing a position opening in a direction of movement(that already has begun) can be considered preferable in comparison withtactics focused on picking extreme market levels (tops or bottoms) toopen a position against the prevailing direction at the moment.
• If the market had committed a significant move in some directionduring the day, there would be a high probability of some extensionin the same direction during the next day. The same assumption canalso be used for analysis of weekly and monthly charts. See Figures8.5 and 8.6.
The trend is one of the main market’s features and occurs frequently.There is nothing unusual in this fact, and the FOREX market is famous for
Evaluating Probabilities Using Technical Analysis 63
FIGURE 8.5 This is a very impressive sample of my statement: A strong andvolatile move in one direction, with the closing price of the day almost at the verybottom of its range, continued during the next day. Despite the fact that thevolatility of the third day was big, the closing price was closer to the top of the daythan to the bottom, and therefore, no further extension is seen.
ccc_beat_059-076_ch08.qxd 6/8/06 2:36 PM Page 63
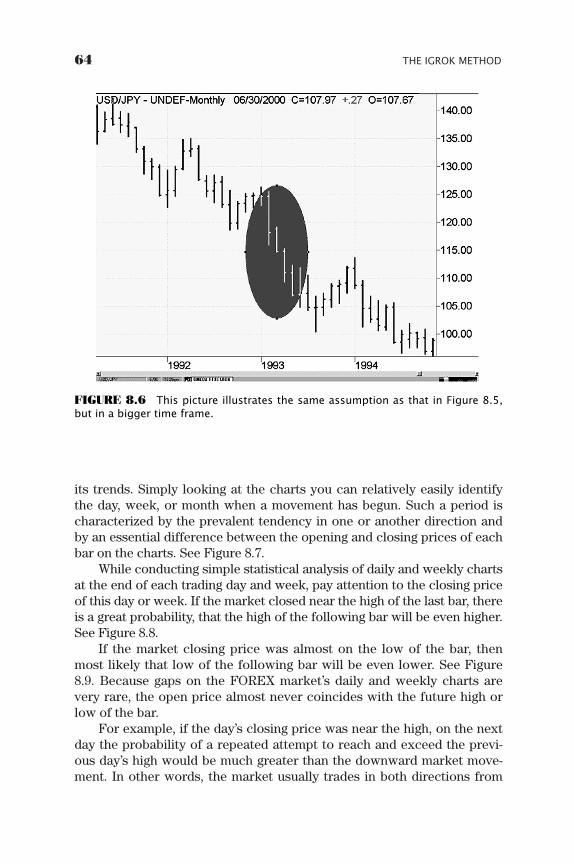
its trends. Simply looking at the charts you can relatively easily identifythe day, week, or month when a movement has begun. Such a period ischaracterized by the prevalent tendency in one or another direction andby an essential difference between the opening and closing prices of eachbar on the charts. See Figure 8.7.
While conducting simple statistical analysis of daily and weekly chartsat the end of each trading day and week, pay attention to the closing priceof this day or week. If the market closed near the high of the last bar, thereis a great probability, that the high of the following bar will be even higher.See Figure 8.8.
If the market closing price was almost on the low of the bar, thenmost likely that low of the following bar will be even lower. See Figure8.9. Because gaps on the FOREX market’s daily and weekly charts arevery rare, the open price almost never coincides with the future high orlow of the bar.
For example, if the day’s closing price was near the high, on the nextday the probability of a repeated attempt to reach and exceed the previ-ous day’s high would be much greater than the downward market move-ment. In other words, the market usually trades in both directions from
64 THE IGROK METHOD
FIGURE 8.6 This picture illustrates the same assumption as that in Figure 8.5,but in a bigger time frame.
ccc_beat_059-076_ch08.qxd 6/8/06 2:36 PM Page 64
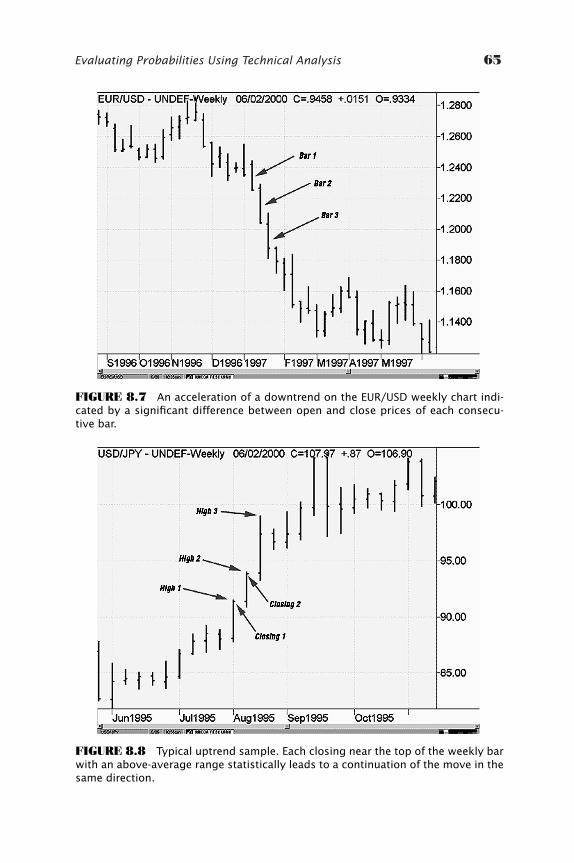
Evaluating Probabilities Using Technical Analysis 65
FIGURE 8.7 An acceleration of a downtrend on the EUR/USD weekly chart indi-cated by a significant difference between open and close prices of each consecu-tive bar.
FIGURE 8.8 Typical uptrend sample. Each closing near the top of the weekly barwith an above-average range statistically leads to a continuation of the move in thesame direction.
ccc_beat_059-076_ch08.qxd 6/8/06 2:36 PM Page 65
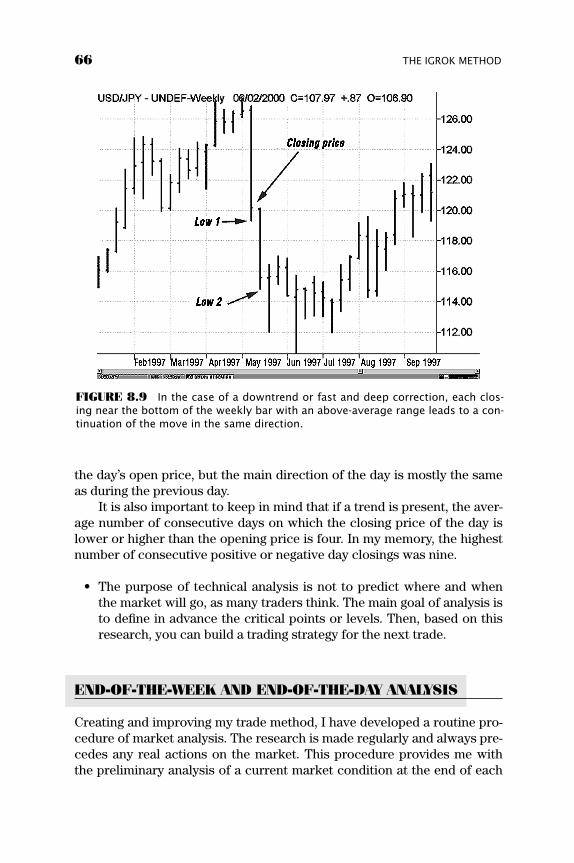
the day’s open price, but the main direction of the day is mostly the sameas during the previous day.
It is also important to keep in mind that if a trend is present, the aver-age number of consecutive days on which the closing price of the day islower or higher than the opening price is four. In my memory, the highestnumber of consecutive positive or negative day closings was nine.
• The purpose of technical analysis is not to predict where and whenthe market will go, as many traders think. The main goal of analysis isto define in advance the critical points or levels. Then, based on thisresearch, you can build a trading strategy for the next trade.
END-OF-THE-WEEK AND END-OF-THE-DAY ANALYSIS
Creating and improving my trade method, I have developed a routine pro-cedure of market analysis. The research is made regularly and always pre-cedes any real actions on the market. This procedure provides me withthe preliminary analysis of a current market condition at the end of each
66 THE IGROK METHOD
FIGURE 8.9 In the case of a downtrend or fast and deep correction, each clos-ing near the bottom of the weekly bar with an above-average range leads to a con-tinuation of the move in the same direction.
ccc_beat_059-076_ch08.qxd 6/8/06 2:36 PM Page 66
trading day. It begins with definition of key points, critical zones, supportsand resistances, and also includes preliminary and rather rough probabil-ity evaluation of the main market direction during the next day. At the endof each week, I do such analysis for the whole next week, too. Despite thefact that this part of the chapter is large in volume and contains manysteps that a trader needs to take before he completes his daily routineanalysis, the actual time you will spend on the daily procedure is unlikelyto exceed 15 to 20 minutes.
The Weekly Chart Analysis
Preliminary analysis on weekly charts is conducted at the end of theweek, and is supposed to be updated at the end of each trading day.
(The fact that you prefer a short-term trade is not so important.Longer-term market analysis should be done even if you consider yourselfas a day trader and the majority of your positions are taken and liquidatedwithin the same trading day. To make a right decision on an intradaytrade, you also have to see the bigger picture, to identify key levels andcurrent longer-term trends. As a matter of fact, dividing the FOREX mar-ket participants among short-term, intermediate-term and long-termtraders seems a bit artificial to me. For example, I personally never refuseto keep my position open for a longer period of time if there is a strongreason to believe that the current trend will continue. Transforming an in-traday trade into a positional trade, revising my initial plan and changingthe time frame can do the necessary adjustment.)
The purpose of this analysis is to define the prevalent intermediate- tolonger-term trends and identify on the chart critical points, zones, and lev-els. Those levels should be located relatively close to the previous week’sclosing price and within the reach of a potential next week’s range. Alltechnical formations and patterns have to be taken into consideration andidentified as well. The trendlines should be drawn and the measured ob-jective targets (if any) calculated. The charts, along with the lines drawnon them, should be saved in your computer and updated every day.
(The Omega SuperCharts (end-of-day) software, which I use for inter-mediate and long-term analysis, is the best software I know. This com-puter program allows you to save in the memory a large number ofgraphic windows with lines drawn on them and, if it is necessary, anynumber of indicators.)
Every day, in accordance with the market’s changes, you should plot anew day bar and revise the lines that have been drawn on the weeklychart the week before. If necessary, remove the old lines and add newones. For example, even for a day trader all the trendlines, support, andresistance lines lying within 2 to 3 days of an average trading range could
Evaluating Probabilities Using Technical Analysis 67
ccc_beat_059-076_ch08.qxd 6/8/06 2:36 PM Page 67
be important. Those critical points that are on a distance up to 300 to 500pips in both directions from the closing price of the day have to be notedand placed on the chart. The levels nearest to a closing price are the mostimportant and require more attention. You have to precisely calculate thecritical point where this level might be penetrated by the market in thenearest future.
The most basic task, but at the same time the simplest, is to define adirection of a current intermediate-term trend. I don’t think anybody has aproblem with this definition, because presence or absence of a trend isusually visible from the first look at the chart. Therefore, I want only to re-mind you that analysis should be conducted on both bar charts and line-on-close charts.
• You should begin with the search of already formed technical forma-tions (head and shoulders, double (triple) tops/bottoms, triangles,wedges, flags, channels, etc.). They should be identified in the follow-ing order:
a. complete formations, with already broken trend/or necklines (crit-ical lines)
b. complete formations, but the critical levels have not been broken yetc. formations, coming nearer to completiond. formations that are just starting their development
(In the case of d, we are making some projections for the future. Thisis the most complicated task, and requires certain practical experi-ence and some imagination from a trader.) After identification of atechnical formation, you should draw and save all necessary linesforming this pattern, including the possible measured objective tar-get, if this given formation allows defining it. See Figure 8.10.
• Drawing trend lines and horizontal supports and resistances will bethe next step. Identification and allocation on the chart of possiblehorizontal and inclined channels limited by two trend lines is alsovery important. Such lines should be drawn only according to certainstrict rules. According to the laws of geometry, it’s possible to draw adirect line through any two points in space. Therefore, trend lines,only if they are not necklines of one of the technical formations, willmake sense only when they are drawn through a minimum of threeimportant points on the analyzed chart.
• The trend lines should be drawn through three consecutive tops, orthree consecutive bottoms, or highs and lows of daily and weeklybars. Preferably, the bars should not intersect the trend line along theway. The line, which has many casual and unconfirmed intersections,is less reliable for a trader. A perfect trend line should be placed on a
68 THE IGROK METHOD
ccc_beat_059-076_ch08.qxd 6/8/06 2:36 PM Page 68
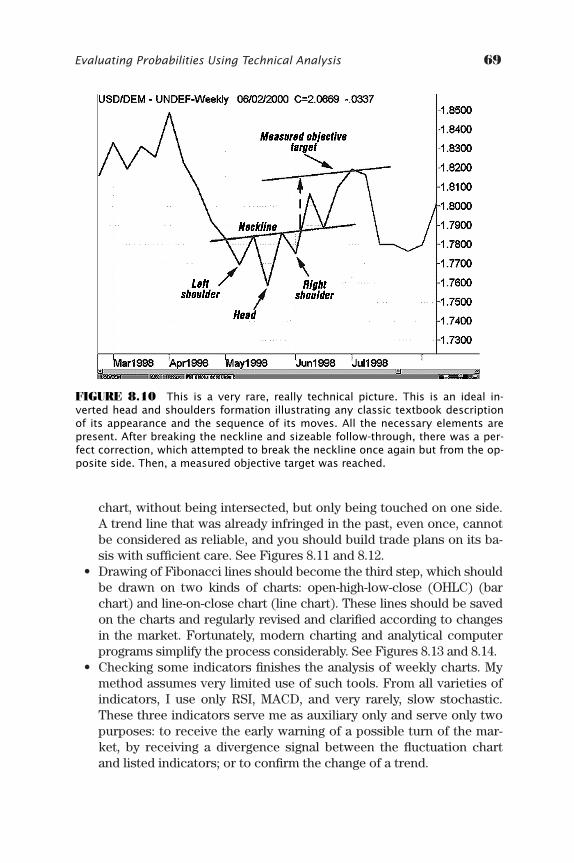
chart, without being intersected, but only being touched on one side.A trend line that was already infringed in the past, even once, cannotbe considered as reliable, and you should build trade plans on its ba-sis with sufficient care. See Figures 8.11 and 8.12.
• Drawing of Fibonacci lines should become the third step, which shouldbe drawn on two kinds of charts: open-high-low-close (OHLC) (barchart) and line-on-close chart (line chart). These lines should be savedon the charts and regularly revised and clarified according to changesin the market. Fortunately, modern charting and analytical computerprograms simplify the process considerably. See Figures 8.13 and 8.14.
• Checking some indicators finishes the analysis of weekly charts. Mymethod assumes very limited use of such tools. From all varieties ofindicators, I use only RSI, MACD, and very rarely, slow stochastic.These three indicators serve me as auxiliary only and serve only twopurposes: to receive the early warning of a possible turn of the mar-ket, by receiving a divergence signal between the fluctuation chartand listed indicators; or to confirm the change of a trend.
Evaluating Probabilities Using Technical Analysis 69
FIGURE 8.10 This is a very rare, really technical picture. This is an ideal in-verted head and shoulders formation illustrating any classic textbook descriptionof its appearance and the sequence of its moves. All the necessary elements arepresent. After breaking the neckline and sizeable follow-through, there was a per-fect correction, which attempted to break the neckline once again but from the op-posite side. Then, a measured objective target was reached.
ccc_beat_059-076_ch08.qxd 6/8/06 2:36 PM Page 69
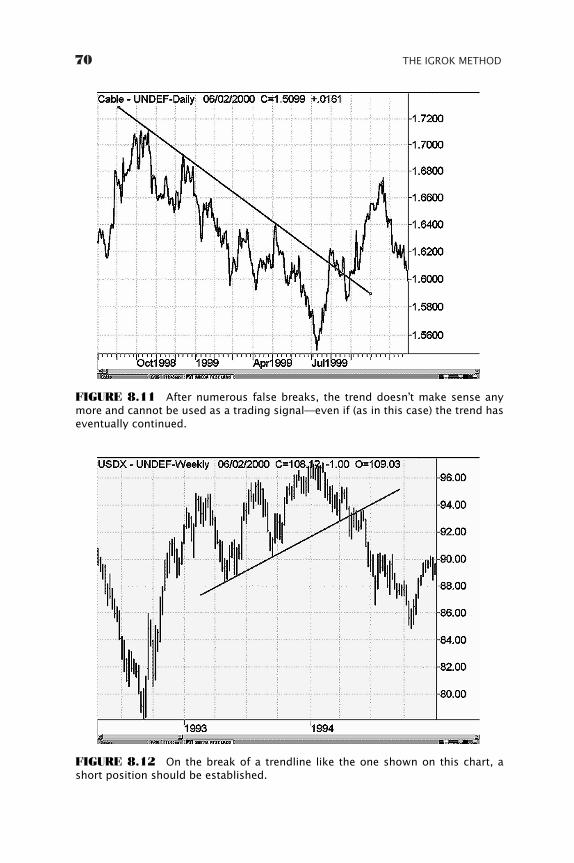
70 THE IGROK METHOD
FIGURE 8.11 After numerous false breaks, the trend doesn’t make sense anymore and cannot be used as a trading signal—even if (as in this case) the trend haseventually continued.
FIGURE 8.12 On the break of a trendline like the one shown on this chart, ashort position should be established.
ccc_beat_059-076_ch08.qxd 6/8/06 2:36 PM Page 70
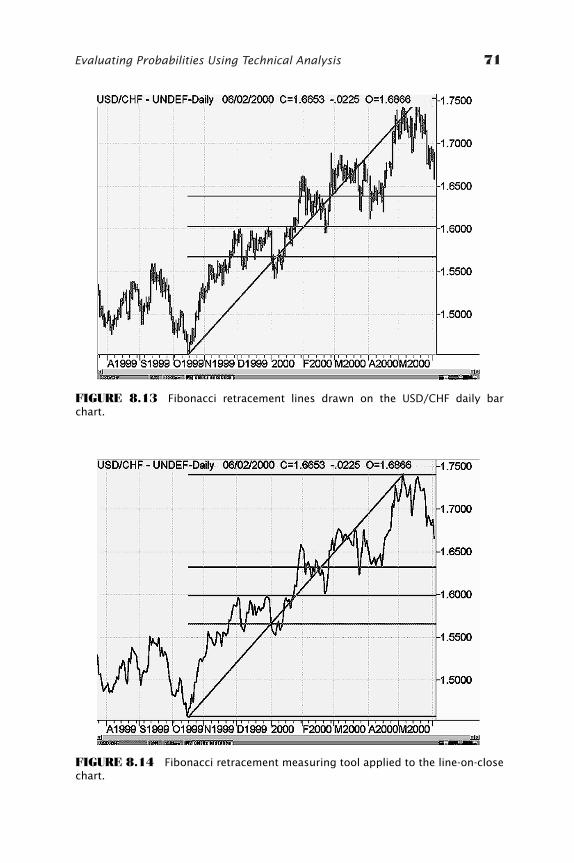
Evaluating Probabilities Using Technical Analysis 71
FIGURE 8.13 Fibonacci retracement lines drawn on the USD/CHF daily barchart.
FIGURE 8.14 Fibonacci retracement measuring tool applied to the line-on-closechart.
ccc_beat_059-076_ch08.qxd 6/8/06 2:37 PM Page 71
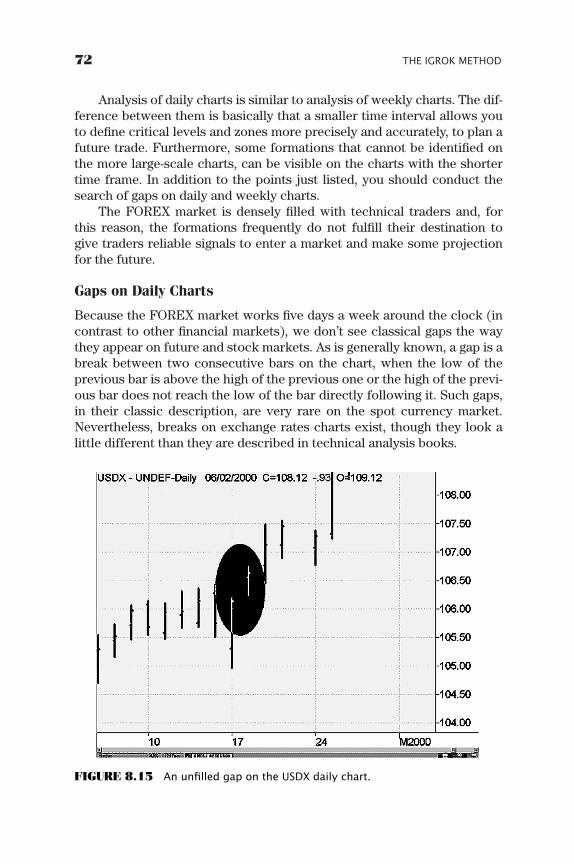
Analysis of daily charts is similar to analysis of weekly charts. The dif-ference between them is basically that a smaller time interval allows youto define critical levels and zones more precisely and accurately, to plan afuture trade. Furthermore, some formations that cannot be identified onthe more large-scale charts, can be visible on the charts with the shortertime frame. In addition to the points just listed, you should conduct thesearch of gaps on daily and weekly charts.
The FOREX market is densely filled with technical traders and, forthis reason, the formations frequently do not fulfill their destination togive traders reliable signals to enter a market and make some projectionfor the future.
Gaps on Daily Charts
Because the FOREX market works five days a week around the clock (incontrast to other financial markets), we don’t see classical gaps the waythey appear on future and stock markets. As is generally known, a gap is abreak between two consecutive bars on the chart, when the low of theprevious bar is above the high of the previous one or the high of the previ-ous bar does not reach the low of the bar directly following it. Such gaps,in their classic description, are very rare on the spot currency market.Nevertheless, breaks on exchange rates charts exist, though they look alittle different than they are described in technical analysis books.
72 THE IGROK METHOD
FIGURE 8.15 An unfilled gap on the USDX daily chart.
ccc_beat_059-076_ch08.qxd 6/8/06 2:37 PM Page 72
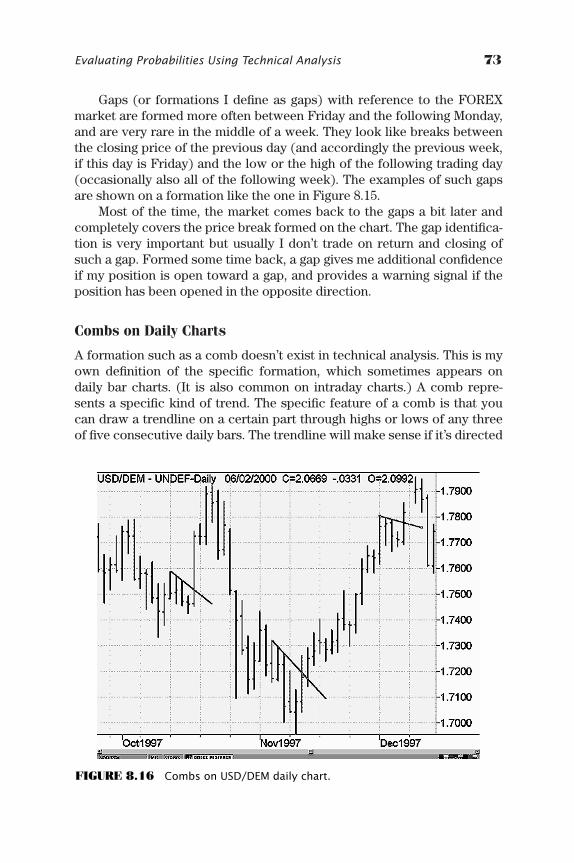
Gaps (or formations I define as gaps) with reference to the FOREXmarket are formed more often between Friday and the following Monday,and are very rare in the middle of a week. They look like breaks betweenthe closing price of the previous day (and accordingly the previous week,if this day is Friday) and the low or the high of the following trading day(occasionally also all of the following week). The examples of such gapsare shown on a formation like the one in Figure 8.15.
Most of the time, the market comes back to the gaps a bit later andcompletely covers the price break formed on the chart. The gap identifica-tion is very important but usually I don’t trade on return and closing ofsuch a gap. Formed some time back, a gap gives me additional confidenceif my position is open toward a gap, and provides a warning signal if theposition has been opened in the opposite direction.
Combs on Daily Charts
A formation such as a comb doesn’t exist in technical analysis. This is myown definition of the specific formation, which sometimes appears ondaily bar charts. (It is also common on intraday charts.) A comb repre-sents a specific kind of trend. The specific feature of a comb is that youcan draw a trendline on a certain part through highs or lows of any threeof five consecutive daily bars. The trendline will make sense if it’s directed
Evaluating Probabilities Using Technical Analysis 73
FIGURE 8.16 Combs on USD/DEM daily chart.
ccc_beat_059-076_ch08.qxd 6/8/06 2:37 PM Page 73
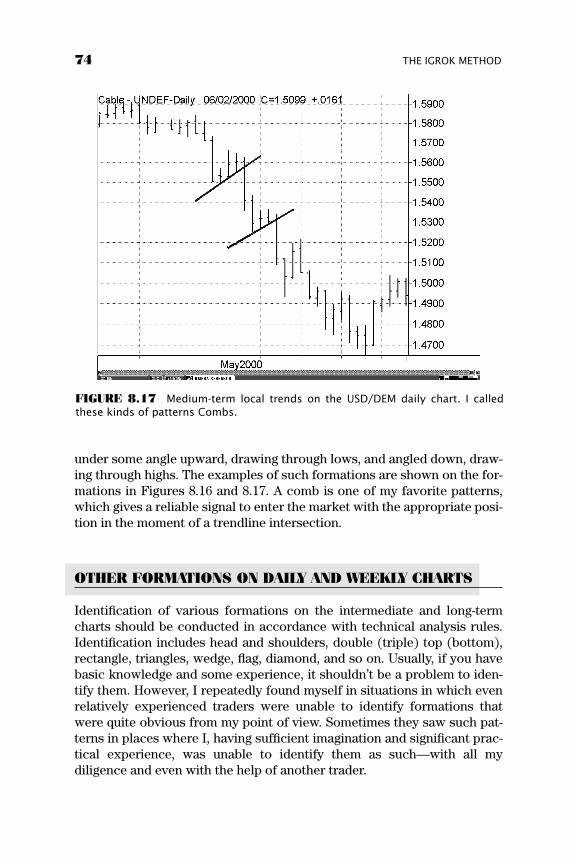
under some angle upward, drawing through lows, and angled down, draw-ing through highs. The examples of such formations are shown on the for-mations in Figures 8.16 and 8.17. A comb is one of my favorite patterns,which gives a reliable signal to enter the market with the appropriate posi-tion in the moment of a trendline intersection.
OTHER FORMATIONS ON DAILY AND WEEKLY CHARTS
Identification of various formations on the intermediate and long-termcharts should be conducted in accordance with technical analysis rules.Identification includes head and shoulders, double (triple) top (bottom),rectangle, triangles, wedge, flag, diamond, and so on. Usually, if you havebasic knowledge and some experience, it shouldn’t be a problem to iden-tify them. However, I repeatedly found myself in situations in which evenrelatively experienced traders were unable to identify formations thatwere quite obvious from my point of view. Sometimes they saw such pat-terns in places where I, having sufficient imagination and significant prac-tical experience, was unable to identify them as such—with all mydiligence and even with the help of another trader.
74 THE IGROK METHOD
FIGURE 8.17 Medium-term local trends on the USD/DEM daily chart. I calledthese kinds of patterns Combs.
ccc_beat_059-076_ch08.qxd 6/8/06 2:37 PM Page 74

Different interpretations of technical patterns and formations are fre-quent among traders. Their interpretations of possible market behaviorbased on such identification also differ. As I already mentioned, theFOREX market is densely filled with technical traders, and for this reasonformations frequently do not fulfill their destination to give a trader a reli-able signal to enter a market and make some projection for the future. Ac-cording to this fact, a trade on a projected target frequently can beunsuccessful. However, we shouldn’t ignore these formations also. Wewill discuss how to use these formations and how to ensure that we aresafe in the chapter devoted to trading signals.
Evaluating Probabilities Using Technical Analysis 75
ccc_beat_059-076_ch08.qxd 6/8/06 2:37 PM Page 75

ccc_beat_059-076_ch08.qxd 6/8/06 2:37 PM Page 76
77
CHAPTER 9
Basic TradingStrategies and
Techniques
Trading signals that I use in my method are not much different fromsupport and resistance theory and chart formations taught in bookson classical technical analysis. In such books, none of the crossings,
divergences, or other signals that I use with various indicators is ac-cepted at all. My own interpretation of these signals is different from theclassical and standard, so each of them requires a separate and detailedexplanation.
TRADING BASED ON ASCENDING AND DESCENDING TRENDLINES
Ascending or descending trendlines practically always give a perfect op-portunity to construct a trade plan based on them. The clearer, more dis-tinct, and more obvious a trendline is, the easier the trade should be. Irecommend that you pay attention to the phenomenon I have discovered,which for some reason has been overlooked in numerous technical analy-sis handbooks and recommendations:
Any trendline correctly drawn through three or more points will bebroken sooner or later. If such a line hasn’t been broken yet, it becomes azone of attraction for the market to return to it.
There is an obvious and rather simple explanation to this fact. Signifi-cant stops accumulate gradually behind such a line and the market thenbegins to successfully pursue on them.
ccc_beat_077-094_ch09.qxd 6/8/06 2:37 PM Page 77
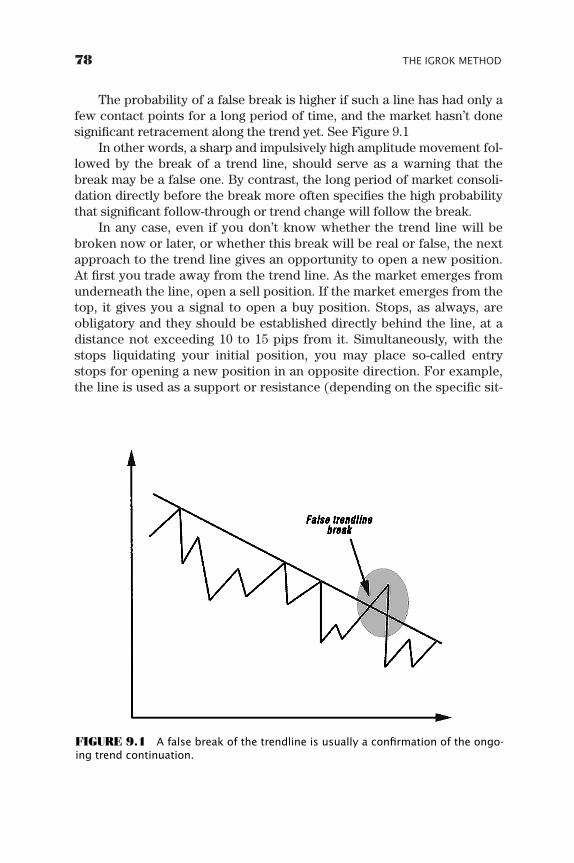
The probability of a false break is higher if such a line has had only afew contact points for a long period of time, and the market hasn’t donesignificant retracement along the trend yet. See Figure 9.1
In other words, a sharp and impulsively high amplitude movement fol-lowed by the break of a trend line, should serve as a warning that thebreak may be a false one. By contrast, the long period of market consoli-dation directly before the break more often specifies the high probabilitythat significant follow-through or trend change will follow the break.
In any case, even if you don’t know whether the trend line will bebroken now or later, or whether this break will be real or false, the nextapproach to the trend line gives an opportunity to open a new position.At first you trade away from the trend line. As the market emerges fromunderneath the line, open a sell position. If the market emerges from thetop, it gives you a signal to open a buy position. Stops, as always, areobligatory and they should be established directly behind the line, at adistance not exceeding 10 to 15 pips from it. Simultaneously, with thestops liquidating your initial position, you may place so-called entrystops for opening a new position in an opposite direction. For example,the line is used as a support or resistance (depending on the specific sit-
78 THE IGROK METHOD
FIGURE 9.1 A false break of the trendline is usually a confirmation of the ongo-ing trend continuation.
ccc_beat_077-094_ch09.qxd 6/8/06 2:37 PM Page 78
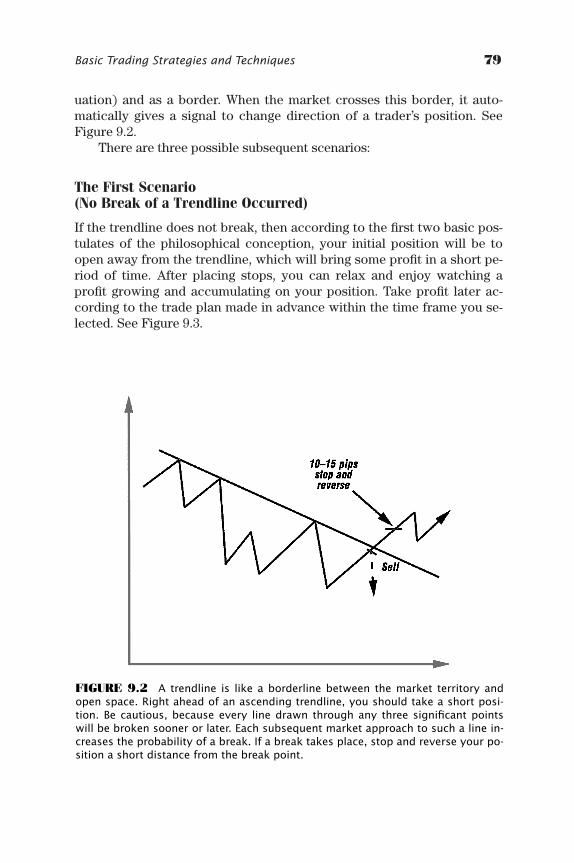
uation) and as a border. When the market crosses this border, it auto-matically gives a signal to change direction of a trader’s position. SeeFigure 9.2.
There are three possible subsequent scenarios:
The First Scenario (No Break of a Trendline Occurred)
If the trendline does not break, then according to the first two basic pos-tulates of the philosophical conception, your initial position will be toopen away from the trendline, which will bring some profit in a short pe-riod of time. After placing stops, you can relax and enjoy watching aprofit growing and accumulating on your position. Take profit later ac-cording to the trade plan made in advance within the time frame you se-lected. See Figure 9.3.
Basic Trading Strategies and Techniques 79
FIGURE 9.2 A trendline is like a borderline between the market territory andopen space. Right ahead of an ascending trendline, you should take a short posi-tion. Be cautious, because every line drawn through any three significant pointswill be broken sooner or later. Each subsequent market approach to such a line in-creases the probability of a break. If a break takes place, stop and reverse your po-sition a short distance from the break point.
ccc_beat_077-094_ch09.qxd 6/8/06 2:37 PM Page 79
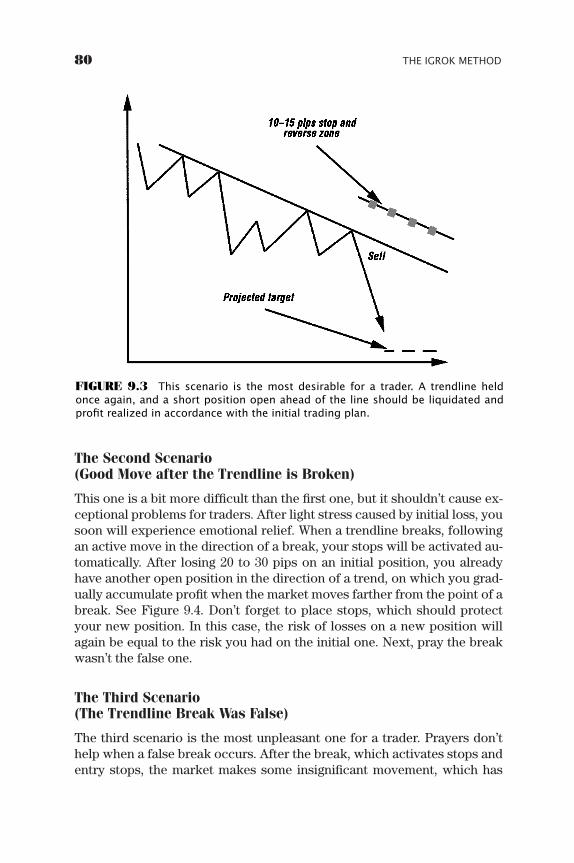
The Second Scenario (Good Move after the Trendline is Broken)
This one is a bit more difficult than the first one, but it shouldn’t cause ex-ceptional problems for traders. After light stress caused by initial loss, yousoon will experience emotional relief. When a trendline breaks, followingan active move in the direction of a break, your stops will be activated au-tomatically. After losing 20 to 30 pips on an initial position, you alreadyhave another open position in the direction of a trend, on which you grad-ually accumulate profit when the market moves farther from the point of abreak. See Figure 9.4. Don’t forget to place stops, which should protectyour new position. In this case, the risk of losses on a new position willagain be equal to the risk you had on the initial one. Next, pray the breakwasn’t the false one.
The Third Scenario (The Trendline Break Was False)
The third scenario is the most unpleasant one for a trader. Prayers don’thelp when a false break occurs. After the break, which activates stops andentry stops, the market makes some insignificant movement, which has
80 THE IGROK METHOD
FIGURE 9.3 This scenario is the most desirable for a trader. A trendline heldonce again, and a short position open ahead of the line should be liquidated andprofit realized in accordance with the initial trading plan.
ccc_beat_077-094_ch09.qxd 6/8/06 2:38 PM Page 80
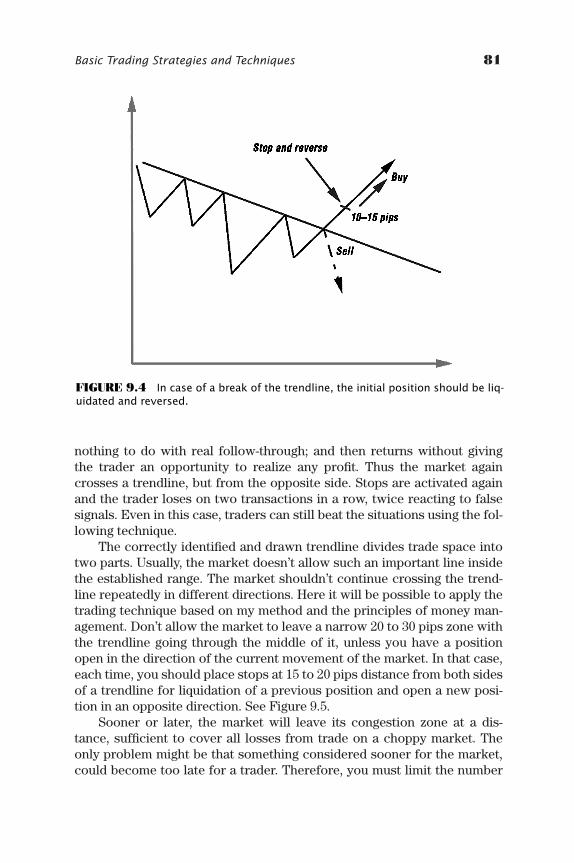
nothing to do with real follow-through; and then returns without givingthe trader an opportunity to realize any profit. Thus the market againcrosses a trendline, but from the opposite side. Stops are activated againand the trader loses on two transactions in a row, twice reacting to falsesignals. Even in this case, traders can still beat the situations using the fol-lowing technique.
The correctly identified and drawn trendline divides trade space intotwo parts. Usually, the market doesn’t allow such an important line insidethe established range. The market shouldn’t continue crossing the trend-line repeatedly in different directions. Here it will be possible to apply thetrading technique based on my method and the principles of money man-agement. Don’t allow the market to leave a narrow 20 to 30 pips zone withthe trendline going through the middle of it, unless you have a positionopen in the direction of the current movement of the market. In that case,each time, you should place stops at 15 to 20 pips distance from both sidesof a trendline for liquidation of a previous position and open a new posi-tion in an opposite direction. See Figure 9.5.
Sooner or later, the market will leave its congestion zone at a dis-tance, sufficient to cover all losses from trade on a choppy market. Theonly problem might be that something considered sooner for the market,could become too late for a trader. Therefore, you must limit the number
Basic Trading Strategies and Techniques 81
FIGURE 9.4 In case of a break of the trendline, the initial position should be liq-uidated and reversed.
ccc_beat_077-094_ch09.qxd 6/8/06 2:38 PM Page 81
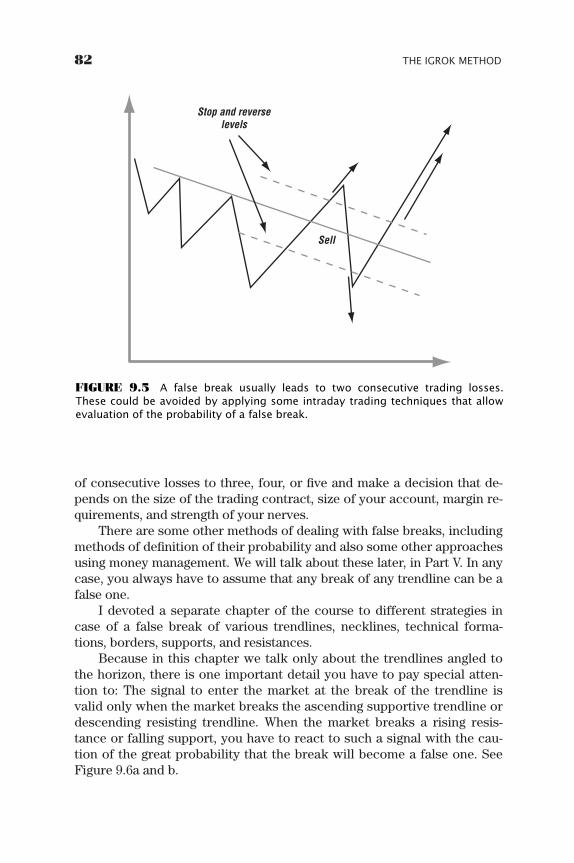
of consecutive losses to three, four, or five and make a decision that de-pends on the size of the trading contract, size of your account, margin re-quirements, and strength of your nerves.
There are some other methods of dealing with false breaks, includingmethods of definition of their probability and also some other approachesusing money management. We will talk about these later, in Part V. In anycase, you always have to assume that any break of any trendline can be afalse one.
I devoted a separate chapter of the course to different strategies incase of a false break of various trendlines, necklines, technical forma-tions, borders, supports, and resistances.
Because in this chapter we talk only about the trendlines angled tothe horizon, there is one important detail you have to pay special atten-tion to: The signal to enter the market at the break of the trendline isvalid only when the market breaks the ascending supportive trendline ordescending resisting trendline. When the market breaks a rising resis-tance or falling support, you have to react to such a signal with the cau-tion of the great probability that the break will become a false one. SeeFigure 9.6a and b.
82 THE IGROK METHOD
Stop and reverselevels
Sell
FIGURE 9.5 A false break usually leads to two consecutive trading losses.These could be avoided by applying some intraday trading techniques that allowevaluation of the probability of a false break.
ccc_beat_077-094_ch09.qxd 6/8/06 2:38 PM Page 82
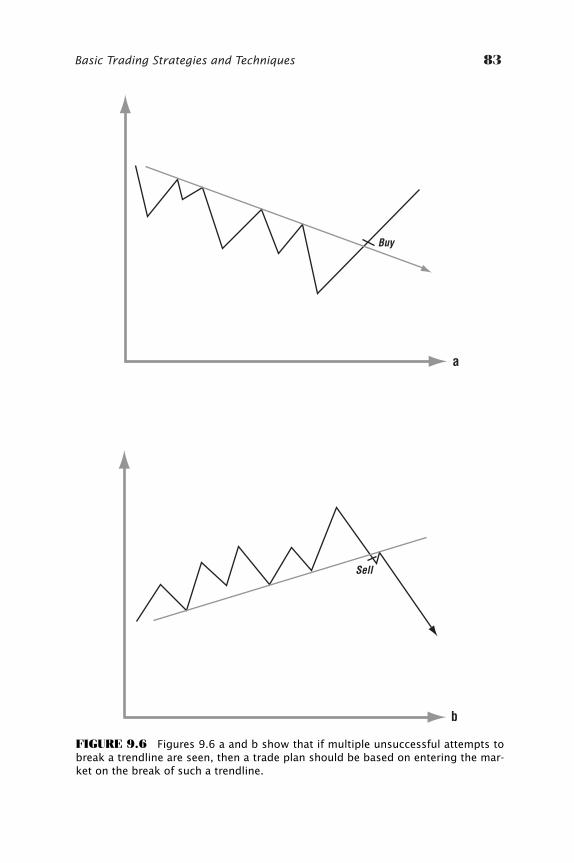
Basic Trading Strategies and Techniques 83
Sell
b
FIGURE 9.6 Figures 9.6 a and b show that if multiple unsuccessful attempts tobreak a trendline are seen, then a trade plan should be based on entering the mar-ket on the break of such a trendline.
Buy
a
ccc_beat_077-094_ch09.qxd 6/8/06 2:38 PM Page 83
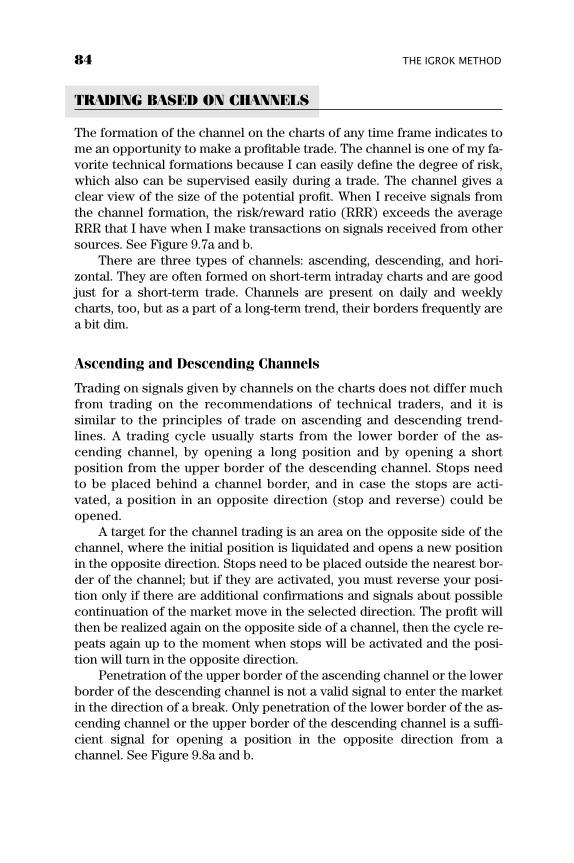
TRADING BASED ON CHANNELS
The formation of the channel on the charts of any time frame indicates tome an opportunity to make a profitable trade. The channel is one of my fa-vorite technical formations because I can easily define the degree of risk,which also can be supervised easily during a trade. The channel gives aclear view of the size of the potential profit. When I receive signals fromthe channel formation, the risk/reward ratio (RRR) exceeds the averageRRR that I have when I make transactions on signals received from othersources. See Figure 9.7a and b.
There are three types of channels: ascending, descending, and hori-zontal. They are often formed on short-term intraday charts and are goodjust for a short-term trade. Channels are present on daily and weeklycharts, too, but as a part of a long-term trend, their borders frequently area bit dim.
Ascending and Descending Channels
Trading on signals given by channels on the charts does not differ muchfrom trading on the recommendations of technical traders, and it is similar to the principles of trade on ascending and descending trend-lines. A trading cycle usually starts from the lower border of the as-cending channel, by opening a long position and by opening a shortposition from the upper border of the descending channel. Stops needto be placed behind a channel border, and in case the stops are acti-vated, a position in an opposite direction (stop and reverse) could beopened.
A target for the channel trading is an area on the opposite side of thechannel, where the initial position is liquidated and opens a new positionin the opposite direction. Stops need to be placed outside the nearest bor-der of the channel; but if they are activated, you must reverse your posi-tion only if there are additional confirmations and signals about possiblecontinuation of the market move in the selected direction. The profit willthen be realized again on the opposite side of a channel, then the cycle re-peats again up to the moment when stops will be activated and the posi-tion will turn in the opposite direction.
Penetration of the upper border of the ascending channel or the lowerborder of the descending channel is not a valid signal to enter the marketin the direction of a break. Only penetration of the lower border of the as-cending channel or the upper border of the descending channel is a suffi-cient signal for opening a position in the opposite direction from achannel. See Figure 9.8a and b.
84 THE IGROK METHOD
ccc_beat_077-094_ch09.qxd 6/8/06 2:38 PM Page 84
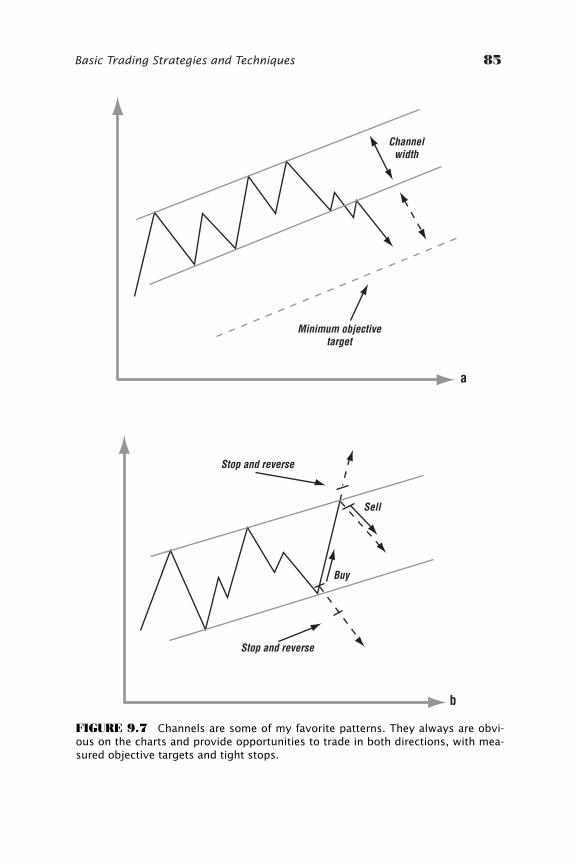
Basic Trading Strategies and Techniques 85
Stop and reverse
Sell
Stop and reverse
Buy
b
Minimum objectivetarget
Channelwidth
a
FIGURE 9.7 Channels are some of my favorite patterns. They always are obvi-ous on the charts and provide opportunities to trade in both directions, with mea-sured objective targets and tight stops.
ccc_beat_077-094_ch09.qxd 6/8/06 2:38 PM Page 85
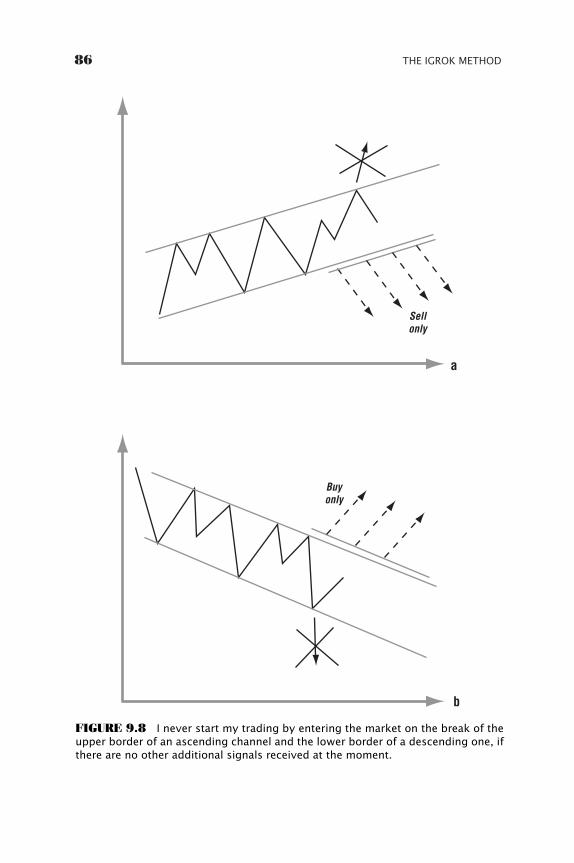
86 THE IGROK METHOD
Buyonly
b
FIGURE 9.8 I never start my trading by entering the market on the break of theupper border of an ascending channel and the lower border of a descending one, ifthere are no other additional signals received at the moment.
Sellonly
a
ccc_beat_077-094_ch09.qxd 6/8/06 2:38 PM Page 86
Horizontal Channel
Ideal (or almost ideal) horizontal channels are very rare on long-termcharts, but they can be seen on the intraday charts. They are best seen onfive-minutes to one-hour charts, or even on a four-hours chart. Becausesuch a channel is formed by two horizontal lines, drawing through at leastthree points each (according to market laws mentioned earlier), bothlines most likely will be broken in the near future.
My experience shows that:
• In the overwhelming majority of cases, the first break of a channel isfalse.
• After the break, there is a minor move in the same direction, then themarket comes back inside the channel.
• After returning into a channel, the market crosses it and penetrates anopposite border.
• After the second break, there is a significant follow-through, whichusually exceeds the width of the channel.
Some of my templates are based on signals given by a horizontal chan-nel formation. They will be discussed in Part IV, devoted to intraday trades.The choice of a trade tactic in the formed horizontal channel depends mainlyon individual preferences of each trader rather than on the market condition,which basically repeats the same scenario just described, with few varia-tions. Any essential deviations are very rare, but they are possible. When Ispeak about trader’s individual preferences, I have in mind the trader’s desireto accept additional risk for an opportunity to gain greater profit. That de-pends on the degree of his conservatism, time invested in market supervi-sion, individual experience, and speed of reaction to a specific situation.
TRADING BASED ON OTHER TECHNICAL FORMATIONS
I use trade signals given by various technical formations a bit differentlyfrom the usual manner accepted in classical technical analysis.
Head and Shoulders (H&S)
H&S is the most recognized reversal technical formation and is very popularamong beginners. Many novice traders can see H&S even if there is not evena trace of it on a chart. Seeing H&S where it does not exist occurs not onlybecause of someone’s bright imagination but also because of insufficientknowledge of the basics of technical analysis. The alteration of waves in themarket occurs constantly, and practically any sequence of contradictory
Basic Trading Strategies and Techniques 87
ccc_beat_077-094_ch09.qxd 6/8/06 2:38 PM Page 87
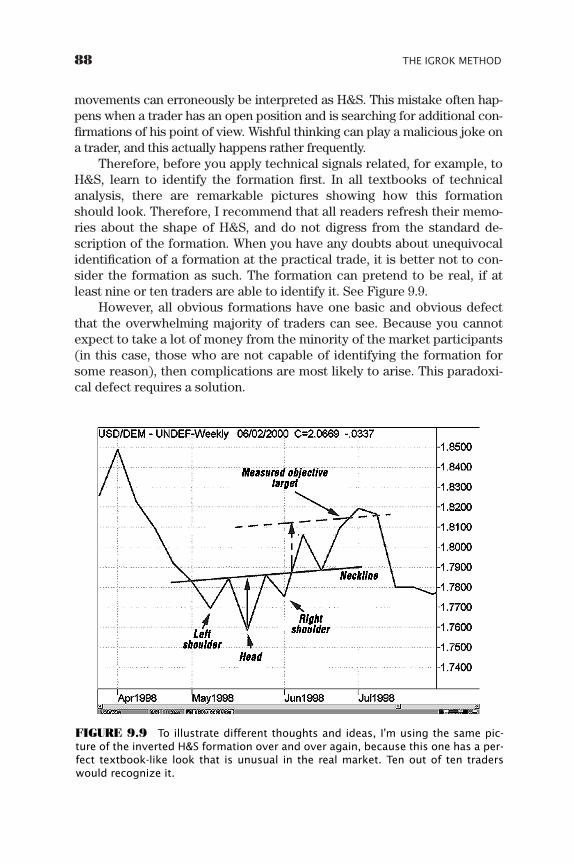
movements can erroneously be interpreted as H&S. This mistake often hap-pens when a trader has an open position and is searching for additional con-firmations of his point of view. Wishful thinking can play a malicious joke ona trader, and this actually happens rather frequently.
Therefore, before you apply technical signals related, for example, toH&S, learn to identify the formation first. In all textbooks of technicalanalysis, there are remarkable pictures showing how this formationshould look. Therefore, I recommend that all readers refresh their memo-ries about the shape of H&S, and do not digress from the standard de-scription of the formation. When you have any doubts about unequivocalidentification of a formation at the practical trade, it is better not to con-sider the formation as such. The formation can pretend to be real, if atleast nine or ten traders are able to identify it. See Figure 9.9.
However, all obvious formations have one basic and obvious defectthat the overwhelming majority of traders can see. Because you cannotexpect to take a lot of money from the minority of the market participants(in this case, those who are not capable of identifying the formation forsome reason), then complications are most likely to arise. This paradoxi-cal defect requires a solution.
88 THE IGROK METHOD
FIGURE 9.9 To illustrate different thoughts and ideas, I’m using the same pic-ture of the inverted H&S formation over and over again, because this one has a per-fect textbook-like look that is unusual in the real market. Ten out of ten traderswould recognize it.
ccc_beat_077-094_ch09.qxd 6/8/06 2:38 PM Page 88
On the one hand, technical analysis recommends that a trader open anew position in the direction of the market’s movement at the break of aneckline. On the other hand, under market laws, the crowd that thinksalike always should lose. The conclusion is: the probability of the correct(i.e., textbook) scenario of the H&S formation should not exceed 50 per-cent; for this reason, a trader has no statistical advantage, no matter howhe acts in a similar situation.
The exit from an inconvenient situation is rather simple. First, becausethe neckline is a critical line, it is possible to apply a money managementsystem such as the one already described in the example of trendlines, anduse stops with reverse to achieve a desirable result. Then, you have to waituntil the market leaves a critical zone going in one or the other direction.Secondly (and I frequently apply this method), you can play in advance ofthe situation and open a new position before such a formation is fully de-veloped. In the case of H&S, I prefer to take a new position at the point Iexpect to see a potential second shoulder top. The point of a potential sec-ond shoulder top is determined by drawing a line parallel to the necklinethrough the top of the first shoulder, which is already formed.
In the case of inverted H&S, such an entry point will be a possible lowof the second shoulder. Stops have to be placed according to intraday sup-ports and resistances, but they can also be placed on some fixed distancefrom the opening position determined according to scale and size of thisparticular formation. Such an approach requires some practical experi-ence, but it is easy to learn. All you need to do in such case is pay atten-tion to the situation and keep it under control at all times.
Double Top (Bottom)
In this formation, my recommendations on a trade is the same as in thecase of the H&S formation, but only in the part related to entry in the mar-ket on the break of a neckline. Don’t take a position without completionof the second top (bottom) because it is not always possible to define pre-cisely a point of entry into the market. Sometimes this formation deviatesfrom a horizontal axis of coordinates and inclines on the side. My view isnot different from the recommendations of classical technical analysis:protect yourself from a false break by placing relatively tight stops and re-versing the position if stops are triggered.
Triangles and Triangle-like Formations
In technical analysis, various triangle-like formations, including wedges,have various names and definitions. According to technical analysis, themarket behaves differently after completing the formation of each specific
Basic Trading Strategies and Techniques 89
ccc_beat_077-094_ch09.qxd 6/8/06 2:38 PM Page 89
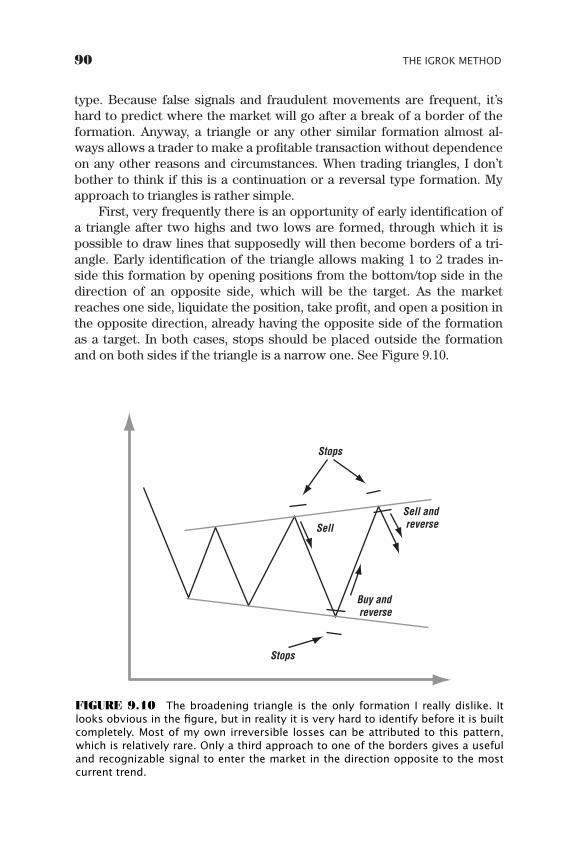
type. Because false signals and fraudulent movements are frequent, it’shard to predict where the market will go after a break of a border of theformation. Anyway, a triangle or any other similar formation almost al-ways allows a trader to make a profitable transaction without dependenceon any other reasons and circumstances. When trading triangles, I don’tbother to think if this is a continuation or a reversal type formation. Myapproach to triangles is rather simple.
First, very frequently there is an opportunity of early identification ofa triangle after two highs and two lows are formed, through which it ispossible to draw lines that supposedly will then become borders of a tri-angle. Early identification of the triangle allows making 1 to 2 trades in-side this formation by opening positions from the bottom/top side in thedirection of an opposite side, which will be the target. As the marketreaches one side, liquidate the position, take profit, and open a position inthe opposite direction, already having the opposite side of the formationas a target. In both cases, stops should be placed outside the formationand on both sides if the triangle is a narrow one. See Figure 9.10.
90 THE IGROK METHOD
Buy and reverse
Sell
Sell and reverse
Stops
Stops
FIGURE 9.10 The broadening triangle is the only formation I really dislike. Itlooks obvious in the figure, but in reality it is very hard to identify before it is builtcompletely. Most of my own irreversible losses can be attributed to this pattern,which is relatively rare. Only a third approach to one of the borders gives a usefuland recognizable signal to enter the market in the direction opposite to the mostcurrent trend.
ccc_beat_077-094_ch09.qxd 6/8/06 2:38 PM Page 90
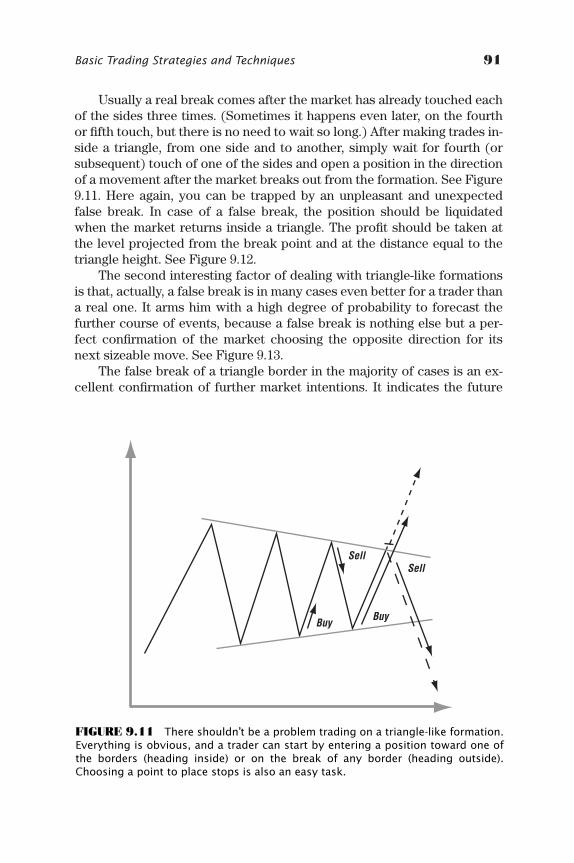
Usually a real break comes after the market has already touched eachof the sides three times. (Sometimes it happens even later, on the fourthor fifth touch, but there is no need to wait so long.) After making trades in-side a triangle, from one side and to another, simply wait for fourth (orsubsequent) touch of one of the sides and open a position in the directionof a movement after the market breaks out from the formation. See Figure9.11. Here again, you can be trapped by an unpleasant and unexpectedfalse break. In case of a false break, the position should be liquidatedwhen the market returns inside a triangle. The profit should be taken atthe level projected from the break point and at the distance equal to thetriangle height. See Figure 9.12.
The second interesting factor of dealing with triangle-like formationsis that, actually, a false break is in many cases even better for a trader thana real one. It arms him with a high degree of probability to forecast thefurther course of events, because a false break is nothing else but a per-fect confirmation of the market choosing the opposite direction for itsnext sizeable move. See Figure 9.13.
The false break of a triangle border in the majority of cases is an ex-cellent confirmation of further market intentions. It indicates the future
Basic Trading Strategies and Techniques 91
Buy
Sell
Buy
Sell
FIGURE 9.11 There shouldn’t be a problem trading on a triangle-like formation.Everything is obvious, and a trader can start by entering a position toward one ofthe borders (heading inside) or on the break of any border (heading outside).Choosing a point to place stops is also an easy task.
ccc_beat_077-094_ch09.qxd 6/8/06 2:38 PM Page 91
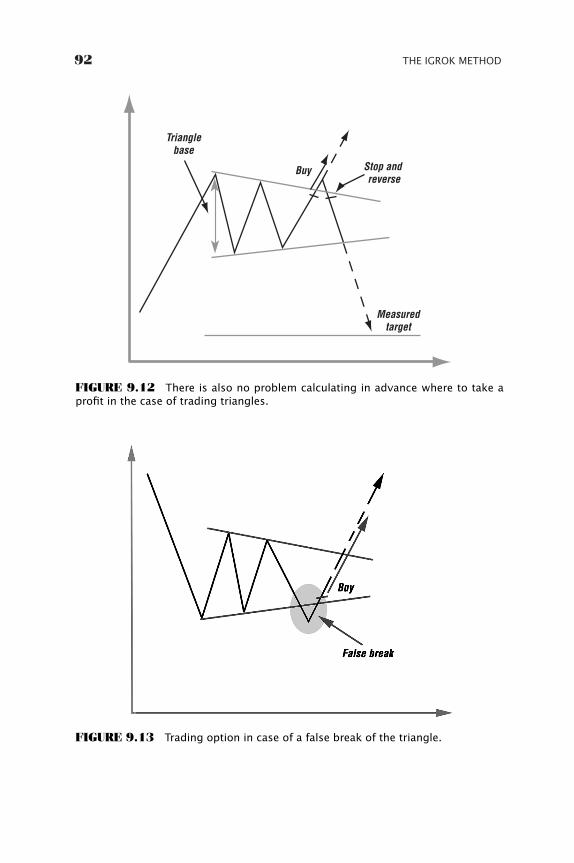
92 THE IGROK METHOD
Stop and reverse
Buy
Measuredtarget
Trianglebase
FIGURE 9.12 There is also no problem calculating in advance where to take aprofit in the case of trading triangles.
FIGURE 9.13 Trading option in case of a false break of the triangle.
ccc_beat_077-094_ch09.qxd 6/8/06 2:38 PM Page 92
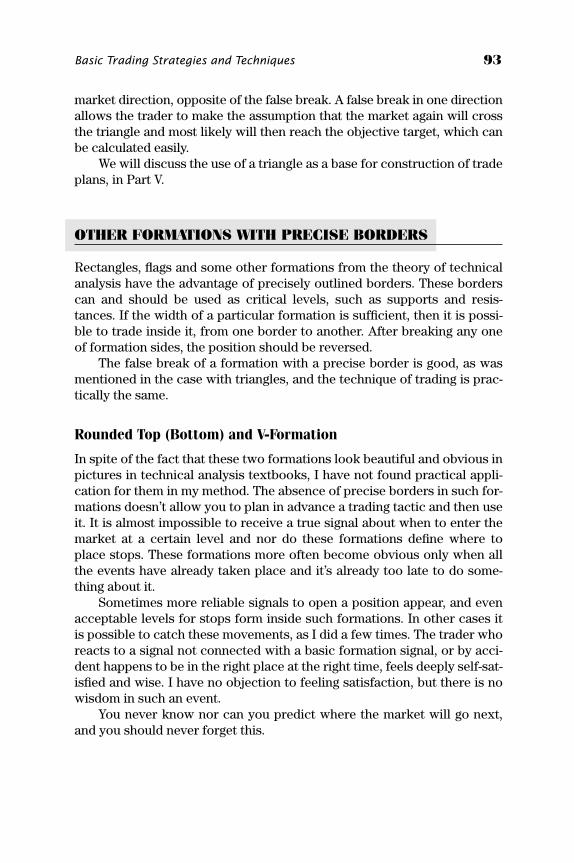
market direction, opposite of the false break. A false break in one directionallows the trader to make the assumption that the market again will crossthe triangle and most likely will then reach the objective target, which canbe calculated easily.
We will discuss the use of a triangle as a base for construction of tradeplans, in Part V.
OTHER FORMATIONS WITH PRECISE BORDERS
Rectangles, flags and some other formations from the theory of technicalanalysis have the advantage of precisely outlined borders. These borderscan and should be used as critical levels, such as supports and resis-tances. If the width of a particular formation is sufficient, then it is possi-ble to trade inside it, from one border to another. After breaking any oneof formation sides, the position should be reversed.
The false break of a formation with a precise border is good, as wasmentioned in the case with triangles, and the technique of trading is prac-tically the same.
Rounded Top (Bottom) and V-Formation
In spite of the fact that these two formations look beautiful and obvious inpictures in technical analysis textbooks, I have not found practical appli-cation for them in my method. The absence of precise borders in such for-mations doesn’t allow you to plan in advance a trading tactic and then useit. It is almost impossible to receive a true signal about when to enter themarket at a certain level and nor do these formations define where toplace stops. These formations more often become obvious only when allthe events have already taken place and it’s already too late to do some-thing about it.
Sometimes more reliable signals to open a position appear, and evenacceptable levels for stops form inside such formations. In other cases itis possible to catch these movements, as I did a few times. The trader whoreacts to a signal not connected with a basic formation signal, or by acci-dent happens to be in the right place at the right time, feels deeply self-sat-isfied and wise. I have no objection to feeling satisfaction, but there is nowisdom in such an event.
You never know nor can you predict where the market will go next,and you should never forget this.
Basic Trading Strategies and Techniques 93
ccc_beat_077-094_ch09.qxd 6/8/06 2:38 PM Page 93

ccc_beat_077-094_ch09.qxd 6/8/06 2:38 PM Page 94
95
CHAPTER 10
Choosinga Currency Pair
to Trade
When making a choice of a currency pair for a trade, no other rea-sons except the practical ones should be taken into considera-tion. It always surprises me when I see that some traders choose a
currency pair for making a speculative trade, based on patriotic or geo-graphical reasons. I have noticed that many traders from Australia, for ex-ample, basically trade an AUD against USD or NZD. New Zealanders,Canadians, Frenchmen and traders from many other countries frequentlyprefer to trade their national currencies also. They trade it against theAmerican dollar, or against other national currencies of neighboring coun-tries of the given geographical region. It seems to me, however, that ourbasic purpose of participation in this business is not to certify our patri-otic feelings and pride but to receive the greatest possible profit. From thepoint of view of a speculative trader, the patriotically geographical ap-proach to a choice of currency pairs for speculative operations on FOREXcannot be considered rational and justified. The choice of a currency pairfor the following speculative transaction should be done according to cer-tain parameters, and patriotism and residence are not among them.
The basic criteria for a choice of currency pairs should be their liquid-ity, activity, and average amplitude of fluctuations (trading range). Thehigher all these parameters, the more preferable such currency pairs arefrom a speculative trader’s point of view. The list of currency pairs mostsuitable to such a definition, first of all, includes the following: USD/CHF,USD/JPY, EUR/USD, EUR/JPY, GBP/EUR, GBP/JPY, and CHF/JPY. Youmay be surprised that I have not included in this group Cable (GBP/USD).The reason is that this currency pair has almost ideal liquidity as well as
ccc_beat_095-096_ch10.qxd 6/8/06 2:39 PM Page 95
all other majors, but the average day amplitude of Cable fluctuations islower than would be desirable. Also, the small cost of a GBP/USD pip is,from my point of view, better for an intermediate term positional tradethan for short-term intraday speculations. (I sometimes trade it, but notvery often.)
The most important and final criterion when making a choice of a cur-rency for short-term speculative trade should be maximum conformity ofa current technical picture, and how it fits to a trading technique and/or toa trading system that you are going to use. Because in this book we talkparticularly about my trading technique, just the maximum conformity ofthe chart to one of the templates used by me becomes a determining fac-tor for a choice of a particular currency for a particular trade. It is espe-cially important if, in the given moment, the market is in immediateproximity to some key technical level.
I accept diversification and, from my point of view, it is possible andnecessary to trade various currency pairs. However, my personal practiceshows that having simultaneous positions on various currency pairs dis-seminates a trader’s attention. It’s rather difficult to follow all the currencypairs at the same time. Therefore, I simultaneously hold open positions onno more than two or (very seldom) three currency pairs. In some cases(for example, trading USD/CHF and EUR/USD), I frequently use substitu-tion. By substitution I mean analyzing one of them, but (on the basis ofthis analysis) trading the other one.
The Swiss franc basically doesn’t have its own brightly expressedidentity in the marketplace. On a large scale, it is not more than a proxy inrelation to Euro. At the same time, it has high activity, large amplitude offluctuations, and perfect liquidity. These characteristics allow USD/CHFto be one of the most attractive currency pairs for speculative trade.
96 THE IGROK METHOD
ccc_beat_095-096_ch10.qxd 6/8/06 2:39 PM Page 96
97
CHAPTER 11
MoneyManagement
Rules andTechniques
Money management is a major component of speculative trade.None of the traders can be successful and none of the trade sys-tems can exist without it. The basic predestination of money man-
agement is to preserve and to protect a trading account against possibleexcessive losses.
Money management’s purpose is to control the risk and distributionof investment capital so that one loss or even a series of consecutivelosses should not result in the inability to continue a trade, and would notdestroy a trading account by bringing it to an unmanageable condition. Ina more comprehensive sense, money management also means a techniqueof preserving current profit in an open position and a technique of fixingcurrent profit.
Plenty of literature is devoted to money management, in which authorswith a large amount of practical experience in trading mainly share theirthoughts and recommendations about the best approach to manage capital.
Their recommendations in general deserve attention but, unfortunately,numerous publications on this subject agree on only one thing: money man-agement is absolutely necessary for a trader, because it is impossible to ex-pect any success without it. However, when it comes to practical advice andrecommendation, we see a large variety of opinions sometimes directlycontradicting one another. Therefore, it is difficult to understand these con-tradictions when reading the works of different authors.
It is almost impossible to choose only one correct approach to corre-spond to a trader’s individual situation, his trade system, the current marketcondition, and a concrete currency pair. Most important of all, however, is
ccc_beat_097-102_ch11.qxd 6/8/06 2:39 PM Page 97
the fact that practically all recommendations about money management ba-sically are directed to a long-term positional trade and not much to whatwould fit an intraday short-term trade. Therefore, my recommendations willnow have a common characteristic: practical suggestions on money man-agement in each of the trading templates intended for an intraday trade.
Because all components of a trade strategy and tactics are connected,some repetition of information will occur.
There are five basic principles of my approach to questions of moneymanagement and they are outlined in the sections that follow.
THE MAJORITY OF A TRADER’S MISTAKES CAN BECORRECTED, AND LOSSES CAN BE COMPENSATED, IF YOU HAVE CORRECTLY CHOSEN MONEY MANAGEMENT TACTICS AND STRATEGY
This principle directly follows from the first two postulates of mymethod—that the market has only two possible directions of movementand it moves all the time. In reality, if the market moves against an openposition, the immediate compensation of losses is possible most of thetime if you liquidate an unprofitable position and open a new one in an op-posite direction. Doing this at the right place at the right time will provideyou some additional comfort and should allow you to cover your lossesrelatively soon. If you place stops, you will be able to get fast compensa-tion of prime loss, assuming that the loss isn’t large enough to keep youfrom further participation in the market.
This technique works especially well on an intraday trade, according tothe third postulate of my method. Because the average daily range on a par-ticular currency pair is usually well-known in advance, it shouldn’t be toodifficult to calculate whether the market still has potential to cover the ini-tial loss completely or partially. This approach can easily be used in prac-tice. The details of such a technique will be described in Part V of this book.
(During an intermediate or long-term trade, the third postulate playsonly an auxiliary role and the reverse technique is a bit different.)
THE TRADER’S PLANS TO RESTRICT THE LOSS FOR A SINGLE TRADE MUST NOT BE CONSTRUCTED ON THE BASIS OF A FIXED PERCENTAGE OR SUM FROM THE TOTAL SIZE OF A TRADING ACCOUNT
Only the market itself can offer a trader the time and place at which an un-profitable position should be liquidated. The trader’s only right is to agree
98 THE IGROK METHOD
ccc_beat_097-102_ch11.qxd 6/8/06 2:39 PM Page 98
or to deny this market’s offer. Therefore, stops should be tied to the mar-ket’s technical levels instead of to a certain amount that the trader consid-ers safe to lose in one trade. The market level at which the position will beliquidated and loss will be accepted should be planned in advance and bea part of the initial trading plan. A trader always has to have a certain limitof loss affordable in any given situation, and the amount must also be cal-culated in advance. If the nearest technical level suitable for placing stopsis outside the limit of acceptable loss, then you should postpone yourtrade or cancel it altogether. Then, wait until the market comes closeenough to such levels or forms a new one, allowing you to place stops onyour position within the limits of an acceptable loss.
A TRADER SHOULD ALWAYS HAVE SUFFICIENT CAPITAL RESERVE IN CASE A SINGLE LOSS OR SERIES OF CONSECUTIVE LOSSES TAKES PLACE
You should establish your own restrictions on the margin and volume ofthe contracts you trade, irrelevant to your dealer’s or broker’s policy.These restrictions have a direct relation to an overtrade situation. A tradewith the margin of 10 to 20 percent seems optimum to me. For example,on each $10,000 to $20,000 of capital in the trading account, you can havejust one open contract at a rate of no more than $100,000. The risk of ex-cessive losses within a short period of time will be considerably limited iftrading on such conditions. At the same time, sufficient use of capital willstill allow you to make a profit, sufficient compared to the total accountsize. This is so even for an intraday trade.
AVERAGING IS ONE OF THE MOST DANGEROUS TRADING TECHNIQUES FOR USE IN REAL TRADING
Averaging is the most difficult method to control from the money manage-ment point of view, and it can be recommended only in isolated cases. Idon’t recommend it for beginners with small trading capital at all. Averag-ing is an enemy of money management and the main reason for completeloss of a trading account for the majority of traders who have already van-ished from this business.
Averaging is the trading technique of adding a new position to alreadyexisting ones that have some floating loss on them. All the positions areon the same currency pair and are open in the same direction. Basically,averaging means that all the positions are open against the prevalent mar-ket movement. In many cases, this also means that even having proof of
Money Management Rules and Techniques 99
ccc_beat_097-102_ch11.qxd 6/8/06 2:39 PM Page 99
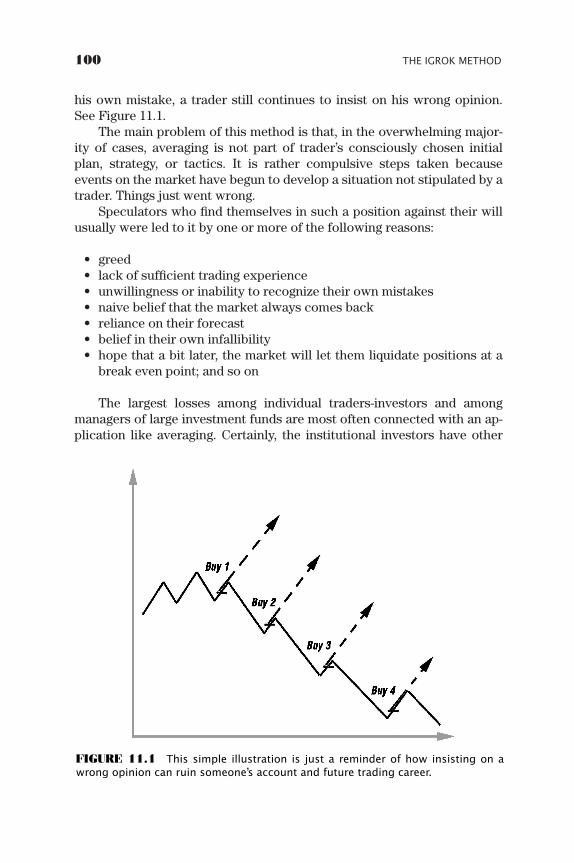
his own mistake, a trader still continues to insist on his wrong opinion.See Figure 11.1.
The main problem of this method is that, in the overwhelming major-ity of cases, averaging is not part of trader’s consciously chosen initialplan, strategy, or tactics. It is rather compulsive steps taken becauseevents on the market have begun to develop a situation not stipulated by atrader. Things just went wrong.
Speculators who find themselves in such a position against their willusually were led to it by one or more of the following reasons:
• greed• lack of sufficient trading experience• unwillingness or inability to recognize their own mistakes• naive belief that the market always comes back• reliance on their forecast• belief in their own infallibility• hope that a bit later, the market will let them liquidate positions at a
break even point; and so on
The largest losses among individual traders-investors and amongmanagers of large investment funds are most often connected with an ap-plication like averaging. Certainly, the institutional investors have other
100 THE IGROK METHOD
FIGURE 11.1 This simple illustration is just a reminder of how insisting on awrong opinion can ruin someone’s account and future trading career.
ccc_beat_097-102_ch11.qxd 6/8/06 2:39 PM Page 100
reasons for having devastating losses different from those common for in-dividual speculators. These are usually mistakes related to the definitionof a force of a long-term trend and, as a consequence, an incorrect moneymanagement strategy. There are lots of examples of such losses—BaringsBank, Long Term Capital Management, Tiger Fund, and Quantum Fund,just to name a few victims.
As you can see, even very large capital does not guarantee againstlosses due to mistakes in money management, especially using such tac-tics as averaging.
Later, I shall explain the basic principles of positional trade strategyconstruction using this technique.
RISK/REWARD RATIO (PROFIT/LOSS RATIO) SHOULD NOT NECESSARILY BE CONSIDERED EVERY TIME YOU OPEN A NEW POSITION
It is widely accepted among traders that the ratio between potential profitand probable loss always should be more than 1. This issue may also berelated to money management. If you accept this ratio from a mathemati-cal point of view, it gives you an equal number of profitable and unprof-itable trades (without mentioning possible additional losses fromcommissions, slippage, and other operational costs). In other words, itmeans that each position should satisfy the following condition: Risk/Re-ward < 1 or Profit/Loss > 1; they are basically the same.
This type of ratio can be compared to a coin toss in which, each timeyou win, your opponent pays you more than you pay him when you lose. Itis clear that even at the ratio of 50/50 (heads and tail), you guarantee your-self profit on the total of all attempts. Referrals to an RRR in all books,brochures, and training recommendation are always nearly identical,namely, the necessity of a positive ratio for the benefit of reward does notcause doubt for anybody. Moreover, for many traders, the number of un-profitable trades is larger than the number of profitable ones. Success insuch cases may be achieved only if the average profit for each profitabletransaction exceeds the average loss for each unprofitable trade.
To tell you the truth, such mathematical absolute truths give mestrong doubts and suspicions about the excessive simplicity of their con-clusions. It seems these absolutes don’t have any other interpretation, notonly because they are based on mathematics, but also because they areeasily accepted as true even from the position of common sense. How-ever, the first opinion seems to me to be the wrong one.
When I developed this book, I made a vow to make it as simple andclear as possible to be understood by a person of any level of knowledge
Money Management Rules and Techniques 101
ccc_beat_097-102_ch11.qxd 6/8/06 2:39 PM Page 101
and degree of preparation in an area not connected with trading. There-fore, my basic purpose is to give my students an opportunity to acquireand to develop practical trading skills, being guided by just ordinary com-mon sense, without stuffing their heads with excessive formulas and theo-retical calculations. In this case, I also try to avoid an excessively academicapproach and to simplify my point of view.
It seems to me that the supporters of the obligatory condition,Risk/Reward < 1, in real trading make some basic mistakes:
First, they consider each trade as an independent event, assumingthat the probability of the profit or loss reception in each concrete case is50/50. If we agree with this, then the decision to open a position each timereally could be based on simply flipping a coin. Moreover, the 3 step ele-mentary mechanical system should work in this case:
1. Flipping a coin at the beginning of a day (or at any other time), youdecide to open a position.
2. On a certain fixed distance from the opening price, place a stop thathas to limit your possible losses.
3. On the opposite side, on a fixed distance, place profitable liquidationstops on such a condition that this distance is more than the distancefrom the opening price to a stop loss placement.
A very simple and effective system will guarantee profit if you assumethat the probability of the market movement in one direction or the otheris identical at any given moment. It is clear that, in reality, nobody tradeslike this—including the RRR supporters.
Second, you should look at a trade not as a set of unconnected and in-dependent events, but as a process that has its own duration of time andconsists of several consecutive steps of the prepared plan of a trade in ac-cordance with the system of probability estimation. It is clear that, in thatcase, the probability of fulfillment of a profitable transaction is greatereach time than the probability of a loss, and constantly changes with theflow of time. If you insert in the trade one more variable component (forexample, change contract size in the same series of trades inside a tradingplan), the observance of RRR principles becomes senseless.
If we digress from a theoretical discussion and look at real trading, weshall see that in many cases it’s not easy to define the point of liquidationof a profitable position, that is, to have a target on every single trade. Theabsence of a target makes calculation of RRR impossible.
In conclusion, I need to add that neglecting principles of money man-agement will sooner or later cause a catastrophe for a trader.
102 THE IGROK METHOD
ccc_beat_097-102_ch11.qxd 6/8/06 2:39 PM Page 102
103
CHAPTER 12
Market Behaviorand TraderDiscipline
Psychology of trading and trading discipline are issues of primary im-portance for a trader. As I mentioned earlier, my desire to reducepsychological stress urged me to create a discrete-systematic trad-
ing method.Because there is plenty written on the subject of crowd psychology,
market psychology, and trading psychology, I don’t want to repeat thosebanal and well-known truths of authors who already have written enoughon these subjects. I’m essentially against citing any other peoples’ opin-ions, and prefer to think and analyze everything myself. Reading thosebooks, I have noticed that the authors usually have no problem diagnosingtraders’ common problems, but each writer offers his or her own uniquesolution. Sometimes, such a solution looks even worse than the problemitself. I have a strong feeling that some advice and recommendations that Ihave found can cause mental illness in even a previously healthy personal-ity. It’s a well-known fact that psychiatrists frequently become similar totheir patients after long-term clinical work, and that is why their recom-mendations look strange from the point of view of an ordinary person.
I assume that all of us are mentally normal adults, and we shouldn’t beengaged in personal psychoanalysis discussions. Because of this, I shalllimit myself to only a few comments and recommendations about psycho-logical issues. My trading method should offer reliable protection againstexcessive emotional pressure and stresses, and I hope you soon will beconvinced of this.
As I imagine, it would be much more useful and practical for tradersto understand from the very beginning the nature of the business that they
ccc_beat_103-110_ch12.qxd 6/8/06 2:40 PM Page 103
participate in. After this, traders can develop a correct model of their be-havior and their personal attitude to the trading process and to the marketin general.
Resolving many problems (both practical and psychological) con-nected with trading is impossible without precise understanding of themarket structure and its propelling forces and character. Problems arise,not by themselves, but as reflections of specific conditions that specula-tors work in. All these are features of the phenomenon we call the market.The mutual relations of traders and the market are complex, and I think itis wise to try to understand some of these relationships.
I think that, before making a decision to participate in the market, youshould correctly imagine what the potential problems are and how toavoid some widespread delusions, which are typical for the majority ofbeginners. As a treatment should begin with a correct diagnosis, the solu-tion to problems that traders will come across should begin with the for-mulation and definition of the problems. A trader’s psychology and theimportance of his emotional self-control were already mentioned in one ofthe early chapters of this book. Now, we will investigate problems of be-havior and mutual relations of the market and traders in more detail.
WHAT IS THE MARKET FROM THE POINT OF VIEW OF A SPECULATIVE TRADER?
I am not going to tell you common truths such as what the market is andhow it works. There is plenty of information on the formal side of specula-tive business that you can get in any book or brochure devoted to FOREX,and also on numerous sites on the Internet. I want to offer you my per-sonal vision of speculative trade problems. It seems to me that my versionof an explanation of the market and specific features of a trader’s profes-sion (though not indisputable) is worthwhile.
Two independent subjects have and always will be objects of discus-sions: the model of the market and the predictability of the market.
MODEL OF THE MARKET
A market is a situation in which there is a lack of cooperation of partici-pants that results in constant and unpredictable fluctuations of the ex-change rates.
For a long period of time, I was intrigued by the question of how todefine the market—what it may be compared with, and how to best de-
104 THE IGROK METHOD
ccc_beat_103-110_ch12.qxd 6/8/06 2:40 PM Page 104
scribe it. Reflecting on this theme, I suddenly remembered an old event.Many years ago, I witnessed an interesting scientific experiment devotedto questions of family cooperation and the ability of spouses to work to-gether in order to achieve their objectives. One of the tasks was organizedas follows:
Couples were divided and sent to two separate rooms so they couldnot exchange words or communicate with one another in any way. Theycouldn’t see one another, either. In both rooms there was a rheostat,which was attached to a common electrical network. Each of the spousescould control voltage in the network on a scale of the voltmeter installednear each rheostat. Both spouses were operating with only one’s ownrheostat and change of voltage in an electrical network, without coordina-tion of their actions. The goal was to bring the pointers on the voltmeterscales to a certain fixed position by coordinating both spouses’ efforts.
As far as I remember, only one couple out of 20 succeeded. The hus-band shot the pointer of the voltmeter to an extreme position, thus givinghis wife an opportunity to quietly make the necessary adjustment and tobring the pointer of her device into the required position. All the othercouples didn’t make it, because (despite a common goal) they couldn’tcoordinate their actions enough in order to complete the task. Everytime, the pointer of the device passed through the required position andcouldn’t be fixed, because each of the participants of the experimentacted according to his or her own ideas and did not consider the actionsof their partners.
PREDICTABILITY OF THE MARKET
The question of predictability of the market always was and always will beone of the primary discussions among speculative traders. Traders will ar-gue if and how it is possible to forecast the market. As the absolute major-ity of traders are engaged in forecasting, it is not difficult to come to theconclusion that the common opinion of the majority is that the market canbe predicted. There are many market analysts offering their services andselling their own analyses and forecasts to traders. This fact speaks in fa-vor of forecasting, too. At the same time, I constantly hear many of my fel-low traders complaining that market behavior frequently contradictsfundamental economical or political realities.
The result of correct guessing of market reaction to economical or po-litical changes is no better, and may be even worse, than flipping a coin inorder to make a decision. Similarly many traders try to predict the futurebehavior of a market only on the basis of technical analysis and with ap-proximately the same result. At the same time, it would be wrong to insist
Market Behavior and Trader Discipline 105
ccc_beat_103-110_ch12.qxd 6/8/06 2:40 PM Page 105
that the market should ignore events and factors of fundamental charac-ter when they definitely are its main driving force. It seems to me that thebasic reason for disharmony between an event and consequences of thisevent is that the fundamental factors influence the market not directly, butrather they are refracted through the market participants’ perception.
Let’s make a short list of three possible reasons for a so-called wrongmarket behavior:
1. Different traders interpret the same fundamental factors differently.
2. The intents of various market participants are different, as well as rea-sons and purposes of conducting a transaction. Reasons may includehedging, purchase of currency with the purposes of financing the in-ternational commercial project, or a bargain for a speculative profit.
3. As the market is simultaneously influenced by the various fundamen-tals and contradictory forces, the final reaction can vary, causing fluc-tuations of the market, and not comply with the expected reaction tosome fundamental event or process.
I have my own explanation about the unpredictability of the market,and its discrepancy to the fundamentals.
Despite the opinions spread among traders, the main market partici-pants—banks and other financial institutions involved in speculative opera-tions on FOREX—aren’t extraordinary at all. The large participants are notmany-headed dragons, offending the weak and taking away money fromsmall speculators, as they are frequently represented to a beginner. Besidesthe fact that they move huge capital in the marketplace and their transac-tions cause movement of the market (and hence, significant change of theexchange rates), those people are pretty ordinary individuals. Hence thiscapital is moved by ordinary people with common weaknesses. They haveno special ability to see the future, and they make serious and sometimeseven fatal mistakes as well. Bankruptcy of such whales of the financial worldas Barrings Bank, Long Term Capital Management Fund and Tiger Fund,which have taken place in the past, are examples of traders’ mistakes result-ing in fatal consequences and ruining formerly mighty financial structures.
It is quite possible that some movements of the market are provokedby such erroneous transactions. A few years ago, I found interesting sta-tistics, according to which the average career of an institutional traderlasts only about four to five years. After that, people either leave forhigher positions not related to trading, or completely change their career.For such a short period of time, it is impossible to become a true profes-sional, so I have come to the conclusion that many dilettantes play on themarket, causing all its difficult-to-explain fluctuations with many differentconsequences.
106 THE IGROK METHOD
ccc_beat_103-110_ch12.qxd 6/8/06 2:40 PM Page 106
HOW TO TREAT THE MARKET
To develop the correct attitude to a market will require some time and ef-forts spent on psychological training. You have to accept the fact that thelife experience you had when you decided to become a trader is ab-solutely useless and even harmful to your new profession. This should be-come the first and most important step in your psychological preparation.If you belong to the majority of mankind (i.e., have normal mentality andstandard reaction to irritants), then in market conditions your experi-ences and ability to think with common sense will not help you. Your stan-dard way thinking will automatically put you with a majority that thinksexactly the way you do. Unfortunately, because of the way the market isarranged, each time you join the crowd, you will definitely lose.
There is a simple and logical explanation that is clear at the common-sense level, but not everything associated with common sense is as simpleas it seems. It is assumed that everyone has common sense, including youand me. However, what we call common sense often happens to be an illu-sion, a simplification, or a political correctness that has no direct connec-tion to common sense. These illusions and politically correct assumptionshelp us to live in a society and make us similar to others, but for trading inthe market, they will work against us in the long run.
The majority of traders in the market are always wrong, and the mostcommon and widespread opinions about the future market are (in the pre-vailing majority of cases) incorrect. Conclusions and choices made by acrowd are always wrong and lead to money losses in speculative tradingoperations. To avoid possible disappointments, it will be useful for begin-ners to remember the following three basic postulates:
1. Try to have no opinion concerning the future market’s behavior. Tradeonly according to your trade system and only on signals that the mar-ket itself gives you.
2. Try to avoid wishful thinking. If you have an open position, first of allpay attention to the trading signals that contradict your point of view,instead of those that confirm it.
3. Listen attentively to other traders’ opinions. Share your ideas withcolleagues on Internet forums and in personal dialogues. If half ofyour colleagues-traders approve your idea, double your vigilance.Check up and analyze the situation once again, looking for a possiblemistake. If you have found that the absolute majority of traders shareyour point of view, immediately abandon your initial plan of tradingand make a new one. In the new plan, you should assume that themarket most likely would choose an opposite direction. The absolute
Market Behavior and Trader Discipline 107
ccc_beat_103-110_ch12.qxd 6/8/06 2:40 PM Page 107
disagreement of the majority with your opinions on current events inthe market is additional and valuable confirmation of the correctnessof your position. Such confirmation should give you an additional re-liance on the correctness of your decision.
The basic conclusion a trader should make is that, because the mar-ket is not predictable, it doesn’t pay to be engaged in predicting and fore-casting its behavior. The absence of forecast and, accordingly, opinionwill have a positive effect on a trader’s mindset. Such an approach relievesthe trader of the need to admit mistakes and to experience stress and dis-appointment resulting in it.
Besides this basic conclusion, I offer you some recommendations onhow a trader should think so that problems of human psychology have nonegative effect on the trader’s work.
Concerning the Market
• None of the experience, mindset, ability, and success of a trader in other kinds of activity is a guarantee of success in the tradingprofession.
• Common sense does not work in speculative trading in the market.• Almost everything that you assume about the market does not corre-
spond with reality.• Everything a majority of market participants consider obvious is actu-
ally never that obvious.• The “more obvious” to a trader current market situation is, the more
surprising its further development will be.• The market always goes against the opinion of a majority.• If in the past you didn’t have the ability to foretell the future, don’t
have the illusion that you can ever precisely forecast future marketbehavior.
• Events on the market always develop under the most improbablescript, and they never comply with your expectations or with thepoint of view and forecasts of other participants.
• The market eventually arrives at even the most easily predicted pricelevels, in the most confusing way.
• Try to predict the future behavior of the market; it is nothing but goodgymnastics for your brains. Never trade on your forecasts. You needother tools for this purpose.
• Any market’s behavior has a suitable explanation. The reasons for thisbehavior always become known too late.
• Accept the market as a natural phenomenon that you are not capableof understanding, explaining, or predicting.
108 THE IGROK METHOD
ccc_beat_103-110_ch12.qxd 6/8/06 2:40 PM Page 108
Concerning Profit
• The market is not a charitable organization and is not capable of en-suring profit to either a majority or all of its participants.
• Profit received by a trader does not materialize from nowhere, and itis formed at the expense of someone else’s losses.
• The market exists only because the redistribution of money alwaysoccurs at the expense of the majority of the participants for the bene-fit of the minority.
• Any position you open can become unprofitable.• When trading on the market, you should never be 100 percent sure
about anything.
THE RECOMMENDATION TO A BEGINNING INDEPENDENT TRADER
You should realize precisely and completely that your trading account isonly a tool for making money, but it is not money itself. From the momentyour money was placed on the working account as an investment, it lostits usual functions inherent in money as a universal means of payment.This money cannot symbolize your ability to exchange it for a new auto-mobile or to spend it for realization of other boons and pleasures. Fromthis moment, your investment becomes for you only a tool of makingmoney (this time real money, with all the attributes connected to it).
I hope that if you can produce for yourself a similar attitude to themarket, work itself will turn into an ordinary and quite routine businessfor you, without excessive stress.
DISCIPLINE OF TRADING
Always apply discipline to your trading. Without discipline, trading is im-possible, and the knowledge you acquire from studying this course is ab-solutely useless. If you do not find enough strength and discipline and donot consider following all the rigid rules, you would do yourself a favor byleaving this business. Even if you decide to leave the business, I considerthis book worthwhile, because such a decision will save you a lot of timeand money.
Market Behavior and Trader Discipline 109
ccc_beat_103-110_ch12.qxd 6/8/06 2:40 PM Page 109

ccc_beat_103-110_ch12.qxd 6/8/06 2:40 PM Page 110
111
PART IV
Short-Term andIntraday TradingStrategies Using the Igrok Method
Intraday trading—when a position is open and liquidated within onetrading day (24 hours)—must be considered as one of the most compli-cated types of trade and, nevertheless, most widespread among inde-
pendent individual traders. Its popularity among traders can be explainedby some subjective reasons. It might be connected to the small size of in-vestment capital and a trader’s desire to receive the greatest possible ad-vantages from margin trading with a large leverage. (As I have alreadymentioned, the appelation “day trade” is considered an artificial one, be-cause the FOREX market works round the clock, five days a week, and atrader does not have and cannot have obligations to liquidate his positionsthe same day, even if they have been open without special necessity.Therefore, when I talk about short-term trading, I mean positions held fora period from a few minutes to a few days.)
Short-term trading is considered to be extremely difficult, because itsresults are greatly influenced by market noises of significant amplitude—sometimes as big as the average amplitude of daily fluctuations. Practi-cally all short-term trading is conducted on market noises, and the trader’sproblem consists mainly of catching small and medium-sized fluctuations,basically from several pips and up to a couple of hundred pips.
ccc_beat_111-112_pt04.qxd 6/8/06 2:40 PM Page 111
The advantages of an intraday trade are obvious. First of all, it is theopportunity to work with small investment capital by taking numerous po-sitions during the day and placing very tight stops. As for profitability, itcan also be more profitable than long-term trading but probably not all thetime. That closes a very short list of advantages of intraday trading.
All intraday trading’s other distinctive features can be defined as pas-sive, because they basically have a negative character. Intraday trading onFOREX differs by high risk, high labor input, long working days, work un-der constant stress, and chronic weariness. The specific conditions of in-traday trading require a speculator’s fast reaction, absolute discipline,calmness, and endless patience. However, the real key to success is an ef-fective and reliable trading technique specially created for this type oftrading, which would allows a trader to make optimal decisions under theconstraints of limited time and market space.
112 SHORT-TERM AND INTRADAY TRADING STRATEGIES USING THE IGROK METHOD
ccc_beat_111-112_pt04.qxd 6/8/06 2:40 PM Page 112
113
CHAPTER 13
Principles of the IntradayTrading Plan
Any trade should begin with scheduling, and can’t be done without it.The planning of each transaction is very important. Planning helpsreduce or even completely eliminates the influence of negative
stress factors. It must be done in advance, to prevent the necessity ofmaking important decisions in limited time constraints, when the proba-bility of making mistakes grows exponentially. Planning is absolutely nec-essary for intraday trading; without it, it would be impossible to have anychance for eventual success.
In addition to the choice of a currency pair, preliminary planning ofeach intraday trade includes four basic elements. Decisions about themshould be made in advance. A trader has to decide the following four things:
1. Where to enter the market with a long or short position;
2. Where to cut loss (where to place a stop-loss order);
3. Where to take profit.
4. Whether a new position will be open in an opposite direction (re-verse), in case the stops are triggered.
Having the answers to all four questions prior to the beginning of atrade will make an ideal plan. However, ideal planning in the real marketisn’t always possible. Frequently, a preliminary plan requires some adjust-ment because of constantly changing market conditions. It’s almost im-possible to foresee all the possible situations in advance, and theimportance of each separate element of the trade planning is unequal.
ccc_beat_113-116_ch13.qxd 6/8/06 2:41 PM Page 113
Therefore, I follow two main rules:
1. I do not begin a trade if I haven’t decided at least the two first ele-ments, and I do not begin to trade if one or both of them are missingfrom my trading plan.
2. The correction of a preliminary plan can occur only inside a basic, ac-cepted-in-advance trading strategy. For example, some minor detailscan vary in the plan, but if the plan is already in the process of realiza-tion, I can’t change it.
The sequence of building a trading plan using the four elements statedabove should be done according to the priority which we discuss next.(Elements 3 and 4 of a preliminary plan could be considered less impor-tant details of a trading plan.)
RULES AND TECHNIQUES OF STOPS PLACING
The stop levels should be determined in accordance with one of the prin-ciples of the method, which states that the market has only two possibledirections in which to go. Therefore, stops should be placed only wherethe probability of continuation of a movement in the direction againstyour position grows sharply. The stops for liquidation of long positionsshould be placed at the point where the market gives a signal on openingof a short position. The same is true for the opposite scenario. For thisreason, in many cases and according to my strategy, I liquidate a losing po-sition and simultaneously open a new one in the opposite direction.
If for any reason you can’t determine a level of placing stops in ad-vance, it is not worth opening a position at all. Such a situation has hap-pened frequently in my practice. The problem basically arises when I searchfor an opportunity to open a position in the direction opposite to the cur-rent market movement. In order to solve this problem, I apply some moneymanagement principles and have one more rule to follow: If I cannot find anacceptable level for placing stops in a sufficient proximity from the currentmarket price, I refrain from making a transaction until the market builds toone that will include all the necessary elements. (Because we are talkinghere about intraday trading, sufficient proximity can be considered any dis-tance anywhere from 20 pips and up to an average daily range of the partic-ular currency pair you are dealing with at the present moment.)
An obligatory condition should be the binding stops to a technicallysignificant level, that is, to support, resistance, or a trendline. Stopsshould be placed only where the probability of continuation of a move-ment in the direction against your position grows sharply.
114 SHORT-TERM AND INTRADAY TRADING STRATEGIES USING THE IGROK METHOD
ccc_beat_113-116_ch13.qxd 6/8/06 2:41 PM Page 114
As far as I know, lots of traders usually place stops considering moneymanagement reasons only. In such cases, the stops are placed on somefixed distance from a position open price, and typically not further than 30to 50 pips. Sometimes, traders have some fixed amount in mind that theyallow themselves to lose in one trade. Technical levels such as trend lines,supports, or resistances (frequently being close at a short distance behindthe stops) are not taken into consideration. Such a practice results in stopsthat are triggered at the most improper moment. Too frequently, a prospec-tive and potentially profitable position is liquidated and a loss is taken.
To avoid such situations, here is another rule I always follow: Placeno stops based on reasons of money management only. The binding of astop should always be done to a specific technical level. If the nearest suit-able technical level lies on a distance more than a trader can afford to losein one transaction, he should refrain from making a trade until the marketcomes close enough to such an appropriate level.
In some cases, it might be necessary to open a position against the cur-rent market movement because of the opportunity to catch the moment of amarket turn. For this purpose, a position needs to be opened near the as-sumed top or bottom—a task that is very difficult to make with precise accu-racy. Then, the technique I call “postponed stops” can be applied. Postponedstops become attached, not to a specific price level, but to some specifictime. More often, the postponed stops attach to the end of a trading day, ses-sion, or moment when the market finally builds a new, clearly expressedtechnical level. This is especially true if this new level can become a new topor bottom on which I will be able to put my new stop. Even in these cases,however, I have to be ensured against possible excessive losses and place asafety stop outside a possible range. This range is the level, which the marketprobably won’t achieve at the present time. Usually, I place these stopswithin the limits of 100 to 150 pips from the price at which my position wasopened. A safety stop should also be bound to a certain technical level. I can-cel a safety stop when a postponed stop becomes invalid and a suitable tech-nical level at which to place stops is found.
A stop shouldn’t be cancelled under any circumstances or a trade beconducted without using stops. A stop can be moved (if necessary) in onedirection only—closer to an open position price. In order to preserve a cur-rent floating profit, a trailing stop can also be used. When moving stops,you should always place a new one first and then cancel the old one.
Principles of the Intraday Trading Plan 115
ccc_beat_113-116_ch13.qxd 6/8/06 2:41 PM Page 115

ccc_beat_113-116_ch13.qxd 6/8/06 2:41 PM Page 116
117
CHAPTER 14
Enteringthe Market
Anew position opening technique is the second most important ele-ment of preliminary trade planning. The rules of an opening of anew position and entering the market are numerous and require
very precise adherence. Because we are discussing intraday trading, thechoice of an entry point represents an especially important and difficulttask because of the limited time—one day—and limited space—the aver-age daily range of any given exchange rate. First, we should always re-member and consider the fact that, during an intraday trade, all tradingactivity reflects only a market noise. In other words, the result of any sin-gle trade is greatly influenced by the casual movements of the market andits chaotic fluctuations of significant amplitude, viewed against an averagedaily range. Therefore, the tactics that can and should be applied to intra-day trading can be characterized as the hit-and-run technique.
HOW TO CHOOSE AN ENTRY POINT
The choice of an entry point should be based on technical signals that aresubmitted by the market when it comes close to a critical level defined bya trader in advance. According to this rule, a new position opening pointshould be at the closest possible distance from the technical level that youshould define as critical at the present moment.
A certain line drawn on the chart (whether a support or resistance,trendline, or border of some formation) should be considered as the criticallevel. In some cases, a narrow price range can also be defined as a critical
ccc_beat_117-124_ch14.qxd 6/8/06 2:41 PM Page 117
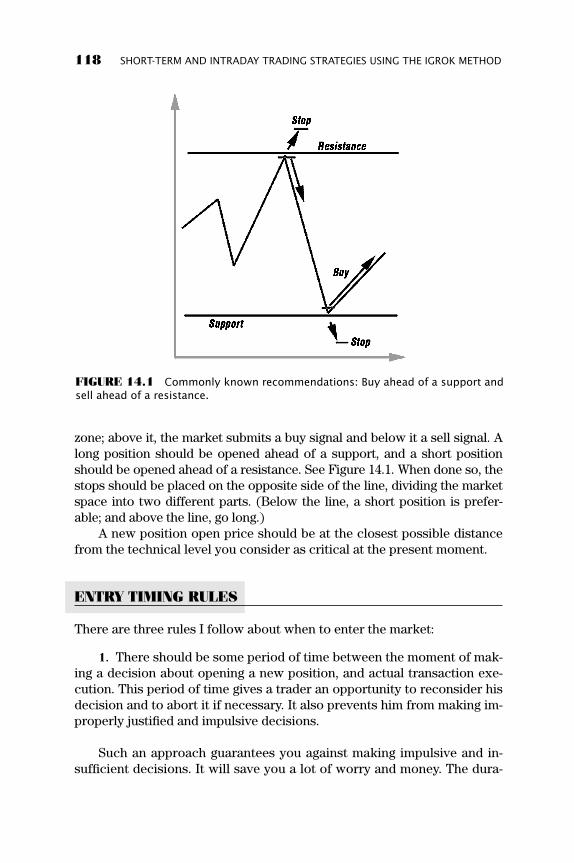
zone; above it, the market submits a buy signal and below it a sell signal. Along position should be opened ahead of a support, and a short positionshould be opened ahead of a resistance. See Figure 14.1. When done so, thestops should be placed on the opposite side of the line, dividing the marketspace into two different parts. (Below the line, a short position is prefer-able; and above the line, go long.)
A new position open price should be at the closest possible distancefrom the technical level you consider as critical at the present moment.
ENTRY TIMING RULES
There are three rules I follow about when to enter the market:
1. There should be some period of time between the moment of mak-ing a decision about opening a new position, and actual transaction exe-cution. This period of time gives a trader an opportunity to reconsider hisdecision and to abort it if necessary. It also prevents him from making im-properly justified and impulsive decisions.
Such an approach guarantees you against making impulsive and in-sufficient decisions. It will save you a lot of worry and money. The dura-
118 SHORT-TERM AND INTRADAY TRADING STRATEGIES USING THE IGROK METHOD
FIGURE 14.1 Commonly known recommendations: Buy ahead of a support andsell ahead of a resistance.
ccc_beat_117-124_ch14.qxd 6/8/06 2:41 PM Page 118
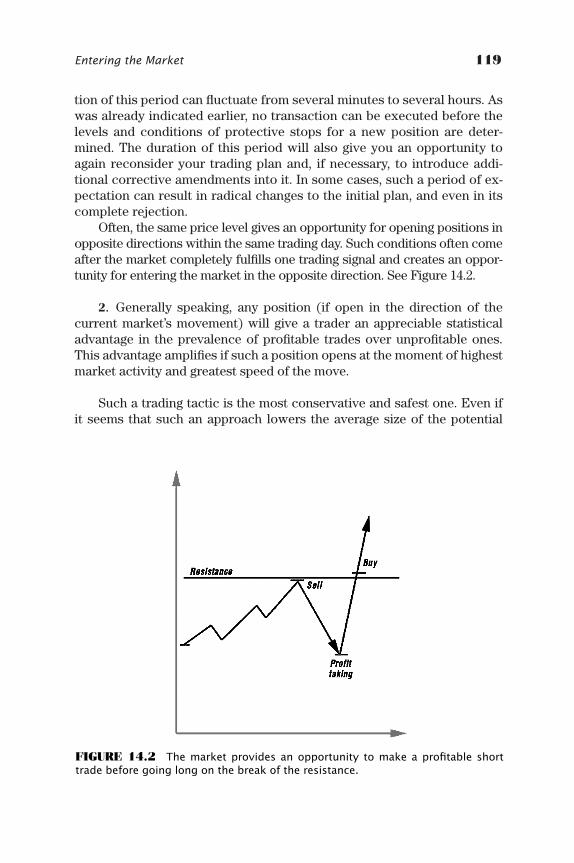
tion of this period can fluctuate from several minutes to several hours. Aswas already indicated earlier, no transaction can be executed before thelevels and conditions of protective stops for a new position are deter-mined. The duration of this period will also give you an opportunity toagain reconsider your trading plan and, if necessary, to introduce addi-tional corrective amendments into it. In some cases, such a period of ex-pectation can result in radical changes to the initial plan, and even in itscomplete rejection.
Often, the same price level gives an opportunity for opening positions inopposite directions within the same trading day. Such conditions often comeafter the market completely fulfills one trading signal and creates an oppor-tunity for entering the market in the opposite direction. See Figure 14.2.
2. Generally speaking, any position (if open in the direction of thecurrent market’s movement) will give a trader an appreciable statisticaladvantage in the prevalence of profitable trades over unprofitable ones.This advantage amplifies if such a position opens at the moment of highestmarket activity and greatest speed of the move.
Such a trading tactic is the most conservative and safest one. Even ifit seems that such an approach lowers the average size of the potential
Entering the Market 119
FIGURE 14.2 The market provides an opportunity to make a profitable shorttrade before going long on the break of the resistance.
ccc_beat_117-124_ch14.qxd 6/8/06 2:41 PM Page 119
profit, it gives a statistical advantage—the prevalence of profitable tradesover unprofitable ones. This tactic can also be considered the least stress-ful because, in most cases, some profit will be generated almost immedi-ately after opening a position.
I open the overwhelming majority (75 to 80 percent) of new positionsin the direction of the current movement of the market. The statistics ofprofitable and unprofitable trades show that the majority of profitabletrades are accomplished by opening a position in the direction of the cur-rent market movement. I am absolutely sure that if you follow the rule ofopening new positions only in the market but not against it, the statisticalprevalence of profitable trades over unprofitable ones could be over-whelming.
Planning most trades in advance provides some additional comfort toa trader. In this case, positions can automatically be taken in accordancewith the preliminary designed plan at the desired price levels. There willbe no need to monitor the market constantly, and, most of the time, I use alimit or an entry stop order for opening the initial position. I do this even ifI’m not going anywhere and am only watching the market. There are sev-eral advantages to such a trading technique:
• First of all, I’m saving my time, and if the position according to myplan is taken using a limit order, then I can place a protective stop si-multaneously. After that (if no reverse was planned), I have nothing toworry about and there is no need to watch the price action at all.
• In case the position is taken through an entry stop order, then all Ineed to do is set an alarm. When the computer gives me a signal thatthe order is executed, then I place protective stops and once againhave nothing to worry about and can spend my time doing somethingelse besides watching the market.
• Automatic position entry also saves worry. It gives me a feeling thatI’m in control of the situation at any moment. I feel myself in charge ofthe trading process, because I chose the price at which to enter andexit the market, as well as price at which to give up if things turnedbad for me. If, for some reason, the market didn’t reach my projectedprice level, I consider it as the market’s own problem, and there wasno good trading signal or price to enter it.
• Automatic order execution also allows me to enter and exit the mar-ket at the exact price I planned from the very beginning, and not to re-consider my previous trading plan too often. In case the positionopens through an entry stop order, I’m not missing the move if themarket is moving too fast.
• Such a technique also supports my money management requirementsand allows me to calculate my potential losses in advance.
120 SHORT-TERM AND INTRADAY TRADING STRATEGIES USING THE IGROK METHOD
ccc_beat_117-124_ch14.qxd 6/8/06 2:41 PM Page 120
I open up to 85 to 90 percent of my positions using this technique, andthe overwhelming majority of them are in the direction of the currentmovement of the market.
3. If, in accordance to a trading plan, the position should be openedin the direction opposite to the most current movement of the market, itwould be better to do it during the least market activity and its slowestmovement.
Many traders have failed and were compelled to leave business for-ever because their basic tactics for a trade were mostly based on attemptsto catch the moments of the market reverse. It is incredibly difficult tocatch the exact moment of change in the trend or the market direction, es-pecially when trading short-term contracts. In longer-term trading, this is-sue looks a bit easier and can be successfully performed in some cases.Using the common sense trading technique often allows me to catch theprice close to extreme with a relatively high degree of success, but it alsoworks well in case my interest at the moment is not higher profit butrather the safest way to make some profit.
Because the trend has high momentum and inertia, the reverseprocess usually takes a significant period of time. Therefore, it is possibleto open positions in the direction opposite to the direction of a previousor current market’s movement only when the market calms down a bitand shows signs of inability of further movement in the initial direction.The speed of its movement should be considerably reduced, and the mar-ket should be moving sideways before it gives a chance to open a new po-sition. If the market stops moving during some period of time and doesnot form new local extremes, you can think of opening a new position inthe opposite direction. The details will be described in the templates ofthis book.
4. The most effective trading tactic can be considered the one that as-sumes a new position opening only in the most probable direction of move-ment of a day. A good trading plan should never be based on possibleretracement of the main move. It’s also dangerous to open a new positionagainst the main direction of a day movement, if the market has already de-termined this direction. The less time remaining until the end of a tradingday (24 hours), the less is the probability that the market will suddenlychange the direction of the main intraday movement to the opposite.
This recommendation also follows directly from the philosophicalconcept of the method. First of all, the market is not a sewing machine inwhich the needle runs up and down with identical amplitude and speed.
Entering the Market 121
ccc_beat_117-124_ch14.qxd 6/8/06 2:41 PM Page 121
Usually, if the market is active enough, it has a highly visible intraday ba-sic direction.
Statistically, before a reversal, there should be a certain period ofmarket hesitation that a trader can use either for liquidation of the prof-itable position or for planning to open a new position in the opposite di-rection. However, all this can be correct and will work only when themarket has not yet chosen the direction of the main intraday trend, andhas not finished formation of a daily trading range. The market also re-quires some time to reverse and to begin its movement toward the oppo-site side of the previously established range—especially if there is notmuch time left before the end of the day and the average amplitude hasn’tbeen seen yet. Therefore, at the opening of new intraday short-term posi-tions, I consider the following rules 5 and 6 useful:
5. Do not open new positions on the European currencies againstUSD at the beginning of a trading day or during the Asian trading session.
This rule is also connected to the fact that, more often than not, theincrease in activity of European exchange rates begins only after theopening of the European trading session. During the Asian session, therates of European currencies against USD and other non-Asian currenciestrade passively, most of the time in a narrow range that demonstrates clas-sical behavior of the market in a narrow side trend. There are rare excep-tions to this rule, such as when I consider making a safe short (20 to 40pips) trade with tight stops and to liquidate the position prior to the begin-ning of the European session. This situation does not happen very often,and I try to not make many of these trades. From the time when I was anabsolutely green novice and traded without stops, I remembered well thatthe longest lasting positions were targeted for a fast profit. Therefore, Idon’t recommend such trades to my students (especially beginners), and Idon’t plan to describe this technology in this book.
The other kind of exception occurs in cases when, during the Asiansession, the rate of the European currency reaches some critical level, thedefinition of which is possible by analyzing the longer-term charts likedaily, weekly or monthly. In these cases, it is necessary to react to the sig-nal received, even if such situations happen very rarely.
6. I do not open new positions against the major market move of theday after the beginning of the New York trading session, and especially af-ter ending of the European session.
It is not so difficult to determine where the main movement of a dayhas been directed. In most cases, it could be clearly seen on the charts by
122 SHORT-TERM AND INTRADAY TRADING STRATEGIES USING THE IGROK METHOD
ccc_beat_117-124_ch14.qxd 6/8/06 2:41 PM Page 122
the closing time of the European session. It is characterized by a highlyvisible intraday trend and also by expansion of the intraday range, whichhas occurred during the entire previous period of time from the beginningof a current trading day.
The only case in which you can accept some risk and open a new po-sition against the main movement of a day during the New York session isas follows:
• The market has reached one of the main technical levels such as a ma-jor support or a major resistance. This level should have more than lo-cal intraday significance, but it has to be easily determined on dailycharts as a minimum.
• The daily range has already exceeded its average typical range for theparticular currency by the time the major technical level wasachieved.
• The main move of the day was formed as a result of an impulsive mar-ket reaction to someone’s comment or market news.
When these conditions are met, there is a possibility for a counter-trade with stops placed outside the most current extreme, major support,or resistance zone. However, the probability of making a profitable tradein such a situation does not usually exceed 50 percent.
Entering the Market 123
ccc_beat_117-124_ch14.qxd 6/8/06 2:41 PM Page 123

ccc_beat_117-124_ch14.qxd 6/8/06 2:41 PM Page 124
125
CHAPTER 15
Exitingthe Market
POSITION LIQUIDATION AND PROFIT TAKING
In my trading method, I use several different ways to take profit and to liq-uidate profitable positions. The choice of one or the other in a real marketsituation depends on the current technical picture, presence or lack oftrading signals, timing, market speed, amplitude and sequence of the pre-vious fluctuations, short- and medium-term trend direction, and such. It’sabsolutely impossible to describe each and every combination of differentfactors. Here, I will give you just a few general tips on how and when aprofitable position can be squared and profit pocketed.
PROFIT-TAKING AT THE MOMENT YOU RECEIVE A SIGNALTO OPEN A POSITION IN THE OPPOSITE DIRECTION
At first glance, such a way of trading may seem in general like the idealone. This way seems like it would allow a trader to stay in the market for-ever by switching his positions from long to short ones, taking profits andlosses, and every time reversing in the opposite direction. However, for amillion obvious reasons, such a scenario is almost absolutely impossible,especially if trading on an intraday basis. Even if you exclude such fac-tors as physical impossibility to control the market for the whole day, fivedays a week, and that more trades usually result in fewer profits, it still
ccc_beat_125-132_ch15.qxd 6/8/06 2:42 PM Page 125
wouldn’t be reasonable to try to catch every intraday fluctuation. For in-traday trading, for example, when a trader has to deal within a limitedtime frame and market space, a hit-and-run tactic might be considered asthe most sufficient and effective. This tactic does not give traders an op-portunity to switch from one position to the opposite one, without risk-ing their floating profit every time they wait for a signal to take profit andopen a position in the opposite direction.
The average daily range, even on the most volatile and active cur-rencies, doesn’t usually exceed 180 to 200 pips. Also, a lifetime of an in-traday position rarely lasts more than several hours—and sometimes,even minutes. It is also obvious that in order to complete such a dailyrange and stay within it for a 24-hour period, the market has to fluctuateinside this range, going up and down through the same levels severaltimes in one day. Thus, we can come to a conclusion that because themarket most likely gives the opportunity to enter opposite positions atthe same price level but at different moments of the day, a profit-takingtactic based on trading signals cannot be considered as too effective. Of course, there are some exceptions to the rule. I think that the tacticsdescribed earlier can be used in such cases as when, during the day, the market approaches major and long-term trendlines, supports, andresistances, and different formations’ borders—all of which can beidentified on longer-term charts starting with daily. In these cases,traders also have an opportunity not just to liquidate their profitable po-sition, but also to open a new one at the same price but in the oppositedirection.
PROFIT-TAKING IF THE MARKET SPEEDS AND ACTIVITY DECREASES
This criterion can also be used as a signal to pocket your profits. Unfor-tunately, in practice it’s not always possible to know exactly if the mar-ket activity decrease means that it is getting ready to turn in theopposite direction, or if the initial move will continue after some mar-ket hesitation and trading sideways. However, there are some signs thatmay help you to determine further market intentions. First of all, usu-ally the turn doesn’t happen at once. It usually takes some time tochange the direction of the move to the opposite. Also, the market usu-ally forms a sharp top or bottom (V-formation) when reaching a real ex-treme, even if this extreme is a local one and can be seen on an intradaybasis. So if the market has formed a sharp top or a bottom and then
126 SHORT-TERM AND INTRADAY TRADING STRATEGIES USING THE IGROK METHOD
ccc_beat_125-132_ch15.qxd 6/8/06 2:42 PM Page 126
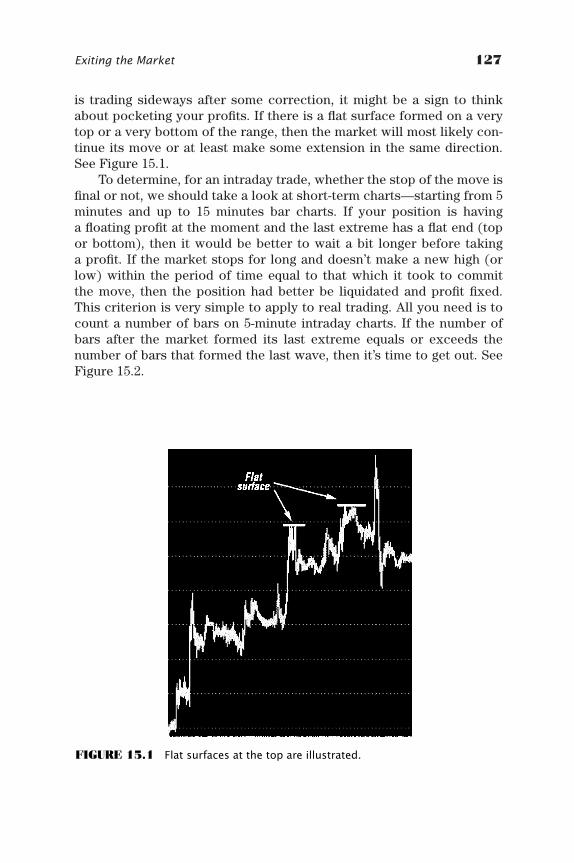
is trading sideways after some correction, it might be a sign to thinkabout pocketing your profits. If there is a flat surface formed on a verytop or a very bottom of the range, then the market will most likely con-tinue its move or at least make some extension in the same direction.See Figure 15.1.
To determine, for an intraday trade, whether the stop of the move isfinal or not, we should take a look at short-term charts—starting from 5minutes and up to 15 minutes bar charts. If your position is having a floating profit at the moment and the last extreme has a flat end (topor bottom), then it would be better to wait a bit longer before taking a profit. If the market stops for long and doesn’t make a new high (orlow) within the period of time equal to that which it took to commit the move, then the position had better be liquidated and profit fixed.This criterion is very simple to apply to real trading. All you need is tocount a number of bars on 5-minute intraday charts. If the number ofbars after the market formed its last extreme equals or exceeds thenumber of bars that formed the last wave, then it’s time to get out. SeeFigure 15.2.
Exiting the Market 127
FIGURE 15.1 Flat surfaces at the top are illustrated.
ccc_beat_125-132_ch15.qxd 6/8/06 2:42 PM Page 127
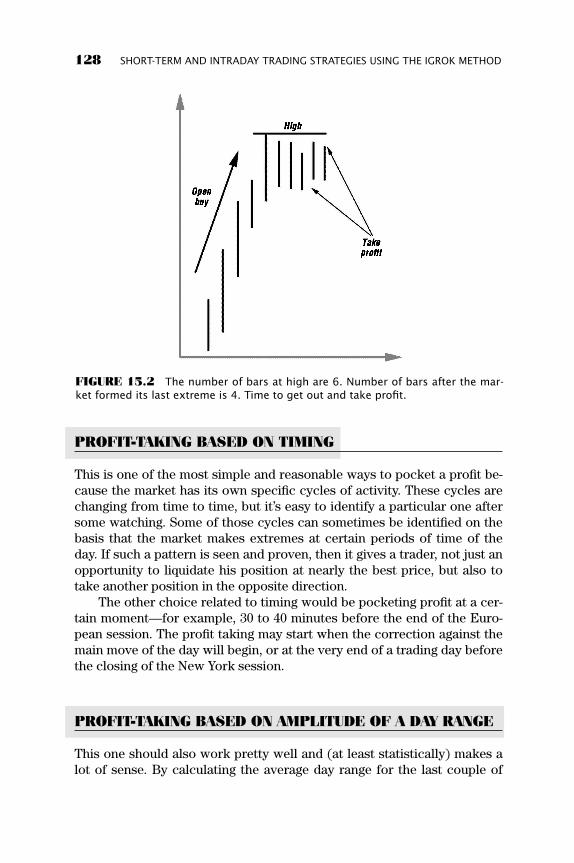
PROFIT-TAKING BASED ON TIMING
This is one of the most simple and reasonable ways to pocket a profit be-cause the market has its own specific cycles of activity. These cycles arechanging from time to time, but it’s easy to identify a particular one aftersome watching. Some of those cycles can sometimes be identified on thebasis that the market makes extremes at certain periods of time of theday. If such a pattern is seen and proven, then it gives a trader, not just anopportunity to liquidate his position at nearly the best price, but also totake another position in the opposite direction.
The other choice related to timing would be pocketing profit at a cer-tain moment—for example, 30 to 40 minutes before the end of the Euro-pean session. The profit taking may start when the correction against themain move of the day will begin, or at the very end of a trading day beforethe closing of the New York session.
PROFIT-TAKING BASED ON AMPLITUDE OF A DAY RANGE
This one should also work pretty well and (at least statistically) makes alot of sense. By calculating the average day range for the last couple of
128 SHORT-TERM AND INTRADAY TRADING STRATEGIES USING THE IGROK METHOD
FIGURE 15.2 The number of bars at high are 6. Number of bars after the mar-ket formed its last extreme is 4. Time to get out and take profit.
ccc_beat_125-132_ch15.qxd 6/8/06 2:42 PM Page 128
months (for example), we can easily make a projection for any current dayin terms of its possible range. So, the position might be liquidated and profittaken if the market has already reached its average day limits and fully com-pleted its daily task. Such an approach is usually good when a position wastaken after the market has already formed some intraday range and the tim-ing (in regards to cyclical changes) is also taken into consideration.
So we have a variety of different approaches to profitable position liq-uidation, but it is also important to remember that the time frame for eachtrade should be planned (even roughly) in advance. It would be better tofollow the initial plan from the very beginning to the very end, unlesssome dramatic market changes call for its review and reconsideration.
EXITING A POSITION WITH A SIMULTANEOUS REVERSE
Position liquidation with simultaneous opening of a new one in the oppo-site direction is a method that I apply frequently. In most cases, I apply itat the moment of liquidation of an unprofitable position, but there arecases in which the reverse occurs at liquidation of a position with profit.Between these two cases, there is a basic difference, and it makes senseto consider each of them separately.
Simultaneously Reverse and Liquidate an Unprofitable Position
Simultaneously opening a new position in the opposite direction and liqui-dating a previous one is a quite normal and natural action for me. Why not?Things went wrong—not as I was hoping in the beginning while making mytrading plan. The market has to go somewhere and there are just two pos-sible directions for that. So I don’t hesitate. I had better take a positionwhere the market goes, instead of sitting and doing nothing after the stopswere triggered. Because I try not to have an opinion about future marketbehavior and its direction, I do not feel any stress in relation to liquidationof one position and opening the opposite one. Really, why should I worry ifthere is a confirmation that the market is choosing the opposite directionand it is possible to earn money trading either way? By receiving confirma-tion that the market is not going to follow in a direction originally selectedin accordance with my initial plan, it would be quite logical to try toachieve success by reversing a position. In such cases, the new positionusually opens automatically at the moment the stops trigger. My only con-cern is that such an action always has to be part of the initial trading plan.Like the rules of stops placing that we discussed, opening a new position atreverse also has to be carried out using similar tactics. However, in order
Exiting the Market 129
ccc_beat_125-132_ch15.qxd 6/8/06 2:42 PM Page 129
to make a decision to reverse a position, there should be some certainterms and preconditions met to avoid possible problems and complica-tions. There are also some times when the reverse is not recommended be-cause it can be too risky.
The presence of the following factors will favor position reverse, ifthey occur at the moment of reverse:
• The market breaks a major technical level, which can be determinedat the analysis of intermediate- and long-term charts.
• There is an opportunity to place tight stops, and the risk taken doesn’texceed a safe level in case of possible loss.
• The market is active and its speed is high.• The intraday range is broadening.• There is an expressed intermediate-term trend in the direction of the
newly open position.
The reverse of a position can appear inexpedient and risky if:
• Activity of the market and its speed are rather low.• The reversed position will be open against the main direction of the day.• The new position will be directed against the intermediate trend.• There are less than two hours before the end of a trading day.• The market has already formed or exceeded its average daily amplitude.• The point of reverse is not tied to any significant technical level.• The nearest technical level suitable for placing stops is too far from it
and is outside an acceptable range.
These common reasons are not rigid rules, and the decision should bemade with regard to the particular situation. Some preliminary analysisand consideration of several possible variations should also be done. Inany case, the decision to reverse a position should be made in advanceand be part of the whole trading plan from the time the initial position wasopened. The reverse is best when you place the stop that will be activatedat the same price at which the initial position was liquidated.
Contract Size Increase (Doubling) for a Reversed Position
I apply this method rarely, though it is known that many traders use itwidely. It seems to me that, in many cases, there is no practical expedi-ency in such an action. Rather, the incentive is elementary greed, the de-sire to recoup and to cover losses as soon as possible. More so, increasingcontract size is related to psychology rather than to a trader’s everydayroutine (only in a case when such a practice is not part of a mechanical
130 SHORT-TERM AND INTRADAY TRADING STRATEGIES USING THE IGROK METHOD
ccc_beat_125-132_ch15.qxd 6/8/06 2:42 PM Page 130
trading system used by a trader). I think that mistakes or lack of profes-sionalism should not be corrected at the expense of such purely mechani-cal actions as a contract size increase at the moment of position reversal,because the risk also increases accordingly.
When several consecutive losses during the same trading session oc-cur (for example, a choppy market situation took place), increasing con-tract size can result in severe damage to the trading account. Therefore, Iapply a double contract size at a position reverse only when there is anopportunity to place a very tight stop. More often, I liquidate the surplusin the contract size as soon as the profit covers the initial loss. Besides, Iprefer to double a contract size after two consecutive losses only. If athird one happens this time, I stop trading until the next day, when newtrading opportunities and signals will be generated.
Reverse at the Moment of Liquidation of the Previous Profitable Position
I use this scheme rarely, but more often than I apply the technique of dou-bling the contract size. I use it seldom, not because I do not like such anapproach, but because such a method requires great accuracy, attention,and certain conditions that need to develop in the market. Unfortunately,in practice, the conditions for this kind of trade are rare, especially for in-traday trading.
The reverse with simultaneous liquidation of a profitable position ispossible under two circumstances:
1. The market reaches a strong technical level that it is unlikely to pass.
2. The market gives a signal for opening a position in the opposite direction.
In both cases, a trade execution can be made directly by a traderthrough a market order, whether he looks after the market at this momentor it is done automatically. The automatic order occurs when an old posi-tion is liquidated through a limit order at the level calculated in advance,that is, directly ahead of strong technical support or resistance. A new po-sition then opens simultaneously by the same order. Externally, it lookslike an ordinary limit order but twice the size of the initial contract. In bothvariations, stops on a new position should be placed beforehand, too.
In the second case, for liquidation of one position and the opening ofanother position, a trailing stop can also be used along with the doublingsize of the usual contract. After an order execution, a new position shouldbe protected immediately by automatic stops.
Exiting the Market 131
ccc_beat_125-132_ch15.qxd 6/8/06 2:42 PM Page 131

ccc_beat_125-132_ch15.qxd 6/8/06 2:42 PM Page 132
133
CHAPTER 16
The Importanceof Timing
The market has three basic characteristics that a trader must take intoconsideration: level, direction, and timing. Trading is the art of being inthe right place at the right time, that is, on the right side of the market.
I have already discussed how to determine the right place for entering themarket and how to use the market fluctuations. Now, it’s time to talk aboutthe timing factor. As the market events develop (not only in space, but alsoin time), it is necessary to take into account the entire picture at any mo-ment a position is opened or liquidated. Timing is an extremely importantfactor in trading, and a sense of timing is an essential component of atrader’s success in the market. The right choice of timing for position open-ing and liquidation is a very complicated task and demands a lot of atten-tion, patience, and (unfortunately) rather significant experience of a trader.
Thus, positions opened in the direction of particular market move-ment—at the moment when the market forms new high or low of the day—will give a trader some certain statistical advantage. This is especially truewhen the market simply doesn’t have enough time to complete its averagedaily range within the period of time left before the end of a trading day.
Normally, it wouldn’t be very difficult for an experienced technicaltrader to determine future market trading levels more or less precisely, butthe forecast of the time frame of such an event is rather difficult if not impos-sible. Mistakes in precise forecasting are so great that they often compel atrader either to liquidate a potentially very promising position prematurely,or to keep a profitable position longer than necessary. An unprofitable posi-tion carried with a floating loss is often liquidated at the moment it has accu-mulated the greatest possible loss and right before a turn for the better.
ccc_beat_133-140_ch16.qxd 6/8/06 2:42 PM Page 133
However, the connection between amplitude of the market fluctua-tions and its direction also exists, and the knowledge of some commonlaw related to timing could essentially help a trader in his choice of theright place at the right time. Besides, because the market is open 24 hoursa day, it is quite natural that a trader is not capable of supervising it con-stantly. Hence, it is necessary to organize his working hours so that pres-ence in the market would coincide with periods of the best activity andwould bring a maximum possible effect. For these purposes, it is impor-tant to have an idea of how time and market space are tied together.
The market has to complete its average trading range daily. So, thedistance between high and low of each next day can be projected in ad-vance with certain accuracy.
This statement is one of the basic three postulates of my tradingmethod. It is time to talk about it in more detail, because this fact has a di-rect relation to intraday speculative trade, and some of my trading tem-plates are constructed on its basis.
Really, this feature of the market rather rigidly connects space and time.If you take into the account the inertia of the market, such an approach willallow you to more effectively determine the levels of opening and liquidatingyour positions, and to make these transactions at the right time.
Thus, the positions opened in the direction of the current market move-ment at the moment when the market forms new High or Low of the daywill give traders some certain statistical advantage. This is especially truewhen the market simply doesn’t have enough time to complete its averagedaily range within the period of time left before the end of a trading day.
To execute the order to open a new position, I typically use entrystops so as not to waste time on transaction execution while trying toplace my order at a market price. Generally, such tactics works very wellbecause, at the expense of stops accumulation, the market frequently ac-celerates at the moment of establishing a new daily High or Low.
This trading tactic is very effective when:
• Trading is made at a period of the best activity of the market.• The currency chosen for trade has the largest average daily range.• The position opens in a direction of the current intermediate trend.• The establishment of new high or low coincides with a break of an im-
portant technical level.• There is not enough time left until the end of the trading day, and
the average minimum range typical for the given currency hasn’t yetbeen formed.
The last item is especially interesting to traders, because it gives thema statistically advantageous position. The described situation hardly in-
134 SHORT-TERM AND INTRADAY TRADING STRATEGIES USING THE IGROK METHOD
ccc_beat_133-140_ch16.qxd 6/8/06 2:42 PM Page 134
creases chances for taking profit, but at the same time allows the trader tocalculate a point of the position liquidation. The position may be closed atthe moment when the market achieves the average range in which it canliquidate your position, or it may be saved until the end of the day and beliquidated directly before closing of the market. In the second case, the in-traday profit is frequently more significant, because the market often ex-ceeds the minimum of its daytime range.
CYCLIC CHANGES IN MARKET ACTIVITY PERIODS
I have witnessed many similar cycles when, almost every day, not onlyUSD/JPY but also USD/CHF, USD/DEM, and Cable formed their daily trad-ing range during a single market session. Long-term supervision of themarket has allowed me to determine some other laws having a direct rela-tion to timing. These laws are considerably more important for a short-term trade than for a positional one. The intraday trade is most subject toinfluence of timing, and requires application of various trading tactics, de-pending on the moment of opening or liquidating a position.
From the start, I would like you to pay attention to the periodicallyvarying character of market behavior. Activity of the market and an intra-day trading range are not coordinated. Changes in market activity occurcyclically. They are characterized by displacement of periods of the in-creased and decreased activity on a 24-hour scale of a trading day duringmany consecutive days. For example, there have been cycles in which thedaily trading range was completed in a period of one working session. Forexample, the daily range completion during the limited time is character-ized by forming the top and bottom of the whole day during one of threebasic sessions: Asian, European, or New York. It means that the high andlow of the trading day were formed in no more than eight hours, and, forthe rest of the trading day, the market was moving inside the alreadyformed range.
Sometimes, these cycles are highly visible, and sometimes they areless obvious. Their variety is huge. From that great number of various cy-cles that I had to observe while trading the basic currencies, the followingwere the most memorable:
• The market formed its daily range during a single session. See Figures16.1 a, b, and c.
• Directly before the New York session (10 to 20 minutes prior to its be-ginning), the market formed the top or bottom of the daily range. Forexample, within the time left until the end of the day, the markettraded inside the already formed range. See Figure 16.2.
The Importance of Timing 135
ccc_beat_133-140_ch16.qxd 6/8/06 2:42 PM Page 135
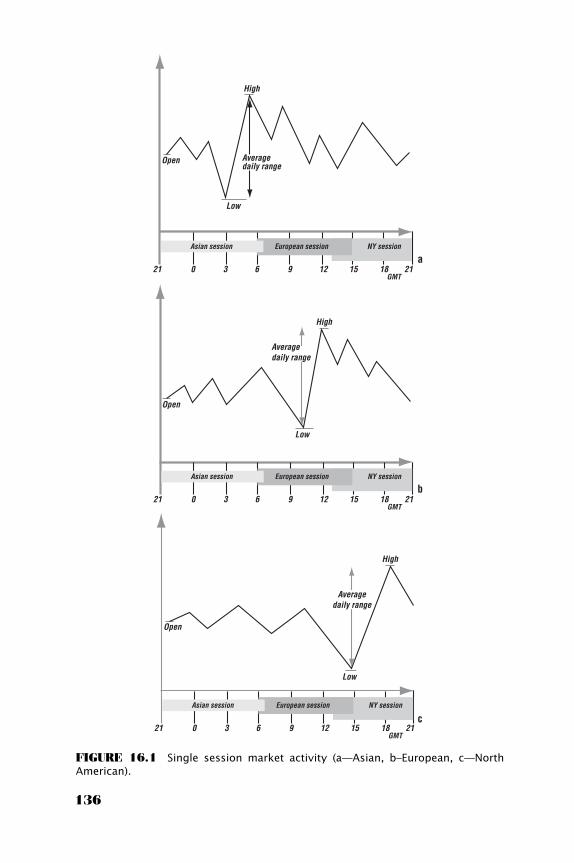
High
Open Averagedaily range
Low
21 0 3 6 9 12 15 18 21GMT
Asian session European session NY session
a
High
Open
Averagedaily range
Low
21 0 3 6 9 12 15 18 21GMT
Asian session European session NY session
b
FIGURE 16.1 Single session market activity (a—Asian, b–European, c—NorthAmerican).
High
Open
Averagedaily range
Low
21 0 3 6 9 12 15 18 21GMT
Asian session European session NY session
c
136
ccc_beat_133-140_ch16.qxd 6/8/06 2:42 PM Page 136
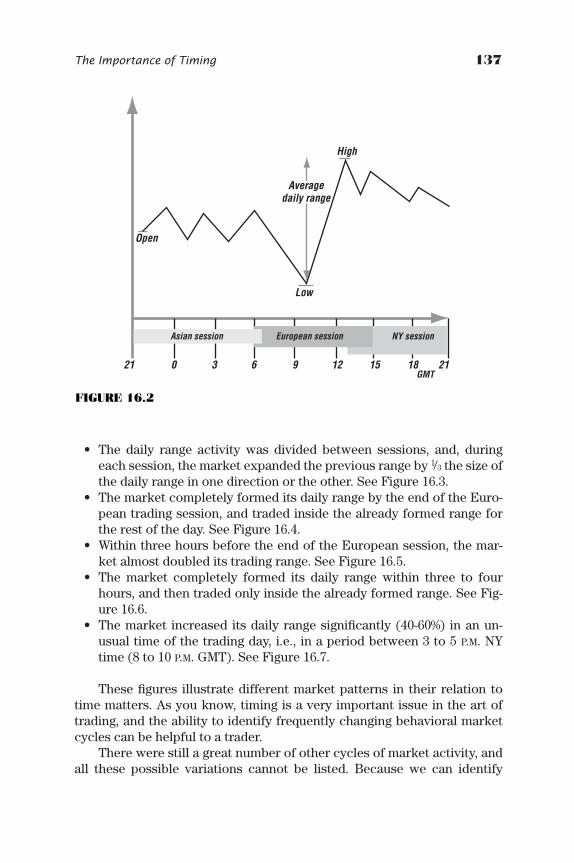
• The daily range activity was divided between sessions, and, duringeach session, the market expanded the previous range by 1/3 the size ofthe daily range in one direction or the other. See Figure 16.3.
• The market completely formed its daily range by the end of the Euro-pean trading session, and traded inside the already formed range forthe rest of the day. See Figure 16.4.
• Within three hours before the end of the European session, the mar-ket almost doubled its trading range. See Figure 16.5.
• The market completely formed its daily range within three to fourhours, and then traded only inside the already formed range. See Fig-ure 16.6.
• The market increased its daily range significantly (40-60%) in an un-usual time of the trading day, i.e., in a period between 3 to 5 P.M. NYtime (8 to 10 P.M. GMT). See Figure 16.7.
These figures illustrate different market patterns in their relation totime matters. As you know, timing is a very important issue in the art oftrading, and the ability to identify frequently changing behavioral marketcycles can be helpful to a trader.
There were still a great number of other cycles of market activity, andall these possible variations cannot be listed. Because we can identify
The Importance of Timing 137
High
Open
Averagedaily range
Low
21 0 3 6 9 12 15 18 21GMT
Asian session European session NY session
FIGURE 16.2
ccc_beat_133-140_ch16.qxd 6/8/06 2:42 PM Page 137
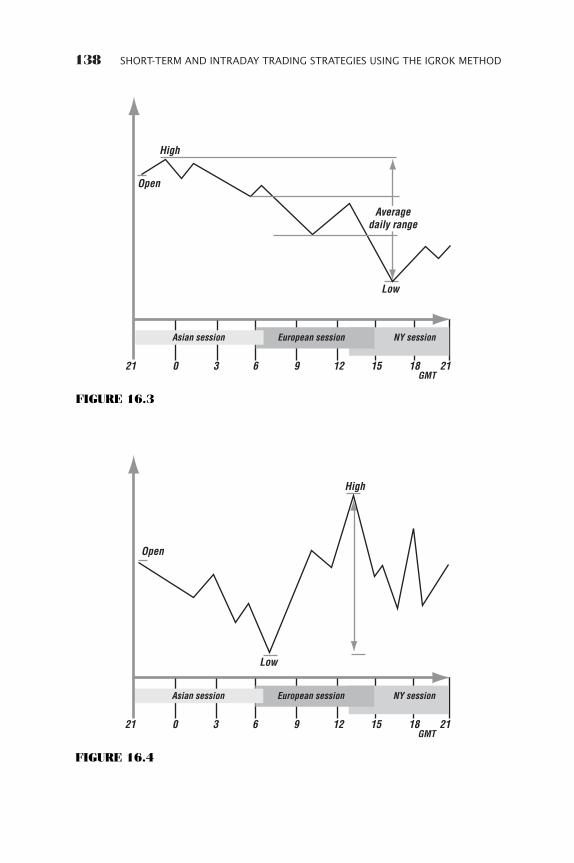
138 SHORT-TERM AND INTRADAY TRADING STRATEGIES USING THE IGROK METHOD
High
Open
Averagedaily range
Low
21 0 3 6 9 12 15 18 21GMT
Asian session European session NY session
FIGURE 16.3
High
Open
Low
21 0 3 6 9 12 15 18 21GMT
Asian session European session NY session
FIGURE 16.4
ccc_beat_133-140_ch16.qxd 6/8/06 2:42 PM Page 138
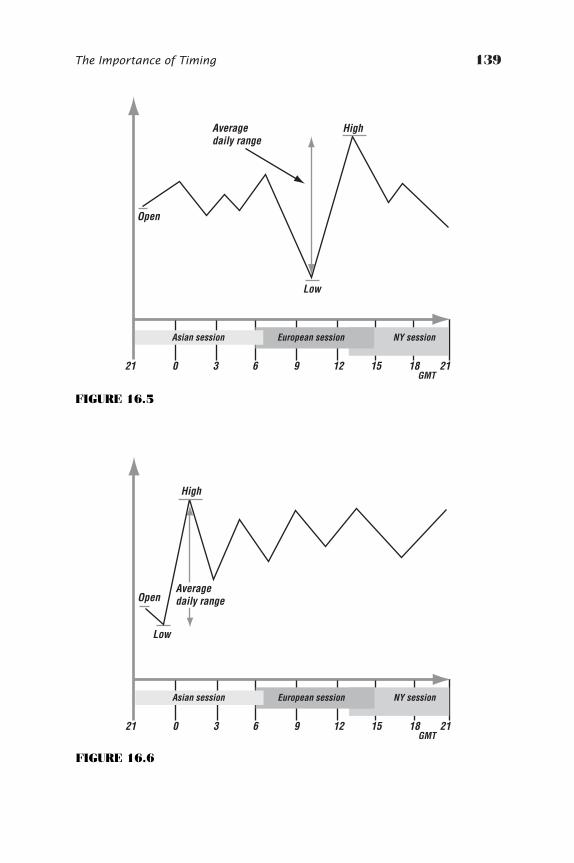
The Importance of Timing 139
High
Open
Averagedaily range
Low
21 0 3 6 9 12 15 18 21GMT
Asian session European session NY session
FIGURE 16.5
High
OpenAveragedaily range
Low
21 0 3 6 9 12 15 18 21GMT
Asian session European session NY session
FIGURE 16.6
ccc_beat_133-140_ch16.qxd 6/8/06 2:42 PM Page 139
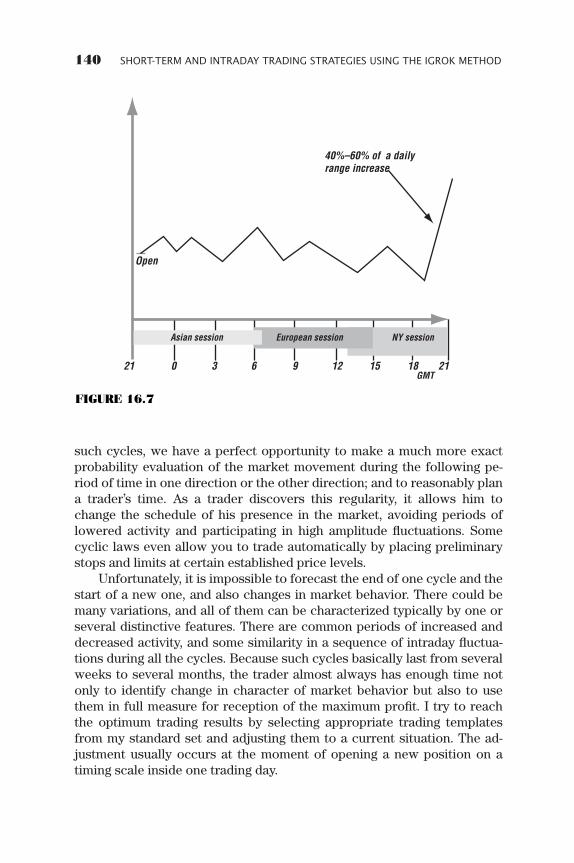
such cycles, we have a perfect opportunity to make a much more exactprobability evaluation of the market movement during the following pe-riod of time in one direction or the other direction; and to reasonably plana trader’s time. As a trader discovers this regularity, it allows him tochange the schedule of his presence in the market, avoiding periods oflowered activity and participating in high amplitude fluctuations. Somecyclic laws even allow you to trade automatically by placing preliminarystops and limits at certain established price levels.
Unfortunately, it is impossible to forecast the end of one cycle and thestart of a new one, and also changes in market behavior. There could bemany variations, and all of them can be characterized typically by one orseveral distinctive features. There are common periods of increased anddecreased activity, and some similarity in a sequence of intraday fluctua-tions during all the cycles. Because such cycles basically last from severalweeks to several months, the trader almost always has enough time notonly to identify change in character of market behavior but also to usethem in full measure for reception of the maximum profit. I try to reachthe optimum trading results by selecting appropriate trading templatesfrom my standard set and adjusting them to a current situation. The ad-justment usually occurs at the moment of opening a new position on atiming scale inside one trading day.
140 SHORT-TERM AND INTRADAY TRADING STRATEGIES USING THE IGROK METHOD
Open
40%–60% of a dailyrange increase
21 0 3 6 9 12 15 18 21GMT
Asian session European session NY session
FIGURE 16.7
ccc_beat_133-140_ch16.qxd 6/8/06 2:42 PM Page 140
141
CHAPTER 17
Trading StrategyDuring the
Central BankIntervention
From time to time, the central bank (CB) within a particular country,alone or with the support of the CBs of other countries, launchescurrency interventions into the market by buying up the weakening
currency, in an attempt to artificially keep its rate stable. Bank of Japan(BoJ) is especially notable for such actions. It makes sudden and large-scale purchases of currency packages, thus keeping the yen rate againstthe dollar, or vice versa. This depends on the end of the currency channelacceptable for the CB at which the current rate is located. These actionsof the CB always cause strong, fast, and large amplitude movement thatmay result in dramatic consequences for traders, leading to complete lossof their trading account. If traders are not ready for such action, thismovement may inflict irreparable damage on their accounts within a fewminutes.
To lower the risk of the loss during a sudden intervention and to useinterventions for their benefit, traders should know and always rememberthe traits of this phenomenon, which is not rare in the currency market.
The first trait of an intervention is the direction of its movement. Anintervention is always undertaken in the direction opposite to the maincurrent trend. This can be seen in daily and weekly charts of currency ratefluctuations. See Figure 17.1.
The second trait is the amplitude of the movement. One should re-member that an intervention is aimed at a significant correction of the pre-sent rates. This amplitude fluctuates from 300 to 600 pips, depending onthe scale of the intervention and the number of its participants. Duringconcerted interventions, when several CBs of different countries partici-
ccc_beat_141-144_ch17.qxd 6/8/06 2:43 PM Page 141
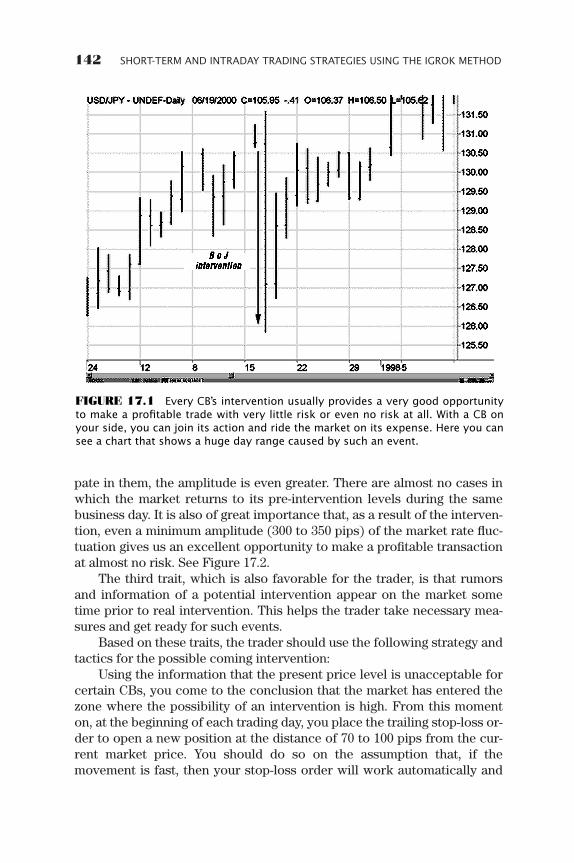
pate in them, the amplitude is even greater. There are almost no cases inwhich the market returns to its pre-intervention levels during the samebusiness day. It is also of great importance that, as a result of the interven-tion, even a minimum amplitude (300 to 350 pips) of the market rate fluc-tuation gives us an excellent opportunity to make a profitable transactionat almost no risk. See Figure 17.2.
The third trait, which is also favorable for the trader, is that rumorsand information of a potential intervention appear on the market sometime prior to real intervention. This helps the trader take necessary mea-sures and get ready for such events.
Based on these traits, the trader should use the following strategy andtactics for the possible coming intervention:
Using the information that the present price level is unacceptable forcertain CBs, you come to the conclusion that the market has entered thezone where the possibility of an intervention is high. From this momenton, at the beginning of each trading day, you place the trailing stop-loss or-der to open a new position at the distance of 70 to 100 pips from the cur-rent market price. You should do so on the assumption that, if themovement is fast, then your stop-loss order will work automatically and
142 SHORT-TERM AND INTRADAY TRADING STRATEGIES USING THE IGROK METHOD
FIGURE 17.1 Every CB’s intervention usually provides a very good opportunityto make a profitable trade with very little risk or even no risk at all. With a CB onyour side, you can join its action and ride the market on its expense. Here you cansee a chart that shows a huge day range caused by such an event.
ccc_beat_141-144_ch17.qxd 6/8/06 2:43 PM Page 142
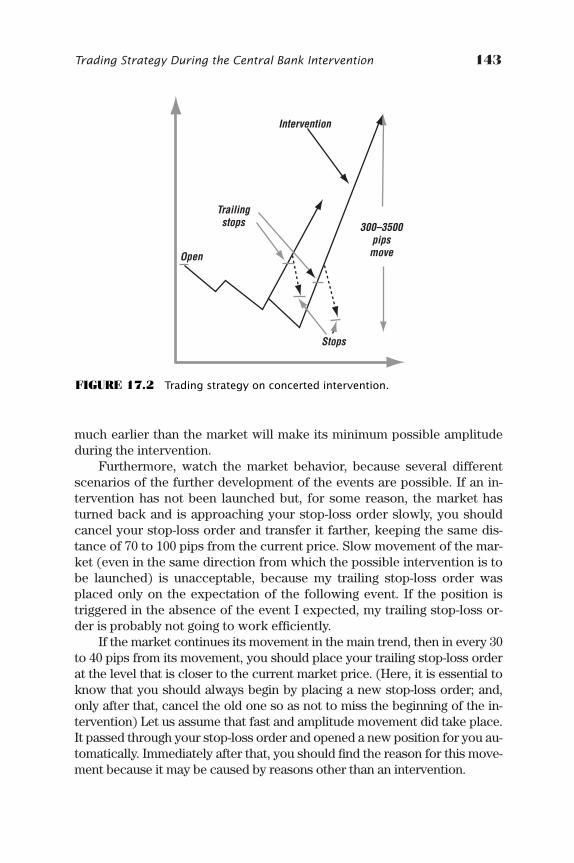
much earlier than the market will make its minimum possible amplitudeduring the intervention.
Furthermore, watch the market behavior, because several differentscenarios of the further development of the events are possible. If an in-tervention has not been launched but, for some reason, the market hasturned back and is approaching your stop-loss order slowly, you shouldcancel your stop-loss order and transfer it farther, keeping the same dis-tance of 70 to 100 pips from the current price. Slow movement of the mar-ket (even in the same direction from which the possible intervention is tobe launched) is unacceptable, because my trailing stop-loss order wasplaced only on the expectation of the following event. If the position istriggered in the absence of the event I expected, my trailing stop-loss or-der is probably not going to work efficiently.
If the market continues its movement in the main trend, then in every 30to 40 pips from its movement, you should place your trailing stop-loss orderat the level that is closer to the current market price. (Here, it is essential toknow that you should always begin by placing a new stop-loss order; and,only after that, cancel the old one so as not to miss the beginning of the in-tervention) Let us assume that fast and amplitude movement did take place.It passed through your stop-loss order and opened a new position for you au-tomatically. Immediately after that, you should find the reason for this move-ment because it may be caused by reasons other than an intervention.
Trading Strategy During the Central Bank Intervention 143
Open
Intervention
Trailingstops
Stops
300–3500pipsmove
FIGURE 17.2 Trading strategy on concerted intervention.
ccc_beat_141-144_ch17.qxd 6/8/06 2:43 PM Page 143
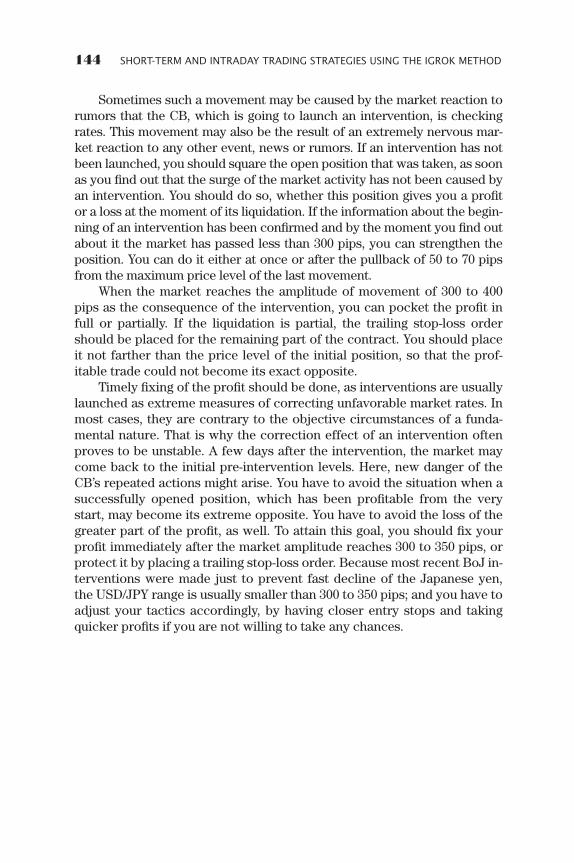
Sometimes such a movement may be caused by the market reaction torumors that the CB, which is going to launch an intervention, is checkingrates. This movement may also be the result of an extremely nervous mar-ket reaction to any other event, news or rumors. If an intervention has notbeen launched, you should square the open position that was taken, as soonas you find out that the surge of the market activity has not been caused byan intervention. You should do so, whether this position gives you a profitor a loss at the moment of its liquidation. If the information about the begin-ning of an intervention has been confirmed and by the moment you find outabout it the market has passed less than 300 pips, you can strengthen theposition. You can do it either at once or after the pullback of 50 to 70 pipsfrom the maximum price level of the last movement.
When the market reaches the amplitude of movement of 300 to 400pips as the consequence of the intervention, you can pocket the profit infull or partially. If the liquidation is partial, the trailing stop-loss ordershould be placed for the remaining part of the contract. You should placeit not farther than the price level of the initial position, so that the prof-itable trade could not become its exact opposite.
Timely fixing of the profit should be done, as interventions are usuallylaunched as extreme measures of correcting unfavorable market rates. Inmost cases, they are contrary to the objective circumstances of a funda-mental nature. That is why the correction effect of an intervention oftenproves to be unstable. A few days after the intervention, the market maycome back to the initial pre-intervention levels. Here, new danger of theCB’s repeated actions might arise. You have to avoid the situation when asuccessfully opened position, which has been profitable from the verystart, may become its extreme opposite. You have to avoid the loss of thegreater part of the profit, as well. To attain this goal, you should fix yourprofit immediately after the market amplitude reaches 300 to 350 pips, orprotect it by placing a trailing stop-loss order. Because most recent BoJ in-terventions were made just to prevent fast decline of the Japanese yen,the USD/JPY range is usually smaller than 300 to 350 pips; and you have toadjust your tactics accordingly, by having closer entry stops and takingquicker profits if you are not willing to take any chances.
144 SHORT-TERM AND INTRADAY TRADING STRATEGIES USING THE IGROK METHOD
ccc_beat_141-144_ch17.qxd 6/8/06 2:43 PM Page 144
145
PART V
Templates for Short-Term andIntraday Trading
The templates that I’m about to present you represent the systematiccomponent of my discrete-systematic trading method. These tem-plates were created to organize the trading process in the most effec-
tive, simple, and timesaving way, reduce stress, and save traders worryand money. Actual trading with use of the templates is based on recogni-tion of certain market behavioral patterns.
To make a trade, you have to choose the correct template that corre-sponds with the current market outlook, and then follow the prescribedprocedure automatically. Almost all of the templates can be customized tofit the needs of the majority of traders in terms of capital size and risk ac-ceptance. Despite the fact that all the templates described here are dividedinto chapters devoted to different kinds of trading signals, the borderlinesbetween templates from different categories are not so clear. Combina-tions composed by parts taken from two or more different templates canalso be used. I believe that such an approach will eventually allow everytrader to create his or her own individual and unique trading style andtechnique.
Start creating your own trading templates by using the basic ideasand principles described in the book and this particular part of it. Asyou understand, it was absolutely impossible to research and describe
ccc_beat_145-146_pt05.qxd 6/8/06 2:43 PM Page 145
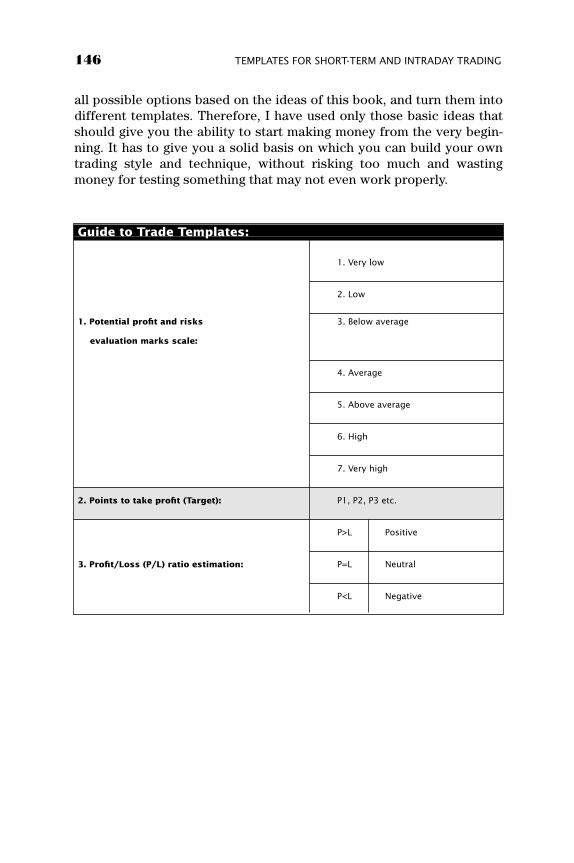
all possible options based on the ideas of this book, and turn them intodifferent templates. Therefore, I have used only those basic ideas thatshould give you the ability to start making money from the very begin-ning. It has to give you a solid basis on which you can build your owntrading style and technique, without risking too much and wastingmoney for testing something that may not even work properly.
146 TEMPLATES FOR SHORT-TERM AND INTRADAY TRADING
Guide to Trade Templates:
1. Very low
2. Low
1. Potential profit and risks 3. Below average
evaluation marks scale:
4. Average
5. Above average
6. High
7. Very high
2. Points to take profit (Target): P1, P2, P3 etc.
P>L Positive
3. Profit/Loss (P/L) ratio estimation: P=L Neutral
P<L Negative
ccc_beat_145-146_pt05.qxd 6/8/06 2:43 PM Page 146
147
CHAPTER 18
Average DailyTrading Range
Templates
The markets have a strong tendency to complete their average tradingrange daily. Using this as a base, entry strategies can be employed,as described in the following templates. Please see Box 18.1 through
Box 18.5, along with each box’s corresponding figures.
ccc_beat_147-158_ch18.qxd 6/8/06 2:44 PM Page 147
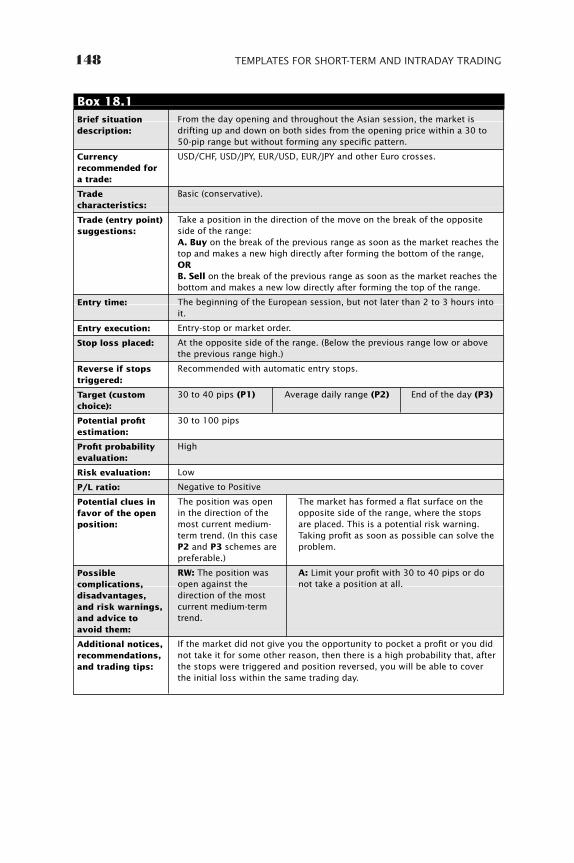
148 TEMPLATES FOR SHORT-TERM AND INTRADAY TRADING
Brief situation description:
Currencyrecommended fora trade:
Tradecharacteristics:
Trade (entry point)suggestions:
Entry time:
Entry execution:
Stop loss placed:
Reverse if stopstriggered:
Target (customchoice):
Potential profitestimation:
Profit probabilityevaluation:
Risk evaluation:
P/L ratio:
Potential clues infavor of the openposition:
Possiblecomplications,disadvantages,and risk warnings,and advice toavoid them:
Additional notices,recommendations,and trading tips:
From the day opening and throughout the Asian session, the market isdrifting up and down on both sides from the opening price within a 30 to50-pip range but without forming any specific pattern.
USD/CHF, USD/JPY, EUR/USD, EUR/JPY and other Euro crosses.
Basic (conservative).
Take a position in the direction of the move on the break of the oppositeside of the range:A. Buy on the break of the previous range as soon as the market reaches thetop and makes a new high directly after forming the bottom of the range,ORB. Sell on the break of the previous range as soon as the market reaches thebottom and makes a new low directly after forming the top of the range.
The beginning of the European session, but not later than 2 to 3 hours intoit.
Entry-stop or market order.
At the opposite side of the range. (Below the previous range low or abovethe previous range high.)
Recommended with automatic entry stops.
30 to 40 pips (P1) Average daily range (P2) End of the day (P3)
30 to 100 pips
High
Low
Negative to Positive
The position was open The market has formed a flat surface on thein the direction of the opposite side of the range, where the stops most current medium- are placed. This is a potential risk warning.term trend. (In this case Taking profit as soon as possible can solve theP2 and P3 schemes are problem.preferable.)
RW: The position was A: Limit your profit with 30 to 40 pips or do open against the not take a position at all.direction of the most current medium-termtrend.
If the market did not give you the opportunity to pocket a profit or you didnot take it for some other reason, then there is a high probability that, afterthe stops were triggered and position reversed, you will be able to coverthe initial loss within the same trading day.
Box 18.1
ccc_beat_147-158_ch18.qxd 6/8/06 2:44 PM Page 148
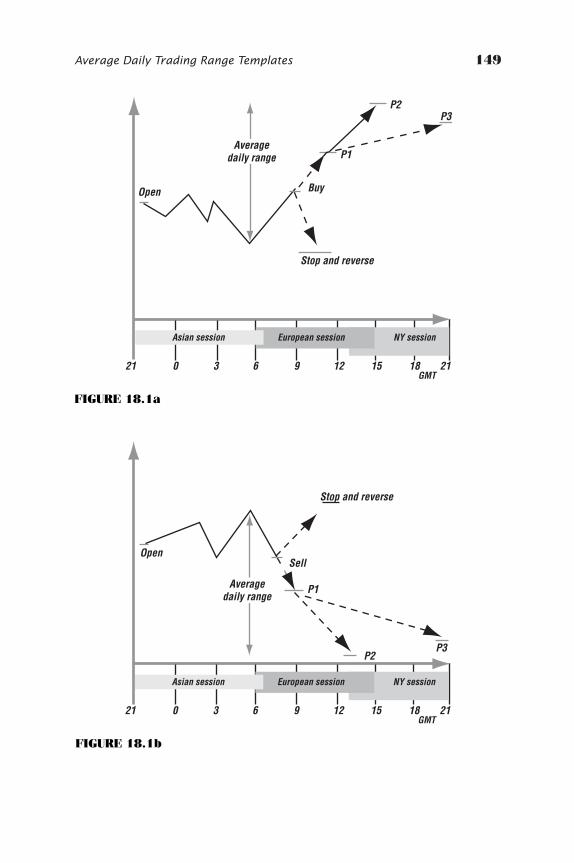
Average Daily Trading Range Templates 149
Open
Stop and reverse
21 0 3 6 9 12 15 18 21GMT
Asian session European session NY session
Buy
P1
P2P3
Averagedaily range
FIGURE 18.1a
Open
Stop and reverse
21 0 3 6 9 12 15 18 21GMT
Asian session European session NY session
Averagedaily range
Sell
P1
P2P3
FIGURE 18.1b
ccc_beat_147-158_ch18.qxd 6/8/06 2:44 PM Page 149

150 TEMPLATES FOR SHORT-TERM AND INTRADAY TRADING
Brief situationdescription:
Currencyrecommended for a trade:
Tradecharacteristics:
Trade (entry point)suggestions:
Entry time:
Entry execution:
Stop loss placed:(Cannot be chosenin accordance witha trader’sindividualsituation andpreferences.Moneymanagementprinciples mustapply.)
Reverse if stopstriggered:
Target (customchoice):
Potential profitestimation:
Profit probabilityevaluation:
Risk evaluation:
P/L ratio:
Potentialadvantages infavor of the openposition:
The most probablecomplications,disadvantages,and risk warnings,and advice toavoid them:
From the day opening during the Asian session, the market was driftingslowly in only one direction from the open price at a distance 40 to 60 pipswithout forming any specific pattern.
USD/CHF, USD/JPY, EUR/USD, EUR/JPY and other Euro crosses.
Basic (conservative).
Take a position in the direction of the move on the break of the oppositeside of the range:A. Buy on the break of the previous range as soon as the market reaches thetop and makes a new high directly after forming the bottom of the range,ORB. Sell on the break of the previous range as soon as the market reaches thebottom and makes a new low directly after forming the top of the range.
European or NY session.
Entry-stop order.
On the opposite side of the range. (Above the previous day high or belowthe previous day low.)
Recommended. (Automatic and simultaneous with stops.)
Average daily range (P1) End of the day (P2)
50 to 100 pips
Average to High
Average to Low
Neutral to Positive
The position was open The position was open The market brokein the direction of the in the direction of the an important medium-term trend. main move of the trendline, support
previous day. or resistance.
RW#1: The position was A#1: Move your stops closer and place open against the direction them above (below) the previous local of the medium-term trend. extreme formed the same day.RW#2: The position was A#2: Same as above.open against the main move of the previous day.RW#3: The market has A#3: Accept the risk.formed a “flat surface” on the opposite side ofthe range.
Box 18.2
ccc_beat_147-158_ch18.qxd 6/8/06 2:44 PM Page 150
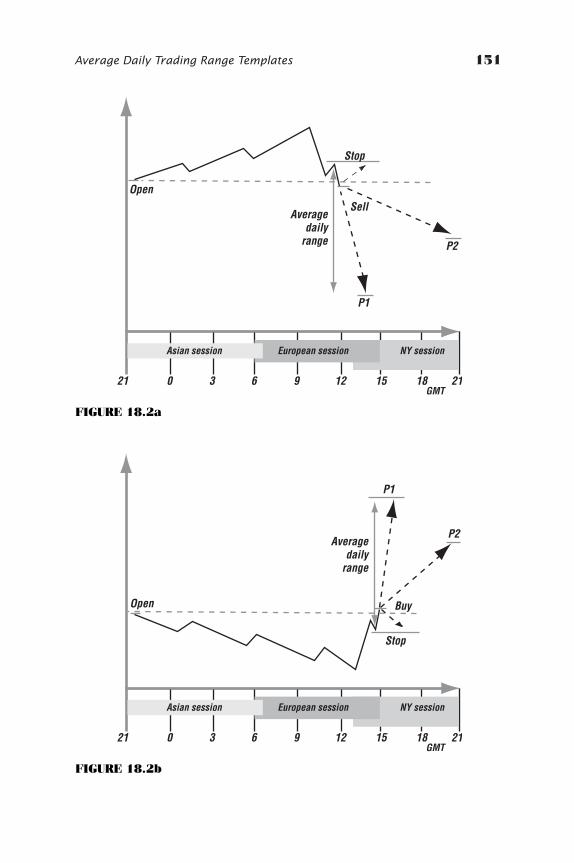
Average Daily Trading Range Templates 151
Open
Averagedaily
range
21 0 3 6 9 12 15 18 21GMT
Asian session European session NY session
Stop
P1
P2
Sell
FIGURE 18.2a
Open
Averagedaily
range
21 0 3 6 9 12 15 18 21GMT
Asian session European session NY session
Stop
P1
P2
Buy
FIGURE 18.2b
ccc_beat_147-158_ch18.qxd 6/8/06 2:44 PM Page 151
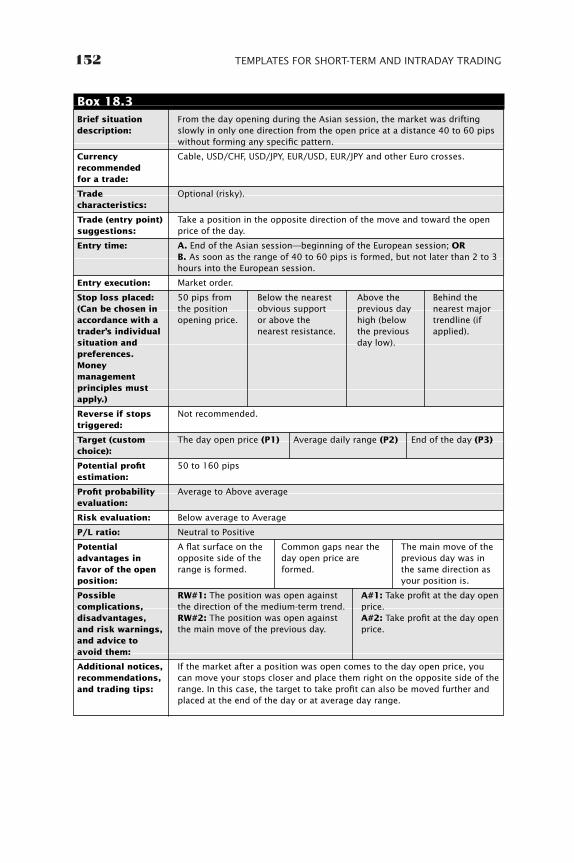
152 TEMPLATES FOR SHORT-TERM AND INTRADAY TRADING
Brief situation description:
Currency recommended for a trade:
Trade characteristics:
Trade (entry point)suggestions:
Entry time:
Entry execution:
Stop loss placed: (Can be chosen in accordance with a trader’s individual situation and preferences. Moneymanagementprinciples mustapply.)
Reverse if stopstriggered:
Target (customchoice):
Potential profitestimation:
Profit probabilityevaluation:
Risk evaluation:
P/L ratio:
Potentialadvantages infavor of the openposition:
Possiblecomplications,disadvantages,and risk warnings,and advice toavoid them:
Additional notices,recommendations,and trading tips:
From the day opening during the Asian session, the market was driftingslowly in only one direction from the open price at a distance 40 to 60 pipswithout forming any specific pattern.
Cable, USD/CHF, USD/JPY, EUR/USD, EUR/JPY and other Euro crosses.
Optional (risky).
Take a position in the opposite direction of the move and toward the openprice of the day.
A. End of the Asian session—beginning of the European session; OR B. As soon as the range of 40 to 60 pips is formed, but not later than 2 to 3hours into the European session.
Market order.
50 pips from Below the nearest Above the Behind thethe position obvious support previous day nearest majoropening price. or above the high (below trendline (if
nearest resistance. the previous applied).day low).
Not recommended.
The day open price (P1) Average daily range (P2) End of the day (P3)
50 to 160 pips
Average to Above average
Below average to Average
Neutral to Positive
A flat surface on the Common gaps near the The main move of the opposite side of the day open price are previous day was in range is formed. formed. the same direction as
your position is.
RW#1: The position was open against A#1: Take profit at the day open the direction of the medium-term trend. price.RW#2: The position was open against A#2: Take profit at the day open the main move of the previous day. price.
If the market after a position was open comes to the day open price, youcan move your stops closer and place them right on the opposite side of therange. In this case, the target to take profit can also be moved further andplaced at the end of the day or at average day range.
Box 18.3
ccc_beat_147-158_ch18.qxd 6/8/06 2:44 PM Page 152
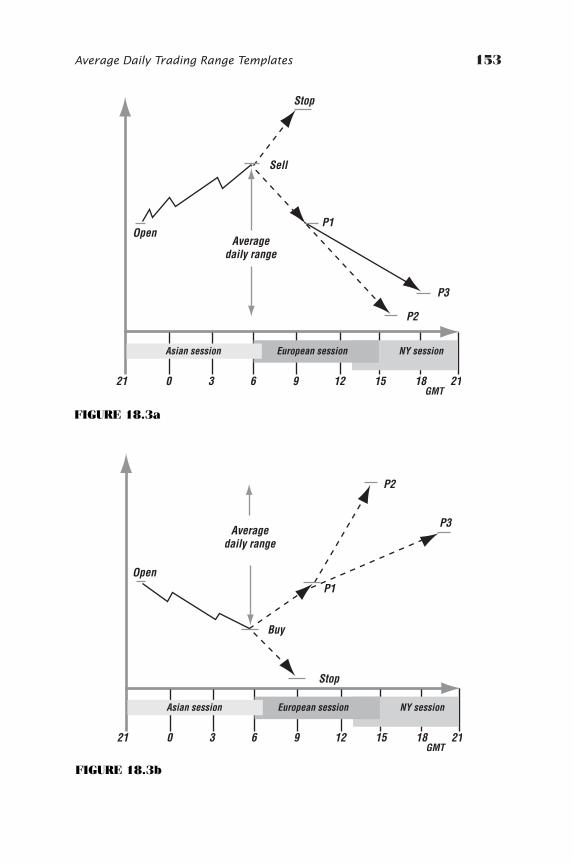
Average Daily Trading Range Templates 153
OpenAverage
daily range
21 0 3 6 9 12 15 18 21GMT
Asian session European session NY session
Stop
P1
P2
Sell
P3
FIGURE 18.3a
Open
Averagedaily range
21 0 3 6 9 12 15 18 21GMT
Asian session European session NY session
Stop
P1
P2
Buy
P3
FIGURE 18.3b
ccc_beat_147-158_ch18.qxd 6/8/06 2:44 PM Page 153
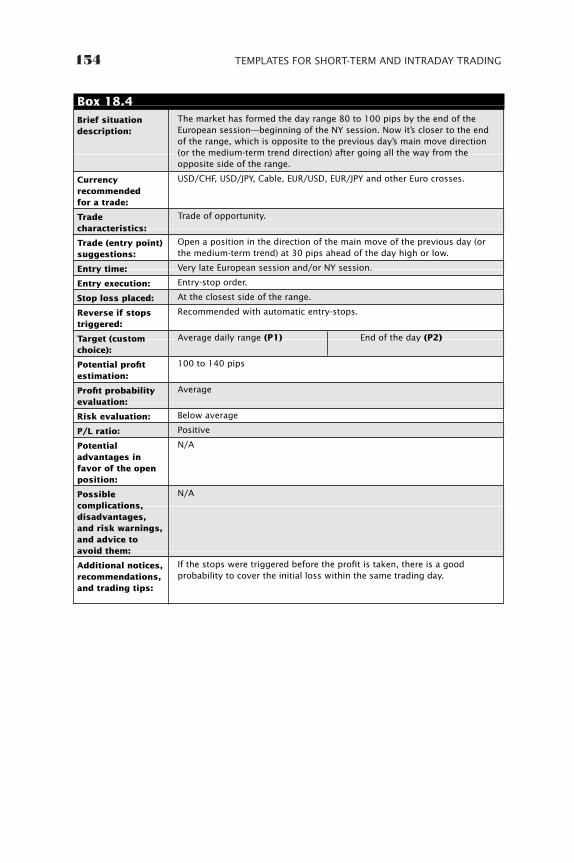
154 TEMPLATES FOR SHORT-TERM AND INTRADAY TRADING
Brief situation description:
Currencyrecommended for a trade:
Tradecharacteristics:
Trade (entry point)suggestions:
Entry time:
Entry execution:
Stop loss placed:
Reverse if stopstriggered:
Target (customchoice):
Potential profitestimation:
Profit probabilityevaluation:
Risk evaluation:
P/L ratio:
Potentialadvantages infavor of the openposition:
Possiblecomplications,disadvantages,and risk warnings,and advice toavoid them:
Additional notices,recommendations,and trading tips:
The market has formed the day range 80 to 100 pips by the end of theEuropean session—beginning of the NY session. Now it’s closer to the endof the range, which is opposite to the previous day’s main move direction(or the medium-term trend direction) after going all the way from theopposite side of the range.
USD/CHF, USD/JPY, Cable, EUR/USD, EUR/JPY and other Euro crosses.
Trade of opportunity.
Open a position in the direction of the main move of the previous day (orthe medium-term trend) at 30 pips ahead of the day high or low.
Very late European session and/or NY session.
Entry-stop order.
At the closest side of the range.
Recommended with automatic entry-stops.
Average daily range (P1) End of the day (P2)
100 to 140 pips
Average
Below average
Positive
N/A
N/A
If the stops were triggered before the profit is taken, there is a goodprobability to cover the initial loss within the same trading day.
Box 18.4
ccc_beat_147-158_ch18.qxd 6/8/06 2:44 PM Page 154
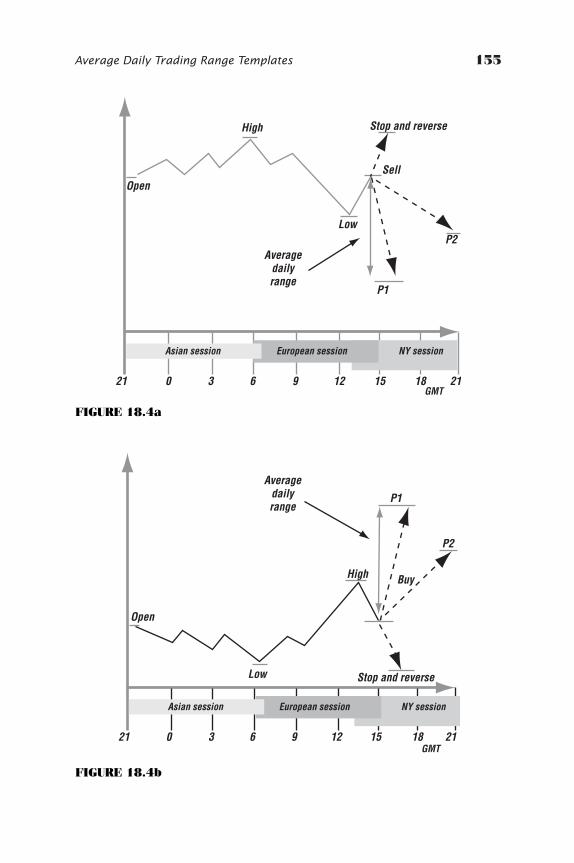
Average Daily Trading Range Templates 155
Open
Averagedailyrange
21 0 3 6 9 12 15 18 21GMT
Asian session European session NY session
Stop and reverse
P1
P2
High
Low
Sell
FIGURE 18.4a
Open
Averagedailyrange
21 0 3 6 9 12 15 18 21GMT
Asian session European session NY session
Stop and reverse
P1
P2
High
Low
Buy
FIGURE 18.4b
ccc_beat_147-158_ch18.qxd 6/8/06 2:44 PM Page 155
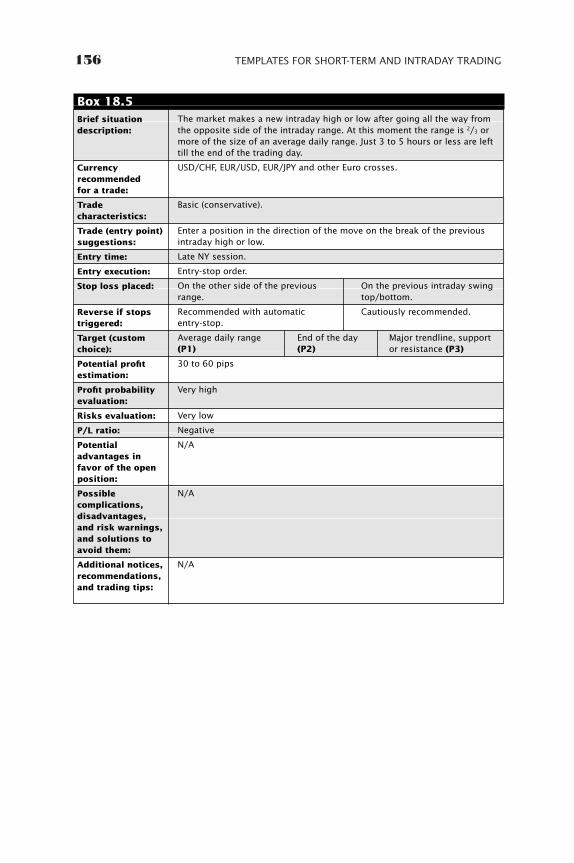
156 TEMPLATES FOR SHORT-TERM AND INTRADAY TRADING
Brief situationdescription:
Currencyrecommended for a trade:
Tradecharacteristics:
Trade (entry point)suggestions:
Entry time:
Entry execution:
Stop loss placed:
Reverse if stopstriggered:
Target (customchoice):
Potential profitestimation:
Profit probabilityevaluation:
Risks evaluation:
P/L ratio:
Potentialadvantages infavor of the openposition:
Possiblecomplications,disadvantages,and risk warnings,and solutions toavoid them:
Additional notices,recommendations,and trading tips:
The market makes a new intraday high or low after going all the way fromthe opposite side of the intraday range. At this moment the range is 2/3 ormore of the size of an average daily range. Just 3 to 5 hours or less are lefttill the end of the trading day.
USD/CHF, EUR/USD, EUR/JPY and other Euro crosses.
Basic (conservative).
Enter a position in the direction of the move on the break of the previousintraday high or low.
Late NY session.
Entry-stop order.
On the other side of the previous On the previous intraday swingrange. top/bottom.
Recommended with automatic Cautiously recommended.entry-stop.
Average daily range End of the day Major trendline, support(P1) (P2) or resistance (P3)
30 to 60 pips
Very high
Very low
Negative
N/A
N/A
N/A
Box 18.5
ccc_beat_147-158_ch18.qxd 6/8/06 2:44 PM Page 156
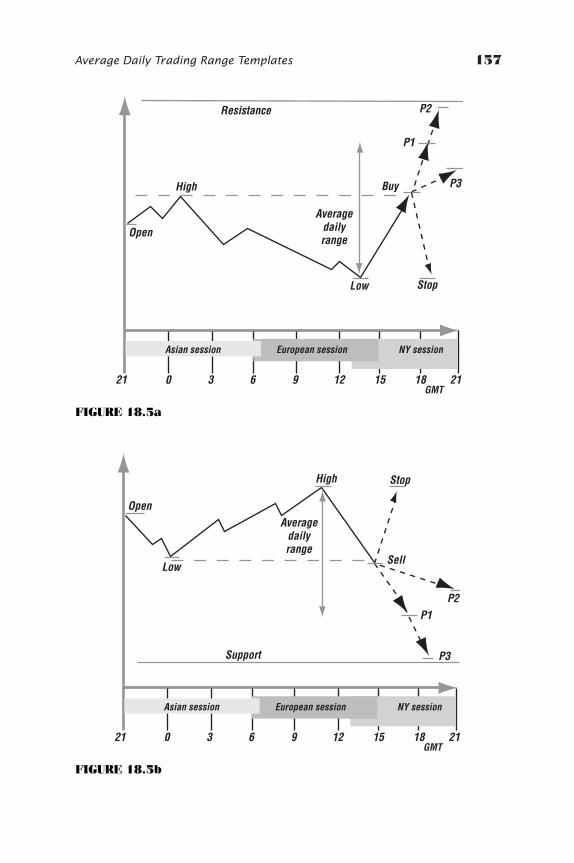
Average Daily Trading Range Templates 157
Open
Averagedailyrange
21 0 3 6 9 12 15 18 21GMT
Asian session European session NY session
Stop
P1
P2
High
Low
Buy
Resistance
P3
FIGURE 18.5a
OpenAverage
dailyrange
21 0 3 6 9 12 15 18 21GMT
Asian session European session NY session
Stop
P1P2
High
LowSell
Support P3
FIGURE 18.5b
ccc_beat_147-158_ch18.qxd 6/8/06 2:44 PM Page 157

ccc_beat_147-158_ch18.qxd 6/8/06 2:44 PM Page 158

159
CHAPTER 19
TechnicalFormationTemplates
Common technical formations such as channels, triangles, diamonds,head and shoulders, and double tops and bottoms provide trade en-try possibilities as described in the following templates. Please see
Box 19.1 through Box 19.15, along with each box’s accompanying figures.
ccc_beat_159-190_ch19.qxd 6/8/06 2:44 PM Page 159
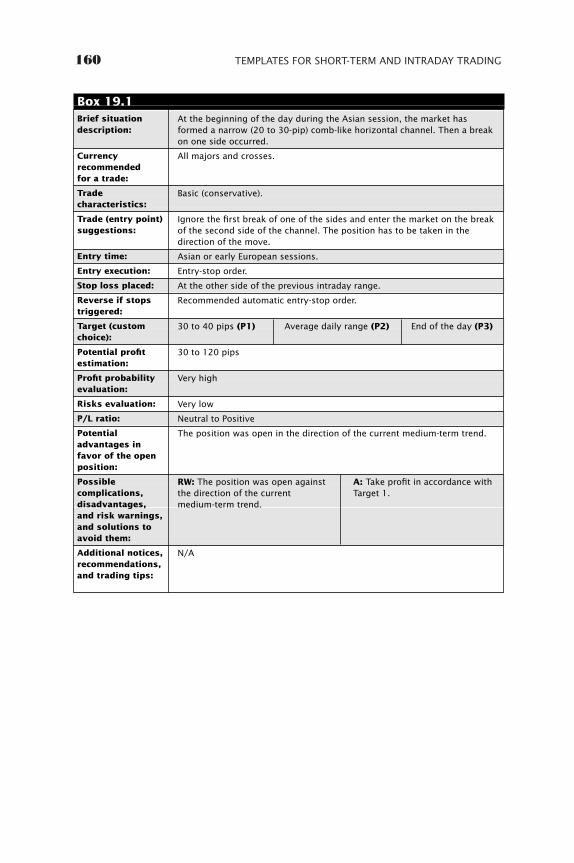
160 TEMPLATES FOR SHORT-TERM AND INTRADAY TRADING
Brief situationdescription:
Currencyrecommendedfor a trade:
Tradecharacteristics:
Trade (entry point)suggestions:
Entry time:
Entry execution:
Stop loss placed:
Reverse if stopstriggered:
Target (customchoice):
Potential profitestimation:
Profit probabilityevaluation:
Risks evaluation:
P/L ratio:
Potentialadvantages infavor of the openposition:
Possiblecomplications,disadvantages,and risk warnings,and solutions toavoid them:
Additional notices,recommendations,and trading tips:
At the beginning of the day during the Asian session, the market hasformed a narrow (20 to 30-pip) comb-like horizontal channel. Then a breakon one side occurred.
All majors and crosses.
Basic (conservative).
Ignore the first break of one of the sides and enter the market on the breakof the second side of the channel. The position has to be taken in thedirection of the move.
Asian or early European sessions.
Entry-stop order.
At the other side of the previous intraday range.
Recommended automatic entry-stop order.
30 to 40 pips (P1) Average daily range (P2) End of the day (P3)
30 to 120 pips
Very high
Very low
Neutral to Positive
The position was open in the direction of the current medium-term trend.
RW: The position was open against A: Take profit in accordance with the direction of the current Target 1.medium-term trend.
N/A
Box 19.1
ccc_beat_159-190_ch19.qxd 6/8/06 2:44 PM Page 160
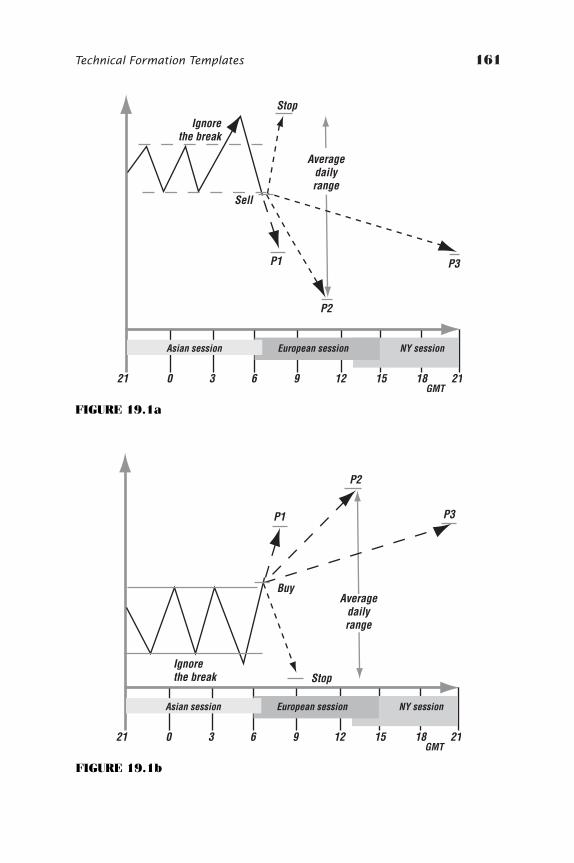
Technical Formation Templates 161
21 0 3 6 9 12 15 18 21GMT
Asian session European session NY session
Stop
P1
P2
Sell
Ignorethe break
P3
Averagedailyrange
FIGURE 19.1a
21 0 3 6 9 12 15 18 21GMT
Asian session European session NY session
Stop
P1
P2
Buy
Ignorethe break
P3
Averagedailyrange
FIGURE 19.1b
ccc_beat_159-190_ch19.qxd 6/8/06 2:44 PM Page 161

162 TEMPLATES FOR SHORT-TERM AND INTRADAY TRADING
Brief situationdescription:
Currencyrecommendedfor a trade:
Tradecharacteristics:
Trade (entry point)suggestions:
Entry time:
Entry execution:
Stop loss placed:
Reverse if stopstriggered:
Target (NO customchoice):
Potential profitestimation:
Profit probabilityevaluation:
Risks evaluation:
P/L ratio:
Potentialadvantages infavor of the openposition:
Possiblecomplications,disadvantages,and risk warnings,and solutions toavoid them:
Additional notices,recommendations,and trading tips:
At the beginning of the day during the Asian session, the market hasformed a narrow (20 to 30-pip) comb-like horizontal channel. It usually canbe identified on 5 to 10-min charts.
USD/CHF, USD/JPY, Cable, EUR/USD, EUR/JPY and other Euro crosses.
Optional (risky).
Take a position on the first break of either side in the direction of the move.
Asian session.
Entry-stop order.
At the opposite side of the channel.
Recommended (automatic entry-stops order).
20 to 30 pips
20 to 30 pips
Average
Average
Negative
N/A
Such a trade requires a very precise execution that can be achieved with agood dealer or broker company. It also can be recommended forexperienced traders only.
I recommend this particular trade only because the risk taken is very small.Also, a trader usually has enough time to pocket a small profit in this trade.The reverse (if the stops were triggered) most likely will cover the initialloss soon enough. However, in some relatively rare cases, an unexpectedand fast move may happen. It can provide a profit that is much bigger thanthe projected target shown in this table. (Not a good choice for aconservative trader, though.)
Box 19.2
ccc_beat_159-190_ch19.qxd 6/8/06 2:44 PM Page 162
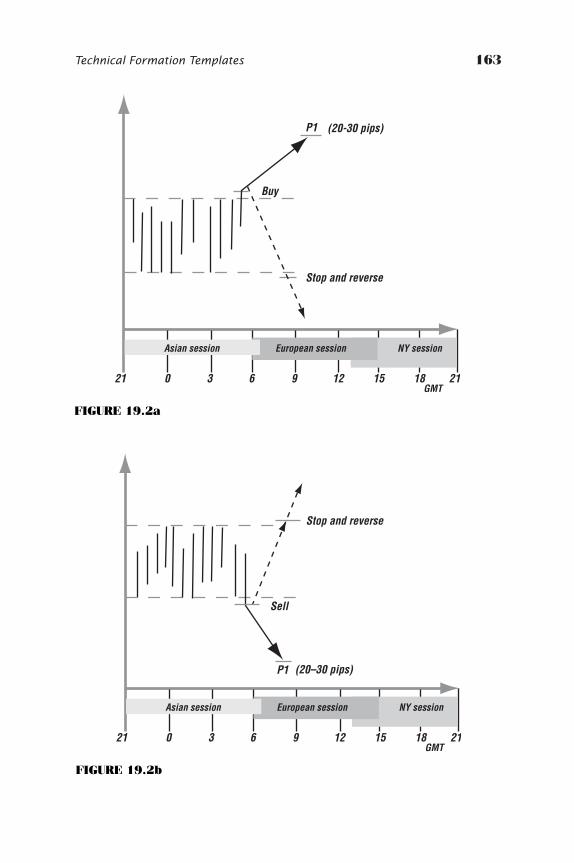
Technical Formation Templates 163
21 0 3 6 9 12 15 18 21GMT
Asian session European session NY session
Stop and reverse
P1
Buy
(20-30 pips)
FIGURE 19.2a
21 0 3 6 9 12 15 18 21GMT
Asian session European session NY session
Stop and reverse
P1
Sell
(20–30 pips)
FIGURE 19.2b
ccc_beat_159-190_ch19.qxd 6/8/06 2:44 PM Page 163
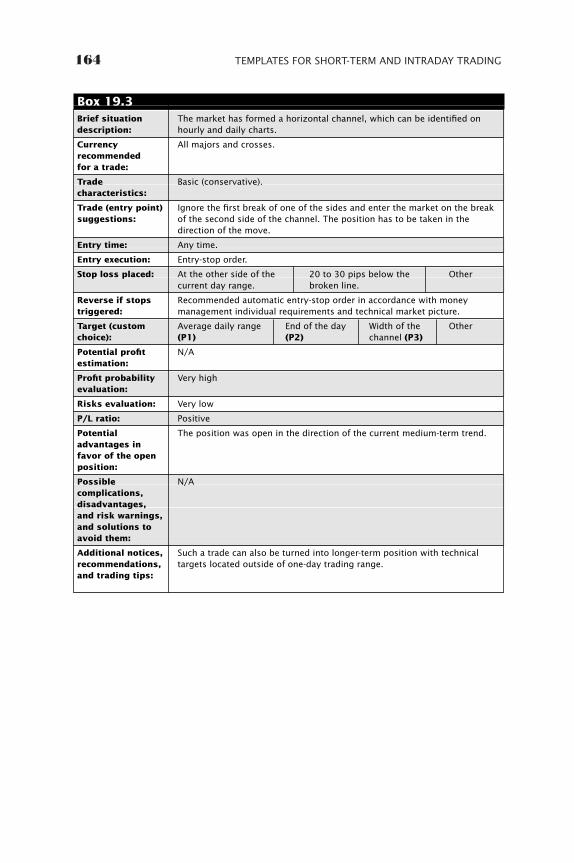
164 TEMPLATES FOR SHORT-TERM AND INTRADAY TRADING
Brief situationdescription:
Currencyrecommendedfor a trade:
Tradecharacteristics:
Trade (entry point)suggestions:
Entry time:
Entry execution:
Stop loss placed:
Reverse if stopstriggered:
Target (customchoice):
Potential profitestimation:
Profit probabilityevaluation:
Risks evaluation:
P/L ratio:
Potentialadvantages infavor of the openposition:
Possiblecomplications,disadvantages,and risk warnings,and solutions toavoid them:
Additional notices,recommendations,and trading tips:
The market has formed a horizontal channel, which can be identified onhourly and daily charts.
All majors and crosses.
Basic (conservative).
Ignore the first break of one of the sides and enter the market on the breakof the second side of the channel. The position has to be taken in thedirection of the move.
Any time.
Entry-stop order.
At the other side of the 20 to 30 pips below the Othercurrent day range. broken line.
Recommended automatic entry-stop order in accordance with moneymanagement individual requirements and technical market picture.
Average daily range End of the day Width of the Other(P1) (P2) channel (P3)
N/A
Very high
Very low
Positive
The position was open in the direction of the current medium-term trend.
N/A
Such a trade can also be turned into longer-term position with technicaltargets located outside of one-day trading range.
Box 19.3
ccc_beat_159-190_ch19.qxd 6/8/06 2:44 PM Page 164
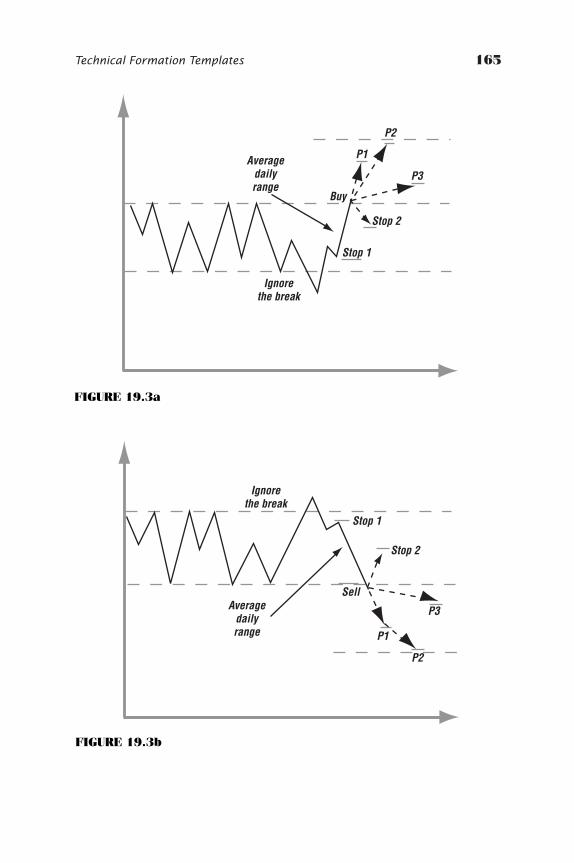
Technical Formation Templates 165
Stop 1
P1
Buy
Ignorethe break
P2
P3
Stop 2
Averagedailyrange
FIGURE 19.3a
Stop 1
P1
Sell
Ignorethe break
P2
P3
Stop 2
Averagedailyrange
FIGURE 19.3b
ccc_beat_159-190_ch19.qxd 6/8/06 2:44 PM Page 165
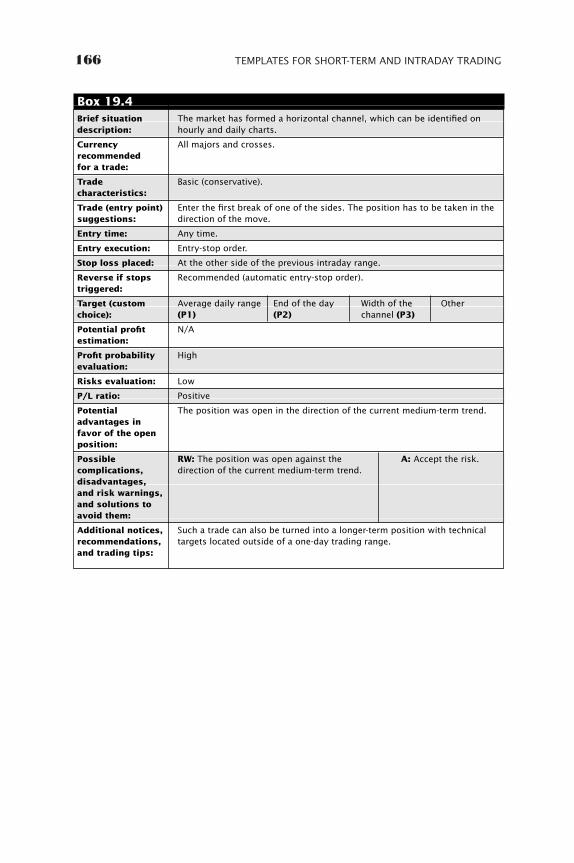
166 TEMPLATES FOR SHORT-TERM AND INTRADAY TRADING
Brief situationdescription:
Currencyrecommendedfor a trade:
Tradecharacteristics:
Trade (entry point)suggestions:
Entry time:
Entry execution:
Stop loss placed:
Reverse if stopstriggered:
Target (customchoice):
Potential profitestimation:
Profit probabilityevaluation:
Risks evaluation:
P/L ratio:
Potentialadvantages infavor of the openposition:
Possiblecomplications,disadvantages,and risk warnings,and solutions toavoid them:
Additional notices,recommendations,and trading tips:
The market has formed a horizontal channel, which can be identified onhourly and daily charts.
All majors and crosses.
Basic (conservative).
Enter the first break of one of the sides. The position has to be taken in thedirection of the move.
Any time.
Entry-stop order.
At the other side of the previous intraday range.
Recommended (automatic entry-stop order).
Average daily range End of the day Width of the Other(P1) (P2) channel (P3)
N/A
High
Low
Positive
The position was open in the direction of the current medium-term trend.
RW: The position was open against the A: Accept the risk.direction of the current medium-term trend.
Such a trade can also be turned into a longer-term position with technicaltargets located outside of a one-day trading range.
Box 19.4
ccc_beat_159-190_ch19.qxd 6/8/06 2:44 PM Page 166
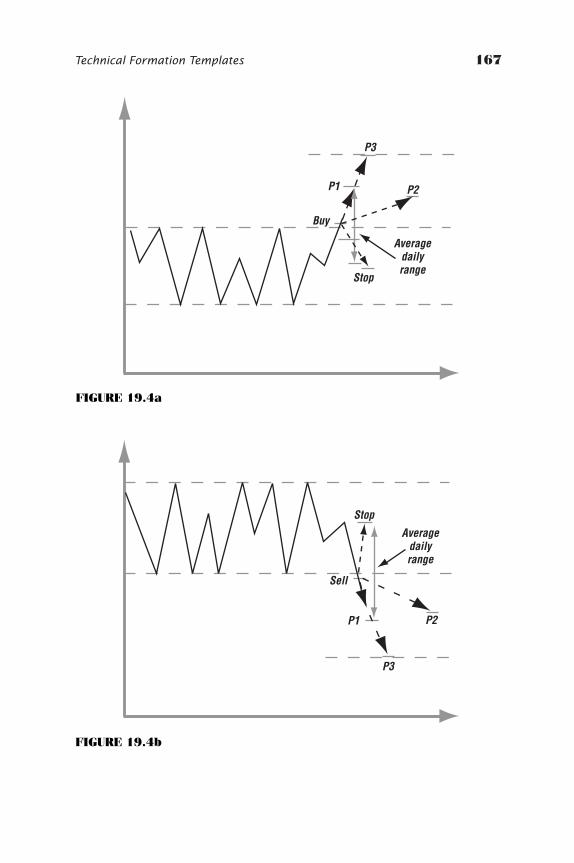
Technical Formation Templates 167
P1
Buy
P2
P3
Stop
Averagedailyrange
FIGURE 19.4a
P1
Sell
P2
P3
Stop
Averagedailyrange
FIGURE 19.4b
ccc_beat_159-190_ch19.qxd 6/8/06 2:44 PM Page 167
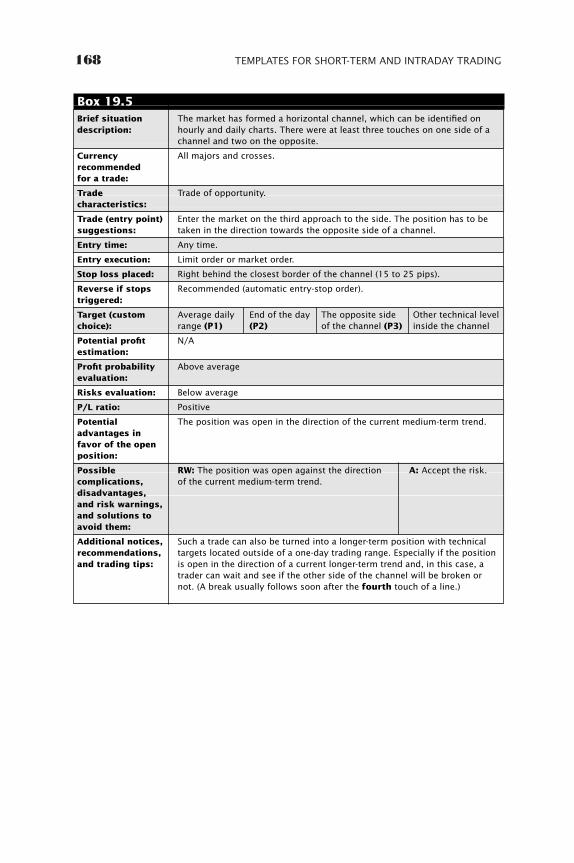
168 TEMPLATES FOR SHORT-TERM AND INTRADAY TRADING
Brief situationdescription:
Currencyrecommendedfor a trade:
Tradecharacteristics:
Trade (entry point)suggestions:
Entry time:
Entry execution:
Stop loss placed:
Reverse if stopstriggered:
Target (customchoice):
Potential profitestimation:
Profit probabilityevaluation:
Risks evaluation:
P/L ratio:
Potentialadvantages infavor of the openposition:
Possiblecomplications,disadvantages,and risk warnings,and solutions toavoid them:
Additional notices,recommendations,and trading tips:
The market has formed a horizontal channel, which can be identified onhourly and daily charts. There were at least three touches on one side of achannel and two on the opposite.
All majors and crosses.
Trade of opportunity.
Enter the market on the third approach to the side. The position has to betaken in the direction towards the opposite side of a channel.
Any time.
Limit order or market order.
Right behind the closest border of the channel (15 to 25 pips).
Recommended (automatic entry-stop order).
Average daily End of the day The opposite side Other technical level range (P1) (P2) of the channel (P3) inside the channel
N/A
Above average
Below average
Positive
The position was open in the direction of the current medium-term trend.
RW: The position was open against the direction A: Accept the risk.of the current medium-term trend.
Such a trade can also be turned into a longer-term position with technicaltargets located outside of a one-day trading range. Especially if the positionis open in the direction of a current longer-term trend and, in this case, atrader can wait and see if the other side of the channel will be broken ornot. (A break usually follows soon after the fourth touch of a line.)
Box 19.5
ccc_beat_159-190_ch19.qxd 6/8/06 2:44 PM Page 168
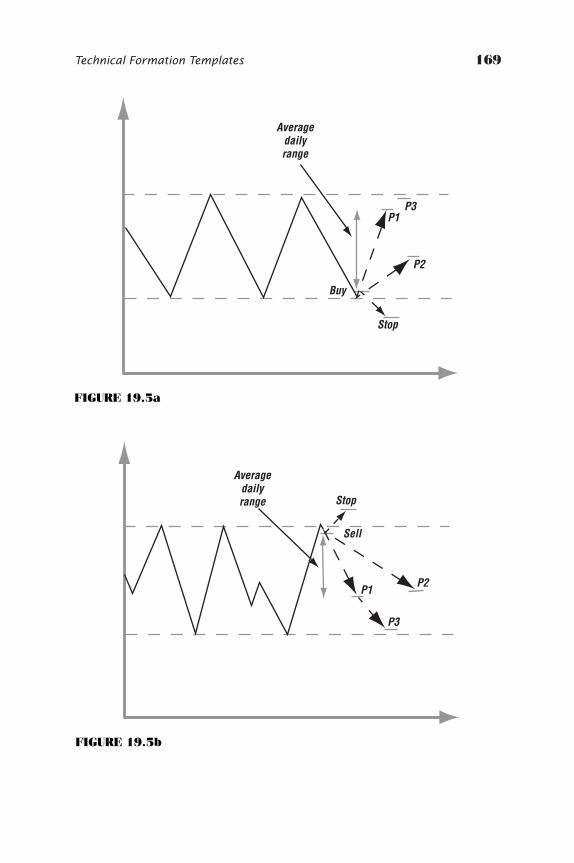
Technical Formation Templates 169
P1
Buy
P2
P3
Stop
Averagedailyrange
FIGURE 19.5a
P1
Sell
P2
P3
Stop
Averagedailyrange
FIGURE 19.5b
ccc_beat_159-190_ch19.qxd 6/8/06 2:44 PM Page 169
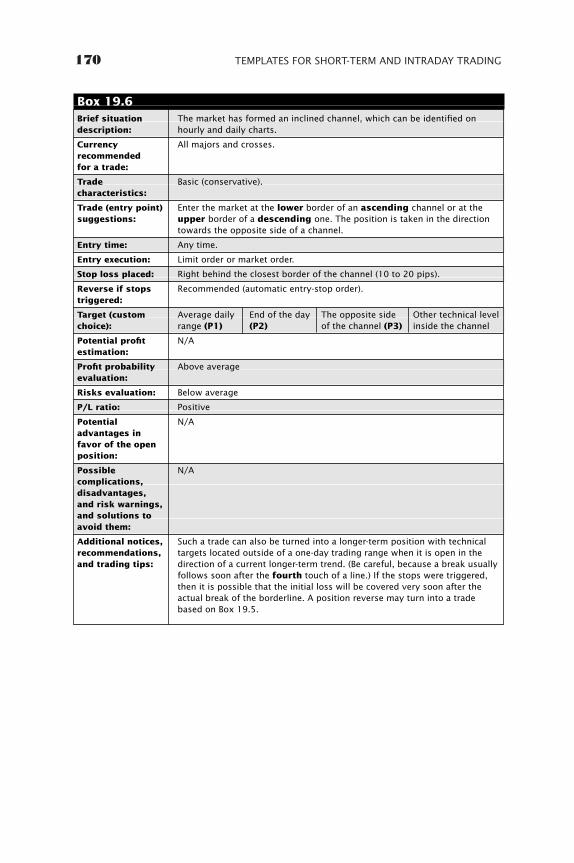
170 TEMPLATES FOR SHORT-TERM AND INTRADAY TRADING
Brief situationdescription:
Currencyrecommendedfor a trade:
Tradecharacteristics:
Trade (entry point)suggestions:
Entry time:
Entry execution:
Stop loss placed:
Reverse if stopstriggered:
Target (customchoice):
Potential profitestimation:
Profit probabilityevaluation:
Risks evaluation:
P/L ratio:
Potentialadvantages infavor of the openposition:
Possiblecomplications,disadvantages,and risk warnings,and solutions toavoid them:
Additional notices,recommendations,and trading tips:
The market has formed an inclined channel, which can be identified onhourly and daily charts.
All majors and crosses.
Basic (conservative).
Enter the market at the lower border of an ascending channel or at theupper border of a descending one. The position is taken in the directiontowards the opposite side of a channel.
Any time.
Limit order or market order.
Right behind the closest border of the channel (10 to 20 pips).
Recommended (automatic entry-stop order).
Average daily End of the day The opposite side Other technical level range (P1) (P2) of the channel (P3) inside the channel
N/A
Above average
Below average
Positive
N/A
N/A
Such a trade can also be turned into a longer-term position with technicaltargets located outside of a one-day trading range when it is open in thedirection of a current longer-term trend. (Be careful, because a break usuallyfollows soon after the fourth touch of a line.) If the stops were triggered,then it is possible that the initial loss will be covered very soon after theactual break of the borderline. A position reverse may turn into a tradebased on Box 19.5.
Box 19.6
ccc_beat_159-190_ch19.qxd 6/8/06 2:44 PM Page 170
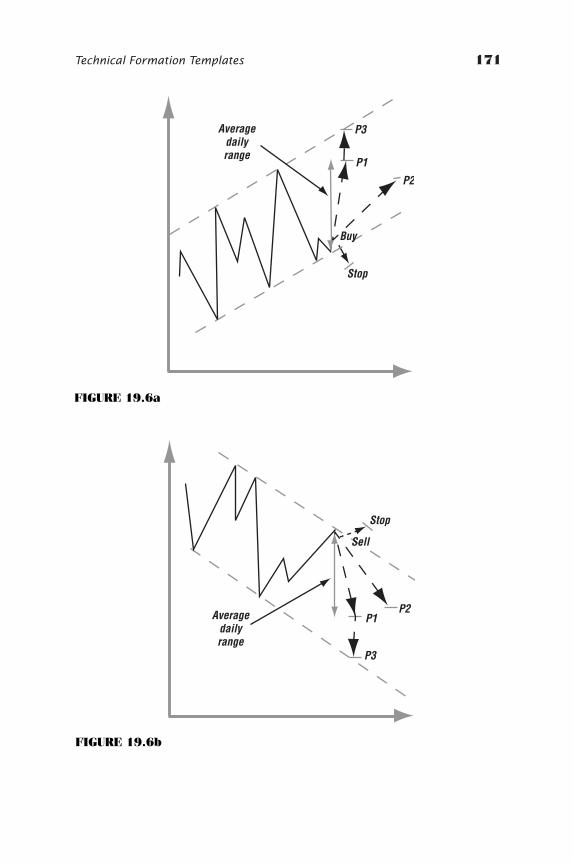
Technical Formation Templates 171
P1
P2
P3
Stop
Averagedailyrange
Buy
FIGURE 19.6a
P1P2
P3
Stop
Averagedailyrange
Sell
FIGURE 19.6b
ccc_beat_159-190_ch19.qxd 6/8/06 2:44 PM Page 171
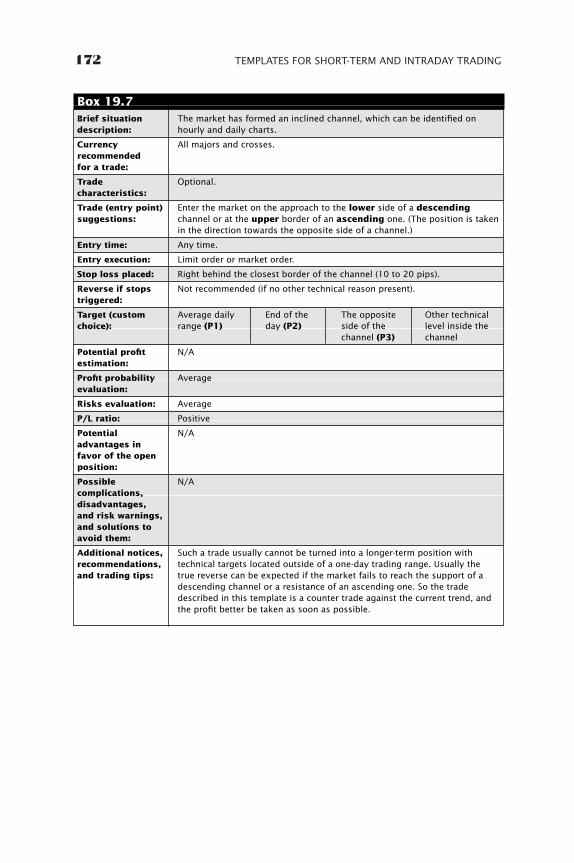
172 TEMPLATES FOR SHORT-TERM AND INTRADAY TRADING
Brief situationdescription:
Currencyrecommendedfor a trade:
Tradecharacteristics:
Trade (entry point)suggestions:
Entry time:
Entry execution:
Stop loss placed:
Reverse if stopstriggered:
Target (customchoice):
Potential profitestimation:
Profit probabilityevaluation:
Risks evaluation:
P/L ratio:
Potentialadvantages infavor of the openposition:
Possiblecomplications,disadvantages,and risk warnings,and solutions toavoid them:
Additional notices,recommendations,and trading tips:
The market has formed an inclined channel, which can be identified onhourly and daily charts.
All majors and crosses.
Optional.
Enter the market on the approach to the lower side of a descendingchannel or at the upper border of an ascending one. (The position is takenin the direction towards the opposite side of a channel.)
Any time.
Limit order or market order.
Right behind the closest border of the channel (10 to 20 pips).
Not recommended (if no other technical reason present).
Average daily End of the The opposite Other technical range (P1) day (P2) side of the level inside the
channel (P3) channel
N/A
Average
Average
Positive
N/A
N/A
Such a trade usually cannot be turned into a longer-term position withtechnical targets located outside of a one-day trading range. Usually thetrue reverse can be expected if the market fails to reach the support of adescending channel or a resistance of an ascending one. So the tradedescribed in this template is a counter trade against the current trend, andthe profit better be taken as soon as possible.
Box 19.7
ccc_beat_159-190_ch19.qxd 6/8/06 2:44 PM Page 172
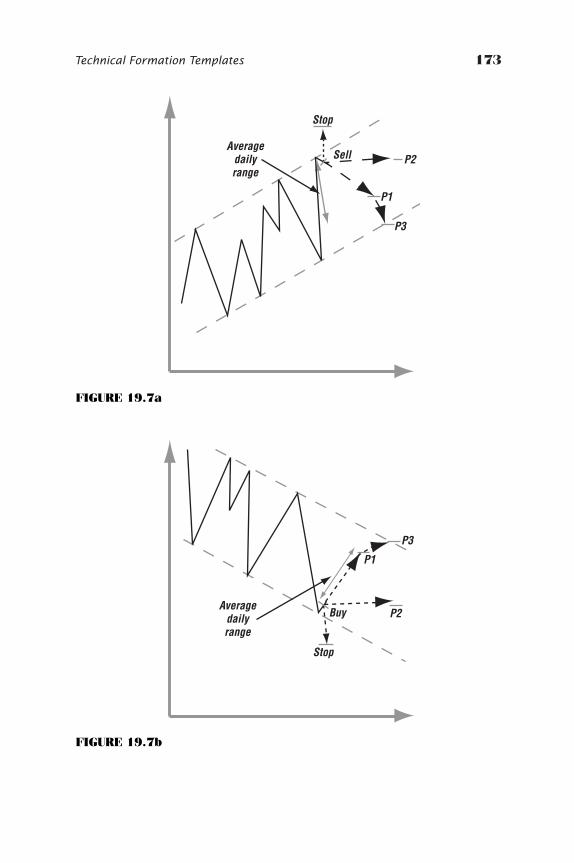
Technical Formation Templates 173
P1
Sell P2
P3
Stop
Averagedailyrange
FIGURE 19.7a
P1
Buy P2
P3
Stop
Averagedailyrange
FIGURE 19.7b
ccc_beat_159-190_ch19.qxd 6/8/06 2:44 PM Page 173

174 TEMPLATES FOR SHORT-TERM AND INTRADAY TRADING
Brief situationdescription:
Currencyrecommendedfor a trade:
Tradecharacteristics:
Trade (entry point)suggestions:
Entry time:
Entry execution:
Stop loss placed:
Reverse if stopstriggered:
Target (customchoice):
Potential profitestimation:
Profit probabilityevaluation:
Risks evaluation:
P/L ratio:
Potentialadvantages infavor of the openposition:
Possiblecomplications,disadvantages,and risk warnings,and solutions toavoid them:
Additional notices,recommendations,and trading tips:
The market has formed an inclined channel, which can be identified onhourly and daily charts. This trade would be the continuation of the onedescribed in Box 19.6 (in case the stops were triggered and the positionreversed). It can also be traded independently, and the signal to enter themarket would be the break of the border of such a channel.
All majors and crosses.
Basic (conservative).
Enter the market on the break of the lower side of an ascending channelor at the upper border of a descending one.
Any time.
Entry-stop order.
The opposite side of the current day Other technical level inside the range (if close enough). current day range.
Recommended (automatic entry-stop order) at the opposite side of a currentday range.
Average daily range (P1) End of the day (P2) Other
N/A
High
Low
Neutral to Positive
N/A
N/A
Such a trade can also be turned into a longer-term position with technicaltargets located outside the day-trading range. In this case, the position wasopen following a signal indicating potential trend change, and might bekept for longer term.
Box 19.8
ccc_beat_159-190_ch19.qxd 6/8/06 2:44 PM Page 174
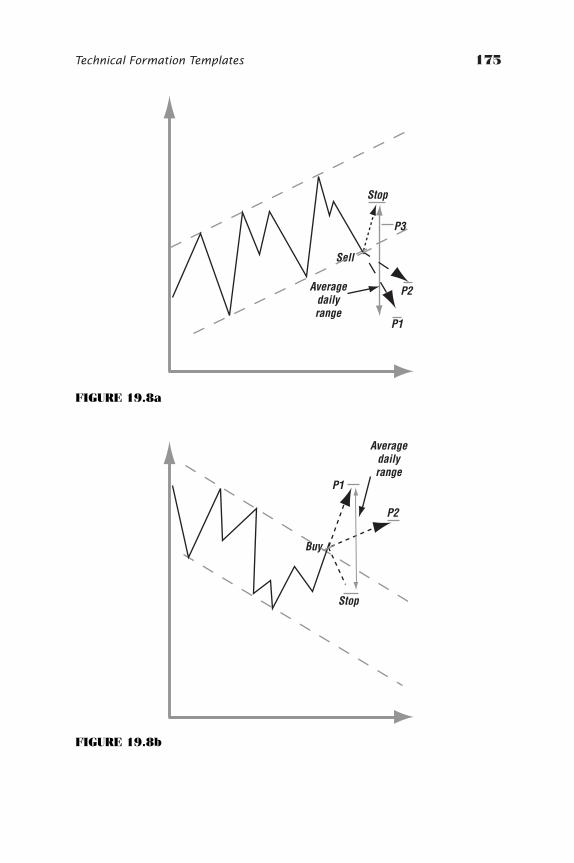
Technical Formation Templates 175
P1
Sell
P2
P3
Stop
Averagedailyrange
FIGURE 19.8a
P1
Buy
P2
Stop
Averagedailyrange
FIGURE 19.8b
ccc_beat_159-190_ch19.qxd 6/8/06 2:44 PM Page 175
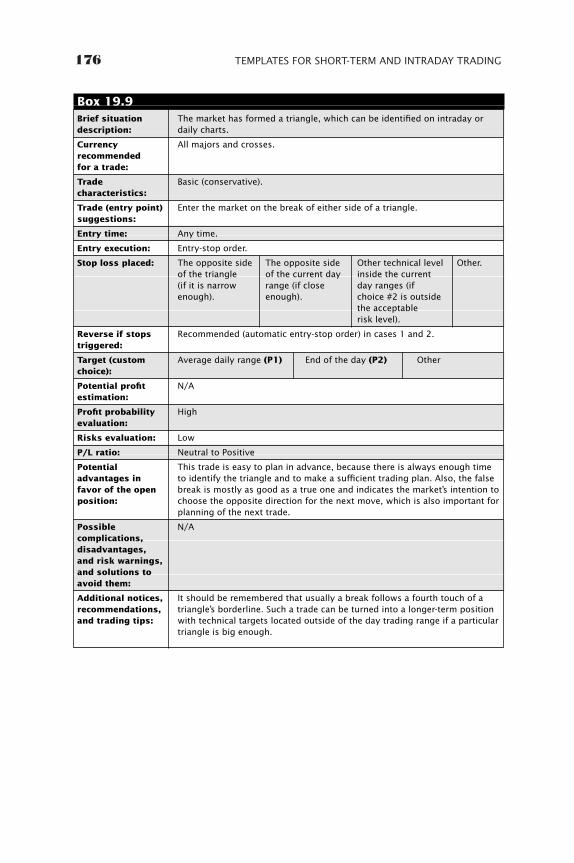
176 TEMPLATES FOR SHORT-TERM AND INTRADAY TRADING
Brief situationdescription:
Currencyrecommendedfor a trade:
Tradecharacteristics:
Trade (entry point)suggestions:
Entry time:
Entry execution:
Stop loss placed:
Reverse if stopstriggered:
Target (customchoice):
Potential profitestimation:
Profit probabilityevaluation:
Risks evaluation:
P/L ratio:
Potentialadvantages infavor of the openposition:
Possiblecomplications,disadvantages,and risk warnings,and solutions toavoid them:
Additional notices,recommendations,and trading tips:
The market has formed a triangle, which can be identified on intraday ordaily charts.
All majors and crosses.
Basic (conservative).
Enter the market on the break of either side of a triangle.
Any time.
Entry-stop order.
The opposite side The opposite side Other technical level Other.of the triangle of the current day inside the current(if it is narrow range (if close day ranges (if enough). enough). choice #2 is outside
the acceptablerisk level).
Recommended (automatic entry-stop order) in cases 1 and 2.
Average daily range (P1) End of the day (P2) Other
N/A
High
Low
Neutral to Positive
This trade is easy to plan in advance, because there is always enough timeto identify the triangle and to make a sufficient trading plan. Also, the falsebreak is mostly as good as a true one and indicates the market’s intention tochoose the opposite direction for the next move, which is also important forplanning of the next trade.
N/A
It should be remembered that usually a break follows a fourth touch of atriangle’s borderline. Such a trade can be turned into a longer-term positionwith technical targets located outside of the day trading range if a particulartriangle is big enough.
Box 19.9
ccc_beat_159-190_ch19.qxd 6/8/06 2:44 PM Page 176
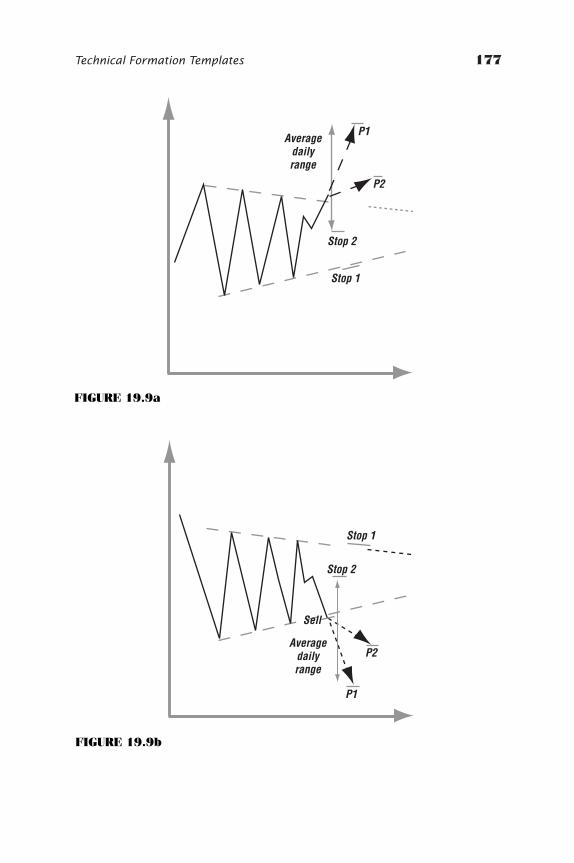
Technical Formation Templates 177
P1
Stop 2
P2
Stop 1
Averagedailyrange
FIGURE 19.9a
P1
P2
Stop 1
Averagedailyrange
Stop 2
Sell
FIGURE 19.9b
ccc_beat_159-190_ch19.qxd 6/8/06 2:45 PM Page 177
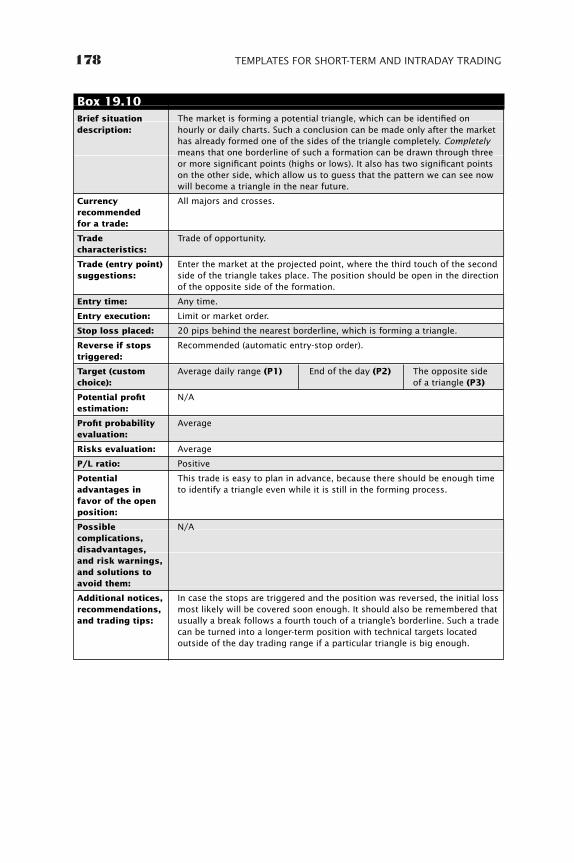
178 TEMPLATES FOR SHORT-TERM AND INTRADAY TRADING
Brief situationdescription:
Currencyrecommendedfor a trade:
Tradecharacteristics:
Trade (entry point)suggestions:
Entry time:
Entry execution:
Stop loss placed:
Reverse if stopstriggered:
Target (customchoice):
Potential profitestimation:
Profit probabilityevaluation:
Risks evaluation:
P/L ratio:
Potentialadvantages infavor of the openposition:
Possiblecomplications,disadvantages,and risk warnings,and solutions toavoid them:
Additional notices,recommendations,and trading tips:
The market is forming a potential triangle, which can be identified onhourly or daily charts. Such a conclusion can be made only after the markethas already formed one of the sides of the triangle completely. Completelymeans that one borderline of such a formation can be drawn through threeor more significant points (highs or lows). It also has two significant pointson the other side, which allow us to guess that the pattern we can see nowwill become a triangle in the near future.
All majors and crosses.
Trade of opportunity.
Enter the market at the projected point, where the third touch of the secondside of the triangle takes place. The position should be open in the directionof the opposite side of the formation.
Any time.
Limit or market order.
20 pips behind the nearest borderline, which is forming a triangle.
Recommended (automatic entry-stop order).
Average daily range (P1) End of the day (P2) The opposite side of a triangle (P3)
N/A
Average
Average
Positive
This trade is easy to plan in advance, because there should be enough timeto identify a triangle even while it is still in the forming process.
N/A
In case the stops are triggered and the position was reversed, the initial lossmost likely will be covered soon enough. It should also be remembered thatusually a break follows a fourth touch of a triangle’s borderline. Such a tradecan be turned into a longer-term position with technical targets locatedoutside of the day trading range if a particular triangle is big enough.
Box 19.10
ccc_beat_159-190_ch19.qxd 6/8/06 2:45 PM Page 178
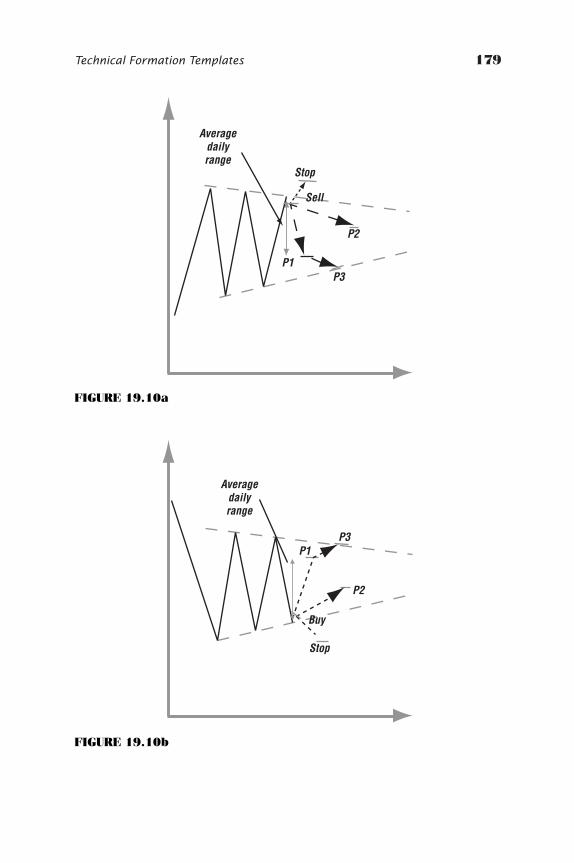
Technical Formation Templates 179
P1
P2
Stop
Averagedailyrange
P3
Sell
FIGURE 19.10a
P1
P2
Stop
Averagedailyrange
P3
Buy
FIGURE 19.10b
ccc_beat_159-190_ch19.qxd 6/8/06 2:45 PM Page 179
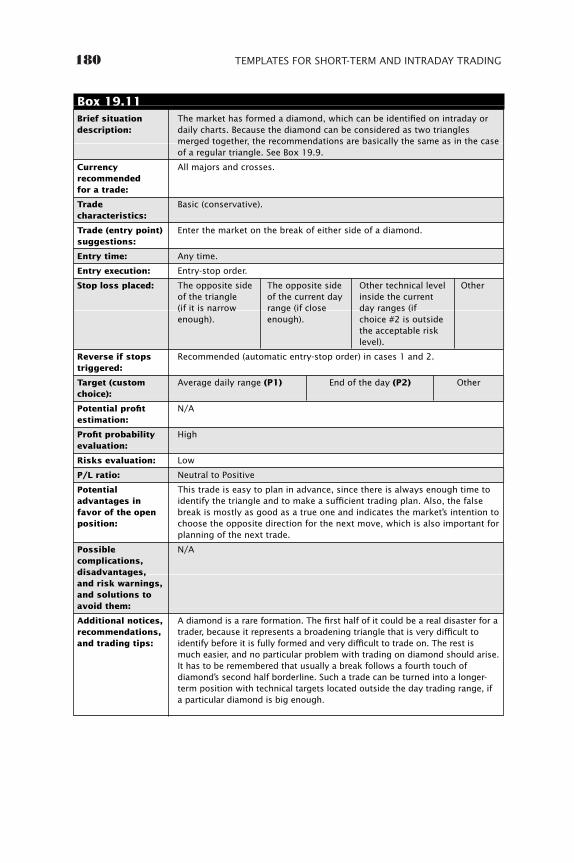
180 TEMPLATES FOR SHORT-TERM AND INTRADAY TRADING
Brief situationdescription:
Currencyrecommendedfor a trade:
Tradecharacteristics:
Trade (entry point)suggestions:
Entry time:
Entry execution:
Stop loss placed:
Reverse if stopstriggered:
Target (customchoice):
Potential profitestimation:
Profit probabilityevaluation:
Risks evaluation:
P/L ratio:
Potentialadvantages infavor of the openposition:
Possiblecomplications,disadvantages,and risk warnings,and solutions toavoid them:
Additional notices,recommendations,and trading tips:
The market has formed a diamond, which can be identified on intraday ordaily charts. Because the diamond can be considered as two trianglesmerged together, the recommendations are basically the same as in the caseof a regular triangle. See Box 19.9.
All majors and crosses.
Basic (conservative).
Enter the market on the break of either side of a diamond.
Any time.
Entry-stop order.
The opposite side The opposite side Other technical level Other of the triangle of the current day inside the current (if it is narrow range (if close day ranges (if enough). enough). choice #2 is outside
the acceptable risk level).
Recommended (automatic entry-stop order) in cases 1 and 2.
Average daily range (P1) End of the day (P2) Other
N/A
High
Low
Neutral to Positive
This trade is easy to plan in advance, since there is always enough time toidentify the triangle and to make a sufficient trading plan. Also, the falsebreak is mostly as good as a true one and indicates the market’s intention tochoose the opposite direction for the next move, which is also important forplanning of the next trade.
N/A
A diamond is a rare formation. The first half of it could be a real disaster for atrader, because it represents a broadening triangle that is very difficult toidentify before it is fully formed and very difficult to trade on. The rest ismuch easier, and no particular problem with trading on diamond should arise.It has to be remembered that usually a break follows a fourth touch ofdiamond’s second half borderline. Such a trade can be turned into a longer-term position with technical targets located outside the day trading range, ifa particular diamond is big enough.
Box 19.11
ccc_beat_159-190_ch19.qxd 6/8/06 2:45 PM Page 180
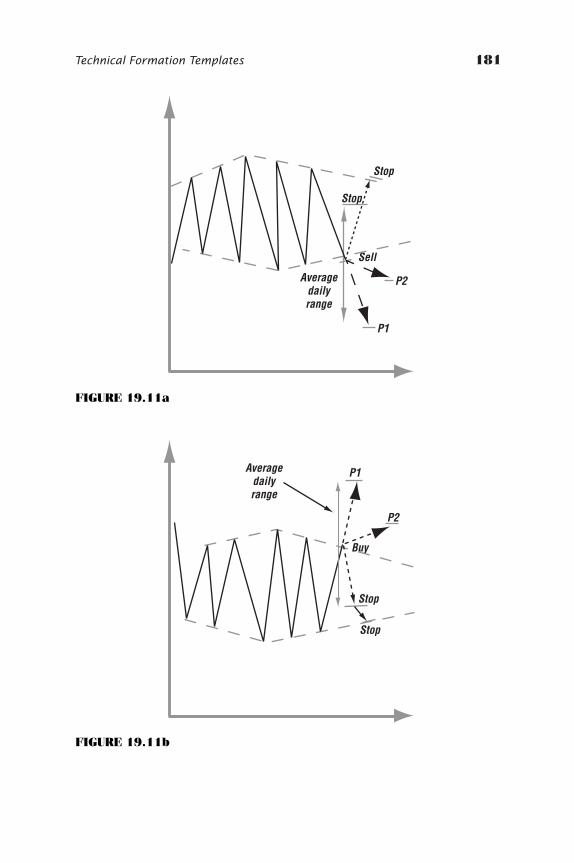
Technical Formation Templates 181
P1
Sell
P2
Stop
Averagedailyrange
Stop
FIGURE 19.11a
P1
Buy
P2
Stop
Averagedailyrange
Stop
FIGURE 19.11b
ccc_beat_159-190_ch19.qxd 6/8/06 2:45 PM Page 181
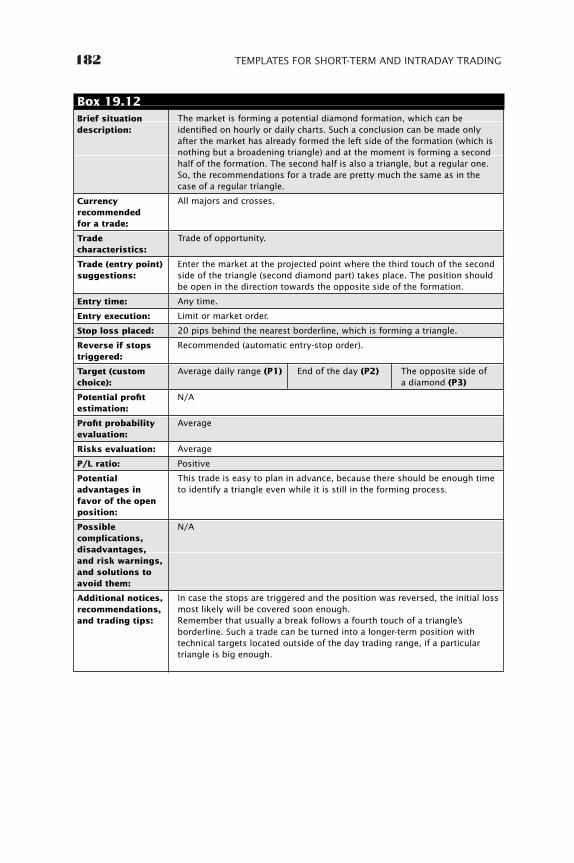
182 TEMPLATES FOR SHORT-TERM AND INTRADAY TRADING
Brief situationdescription:
Currencyrecommendedfor a trade:
Tradecharacteristics:
Trade (entry point)suggestions:
Entry time:
Entry execution:
Stop loss placed:
Reverse if stopstriggered:
Target (customchoice):
Potential profitestimation:
Profit probabilityevaluation:
Risks evaluation:
P/L ratio:
Potentialadvantages infavor of the openposition:
Possiblecomplications,disadvantages,and risk warnings,and solutions toavoid them:
Additional notices,recommendations,and trading tips:
The market is forming a potential diamond formation, which can beidentified on hourly or daily charts. Such a conclusion can be made onlyafter the market has already formed the left side of the formation (which isnothing but a broadening triangle) and at the moment is forming a secondhalf of the formation. The second half is also a triangle, but a regular one.So, the recommendations for a trade are pretty much the same as in thecase of a regular triangle.
All majors and crosses.
Trade of opportunity.
Enter the market at the projected point where the third touch of the secondside of the triangle (second diamond part) takes place. The position shouldbe open in the direction towards the opposite side of the formation.
Any time.
Limit or market order.
20 pips behind the nearest borderline, which is forming a triangle.
Recommended (automatic entry-stop order).
Average daily range (P1) End of the day (P2) The opposite side of a diamond (P3)
N/A
Average
Average
Positive
This trade is easy to plan in advance, because there should be enough timeto identify a triangle even while it is still in the forming process.
N/A
In case the stops are triggered and the position was reversed, the initial lossmost likely will be covered soon enough.Remember that usually a break follows a fourth touch of a triangle’sborderline. Such a trade can be turned into a longer-term position withtechnical targets located outside of the day trading range, if a particulartriangle is big enough.
Box 19.12
ccc_beat_159-190_ch19.qxd 6/8/06 2:45 PM Page 182
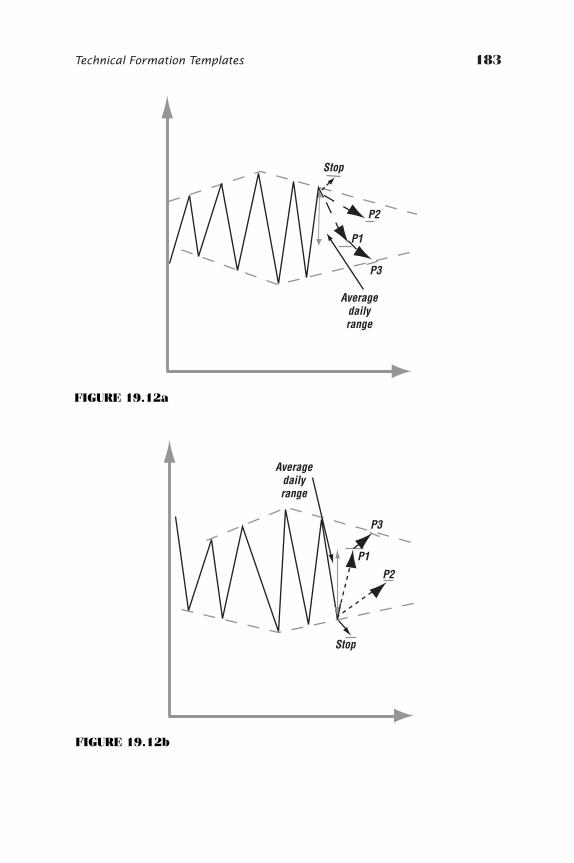
Technical Formation Templates 183
P1
P2
P3
Averagedailyrange
Stop
FIGURE 19.12a
P1
P2
Stop
Averagedailyrange
P3
FIGURE 19.12b
ccc_beat_159-190_ch19.qxd 6/8/06 2:45 PM Page 183
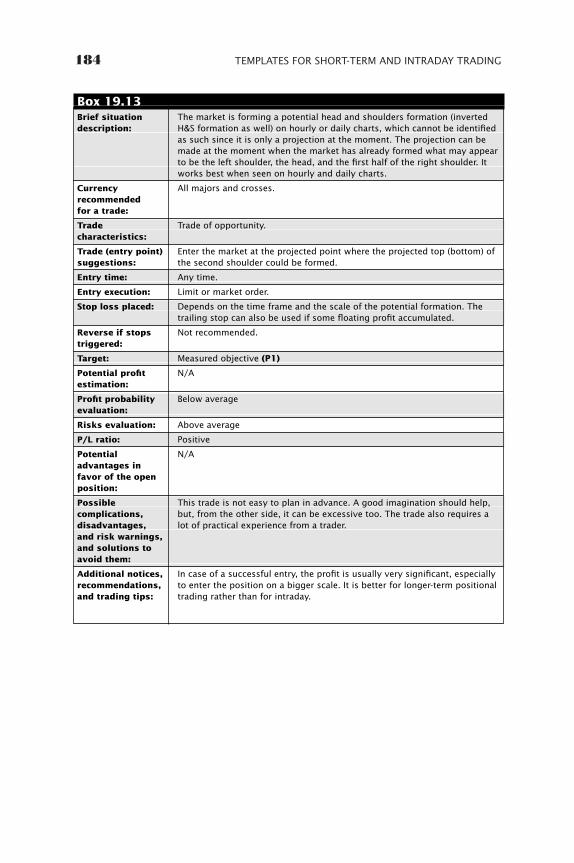
184 TEMPLATES FOR SHORT-TERM AND INTRADAY TRADING
Brief situationdescription:
Currencyrecommendedfor a trade:
Tradecharacteristics:
Trade (entry point)suggestions:
Entry time:
Entry execution:
Stop loss placed:
Reverse if stopstriggered:
Target:
Potential profitestimation:
Profit probabilityevaluation:
Risks evaluation:
P/L ratio:
Potentialadvantages infavor of the openposition:
Possiblecomplications,disadvantages,and risk warnings,and solutions toavoid them:
Additional notices,recommendations,and trading tips:
The market is forming a potential head and shoulders formation (invertedH&S formation as well) on hourly or daily charts, which cannot be identifiedas such since it is only a projection at the moment. The projection can bemade at the moment when the market has already formed what may appearto be the left shoulder, the head, and the first half of the right shoulder. Itworks best when seen on hourly and daily charts.
All majors and crosses.
Trade of opportunity.
Enter the market at the projected point where the projected top (bottom) ofthe second shoulder could be formed.
Any time.
Limit or market order.
Depends on the time frame and the scale of the potential formation. Thetrailing stop can also be used if some floating profit accumulated.
Not recommended.
Measured objective (P1)
N/A
Below average
Above average
Positive
N/A
This trade is not easy to plan in advance. A good imagination should help,but, from the other side, it can be excessive too. The trade also requires alot of practical experience from a trader.
In case of a successful entry, the profit is usually very significant, especiallyto enter the position on a bigger scale. It is better for longer-term positionaltrading rather than for intraday.
Box 19.13
ccc_beat_159-190_ch19.qxd 6/8/06 2:45 PM Page 184
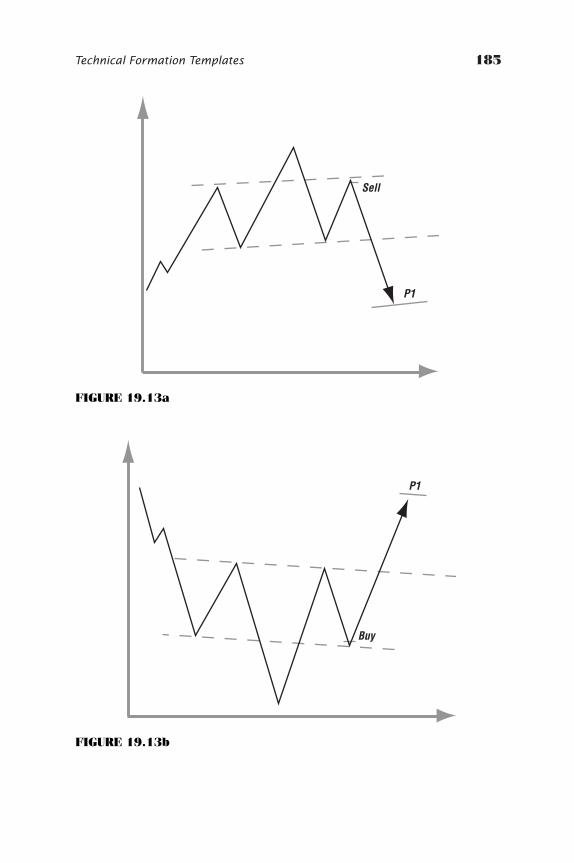
Technical Formation Templates 185
P1
Sell
FIGURE 19.13a
P1
Buy
FIGURE 19.13b
ccc_beat_159-190_ch19.qxd 6/8/06 2:45 PM Page 185
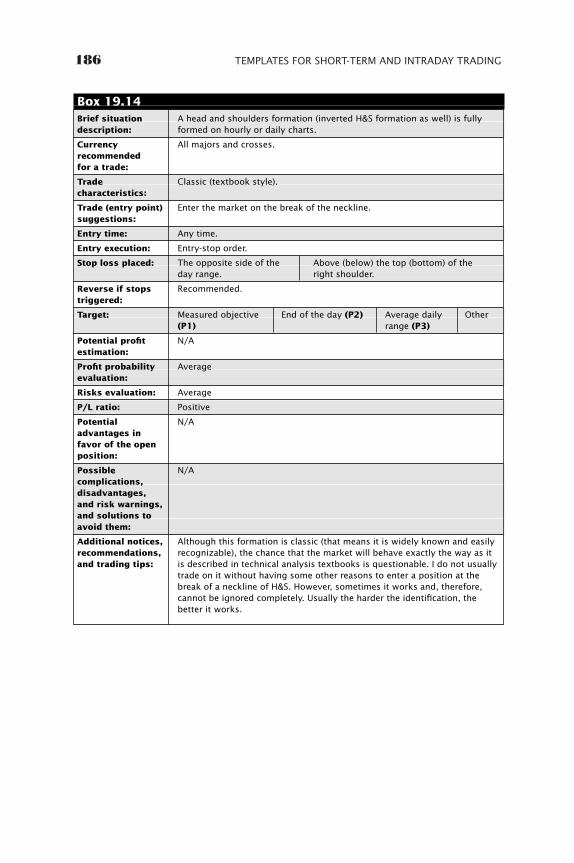
186 TEMPLATES FOR SHORT-TERM AND INTRADAY TRADING
Brief situationdescription:
Currencyrecommendedfor a trade:
Tradecharacteristics:
Trade (entry point)suggestions:
Entry time:
Entry execution:
Stop loss placed:
Reverse if stopstriggered:
Target:
Potential profitestimation:
Profit probabilityevaluation:
Risks evaluation:
P/L ratio:
Potentialadvantages infavor of the openposition:
Possiblecomplications,disadvantages,and risk warnings,and solutions toavoid them:
Additional notices,recommendations,and trading tips:
A head and shoulders formation (inverted H&S formation as well) is fullyformed on hourly or daily charts.
All majors and crosses.
Classic (textbook style).
Enter the market on the break of the neckline.
Any time.
Entry-stop order.
The opposite side of the Above (below) the top (bottom) of the day range. right shoulder.
Recommended.
Measured objective End of the day (P2) Average daily Other(P1) range (P3)
N/A
Average
Average
Positive
N/A
N/A
Although this formation is classic (that means it is widely known and easilyrecognizable), the chance that the market will behave exactly the way as itis described in technical analysis textbooks is questionable. I do not usuallytrade on it without having some other reasons to enter a position at thebreak of a neckline of H&S. However, sometimes it works and, therefore,cannot be ignored completely. Usually the harder the identification, thebetter it works.
Box 19.14
ccc_beat_159-190_ch19.qxd 6/8/06 2:45 PM Page 186
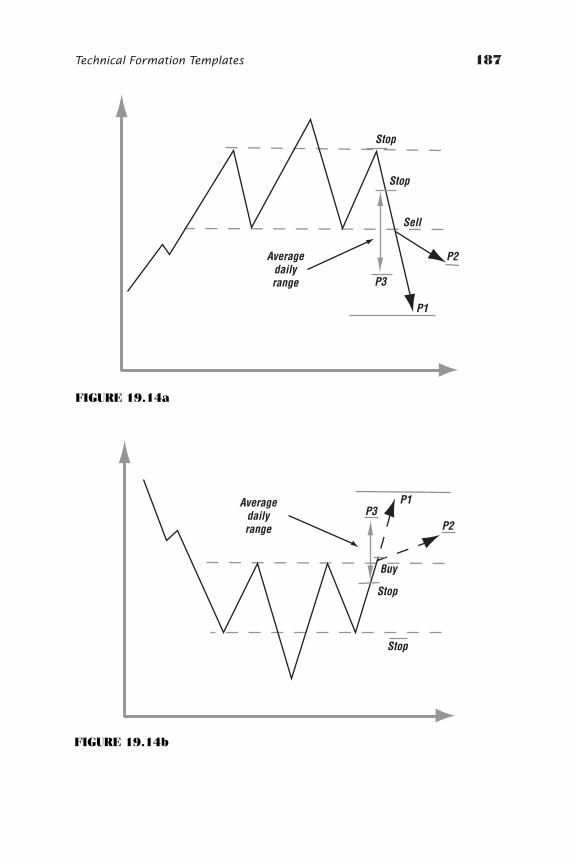
Technical Formation Templates 187
P1
Sell
Averagedailyrange
Stop
Stop
P3
P2
FIGURE 19.14a
P1
Buy
Averagedailyrange
Stop
Stop
P3P2
FIGURE 19.14b
ccc_beat_159-190_ch19.qxd 6/8/06 2:45 PM Page 187
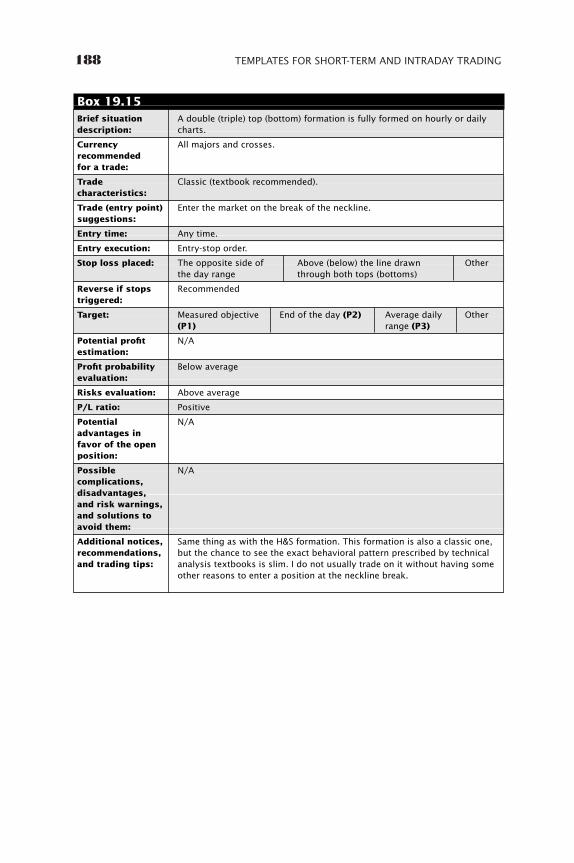
188 TEMPLATES FOR SHORT-TERM AND INTRADAY TRADING
Brief situationdescription:
Currencyrecommendedfor a trade:
Tradecharacteristics:
Trade (entry point)suggestions:
Entry time:
Entry execution:
Stop loss placed:
Reverse if stopstriggered:
Target:
Potential profitestimation:
Profit probabilityevaluation:
Risks evaluation:
P/L ratio:
Potentialadvantages infavor of the openposition:
Possiblecomplications,disadvantages,and risk warnings,and solutions toavoid them:
Additional notices,recommendations,and trading tips:
A double (triple) top (bottom) formation is fully formed on hourly or dailycharts.
All majors and crosses.
Classic (textbook recommended).
Enter the market on the break of the neckline.
Any time.
Entry-stop order.
The opposite side of Above (below) the line drawn Otherthe day range through both tops (bottoms)
Recommended
Measured objective End of the day (P2) Average daily Other(P1) range (P3)
N/A
Below average
Above average
Positive
N/A
N/A
Same thing as with the H&S formation. This formation is also a classic one,but the chance to see the exact behavioral pattern prescribed by technicalanalysis textbooks is slim. I do not usually trade on it without having someother reasons to enter a position at the neckline break.
Box 19.15
ccc_beat_159-190_ch19.qxd 6/8/06 2:45 PM Page 188
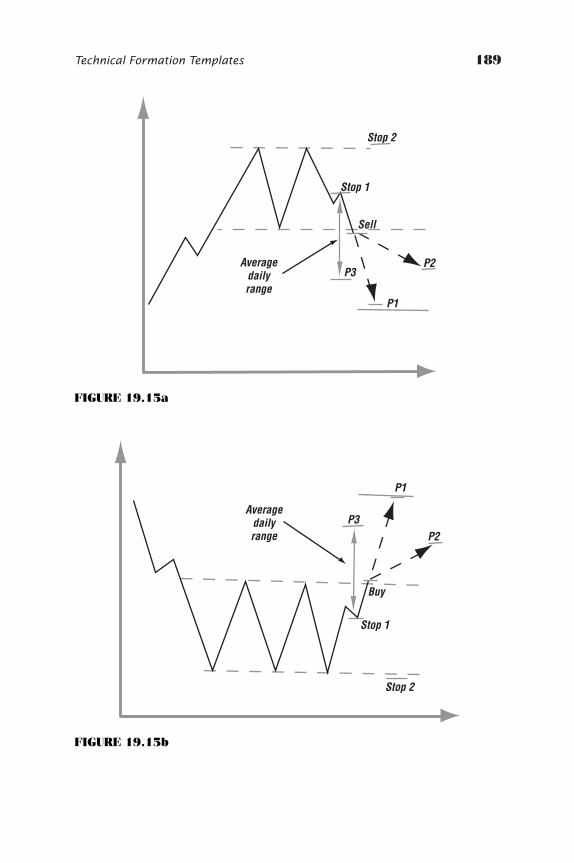
Technical Formation Templates 189
P1
Sell
Averagedailyrange
Stop 2
Stop 1
P3P2
FIGURE 19.15a
P1
Buy
Averagedailyrange
Stop 2
Stop 1
P3P2
FIGURE 19.15b
ccc_beat_159-190_ch19.qxd 6/8/06 2:45 PM Page 189

ccc_beat_159-190_ch19.qxd 6/8/06 2:45 PM Page 190

191
CHAPTER 20
Trendlines,Support, andResistanceTemplates
The following templates are based on trendlines, supports, and resis-tances. Please see Box 20.1 through Box 20.7, along with each box’saccompanying figures.
ccc_beat_191-206_ch20.qxd 6/8/06 2:45 PM Page 191

192 TEMPLATES FOR SHORT-TERM AND INTRADAY TRADING
Brief situationdescription:
Currencyrecommendedfor a trade:
Tradecharacteristics:
Trade (entry point)suggestions:
Entry time:
Entry execution:
Stop-loss placed:(Cannot be chosenin accordance witha trader’sindividualsituation andpreferences.Moneymanagementprinciples mustapply.)
Reverse if stopstriggered:
Target (customchoice):
Potential profitestimation:
Profit probabilityevaluation:
Risks evaluation:
P/L ratio:
Potentialadvantages infavor of the openposition:
The most probablecomplications,disadvantages,and risk warnings,and advice toavoid them:
The market has formed on daily charts a specific formation, which I call acomb. (This is a sort of short-term trend seen on frame charts any timeincluding intraday, daily, and weekly.)
USD/CHF, USD/JPY, EUR/USD, EUR/JPY and other Euro crosses.
Basic (conservative).
Take a position in the direction of the move on the break of the trendlinelimiting a comb from one side:A. Buy on the break of the descending line, ORB. Sell on the break of the ascending line.
Any time.
Entry-stop order.
On the opposite side of the current day range. (Above the previous day highor below the previous day low.)
Recommended. (Automatic and simultaneous with stops.)
Average daily range (P1) End of the day (P2) Other
N/A
Average to High
Average to Low
Positive
The position was open in the The position was open in the directiondirection of the medium-term of the main move of the previous day.trend.
RW#1: The position was open A#1: Move your stops closer and against the direction of the place them above (below) the previous medium-term trend. local extreme formed the same day.RW#2: The position was open A#2: Same as above.against the main move of theprevious day.
Box 20.1
ccc_beat_191-206_ch20.qxd 6/8/06 2:45 PM Page 192
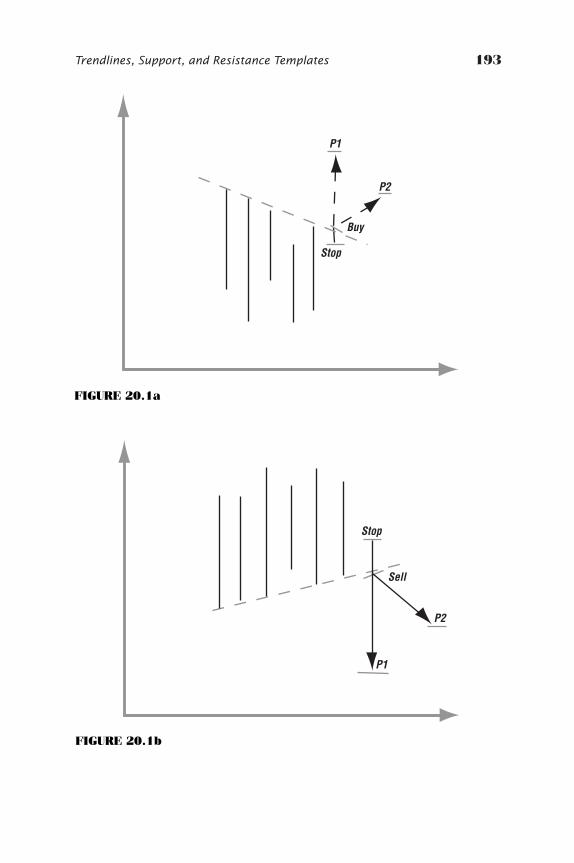
Trendlines, Support, and Resistance Templates 193
P1
P2
Buy
Stop
FIGURE 20.1a
P1
P2
Sell
Stop
FIGURE 20.1b
ccc_beat_191-206_ch20.qxd 6/8/06 2:45 PM Page 193
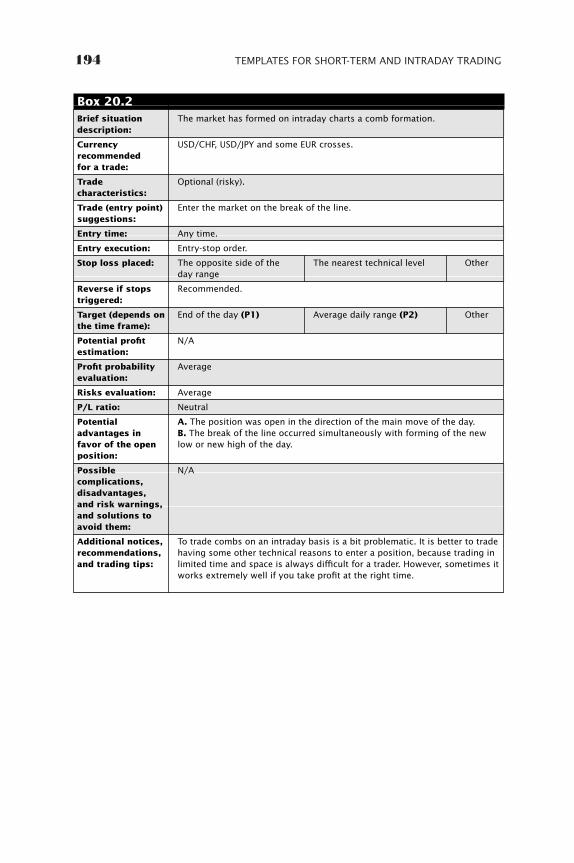
194 TEMPLATES FOR SHORT-TERM AND INTRADAY TRADING
Brief situation description:
Currencyrecommendedfor a trade:
Tradecharacteristics:
Trade (entry point) suggestions:
Entry time:
Entry execution:
Stop loss placed:
Reverse if stops triggered:
Target (depends onthe time frame):
Potential profitestimation:
Profit probabilityevaluation:
Risks evaluation:
P/L ratio:
Potentialadvantages infavor of the openposition:
Possiblecomplications,disadvantages,and risk warnings,and solutions toavoid them:
Additional notices,recommendations,and trading tips:
The market has formed on intraday charts a comb formation.
USD/CHF, USD/JPY and some EUR crosses.
Optional (risky).
Enter the market on the break of the line.
Any time.
Entry-stop order.
The opposite side of the The nearest technical level Otherday range
Recommended.
End of the day (P1) Average daily range (P2) Other
N/A
Average
Average
Neutral
A. The position was open in the direction of the main move of the day.B. The break of the line occurred simultaneously with forming of the newlow or new high of the day.
N/A
To trade combs on an intraday basis is a bit problematic. It is better to tradehaving some other technical reasons to enter a position, because trading inlimited time and space is always difficult for a trader. However, sometimes itworks extremely well if you take profit at the right time.
Box 20.2
ccc_beat_191-206_ch20.qxd 6/8/06 2:45 PM Page 194
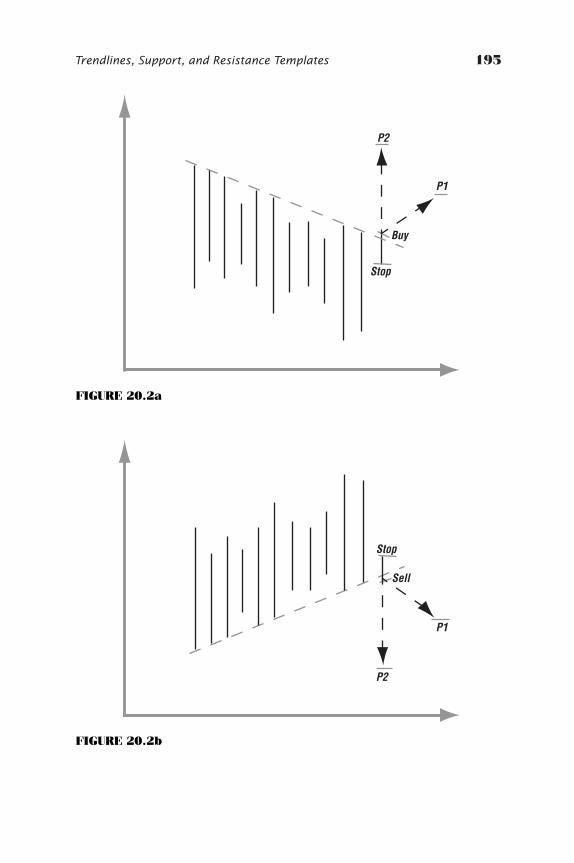
Trendlines, Support, and Resistance Templates 195
P1
P2
Buy
Stop
FIGURE 20.2a
P1
P2
Sell
Stop
FIGURE 20.2b
ccc_beat_191-206_ch20.qxd 6/8/06 2:45 PM Page 195
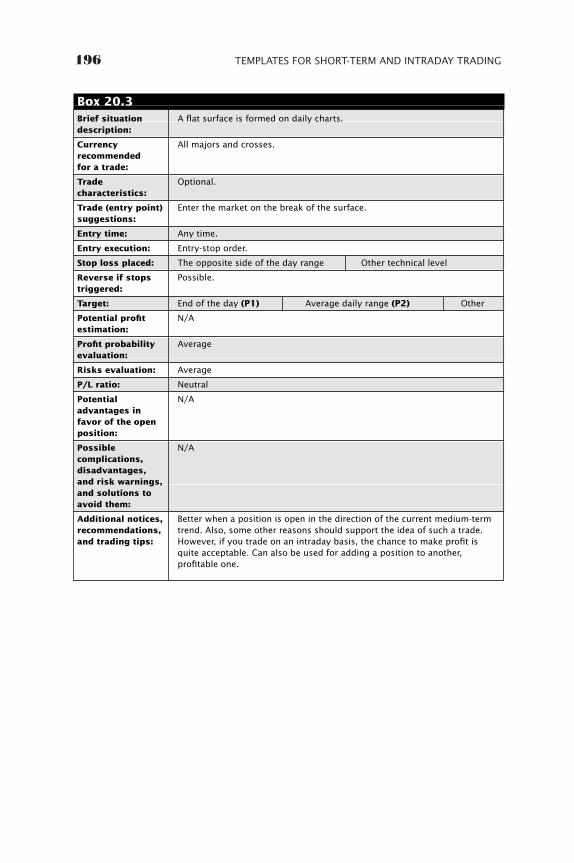
196 TEMPLATES FOR SHORT-TERM AND INTRADAY TRADING
Brief situation description:
Currency recommendedfor a trade:
Trade characteristics:
Trade (entry point) suggestions:
Entry time:
Entry execution:
Stop loss placed:
Reverse if stopstriggered:
Target:
Potential profitestimation:
Profit probabilityevaluation:
Risks evaluation:
P/L ratio:
Potentialadvantages infavor of the openposition:
Possiblecomplications,disadvantages,and risk warnings,and solutions toavoid them:
Additional notices,recommendations,and trading tips:
A flat surface is formed on daily charts.
All majors and crosses.
Optional.
Enter the market on the break of the surface.
Any time.
Entry-stop order.
The opposite side of the day range Other technical level
Possible.
End of the day (P1) Average daily range (P2) Other
N/A
Average
Average
Neutral
N/A
N/A
Better when a position is open in the direction of the current medium-termtrend. Also, some other reasons should support the idea of such a trade.However, if you trade on an intraday basis, the chance to make profit isquite acceptable. Can also be used for adding a position to another,profitable one.
Box 20.3
ccc_beat_191-206_ch20.qxd 6/8/06 2:45 PM Page 196
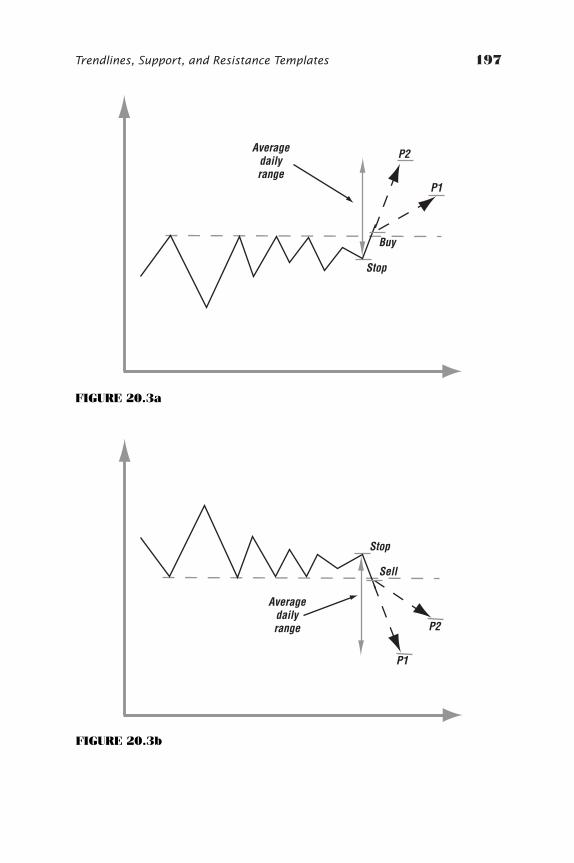
Trendlines, Support, and Resistance Templates 197
P1
Buy
P2Averagedailyrange
Stop
FIGURE 20.3a
P1
Sell
P2
Averagedailyrange
Stop
FIGURE 20.3b
ccc_beat_191-206_ch20.qxd 6/8/06 2:45 PM Page 197
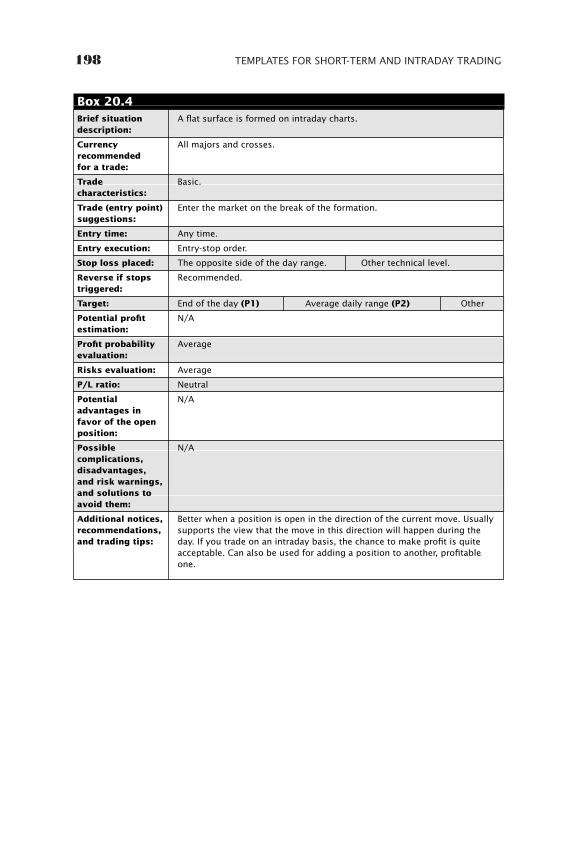
198 TEMPLATES FOR SHORT-TERM AND INTRADAY TRADING
Brief situationdescription:
Currencyrecommendedfor a trade:
Tradecharacteristics:
Trade (entry point)suggestions:
Entry time:
Entry execution:
Stop loss placed:
Reverse if stopstriggered:
Target:
Potential profitestimation:
Profit probabilityevaluation:
Risks evaluation:
P/L ratio:
Potentialadvantages infavor of the openposition:
Possiblecomplications,disadvantages,and risk warnings,and solutions toavoid them:
Additional notices,recommendations,and trading tips:
A flat surface is formed on intraday charts.
All majors and crosses.
Basic.
Enter the market on the break of the formation.
Any time.
Entry-stop order.
The opposite side of the day range. Other technical level.
Recommended.
End of the day (P1) Average daily range (P2) Other
N/A
Average
Average
Neutral
N/A
N/A
Better when a position is open in the direction of the current move. Usuallysupports the view that the move in this direction will happen during theday. If you trade on an intraday basis, the chance to make profit is quiteacceptable. Can also be used for adding a position to another, profitableone.
Box 20.4
ccc_beat_191-206_ch20.qxd 6/8/06 2:45 PM Page 198
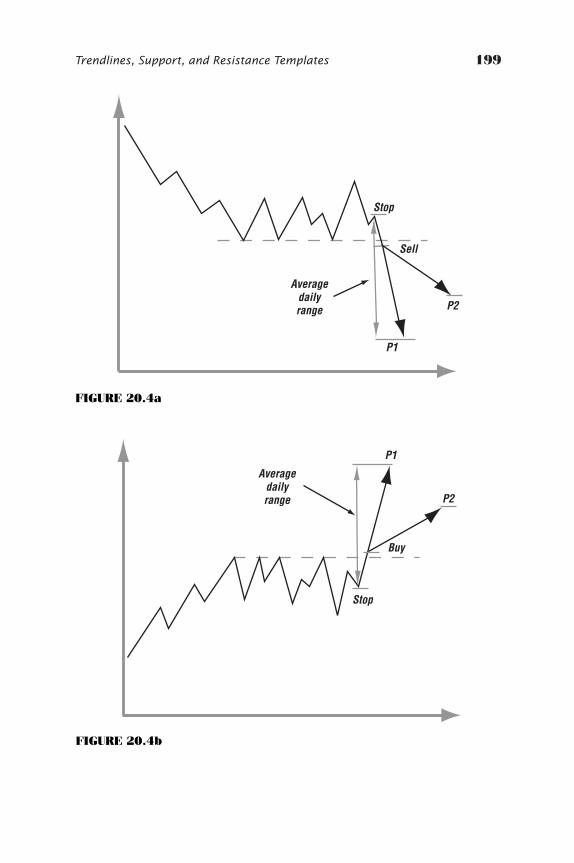
Trendlines, Support, and Resistance Templates 199
P1
Sell
P2
Averagedailyrange
Stop
FIGURE 20.4a
P1
Buy
P2
Averagedailyrange
Stop
FIGURE 20.4b
ccc_beat_191-206_ch20.qxd 6/8/06 2:45 PM Page 199

200 TEMPLATES FOR SHORT-TERM AND INTRADAY TRADING
Brief situationdescription:
Currencyrecommendedfor a trade:
Tradecharacteristics:
Trade (entry point)suggestions:
Entry time:
Entry execution:
Stop loss placed:
Reverse if stopstriggered:
Target:
Potential profitestimation:
Profit probabilityevaluation:
Risks evaluation:
P/L ratio:
Potentialadvantages infavor of the openposition:
Possiblecomplications,disadvantages,and risk warnings,and solutions toavoid them:
Additional notices,recommendations,and trading tips:
The market approaches the major trendline drawn through two (or more)absolutely extreme points. (There should be the whole chart on one sidefrom such a line and a totally free space on the other side.) The trade canbe executed only on the approach to a supportive line of theuptrend or at the resisting line of a downtrend.
All majors and crosses.
Basic.
Enter the market 5 to 10 pips before the line in the direction, opposite tothe direction of the move.
Any time.
Limit or market order.
Behind the line.
Recommended. (Trailing stop can also be used.)
End of the day (P1) Average daily range Other technical point (P2) or reason
N/A
Above average
Below average
Positive
N/A
N/A
The bigger the number of points lying on such a line, the less theprobability to commit a profitable trade. I prefer to trade this template onthe third or (at the maximum) fourth approach to the line. In the case of thefourth approach, I usually take profit early, using some market’s hesitationahead of the line.
Box 20.5
ccc_beat_191-206_ch20.qxd 6/8/06 2:45 PM Page 200
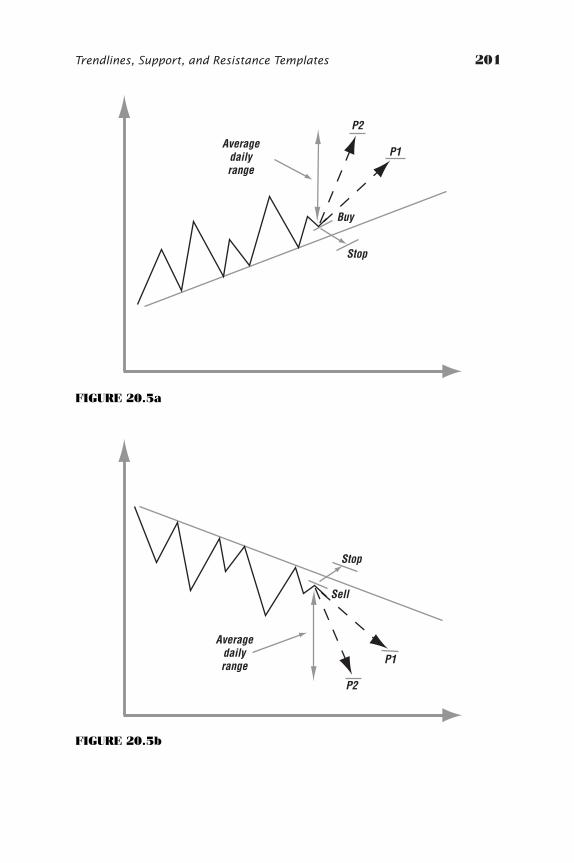
Trendlines, Support, and Resistance Templates 201
P1
Buy
P2
Averagedailyrange
Stop
FIGURE 20.5a
P1
Sell
P2
Averagedailyrange
Stop
FIGURE 20.5b
ccc_beat_191-206_ch20.qxd 6/8/06 2:45 PM Page 201
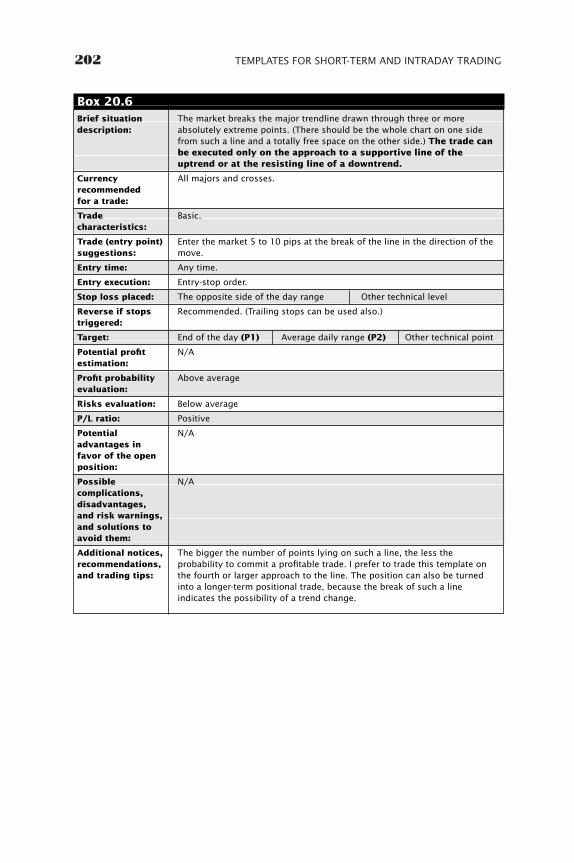
202 TEMPLATES FOR SHORT-TERM AND INTRADAY TRADING
Brief situationdescription:
Currencyrecommendedfor a trade:
Tradecharacteristics:
Trade (entry point)suggestions:
Entry time:
Entry execution:
Stop loss placed:
Reverse if stopstriggered:
Target:
Potential profitestimation:
Profit probabilityevaluation:
Risks evaluation:
P/L ratio:
Potentialadvantages infavor of the openposition:
Possiblecomplications,disadvantages,and risk warnings,and solutions toavoid them:
Additional notices,recommendations,and trading tips:
The market breaks the major trendline drawn through three or moreabsolutely extreme points. (There should be the whole chart on one sidefrom such a line and a totally free space on the other side.) The trade canbe executed only on the approach to a supportive line of theuptrend or at the resisting line of a downtrend.
All majors and crosses.
Basic.
Enter the market 5 to 10 pips at the break of the line in the direction of themove.
Any time.
Entry-stop order.
The opposite side of the day range Other technical level
Recommended. (Trailing stops can be used also.)
End of the day (P1) Average daily range (P2) Other technical point
N/A
Above average
Below average
Positive
N/A
N/A
The bigger the number of points lying on such a line, the less theprobability to commit a profitable trade. I prefer to trade this template onthe fourth or larger approach to the line. The position can also be turnedinto a longer-term positional trade, because the break of such a lineindicates the possibility of a trend change.
Box 20.6
ccc_beat_191-206_ch20.qxd 6/8/06 2:45 PM Page 202
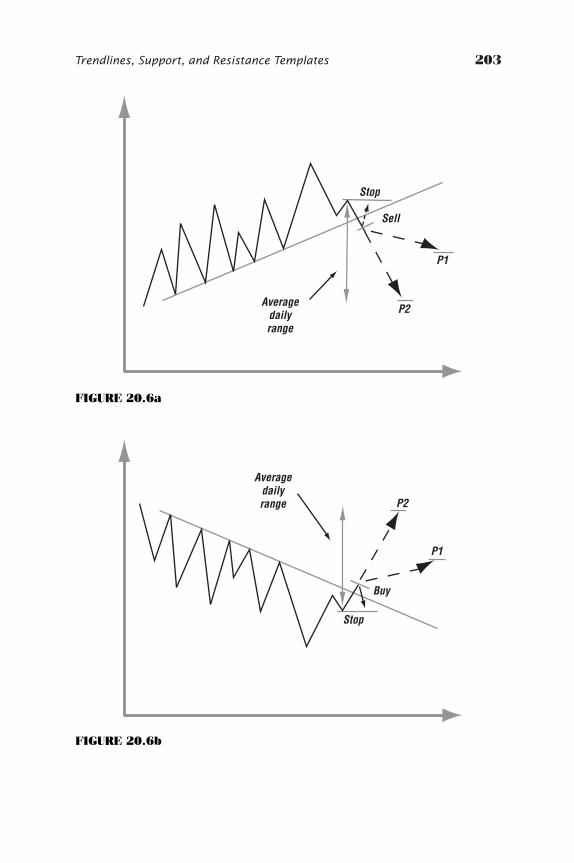
Trendlines, Support, and Resistance Templates 203
P1
Sell
P2Average
dailyrange
Stop
FIGURE 20.6a
P1
Buy
P2
Averagedailyrange
Stop
FIGURE 20.6b
ccc_beat_191-206_ch20.qxd 6/8/06 2:45 PM Page 203
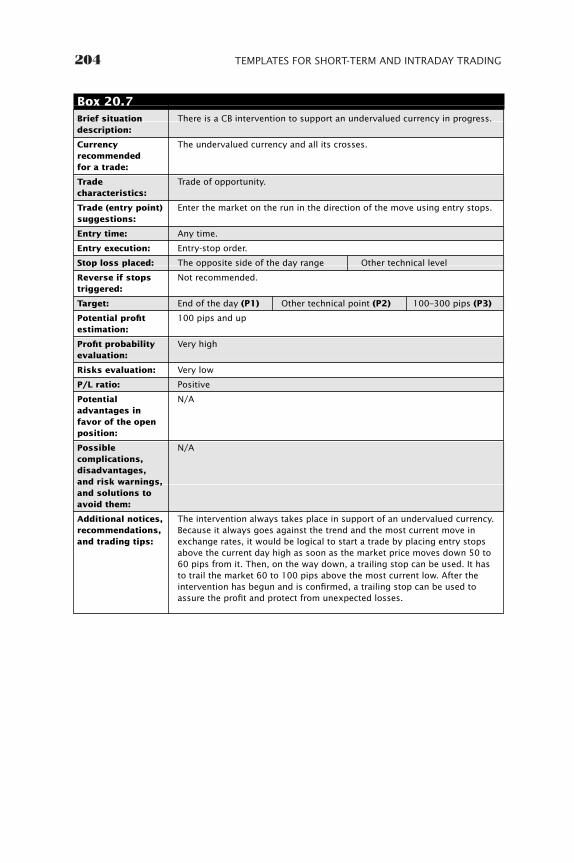
204 TEMPLATES FOR SHORT-TERM AND INTRADAY TRADING
Brief situationdescription:
Currencyrecommendedfor a trade:
Tradecharacteristics:
Trade (entry point)suggestions:
Entry time:
Entry execution:
Stop loss placed:
Reverse if stopstriggered:
Target:
Potential profitestimation:
Profit probabilityevaluation:
Risks evaluation:
P/L ratio:
Potentialadvantages infavor of the openposition:
Possiblecomplications,disadvantages,and risk warnings,and solutions toavoid them:
Additional notices,recommendations,and trading tips:
There is a CB intervention to support an undervalued currency in progress.
The undervalued currency and all its crosses.
Trade of opportunity.
Enter the market on the run in the direction of the move using entry stops.
Any time.
Entry-stop order.
The opposite side of the day range Other technical level
Not recommended.
End of the day (P1) Other technical point (P2) 100–300 pips (P3)
100 pips and up
Very high
Very low
Positive
N/A
N/A
The intervention always takes place in support of an undervalued currency.Because it always goes against the trend and the most current move inexchange rates, it would be logical to start a trade by placing entry stopsabove the current day high as soon as the market price moves down 50 to60 pips from it. Then, on the way down, a trailing stop can be used. It hasto trail the market 60 to 100 pips above the most current low. After theintervention has begun and is confirmed, a trailing stop can be used toassure the profit and protect from unexpected losses.
Box 20.7
ccc_beat_191-206_ch20.qxd 6/8/06 2:45 PM Page 204
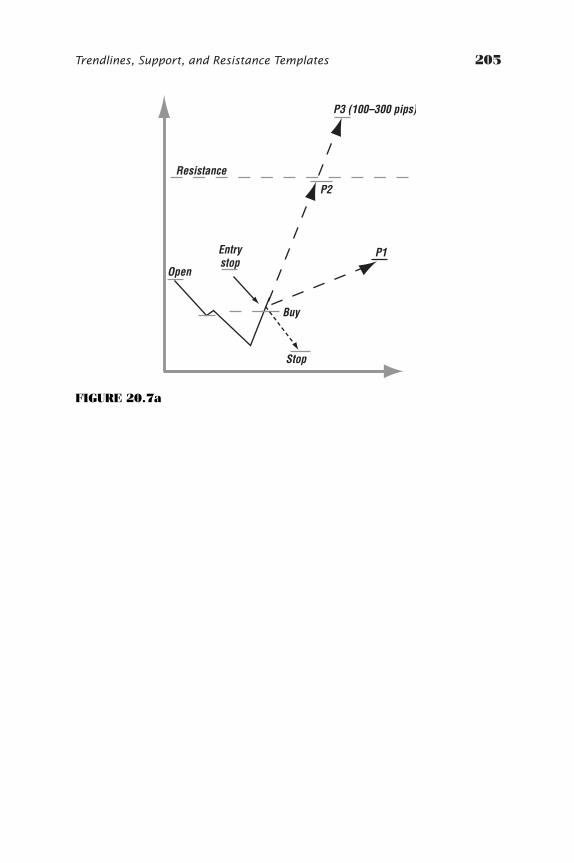
Trendlines, Support, and Resistance Templates 205
P1
Buy
P2
Resistance
Stop
P3 (100–300 pips)
Open
Entrystop
FIGURE 20.7a
ccc_beat_191-206_ch20.qxd 6/8/06 2:45 PM Page 205

ccc_beat_191-206_ch20.qxd 6/8/06 2:45 PM Page 206
207
CHAPTER 21
A Sample Trade
Ihave to admit that I was not going to write a conclusion to Part V or tothe book in general. However, there was a perfect and recent sampletaken from the real market that clearly illustrates the potential and the
power of the templates just described, as well as some other thoughts andideas about my common sense trading technique. I believe the real marketsituation shown in Figure 21.1 will give you clearer understanding ofwhen and how the trading ideas described in the book can be applied toreal trading. As you see, this particular day not only provided several dif-ferent trading opportunities, but also gave a trader a choice of which trad-ing signal to accept and which to ignore, in accordance with his individualtrading profile and preferences.
On the chart, the market has formed a narrow horizontal channel atthe beginning of a trading day and during the Asian session. Then, it brokethe upper border of the channel, creating the opportunity to use Box 19.2and to enter the market in the direction of the break for a quick and rela-tively moderate profit. For a more conservative trader who did not wantthe risk of entering the market with the position where the profit shouldbe taken fast, there was another opportunity to enter the market. In accor-dance with another trading scheme (see Box 18.3), you can enter the mar-ket because it was moving in just one direction from the open price. If thistrading opportunity was also considered an inappropriate one at the mo-ment, another trading opportunity would arise soon. Entering the marketon the break of the low of the previous range was recommended in accor-dance with four (!) other different templates, Box 19.1, Box 18.2, Box 20.4,and even Box 18.1.
ccc_beat_207-210_ch21.qxd 6/8/06 2:46 PM Page 207
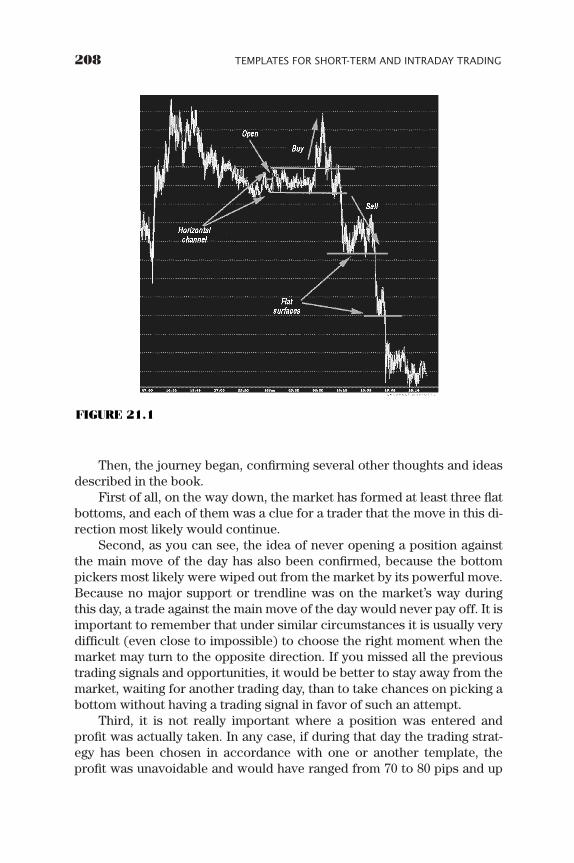
Then, the journey began, confirming several other thoughts and ideasdescribed in the book.
First of all, on the way down, the market has formed at least three flatbottoms, and each of them was a clue for a trader that the move in this di-rection most likely would continue.
Second, as you can see, the idea of never opening a position againstthe main move of the day has also been confirmed, because the bottompickers most likely were wiped out from the market by its powerful move.Because no major support or trendline was on the market’s way duringthis day, a trade against the main move of the day would never pay off. It isimportant to remember that under similar circumstances it is usually verydifficult (even close to impossible) to choose the right moment when themarket may turn to the opposite direction. If you missed all the previoustrading signals and opportunities, it would be better to stay away from themarket, waiting for another trading day, than to take chances on picking abottom without having a trading signal in favor of such an attempt.
Third, it is not really important where a position was entered andprofit was actually taken. In any case, if during that day the trading strat-egy has been chosen in accordance with one or another template, theprofit was unavoidable and would have ranged from 70 to 80 pips and up
208 TEMPLATES FOR SHORT-TERM AND INTRADAY TRADING
FIGURE 21.1
ccc_beat_207-210_ch21.qxd 6/8/06 2:46 PM Page 208

to a couple of hundred pips. However, the real importance of the exampleis the fact that this particular trading day can be considered as typical forthe market. Its behavioral pattern was a common one and seen frequently(with some unimportant variations, of course). Using the templates pro-vides a perfect opportunity to trade with no stress, and without the neces-sity of predicting the future or making forecasts in advance. A simplereaction in accordance with trading signals and basic techniques de-scribed in trading templates would do the job perfectly and would give atrader a great advantage against any other way of trading.
A Sample Trade 209
ccc_beat_207-210_ch21.qxd 6/8/06 2:46 PM Page 209

ccc_beat_207-210_ch21.qxd 6/8/06 2:46 PM Page 210
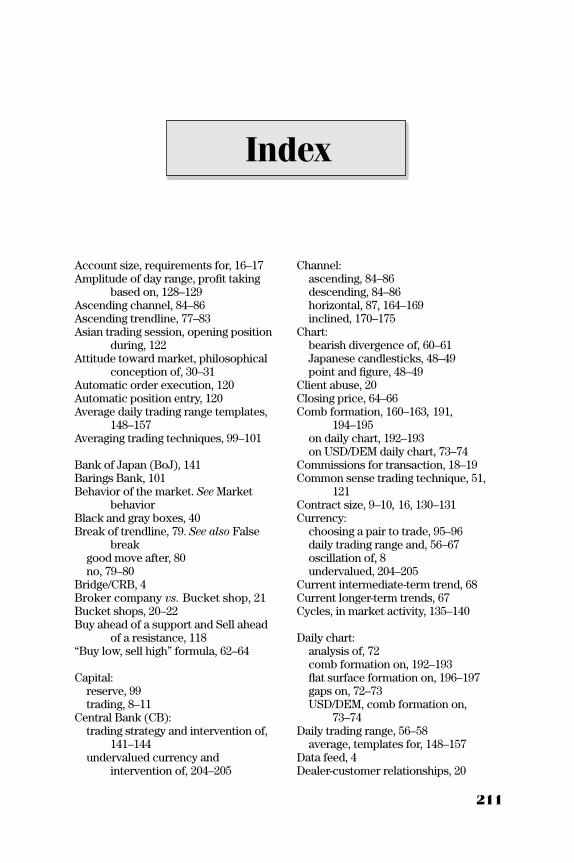
211
Index
Account size, requirements for, 16–17Amplitude of day range, profit taking
based on, 128–129Ascending channel, 84–86Ascending trendline, 77–83Asian trading session, opening position
during, 122Attitude toward market, philosophical
conception of, 30–31Automatic order execution, 120Automatic position entry, 120Average daily trading range templates,
148–157Averaging trading techniques, 99–101
Bank of Japan (BoJ), 141Barings Bank, 101Behavior of the market. See Market
behaviorBlack and gray boxes, 40Break of trendline, 79. See also False
breakgood move after, 80no, 79–80
Bridge/CRB, 4Broker company vs. Bucket shop, 21Bucket shops, 20–22Buy ahead of a support and Sell ahead
of a resistance, 118“Buy low, sell high” formula, 62–64
Capital:reserve, 99trading, 8–11
Central Bank (CB):trading strategy and intervention of,
141–144undervalued currency and
intervention of, 204–205
Channel:ascending, 84–86descending, 84–86horizontal, 87, 164–169inclined, 170–175
Chart:bearish divergence of, 60–61Japanese candlesticks, 48–49point and figure, 48–49
Client abuse, 20Closing price, 64–66Comb formation, 160–163, 191,
194–195on daily chart, 192–193on USD/DEM daily chart, 73–74
Commissions for transaction, 18–19Common sense trading technique, 51,
121Contract size, 9–10, 16, 130–131Currency:
choosing a pair to trade, 95–96daily trading range and, 56–67oscillation of, 8undervalued, 204–205
Current intermediate-term trend, 68Current longer-term trends, 67Cycles, in market activity, 135–140
Daily chart:analysis of, 72comb formation on, 192–193flat surface formation on, 196–197gaps on, 72–73USD/DEM, comb formation on,
73–74Daily trading range, 56–58
average, templates for, 148–157Data feed, 4Dealer-customer relationships, 20
ccc_beat_211-216_ind.qxd 6/8/06 2:50 PM Page 211
Dealers choice:bucket shops and, 20–22commission payment in, 18–19contract size in, 16margin value and leverage in,
15–16on-line trading opportunity in, 18operation account size in, 16–17recent industry developments and,
22–23spread size in, 17stop and limit orders terms in, 17
Decisions, impulsive, traders and, 29Descending channel, 84–86Descending trendline, 77–83Diamond formation, 180–181
potential, 182–183Discrete-systematic trading, 31Discretionary methods vs. mechanical
trading systems, 33–36Double bottom formation, 42Double top (bottom) formation, 89Double top formation, 42Double (triple) top (bottom) formation,
188–189Dow retracement theory, 47Dummy trading, 4–5, 62
Elliott Wave Theory, 46–47End-of-the day analysis, 66–74End-of-the-week analysis, 66–74Entry stop order, 78, 120, 134European trading session, opening
position during, 122EUR/USD chart:
downtrend on, 6570-pip ranges on, 56
False break:of trendline, 78, 80–83of triangle formation, 91–92
Fibonacci lines, drawing, 69, 71Flag formation, 93Flat surface formation, 196, 198–199FOREX market. See also FOREX
tradingdealer-customer relationships, 20formations in, 72specifications of, 7trends of, 63–64volatility of, 62–63
FOREX trading:recent industry developments of,
22–23speculative trade on, 54
Formations. See Technical formation(s)Fundamental analysis, advantages and
disadvantages of, 38–40
Gaps on daily charts, 72–73Getting started:
dummy trading, 4–5information, data feed, and technical
support, 4overview of, 3–4
Good move after trendline break, 90Gunn analytical method, 46
Head and shoulders (H&S) formation,42, 87–89
inverted, 69, 88, 186potential, 184–185
Hit-and-run technique, 117, 126Horizontal channel, 87, 164–169Horizontal supports and resistances, 68H&S. See Head and shoulders (H&S)
formation
Igrok method:basic trading strategies and
techniques, 77–93choosing currency pair to trade, 95–96entering the market, 117–123evaluating probabilities using
technical analysis, 59–75exiting the market, 125–131importance of timing, 133–140intraday trading plan principles,
113–115market behavior and trader discipline,
103–109money management rules and
techniques, 97–102philosophy of, 53–58trading strategy during Central Bank
intervention, 141–144Impulsive decisions, traders and, 29Inclined channel, 170–175Indicators, 43–46, 69Informative services, 4Intermediate-to-long-term trend, 67–69Internet trading, 18
212 INDEX
ccc_beat_211-216_ind.qxd 6/8/06 2:50 PM Page 212
Intraday chart, 73, 87comb formation on, 194–195flat surface formation on, 198–199
Intraday trade/trading:advantages of, 112money management and, 98planning for, 113–114rules and techniques of stops placing,
114–115template, 145–146timing and, 135trading activity of, 117
Inverted head and shoulders formation,69, 88–89, 186–187
Japanese candlesticks charts, 48–49
Legal issues, 20LIBOR rates, 18Limit orders, terms of, 17Line-on-close chart (line chart), 69Liquidation:
position, 125, 129–132of profitable position, 122of unprofitable position, 98
Longer-term market analysis, 67Long position, 55–56, 84, 118Long-term analysis, 4Long Term Capital Management, 101Loss:
averaging and, 99–101in broken trendline, 80–81central bank intervention and, 141correcting, 98in false break trendline, 81–82in no break trendline, 79potential, calculating, 120recovery from, 30in triangle and triangle like
formations, 91–92
MACD, 69Margin, 13, 15–16Market. See also Market behavior;
Market movementapproaching major trendline, 200–201breaking trendline, 202, 204characteristics of, 133–135choosing entry point to, 117–118constant motion of, 55–56cycles, 135–140
drifting in one direction only, 150–153drifting up and down on both sides,
148–149emergence of, 78entry timing rules, 118–123in false break trendline, 78, 80–83forming daily trading range, 56–58forming 80–100 pips day range,
154–155forming specific formation on daily
chart, 192–193making intraday high or low, 156–157paradoxes of predicting, 38–40profit-taking and speeding of, 126–127trader unprofitable position and,
98–99Market behavior:
discipline of trading and, 109model of the market, 104–105predictability of the market, 105–106recommendation to beginning trader,
109speculative trader and, 104traders attitude and, 107–109
Market movement:directions of, 53–54new open position and, 119–120opening position against, 115, 121, 122placing stop-loss order, 142traders and, 30
Mechanical trading systems,discretionary methods vs., 33–36
Methods of definition, false breaks and,82
Model of the market, 104–105Money management:
averaging and, 99–101capital reserve and, 99in false breaks, 82overview of, 97–98restricting loss and, 98–99risk/reward ratio and, 101–102tactics and strategy in, 98
Money market, 53, 54Murphy, John, 40
Neckline, 42New York trading session, opening
position after, 122–123No break of trendline, 79–80
Index 213
ccc_beat_211-216_ind.qxd 6/8/06 2:50 PM Page 213
OHLC chart. See Open-high-low-closebar (OHLC) chart
Omega SuperCharts (end-of-day)software, 67–69
Online trading, 5, 18Open-high-low-close bar (OHLC) chart,
69Opening price:
market drifting in one direction onlyand, 150–153
market drifting up and down from,148–149
Open position:during Asian trading session, 122at the break of neckline, 97choosing an entry point and, 117–118against current market movement,
115, 121against major market move, 122–123in market movement direction, 120position liquidation and, 129–132profit-taking and, 125–126risk/reward ratio and, 101–102rules for, 117
Orders, stop and limit, 17Overtrade risk, 11
Patterns, 42–43Point and figure chart, 48–49“Postponed stops,” 115Potential diamond formation, 182–183Potential head and shoulders formation,
184–185Potential triangle formation, 178–179Precise borders formations, 93Price:
closing, 64–66opening, 64–66
Price level, opening positions and, 119
Probability evaluation technique, 59–61
Profit, 55in broken trendline, 80–81central bank intervention and fixing
of, 144exiting the market and, 125–132in no break trendline, 79recommendation concerning, 109in triangle and triangle like
formations, 91–92
Profit/loss ratio, 101–102Protective stop, placing, 120Psychological challenges of speculative
trading, 27–32
Quantum Fund, 101
Random position, 55Recovery from losses, traders and,
30Rectangle formation, 93Reserve, capital, 99Resistance, 118
horizontal, 68Retractment Theories, 3Reverse position, 129–132Risk/reward ratio (RRR), 84, 101–102Risks:
determining limits, 11–13overtrade, 11undercapitalization, 8–11
Rounded top (bottom) formation, 93
RRR. See Risk/reward ratio (RRR)RSI, 69
Safe short trade, 122“Sell on weakness, buy on strength”
formula, 62–64Sell position, 78Short position, 55–56, 84, 118Short-term trading, 111
template, 145–146Shoulders formation. See Head and
Shoulder (H&S) formationSide trend market movement, 53–54Software, 67–69Speculative trade/trader:
choice of currency for, 95–96on FOREX, 54market and, 104–106money management and, 97psychological challenges of, 27–32strategy and tactics of, 57
Spread size, in dealer selection, 17Statistical analysis, 62–64Statistics, trading systems and, 36Stochastics, 69Stop and reverse position, 84Stop-loss order, 143Stop order, terms of, 17
214 INDEX
ccc_beat_211-216_ind.qxd 6/8/06 2:50 PM Page 214
Stops:broken trendline and, 80, 81channels and, 84entry, 78in inverted head and shoulders, 89market technical levels and, 99placing, rules and techniques of,
114–115postponed, 115
Storage fees, 18Strategy and tactics:
of money management, 98of speculative trade, 57trading, 31, 51, 121of trading in intervention of central
bank, 141–144Stress factor, traders and, 27–28, 31,
34Substitution, 96SuperCharts (Omega Research), 4Support, 118
horizontal, 68Support and resistance templates.
See TrendlineSupport and Resistance Theory, 3,
47
Technical analysis, 3advantages and disadvantages of,
40–42evaluating probabilities using,
59–75philosophy of, 53theories of, 46–47
Technical formation(s), 68. See also
Channeldiamond formation, 180–181
potential, 182–183double bottom formation, 42double top (bottom) formation, 89double top formation, 42double (triple) top (bottom)
formation, 188–189flag formation, 93head and shoulders formation, 42,
87–89, 186inverted, 69, 88–89, 186potential, 184–185
potential diamond formation, 182–183potential triangle formation,
178–179
rectangles formation, 93rounded top (bottom) and
V-formation, 93templates, 159–189triangles and triangle-like formation,
41–42, 89–93, 176–177potential, 178–179
Technical support, 4Templates, 145–146
average daily trading range, 148–157
sample trade, 146short-term trading, 145–146technical formation, 159–189trendlines, support, and resistance,
191–205Tiger Fund, 101Timing:
importance of, 133–135market cycles and, 135–140profit-taking and, 128rules for market entry, 118–123
Trader(s). See also Speculative trader;Trading
beginning, recommendation to, 109
broken trendline and, 80–81choosing right dealer, 13–23discretionary vs. mechanical trading
systems, 33–36establishing an account, 7–13false break trendline and, 80–83getting started, 3–5groups of, 37impulsive decisions of, 29intraday trading plan, 113–115market recommendations for, 108market relationship and, 29mistakes of, 106money management and, 98–102in no break of trendline position,
80profit recommendations for,
109psychological challenges of
speculative trading, 27–32reaction of, 54recovery from losses, 30
Trade sample, 207–209Trade templates, guide to, 146Trade theory, preparation on, 3
Index 215
ccc_beat_211-216_ind.qxd 6/8/06 2:50 PM Page 215
Trading. See also Intraday trading;Online trading; Short-termtrading; Trading account; Trading method, developing
averaging trading techniques in,99–101
based on ascending and descendingtrendlines, 77–83
based on channels, 84, 87based on other technical formations,
87–91, 93capital, insufficient, 8–11cycle, 84discipline of, 109discrete-systematic, 31dummy, 4–5, 62importance of timing in, 133–140Internet, 18strategy of, 31, 141–144
Trading account:about, 7–8determining risk limit, 11–13overtrade risk, 11size of, 16–17terms of opening, 22undercapitalization risk, 8–11
Trading method, developing. See also
Fundamental analysis; Technical analysis
discretionary vs. mechanical tradingsystems, 33–36
psychological challenges ofspeculative trading, 27–32
Trading range, daily, 56–58Transaction execution, opening new
position and, 118–119
Trendline. See also Break of trendlineascending, 77–83descending, 77–83drawing, 68–69major, market approaches, 200–201market breaking, 200, 202no break, 79–81support, and resistance templates,
191–205Triangles and triangle-like formations,
41–42, 89–93, 176–177potential, 178–179
Uncertainty, traders and, 29Undercapitalization risk, in trading, 8–11Undervalued currency, 204–205Uptrend sample, 65USD/CHF daily chart, 60USD/DEM chart:
daily, comb formation on, 73–74medium-term local trends on, 74monthly, bullish triple divergence,
61USD/JPY daily chart, double bottom
formation on, 42USDX, unfilled gap on daily chart, 72
V-formation, 93, 126Virtual dummy trading, 5
Weekly chart:analysis, 67–72cable on, 43
Wishful thinking:avoiding, 107traders and, 28–29
216 INDEX
ccc_beat_211-216_ind.qxd 6/8/06 2:50 PM Page 216