sec31 online complete - UH
23
MATH 1342 Section 3.1
Transcript of sec31 online complete - UH

MATH 1342Section 3.1
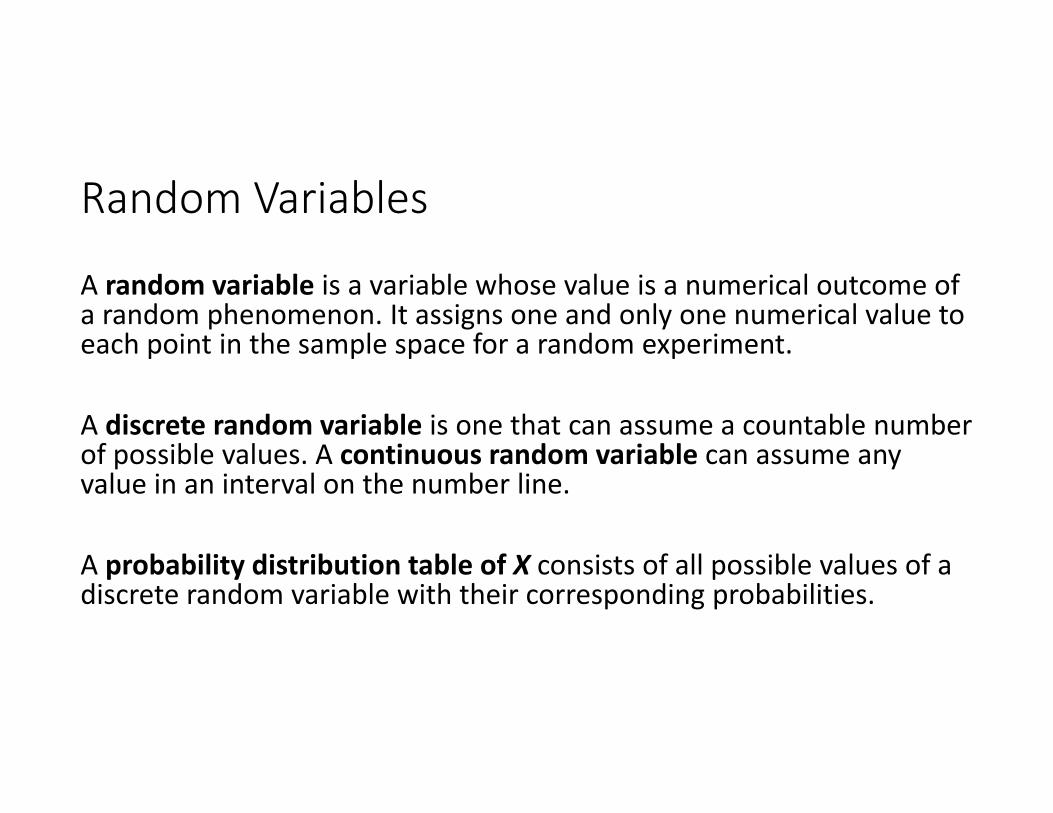
Random Variables
A random variable is a variable whose value is a numerical outcome of a random phenomenon. It assigns one and only one numerical value to each point in the sample space for a random experiment.
A discrete random variable is one that can assume a countable number of possible values. A continuous random variable can assume any value in an interval on the number line.
A probability distribution table of X consists of all possible values of a discrete random variable with their corresponding probabilities.

Example:
Suppose a family has 3 children. Show all possible gender combinations:

Example:
Suppose a family has 3 children. Show all possible gender combinations: Keep in mind, there will be (2)(2)(2)=8 combinations.
BBB BGB GBB GGBBBG BGG GBG GGG
Example:
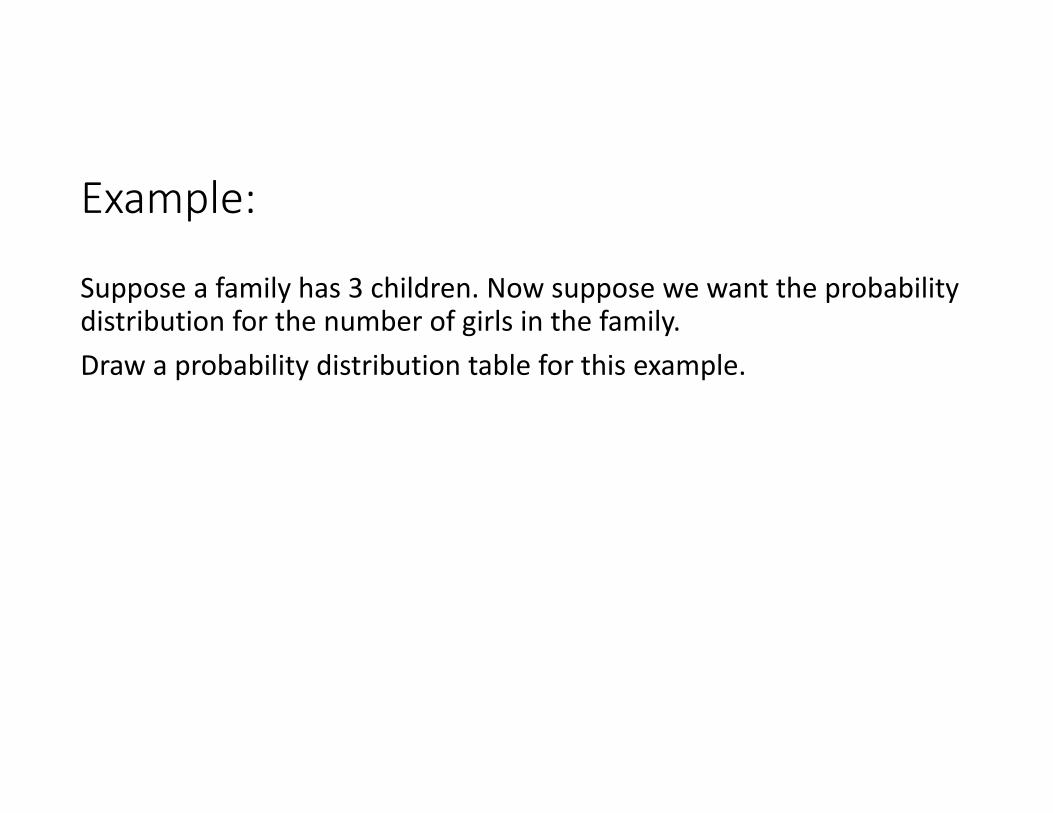
Suppose a family has 3 children. Now suppose we want the probability distribution for the number of girls in the family.Draw a probability distribution table for this example.

Example:
Suppose a family has 3 children. Now suppose we want the probability distribution for the number of girls in the family.Draw a probability distribution table for this example.
We need to know the total possible outcomes.We need to categorize them by number of girls.We need a probability of each outcome.

Example:
Suppose a family has 3 children. Now suppose we want the probability distribution for the number of girls in the family.Draw a probability distribution table for this example.
0 girls:
1 girl:
2 girls:
3 girls:
The sum of the p‐values must equal 1(1/8) + (3/8) + (3/8) + (1/8) = 8/8 = 1

Example:
Find the following probabilities:
0 girls:
1 girl:
2 girls:
3 girls:

Example: Popper # 04
a. 0.10b. 0.15c. 0.30d. 0.05
a. 0.10b. 0.15c. 0.20d. 0.05
a. 0.50b. 0.15c. 0.20d. 0.25
a. 0.50b. 0.75c. 0.80d. 0.70
1. 2. 3. 4.
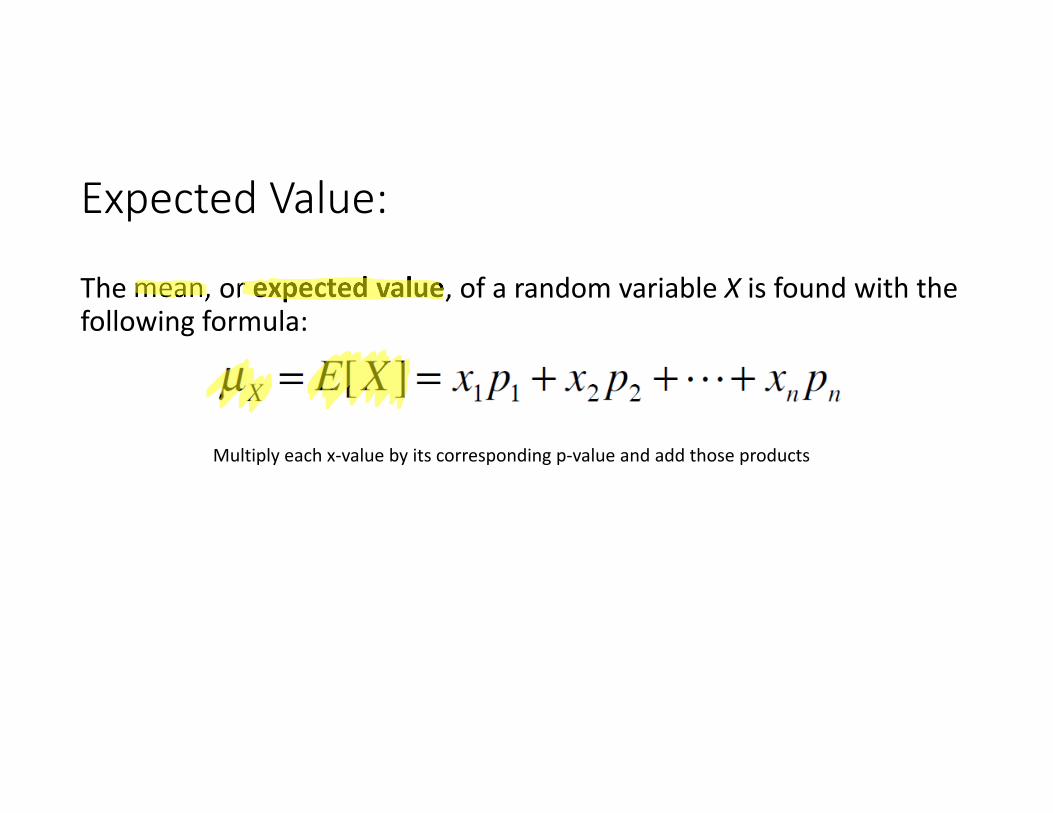
Expected Value:
The mean, or expected value, of a random variable X is found with the following formula:
Multiply each x‐value by its corresponding p‐value and add those products

What is the expected number of girls in the family above?

What is the expected number of girls in the family above?
In R Studio: assign(“x”,c(values))assign(“p”,c(probabilities))sum(x*p)
TI: x L1, p L2, 2nd List (STAT), MATH (right arrow), sum (option 5)sum(L1*L2)


Variance and Standard Deviation
Or (the alternate formula)
Repeat the Expectancy Formula using x2 instead of x.

Variance and Standard Deviation
In R Studio: sum((x‐mean)^2*p)orsum(x^2*p)‐sum(x*p)^2
In TI: sum(L1^2*L2)‐sum(L1*L2)^2
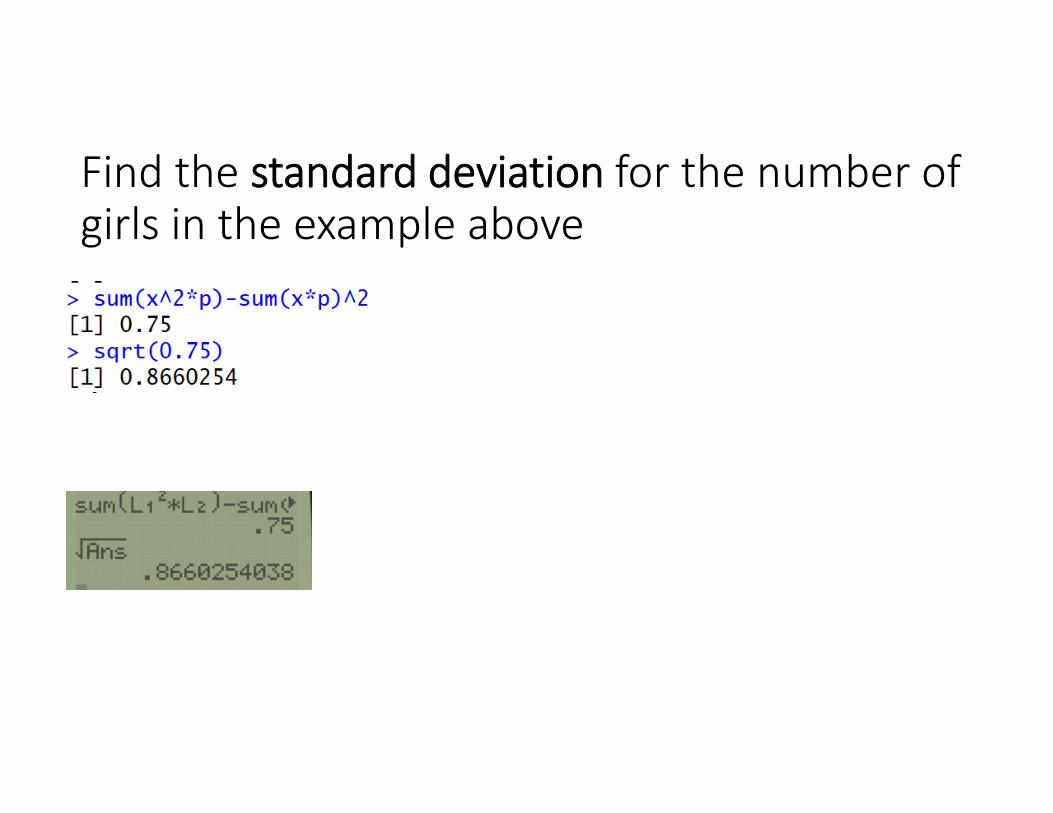
Find the standard deviation for the number of girls in the example above

Popper 04 continued:
What is the expected value?
The variance (2) and standard deviation (3)?
a. 3.50b. 4.20c. 0.35d. 5.00
a. 3.66b. 13.39c. 1.91d. 1.55
6, 7.
5.
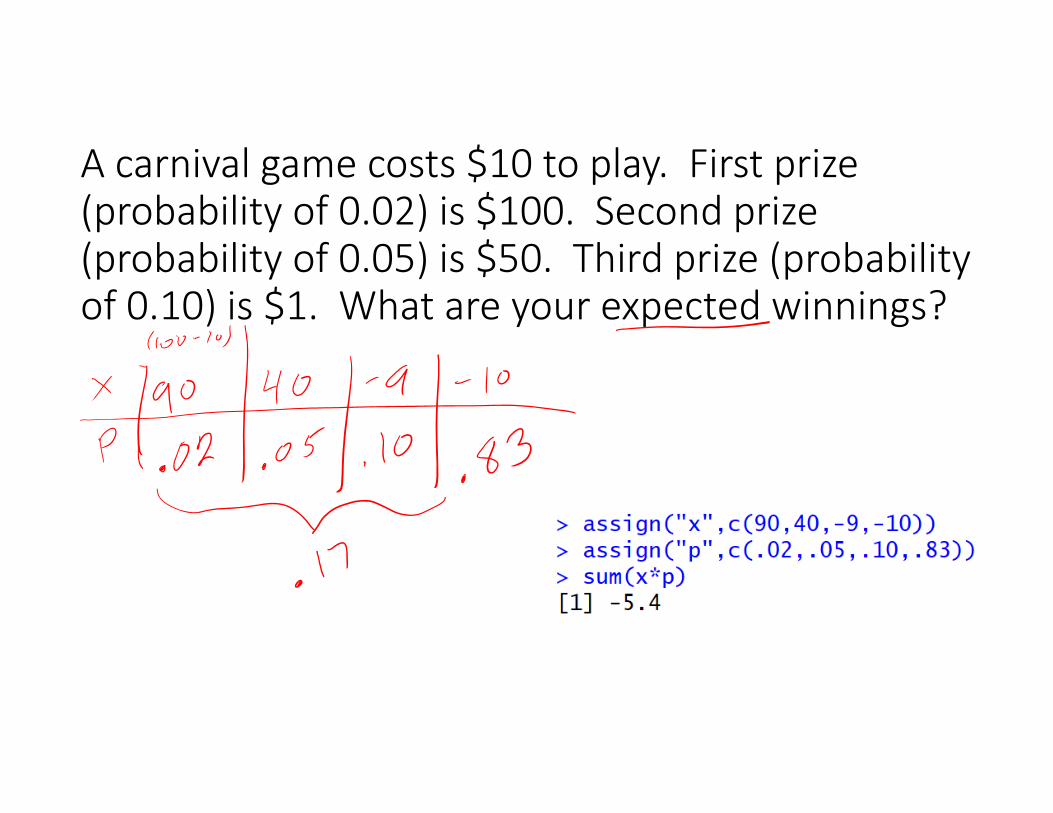
A carnival game costs $10 to play. First prize (probability of 0.02) is $100. Second prize (probability of 0.05) is $50. Third prize (probability of 0.10) is $1. What are your expected winnings?

Rules for means and variances:
Suppose X is a random variable and we define W as a new random variable such that W = aX + b, where a and b are real numbers. We can find the mean and variance of W with the following formula:

Rules for means and variances:
Likewise, we have a formula for random variables that are combinations of two or more other independent random variables. Let X and Y be independent random variables,
Always add the variances when you are adding or subtracting random variables

Suppose you have a distribution, X, with mean = 22 and standard deviation = 3. Define a new random variable Y = 3X + 1.
Popper 04, continued:
8, 9,10,11.
Choices for above questions:a. 3 b. 67 c. 63 d. 9 e. 81

Use the following Probability Distribution Table to find the values of A, B and C.Additional Information: P(X < 4) = 0.55; E[X] = 2.7