Sebastian Schich is Principal Administrator in the ... · Sebastian Schich is Principal...
32
1 * Aviram Levy is Head of the Financial Analysis Division in the Economic Research Area of Banca d’Italia; Sebastian Schich is Principal Administrator in the Financial Affairs Division of the OECD’s Directorate for Financial and Enterprise Affairs. The authors gratefully acknowledge the excellent statistical assistance provided by Andrea Cardillo (Banca d’Italia) and Pierre Ruether (PhD student and part -time trainee at the OECD) and editorial assistance provided by Laura McMahon (OECD). This article was written following a recommendation by the Committee on Financial Markets (CMF) to further develop work on government- provided bond guarantee arrangements in the context of its Strategic Response to the Financial Crisis. An earlier version was discussed at the April 2010 CMF meeting, and the present article takes into account these discussions as well as any written comments received subsequently. All remaining errors are those of the authors. This work is published on the responsibility of the Secretary-General of the OECD. The opinions expressed and arguments employed herein are those of the authors and do not necessarily reflect the official views of the Organisation or of the governments of its member countries.
Transcript of Sebastian Schich is Principal Administrator in the ... · Sebastian Schich is Principal...

1
* Aviram Levy is Head of the Financial Analysis Division in the Economic Research Area of Banca d’Italia;
Sebastian Schich is Principal Administrator in the Financial Affairs Division of the OECD’s Directorate for
Financial and Enterprise Affairs. The authors gratefully acknowledge the excellent statistical assistance
provided by Andrea Cardillo (Banca d’Italia) and Pierre Ruether (PhD student and part-time trainee at the
OECD) and editorial assistance provided by Laura McMahon (OECD). This article was written following a
recommendation by the Committee on Financial Markets (CMF) to further develop work on government-
provided bond guarantee arrangements in the context of its Strategic Response to the Financial Crisis. An
earlier version was discussed at the April 2010 CMF meeting, and the present article takes into account these
discussions as well as any written comments received subsequently. All remaining errors are those of the
authors. This work is published on the responsibility of the Secretary-General of the OECD. The opinions
expressed and arguments employed herein are those of the authors and do not necessarily reflect the official
views of the Organisation or of the governments of its member countries.

2 OECD JOURNAL: FINANCIAL MARKET TRENDS – VOLUME 2010 ISSUE 1 © OECD 2010
EXECUTIVE SUMMARY
Over the past few months, authorities have taken their first steps to end some of the public support
measures put in place in response to the financial crisis; thus, the exit that the OECD’s Committee on
Financial Markets discussed at its last few meetings has actually begun. The present article focuses on
government guarantees for bond issues. Financial institutions have made extensive use of such bond
issuance: in the period October 2008 to May 2010 close to 1400 guaranteed bonds have been issued by
approximately 200 banks from 17 countries, for an amount equivalent to more than €1 trillion. In part
reflecting the nature of the strains that the banking sector was exposed to and the specific structure of the
banking system, the design of the guarantee schemes differed across jurisdictions.
The guarantee schemes which were put in place, together with other measures, have been effective
in resuming overall long term funding for banks and reducing their default risk. This type of public
sector support for the banking system has, nonetheless, raised a number of concerns.
First, the cost of issuing guaranteed bonds has mainly reflected the characteristics of the sovereign
guarantor rather than those of the issuer: this situation has created distortions by favouring “weak”
borrowers with a “strong” sovereign backing, which have been able to borrow more cheaply, even after
accounting for the guarantee fee, than some “strong” banks with a “weak” sovereign guarantor. This
phenomenon, which could have been prevented by choosing an appropriate fee determination
mechanism, has become more acute with the increased differentiation of sovereign risk observed across
advanced economies since early 2010. It tends to distort competition and create incentives for excessive
risk taking.
Secondly, the phasing out of guarantees has to be managed carefully and a balance has to be struck
between two conflicting needs. While the possibility of renewed market tensions makes it important to
dispose of a safety net, it is crucial to prevent further distortion to competition by providing the incentive
to sound banks to exit from government-supported refunding and to weaker banks to address their
weaknesses. The evidence identified here is not inconsistent with the suggestion that the continued
availability into 2010 of guarantee schemes, even when the overall usage of guarantees is declining, may
alleviate the pressure on some weak financial institutions to address their weaknesses. This suggestion is
supported by the fact that, in some large advanced economies, the actual usage of guarantees was
concentrated in a few recipient banks. In addition, the average credit rating of the banks that issued
guaranteed bonds in the second half of 2009 and in the first half of 2010, when market conditions were
much more favourable, is much lower than the average rating of banks that issued in the “turbulent”
period (October 2008 to April 2009). Partly reflecting these concerns, the EU decided in May 2010 that,
starting from July 2010, in countries that continue to make guarantees available those banks which
continue to heavily rely on guarantees will have to undergo a review of their long-term viability.

OECD JOURNAL: FINANCIAL MARKET TRENDS – VOLUME 2010 ISSUE 1 © OECD 2010 3
I. Introduction
In response to the sharp deterioration of financial market conditions that
followed the demise of Lehman Brothers, in October 2008 the authorities of
advanced economies adopted a number of measures to support the banking
system. These measures fall into three broad categories: capital injections to
strengthen banks’ capital base; asset guarantees and purchases to reduce
banks’ exposure to capital losses; and liability guarantees, both on customer
deposits and bond financing, to help banks retain access to retail and wholesale
funding. Overall, the rescue measures have contributed to avoiding a “worst
case scenario” by reducing the default risk of major banks. In particular, the
issuance of guaranteed bonds has been sizeable across regions and has
provided banks with a precious source of funding.
Government-
guaranteed bonds
form a new and
significant segment
of the financial
landscape
Some bank bond government-guarantee schemes expired at the end of
2009, while others will expire by December 2010. Thus, taking stock of the
experiences with, and lessons learned from, these programmes is a timely
exercise. Although the pace of guaranteed issuance has declined, significant
amounts of government-guaranteed bank bonds1 remain outstanding, and these
securities represent a new and significant segment of the market for high-
quality fixed-income securities. Their presence in the market has implications
for pricing and other aspects of the broader structure of financial markets. In
the absence of further difficulties, which may call for an extension beyond
2010, the segment will gradually shrink. At the current juncture (i.e. as of June
2010), the last issue is currently expected to be redeemed by December 2015.
In the near term, however, with overall reliance on support measures declining,
the question remains whether the continued availability of guarantees for bond
issuance may shield weak banks from the market discipline that would
normally prevail.
Guarantees for
unsecured bank
bond issues are the
most tangible form
in which the
government acts as
guarantor of last
resort
All told, public authorities essentially have adopted the role of guarantor
of last resort during the recent financial crisis,2 expanding existing guarantees
and introducing new ones. These included guarantees for bank liabilities and
assets, as well as the assurance on the part of monetary authorities that
liquidity would be made available for banks in sufficient amounts “as long as
needed”. Among these various forms of guarantees provided by public
authorities as part of their insurance-of-last-resort function, the government-
provided guarantees for unsecured bank bond issues are the most tangible form
in which this function was provided.
The purpose of these initiatives was to prevent viable banks from failing
during the systemic crisis by allowing them to continue to refinance
themselves over longer maturities until private markets become receptive to
non-guaranteed debt issues again. In other words, the purpose was to “gain
time”, while trying to minimise the distortions to competition and incentives
created by the government-provided guarantees.
The specific structures of the programmes through which governments
have provided bank bond guarantees have differed across countries, however,

4 OECD JOURNAL: FINANCIAL MARKET TRENDS – VOLUME 2010 ISSUE 1 © OECD 2010
and the present paper asks what lessons can be learned regarding the
appropriate design of such programs, including, in particular, the issue of how
best to structure guarantee fees in the least distortionary way. The present
paper examines the context in which the guarantees were provided and the
evolution of issuance over time, and then addresses two specific questions:
• How to design pricing structures to minimise cross-border
competitive distortions introduced by differences in the quality of the
sovereign guarantor;
• How to achieve exit and avoid subsidising banks (including non-
viable ones) for too long.
II. Government-supported guarantees as part of bank-support packages
Bank funding
strains have been a
worrisome feature
of the recent
financial crisis
Bank funding strains have been one of the key features of the recent
financial crisis, and the introduction of guarantee schemes for unsecured bank
bonds has addressed this issue in a direct way. In particular, to alleviate bank
funding difficulties that opened up as counterparty risk rose to unprecedented
levels and confidence in banks (including on the part of their peers) collapsed,
many governments offered banks the option to issue unsecured bonds with a
government guarantee against the payment of a fee by the issuer.
These facilities were, however, part of wider sets of support measures
made available to banks, which included the following ones affecting either
side of their balance sheets:
Guaranteeing large
parts of bank
liabilities has been a
key part of the
policy response
As far as governments are concerned, there was a massive expansion
of existing guarantees and widespread introduction of new ones. The
latter included guarantees for specific types of investments, such as
money market mutual funds, and a variety of assets for which
guarantees are not typically available, at least not in normal times,
affecting banks in a more indirect way. As regards bank balance
sheets, as highlighted by Table 1, a large number of countries have
either expanded existing or introduced new guarantees in relation to
one of three parts of bank balance sheets: retail funding, wholesale
funding and assets. Moreover, in many cases such guarantees have
played a quantitatively important role (notwithstanding the
conceptual difficulties involved in comparing guarantees with other
support measures that involve upfront payments). For example,
Figure 1 shows guarantees as a percentage of the total headline
support provided in selected G-20 countries (not including, however,
deposit insurance provided by deposit insurance agencies).
Recapitalisation
schemes have been
introduced, but not
used widely
Recapitalisation schemes were adopted in several countries, even if
not all of them have been in use. Most of the actual capital injections
took the form of non-dilutive actions, such as the purchase of new
preferred shares. Treasuries bought the shares at deliberately low
prices, while also applying additional conditions to those purchases,
such as restrictions on executive compensation and dividend
payments (so-called “behavioural constraints”).

OECD JOURNAL: FINANCIAL MARKET TRENDS – VOLUME 2010 ISSUE 1 © OECD 2010 5
Table 1. Government-provided guarantees targeting directly bank assets or liabilities
Country Asset Deposit Bond Country Asset Deposit Bond
Australia Korea
Austria Luxembourg
Belgium Mexico
Canada Netherlands
Chile New Zealand
Czech Republic Norway
Denmark Poland
Finland Portugal
France Russia
Germany Singapore
Greece Slovak Republic
Hong Kong, China Spain
Hungary Sweden
Iceland Switzerland
Ireland Turkey
Italy United Kingdom
Japan United States
Key:
Asset = “” Bank asset guarantee (or guarantee-like measures such as asset purchase with insurance
elements) made available.
Deposit = “” denotes deposit insurance coverage level expanded or explicit deposit insurance
introduced.
Bond = “” denotes bond guarantee scheme introduced and used.
Bond = “” denotes bond guarantee scheme introduced but not used.
Notes: In Spain, a programme was introduced in mid-2009 that foresees the acquisition of financial assets and/or guarantee assistance in order to support banks in a restructuring process (i.e. merger). The programme is open to all credit institutions resident in Spain. In Switzerland, the purchase of illiquid assets from UBS by the Swiss National Bank through a special purpose vehicle involved several contingencies and assigned the first loss to that bank; thus, it is considered here as a guarantee-like policy measure. In Austria, the Financial Market Stability Act allows the provision of state guarantees for bank assets, although that option has not been used.
Source: Estimates by OECD Secretariat and Banca d’Italia.

6 OECD JOURNAL: FINANCIAL MARKET TRENDS – VOLUME 2010 ISSUE 1 © OECD 2010
Figure 1. Composition of financial support measures
Amounts used, in % of 2008 GDP
34.6
33.9
26.4
10.9 97
6.96
4.63.9
2.42.4
2.2
1.2
0
00
0
0
0
5
10
15
20
25
30
35
40
45
Recapitalisation
Asset swaps or purchases
Guarantees (numbers indicate per cent of 2008 GDP)
198.1
Notes: Announced amounts in the cases of Denmark and Ireland. For Switzerland, amounts actually transferred in the case of asset swaps or purchases. In Italy, recapitalisation amounts to 0.1% and guarantees used to 0% of 2008 GDP.
Source: OECD Secretariat and Banca d'Italia estimates based on IMF (2010a).
The “division of
labour” between
treasuries and
central banks has
been effective
After the demise of Lehman Brothers and the severe tensions that
paralysed financial markets in the fall of 2008, public intervention in support
of the financial system was characterised by a “division of labour” between
policy makers.
On the one hand, central banks have expanded liquidity provision to the
banking system by widening the range of counterparties, eligible collateral and
average maturity of refinancing. Some central banks enacted so-called
“quantitative easing” by purchasing large amounts of government bonds. On
top of this, central banks have provided support to specific market segments
deemed to have systemic importance by means of outright purchases of
securities: commercial paper, asset-backed commercial paper, government
sponsored enterprises (GSEs) residential mortgage-based securities and GSE
bonds in the United States; and covered bonds in the euro area. These forms of
liquidity provision and market support have translated into a significant
expansion of central bank balance sheets, as illustrated in Figure 2, which
shows monetary base increases for selected central banks in Committee on
Financial Markets (CMF) member jurisdictions.
OECD JOURNAL: FINANCIAL MARKET TRENDS – VOLUME 2010 ISSUE 1 © OECD 2010 7
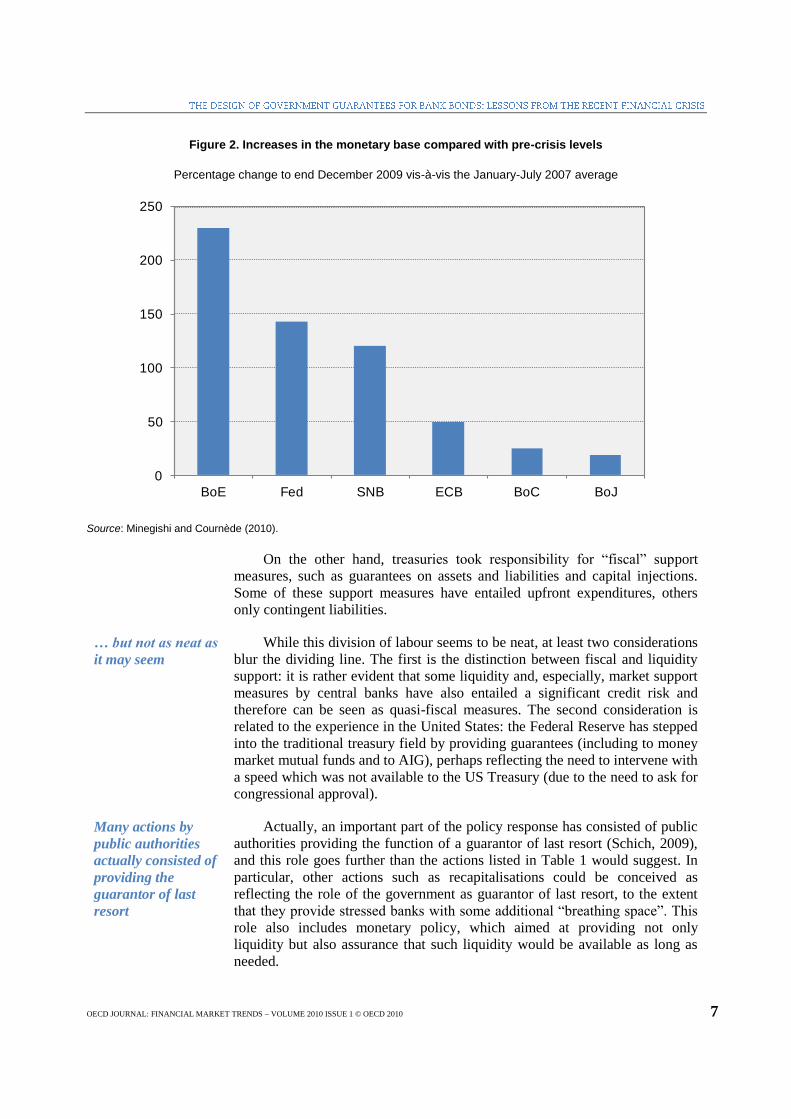
Figure 2. Increases in the monetary base compared with pre-crisis levels
Percentage change to end December 2009 vis-à-vis the January-July 2007 average
0
50
100
150
200
250
BoE Fed SNB ECB BoC BoJ
Source: Minegishi and Cournède (2010).
On the other hand, treasuries took responsibility for “fiscal” support
measures, such as guarantees on assets and liabilities and capital injections.
Some of these support measures have entailed upfront expenditures, others
only contingent liabilities.
… but not as neat as
it may seem
While this division of labour seems to be neat, at least two considerations
blur the dividing line. The first is the distinction between fiscal and liquidity
support: it is rather evident that some liquidity and, especially, market support
measures by central banks have also entailed a significant credit risk and
therefore can be seen as quasi-fiscal measures. The second consideration is
related to the experience in the United States: the Federal Reserve has stepped
into the traditional treasury field by providing guarantees (including to money
market mutual funds and to AIG), perhaps reflecting the need to intervene with
a speed which was not available to the US Treasury (due to the need to ask for
congressional approval).
Many actions by
public authorities
actually consisted of
providing the
guarantor of last
resort
Actually, an important part of the policy response has consisted of public
authorities providing the function of a guarantor of last resort (Schich, 2009),
and this role goes further than the actions listed in Table 1 would suggest. In
particular, other actions such as recapitalisations could be conceived as
reflecting the role of the government as guarantor of last resort, to the extent
that they provide stressed banks with some additional “breathing space”. This
role also includes monetary policy, which aimed at providing not only
liquidity but also assurance that such liquidity would be available as long as
needed.

8 OECD JOURNAL: FINANCIAL MARKET TRENDS – VOLUME 2010 ISSUE 1 © OECD 2010
…and it is difficult
to isolate the effects
of any specific type
of measure
Under these circumstances, it is difficult to isolate and separately analyse
the effects of any specific type of policy measure implemented as part of the
government’s role as insurer of last resort. Thus, when assessing the
effectiveness of bank bond guarantee schemes, one needs to be aware that the
perspective adopted is only a very partial one.
III. Bond guarantee programs and developments in bank funding
Overview of selected features of the bond guarantee programmes, including fee
structures
What is remarkable is that despite broadly similar aims and significant
co-ordination efforts, the frameworks within which the guarantees have been
provided and the specific fees structures imposed for the guarantees have
differed across countries, and so have the amounts of funds pledged by each
country. A stylised overview of some key features regarding extent of
coverage (in most cases just newly issued senior unsecured bonds), fee
structures (in most cases risk-based fee structures), and the time window over
which guarantees are available (in most cases available until a specific
issuance date) is provided in Table 2, illustrating that there has been some
variation in the specific features of different schemes.
Fees charged for
government-
supported
guarantees for bank
bonds have been
apparently risk-
based
All governments (or government-supported entities) have charged a fee in
exchange for the guarantee provided. In most cases, fees levied have been risk-
based, with either historical credit default swaps or credit agency ratings being
used as references. That being said, despite broadly similar schemes, there
were some differences in details: these differences were most pronounced
across the Atlantic, but can be found also within the European Union (EU). In
part, they reflected the different environment faced by each country. For
example, while EU-agreed schemes used credit default swap (CDS) premiums
as a main reference (or, in the absence of a bank’s CDS, the CDS of a
“comparable” institution), CDS histories are not available for all EU banks.
Also, even where CDS histories have been available, slight differences existed
in the choice of the reference periods for calculating median spreads (e.g. the
UK scheme differed slightly in this respect from those used by euro area
members). In the United States, the fees were specified only as a function of
the term-to-maturity of the bond to be issued with a guarantee.
In practice, the
differences in fees
charged across
borders have not
been substantial
Data on actual fee charges are, as a general rule, not published. Private
sector estimates suggest that the ranges of fees charged in practice have
differed to some extent from one country to another. If one compares the
average fees, differences appear not to have been very large: with the
exception of France, where they were as low as 50 basis points, average fees
elsewhere were mostly close to 100 basis points, with the extremes being
Germany (91) on the low side and the United Kingdom (114) on the high side.
This outcome is noteworthy given that pricing schemes have differed, with
some of them being risk-based and others not; and even when risk-based,
different risk indicators have been used.

OECD JOURNAL: FINANCIAL MARKET TRENDS – VOLUME 2010 ISSUE 1 © OECD 2010 9
Table 2. Selected features of government-provided guarantee schemes (schemes proposed initially)
Country Coverage/ issuance
Fees Availability
A B C D E F G H I
Australia
Austria
Belgium(1)
Denmark
France
Germany
Greece
Ireland
Korea
Luxembourg(2)
(2) (2)
Netherlands
New Zealand
Portugal
Spain
Sweden
United Kingdom
United States
A All outstanding and new debt guaranteed.
B All new debt guaranteed unless bank has opted out of scheme.
C New debt guaranteed if explicitly requested.
D Issuance directly by bank or via special agency.
E Guarantee fees based on measure of credit risk (rating).
F Guarantee fees based on historical credit default swap prices.
G Initial scheme with specific end date of issuance window.
H Initial specific deadline extended (or eligible maturities increased).
I Conditions tightened after extension of deadline.
(1) Belgium has set up two guarantee schemes: a) an ad-hoc scheme for Dexia, coordinated with France and Luxemburg; and b) a general purpose scheme, to which no bank has applied as of writing, whose pricing is consistent with ECB guidelines. (2) Luxembourg adopted only an ad hoc scheme for Dexia.
Source: Estimates by OECD Secretariat and Banca d’Italia.
Indeed, fee structures were not perfectly harmonised across the
jurisdictions of CMF participants. They were not designed so as to rule out the
possibility that, across borders, different fees are charged for similar issuer
credit risks and/or similar fees are charged for different issuer credit risks. But,
one might ask, should they have been harmonised?
Actual yield spreads
at issue mainly
reflect investors’
perception of the
The total costs of a guaranteed bank bond for the issuer is represented by
the sum of the fees paid by the issuer to the government (or entity providing
the government-supported guarantee) in exchange for the guarantee and the
yield at issue of the guaranteed bond. Yield spreads at issue may reflect in

10 OECD JOURNAL: FINANCIAL MARKET TRENDS – VOLUME 2010 ISSUE 1 © OECD 2010
value of the
sovereign guarantee
principle three factors: the characteristics of the issuer, those of the bond and
those of sovereign guarantor. As discussed in Schich (2009) and Levy and
Zaghini (2010), in practice the actual spread paid at issuance has mainly
reflected the characteristics of the sovereign guarantor: more precisely, one
third of the spread paid by the hypothetical “weakest” issuer was accounted for
by the sovereign CDS premium and by the sovereign rating; if one also
includes among country characteristics the amount of budgetary resources
committed to rescue measures and timeliness of payments in case of default,
then country characteristics explain close to two thirds of the spread paid by
the weakest issuer.3 Thus, to avoid competitive distortions, one might argue,
the sovereign guarantor needs to take into account the quality of the guarantee
provided and charge commensurate fees (this discussion is taken up in
section III).
Market size and participants
The first government-guaranteed bank bond was issued in October 2008,
but total issuance was relatively subdued during that month and the subsequent
one, as only European banks were issuing (see Figure 3). Starting from
December 2008, when US and Australian financial institutions started to issue,
total issuance picked up briskly, with the US dollar becoming the main
currency of denomination for most of 2009. From May 2009 onwards, total
issuance appreciably diminished, although it picked up again towards the end
of the year largely reflecting exceptionally large issuance by one single issuer
(denominated in euros).4 In the first half of 2010, overall issuance remained
subdued but, reflecting the investors’ reassessment of sovereign risk, in some
countries (e.g. Greece and Ireland) banks stepped up guaranteed issuance in
order to reduce the cost of funding.
Figure 3. Monthly issuance of guaranteed bonds
0
20
40
60
80
100
120
140
160
Other
EUR
USD
Notes: In Euro equivalent billions.
Source: Estimates by OECD Secretariat and Banca d’Italia based on Bloomberg.
OECD JOURNAL: FINANCIAL MARKET TRENDS – VOLUME 2010 ISSUE 1 © OECD 2010 11
A few countries
account for most of
the guaranteed bond
issued volume
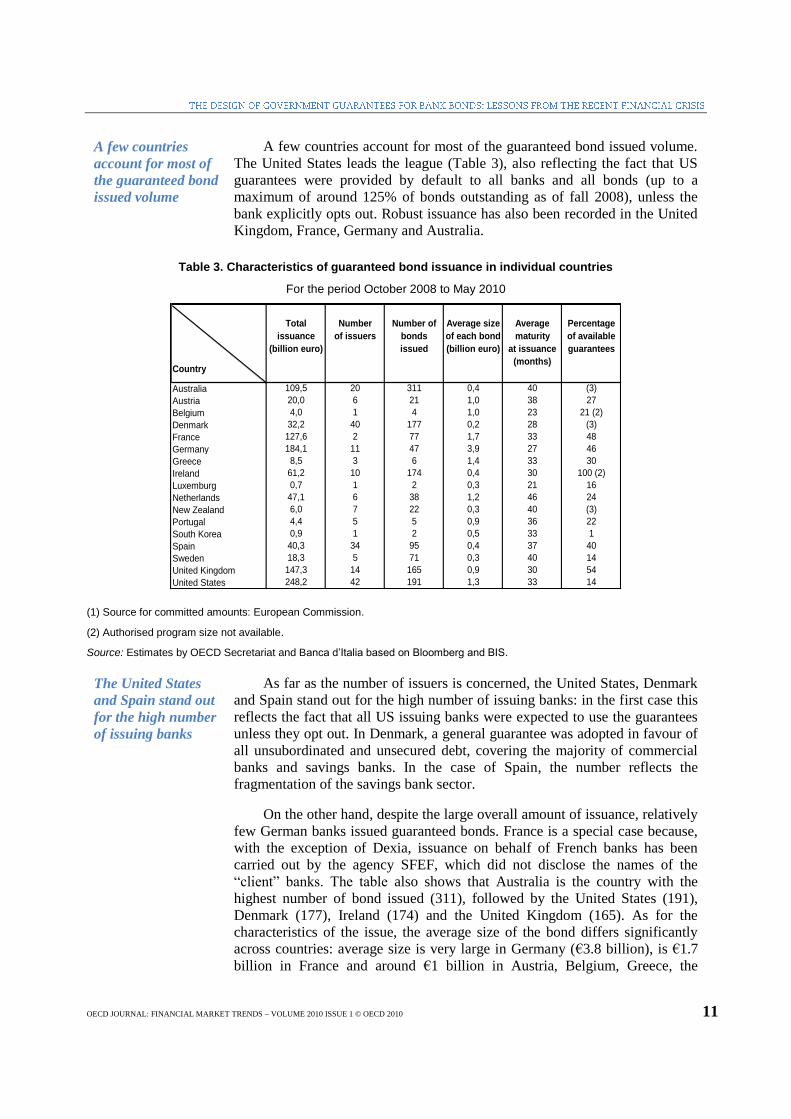
A few countries account for most of the guaranteed bond issued volume.
The United States leads the league (Table 3), also reflecting the fact that US
guarantees were provided by default to all banks and all bonds (up to a
maximum of around 125% of bonds outstanding as of fall 2008), unless the
bank explicitly opts out. Robust issuance has also been recorded in the United
Kingdom, France, Germany and Australia.
Table 3. Characteristics of guaranteed bond issuance in individual countries
For the period October 2008 to May 2010
Country
Total
issuance
(billion euro)
Number
of issuers
Number of
bonds
issued
Average size
of each bond
(billion euro)
Average
maturity
at issuance
(months)
Percentage
of available
guarantees
Australia 109,5 20 311 0,4 40 (3)
Austria 20,0 6 21 1,0 38 27
Belgium 4,0 1 4 1,0 23 21 (2)
Denmark 32,2 40 177 0,2 28 (3)
France 127,6 2 77 1,7 33 48
Germany 184,1 11 47 3,9 27 46
Greece 8,5 3 6 1,4 33 30
Ireland 61,2 10 174 0,4 30 100 (2)
Luxemburg 0,7 1 2 0,3 21 16
Netherlands 47,1 6 38 1,2 46 24
New Zealand 6,0 7 22 0,3 40 (3)
Portugal 4,4 5 5 0,9 36 22
South Korea 0,9 1 2 0,5 33 1
Spain 40,3 34 95 0,4 37 40
Sweden 18,3 5 71 0,3 40 14
United Kingdom 147,3 14 165 0,9 30 54
United States 248,2 42 191 1,3 33 14
(1) Source for committed amounts: European Commission.
(2) Authorised program size not available.
Source: Estimates by OECD Secretariat and Banca d’Italia based on Bloomberg and BIS.
The United States
and Spain stand out
for the high number
of issuing banks
As far as the number of issuers is concerned, the United States, Denmark
and Spain stand out for the high number of issuing banks: in the first case this
reflects the fact that all US issuing banks were expected to use the guarantees
unless they opt out. In Denmark, a general guarantee was adopted in favour of
all unsubordinated and unsecured debt, covering the majority of commercial
banks and savings banks. In the case of Spain, the number reflects the
fragmentation of the savings bank sector.
On the other hand, despite the large overall amount of issuance, relatively
few German banks issued guaranteed bonds. France is a special case because,
with the exception of Dexia, issuance on behalf of French banks has been
carried out by the agency SFEF, which did not disclose the names of the
“client” banks. The table also shows that Australia is the country with the
highest number of bond issued (311), followed by the United States (191),
Denmark (177), Ireland (174) and the United Kingdom (165). As for the
characteristics of the issue, the average size of the bond differs significantly
across countries: average size is very large in Germany (€3.8 billion), is €1.7
billion in France and around €1 billion in Austria, Belgium, Greece, the

12 OECD JOURNAL: FINANCIAL MARKET TRENDS – VOLUME 2010 ISSUE 1 © OECD 2010
Netherlands, Portugal, the United Kingdom and the United States. It is below
€1 billion in the other countries.
Take-up ratios have
differed across
countries
The amounts pledged by different governments for guarantee
programmes differ, as do take-up rates, that is, the ratio of actual issuance to
the amounts pledged by authorities. Take-up is relatively low on average: for
most of the 17 countries considered, the rate is in a range of 20% to 50% (with
the authorised programme size not being available in the case of three
countries). On the high side are France (48%), Germany (46%), the United
Kingdom (54%) and, especially, Ireland (100%).
…as have the ratios
of newly guaranteed
to expired debt
Another way of measuring the extent to which banks relied on guarantees
for issuing bonds is to look at those banks that made a heavier use of their
“ceiling” for guaranteed issuance. Although the rules differ in each country,
the generally agreed principle in G20 countries is that each bank is allowed to
issue guaranteed bonds as long as it aims to roll over the expiring (non-
guaranteed) debt (see Panetta et al., 2009). For this purpose one may look at a
so-called “rollover ratio” for individual banks, calculated as the ratio, over the
whole period, of new (guaranteed) bond issuance to (non-guaranteed) expired
debt. Data show that rollover ratios differ significantly across banks and across
countries. As shown in Figure 4, for the banks with bonds maturing over the
period October 2008 to May 2010, the country median rollover ratio ranges
from 0.2 to 1.8.
Figure 4. Ratio of new guaranteed issuance to expiring bonds
October 2008 to May 2010; for each country, median of all banks
0
0.2
0.4
0.6
0.8
1
1.2
1.4
1.6
1.8
Source: Estimates by OECD Secretariat and Banca d’Italia based on Dealogic DCM. For France, only Dexia (issuance by other banks via SFEF not included).
OECD JOURNAL: FINANCIAL MARKET TRENDS – VOLUME 2010 ISSUE 1 © OECD 2010 13
… with countries
falling broadly into
three groups
The ratio is below one in all countries except Australia, Austria and
Denmark, where rollover ratios are between 1.2 and 1.7. These figures suggest
that, by and large, most participating banks used the guarantees to roll over the
existing debt or, in some cases, to slightly increase bond liabilities (in the
United States the ceiling per institution was 125% of liabilities at end-October
2008). An important caveat in this regard is that the proposed measure of
rollover ratio has an upward bias because the data provider (Dealogic) covers
only “international” bonds: to the extent that a bank’s expired bonds were
“domestic”, Dealogic will understate the denominator of the rollover ratio.5
Towards some normalisation of bank funding patterns?
After the adoption of
guarantee schemes,
overall bank bond
issuance volumes
increased in most
areas
In most major markets, total bank issuance was low in the last three
months of 2008, but picked up somewhat during subsequent months,
regardless of the composition: in some cases guaranteed bonds have more than
offset a decline of non-guaranteed debt; in other cases public rescue schemes
have provided indirect help to the banks’ ability of raising funds without
guarantees by reducing their “funding liquidity risk” (i.e. the risk that the bank
cannot roll over its debt). Figure 4 shows the monthly profile of banks’ bond
issuance since 2008 for the euro area, the United States, the United Kingdom,
Australia, Sweden and Denmark. It is evident that after the adoption of
guarantee schemes overall issuance volumes increased in most of these areas.
The increase was particularly pronounced in the United States, the United
Kingdom and Australia. In the United States, total issuance almost doubled,
whereas in the euro area the gross issuance was robust in the first half of 2008,
then sharply declined and, thanks to guaranteed issuance, recovered to the
levels of one year earlier. For the United States and the United Kingdom,
however, debt issuance declined in the third and fourth quarter of 2009. What
is noticeable is that non-guaranteed bonds have again replaced guaranteed
bonds as the major source of bank funding in almost all markets (Figure 4).
In the second half of
2009 funding
markets
progressively
reopened and
issuance of non-
guaranteed bank
bonds picked up
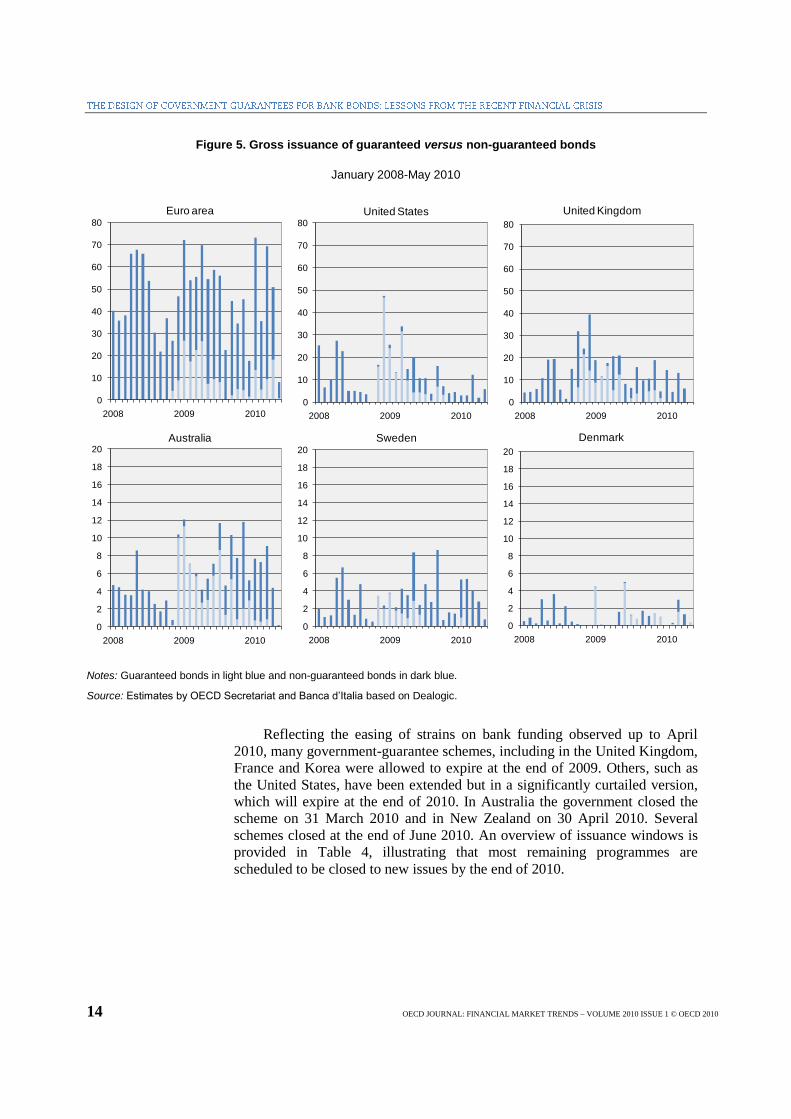
In the second half of 2009, funding markets progressively reopened and,
up to April 2010, issuance of non-guaranteed bank bonds picked up
significantly in many markets (Figure 5). This situation implies that up to
April there was a return towards normalisation of bank funding patterns. That
being said, some issuers continue to rely in part on the issuance of
government-guaranteed bonds, and guaranteed issuance activity increased
again between August and December 2009 before falling off significantly in
January 2010 (Figure 3). In part, the drop in activity reflects changes in the
availability of programmes, while the peak in activity towards the end of 2009
is largely due to exceptionally large issuance by a single issuer (accounting for
about 75% of total issuance in December).6 In May 2010 there was a steep
decline in gross issuance of bank bonds in Europe: the increase of sovereign
risk, especially in some smaller euro area countries, has translated into a flight
to quality and a drying up of demand for both guaranteed and non-guaranteed
bank bonds.
14 OECD JOURNAL: FINANCIAL MARKET TRENDS – VOLUME 2010 ISSUE 1 © OECD 2010
Figure 5. Gross issuance of guaranteed versus non-guaranteed bonds
January 2008-May 2010
0
10
20
30
40
50
60
70
80
2008 2009 2010
Euro area
0
10
20
30
40
50
60
70
80
2008 2009 2010
United States
0
10
20
30
40
50
60
70
80
2008 2009 2010
United Kingdom
0
2
4
6
8
10
12
14
16
18
20
2008 2009 2010
Australia
0
2
4
6
8
10
12
14
16
18
20
2008 2009 2010
Sweden
0
2
4
6
8
10
12
14
16
18
20
2008 2009 2010
Denmark
Notes: Guaranteed bonds in light blue and non-guaranteed bonds in dark blue.
Source: Estimates by OECD Secretariat and Banca d’Italia based on Dealogic.
Reflecting the easing of strains on bank funding observed up to April
2010, many government-guarantee schemes, including in the United Kingdom,
France and Korea were allowed to expire at the end of 2009. Others, such as
the United States, have been extended but in a significantly curtailed version,
which will expire at the end of 2010. In Australia the government closed the
scheme on 31 March 2010 and in New Zealand on 30 April 2010. Several
schemes closed at the end of June 2010. An overview of issuance windows is
provided in Table 4, illustrating that most remaining programmes are
scheduled to be closed to new issues by the end of 2010.

OECD JOURNAL: FINANCIAL MARKET TRENDS – VOLUME 2010 ISSUE 1 © OECD 2010 15
Table 4. Overview of selected issuance windows and estimated end dates of validity of guarantees
Country Name of programme Maximum tenor Issuance window open
until...
Estimated end date
of validity of any
guarantee
Australia Wholesale Funding Guarantee
Facility as of Oct 2008
5 years 31 Mar 2010 (before:
“until conditions
normalise”)
Mar 2015
Austria Interbankmarktstärkungsgesetz as
of Oct 2008
5 years 30 Jun 2010 (extended
from 31 Dec 2009)
Jun 2015
Denmark
(new)
Credit Package Agreement as of
Jan 2009 (following the Act on
Financial Stability as of Oct 2008)
3 years 31 Dec 2010 (extended
from 30 Jun 2010)
Dec 2013
France Société de financement de
l'économie française
5 years 12 Nov 2009
(expired)
Dec 2014
Fra./Bel./Lux.
- Dexia Group
First Demand Guarantee
Agreement as of Oct 2008, updated
in Sep 2009
4 years (until 31 Oct
2014)
30 Jun 2010 (voluntary
stop)
Jun 2014
Germany Sonderfonds
Finanzmarktstabilisierung as of
Dec 2008
3 years, but
extension to 5 years
possible
31 Dec 2010
(extended from 30 Jun
2010)
Dec 2015
- NORD/LB NORD/LB GMTN programme as
of Dec 2008
5 years 31 Dec 2010 Dec 2015
Greece Law for “Enhancing the liquidity
of the economy to address the
effects of international financial
crisis”
3 years 30 Jun 2010 (extended
from 31 Dec 2009)
June 2013
Ireland
(initial)
Credit Institutions (Financial
Support) Act 2008 as of Oct 2008
Until 29 Sep 2010 29 Sep 2010 Sep 2010
Ireland (new) Eligible Liabilities Guarantee
Scheme as of Dec 2009
5 years 31 Dec 2010 (extended
from 27 Sep 2010)
Sep 2015
Italy Italian Guarantee Scheme 5 years 16 Dec 2009 (expired) Dec 2014
Korea Government Guarantee for Foreign
Currency Debt of Korean Banks
5 years (extended
from 3 years)
31 Dec 2009 Jun 2012
Netherlands 2008 Credit Guarantee Scheme 5 years (but not
maturing beyond 31
Dec 2012)
30 Jun 2010 (extended
from 31 Dec 2009)
Dec 2012
New Zealand Wholesale Funding Guarantee
Facility as of Nov 2008
5 years 30 April 2010 30 April 2015
Portugal Portuguese State Guarantee
Scheme as of 20 Oct 2008
3 years
(exceptionally up to
5 years)
30 Jun 2010 (extended
from 31 Dec 2009)
Dec 2012
Spain Royal Decree of 13 October Up to 5 years 31 Dec 2010 (extended
from Jun 2010)
Jun 2015
Sweden Guarantee Scheme as of Oct 2008 5 years 30 June 2010 Apr 2015
United
Kingdom
Credit Guarantee Scheme as of Oct
2008; updated in Jan 2009
3 years 28 Feb 2010 (expired,
although roll-overs until
9 Apr 2014)
April 2014
United States
(initial)
Temporary Liquidity Guarantee
Programme
Until 31 Dec 2012 31 Oct 2009 (extended
from 30 Jun 2009)
Dec 2012
United States
(new)
Six-month emergency guarantee
facility as of Oct 09
Until 31 Dec 2012 30 December2010 Dec 2012
Notes: Countries with “active” programmes under which at least one bond has been issued. Grey-shading indicates that issuance windows have been closed by the time of writing. The “estimated end date of validity of any guarantee” is the latest date until which guarantees extended under these programs are currently projected to be ending. For completion, this estimate is reported even for some of those cases where no guarantees have been issued.
7
Source: Estimates by OECD Secretariat and Banca d’Italia based on EU Commission (2010), Royal Bank of Scotland (2009, 2010) and Schwartz (2010).

16 OECD JOURNAL: FINANCIAL MARKET TRENDS – VOLUME 2010 ISSUE 1 © OECD 2010
Redemptions
projected to peak in
2012
Still, given the current maturity profile of outstanding issues, most
government-guaranteed bank bonds will mature by December 2014 and, on
aggregate, redemptions will peak in 2012 (Figure 6), raising the possibility of
funding challenges in that year (on the concentration of bank bond
redemptions in 2010-2012, see also IMF, 2010, and BIS, 2010). These
aggregate data mask, however, considerable differences in the patterns of
redemptions of guaranteed bonds in individual countries: while redemptions
peak in 2012 in the case of many countries, in some cases such peaks occur
before that year, leading to potentially relevant funding challenges in the short
term (see Appendix 1 for individual-country data). In Europe, where bank
funding relies on bonds more than in the US, the current time profile of
aggregate bank debt (including non-guaranteed bonds) implies that a
significant part of wholesale funding matures between 2010 and 2012.8
Figure 6. Redemptions of guaranteed bonds by year
0
50
100
150
200
250
300
2010 2011 2012 2013 2014
Other
USD
EUR
Notes: Amounts outstanding, in billions of euro equivalents, of guaranteed bank bonds maturing between 2010 and 2014; as of 1 June 2010. Amounts converted using the exchange rate of the day of issuance.
Source: Estimates by OECD Secretariat and Banca d’Italia based on Dealogic.
Summary assessment of benefits and costs of bond guarantee programmes
Schemes have
allowed banks to roll
over their maturing
debt at a time when
traditional sources
of funding were
drying up
There appears to be widespread agreement that, on the whole,
government guarantees have been successful in meeting their stated objectives,
which was to allow banks to tap funds on the markets and roll over their
maturing debt at a time when traditional sources of funding were drying up
(see e.g. ECB, 2010; IMF GFSR, 2009; Levy and Zaghini, 2010; Panetta et.
al., 2009; Schwartz, 2010; Schich, 2009). Clearly, as mentioned at the outset,
it is difficult to isolate the effect of guarantees from those of the wider set of
support measures to the financial sector and from monetary policy measures,

OECD JOURNAL: FINANCIAL MARKET TRENDS – VOLUME 2010 ISSUE 1 © OECD 2010 17
as all of them can have important influences on expectations and confidence.
For example, the IMF’s Global Financial Stability Report of October 2009
noted that government-supported guarantees may not just have favoured
guaranteed but also non-guaranteed issuance, by reducing the funding liquidity
risk of banks. According to other commentators, the support measures may
have favoured the banking system also by signalling that an “implicit
guarantee” was being provided by governments to a large set of banks,
especially the big ones.
In any case, these overall positive assessments notwithstanding, various
distortions have arisen, including to incentives and competition, also reflecting
the chosen pricing schemes.
IV. Minimising cross-border distortions and avoiding subsidising non-viable banks
How to minimise cross-border competitive distortions through appropriate pricing?
There is
considerable
variation in the
quality of sovereign
guarantees
Using similar fee structures in order to avoid creating competitive
distortions is only helpful to the extent that the value of the guarantee provided
is identical across countries. In reality, it is not, however. Actually, there is
considerable variation in the quality of sovereign guarantees, as highlighted
e.g. by the differences in sovereign CDS premiums. These in turn have
affected the yield spreads at issue and hence the total costs to the issuer of the
issue.
A graphical illustration of the disconnect between the issuing bank’s
creditworthiness and the cost of issuing guaranteed bonds is provided by
Figure 7 (taken from Levy and Zaghini, 2010): for instance, Portuguese banks
(Banco Commercial Português, Banco Espírito Santo, both rated A, and Caixa
Geral de Depósitos, which was rated A+) paid much larger spreads at launch
(90–100 basis points over the swap rate) than German banks such as
Commerzbank (rated A), Bayerische Landesbank and HSH Nordbank AG
(both rated BBB+), which paid less than 20 basis points.
There is, of course, another component of the borrowing cost faced by the
issuing bank, namely, the guarantee fee. As already mentioned, however, the
fees paid by European banks were roughly similar across countries.
As a result of this effect, “weak” banks from “strong” countries (where
the sovereign guarantee has a high value) tended to have had access to cheaper
funding than “strong” banks from “weak” countries (where the sovereign
guarantee has a low value).
“Weaker” countries
could (be allowed to)
charge higher fees
for their guarantees
To avoid such distortions, guarantees could have been designed so that
they are consistent across countries. By contrast, pricing schemes that ignore
the fact that the value of a sovereign guarantee differs depending on the
individual guarantor tend to induce competitive distortions. In particular,
“weaker” countries could (be allowed to) charge lower fees, while “stronger”
countries could (be allowed to) charge higher fees for their guarantees.

18 OECD JOURNAL: FINANCIAL MARKET TRENDS – VOLUME 2010 ISSUE 1 © OECD 2010
Figure 7. Dispersion of spreads at launch on guaranteed bonds (1)
GMAC (US)
IKB (DE)
IRISH NATION (IE)
ZIONS (US)
NYCOMM (US)
AMEX (US)
B.BILBAO PR (US)
BAYER LBK (DE)
B.QUEENSLAND (AU)
HSH (DE)
HUNTING (US)
NIBC (NL)
AN-IR BK (IE)
IRISH LIFE (IE)
KEYCORP (US)
LEASEPLAN (NL)
MACQUAR (AU)
METLIFE (US)
STLIFE (GB)
AAREAL (DE)
ALLIED (IE)
BANCAJA (ES)
B.ESPIRITO (PT)
B.IRELAND (IE)
B.INTER (ES)
C.VALENCIA (ES)
C.GALICIA (ES)
C.LAIET (ES)
C.PENEDES (ES)
CAIXANOVA (ES)
C.MANRESA (ES)
CITIGROUP (US)
COMMERZ (DE)
DEXIA (FR)
FIN-DAN (DK)
FORTIS (NL)
JDEERE (US)
KEYBK (US)
OESTER VLB (AT)
PNC FUND (US)
RAIFF (AT)
RBS (GB)
SNS (NL)
TESCO (GB)
YORKSHRE (GB)
B.AMER. (US)
B.SCOT (GB)
C.GERAL (PT)
CITIBANK (US)
DANSKE (DK)
JPMORG (US)
LLOYDS (GB)
N.WIDE (GB)
NYKRED (DK)
STATEST (US)
UNION (US)
MELLON (US)
WEST-SF (US)
BARCLAYS (GB)
HSBC (US)
ING (AUS)
ING (NL)
LACAIXA (ES)
NORDEA (DK)
AU&NZ B. (AU)
CASCADES (US)
INT.FUND (NZ)
COMM AUS (AU)
N.AUSTR (AU)
BANCORP (US)
W.FARGO (US)
WESTPAC (AU)
GENELEC (US)SFEF (FR)
-20
0
20
40
60
80
100
120
140
Sp
rea
d a
t la
un
ch
S&P issuer rating
AAA AA+ AA AA- A+ A A- BBBBBB+ BBB-
(1) Includes guaranteed bonds issued in the period October 2008–October 2009. Averages, basis points.
Source: Levy and Zaghini (2010).
In the European Union, the recommendation about pricing schemes made
by the ECB Council was by and large adopted by all EU member states and it
essentially implied a homogenisation of fee charges. By opting for a variable
component of the fee calculated as the median CDS over the 18-month period
ending in August 2008, two effects were achieved: first, crisis-level data did
not significantly influence the level of the fee and, second, by using the
median, the effect of extremely high (or low) CDS premia was essentially
eliminated.
Allowing more
heterogeneity of
fees, distortions
would have been
smaller
One might argue that by allowing more heterogeneity of fees, e.g. by
opting for a variable-component window including the post-Lehman period
(e.g. September-October 2008 and/or using the mean instead of the median),
distortions would have been smaller. For example, German banks would have
paid higher fees than Irish and Portuguese banks, perhaps offsetting the
“sovereign-quality” advantage and thus “equalising” the overall cost of
issuance (fee plus spread at issuance).
An additional complication arises because the quality of a sovereign
guarantee is not constant over time. It varies, among other things, as a function
of public finance variables (which, in turn, can be a function of the expansion
of the national financial safety net for banks). The public finance situation in
many advanced economies worsened dramatically in 2009, and this situation
has drawn the spotlight on the issue of sovereign credit risk.9 There has been
an increase in sovereign risk premia in the case of many countries, as reflected,
for example, in the prices of bonds or CDS, and this increase has been directly

OECD JOURNAL: FINANCIAL MARKET TRENDS – VOLUME 2010 ISSUE 1 © OECD 2010 19
linked by some observers to the expansion by governments of the financial
safety net for banks (e.g. Alessandri and Haldane, 2009).
The cost advantage
for “weak” banks
from “strong”
countries may have
increased recently
There has been a particularly large increase in the costs of sovereign
credit default protection in the case of some small or medium-sized countries,
including some of those in which banking sectors are relatively large
compared to the size of the country in terms of its GDP or fiscal “capacity”
(see Figure 8, which shows the increase of sovereign spreads on the vertical
axis). As a result, the value of these sovereign guarantees has declined and the
cost advantage for “weak” banks from “strong” countries may have increased,
thus making a continuation of guaranteed issuance particularly attractive for
the latter.
Figure 8. Changes in sovereign CDS premiums since guarantee programmes were introduced
Difference between second quarter of 2010 and fourth quarter of 2008; period averages
-100
-50
0
50
100
150
200
250
300
350
400
450
Source: Estimates by OECD Secretariat and Banca d’Italia based on Thomson Financial Datastream.
How to achieve exit and avoid subsidising banks (including non-viable ones) for too
long?
Most governments
have extended
issuance windows
for guaranteed
bonds
Continuing uncertainty about the underlying strength of financial
markets and institutions and a broadly still weak real economic environment
have led most governments to extend issuance windows for government-
guaranteed bonds into 2010. There is, however, a non-negligible risk that
leaving guarantee schemes in place for too long leads to institutions, including
non-viable ones, being subsidised.
CDS- and rating-
based fees are, to
some extent, a tax
levied according to
risk
The choice of pricing mechanism determines the distribution of
subsidies. For example, in the United States, authorities charge a flat fee,
which depends only on the maturity of the bond. In Australia and Europe the
cost of the guarantee is also based on each bank’s credit agency rating and
CDS spread over a given time window, respectively. An implication of the

20 OECD JOURNAL: FINANCIAL MARKET TRENDS – VOLUME 2010 ISSUE 1 © OECD 2010
different pricing mechanism is that the European CDS-based fee and the
Australian rating-based fee can be seen, at least to some extent, as a tax levied
on banks according to risk. By contrast, a flat-fee system can be characterised
as a subsidised system, in which the government and “strong” banks subsidise
“weak” banks.
…although the
discrimination power
has been limited as a
result of the specific
choice of the fee-
setting formula
That said, where risk-based premiums are levied, the discrimination
power has been limited by the choice of the formula for determining
premiums. For example, the European Union has opted for a variable
component of the fee being calculated as the median CDS over the 18-month
period ending August 2008. Both the choice of excluding the turmoil period
from the “reference time window” for pricing and selecting the median tend to
reduce the cross-country and cross-bank variation of fees in practice. Indeed,
apart from France, which levies a fixed guarantee fee of only 20 basis points
on top of the median CDS over a pre-defined time window, the actual
variation across countries is relatively limited, as discussed in section II.
Schemes where
participation is
optional at the level
of each single bond
issue tend to lead to
a “separating
equilibrium”
Optionality of participation also affects the allocation of subsidies. In the
United States, all financial institutions participated in the programme unless
they opted out. And if they did not opt out, all their new senior unsecured
liabilities were insured by the FDIC. Similarly, in Ireland, all new bonds
issued by banks covered by the scheme are automatically insured.
By contrast, in most European countries, participation is optional at the
level of each single bond issue. This difference will influence the signalling
effect. The schemes used in most European countries tend to lead to an
outcome known in the literature as “separating equilibrium” (Acharya and
Sundaram, 2009). In particular, that mechanism may reveal to markets which
intermediaries are stronger and which are weaker, allowing banks to raise debt
and equity accordingly.
Indeed, market sources report that in many markets, issuance of
guaranteed bonds as compared to non-guaranteed bonds or equity was
considered a “stigma”. However, a role in deterring some banks from issuing
guaranteed bonds has also been played by “relative cost” considerations (see
Levy and Zaghini, 2010), as in some countries the sum of fees plus spread at
issuance of guaranteed bonds have been close to or even higher than the
issuance spreads of non-guaranteed bonds, reflecting the low quality of the
sovereign guarantee.
An opt-in approach
can avoid the
potential
stigmatisation of
guaranteed issuance
An opt-in approach, whereby bank bonds would be automatically
covered (up to a specific maximum level defined as a function of outstanding
debt at the time of the introduction of the scheme) unless they opt out, allows
one to avoid the potential stigma effect associated with issuance of guaranteed
debt.
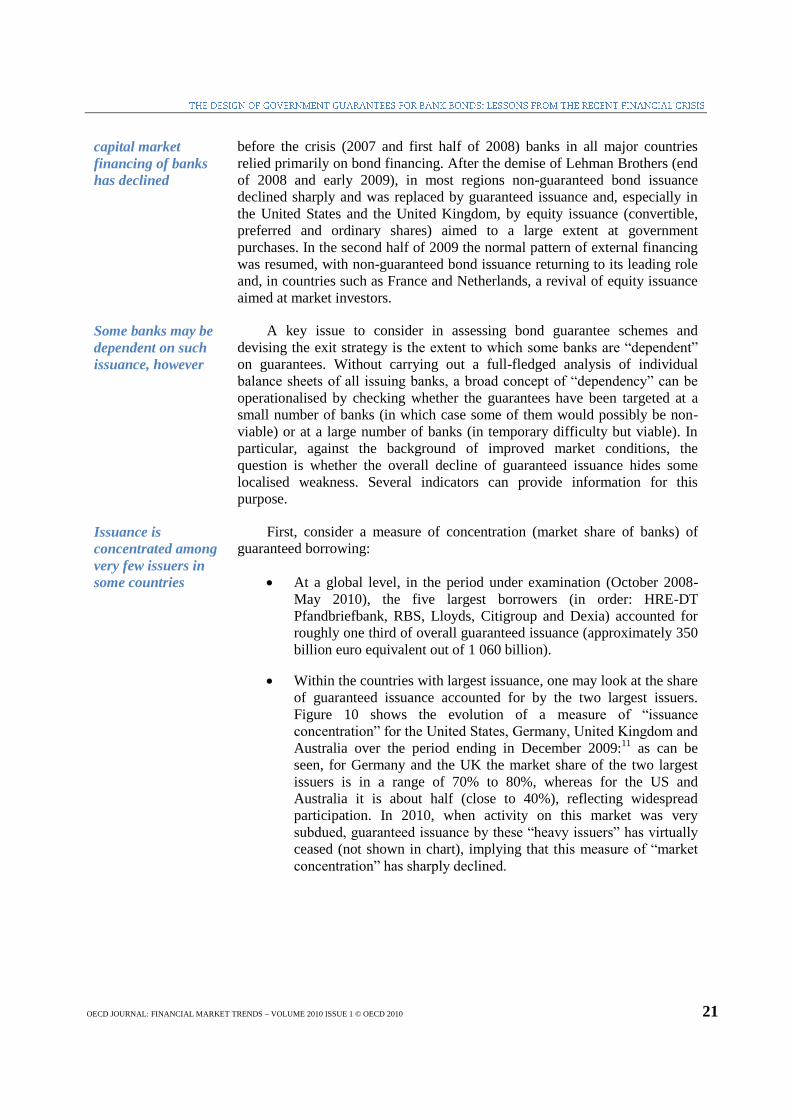
Over the past few
months, the role of
guaranteed bond
issuance as part of
With the normalisation of market conditions observed since mid-2009,
the role of guaranteed bond issuance has declined when considered in the
broader context of capital market financing for banks.10
Figure 9 shows the
evolution of all market financing sources for banks since 2007: as can be seen,
OECD JOURNAL: FINANCIAL MARKET TRENDS – VOLUME 2010 ISSUE 1 © OECD 2010 21
capital market
financing of banks
has declined
before the crisis (2007 and first half of 2008) banks in all major countries
relied primarily on bond financing. After the demise of Lehman Brothers (end
of 2008 and early 2009), in most regions non-guaranteed bond issuance
declined sharply and was replaced by guaranteed issuance and, especially in
the United States and the United Kingdom, by equity issuance (convertible,
preferred and ordinary shares) aimed to a large extent at government
purchases. In the second half of 2009 the normal pattern of external financing
was resumed, with non-guaranteed bond issuance returning to its leading role
and, in countries such as France and Netherlands, a revival of equity issuance
aimed at market investors.
Some banks may be
dependent on such
issuance, however
A key issue to consider in assessing bond guarantee schemes and
devising the exit strategy is the extent to which some banks are “dependent”
on guarantees. Without carrying out a full-fledged analysis of individual
balance sheets of all issuing banks, a broad concept of “dependency” can be
operationalised by checking whether the guarantees have been targeted at a
small number of banks (in which case some of them would possibly be non-
viable) or at a large number of banks (in temporary difficulty but viable). In
particular, against the background of improved market conditions, the
question is whether the overall decline of guaranteed issuance hides some
localised weakness. Several indicators can provide information for this
purpose.
Issuance is
concentrated among
very few issuers in
some countries
First, consider a measure of concentration (market share of banks) of
guaranteed borrowing:
At a global level, in the period under examination (October 2008-
May 2010), the five largest borrowers (in order: HRE-DT
Pfandbriefbank, RBS, Lloyds, Citigroup and Dexia) accounted for
roughly one third of overall guaranteed issuance (approximately 350
billion euro equivalent out of 1 060 billion).
Within the countries with largest issuance, one may look at the share
of guaranteed issuance accounted for by the two largest issuers.
Figure 10 shows the evolution of a measure of “issuance
concentration” for the United States, Germany, United Kingdom and
Australia over the period ending in December 2009:11
as can be
seen, for Germany and the UK the market share of the two largest
issuers is in a range of 70% to 80%, whereas for the US and
Australia it is about half (close to 40%), reflecting widespread
participation. In 2010, when activity on this market was very
subdued, guaranteed issuance by these “heavy issuers” has virtually
ceased (not shown in chart), implying that this measure of “market
concentration” has sharply declined.

22 OECD JOURNAL: FINANCIAL MARKET TRENDS – VOLUME 2010 ISSUE 1 © OECD 2010
Figure 9. Sources of financing
First quarter 2007 to first quarter 2010
0
50
100
150
200
250
300
350
400
2007 Q1
2007 Q2
2007 Q3
2007 Q4
2008 Q1
2008 Q2
2008 Q3
2008 Q4
2009 Q1
2009 Q2
2009 Q3
2009 Q4
2010 Q1
USA
common shares
convertibles
pref shares
guaranteed
bonds
0
20
40
60
80
100
120
140
160
180
200
2007 Q1
2007 Q2
2007 Q3
2007 Q4
2008 Q1
2008 Q2
2008 Q3
2008 Q4
2009 Q1
2009 Q2
2009 Q3
2009 Q4
2010 Q1
United Kingdom
common shares
convertibles
pref shares
guaranteed
bonds
0
20
40
60
80
100
120
140
2007 Q1
2007 Q2
2007 Q3
2007 Q4
2008 Q1
2008 Q2
2008 Q3
2008 Q4
2009 Q1
2009 Q2
2009 Q3
2009 Q4
2010 Q1
Germany
common shares
convertibles
pref shares
guaranteed
bonds
0
5
10
15
20
25
30
35
40
45
2007 Q1
2007 Q2
2007 Q3
2007 Q4
2008 Q1
2008 Q2
2008 Q3
2008 Q4
2009 Q1
2009 Q2
2009 Q3
2009 Q4
2010 Q1
Switzerland
common shares
convertibles
pref shares
guaranteed
bonds
0
10
20
30
40
50
60
70
80
90
2007 Q1
2007 Q2
2007 Q3
2007 Q4
2008 Q1
2008 Q2
2008 Q3
2008 Q4
2009 Q1
2009 Q2
2009 Q3
2009 Q4
2010 Q1
France
common shares
convertibles
pref shares
guaranteed
bonds
0
5
10
15
20
25
30
35
40
45
2007 Q1
2007 Q2
2007 Q3
2007 Q4
2008 Q1
2008 Q2
2008 Q3
2008 Q4
2009 Q1
2009 Q2
2009 Q3
2009 Q4
2010 Q1
Netherlands
common shares
convertibles
pref shares
guaranteed
bonds
Source: Estimates by OECD Secretariat and Banca d’Italia based on Dealogic.

OECD JOURNAL: FINANCIAL MARKET TRENDS – VOLUME 2010 ISSUE 1 © OECD 2010 23
Figure 10. Share of GGB issuance accounted for by two largest borrowers
0
0.1
0.2
0.3
0.4
0.5
0.6
0.7
0.8
0.9
1
Jan/09 Feb/09 Mar/09 Apr/09 May/09 Jun/09 Jul/09 Aug/09 Sep/09 Oct/09 Nov/09 Dec/09
Top-2 German issuers
Top-2 Australian issuers
Top-2 United States issuers
Top-2 United Kingdom issuers
Notes: “Largest” issuers are defined in terms of their share in total issuance over the whole observation period.
Source: Estimates by OECD Secretariat and Banca d’Italia based on Dealogic.
Compared to the
“turbulent” period
after fall 2008, more
recently “weaker”
banks account for a
relatively larger
share of GGB
issuance
Second, consider an indicator that compares the characteristics of banks
that issued in the “turbulent” period October 2008 to April 2009, when
guaranteed issuance was very sustained, with the characteristics of banks that
issued mainly during the subsequent “tranquil” period (May 2009 to May
2010):
One stylised fact is that out of the 200 banks that have issued
guaranteed bonds worldwide, roughly one third issued only in the
”turbulent” period, one third issued only in the “quiet” period and
the remaining third issued in both periods.
Another stylised fact is that the average creditworthiness of banks
(as measured by their credit ratings) that issued in the second period
has declined significantly as compared to the first “turbulent” period:
the shares of banks rated double-A and single-A have declined by
roughly 10 percentage points each, to 10% and 40%, respectively,
and the share of banks rated triple-B has risen by roughly the same
amount (20 percentage points), to 30%. In the same vein, the share
of triple-C and non-rated issuers has increased (Figure 11).
Thus, “weaker” banks account for a relatively larger share of total
issuance more recently, as compared to the “turbulent” period, possibly
suggesting that declining issuance in the second half of 2009 and first half of
2010 hides weaknesses and a “dependence” of some banks. It is against this
background, and with a view to mitigating these concerns, that in May 2010
the EU Council of Ministers of Finance and the EU Commission announced

24 OECD JOURNAL: FINANCIAL MARKET TRENDS – VOLUME 2010 ISSUE 1 © OECD 2010
new rules for the issuance of bank bonds with public guarantee, starting from
1 July 2010: on the one hand “guarantee fees will be increased in order to
bring funding costs closer to market conditions”, on the other “banks
continuing to heavily rely on guarantees and not under restructuring
obligations should undergo a review of their long-term viability which will be
conducted by the Commission” (see Ecofin, 2010).12
Figure 11. Issuance by rating of issuers
As a percentage of total issuance in the period October 2008-May 2010
0
10
20
30
40
50
60
AA A BBB CCC NR
until April 2009
after April 2009
Source: OECD and Banca d’Italia calculations based on Bloomberg and Dealogic.
V. Concluding remarks
Reflecting the
specific country
circumstances,
specific elements of
the design of bank
bond guarantee
schemes have
differed
Financial institutions have made extensive use of government guarantees
on bond issuance: in the period October 2008 to May 2010 more than 1 400
guaranteed bonds have been issued by approximately 200 banks from 17
countries, for an amount equivalent to more than €1 000 billion. Largely
reflecting the specific strains that the banking sector was exposed to and the
structure of the banking system, the parameters of the design of such
guarantee schemes differed from one country to another, and there appears to
be no single best approach to the design of such schemes that would have
fitted the circumstances of all countries.
Guarantees have
been effective in
resuming overall
long-term funding
While the guarantees have been effective in resuming overall long-term
funding for banks and reducing their default risk, this type of public support to
the banking system has raised two major issues:

OECD JOURNAL: FINANCIAL MARKET TRENDS – VOLUME 2010 ISSUE 1 © OECD 2010 25
for banks;
nonetheless they
have also raised (at
least) two major
issues
The pricing of the guarantees has brought non-negligible distortions
and has “altered” the level playing field for banks from different
countries.
Despite a declining overall reliance on guarantees, there is a risk that
non-viable institutions benefit from the continued availability of
such guarantees.
The pricing of the
guarantees has
brought non-
negligible distortions
to competition
Concerning the first issue, the pricing scheme adopted by virtually all
participating countries has implied charging very similar guarantee-fees for all
banks across countries. In principle, such harmonisation was aimed at
providing a “level playing field”. In practice, however, the significant
differences in the creditworthiness across sovereigns, especially within the
EU, and the fact that investors have considered such creditworthiness as the
main variable for pricing each bank’s guaranteed bonds, have led to a paradox:
relatively weak banks with strong sovereign guarantors have been able to
borrow more cheaply, even including the guarantee fee, than strong banks
with weak sovereign guarantors, which implies an inefficient allocation of
resources.
Governments with
lower sovereign risk
would have to
charge higher fees
to “offset” the
funding advantage
for domestic banks
The increase in the sovereign risk observed in some small or medium-
sized EU countries since early 2010, in a much stronger form since May, has
made the issue of cost advantage for weak banks from strong countries even
more relevant. One commentator noted that the cost advantage may not be
confined to the issuance cost savings, but may also include a facilitated access
to the market, permitting issuances of larger amounts and, in some countries,
at longer maturities.
One way of preventing this distortion would have been to incorporate and
“offset” the difference in cross-country sovereign risk by choosing an
appropriate price of the guarantee: in practice, this would have implied that
governments with lower sovereign risk would choose to charge a higher fee to
their banks (and vice versa in the case of governments with higher sovereign
risk).
But requiring such a
choice was not
considered a valid
policy option
One could argue, however, that going so far as to require that stronger
sovereigns charge higher premiums would penalise virtuous countries. Indeed,
as one delegation noted, in order to encourage “fiscal virtue”, the strong
sovereign should be allowed to charge a similarly low premium as other
(perhaps weaker) sovereigns, so that the strength of the fiscal and credit risk
position is recognised as a worthy achievement. That said, that delegation
added, greater consistency could be achieved by other means, such as
harmonising the timing of the phasing-out of guarantees.
In principle, an alternative solution to dealing with the potential distortion
to competition arising from differences in the quality of the guarantor would
be to establish some form of “joint guarantee” scheme (an issue that is not
covered in the present article). But as such solutions would require a
significant strengthening of cross-border fiscal burden-sharing, they are
politically difficult to implement. More important, perhaps, they may also not
be desirable, as they can introduce other distortions (e.g. limiting the potential

26 OECD JOURNAL: FINANCIAL MARKET TRENDS – VOLUME 2010 ISSUE 1 © OECD 2010
role for market discipline). In any case, absent such arrangements, recent
efforts to achieve similarity in fee structures for government-provided
guarantees for banks are not necessarily helpful to minimise the potential
distortions arising from such guarantees.
Despite declining
overall reliance on
guarantees, there is
a risk that non-
viable entities
benefit from the
continued
availability of such
guarantees
Concerning the second issue, most governments have extended bank
bond guarantee schemes into 2010 (some of them with higher fees and
restrictions on issuance) out of a concern that, despite the improvement in
financial market conditions, some institutions might still be fragile and
possibly require the “safety net” of public guarantees. There is, however, the
risk that, on the one hand, additional competitive distortions arise, and, on the
other, non-viable banks take advantage of the continued availability of
guarantees and postpone addressing their own weaknesses or, even worse,
adopt excessive risks in a “gamble-for-redemption”. The EU Council’s
Conclusions of 2 December 2009 reflect this consideration and, incidentally,
suggest that countries begin the phasing out of government support measures
starting with government guarantees.13
…and the evidence
identified here is not
inconsistent with
that suggestion
The evidence identified here is not inconsistent with the suggestion that
the continued availability into 2010 of guarantee schemes might, indeed, even
when the overall usage of guarantees declines, shield weak banks from the
market discipline that would normally prevail. In some large advanced
economies, actual usage of guarantees was concentrated in a few banks. In
addition, the average credit rating of the banks that issued in the second half of
2009, when market conditions were much more favourable, is much lower
than the rating of banks that issued in the “turbulent” period (October 2008 to
April 2009). While this evidence is consistent with the hypothesis of a
“tiering” of banks, with some weaker banks being “dependent” on guaranteed
issuance, only a closer look at individual bank characteristics, such as size,
capitalisation, leverage and liquidity, would allow one to reach stronger
conclusions.
In Europe, for example, these concerns were partly assuaged by the
decisions taken in May 2010 by the EU Council of Ministers of Finance and
the EU Commission: starting from 1 July 2010 guarantee fees will be
increased in order to bring funding costs closer to market conditions and those
banks that continue to rely heavily on guarantees will have to undergo a
review of their long-term viability.14

OECD JOURNAL: FINANCIAL MARKET TRENDS – VOLUME 2010 ISSUE 1 © OECD 2010 27
NOTES
1 The expression “government-guaranteed bank bonds” is used here since almost all bonds issued under such
programs were issued by banks. That said, some programs were, in principle, also open to non-bank
financial institutions. For convenience, the remainder of the paper refers to these bonds as “government-
guaranteed bonds” (GGB).
2 See also Schich (2009), especially section V.
3 An important feature of each country’s guarantee scheme is the timeliness of the repayment in case of the
borrowing bank’s default; the non-negligible differences that exist across countries in this regard seem to
have affected the value of the guarantee and hence the actual issuance costs (see e.g. Levy and Zaghini,
2010). Among those governments that have provided details in this regard, two main approaches have
been followed. On the one hand, the French authorities have devised a pre-payment structure, by setting
up an agency (SFEF), which issues the bonds on behalf of individual institutions. In other countries the
guarantor steps in, upon request, only after the issuer has failed to pay on the due date (in some countries,
with a grace period before the guarantee becomes effective).
4 With a view to alleviating funding pressures arising from the large amount of medium-term bank debt expiring in
2009 (and, reportedly, to avoid direct competition for investors between GGB and government bonds),
most countries made guarantees available for bonds with a maximum maturity of 3 years, with some
countries allowing 5-year maturities (and others later extending the maximum tenor from 3 to 5 years).
Reflecting this initial constraint, a large amount of bonds was issued with a tenor of 3 years and are thus
scheduled to expire in 2012 (around €300 billion, representing 40% of all bond issuance).
5 One CMF delegation emphasised the relevance of this statistical bias, drawing attention to the fact that authorities
in that country do not calculate such data and that, therefore, the data shown should not be seen as
official estimates.
6 There were two large issues of Deutsche Pfandbriefbank DEPFA in December 2009. DEPFA Deutsche
Pfandbriefbank and Hypo Real Estate Bank AG merged to form Deutsche Pfandbriefbank AG on 29
June 2009.
7 In establishing the guarantee scheme in Australia, the government announced that the scheme would remain open
until markets normalise. On 7 February 2010, it was announced that the scheme would be closed to new
borrowing from 31 March 2010. In Denmark, an extension of the window for applying for an individual
government guarantee on bond issuance from June 2010 to December 2010 has been approved by the
European Commission. In that country, a general state guarantee on all unsubordinated and unsecured
debt will expire on 30 September 2010 (also affecting outstanding bonds, which will lose the public
guarantee). Ireland and Spain have received approvals by the EU Commission for a three month and six-
month extension, respectively, to end-December 2010 of their bank debt guarantee schemes.
8 FitchRating (2010) draws attention to the maturity profile of European bank debt (guaranteed and non-
guaranteed), which is characterised by a large amount of redemptions concentrated in the years 2010 to
2012 and poses a refinancing risk for European banks.

28 OECD JOURNAL: FINANCIAL MARKET TRENDS – VOLUME 2010 ISSUE 1 © OECD 2010
9 Schuknecht, von Hagen, and Wolswijk (2010) suggest sovereign bond yield spreads can largely be explained on
the basis of changes in economic fundamentals principles. They argue that markets penalise fiscal
imbalances much more strongly only after September 2008, with this shift accounting for much of the
spread increase for EU country government bonds relative to German or US treasury benchmarks until
May 2009.
10 In this context, note that exiting from bank bond guarantee programmes should also be facilitated by ongoing
efforts to strengthen the resilience of alternatives to issuing unsecured bank bonds. For example, there
are efforts to strengthen deposit insurance arrangements as well as to promote a recovery in securitized
funding by improving disclosure, standardization and simplification of structures. Also, there are
initiatives aimed at reducing the risks associated with custodian banks, increasing the use of central
counterparties and standardization and automation of settlement arrangements with a view to improving
the infrastructure for interbank and repo markets. The results of such efforts will not be available
quickly, however.
11 For France, no information is available for individual issuers of guaranteed bonds, as the SFEF Agency issues on
behalf of banks, under anonymity. If one looks at the Annual Report on 2009 for the three largest French
banks, only BNP discloses that in 2009 it issued €11 billion of guaranteed bonds (which compares with a
total issuance by SFEF close to 75 billion).
12 The Staff Working Document published on 18 May 2010 by the DG Competition of the EU Commission (see EU
Commission, 2010) provides the operational details: in particular, the approval of the extension of a
guarantee scheme beyond 30 June 2010 requires the fee for a government guarantee to be higher than
under the pricing formula recommended by the ECB in October 2008 at least by 20 basis points for
banks with a rating of A+ or A, by 30 basis points for banks rated A, and by 40 basis points for banks
rated below A- or without rating. Also, guarantee schemes to be prolonged beyond 30 June 2010 should
include a threshold concerning the ratio of total guaranteed liabilities outstanding over total liabilities of
a bank and the absolute amount of guaranteed liabilities which, if exceeded, triggers the requirement of a
viability review by the Commission.
13 “In this respect, a coordinated strategy should be based on facilitating adequate incentives to return to a
competitive market. […] The timing of exit should take into account a broad range of elements,
including macro-economic and financial sector stability, the functioning of credit channels, a systemic
risk assessment and the pace of natural phasing out by banks. […] Depending on individual Member
State's circumstances, the phasing out of support should start with government guarantees. Action to
phase out guarantee schemes would incentivise the exit of sound banks and give other banks incentives
to address their weaknesses.”
14 These concerns are also acknowledged and addressed by efforts at the national level. For example, one country’s
CMF delegation reported that in that country already now “banks which show a significant proportion of
guaranteed bonds in relation to overall liabilities are almost all subject to restructuring plans”.

OECD JOURNAL: FINANCIAL MARKET TRENDS – VOLUME 2010 ISSUE 1 © OECD 2010 29
REFERENCES
Acharya, V and R Sundaram (2008), “The other part of the bailout: pricing and evaluating the US and
UK loan guarantees”, VoxEU.org, 26 October.
BIS (2010), Annual Report, June.
ECB (2010), “Measures Taken By Euro Area Governments In Support Of The Financial Sector”,
Monthly Bulletin, April, pages 75-90.
Ecofin (2010), Press release of the 3015th Council of Economic and Financial Affairs, Brussels, 18 May.
EU Commission (2010), “The Application Of State Aid Rules To Government Guarantee Schemes
Covering Bank Debt To Be Issued After 30 June 2010”, DG Competition Staff Working
Document, 18 May.
FitchRatings (2010), Presentation at the Global Banking Conference, Paris, 16 June.
Gerlach, P. (2010), “The dependence of the financial system on central bank and government support”,
BIS Quarterly Review, March.
IMF (2009), Global Financial Stability Report, October, Washington, D.C.
IMF (2010a), Exiting from Crisis Intervention Policies, Prepared by the Fiscal Affairs, Monetary and
Capital Markets, and Research Departments, Approved by Olivier J. Blanchard, Carlo Cottarelli,
and José Viñals, 4 February.
IMF (2010b), Global Financial Stability Report, April, Washington, D.C.
Levy, A. and F. Panetta (2009), “Government Guarantees on Bank Funding: Should we Extend them into
2010 Despite the Improved Bank Profitability and the Schemes’ Distortionary Effects?”,
VoxEU.org, 3 November (available at http://www.voxeu.org/index.php?q=node/4156 ).
Levy, A. and A. Zaghini (2010), “The Pricing of Government-Guaranteed Bank Bonds”, Banca d’Italia
Working Paper n. 753, March.
Minegishi, M. and B. Cournède (2010), “Monetary Policy Responses to the Crisis and Exit Strategies”,
OECD Economics Department Working Papers No. 753, February.
Panetta, F., T. Faeh, G. Grande, C. Ho, M. King, A. Levy, F.M. Signoretti, M. Taboga, and A. Zaghini
(2009), “An Assessment of Financial Sector Rescue Programmes”, BIS Paper No. 48, July
(available at http://www.bis.org/publ/bppdf/bispap48.htm).
Royal Bank of Scotland (2009), Overview on Guarantee Schemes, Fourth Edition, 3 April.
Royal Bank of Scotland (2010), Supras and Non-US Agencies Funding Update, 8 February.

30 OECD JOURNAL: FINANCIAL MARKET TRENDS – VOLUME 2010 ISSUE 1 © OECD 2010
Schich, S. (2009), “Expanded Guarantees for Banks: Benefits, Costs and Exit Issues”, OECD Journal:
Financial Market Trends Vol. 2009/2, November 2009 (available at
http://www.oecd.org/dataoecd/53/48/44260489.pdf ).
Schuknecht, L., J.v. Hagen, and G. Wolswijk (2010), “Government Bond Risk Premiums in the EU
Revisited: the Impact of the Financial Crisis”, ECB Working Paper No 1151, February (available
at http://www.ecb.europa.eu/pub/pdf/scpwps/ecbwp1152.pdf ).
Schwartz, C. (2010), “The Australian Government Guarantee Scheme”, Reserve Bank of Australia
Bulletin, March Quarter 2010.
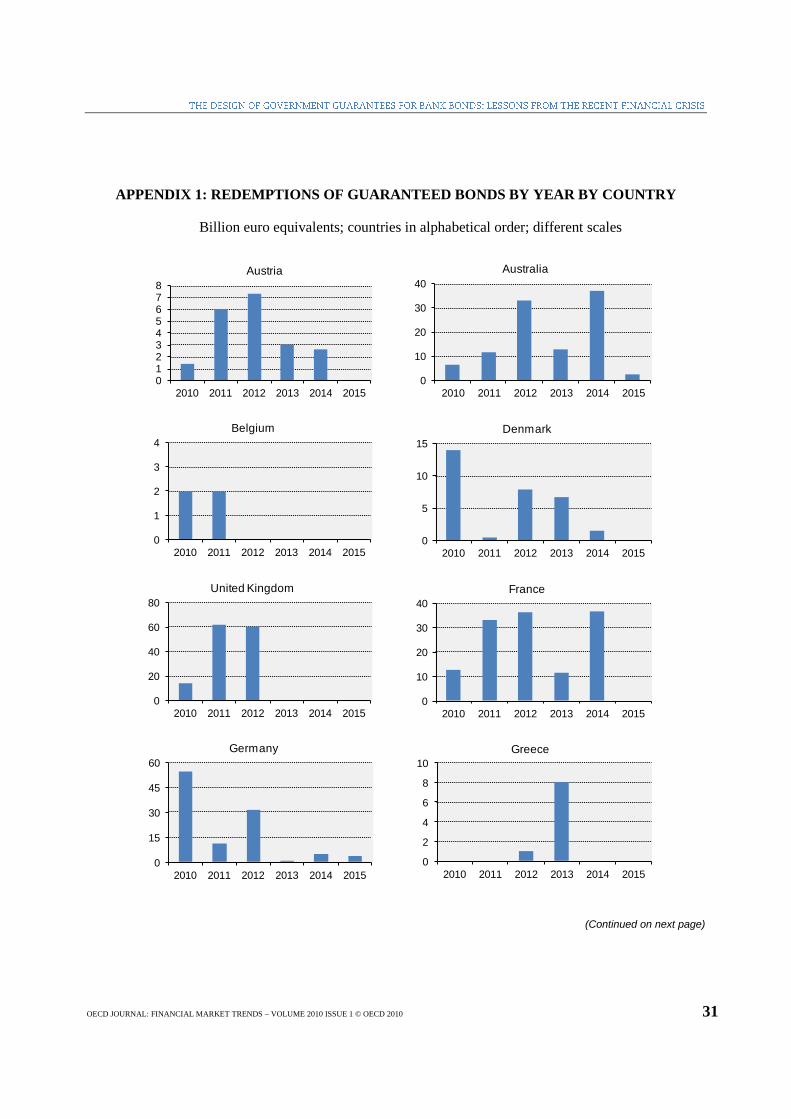
OECD JOURNAL: FINANCIAL MARKET TRENDS – VOLUME 2010 ISSUE 1 © OECD 2010 31
APPENDIX 1: REDEMPTIONS OF GUARANTEED BONDS BY YEAR BY COUNTRY
Billion euro equivalents; countries in alphabetical order; different scales
012345678
2010 2011 2012 2013 2014 2015
Austria
0
10
20
30
40
2010 2011 2012 2013 2014 2015
Australia
0
1
2
3
4
2010 2011 2012 2013 2014 2015
Belgium
0
5
10
15
2010 2011 2012 2013 2014 2015
Denmark
0
20
40
60
80
2010 2011 2012 2013 2014 2015
United Kingdom
0
10
20
30
40
2010 2011 2012 2013 2014 2015
France
0
15
30
45
60
2010 2011 2012 2013 2014 2015
Germany
0
2
4
6
8
10
2010 2011 2012 2013 2014 2015
Greece
(Continued on next page)

32 OECD JOURNAL: FINANCIAL MARKET TRENDS – VOLUME 2010 ISSUE 1 © OECD 2010
0
10
20
30
40
2010 2011 2012 2013 2014 2015
Ireland
0.0
0.5
1.0
1.5
2.0
2010 2011 2012 2013 2014 2015
Luxembourg
0
5
10
15
20
2010 2011 2012 2013 2014 2015
Netherlands
0
1
2
3
4
2010 2011 2012 2013 2014 2015
New Zealand
0
1
2
3
4
2010 2011 2012 2013 2014 2015
Portugal
0.0
0.3
0.5
0.8
1.0
2010 2011 2012 2013 2014 2015
South Korea
0
10
20
30
40
2010 2011 2012 2013 2014 2015
Spain
0
3
5
8
10
2010 2011 2012 2013 2014 2015
Sweden
0
30
60
90
120
150
2010 2011 2012 2013 2014 2015
USA
Source: Estimates by OECD Secretariat and Banca d’Italia based on Dealogic.