Seasonal and spatial variation in biochemical composition...
14
Botanica Marina 2015; aop a Research presented at the 4th Nordic Seaweed Conference, Grenaa, Denmark, October 8–9, 2014. *Corresponding author: Eva Albers, Department of Biology and Biological Engineering-Industrial Biotechnology, Chalmers University of Technology, SE-412 96 Gothenburg, Sweden, e-mail: [email protected]. http://orcid.org/0000-0002-1921-3415 Jenny Veide Vilg, Tony Werner and Joshua J. Mayers: Department of Biology and Biological Engineering-Industrial Biotechnology, Chalmers University of Technology, SE-412 96 Gothenburg, Sweden Göran M. Nylund and Henrik Pavia: Department of Marine Sciences – Tjärnö, University of Gothenburg, SE-452 96 Strömstad, Sweden Linnea Qvirist: Department of Biology and Biological Engineering- Industrial Biotechnology, Chalmers University of Technology, SE-412 96 Gothenburg, Sweden; and Department of Biology and Biological Engineering-Food and Nutrition Science, Chalmers University of Technology, SE-412 96 Gothenburg, Sweden Ingrid Undeland: Department of Biology and Biological Engineering- Food and Nutrition Science, Chalmers University of Technology, SE-412 96 Gothenburg, Sweden Jenny Veide Vilg, Göran M. Nylund, Tony Werner, Linnea Qvirist, Joshua J. Mayers, Henrik Pavia, Ingrid Undeland and Eva Albers* Seasonal and spatial variation in biochemical composition of Saccharina latissima during a potential harvesting season for Western Sweden a DOI 10.1515/bot-2015-0034 Received 31 May, 2015; accepted 29 September, 2015 Abstract: This study monitored the biomass composi- tion of Saccharina latissima during a potential harvesting season on the West coast of Sweden, in order to find suit- able harvest times for biorefinery purposes. Specimens of S. latissima were sampled at three locations in June, August and October and the biomass was analysed for its macromolecular composition, as well as for the content of several specific compounds, e.g. sugars and fatty acids. PERMANOVA analyses showed that there was a signifi- cant difference in the biomass composition among time points. The total carbohydrate concentration was lowest in June and peaked at 360 mg g -1 dry weight in August, while the mannitol content was highest, 90 mg g -1 , in June and decreased throughout the sampling period. Total protein and fatty acid concentrations were found to be approximately 80 and 3 mg g -1 , respectively, with relatively little variation over time. Overall, there was little spatial variation in the macromolecular composition, although the concentration of some specific monosaccharides and fatty acids, as well as the total phenolic content, differed among localities. We discuss the implications of the observed variation in biomass composition of S. latissima for future biorefinery purposes. Keywords: biomass composition; Saccharina; seasonal variation; seaweed. Introduction Cultivation and utilization of marine seaweed biomass is still occurring at a relatively small scale in most parts of the world and represents a largely underexploited resource with great potential in a future, biobased society. Today, cultivation is largely restricted to Asia and, in 2012, this region accounted for more than 96% of the 23.8 million tons of seaweed produced worldwide (FAO 2014). The present use of seaweeds includes human foods (e.g. hydrocolloid ingredients), animal feed, fertilizers and cosmetics, of which food products and extraction of hydrocolloids are the most important (Bartsch et al. 2008, Buchholz et al. 2012). In addition, seaweeds are a potential source of new compounds with pharmaceutical applica- tions, such as antiviral, antibiotic, antitumor, anticancer or anti-inflammatory compounds (Holdt and Kraan 2011). Stimulated by the global demand for new sources of biomass, there is a growing interest in expanding seaweed cultivation in Europe. Seaweeds can have high growth rates, with pilot cultivation in Scottish waters suggest- ing that annual yields of the kelp Saccharina latissima (Linnaeus) C.E. Lane, C. Mayes, Druehl et G.W. Saunders (formerly Laminaria saccharina, Lane et al. 2006) can reach 100–200 ton wet weight ha -1 (Hughes et al. 2012, Sanderson et al. 2012). Kelp species, such as S. latissima, typically contain high amounts of carbohydrates, which can undergo pronounced seasonal fluctuations (Holdt and Kraan 2011). Alginate, a structural component of the cell wall and intracellular matrix is the most abundant carbohy- drate and can account for up to 40% dry weight (dw) in some species (Horn et al. 1999), with the highest content Brought to you by | Chalmers University of Technology Authenticated | [email protected] author's copy Download Date | 11/9/15 8:41 AM
Transcript of Seasonal and spatial variation in biochemical composition...

Botanica Marina 2015; aop
aResearch presented at the 4th Nordic Seaweed Conference, Grenaa, Denmark, October 8–9, 2014. *Corresponding author: Eva Albers, Department of Biology and Biological Engineering-Industrial Biotechnology, Chalmers University of Technology, SE-412 96 Gothenburg, Sweden, e-mail: [email protected]. http://orcid.org/0000-0002-1921-3415Jenny Veide Vilg, Tony Werner and Joshua J. Mayers: Department of Biology and Biological Engineering-Industrial Biotechnology, Chalmers University of Technology, SE-412 96 Gothenburg, SwedenGöran M. Nylund and Henrik Pavia: Department of Marine Sciences – Tjärnö, University of Gothenburg, SE-452 96 Strömstad, SwedenLinnea Qvirist: Department of Biology and Biological Engineering-Industrial Biotechnology, Chalmers University of Technology, SE-412 96 Gothenburg, Sweden; and Department of Biology and Biological Engineering-Food and Nutrition Science, Chalmers University of Technology, SE-412 96 Gothenburg, SwedenIngrid Undeland: Department of Biology and Biological Engineering-Food and Nutrition Science, Chalmers University of Technology, SE-412 96 Gothenburg, Sweden
Jenny Veide Vilg, Göran M. Nylund, Tony Werner, Linnea Qvirist, Joshua J. Mayers, Henrik Pavia, Ingrid Undeland and Eva Albers*
Seasonal and spatial variation in biochemical composition of Saccharina latissima during a potential harvesting season for Western Swedena
DOI 10.1515/bot-2015-0034Received 31 May, 2015; accepted 29 September, 2015
Abstract: This study monitored the biomass composi-tion of Saccharina latissima during a potential harvesting season on the West coast of Sweden, in order to find suit-able harvest times for biorefinery purposes. Specimens of S. latissima were sampled at three locations in June, August and October and the biomass was analysed for its macromolecular composition, as well as for the content of several specific compounds, e.g. sugars and fatty acids. PERMANOVA analyses showed that there was a signifi-cant difference in the biomass composition among time points. The total carbohydrate concentration was lowest in June and peaked at 360 mg g-1 dry weight in August, while the mannitol content was highest, 90 mg g-1, in June and decreased throughout the sampling period. Total protein and fatty acid concentrations were found to be approximately 80 and 3 mg g-1, respectively, with relatively little variation over time. Overall, there was little spatial variation in the macromolecular composition, although the concentration of some specific monosaccharides and fatty acids, as well as the total phenolic content, differed
among localities. We discuss the implications of the observed variation in biomass composition of S. latissima for future biorefinery purposes.
Keywords: biomass composition; Saccharina; seasonal variation; seaweed.
IntroductionCultivation and utilization of marine seaweed biomass is still occurring at a relatively small scale in most parts of the world and represents a largely underexploited resource with great potential in a future, biobased society. Today, cultivation is largely restricted to Asia and, in 2012, this region accounted for more than 96% of the 23.8 million tons of seaweed produced worldwide (FAO 2014). The present use of seaweeds includes human foods (e.g. hydrocolloid ingredients), animal feed, fertilizers and cosmetics, of which food products and extraction of hydrocolloids are the most important (Bartsch et al. 2008, Buchholz et al. 2012). In addition, seaweeds are a potential source of new compounds with pharmaceutical applica-tions, such as antiviral, antibiotic, antitumor, anticancer or anti-inflammatory compounds (Holdt and Kraan 2011).
Stimulated by the global demand for new sources of biomass, there is a growing interest in expanding seaweed cultivation in Europe. Seaweeds can have high growth rates, with pilot cultivation in Scottish waters suggest-ing that annual yields of the kelp Saccharina latissima (Linnaeus) C.E. Lane, C. Mayes, Druehl et G.W. Saunders (formerly Laminaria saccharina, Lane et al. 2006) can reach 100–200 ton wet weight ha-1 (Hughes et al. 2012, Sanderson et al. 2012).
Kelp species, such as S. latissima, typically contain high amounts of carbohydrates, which can undergo pronounced seasonal fluctuations (Holdt and Kraan 2011). Alginate, a structural component of the cell wall and intracellular matrix is the most abundant carbohy-drate and can account for up to 40% dry weight (dw) in some species (Horn et al. 1999), with the highest content
Brought to you by | Chalmers University of TechnologyAuthenticated | [email protected] author's copy
Download Date | 11/9/15 8:41 AM

2 J. Veide Vilg et al.: Biochemical composition variation in S. latissima
reported in early spring and the lowest in autumn (Black 1950, Schiener et al. 2015). Structural cellulose has been reported at concentrations of around 10% dw with only minor seasonal variations (Schiener et al. 2015). On the other hand, the levels of the storage carbohydrates lami-narin and mannitol in Laminaria sp. varies considerably between 5–32 and 2–25% dw, respectively, with lowest levels reported in winter/spring (Black 1950, Adams et al. 2011, Schiener et al. 2015).
Other components of kelp biomass also display seasonal variations. Ash content in Laminaria digitata (Hudson) J.V. Lamouroux and S. latissima can reach up to 32% dw during the winter months, but is consider-ably lower in the summer (Adams et al. 2011, Schiener et al. 2015). A similar pattern is found for proteins, with concentrations around 10% dw in winter and 6% dw in summer (Schiener et al. 2015). Lipid content in kelp is also low, ranging from < 1 to 4.5% dw, with the fatty acids (FA) being predominantly unsaturated (Holdt and Kraan 2011, Miyashita et al. 2013). According to Haug and Jensen (1954), the lipid content in L. digitata and S. latissima reaches the maximum concentration during the winter.
Other characteristic components of brown algae are the polyphenolic compounds, phlorotannins, and the oxygenated carotenoid, fucoxanthin. Due to their antioxi-dative activity, phlorotannins are interesting for industrial applications as additives in functional foods, cosmetics and pharmaceuticals (Li et al. 2009). Fucoxanthin has received significant attention for its remarkable biologi-cal properties, in particular in relation to human health, owing to the unusual allenic bond structure and oxygenic functional groups (Peng et al. 2011). Several extrinsic factors are known to affect the concentration of phloro-tannins and fucoxanthin in brown algae, including UV-B radiation, irradiance, nutrient availability and herbivory (Pavia et al. 1997, Pavia and Toth 2000), contributing to seasonal variations in concentration (Schiener et al. 2015).
Given the significant variation in the chemical com-position of kelp species among seasons and localities, it is important to have area-specific knowledge about seasonal variation in biomass composition if algal com-pounds are to be industrially exploited. In this study, we investigate seasonal and spatial variation of the biochemi-cal composition of S. latissima during a potential harvest-ing season for Western Sweden. Seasonal fluctuations in the biochemical composition of S. latissima need to be considered to optimize the time of harvest, depending on what components are of highest importance or value. This study is part of a larger initiative with the goals of estab-lishing fundamental knowledge for optimal cultivation of kelp biomass in Swedish waters, and to evaluate the
potential to biorefine seaweed biomass into food, feed, biobased materials and bioenergy.
Materials and methods
Harvesting of seaweed and sample preparation
Samples of Saccharina latissima (Linnaeus) C.E.Lane, C.Mayes, Druehl et G.W.Saunders were harvested by SCUBA diving from three localities during June–October 2012 in the archipelago of Bohuslän, on the Swedish west coast (Figure 1). The localities were Vattenholmen (VH, 58.8750° N, 11.1048° E), Ulvillarna (UL, 58.8233° N, 11.0695° E) and Ursholmen (UR, 58.8354° N, 10.9903° E). Samples were taken from a depth of approximately 2–3 m and temporarily stored at -20°C within 8 h of collection. After the last collection date, the blades (with stipes removed) were individually ground in a mortar with liquid nitrogen and subsequently stored at -20°C or -80°C. The algae were freeze-dried and ground into a fine powder with a mortar and stored again at -20 or -80°C before analytical work was done, for which exact weights were recorded for each test. Biomass pre-stored at -80°C was used for analysis of fatty acids (FA), polyphenols and pig-ments; all other analytical methods were done on material stored at -20°C. Freeze-dried biomass was noted to have absorbed moisture during storage (i.e. was highly hydro-scopic) and thus the moisture content of the freeze-dried material was determined to allow correction of sample weights. Seaweed biomass stored at -80°C had a dry weight of 930–950 mg g-1 and material stored at -20°C had a dry weight of 890–940 mg g-1 (Supplemental Table S1).
Moisture and ash content analyses
The moisture content of homogenized wet biomass was determined on 1.4–5 g of material that was dried at 105°C for 19 h. The moisture content of dry biomass was meas-ured on approximately 110 mg of material in a mois-ture balance (HA 300, Precisa, Dietikon, Switzerland). For ash content determination, 70–85 mg dry biomass were dried again at 105°C overnight. After determining the weight, the samples were combusted in a furnace at 550°C for 3 h. The oven was cooled to about 300°C before the samples were transferred to a desiccator and cooled at room temperature for at least 2 h before weighing.
Brought to you by | Chalmers University of TechnologyAuthenticated | [email protected] author's copy
Download Date | 11/9/15 8:41 AM

J. Veide Vilg et al.: Biochemical composition variation in S. latissima 3
Carbohydrate extraction and analyses
A two-step hydrolysis was performed for the extraction of total monosaccharides, based on the method of Dallies et al. (1998). Dry biomass (performed in duplicate, with two amounts of biomass, aproximately 5 and 10 mg) was mixed with 0.75 ml of 72% H2SO4 and 0.25 mg glass beads (0.5 mm) and homogenized (Fastprep-24, MP Biomedicals, Santa Ana, CA, USA) for 8 × 40 s at 6.5 m s-1 (cooled on ice between runs). Samples were transferred to 10 ml glass cen-trifuge tubes and another 0.25 ml of 72% H2SO4 was added and incubated at room temperature for 3 h. After incuba-tion, tubes were placed on ice and 9 ml milliQ water added, yielding a concentration of approximately 1 mm H2SO4. A second incubation was performed for 4 h at 100°C. Tubes were cooled to room temperature before filtration (0.2 μm pore size, nylon filters) and storage at -20°C until analysis. Quantification of monosaccharides was performed using high-performance anion exchange chromatography (Xiros and Olsson 2014), using external standards curves for glucose, galactose, xylose, mannose, and fucose between 0.1 and 100 mg l-1 (Sigma-Aldrich, St. Louis, MO, USA).
Mannitol was extracted according to the CuSO4 method of Obluchinskaya (2008) but scaled down ten times, thus using approximately 300 mg of dry biomass. Solubilized mannitol was detected by HPLC (Koppram et al. 2012) using an external mannitol standard curve between 0.3 and 10 g l-1 (Fluka Analytical, Buchs, Switzerland). Lami-narin was extracted from 15–17 mg of dry biomass and hydrolysed by boiling in 2.5 ml of 0.5 m H2SO4 for 5 h (Iwao et al. 2008). Samples were neutralized using 5 m NaOH and centrifuged at 5000 g for 15 min. Released glucose was quantified using a commercial enzymatic assay kit (R-Biopharm GmbH, Darmstadt, Germany).
Fatty acid extraction and analysis
The lipids were extracted and fatty acids (FA) transes-terificated using the “in house two-step transesterifica-tion with KOH” of Cavonius et al. (2014). Approximately 400 mg of dry biomass, 50 μl of C17:0 internal standard (1.02 g l-1 in toluene), and in the extraction, 0.5% pyro-gallol as antioxidant and 1 g of KOH pellets were used.
Figure 1: Location of seaweed sampling sites Vattenholmen (VH), Ulvillarna (UL) and Ursholmen (UR) on the Swedish west coast (59° N, 11° E). Map data: Google, DigitalGlobe.
Brought to you by | Chalmers University of TechnologyAuthenticated | [email protected] author's copy
Download Date | 11/9/15 8:41 AM

4 J. Veide Vilg et al.: Biochemical composition variation in S. latissima
After separation of the organic phase, the remaining aqueous phase was washed once (2 ml of toluene) and the organic extracts were pooled. For analysis of methyl-ated FA (FAME), 1 ml of the organic phase was evaporated under N2 atmosphere and then re-suspended in 0.5 ml of iso-octane (2,2,4- trimethylpentane) and measured by GC (HP, 5890, Agilent, Santa Clara, CA, USA), with a polar column (Agilent J&W DB®-WAX), oven temp at 100–250°C, injector at 250°C, He & H2 (50/50) as carrier-gas with flame ionization detection at 275°C. Quantification was done by relating peak areas of individual FA to the internal stand-ard (heptadeconoic acid, C17:0, Sigma-Aldrich).
Protein extraction and analysis
Protein was extracted from dry biomass and quantified according to Lowry et al. (1951). Approximately 25 mg of samples in 500 μl of denaturation solution (2% sodium dodecyl sulfate, 1 mm dithiothreitol) and 0.2 g of 0.5-mm glass beads were homogenized (Fastprep-24, MP Biomedi-cals) 8 times for 40 s at 6.5 m s-1 (cooled on ice between runs). The suspensions were boiled 3 times for 5 min with vortexing in between. The tubes were centrifuged for 20 min at 12,000 g and 4°C and the supernatant (protein extracts) were stored at -20°C for later analysis. For the Lowry analysis the DC™ protein assay (BioRad, Hercules, CA, USA) was used, with 0–1.35 g l-1 bovine serum albumin in denaturation buffer as standards and the modified reagent A′ (20 μl reagent S+1 ml reagent A). Absorbance at 750 nm was measured in a microplate reader (FLUOstar Omega, BMG LABTECH, Ortenberg, Germany).
Acetone extraction and analyses of phenolic compounds and pigments
For the acetone extraction, approximately 0.25 g of dry biomass was suspended in 0.75 ml of milliQ water and homogenized (FastPrep-24, MP Biomedicals) 8 times with 0.2 g glass beads (0.5 mm) at speed of 6.5 m s-1 for 40 s. Subsequently, 0.75 ml milliQ water and 3.5 ml acetone were added to create a 70:30 acetone:water ratio for the extraction. The samples were incubated in a rotating wheel overnight at room temperature and centrifuged at 3000 g for 5 min. The supernatants were transferred to glass vials and stored at -80°C until analysis of phenolics and pigments.
Phenolic compounds were analysed by the Folin-Ciocalteu method using phloroglucinol (the monomer of brown algal polyphenolics, i.e. phlorotannins) at
20–100 mg l-1 for the standard curve. For analysis, 100 μl of sample or standard was mixed with 50 μl of 10% Folin-Ciocalteu reagent (Sigma-Aldrich) and 50 μl of 7.5% NaHCO3 directly in a microplate well. The absorbance at 765 nm was determined in a plate reader (Safire2, Tecan, Männedorf, Switzerland) with three measuring cycles with 5-s shaking steps between measurements.
Pigment quantification was conducted according to the following equations for chlorophyll a and c (Jeffrey and Humphrey 1975) and for total carotenoids (Parsons et al. 1984):
= 664 630( ) (Chl 11.43·A - 0.40·A )a
= +664 630Chl -3.80·A 24.88·( A( ) )c
= 480 510(Total carotenoids 7·A - 1.49·A) ( )
Absorbance was measured at 480, 510, 630 and 664 nm using a 1-cm quartz cuvette (DU800 spectropho-tometer, Beckman Coulter, Brea, CA, USA) and blanked against 70% acetone in deionized water. Samples with absorbances above 0.9 were diluted in 70% acetone. The absorbance maxima for these pigments were not found to differ significantly when using 70% acetone compared to 90% acetone (for which the equations were originally derived) and it was decided that these equations were suitable for quantification.
Statistical analysis
For statistical analysis, the chemical composition of Saccharina latissima was divided into three groups, which were analyzed separately. The groups were: (1) major chemical compound groups consisting of ash, water content and total levels of proteins, carbohydrates, carot-enoids and phenolics; (2) sugar composition consisting of laminarin, mannitol, fucose, galactose, glucose, mannose and xylose; (3) 13 different fatty acids (5 further FA were analyzed, but excluded from the statistical analysis due to highly sporadic occurrence). In addition to individual FA, two separate analyses were also performed for total fatty acids (TFA), and saturated (SFA), monounsaturated (MUFA) and polyunsaturated fatty acids (PUFA). TFA was analyzed separately since it was not possible to analyze this group together with the other major compound groups due to unbalanced sampling. Seasonal and spatial variation in these compound groups was analyzed using permutational multivariate analysis of variance (PER-MANOVA; Primer-E, Ivybridge, UK) (Anderson 2001). As
Brought to you by | Chalmers University of TechnologyAuthenticated | [email protected] author's copy
Download Date | 11/9/15 8:41 AM

J. Veide Vilg et al.: Biochemical composition variation in S. latissima 5
data was obtained from only one locality (VH) in October, two separate PERMANOVA analyses were conducted: 1-factor PERMANOVA (factor season, fixed) for data from VH for all seasons and 2-factor PERMANOVA (factor season, fixed, and factor locality, random) for June and August for all localities. Significant factors were further analyzed using PERMANOVA pairwise comparisons and Monte Carlo (MC) tests were included to obtain more reli-able p-values in cases with few possible permutations (Anderson et al. 2008). Tests were carried out using 9999 unrestricted permutations. The analyses were accompa-nied with PERMDISP to determine possible reasons for the rejection of the null hypotheses as PERMANOVA can be sensitive to sample dispersion (Anderson et al. 2006). Similarities among samples and importance of individ-ual chemical compounds were visualized and evaluated using a canonical analysis of principal coordinates (CAP) (Anderson and Willis 2003), a constrained ordination method. PERMANOVA and CAP analyses were based on Euclidian distance measures, using unit variance scaled data.
ResultsThe composition (i.e. macromolecules along with poly-phenols, pigments, individual sugars, and FA) of Sac-charina latissima was investigated for individual blades harvested at three different dates and three locations (VH, UL and UR) during the period June–October 2012 and is reported in the following section.
Content of macromolcules and possible high-value products in S. latissima
The content of macromolecules, representing the main biochemical groups (carbohydrates, proteins, FA and ash) and possible high-value products (phenolic compounds and pigments) is presented in Table 1.
Carbohydrates (calculated as the sum of total mono-saccharides and mannitol) were the major constituent of the biomass, ranging from 200 to 440 mg g-1 dw. Ash, representing minerals and metal ions also constituted a major portion of the biomass (140–320 mg g-1 dw). The content of total proteins was rather low in these samples, ranging from 30 to 110 mg g-1 dw, whereas mean values of total FA were also low and varied from 1.7 to 3.9 mg g-1 dw for all samples (Table 1). The phenolic compounds were found in the range 4.3–11.9 mg g-1 dw.
The pigments, chlorophyll a and c, and total carot-enoids were found at concentrations of 0.12–0.58, 0.07–0.38, and 0.10–0.45 mg g-1 dw, respectively. Since, the main carotenoid in brown algae, such as S. latissima, is fucoxanthin (Haugan and Liaaenjensen 1994, Andersen et al. 2013), which is a potential high-value product, only the total carotenoid data were used in the statistical analy-sis described below. FA were also excluded from the main PERMANOVA analysis since these were only determined for half of the samples and instead included in the cor-responding analysis on the FA profiles described below.
PERMANOVA showed that there was a significant difference (p = 0.0021–0.0321) in the composition of the major chemical compound groups in S. latissima between all seasons at VH (Supplemental Table S2). The
Table 1: Water content of wet biomass (mg g-1 wet weight, mean±SD, n = 6) and cellular content of freeze-dried biomass (mg g-1 dw biomass, mean±SD, n = 6) of Saccharina latissima harvested at three locations between June and October, 2012.
Vattenholmen Ulvillarna Ursholmen
5 June 8 August 23 October 5 June 8 August 5 June 8 August
Water content (mg g-1 wet weight) 780±50 640±100 640±50 750±30 700±30 680±60 700±10Ash (mg g-1 dw) 210±30 140±30 200±20 330±20 180±30 270±20 200±20Total carbohydratesa (mg g-1 dw) 310±50 440±80 380±40 200±40 380±60 260±40 350±40Total proteins (mg g-1 dw) 80±30 110±40 80±40 30±10 90±10 60±20 90±30Total fatty acidsb (mg g-1 dw) 2.8±0.3 1.7±0.5 3.9±1.8 2.5±0.3 2.5±0.6 2.1±0.6 2.8±0.2Phenolicsc (mg g-1 dw) 11.9±3.8 8.1±2.0 8.2±1.6 8.3±0.7 4.8±1.2 10.5±2.2 4.3±1.4Total carotenoidsc (mg g-1 dw) 0.10±0.01 0.25±0.13 0.39±0.17 0.45±0.1 0.27±0.1 0.26±0.04 0.24±0.04Chlorophyll ac (mg g-1 dw) 0.12±0.03 0.32±0.18 0.37±0.24 0.58±0.1 0.37±0.1 0.29±0.07 0.34±0.06Chlorophyll cc (mg g-1 dw) 0.07±0.03 0.15±0.08 0.19±0.14 0.38±0.1 0.25±0.1 0.22±0.09 0.20±0.07
aTotal carbohydrates were calculated as the sum of mannitol and monosaccharides (weights were adjusted for loss of water when polymer-ized into polysaccharides).bn = 3 for total fatty acid determination.cPhenolic compounds and pigments were in 70% acetone extracts.
Brought to you by | Chalmers University of TechnologyAuthenticated | [email protected] author's copy
Download Date | 11/9/15 8:41 AM
6 J. Veide Vilg et al.: Biochemical composition variation in S. latissima
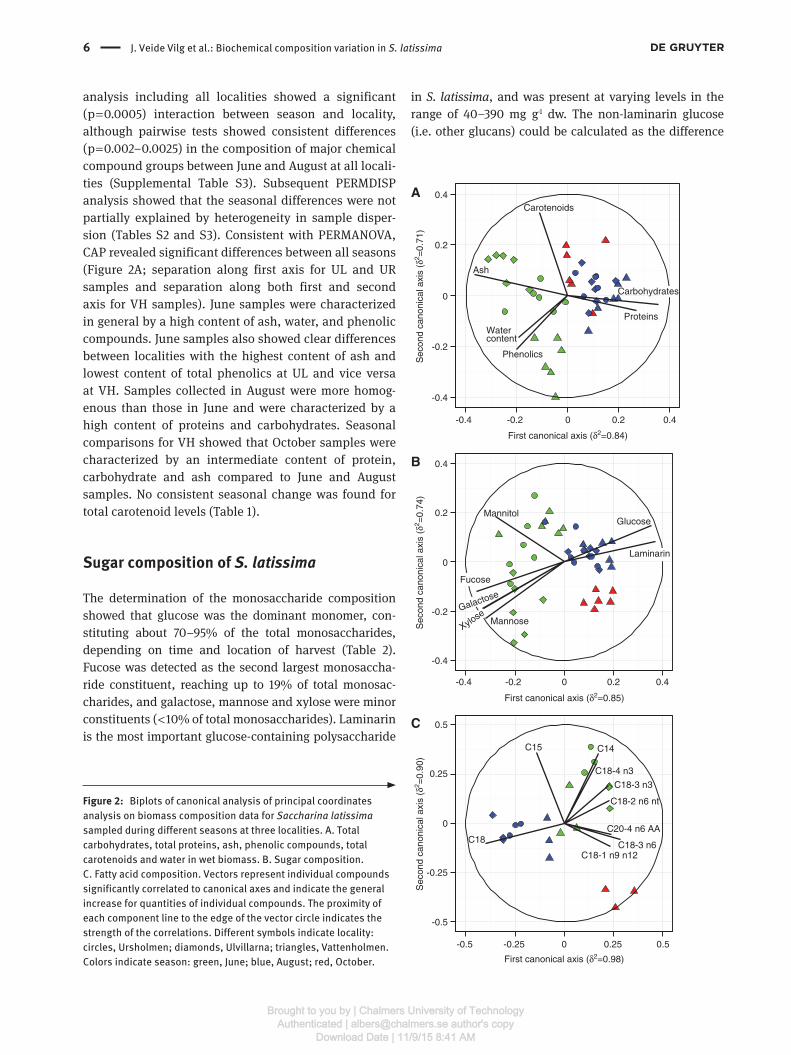
analysis including all localities showed a significant (p = 0.0005) interaction between season and locality, although pairwise tests showed consistent differences (p = 0.002–0.0025) in the composition of major chemical compound groups between June and August at all locali-ties (Supplemental Table S3). Subsequent PERMDISP analysis showed that the seasonal differences were not partially explained by heterogeneity in sample disper-sion (Tables S2 and S3). Consistent with PERMANOVA, CAP revealed significant differences between all seasons (Figure 2A; separation along first axis for UL and UR samples and separation along both first and second axis for VH samples). June samples were characterized in general by a high content of ash, water, and phenolic compounds. June samples also showed clear differences between localities with the highest content of ash and lowest content of total phenolics at UL and vice versa at VH. Samples collected in August were more homog-enous than those in June and were characterized by a high content of proteins and carbohydrates. Seasonal comparisons for VH showed that October samples were characterized by an intermediate content of protein, carbohydrate and ash compared to June and August samples. No consistent seasonal change was found for total carotenoid levels (Table 1).
Sugar composition of S. latissima
The determination of the monosaccharide composition showed that glucose was the dominant monomer, con-stituting about 70–95% of the total monosaccharides, depending on time and location of harvest (Table 2). Fucose was detected as the second largest monosaccha-ride constituent, reaching up to 19% of total monosac-charides, and galactose, mannose and xylose were minor constituents ( < 10% of total monosaccharides). Laminarin is the most important glucose-containing polysaccharide
Phenolics
Water content
Ash
Carotenoids
Proteins
0
0
0.2 0.4-0.2-0.4
0.2
-0.2
0.4
-0.4
Sec
ond
cano
nica
l axi
s (δ
2 =0.
71)
A
Carbohydrates
Sec
ond
cano
nica
l axi
s (δ
2 =0.
74)
GlucoseMannitol
0
0
0.2 0.4-0.2-0.4
0.2
-0.2
0.4
-0.4
Mannose
B
Laminarin
Fucose
Galactose
Xylose
C14
C18-4 n3
C18-3 n6
C15
C20-4 n6 AA
C18-1 n9 n12
C18
C18-3 n3
C18-2 n6 nt
First canonical axis (δ2=0.98)
First canonical axis (δ2=0.85)
First canonical axis (δ2=0.84)
Sec
ond
cano
nica
l axi
s (δ
2 =0.
90)
0 0.25 0.5-0.25-0.5
0
0.25
-0.25
0.5
-0.5
C
Figure 2: Biplots of canonical analysis of principal coordinates analysis on biomass composition data for Saccharina latissima sampled during different seasons at three localities. A. Total carbohydrates, total proteins, ash, phenolic compounds, total carotenoids and water in wet biomass. B. Sugar composition. C. Fatty acid composition. Vectors represent individual compounds significantly correlated to canonical axes and indicate the general increase for quantities of individual compounds. The proximity of each component line to the edge of the vector circle indicates the strength of the correlations. Different symbols indicate locality: circles, Ursholmen; diamonds, Ulvillarna; triangles, Vattenholmen. Colors indicate season: green, June; blue, August; red, October.
in S. latissima, and was present at varying levels in the range of 40–390 mg g-1 dw. The non-laminarin glucose (i.e. other glucans) could be calculated as the difference
Brought to you by | Chalmers University of TechnologyAuthenticated | [email protected] author's copy
Download Date | 11/9/15 8:41 AM

J. Veide Vilg et al.: Biochemical composition variation in S. latissima 7
between total glucose and the laminarin content (adjusted for loss of water during polymerization of polysaccha-rides). For most of the time points and locations there were no significant differences between the glucose and lami-narin contents, except for the locations UL and UR in June, for which the contents of other glucans were 46±6 mg g-1 dw for UL and 52±7 mg g-1 dw for UR (means±standard deviations). The sugar alcohol mannitol was in the range 46–97 mg g-1 dw.
PERMANOVA showed that there was a significant difference (p = 0.0013–0.0021) in the sugar composition of S. latissima between all seasons at VH (Supplemental Table S4). The analysis including all localities showed a significant interaction (p = 0.017) between season and locality, although pairwise tests showed consistent dif-ferences (p = 0.0023–0.0054) in the sugar composition between June and August at all localities (Supplemental Table S5). Subsequent PERMDISP analysis showed that the seasonal differences were not partially explained by heterogeneity in sample dispersion. Further analysis using CAP also showed significant differences between all seasons (Figure 2B; separation along first axis for UL and UR samples, and separation along both first and second axis for VH samples). June samples were charac-terized by high contents of fucose, galactose, mannitol, mannose and xylose. June samples also showed clear dif-ferences between localities with the highest content of, for example, mannitol at UR and VH, and the highest content of mannose at UL. Samples collected in August were in comparison more homogenous and were characterized by high contents of glucose and laminarin. Seasonal compar-isons for VH showed that October samples were character-ized by a low mannitol content and intermediate contents of glucose and laminarin, compared with June and August samples (Figure 2B).
Fatty acid composition of S. latissima
The distribution of FA showed that average levels of SFA and PUFA were higher than levels of MUFA (Table 3). Among the SFA, C16, palmitic acid largely dominated, with average values up to 25% of TFA. Levels of C14, myristic acid, were ranked second (7.8–11.3%), followed by C18, stearic acid (1.1–3.7%). Regarding MUFAs, C18:1 (oleic acid) dominated, with relative amounts up to 18%. C16:1 was ranked second (3.6–7.2%), followed by C20:1, which was only detected in August samples from UL and UR (1.15% and 1.02%, respectively). Among the PUFA detected, C18:2 n-6 (linoleic acid), C20:4 n-6 (arachidonic acid) and C20:5 n-3 (eicosapentaenoic acid, EPA) were found in relatively large quantities among all samples (6.9–9.7%, 7.8–11.8% and 6.3–9.1%, respectively). The n-3 FA docosahexaenoic acid (C22:6 n-3, DHA) was detected only in August samples from all three locations, but par-ticularly in UL and UR samples (8.0 and 8.5%, respec-tively). VH samples had significantly lower relative DHA levels (0.9%).
Using total FA data for June and August for all locali-ties in the statistical analysis resulted in a significant interaction (p = 0.0137) between season and locality, but pairwise tests on the interaction showed no differences between June and August at UL and UR (Supplemental Table S7). PERMANOVA showed that there was no signifi-cant differences in the TFA levels among seasons at VH (Supplemental Table S6). However, in contradiction to the analysis using data from VH for all seasons, the pair-wise tests showed a significant difference (p = 0.0196) in TFA levels between June and August samples. Subsequent PERMDISP analysis showed that the difference between June and August at VH was not partially explained by het-erogeneity in sample dispersion.
Table 2: Mannitol and laminarin content (mg g-1 dry weight, mean±SD, n = 6) and distribution of monosaccharides after a total hydrolysis of biomass (%, mean±SD, n = 6) of Saccharina latissima harvested at three locations between June and October, 2012.
Vattenholmen Ulvillarna Ursholmen
5 June 8 August 23 October 5 June 8 August 5 June 8 August
Mannitol (mg g-1 dw) 94±9 63±14 46±7 77±15 54±20 97±8 76±26Laminarina (mg g-1 dw) 160±50 390±90 270±70 40±30 300±70 70±50 230±40
Monosaccharide composition (% of total monosaccharides) Glucose 86±7 95±2 90±2 70±6 92±3 76±9 91±3 Fucose 9±5 3±1 5±1 19±4 5±2 16±6 6±2 Galactose 3.1±1.5 1.3±0.3 2.6±0.8 6.4±1.1 1.6±0.6 4.6±1.6 2.0±0.6 Mannose 0.9±0.5 0.4±0.1 0.9±0.3 2.5±0.5 0.6±0.1 1.5±0.6 0.6±0.2 Xylose 0.8±0.4 0.3±0.1 0.8±0.2 2.1±0.4 0.5±0.2 1.7±0.7 0.7±0.2
aWeight adjusted for loss of water during polymerization of the polysaccharide.
Brought to you by | Chalmers University of TechnologyAuthenticated | [email protected] author's copy
Download Date | 11/9/15 8:41 AM

8 J. Veide Vilg et al.: Biochemical composition variation in S. latissima
No seasonal differences in SFA, MUFA and PUFA content were found for S. latissima sampled from VH in June, August and October (Supplemental Table S8). Simi-larly, no seasonal differences were found when June and August samples from all localities were analyzed together (Supplemental Table S9).
PERMANOVA showed no significant differences in individual FA composition (only those detected at all loca-tions and time points were included) of S. latissima among seasons at VH (Supplemental Table S10). The analysis including all localities showed a significant interaction (p = 0.0019) between season and locality, and pairwise tests showed significant differences in individual FA com-position between June and August at UL and UR, but not at VH (Supplemental Table S11). Subsequent PERMDISP analysis showed that the seasonal differences observed for UL and UR were not partially explained by heterogene-ity in sample dispersion. Further analysis using CAP also showed significant differences between June and August for samples from UL and UR (Figure 2C; separation along both first and second axis), which is mainly attributed to the higher content of C14, C18:4 n3, C18:3 n3 and C18:2
n6 FA in June, and higher content of C18 FA in August. In addition, CAP analysis indicated that samples from VH in October were different from those in June and August for all localities, characterized by low content of C15 FA (Figure 2C).
DiscussionWe found considerable seasonal variations in several of the investigated chemical components of Saccharina latissima, which suggests different harvest times for cul-tivated algae on the Swedish west coast, depending on which components are of greatest interest.
The dominant component of S. latissima are carbohy-drates, for which the concentration changed significantly over time with highest levels up to 44.5% of the dry weight biomass in August, excluding alginates. Laminarin was the main contributor to the high carbohydrate concentra-tions in August; this is consistent with the high glucose content also found at this time point. The concentration
Table 3: Distribution of fatty acids (FA,% of total fatty acids, mean±SD, n = 3) of Saccharina latissima harvested at three locations between June and October, 2012.
FA (% of Total FA) Vattenholmen Ulvillarna Ursholmen
5 June 8 August 23 October 5 June 8 August 5 June 8 August
C14 9.6±2.8 8.8±0.5 7.5±1.6 11.0±1.0 7.8±2.1 11.3±0.3 8.3±0.4C15 0.51±0.11 0.61±0.03 0.35±0.10 0.55±0.02 0.57±0.12 0.67±0.06 0.54±0.02C16 21.0±6.0 21.8±1.5 22.1±1.5 22.0±1.8 22.1±2.4 25.0±4.9 21.7±0.8C18 1.10±0.29 1.60±0.49 1.53±0.98 0.90±0.06 3.71±0.57 1.25±0.74 3.59±0.04C20 0.76±0.16 0.97±0.08 0.86±0.10 0.71±0.05 0.81±0.13 0.78±0.18 0.76±0.04C22 ND ND ND ND 0.7±0.2 ND 0.3±0.2Total SFA 33.0±9.3 33.8±1.8 32.3±1.0 35.1±2.9 35.7±4.6 39.0±6.2 35.2±0.4
C16:1 n7 3.6±2.6 6.0±0.6 7.2±3.2 5.5±0.8 5.4±0.9 7.0±1.6 4.8±0.5C18:1a 13.8±3.8 15.7±1.5 18.9±7.8 15.0±1.1 12.7±1.4 15.7±3.8 11.7±0.8C20:1 n15 ND ND ND ND 1.15±0.31 ND 1.02±0.04Total MUFA 17.6±5.3 21.8±1.8 26.2±4.8 20.4±0.7 19.3±1.9 22.7±5.4 17.6±1.2
C18:2 n6ct 7.7±1.8 9.7±1.0 8.3±0.8 8.5±1.4 7.0±0.5 9.6±0.7 6.9±0.3C18:3 n6 1.18±0.35 1.66±0.54 1.75±0.11 1.57±0.36 1.07±0.08 1.51±0.17 1.11±0.19C18:3 n3 2.6±0.6 3.3±0.6 3.2±0.3 3.3±0.4 2.6±0.3 4.0±0.6 2.7±0.3C18:4 n3 4.16±0.90 4.75±0.85 4.33±0.68 5.76±0.67 4.30±0.75 7.09±1.67 4.49±0.07C20:2 n6 ND ND ND ND 0.73±0.15 ND 0.73±0.02C20:3 n6 0.39±0.06 ND 0.65±0.25 ND ND ND NDC20:4 n6 AA 7.9±1.6 12.4±1.5 11.8±2.0 10.5±0.7 8.7±1.3 11.4±2.3 7.8±0.2C20:5 n3 EPA 6.3±1.2 8.2±1.2 7.9±1.1 8.0±0.6 7.1±0.8 9.1±1.9 7.1±0.4C22:6n3 DHA ND 0.9±0.9 ND ND 8.0±2.7 ND 8.5±0.5Total PUFA 30.2±6.1 40.9±3.5 37.8±3.8 37.7±3.5 39.5±3.1 42.9±7.4 39.4±0.2
Unidentified peaks represented 3.8–7.9% and small identified peaks represented ≤ 0.62% of the total peak area. ND, Not detected; SFA, saturated fatty acids; MUFA, monounsaturated fatty acids; PUFA, polyunsaturated fatty acids; AA, arachidonic acid; EPA, Eicosapentae-noic acid; DHA, docosahexaenoic acid.aThe sum of 18:1 types, n7, n9,n12.
Brought to you by | Chalmers University of TechnologyAuthenticated | [email protected] author's copy
Download Date | 11/9/15 8:41 AM

J. Veide Vilg et al.: Biochemical composition variation in S. latissima 9
of mannitol was generally lower in August than in June, which could be an effect of phosphorus limitation, as this has been reported to cause transiently lower man-nitol production (Lee 2008). The lower concentrations of both mannitol and laminarin in October than in August highlight the effect of low irradiance and the utilization of carbon storage products during winter months for new growth (Henley and Dunton 1995, Belseth 2012). If the main purpose for the harvested biomass is production of bioethanol, the most suitable time of harvest would be in August, since the laminarin can be considered the most important substrate for fermentation (Adams et al. 2009).
The protein concentrations also peaked in August, with concentrations up to 110 mg g-1 dry weight. This may appear low compared to other protein crops, such as soya beans (up to 40%) but, considering the high productiv-ity of macroalgae and that the protein can be extracted from the whole biomass, the theoretical protein yield per production area can exceed that of soy. This may be of great interest in a biorefinery context, and should be con-sidered when deciding on harvesting time. The increase in protein concentration from June to August (Table 1) conflicts with some previous reports of a higher protein content in S. latissima by the end of May than in August (Black 1950, Schiener et al. 2015). It has, however, been found previously that the nitrogen content of the algal biomass increases throughout the summer, which could correspond to a higher protein content (Tønder 2014). Significant changes in other biochemical groups, e.g. storage carbohydrates, will obviously influence the con-centration of other components (measured as their rela-tive contribution to total biomass), especially those of relatively low concentration such as proteins. The com-bined content of mannitol and laminarin in the Swedish S. latissima individuals in August was around 30% lower than that reported from Norway and Scotland (Tønder 2014, Schiener et al. 2015), which could be an explanation of why the relative protein content appears higher in the Swedish algae at this time of year.
Seaweeds usually contain low levels of lipids, varying from 9.2 to 50 mg total lipids g-1 dw (Sánchez-Machado et al. 2004, Dawczynski et al. 2007, Schmid et al. 2014) and the TFA levels we report (1.7–3.9 mg TFA g-1 dw) were even lower than that. From a biorefinery perspective, the lipid fraction could still be of interest since it contains relatively high-value products, of which the PUFAs EPA and DHA are the most important. In previous studies, EPA was found at 10.8 and 1.8% of total FA (in June and November, respectively) in S. latissima from the Irish west coast (Schmid et al. 2014), at 8.6% (July) in Laminaria ochroleuca (Bachelot de la Pylaie) from the Iberian coast
(Sánchez-Machado et al. 2004) and at 16.2% in Laminaria sp. from China, Japan and Korea (Dawczynski et al. 2007). In all of these studies no DHA was found. Our data on S. latissima from the Swedish west coast are thus unique in that they indicated up to 8.5% DHA in August. The com-bination of DHA and EPA increases the attractiveness of utilising this resource as a functional food product. The European Food Safety Authority has recently permitted several beneficial health claims to be associated with the consumption of products containing EPA and DHA, including three claims for DHA alone, and three for EPA and DHA together (EFSA 2015). Among these is the claim that EPA and DHA together help to maintain normal heart function, but a product claiming this benefit is required to contain at least 40 mg EPA+DHA per 100 g. In August 100 g of dried S. latissima biomass from Ursholmen was just above this limit (42.1 mg (100 g)-1 dw).
Pigments and polyphenols are the other high-value compound groups that can be extracted from S. latis-sima. The highest concentrations of phenolic compounds in our study were observed in the June samples, and were up to 11.9 mg g-1 dw biomass. This is in agreement with Schiener et al. (2015), who found the lowest levels of phenolics in March, and the highest between May and July. The amounts of phenolic compounds extractable in acetonitrile:water:formic acid in their study (on average 0.41%) were at the lower end of those found in our study (0.43–1.2%) when extracting with 70% acetone. Since acetone is a better solvent for food applications, these find-ings are positive for industrial applications. Phlorotan-nins are known to comprise the major part of the phenolic compounds in kelps and have earlier been reported in the range 1–5% dw (Toth and Pavia 2002, Angela and Katrin 2012). They are oligomers of phloroglucinol (Shibata et al. 2004) and have been particularly highlighted due to their antioxidative properties in in vitro tests and in food prod-ucts (Wang et al. 2010).
The range of carotenoid contents for the different sites (0.10–0.45 mg g-1 dw) are comparable to those reported for S. latissima collected in Norway (~0.5 mg g-1 dw; Andersen et al. 2013). Schmid and Stengel (2015) reported the com-bined fucoxanthin and β-carotene content of S. latissima to be 0.2–0.3 mg g dw-1, which was significantly lower than other Laminaria species collected from the same site (~0.8–0.9 mg g-1 dw). Saccharina latissima is reported to have a lower pigment content, particularly carotenoids, under warmer conditions (Andersen et al. 2013, Hallerud 2014), but no consistent trend was seen between time points for sites in our study. This could be due to varia-tion between individual fronds sampled from each site in physiological status (age and thickness), which affects
Brought to you by | Chalmers University of TechnologyAuthenticated | [email protected] author's copy
Download Date | 11/9/15 8:41 AM

10 J. Veide Vilg et al.: Biochemical composition variation in S. latissima
pigment content in several kelp species (Belseth 2012, Hallerud 2014). In addition, individual macroalgae accli-mate to their ambient light regime (quantity and quality) by adjusting frond pigment content, possibly reflecting differences in their immediate environment (Hallerud 2014). This may also explain the variation seen between the replicate blades taken from each site as well as varia-tion between sites, not just for pigment content, but also for carbohydrate and FA content and profile. This high-lights the importance of careful sampling as well as the heterogeneity that is to be expected if commercial exploi-tation of these compounds is undertaken.
A large fraction of S. latissima biomass consists of moisture and ash. The highest ash concentration we deter-mined (32% dw) was similar to the average ash values reported by others, ~31% (Obluchinskaya 2008, Schiener et al. 2015). Schiener et al. (2015) found the highest mois-ture and ash content during the winter months, while we did not sample during the winter, but still found highest ash and moisture in June rather than October. The ash fraction probably represents mainly minerals, many of which are associated with the amino acid glutamate in brown seaweed and may be of interest as salt (sodium chloride) replacers (Lopez-Lopez et al. 2009).
The total weight of the compounds analysed within this study accounted for 60–70% of the total algal dry weight. There were no significant differences among loca-tions, apart from Ulvillarna in June when the total weight was significantly higher than in the other two locations (71±6% versus a mean value of 61±5% at UR and VH). We did not include alginate in our analyses and, since it is reported to constitute 15–25% of dry weight S. latissima biomass (Black 1950, Schiener et al. 2015), it may account for a large part of the missing 30–40%. In addition, the lipid analysis only covered the FA, meaning that all other lipid components are not accounted for; however, this would not affect the sum of weights substantially, since the total lipid fraction is so small.
Here we have highlighted how different biochemi-cal groups vary across potential harvest time points. The results suggest that for carbohydrate- or protein-rich biomass, August is the preferred time of harvest. However, several other factors influence when the optimal harvest time may be, not least the effect of bryozoan growth on kelp fronds. The main species causing fouling in Northern latitudes has been identified as the colonial species Mem-branipora membranacea (Linnaeus), which can develop calcified mats across kelp fronds (Handå et al. 2013, Tønder 2014). The effect of biofouling from other species could result in a significant decrease in growth, negative effects on biochemical composition from an industrial point of
view and, in worst case scenarios, defoliation of kelp beds and loss of biomass (Handå et al. 2013, Tønder 2014). Bryo-zoan colonization coincides with increased temperatures and can become a significant problem in late summer, reaching 80–100% coverage of frond area. This may be cor-related with reduced pigment content and photosynthetic rate (Hurd et al. 2000) and could consequently reduce carbohydrate formation (Handå et al. 2013, Tønder 2014). Alternatively, the concentration of these compounds could be simply diluted by the presence of the bryozoans, which can make up 50% of the biomass. Further work is required to evaluate the possible effects of epiphytic colonization of cultivated kelp in Western Sweden and the effects on algal biochemistry. These effects could have significant impacts on possible seaweed biorefinery processes, and harvesting should be timed to maximise product composition, and to avoid epiphytism, which suggests that a flexible or respon-sive strategy may be required.
Acknowledgments: We thank Trucy Nguyen, Albin Jörgensen, Nils-Gunnar Carlsson, and Annette Almgren at Chalmers University of Technology, for assistance with some of the analyses. Support from Carl Trygger Founda-tion, Stockholm (grant nr CTS12-8), the Centre for Marine Chemical Ecology (CeMaCE) at University of Gothenburg, and The Swedish Research Council Formas (Seafarm pro-ject, grant nr 213-2013-92) are acknowledged.
ReferencesAdams, J.M., J.A. Gallagher and I.S. Donnison. 2009. Fermenta-
tion study on Saccharina latissima for bioethanol production considering variable pre-treatments. J. Appl. Phycol. 21: 569–574.
Adams, J.M., A.B. Ross, K. Anastasakis, E.M. Hodgson, J.A. Gallagher, J.M. Jones and I.S. Donnison. 2011. Seasonal vari-ation in the chemical composition of the bioenergy feedstock Laminaria digitata for thermochemical conversion. Bioresour. Technol. 102: 226–234.
Andersen, G.S., M.F. Pedersen and S.L. Nielsen. 2013. Temperature acclimation and heat tolerance of photosynthesis in Norwegian Saccharina latissima (Laminariales, Phaeophyceae). J. Phycol. 49: 689–700.
Anderson, M. 2001. A new method for non-parametric multivariate analysis of variance. Austral. Ecol. 26: 32–46.
Anderson, M. and T. Willis. 2003. Canonical analysis of principal coordinates: a useful method of constrained ordination for ecology. Ecology 84: 511–525.
Anderson, M., K. Ellingsen and B. McArdle. 2006. Multivariate dis-persion as a measure of beta diversity. Ecol. Lett. 9: 683–693.
Anderson, M., R. Gorley and K. Clarke. 2008. PERMANOVA+ for PRIMER: guide to software and statistical methods. PRIMER-E, Plymouth.
Brought to you by | Chalmers University of TechnologyAuthenticated | [email protected] author's copy
Download Date | 11/9/15 8:41 AM

J. Veide Vilg et al.: Biochemical composition variation in S. latissima 11
Angela, D. and I. Katrin. 2012. Seasonal variation in kelp phlorotan-nins in relation to grazer abundance and environmental vari-ables in the Alaskan sublittoral zone. Algae 27: 9–19.
Bartsch, I., C. Wiencke, K. Bischof, C. Buchholz, B. Buck, A. Eggert, P. Feuerpfeil, D. Hanelt, S. Jacobsen, R. Karez, U. Karsten, M. Molis, M. Roleda, H. Schubert, R. Schumann, K. Valentin, F. Weinberger and J. Wiese. 2008. The genus Laminaria sensu lato: recent insights and developments. Eur. J. Phycol. 43: 1–86.
Belseth, E. 2012. Eco-physiology of the Arctic kelp Laminaria solidungula. PhD Thesis. Norwegian University of Science and Technology, Trondheim, Norway.
Black, W. 1950. The seasonal variation in weight and chemical composition of the common British Laminariaceae. J. Mar. Biol. Assoc. UK 29: 45–72.
Buchholz, C., G. Krause and B. Buck. 2012. Seaweed and man. In: (C. Wiencke and K. Bischof, eds) Seaweed biology, ecological studies, 219. Springer-Verlag, Berlin, Heidelberg. pp. 471–493.
Cavonius, L.R., N.G. Carlsson and I. Undeland. 2014. Quantification of total fatty acids in microalgae: comparison of extraction and transesterification methods. Anal. Bioanal. Chem. 406: 7313–7322.
Dallies, N., J. Francois and V. Paquet. 1998. A new method for quan-titative determination of polysaccharides in the yeast cell wall. Application to the cell wall defective mutants of Saccharomy-ces cerevisiae. Yeast 14: 1297–1306.
Dawczynski, C., R. Schubert and G. Jahreis. 2007. Amino acids, fatty acids, and dietary fibre in edible seaweed products. Food. Chem. 103: 891–899.
EFSA. 2015. “General function” health claims under Article 13. http://www.efsa.europa.eu/en/topics/topic/article13. European Food Safety Authority, The European Union.
FAO. 2014. The state of world fisheries and aquaculture. Rome: Food and Agriculture Organization of the United States.
Hallerud, C. 2014. Pigment composition of macroalgae from a Norwegian Kelp forest. PhD Thesis. Norwegian University of Science and Technology, Trondheim, Norway.
Handå, A., S. Forbord, X.X. Wang, O.J. Broch, S.W. Dahle, T.R. Storseth, K.I. Reitan, Y. Olsen and J. Skjermo. 2013. Seasonal- and depth-dependent growth of cultivated kelp (Saccharina latissima) in close proximity to salmon (Salmo salar) aquaculture in Norway. Aquaculture 414: 191–201.
Haug, A. and A. Jensen. 1954. Seasonal variation in the chemical composition of Alaria esculenta, Laminaria saccharina, Lami-naria hyperborea and Laminaria digitata from Northern Norway. Akademisk Trykningssentral, Blindern, Norway: Norwegian Institute of Seaweed Research, Report No.: 4. pp. 1–14.
Haugan, J.A. and S. Liaaenjensen. 1994. Algal carotenoids. 54. Carotenoids of brown algae (Phaeophyceae). Biochem. Syst. Ecol. 22: 31–41.
Henley, W.J. and K.H. Dunton. 1995. A seasonal comparison of car-bon, nitrogen, and pigment content in Laminaria solidungula and L. saccharina (Phaeophyta) in the Alaskan Arctic. J. Phycol. 31: 325–331.
Holdt, S. and S. Kraan. 2011. Bioactive compounds in seaweed: functional food applications and legislation. J. Appl. Phycol. 23: 543–597.
Horn, S., E. Moen and K. Østgaard. 1999. Direct determination of alginate content in brown algae by near infra-red (NIR) spec-troscopy. J. Appl. Phycol. 11: 9–13.
Hughes, A.D., M.S. Kelly, K.D. Black and M.S. Stanley. 2012. Biogas from Macroalgae: is it time to revisit the idea? Biotechnol. Biofuels 5: 86.
Hurd, C.L., K.M. Durante and P.J. Harrison. 2000. Influence of bryozoan colonization on the physiology of the kelp Macrocys-tis integrifolia (Laminariales, Phaeophyta) from nitrogen-rich and -poor sites in Barkley Sound, British Columbia, Canada. Phycologia 39: 435–440.
Iwao, T., A. Kurashima and M. Maegawa. 2008. Effect of seasonal changes in the photosynthates mannitol and laminarin on maturation of Ecklonia cava (Phaeophyceae, Laminariales) in Nishiki Bay, central Japan. Phycol. Res. 56: 1–6.
Jeffrey, S. and G. Humphrey. 1975. New spectrophotometric equa-tions for determining chlorophyll a, b, c1 and c2 in higher plants and natural phytoplankton. Bioch. Physiol. Pflanz (BPP) 165: 191–194.
Koppram, R., E. Albers and L. Olsson. 2012. Evolutionary engi-neering strategies to enhance tolerance of xylose utilizing recombinant yeast to inhibitors derived from spruce biomass. Biotechnol. Biofuels 5: 32.
Lane, C.E., C. Mayes, L.D. Druehl and G.W. Saunders. 2006. A multi-gene molecular investigation of the kelp (Laminariales, Phaeo-phyceae) supports substantial taxonomic re-organization. J. Phycol. 42: 493–512.
Lee, R.E. 2008. Heterokontophyta, Phaeophyceae. Phycology. 4th edition. Cambridge University Press, Cambridge, UK.
Li, Y., Z.J. Qian, B. Ryu, S.H. Lee, M.M. Kim and S.K. Kim. 2009. Chemical components and its antioxidant properties in vitro: an edible marine brown alga, Ecklonia cava. Bioorg. Med. Chem. 17: 1963–1973.
Lopez-Lopez, I., S. Cofrades, C. Ruiz-Capillas and F. Jimenez- Colmenero. 2009. Design and nutritional properties of poten-tial functional frankfurters based on lipid formulation, added seaweed and low salt content. Meat Sci. 83: 255–262.
Lowry, O.H., N.J. Rosebrough, A.L. Farr and R.J. Randall. 1951. Pro-tein measurement with the folin phenol reagent. J. Biol. Chem. 193: 265–275.
Miyashita, K., N. Mikami and M. Hosokawa. 2013. Chemical and nutritional characteristics of brown seaweed lipids: A review. J. Funct. Foods 5: 1507–1517.
Obluchinskaya, E. 2008. Comparative chemical composition of the Barents Sea brown algae. Appl. Biochem. Microbiol. 44: 305–309.
Parsons, T.R., Y. Maita and C.M. Lalli. 1984. A manual for chemi-cal and biological methods for seawater analysis. Pergamon Press, Oxford, UK.
Pavia, H. and G. Toth. 2000. Influence of light and nitrogen on the phlorotannin content of the brown seaweeds Ascophyllum nodosum and Fucus vesiculosus. Hydrobiologia 440: 299–305.
Pavia, H., G. Cervin, A. Lindgren and P. Aberg. 1997. Effects of UV-B radiation and simulated herbivory on phlorotannins in the brown alga Ascophyllum nodosum. Mar. Ecol. Prog. Ser. 157: 139–146.
Peng, J., J.P. Yuan, C.F. Wu and J.H. Wang. 2011. Fucoxanthin, a marine carotenoid present in brown seaweeds and diatoms: metabolism and bioactivities relevant to human health. Mar. Drugs 9: 1806–1828.
Sánchez-Machado, D.I., J. López-Cervantes, J. López-Hernández and P. Paseiro-Losada. 2004. Fatty acids, total lipid, protein and ash contents of processed edible seaweeds. Food. Chem. 85: 439–444.
Brought to you by | Chalmers University of TechnologyAuthenticated | [email protected] author's copy
Download Date | 11/9/15 8:41 AM

12 J. Veide Vilg et al.: Biochemical composition variation in S. latissima
Sanderson, J., M. Dring, K. Davidson and M. Kelly. 2012. Culture, yield and bioremediation potential of Palmaria palmata (Linnaeus) Weber & Mohr and Saccharina latissima (Linnaeus) C.E. Lane, C. Mayes, Druehl & G.W. Saunders adjacent to fish farm cages in northwest Scotland. Aquacult. 354–355: 128–135.
Schiener, P., K. Black, M. Stanley and D. Green. 2015. The seasonal variation in the chemical composition of the kelp species Lami-naria digitata, Laminaria hyperborea, Saccharina latissima and Alaria esculenta. J. Appl. Phycol. 27: 363–373.
Schmid, M. and D.B. Stengel. 2015. Intra-thallus differentiation of fatty acid and pigment profiles in some temperate Fucales and Laminariales. J. Phycol. 51: 25–36.
Schmid, M., F. Guihéneuf and D. Stengel. 2014. Fatty acid contents and profiles of 16 macroalgae collected from the Irish Coast at two seasons. J. Appl. Phycol. 26: 451–463.
Shibata, T., S. Kawaguchi, Y. Hama, M. Inagaki, K. Yamaguchi and T. Nakamura. 2004. Local and chemical distribution of phloro-tannins in brown algae. J. Appl. Phycol. 16: 291–296.
Toth, G. and H. Pavia. 2002. Lack of phlorotannin induction in the kelp Laminaria hyperborea in response to grazing by two gas-tropod herbivores. Mar. Biol. 140: 403–409.
Tønder, T.S. 2014. A study of the seasonal variation in biochemical composition of Saccharina latissima. MSc Thesis. Norwegian University of Science and Technology, Trondheim, Norway.
Wang, T., R. Jónsdóttir, H.G. Kristinsson, G. Thorkelsson, C. Jacobsen, P.Y. Hamaguchi and G. Ólafsdóttir. 2010. Inhibi-tion of haemoglobin-mediated lipid oxidation in washed cod muscle and cod protein isolates by Fucus vesiculosus extract and fractions. Food Chem. 123: 321–330.
Xiros, C. and L. Olsson. 2014. Comparison of strategies to overcome the inhibitory effects in high-gravity fermentation of lignocel-lulosic hydrolysates. Biomass Bioenerg. 65: 79–90.
Supplemental Material: The online version of this article (DOI: 10.1515/bot-2015-0034) offers supplementary material, available to authorized users.
BionotesJenny Veide VilgDepartment of Biology and Biological Engineering-Industrial Biotechnology, Chalmers University of Technology, SE-412 96 Gothenburg, Sweden
Jenny Veide Vilg is a researcher at the Division of Industrial Biotechnology, Department of Biology and Biological Engineering, Chalmers University of Technology. She holds a PhD in Biosci-ence from the division of Food Science at Chalmers University of
Technology and has a research background in molecular microbiol-ogy and enzymology, with applications in nutrition and biofuels production, as well as fundamental research. Her present research is focused on seaweed biotechnology, with emphasis on protein extraction and bioprospecting for novel enzymes and microorgan-isms for algal polysaccharide hydrolysis and fermentation.
Göran M. Nylund Department of Marine Sciences – Tjärnö, University of Gothenburg, SE-452 96 Strömstad, Sweden
Göran M. Nylund is a Researcher at the Department of Marine Sciences, University of Gothenburg. He earned a PhD in Marine Ecology at the University of Gothenburg for work on seaweed defences against biofouling and has worked with chemical ecology of seaweeds for more than 10 years. His recent research inter-est also includes the development of cultivation techniques for seaweeds.
Tony WernerDepartment of Biology and Biological Engineering-Industrial Biotechnology, Chalmers University of Technology, SE-412 96 Gothenburg, Sweden
Tony Werner is a Master of Science student studying Biotechnology at Chalmers University of Technology and he holds a Bachelor of Science degree in Chemical Engineering from Chalmers University of Technology. During his Master’s studies he worked as a project assistant under Dr. Eva Albers.
Linnea QviristDepartment of Biology and Biological Engineering-Industrial Biotechnology, Chalmers University of Technology, SE-412 96 Gothenburg, Sweden; and Department of Biology and Biological Engineering-Food and Nutrition Science, Chalmers University of Technology, SE-412 96 Gothenburg, Sweden
Linnea Qvirist is a PhD student at the Department of Biology and Biological Engineering at Chalmers University of Technology, in the division of Food and Nutrition Science. She has an MSc degree in Biotechnology from Chalmers, and her Master’s thesis work involved the isolation, characterization and analysis of yeasts. Thereafter she worked in the Industrial Biotechnology group, ana-lyzing the composition of algal biomass.
Brought to you by | Chalmers University of TechnologyAuthenticated | [email protected] author's copy
Download Date | 11/9/15 8:41 AM

J. Veide Vilg et al.: Biochemical composition variation in S. latissima 13
Joshua J. MayersDepartment of Biology and Biological Engineering-Industrial Biotechnology, Chalmers University of Technology, SE-412 96 Gothenburg, Sweden
Joshua J. Mayers joined the Industrial Biotechnology Division at Chalmers University of Technology as a post-doctoral researcher in the Algal Biotechnology group in June 2014. He gained his PhD in Biological Sciences at Swansea University (UK) studying the physi-ological and biochemical responses of marine microalgae to culture conditions, nutrient regime and stress. He is currently involved in several multi-disciplinary projects, including investigation of integrated biorefinery scenarios, and microalgal metabolism and biochemistry.
Henrik PaviaDepartment of Marine Sciences – Tjärnö, University of Gothenburg, SE-452 96 Strömstad, Sweden
Henrik Pavia is Professor in Marine Chemical Ecology at the Department of Marine Sciences-Tjärnö, University of Gothenburg. He gained his PhD in Marine Botany in 1999, focusing on the eco-logical role of brown algal phlorotannins. Since then he has built and led a research group in marine chemical ecology, with extensive national and international collaboration. During recent years he has also shown strong interest in seaweed farming and he is currently coordinating some of the major Swedish initiatives on cultivation of brown, red and green macroalgae.
Ingrid UndelandDepartment of Biology and Biological Engineering-Food and Nutrition Science, Chalmers University of Technology, SE-412 96 Gothenburg, Sweden
Ingrid Undeland is Professor of Food Science at Chalmers University of Technology focusing her research on lipids, proteins and antioxidants from marine raw materials. She earned her PhD from Chalmers in 1998 on lipid oxidation in herring and then spent 2 years as a post doc at the University of Massachusetts Marine Station in USA. Currently, she leads a marine research group at the Food and Nutrition Science unit at Chalmers. She is also the national representative in West European Fish Technologists Association (WEFTA) and European Association for Chemical and Molecular Sciences-Food Chemistry Division (EuCheMS-FCD), and Chair of Nordic Lipidforum.
Eva AlbersDepartment of Biology and Biological Engineering-Industrial Biotechnology, Chalmers University of Technology, SE-412 96 Gothenburg, Sweden, [email protected]
Eva Albers is a Senior Lecturer and Researcher at Chalmers University of Technology in the Division of Industrial Biotechnology. She earned a PhD in 2000 from Chalmers in Biochemical Engineer-ing by studying the nitrogen and redox metabolism in Saccharo-myces cerevisiae. She is leading the Algal Biotechnology group of the Industrial Biotechnology Division, which studies seaweed and microalgae. Her research interest is metabolism and physiology in particular in response to changing environmental conditions and algal biorefinery recovering fine and bulk chemicals from biomass.
Brought to you by | Chalmers University of TechnologyAuthenticated | [email protected] author's copy
Download Date | 11/9/15 8:41 AM
Botanica Marina 2015 | Volume xx | Issue x
Graphical abstract
Jenny Veide Vilg, Göran M. Nylund, Tony Werner, Linnea Qvirist, Joshua J. Mayers, Henrik Pavia, Ingrid Undeland and Eva AlbersSeasonal and spatial variation in biochemical composition of Saccharina latissima during a potential harvesting season for Western Sweden
DOI 10.1515/bot-2015-0034Botanica Marina 2015; xx(x): xx–xx
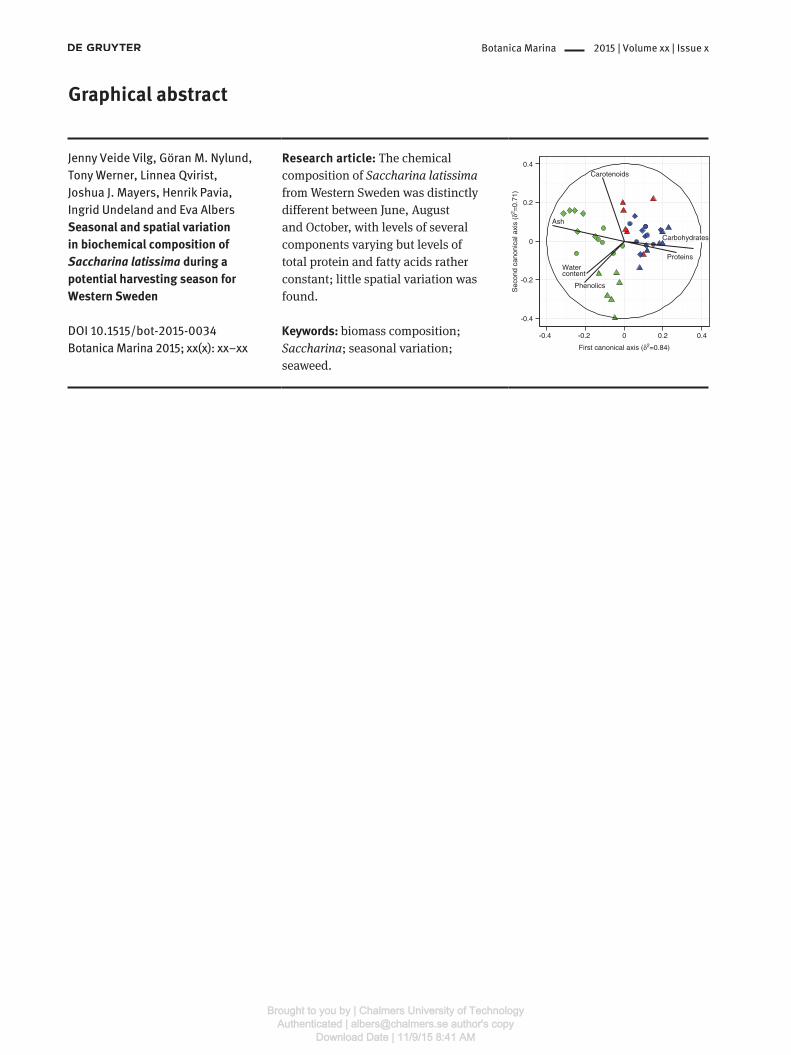
Research article: The chemical composition of Saccharina latissima from Western Sweden was distinctly different between June, August and October, with levels of several components varying but levels of total protein and fatty acids rather constant; little spatial variation was found.
Keywords: biomass composition; Saccharina; seasonal variation; seaweed.
Phenolics
Water content
Ash
Carotenoids
Proteins
0
0
0.2 0.4-0.2-0.4
0.2
-0.2
0.4
-0.4
Sec
ond
cano
nica
l axi
s (δ
2 =0.
71)
Carbohydrates
First canonical axis (δ2=0.84)
Brought to you by | Chalmers University of TechnologyAuthenticated | [email protected] author's copy
Download Date | 11/9/15 8:41 AM