Searching High-z Supernovae with HSC and WFMOS Yutaka Ihara (U. Tokyo/IOA) Mamoru Doi, Naoki Yasuda,...
18
Searching High-z Supernovae with HSC and WFMOS Yutaka Ihara (U. Tokyo/IOA) Mamoru Doi, Naoki Yasuda, Tomoki Morokuma, Kohki Konishi, Kouich Tokita Subaru User’s Meeting 2009/01/14-16 @ Mitaka
-
Upload
hilary-fletcher -
Category
Documents
-
view
216 -
download
0
Transcript of Searching High-z Supernovae with HSC and WFMOS Yutaka Ihara (U. Tokyo/IOA) Mamoru Doi, Naoki Yasuda,...
Searching High-z Supernovae
with HSC and WFMOS
Yutaka Ihara (U. Tokyo/IOA)
Mamoru Doi, Naoki Yasuda,
Tomoki Morokuma, Kohki Konishi, Kouich Tokita
Subaru User’s Meeting 2009/01/14-16 @ Mitaka

AbstractWe will search Type Ia supernovae with HSC and WFMOS.
(1)HSC (Imaging observations)Detect variable objects in high-z galaxies(5-10 nights (epochs) observations give SN light curves. )→~1000 SNe Ia will be obtained for one year (two terms) survey. (2) WFMOS・ ~500 spectra of SNe Ia will be obtained for one year.・ ~1000 spectra of host galaxies of the detected SNe Ia
Our Goal(1) For SN Ia properties
① SN rate study → Progenitor of SNe Ia ② SN Ia spectra → Diversity
(2) For Cosmology・ Resolve the time variation of “Dark Energy”・ Obtain more accurate cosmological parameters (ΩM, ΩΛ, w)

Classification of SNe
H line
Si line
He line
Line shape
Light curve
Ia
Ib
Ic
IIn
IIP
IIL
○
Narrow
Plateau
Linear
Binary (WD)
Core Collapse○
×○
×

How to detect SNe ?(1) Detect variable objects with repeat imaging observations
Example of a SN Ia at z=0.606 (Morokuma+2008)
Reference Another Image Subtracted Image
(2) Classify SNe
① From Spectra (Confirmed method) ② From Light Curves (with Uncertainty)
Ia
II
Filippenko 1997

Why do SNe Ia are important?
© NASA / HST
SN1994D
SNe Ia ↓Standard candle in the universe
・ Constant Maximum brightness・ Uniform Light curves and spectra
Measure the expansion of the universe using SNe Ia.
On the contrary…Large systematic errors still exist on the cosmological parameter fit.
Diversity of SNe Iacaused by Progenitors?, Metallicity of Host Galaxies?, Time evolution? or…→ Need more spectra of SNe Ia from low-z to high-z
Very bright (MV~-19.3 mag)
・ Observable at cosmological distances (z~1.5)

Mid-z survey・ SNLS (0.2<z<0.9) ~700 SNe Ia obtained in 2003-07.Imaging: CFHT 4m・ SDSS-II SN survey (0.1<z<0.4)~500 SNe Ia obtained in 2005-07.Imaging: SDSS 2.5m・ ESSENCE (0.2<z<0.9)~200 SNe Ia obtained in 2002-07.Imaging: CTIO 4mHigh-z survey・ SCP (0.3<z<1.4)~30 SNe Ia obtained in 2002 and 2005,6.Imaging: Subaru 8m and HST・ High-z Team (0.2<z<1.6)~30 SNe Ia obtained in 2002-04Imaging: HST
HSC+WFMOS
SN Ia survey
If using HSC (imaging) + WFMOS (spectroscopy), We will get ~1000 SNe Ia for one year survey. Out of them, ~500 SNe Ia are high-z SNe (z>1.0).

Science with SNe Ia

SN Ia rate study→ Many SNe Ia samples are very useful.
MotivationSN Ia rate is the clue of progenitors of SNe Ia
Recently, large delay time distribution of SNe Ia are shown by rate studies.
( “Delay time” → time interval between star formation and SN explosion )
Prompt Tardy
Neill+06(SNLS work)
Nearby results(e.g. Cappellaro+99)
Sullivan+06 ★ Two populations of SNe Ia ? (Mannucci+2005, 2006)
“Prompt” : Short delay time (~0.1-1Gyr) “Tardy” : Long delay time (~1-10Gyr)
High-z rate is important!!It is difficult to measure that from current SN surveys
→ HSC+WFMOS survey

Results of our work and the others
Ihara+09 (SXDS)Dahlen+08(GOODS)Poznanski+07(SDF)Neill+06 (73)(SNLS) z=0.47 Dilday+08 (17)(SDSS) z=0.12
Ihara+09 showsincreasing rates toward z~1.2
At highest-z (z>1.4), very large errors due to small statistics
( Detailed results will be shown in Joint Subaru/Gemini Science Conference)
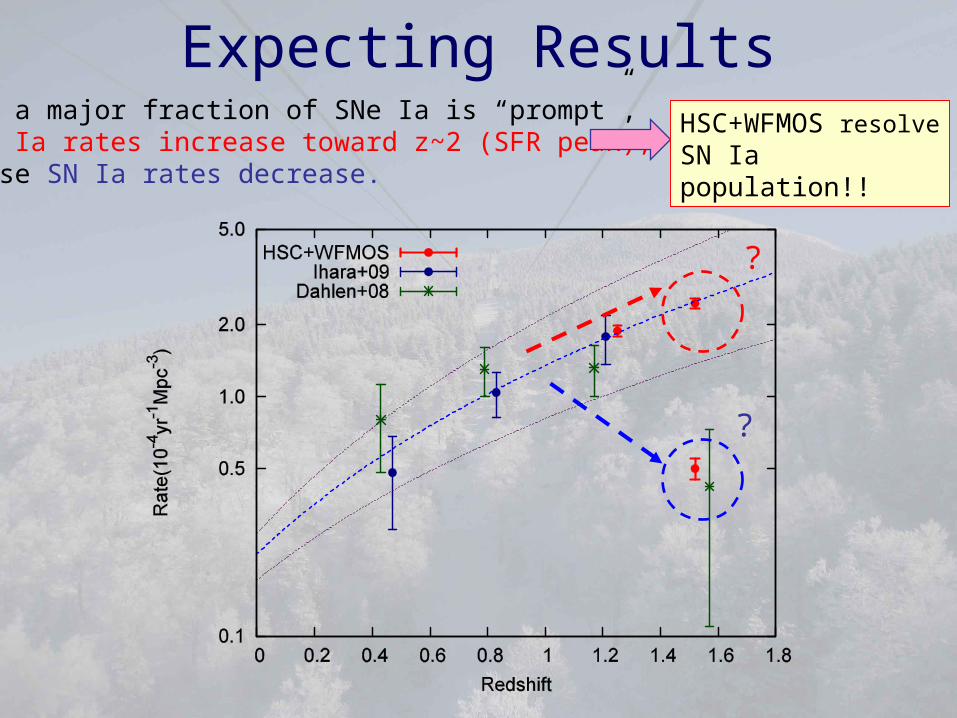
Expecting Results
?
?
If a major fraction of SNe Ia is “prompt”, SN Ia rates increase toward z~2 (SFR peak), else SN Ia rates decrease.
HSC+WFMOS resolve SN Ia population!!
Diversity of SNe
-0.8 -0.4 0.0 0.4
-0.2
0
.0 0
.2 0
.4 0
.6
U-B
B-V
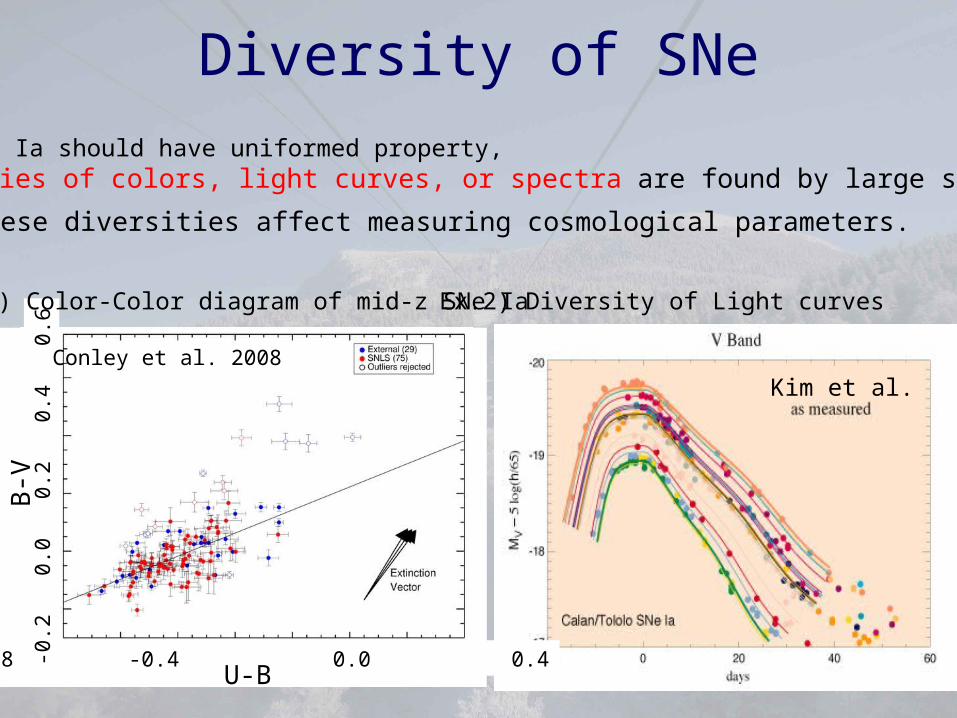
Though SNe Ia should have uniformed property, diversities of colors, light curves, or spectra are found by large surveys.
→ These diversities affect measuring cosmological parameters.
Ex.1) Color-Color diagram of mid-z SNe Ia
Conley et al. 2008
Kim et al.
Ex.2) Diversity of Light curves

Diversity of SNe
Red sample
Blue sample
Tokita 2009 PhD thesis
Corrected diversities with stretch factor, epoch, and MW extinction→ But the diversities still remain…→ Extinction of host galaxies? Metallicity of hosts? Other unknown reasons?
→ Resolve that by large statistic samples of SN Ia spectra( Need large amounts of SNe at each epoch and stretch factor)

Diversity of SNeCorrelation of EW(FeII) and Color of SNe Ia (?) (see detail on Konishi’s Poster)→ SN spectra may be useful to decide color terms of SNe
SALT2 (Light curve fitting method) (Guy+2007)
Color term
● Subaru(SDSS)● SuspectAt max
A few spectra of SNe…Large statistical samples with WFMOSwill find distinct correlations.
Konishi+09 in prep

CosmologyKowalski’s work → Using all SNe Ia obtained by SN surveys or the other works → 307 SNe Ia (after selection cuts)
Enough statistics Errors depend on systematic
Small statistics at z>1 Need more samples

Cosmology• Redshift should be determined well below 1% level
– Difficult only with photometric information
★ Need spectroscopic information– Combine with photo-z of host galaxies?
• Different error properties are expected– Spectroscopy of host galaxies
• Need large observing time
Using WFMOS, Get ~50 SNe Ia spectra at once!!And, get spectra of their host galaxies at the same time.

Cosmology○ Errors on ΩM and w reduce by a factor of 2
Contour : 1σ
Kowalski et al. 2008
HSC+WFMOS
○ The time variation of Dark Energy will be constrained

Summary HSC → Detect ~1000 SNe Ia at z<1.5 WFMOS → Spectra of ~500 SNe Ia and all of the ~1000 host galaxies
This survey will be the largest and the deepest SN survey for the next five years.
① Nature of SNe Ia and their evolution can be explored with large sample.→ SN Ia rate study ( for progenitors)→ Diversities
② Measure cosmological parameters→ ΩM, ΩΛ, w→ The time variation of Dark Energy (?)

~ Fin ~


![Galactic Archaeology with SuMIRe PFSmember.ipmu.jp/denet2010/aoki.pdfa few 100 (kpc km/s) smears out substructures clump ... Comparisons with GA proposal for WFMOS ... KP([Fe/H],B-V)](https://static.fdocuments.in/doc/165x107/5d2ea02288c9930e6e8b9dd1/galactic-archaeology-with-sumire-few-100-kpc-kms-smears-out-substructures-clump.jpg)