Search - January 2012 - Top 500 Manufacturing Companies: Listing & Analysis
108
-
Upload
infomedia18 -
Category
Documents
-
view
289 -
download
23
description
‘SEARCH’, India’s leading B2B magazine on general engineering and manufacturing, is aimed to equip its readers with latest business trends, news, views and insights. A ready-reckoner for all techno-commercial information, it is a sumptuous source of business trends and growth opportunities. Encompassing all the segments of manufacturing along with sourcing solutions, this monthly presentation is a unique platform for SMEs as well. With multitude of dedicated readers patronising this flagship magazine, launched in 1998, SEARCH has retained the leadership position in its domain.
Transcript of Search - January 2012 - Top 500 Manufacturing Companies: Listing & Analysis


Search Jan 2012 Ad Name: JYOTI CNC Pg. 7

Search Jan 2012 Ad Name: Riat Pg. 8


J A N U A R Y 2 0 1 2 | SEARCH - THE INDUSTRIAL SOURCEBOOK 11
EDITORIAL
new economic order is taking shape in front of our eyes, as the old Western powers and the emerging world’s major new players converge. But the forces driving this convergence are not those that generations of economists envisaged, but the new best strategies are the ones that have never been thought of by anybody else, this is to say that for all the old, new and the next generation companies to stay ahead, you need to think ahead.
Think ‘ahead’ of your perceived and hidden competitors and think ‘for’ your customers, a strategy which sounds simple, but has many layers and hidden insights concerning all
things important for companies to win. It is very important to accept and acknowledge that a company does not gain at the expense of its competitors or by limiting or cloning its competitor’s strategy, but rather, by crafting or deploying a distinctive strategy that changes the rules of the game in its favour. What wins in the business is not trying to out muscle your competitors with brawn, but rather to outthink those competitors with some serious brain power.
This will enable you to produce a distinctive strategy. Then again there is a need for strategic thinking, which sets out a vision of where your company is going. Use this as your basis for making appropriate choices and plans. Clarify what your company is, and is not, to avoid becoming scattered and overextended. Every leader of a company must carefully choose what game to play, and how to craft a strategy to make and shape the rules. How to use strategic thinking is today’s most important management tool, to put your company on a growth-oriented path to the future.
It is very important to find out how to overcome the key obstacles to strategic thinking; craft a future profile for your organisation; articulate a meaningful business concept; utilise strategic leverage; make competition practically irrelevant; benefit from product innovation & market fragmentation and avoid mistakes when making alliances and acquisitions, all this will help you outthink, outsmart & outpace your competitors.
In the automated world, it’s still the human angle that dominates the thought process and strategies for success. In the race to win customer confidence, companies must ensure that they make the customer come back for more. Focus on delivering high-quality services that meet the needs of key customers is critical. Producing innovative solutions comes from a number of actions — closer relationships with supply chain partners, making corporate acquisitions relevant to better meeting the needs of customers and investing in & developing relationships with existing and new generation of consumers for your product or service, all underpin a commitment to innovation. Another critical human angle is the workforce that has the potential to make or mar the fortunes of a company. Building the right leadership and creating the best team is fundamental to success.
All this and more will help you position yourself among the best in class, if you are already doing these things, chances are that you are a part of this envious listing of Top 500 Manufacturing Companies, if not, the analysis of what makes these winning companies tick will get you there.
So read on and go ahead… Outthink, Outsmart, Outpace your competitor!
AOUTTHINK, OUTSMART, OUTPACE
Archana [email protected]
J A N U A R Y 2 0 1 2 | SEARCH - THE INDUSTRIAL SOURCEBOOK 13
CARE RESEARCH & Information Services is an independent division of CARE. CARE Research services a variety of business research needs with credible, high quality research and analysis on various facets of the Indian Economy and Industries. The research division has a two pronged objective of providing an in-house research to the ratings division as also high quality sectoral research to fi nancial intermediaries, corporate, analysts, policy makers, etc., as an aid to their decision making process. CARE Research draws its strengths from CARE’s decade long experience and in-depth understanding of the Indian economy/industries, use of rigorous analytical methods and its knowledge team. It has an in-house team of qualifi ed, experienced analysts and is committed to provide accurate, reliable research to its clients with consistent updates in time frame.
CARE RESEARCH has established a network of primary and secondary sources, which enable the team of analysts to form unbiased opinions on industry segments. It has also developed different methodologies for forecasting the future demand-supply situation in a particular industry.
CARE RESEARCH produces Industry Research Reports, Industry Risk Evaluation Reports and undertakes customised assignments on request basis.
Industry Research: CARE Research is a leading provider of value research. Investors, corporates, bankers, analysts, etc use the sector reports for in-depth understanding of present situation, issues, outlook, etc., to arrive at opinion. The reports contain latest available data on capacity utilisation, consumption, prices, domestic and global trends, raw material scenario, and outlook. Further CARE Research also provides updates on monthly/quarterly /half-yearly basis as well as impact notes on policy changes. Subscription is made available though CARE online research distribution systems and all the reports can be accessed online from anywhere. The Industry Research Report services are today subscribed by vast number of clients. At present, we cover 30 industries.
Industry Risk Evaluation: Industry Risk Evaluation Reports offer industry specifi c risk scores which capture the infl uence of industry variables on various critical parameters which can impact cash fl ow and debt servicing capabilities of the industry for the next 2-3 years. The risks on various parameters are quantifi ed by assigning a score to each parameter. Some of the key parameters used for scoring are demand, supply, competition, factors of production, government policies and regulations and the fi nancial structure of the industry. The risk scores are useful tools for quantifying industry risk and are used in credit assessment of companies. At present, evaluation reports are available on 84 sectors.
Customised Research: The rising level of volatility in complex markets with lots of opportunities to tap necessitates a thorough understanding and guidance provided by a well known research fi rm. To address such needs, CARE Research offers need-based solutions by completely checking the facts, market scenario, past trends, etc., to help clients realise their futuristic goals and transform their businesses. Some of the areas in which we offer customised research are market sizing, demand estimation, demand-gap analysis, cost-benefi t analysis, cost indexation, product segmentation, business analysis, competitive intelligence, etc. We also prepare industry overviews for clients in connection with their capital markets offerings.
FOREWORD
DR DograMD & CEO, CARE Ltd.
he World Economic Outlook suggests moderation in global growth to about 4% through CY2012 from over 5% in CY2010. Th e real GDP in developed economies is anticipated to expand at about 1.9% in CY2012, while emerging/developing ones are anticipated to expand at 6.1%. Th e macroeconomic situation in India is currently subdued as refl ected by the decline in various indicators like GDP, IIP, export trends, etc. Th e Indian manufacturing sector grew at 3.7% in April-October, 2011, as compared to 9.4% in the last year. Hence, for the current fi scal, CARE estimates the GDP growth would be in the range of 7.1% to 7.4%, lower than 8.6% clocked in the previous fi scal.
IIP capital goods have registered a sharp drop of 25.5% in October, 2011, on the back of a slowdown in investments because of rising interest rates and slowdown in demand. Th ese factors have inevitably dragged down production in the manufacturing sector and are expected to have an impact in the coming months as well. Further, FY12 continues to be marked by concerns such as those emanating from the European debt crisis, global currency wars, etc. However, resilient domestic consumption followed by diversifi cation of businesses to new geographical areas would help India arrest the decline to some extent. India, with its vast domestic consumption, remains a more resilient economy and one of the fastest growing economies in the world.
CARE Research, as the Ratings Partner for SEARCH magazine, has developed a comprehensive methodology to bring out the leaders and rank the ‘Top-500 Indian Manufacturing Companies’ for the third consecutive year. Th e various parameters on which the companies were assessed on included: size of the company, profi tability, capital structure and return to the investor community. Th e research methodology is explained in detail in this issue and reinforces the fact that the companies, which strategically tackled the tidal waves of economic uncertainty, also paced faster than others to gain from the economic growth and achieved a higher rank than the rest in the rankings.
Going forward, apart from scalability, sustainability would be the mantra for success for the Indian manufacturing industry.
T
RATINGS PARTNER
Scalability & Sustainability: Key To Manufacturing Growth

J A N U A R Y 2 0 1 2 | SEARCH - THE INDUSTRIAL SOURCEBOOK 15
CONT
ENTSEditorial11
Foreword13
18
RANKING METHODOLOGYDeciphering The Top 500 Manufacturing Companies
30
Top 500 Manufacturing Companies - Listing34
ANALYSING THE TOP 14
54
HINDALCO INDUSTRIES LTDBuilding On A Four-pronged Strategy
STEEL AUTHORITY OF INDIA LTD (SAIL)Growing From Strength-to-strength
HINDUSTAN PETROLEUM CORPORATION LTD (HPCL)Promising A Future Full Of Energy
BHARAT PETROLEUM CORPORATION LTD (BPCL)Securing India’s Future Energy Needs
TATA MOTORSCapitalising On Product Innovation
ITCBuilding on Green GDP & Inclusive Growth
INDIAN OIL CORPORATION (IOC)On A Strong Tech & Marketing Footing
OIL & NATURAL GAS CORPORATION (ONGC)Moving Towards Hydrocarbon Assets
RELIANCE INDUSTRIES LTD (RIL)The Pole Star
TATA STEELValue Creation Through Sustainability
BHARAT HEAVY ELECTRICALS LTD (BHEL)Of Envious Order Books & Potential Profi ts
STERLITE INDUSTRIES (INDIA) LTDFocussing On Organic Growth Projects
56
60
63
67
70
74
78
80
84
88
92
HINDUSTAN UNILEVER LTD (HUL)Winning With Brands & Innovations 96
Glossary102 Product Index103
JINDAL STEEL & POWER LTDTreading Along The Success Path 100
Advertisers’ List104
GLOBAL ECONOMIC OUTLOOKProspects Constrained, Yet Sturdy
24 China: Slower Growth, Longer-term Risks
27 Japan: On The Bright Side…
28 India: Trudging Along, For Now


FOUNDER & EDITOR, NETWORK 18Raghav Bahl
PRESIDENT & EDITORIAL DIRECTOR, TV 18Senthil Chengalvarayan
EXECUTIVE EDITORArchana Tiwari-Nayudu
ASSISTANT EDITORPrerna Sharma
EDITORIAL TEAMSumedha Mahorey, Kimberley D’Mello, Nishi Rath, Michael Anthony,
Arindam Ghosh (Delhi), Abha Mishra, Paskaline L Sebastian
ASSISTANT ART DIRECTORVaruna Naik
DESIGN TEAMSanjay Dalvi, Uttam Rane
CHIEF PHOTOGRAPHERMexy Xavier
PHOTOGRAPHYNeha Mithbawkar, Joshua Navalkar
BUSINESS CONTROLLERSPukha Dhawan, Lovey Fernandes, Akshata Rane, Deepak Bhatia,
Shwetha ME, Jayashree N, Sugandha Kulkarni, Shefali Mahant
PRINTINGEXECUTIVE VICE PRESIDENT
Ananth R Iyer
ASSISTANT GENERAL MANAGER - PPCShekhar Khot
PRODUCTION TEAMDnyaneshwar Goythale, Surekha Karmarkar, Ravikumar Potdar, Ravi Salian, Sanjay Shelar
OVERSEAS CONTACTRingier Trade Media Ltd CHINA
1001 Tower 3, Donghai Plaza, 1486 Nanjing Road, West, Shanghai 200040, China Tel: +86-21 6289 – 5533 Ext. 368, Fax: +86-21 6247 – 4855
(Craig Shibinsky) Email: [email protected] Trade Media Ltd HONG KONG
9/F, Cheong Sun Tower, 118 Wing Lok Street, Sheung Wan, Hong Kong Tel: +852 2369 – 8788 Ext. 21, Fax: +852 2869 – 5919
(Octavia Au-Yeung) Email: [email protected] Trade Media Ltd TAIWAN
Room 3, Fl. 12, No. 303, Chung Ming S. Rd., Taichung, TaiwanTel: +886-4 2329 – 7318 Ext. 16, Fax: +886-4 2310 – 7167
(Sydney La) Email: [email protected] Trade Media Ltd GERMANY, AUSTRIA, SWITZERLAND
Tel: +41-44 734 0472, Fax: +41 44 734 0680Email: [email protected]
USA Tel: (513) 527-8800 Fax: (513) 527-8801
Email: [email protected]
USA Alfredo Domador, 6505 Blue Lagoon Drive, Suite 430 Miami, FL. 33126, USA
Tel: (305) 448-6875, Fax: (305) 448-9942
GROUP CEO, NETWORK 18Haresh Chawla
GROUP COO, NETWORK 18B Sai Kumar
CEO-PUBLISHING, INFOMEDIA 18Sandeep Khosla
EVP-HUMAN RESOURCESSanjeev Kumar Singh
ASSOCIATE VICE PRESIDENTSudhanva Jategaonkar
ADVERTISING SALESShashin Bhagat (Ahmedabad)[email protected]
Mahadev B (Bengaluru)[email protected]
Hari Hara Subramaniam (Chennai)[email protected]
Prakash N (Coimbatore)[email protected]
Rahul Hanchate (Hyderabad)[email protected]
Ameya Gokhale (Indore)[email protected]
Durgesh Grover (Jaipur)[email protected]
Inder Dhingra (Ludhiana)[email protected]
Mukesh Yadav (New Delhi)[email protected]
Rohit Dass (Pune)[email protected]
Chirag Pathak (Vadodara)[email protected]
MARKETING TEAMGanesh Mahale, Prachi Mutha, Varsha Nawathe, Abhay Borkar
NEWSSTAND AND SUBSCRIPTIONSDISTRIBUTION HEADSunil Nair
DEPUTY GENERAL MANAGERManoj Palsay
SENIOR MANAGER - SUBSCRIPTIONSSheetal Kotawdekar
CO-ORDINATORSRahul Mankar, Anant Shirke, Sarita Quadros,Chaitali Parkar, Kamlesh Mathkar, Vaibhav Ghavale
SERVICESSUBSCRIPTION SERVICES For subscription queries, write [email protected] or call +91 22 30034631-34 or toll free 1800 200 1021
PERMISSIONS For subscription to copy or reuse material from SEARCH,Write to [email protected]
Views and opinions expressed in this magazine are not necessarily those of Infomedia18 Ltd, its publisher and/or editors. We at Infomedia 18 Ltd do our best to verify the information published but do not take any responsibility for the absolute accuracy of the information. Infomedia 18 Ltd does not accept the responsibility for any investment or other decision taken by readers on the basis of information provided herein. Infomedia 18 Ltd does not take responsibility for returning unsolicited material sent without due postal stamps for return postage. No part of this magazine can be reproduced without the prior written permission of the publisher. Infomedia18 Ltd reserves the right to use the information published herein in any manner whatsoever.
Infomedia 18 Ltd is the publishing arm of Network 18.
Printed by Mohan Gajria and published by Lakshmi Narasimhan on behalf of Infomedia 18 Ltd.Executive Editor: Archana Tiwari-NayuduPrinted at Infomedia 18 Ltd, Plot no.3, Sector 7, off Sion-Panvel Road, Nerul, Navi Mumbai 400 706, and published at Infomedia 18 Ltd, ‘A’ Wing, Ruby House, J K Sawant Marg, Dadar (W), Mumbai - 400 028. SEARCH is registered with the Registrar of Newspapers of India under No. 67827/98. Infomedia 18 Ltd does not take any responsibility for loss or damage incurred or suffered by any subscriber of this magazine as a result of his/her accepting any invitation/offer published in this edition.
18 SEARCH - THE INDUSTRIAL SOURCEBOOK | J A N U A R Y 2 0 1 2
UROZONELast quarter, the biggest issues facing the global economy were the crisis in the Eurozone and uncertainty about the path of US monetary and fiscal policy. Well, nothing seems to have changed. These remain the big issues. And yet,
much has indeed changed. In Europe, the members of the Eurozone agreed on a new package for assisting Greece, only to find that financial market stress kept getting worse as market participants doubted the
package would be sufficient. The fortune of the Eurozone depends crucially on whether -
and how fast - a convincing solution to the debt crisis can be found and implemented. Fears of a Greek default
and its contagion effect, including the possibility of an ensuing banking crisis, hang over the economy
like the sword of Damocles. Leaders are currently trying to solve three key issues: Dealing decisively with Greece while
firewalling other, less-affected fringe nations Establishing a mechanism for a functioning European bond market by giving the European Financial Stability Facility (EFSF) more money and more power Putting the announced plans on fiscal and
macroeconomic surveillance and enforcement into action. Eurozone growth is slowing. Sentiment has
deteriorated over the summer amid signs of weakening global demand and disappointed hopes of solving the
sovereign debt crisis. This is a crucial time for Europe. If Eurozone leaders act decisively to stabilise financial markets and turn
their plans for closer cooperation into action, it could halt the downward spiral of deteriorating confidence and weakening activity. Real economic
Global economic activity weakened in the fi rst half of 2011. In advanced economies, the recovery was dragged down by the continued fragility in private sector balance sheets, as fi nancial markets were buffeted by a series of shocks, including greater Euro area sovereign risks and the credit downgrade of the US. Tracking the impact of these on the emerging economies, here’s analysing the prospects that the global economy holds...
ProspectsConstrained,
SturdyYetYet
E
18 SEARCH - THE INDUSTRIAL SOURCEBOOK | J A N U A R Y 2 0 1 2
J A N U A R Y 2 0 1 2 | SEARCH - THE INDUSTRIAL SOURCEBOOK 19
GLOBAL ECONOMIC OUTLOOK
indicators are not yet indicating a recession, but markets remain unsettled by deteriorating sentiment and speculation about the future of the monetary union.
THE UNITED STATESIn the United States, it is likely that job growth failed to materialise, in part, because the private sector faced increased costs associated with regulatory oversight in health care, financial services, and energy. Add to this, the increase in government spending that was used to fund short-term consumption, shifting wealth from the future into the present. And finally, the Federal Reserve’s high-risk but ultimately unsuccessful second round of quantitative easing increased oil and food prices but did little to stimulate real growth.
The first piece of hard data that argues in favor of a recession can be found in the most recent readings on US Gross Domestic Product (GDP). While the 2007–2009 recession was more severe than previously advertised, the new data also showed that real GDP growth in the second quarter was up just 1.5% from a year ago. Since 1947, there have been 14 occasions when real GDP growth slowed below 2%. In 11 of those cases, the economy fell into a recession, which puts the historical probability at 78%.
The second development that raises the risk of a recession in the United States is the European debt crisis and a corresponding recession that would follow it. A recession in Europe would wash back into the US economy in several ways, including trade, industrial production, corporate profitability, and banking. The European Union is a major trading partner for the United States, accounting for $259 billion in exports, which is roughly 12% of the $1.9 trillion in total US exports. During the 2008–2009 recession, exports to the EU fell sharply from a peak of $272 billion to $220 billion, a peak-to-trough decline of 19.1% over a fifteen month period. Even with a recovery, the US exports to the EU are still 4.9% below their mid-2008 peak.
Another recession in Europe would have a comparable drag on US exports. A comparable decline to what happened in 2008–2009 would bring US exports down to $210 billion. Since Europe would not be the only place from which US exports would decline, the trade sector would become a drag on growth.
US businesses are going into this recession with much stronger balance sheets and much leaner operations than in 2008. Cash levels and productivity are substantially higher. With leaner operations, layoffs and inventory reduction will not create the kind of downdraft for the broader macro economy that they did in 2008. On the downside, the policy options available to address the recession are much more limited today than they were in 2008. Back-to-back stimulus programs in 2009 and 2010 in excess of $800 billion are unthinkable today. A third round of quantitative
easing is possible, but it will be controversial and given the effectiveness of the previous round, may be of limited value. Weaker exports, a decline in business investment, and contracting manufacturing will likely combine to push an economy that is operating at stall speed into a recession.
UNITED KINGDOMConsistent with the other large industrialised countries, UK growth slowed sharply in the second quarter (although, in the case of the UK, activity was somewhat depressed by timing effects and by the impact of Japan’s tsunami and earthquake). UK domestic fundamentals have weakened, but the big change has been in the global environment. The Eurozone debt crisis created fears of a vicious spiral of sovereign and bank defaults. One consequence has been the virtual closure of corporate bond and bank term funding markets to new issuance.
Confidence about global growth has waned. Consensus forecasts for GDP growth have declined across the industrialised world. The UK consumer sector remains weak with spending under pressure from a severe squeeze on real incomes. Over the last year, real personal disposable incomes have fallen by almost 3%, the fastest rate of decline in this indicator of consumer spending power since 1976. With consumer borrowing growing at single-digit rates, credit has been unable to fill the gap. Over the last year, retail spending has hardly increased, and house prices have fallen. Mortgage approvals, a key leading indicator for housing activity, remain at historically low levels.
Much will hinge on the speed and effectiveness of the response from European policymakers to the crisis in the Euro area. A combination of monetary ease in the UK and abroad should help bolster growth next year. So, too, will sharply lower inflation; UK inflation is widely expected to almost halve over the next 12 months, and this will support consumer spending power. But the UK’s fortunes are heavily dependent on events in the Euro area. Financial stress, as Lehman’s failure demonstrated, can spread contagiously. Disruption to demand in the Euro area would hit the UK’s largest export market. Introducing another round of quantitative easing in the UK is politically and technically straightforward, but finding a solution to the problems of the Euro area is precisely the opposite.
RUSSIAAt long last, the political situation in Russia has clarity. It was announced that Prime Minister Putin will return as president in March 2012, exchanging jobs with President Medvedev. This means that, in theory, Putin could be president for the next 12 years since the constitution would allow this. Yet, clarity about who occupies which chair does not imply clarity about the policy outlook, which remains uncertain. And it could be that uncertainty pertaining to
20 SEARCH - THE INDUSTRIAL SOURCEBOOK | J A N U A R Y 2 0 1 2
GLOBAL ECONOMIC OUTLOOK
policy has contributed to a declining value of the ruble. In the past few years, Russia has experienced almost $250 billion in capital flight, given the weak global economy and a perception of poor investment opportunities at home. Such flight puts downward pressure on the currency.
Unfortunately, a slowing global economy and dampening oil prices will not be helpful. Instead, the economy will mostly have to rely on domestic demand. While consumer spending is doing well, fixed asset investment is not growing at a speed that would offset a slowdown in exports. On the positive side, consumer spending continues to rise, given rising real wages and greater access to consumer credit. Also, it is widely expected that fiscal policy will be more expansive in the months leading up to the election in March. This expectation is based on the fact that similar policy shifts have taken place in the past. Fiscal expansion will likely have a positive impact on economic activity.
Also on the positive side is the fact that inflation is not accelerating. The central bank tightened monetary policy during the first half of 2011, but it left policy unchanged since May. This tightening, combined with declining global food and energy prices, has caused inflation to peak below 10%. In addition, it is expected that inflation will gradually decline in the coming year. However, a steep drop in the value of the ruble could have an inflationary impact.
As for monetary policy, the deceleration of inflation provides the central bank room for engaging in more aggressive policy, should the economic slowdown become onerous. On the other hand, while the central bank does not explicitly target the exchange rate, a declining ruble could restrain the bank from cutting interest rates.
BRAZILBrazil’s central bank has chosen a new path. After a two year period of raising interest rates in order to fight rising inflation, the bank suddenly and unexpectedly cut the critical Selic rate in August. The changing fortunes of the global economy have caused the central bank to rethink its policy in light of a new outlook.
Going forward, it seems likely that interest rates will be cut further. After all, the inflation-adjusted interest rate remains fairly high by global standards. A lower rate will help maintain a satisfactory level of business investment. In addition, the rate of inflation is expected to decline as the economy slows and, especially, as commodity prices stabilize. Thus, a looser monetary policy is likely to be beneficial.
The Brazilian economy will probably grow more slowly in the coming year than it did recently. The lagged effect of tight monetary policy and a high valued currency will take its toll on growth. Yet the new policy of lower rates, combined with a declining currency, will help boost investment and exports. Foreign direct investment is likely to be strong given expectations about Brazil’s long-term future.
The big uncertainty concerns the impact of the global economy on Brazil. A severe recession in Europe emanating from a partial collapse of the Eurozone would certainly have a negative impact on Brazil. Moreover, a global slowdown could have a significantly negative impact on commodity prices, which in turn, would hurt Brazil’s export revenue.
MEXICOAt the turn of this century, Mexico was Latin America’s largest economy. Its prospects were akin to those of the BRIC nations. However, as the BRICs’ marched ahead, Mexico, it seems, lost its way. Despite being an uppermiddle-income nation, Mexico continues to grapple with widespread income inequality and poverty. Between 2000 and 2010, Brazil’s economy grew at an average rate of 3.7% compared to Mexico’s 2%. Today, Brazil’s economy is larger than Mexico and growing at a faster pace. While the outlook for China, India, and Russia is much more favorable, Mexico finds itself caught in the crossfire of violent drug cartels and the prospect of an economic slowdown for its major trading partner, the United States. Yet, Mexico has tremendous potential and if policymakers tackle the country’s challenges effectively, the economy could blossom once again.
The economy will be constrained by declining oil output (due to underinvestment), poor business investment, and the likelihood of an unstable environment due to widespread violence. If remittances continue to increase, it could potentially boost domestic demand and positively impact the local economy. Higher consumer spending will likely benefit the retail industry as more people transition into the middle class. If demand from the United States strengthens, the export sector will be boosted. With elections due this year, tackling security concerns and making Mexico’s economic environment conducive for large-scale foreign and domestic investment will be high on the agenda.
ASIAThe increased uncertainty over the global outlook and greater risk aversion in financial markets spilled over to Asia in August and September 2011, with leveraged investors liquidating profitable positions in the region to cover their losses elsewhere. As a result, many Asian financial and currency markets experienced declines of magnitudes similar to those experienced in mid 2010.
After a strong start in the first quarter of 2011, economic activity in Asia has also moderated (Figure 1.1). Sluggish demand in advanced economies and supply chain disruptions after the tragic March 2011 earthquake and tsunami in Japan led to a broad-based decline in industrial production and export growth across Asia. High frequency indicators, including manufacturing purchasing managers’ indices (PMI) and export orders, suggest that the moderation of activity continued in the third quarter of 2011.


22 SEARCH - THE INDUSTRIAL SOURCEBOOK | J A N U A R Y 2 0 1 2
GLOBAL ECONOMIC OUTLOOK
By contrast, Asian domestic demand has proven generally resilient in 2011. Employment gains and real wage growth supported private consumption, and high capacity utilisation boosted private investment. Financial conditions have remained accommodative in most of Asia, as increases in interest rates were offset partly by higher inflation in some economies (such as Korea, Malaysia, and Thailand), and real effective exchange rates have generally not strengthened during 2011, except in a few commodity exporters, including Indonesia, Australia and New Zealand, as well as in Korea & Singapore. By contrast, monetary policy normalisation and slowing credit growth have contributed to tighter financial conditions in China and India.
Notwithstanding the moderation in growth, inflationary pressures across the Asia-Pacific region remain elevated. Headline inflation continued to increase in most economies and averaged 5.5% (year over year) in July 2011, as compared
with 4.6% in January. In particular, inflation has continued to rise in China, Hong Kong SAR, Korea & Vietnam, and remains above central banks’ explicit or implicit targets in many cases. Inflation has been driven by commodity prices, but also in many economies by sustained demand pressures. Indeed, core inflation has increased in Hong Kong SAR, India, Indonesia, Korea, Malaysia and Thailand, as second-round effects of previous commodity price rises have fed through to generalised inflationary pressures.
Inflation expectations have also risen since the first quarter of 2011 in a number of economies. In contrast to the rest of the region, Japan’s deflationary pressures persisted, with core inflation that excludes food and energy prices still in negative territory as of July 2011.
DYNAMICS AND COMPOSITION OF GROWTHThe dynamics and composition of growth in 2011 have
varied across Asia: In much of industrial Asia, economic activity has been
significantly influenced by natural disasters. In Japan, the earthquake and tsunami led to a sharp contraction in domestic demand. In Australia, cyclones and flooding disrupted mineral output, although strong global demand for coal and iron pushed the terms of trade to 60-year highs and supported private investment. New Zealand’s economy, however, continued to expand despite the impact of the January 2011 earthquake.
In East Asia, growth has been held up by strong domestic demand. In China, gains in wages employment supported private consumption, whereas strong private investment, including real estate investment, offset a slowdown in public investment. Growing financial and economic integration with the mainland helped cushion Hong Kong SAR and Taiwan Province of China against weaker
external demand from advanced economies. In Korea, continuing easy financial conditions and wage growth supported private domestic demand. In several ASEAN economies, strong domestic
demand, particularly investment, helped mitigate the slowdown in export growth. In addition, commodity exporters, such as Indonesia and Malaysia, benefitted from the rise in commodity prices through mid-2011. Inflation concerns have persisted in Vietnam. In South Asia, private consumption remained
robust in India on account of rising disposable income, but investment was subdued partly on concerns over governance and the global outlook. In Bangladesh, buoyant credit growth amid a still-accommodative monetary stance continued to fuel domestic demand, while in Sri Lanka activity benefitted from greater political stability. In Nepal, domestic demand was subdued on investor concerns
over banking system fragilities and a decline in remittances from the Middle East.
In other low-income countries and Pacific Island economies, commodity exporters such as Mongolia and Papua New Guinea benefitted from high mineral prices in the first half of 2011, and new garment quotas in European markets contributed to buoyant exports in Cambodia. In Mongolia, growth has also been fuelled by expansionary macroeconomic policies, which boosted underlying inflation above the authorities’ target. However, in a number of Pacific Island economies, high commodity prices continued to weigh on growth, although the strong Australian dollar boosted tourism flows.Net capital flows into emerging Asia have moderated
so far in 2011 relative to 2010, following the sharp rise in global risk aversion. Within the region, however, there are large disparities — in the first half of 2011, capital
30
25
20
15
10
5
0
-5
-10
Sing
apor
e
Japa
n
Thai
land
Phili
ppin
es
New
Zea
land
Taiw
an P
rovi
nce
of C
hina
Hong
Kon
g SA
R
Mal
aysi
a
Kore
a
Indi
a
Aust
ralia
Indo
nesi
a
Chin
a
2011:01 2011:02
Sources: CEIC Data Company Ltd.; Haver Analytics; and IMF staff calculations.
Figure 1: Selected Asia: Real GDP at Market Prices(Quarter-over-quarter% change; SAAR)

24 SEARCH - THE INDUSTRIAL SOURCEBOOK | J A N U A R Y 2 0 1 2
GLOBAL ECONOMIC OUTLOOK
China’s economic growth is decelerating because of the weakening global economy and tightened monetary policy. Overall debt has nearly tripled in the last fi ve years and signifi cant investments in fi xed assets may loom heavily over China’s longer term.
hina’s economy is decelerating. In September, the purchasing managers’ indices for output
and exports were below 50 for a third month in a row, which has not happened since 2009. Still, the indices
barely slipped below 50, indicating that the decline in manufacturing is moderate. Moreover, China’s central bank has stopped tightening policy given the latest global slowdown. Therefore, although China’s economy
will slow down, deceleration will likely be less-than-dramatic. On the other hand, it is notable that a senior Chinese official recently predicted that growth in 2012 would be below 9%. If this prediction materialises, it would be the
China:Slower growth,
longer-term risks
C
inflows remained strong in China, thus reflecting increased borrowing by mainland firms from Hong Kong SAR, and in India & Indonesia, where strong growth prospects and interest rate differentials attracted large equity and bond inflows, respectively. In East Asia (excluding China) and Singapore, however, concerns about slowing growth led to net capital outflows. Although direct investment and banking inflows to Asia have been relatively resilient, equity and bond inflows have been volatile, with equity recording sharp outflows since August 2011.
GROWTH FORECAST Looking ahead, for the region, growth is forecast to average 6¼% in 2011 and 6¾% in 2012. The somewhat weaker growth forecast for Asia mainly reflects the deteriorating outlook for exports to advanced economies. The impact would be smaller for domestic demand-based economies, such as China, India & Indonesia and larger for highly open economies that specialise in income-sensitive, high-tech consumer and investment goods, such as Korea, Singapore and Taiwan Province of China. Adverse regional supply chain disruptions are not expected to play a major role in the future, as Japanese production in key sectors returned to normal levels.
The fundamentals for domestic demand in the region remain strong and are expected to cushion the impact of weaker external demand on overall growth in 2012: In Industrial Asia, reconstruction investment will be the
main driver of domestic demand growth in Japan, while investment in mining will propel growth in Australia.
In East Asia, more spending on social housing is expected to support investment in China. Moreover, accommodative
financial conditions and high capacity utilisation should boost private investment in Korea, while strong employment is expected to sustain private consumption in Hong Kong SAR.
In more advanced ASEAN economies, in addition to favourable labour market conditions and high capacity utilisation, greater public investment projects will provide an additional boost to domestic demand in Indonesia, Malaysia, the Philippines and Singapore. In Thailand, the new government is seeking to stimulate domestic demand through measures to increase disposable income and private investment.
In India, robust disposable income growth (including from high agricultural prices) and accommodative financial conditions are expected to support private consumption and investment.Headline inflation is expected to decelerate gradually in
2012. But inflation is expected to remain above the midpoint of the target range in most Asian economies, as commodity prices fall only slightly, domestic demand pressures persist and inflation spillovers from key regional economies remain elevated. The September 2011 World Economic Outlook, (WEO) projects fuel and nonfuel commodity price inflation in 2012 to recede by 3.5% and 4.5%, respectively – a mild deceleration relative to the sharp run up in 2010-11.
Moreover, output gaps in many Asian economies will remain positive in 2012. Finally, inflation in China is expected to settle at levels that, while lower than the peak in 2011, are higher than in the recent past – with spillovers to inflation in the rest of Asia.
Let’s take a look at the fortunes of major Asian economies in the near-term:


26 SEARCH - THE INDUSTRIAL SOURCEBOOK | J A N U A R Y 2 0 1 2
GLOBAL ECONOMIC OUTLOOK
first year since 2001 that growth falls below 9%. These comments reflect a belief that a combination of monetary policy tightening and reduced global growth will cause the Chinese economy to grow more slowly.
Interestingly, there is an evidence that the economic slowdown is being experienced principally by small- to medium-sized private businesses and not by the large, state-run enterprises that retain favourable access to credit. After all, imports of oil and iron ore rose significantly in August. The biggest source of recent growth has been fixed asset investment, especially construction. The importation of iron ore, used to make steel, indicates ongoing strength in construction. Meanwhile, a deceleration in exports is the prime cause of the economic slowdown. While the strength of construction is good in the short term, it means that China continues to over-build.
EXCESSIVE DEBT China’s officials have complained about the rapid expansion of US Government debt. This reflects fear that the massive stock of foreign currency reserves held by China’s Government could lose value. Less attention, however, has been paid to the big increase in overall debt in China itself. Yet, that is likely to change soon, given the fact that overall debt has nearly tripled in the past five years.
HOW DID IT COME TO THIS?When the global economic crisis began in 2008 and China’s exports suddenly dropped, the government implemented a vast stimulus programme to boost domestic demand and offset the drop in exports. Part of this involved extending credit to provincial and local governments to engage in infrastructure development. In the short run, this policy was successful in boosting growth and preventing a general recession. The problem, however, is that many such investments have failed
to generate adequate returns. The Chinese Government estimates that little more than one quarter of local government investment has produced a return adequate to service the debts.
Furthermore, local government borrowing is not the entire problem. During the global crisis, the government injected capital into state-run banks so that they could lend to state-run companies. The result was an investment boom. Yet this also involved many investments that are not producing an adequate return. The result was that investment in fixed assets surged, reaching almost 50% of last year’s GDP.
WHAT EXACTLY IS THE RISK?Is China at risk of having a financial crisis? On one hand, there is a danger that a new round of defaults will damage the solvency of China’s state-run banking system. Yet, it is likely that the government would bail out such banks and thereby prevent a larger financial crisis. Moreover, due to capital controls, China’s financial system is not integrated into the global economy. Therefore, a problem in China’s banks would not lead to problems outside China.
On the other hand, China does face a risk. Specifically, if the government were compelled to bail out troubled financial institutions, it would probably not support continued lending for the purpose of poorly conceived investments. Consequently, investment would likely fall considerably. Given that investment is now close to 50% of GDP, such a fall could have serious consequences for GDP without an offsetting increase in something else. What could that something else be?
Exports are not likely to take up slack. With a rising currency, slower growth overseas, and rising wages at China’s factories, it seems likely that export growth will be slow in the next few years. In this scenario, China will likely look towards a boost in consumer spending to offset a decline
in investment, but it would have to grow rapidly to make a difference and avoid a significant slowdown, given that consumer spending is now only 35% of GDP.
WHAT COULD GO RIGHT?There are some positive signs concerning the prospect for boosting consumer spending. First, wages have been rising, adding to real, disposable incomes. This reflects a shortage of labour as demographic trends limit the labour force’s growth and as internal migration slows. In addition, provincial and local governments have been increasing their minimum wages. Second, the government intends to have state-run companies pay higher dividends to shareholders. In doing so, this will reduce retained earnings and therefore, the impetus to invest. Third, higher inflation will help reduce some of the real value of the debts in question. On the other hand, high inflation means that real interest rates are largely negative, thereby fuelling continued borrowing. Also, high inflation means that the real value of the currency is rising quickly, thereby hurting export competitiveness. So, a slowdown in exports could become more pronounced.
WHAT HAPPENS NEXT?It is safe to say that China is slowing down. In addition, the excessive debt-financed investment of recent years will likely lead to challenges somewhere down the road. In that situation, economic growth will decelerate. How much it slows will depend on a variety of factors, including how the government responds to such an event. In any event, an economic slowdown in China will have global ramifications. A Chinese slowdown will remove pressure on global commodity prices and reduce export growth for China’s major trading partners. Domestically, slower growth could remove some of the upward pressure on wages and prices.
J A N U A R Y 2 0 1 2 | SEARCH - THE INDUSTRIAL SOURCEBOOK 27
GLOBAL ECONOMIC OUTLOOK
n a world of slowing economic growth, Japan is the exception. In fact, the country can
reasonably expect that growth will soon accelerate — at least for a while. The silver lining of a natural disaster is the extra spending that boosts economic growth, but the positive impact of reconstruction spending has not met expectations. Challenges remain for the Japanese economy.
In the second quarter of 2011, the economy contracted at a rate of 2%. This third consecutive quarter of declining GDP was, in part, due to the negative impact of the earthquake and tsunami. While many analysts anticipated a strong boost to economic growth in the second half of 2011, the latest numbers suggest slower growth than expected. The Tankan index of sentiment at large manufacturing companies rose from -9 in the second quarter to +2 in the third quarter. A positive reading means that there are more optimists than pessimists among the surveyed executives. The current reading is still lower than in March, just before the earthquake. Japan is recovering, but the pace is underwhelming. This is likely due to slower overseas growth, a high-valued yen and slower than expected reconstruction spending.
The rising value of the yen is taking its toll on the industrial sector. While the automotive sector is recovering from damage to its supply chain, the major players are planning to
shift production capacity offshore in order to avoid the impact of an overvalued currency. The strong yen reflects several factors, including the repatriation of overseas funds for the purpose of reconstruction. It is also due to the perception of Japan as a safe haven for financial assets in a time of global turmoil. Although the return on Japanese assets is very low, global investors do not perceive them to be at risk of outright failure.
Still, despite troubles in Japan’s export sector, the country will probably grow faster in 2012 than either Europe or the US. This case would be different sans the earthquake or tsunami; reconstruction spending will make a significant difference.
In September, the Japanese Government proposed its third reconstruction budget of 12 trillion yen — roughly $160 billion, which is about twice of what has already been budgeted. This brings the total to about $240 billion. The big debate has been over how to finance this expenditure. The current government has indicated a preference for tax increases so as to not substantially increase the already large debt. As such, it is likely that there will be an increase in the consumption tax. This will have some negative impact on consumer spending. In addition to increasing the consumption tax, the government plans to sell assets such as shares in Japan Tobacco to fund reconstruction.
Interestingly, the government’s
deficit was already projected to be 8% of the GDP even before the earthquake. Reconstruction costs, by adding an estimated 4% of GDP, will not have a big impact on overall debt, even if it is financed by borrowing. Meanwhile, despite the government’s plans for fiscal rectitude, Moody’s has again downgraded Japan’s sovereign debt. This action had little impact on the market for Japanese Government bonds, which continue to offer among the lowest rates of return in the world. While Moody’s was evidently concerned about the fact that government debt has reached 200% of GDP, there are other mitigating factors. For example, 95% of that debt is held domestically. In addition, Japan continues to have a very high rate of savings, so financing government deficits is not a problem.
Interestingly, Japanese monetary policy has been relatively aggressive this year; the Bank of Japan is engaged in quantitative easing on a surprisingly large scale, but perhaps it has not been large enough. The currency continues to rise, and inflation continues to be very low. One of the purposes of a round of quantitative easing is to boost expectations of inflation. Higher inflation can have the effect of boosting spending, reducing real interest rates and reducing the real value of debts. However, retail sales are declining, business investment fell in the second quarter and inflation remains close to zero. Thus, the real level of debt has
Japan: On theBright side…
The Japanese economy is one of the few economic bright spots in a world that is experiencing slower growth. Japan is recovering from a natural disaster and additional spending will likely accelerate the Japanese economy next year. However, slower overseas growth, a high-valued yen and slower than expected reconstruction spending, are introducing obstacles to the country’s economic prospects.
I
28 SEARCH - THE INDUSTRIAL SOURCEBOOK | J A N U A R Y 2 0 1 2
GLOBAL ECONOMIC OUTLOOK
Indian policymakers are trying to curb the rapidly rising infl ation and simultaneously sustain growth despite a weakening global economy. GDP growth may continue to hover around 7.5% for the current fi scal year.
ver the past two years, India has experienced one of the highest inflation rates in major
emerging markets. High food inflation and fears of a lack of meaningful fiscal intervention have compelled the central bank to increase interest rates in order to pursue lower prices at the expense of growth. The central bank’s latest tightening in September – the 12th since March 2010 – comes in the wake of fears of a global recession and the possibility of debt defaults in some Eurozone countries. While some critics of the central bank say that the bank has been too slow in reacting to inflation and has not been bold enough with its rate increases, several others lament the rising cost of capital and falling domestic demand. While the debate regarding India’s monetary policy rages on, it is becoming increasingly likely that the Indian Government will not meet its fiscal deficit target for the year. While policymakers tinker with policy tools, the Indian economy is on course to achieve over 7% growth this fiscal year.
INFLATION STAYS HIGHInflation continues to be the key issue
for Indian policymakers. In a bold move to curb inflation, the central bank raised interest rates by 50 bps in July and by another 25 bps in September. Despite recent rate increases, inflation came in at over 9% in July and hit a 13-month high of 9.8% in August. Food inflation, despite hitting a 20-month low of 7.3% in July, settled at 9.1% in September. That food inflation continues to be an issue, despite a good harvest in the 2010-11 season and normal rainfall this year, is a clear indication that structural issues and supply-side bottlenecks that plague the Indian agricultural sector will remain for some time to come. Fuel inflation is beginning to exert upward pressure on headline inflation as well. While the inflationary impact of the rise in fuel prices is worrisome, what is interesting is the fact that the latest price increase was the result of the depreciating rupee against the dollar on imports of crude oil.
THE EXTERNAL SECTOR With policymakers wrestling to control inflation and sustain growth in the context of a weak global
economy, the rupee hit new lows as global funds chase better prospects for growth. The falling rupee is a serious cause of consternation for importers, oil companies included. At the same time, while one would normally expect a weaker rupee to benefit exporters, a shaky global recovery means exporters may not be able to take advantage of the opportunity for cost arbitrage in the coming months.
CONSUMPTION IS BAD, BUT INDUSTRY IS WORSEInterest rate hikes have finally begun to put the brakes on GDP growth in India. GDP growth for the first three months of 2011 came in at 7.8%, as compared to a growth of 9.4% in the corresponding quarter of 2010. Figures for the quarter that ended July further corroborate the slowdown in growth. GDP grew at 7.7% as compared to 8.8% the previous year. What is
surprising about
India:Trudging along,
for Now
O
not improved.Going forward, Japan continues to
face several downside risks despite the anticipated boost from reconstruction spending. The global economic
slowdown is the first among these risks as it will have a negative impact on export growth. Domestically, major challenges include a slower than expected revival of electricity generating
capacity, uncertainty about the future of Japan’s nuclear programme, political uncertainty, a continued high rate of savings, and long-term problems related to demographics.
J A N U A R Y 2 0 1 2 | SEARCH - THE INDUSTRIAL SOURCEBOOK 29
GLOBAL ECONOMIC OUTLOOK
data from the recent quarter is that investment increased almost 8%.
High interest rates, combined with a potential liquidity challenge in the second half of the year, could ensure that investment drops off once again as the year progresses. The Central Government recently announced that it will need to borrow 13% more than what it budgeted for the current fiscal year primarily due to a reduction in funds available through national savings accounts; there has been an exodus of funds from national saving accounts toward accounts in banks as they offer higher interest rates. This mopping up of funds from the market, although unlikely to add to the fiscal deficit, could crowd out investment from the private sector and increase the cost of borrowing for both government as well as private sector borrowers. However, the central bank is likely to be called upon to buy government bonds from the market in order to infuse
liquidity and this could, in turn, add to inflation.
Consumer demand has taken a hit, and growth in rate sensitive sectors has been weak in the last two quarters. Still, relatively speaking, domestic consumption is robust and is likely to act as a buffer for the economy in the event of further global economic turbulence. However, it is important to note that policymakers are currently grappling with high inflation.
Both the finance minister and the head of the central bank believe that current levels of food inflation are a matter of grave concern, and another hike in interest rates is a possibility. That being said, we could also be very close to the end of the rate increases. Until there is a clear indication that interest rates will stabilise, business confidence is likely to continue to drop. Private investment is expected to slow down in the coming months as well.
A LOOK AHEADThe challenges that face Indian policymakers are, to a large extent, the same as they were a year ago. Inflation shows no signs of abating, and another interest rate hike is a possibility, but the end of the cycle of rate increases is probably very close. Consumer demand is likely to continue to slow down as monetary policy kicks in with some lag. Consequently, GDP growth may slow down further and may hover around 7.5% for the current fiscal year. The fiscal deficit is unlikely to meet the target level of 4.6% of GDP. Since a significant portion of the deficit is funded through funds from the central bank, money supply in the economy will continue to increase and exert upward pressure on inflation.
The article is an excerpt from ‘Navigating An
Uncertain Global Environment’ by IMF &
Deloitte Global Economic Outlook, 4th Quarter
2011.
30 SEARCH - THE INDUSTRIAL SOURCEBOOK | J A N U A R Y 2 0 1 2
RANKING METHODOLOGY
TOP 500TOP 500Uncertain global economic conditions coupled with rising infl ationary trends are posing a threat to India Inc.’s stupendous growth journey. Withstanding such external as well as internal shocks is our pack of Top 500 Manufacturing Companies who have demonstrated to the world their mettle & might in true sense & spirit. Notably so, ranking these companies while taking all the fundamental aspects into consideration can never be an easy feat. Carefully crafting the most transparent methodology, we trace the inspirational journey of India Inc.’s most sought after manufacturing companies…
he l ist ing and analysis of the Top 500 Manufacturing Companies is an ode to those, who, by virtue of
their grit & determination, have set enviable benchmarks when it comes to not only the financial performance, but also imbibing societal values and ethics. These are the companies who believe in leading by examples and setting milestones for emerging companies. In order to ensure a just & fair ranking, utmost care was taken while developing a step-by-step approach by taking each and every parameter into consideration. The process is as follows:
SELECTION CRITERIAThe classification of manufacturing companies from non-manufacturing companies is based on “The Central Excise Tariff Act 1985”. Also, companies wherein their core business activities do not contribute to excise payments have been excluded. However, the manufacturing companies with operation set up in excise exemption zones like SEZs and EPZs have been considered. Only the entities listed on BSE or NSE have been considered.
CLASSIFICATION & ASSUMPTIONSThe ranking is based on the consolidated results of the company. In cases, where the company does not have any subsidiary or latest data for consolidated results are not available,
the standalone results are assumed as consolidated results. The listed subsidiaries of the company qualifying the ranking criteria as detailed above have been excluded. Those companies having negative shareholder’s funds have also been excluded. The ratios as well as other company financials in absolute terms have been sourced through the database – CMIE Prowess. For the purpose of ranking, the annual financials of the companies has been sourced as available in the said database uptill December 4, 2011.
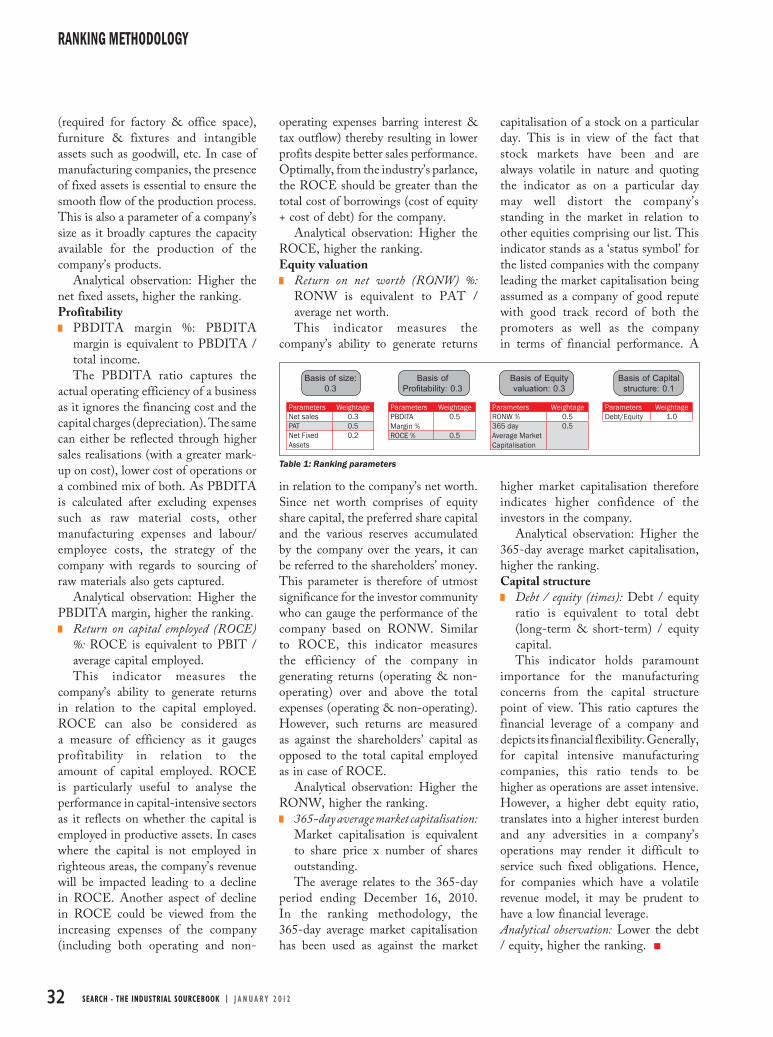
A STEP-WISE APPROACHStep 1: A two-tier weighting methodology was used to rank the companies. Step 2: Based on parameters selected and weightage specified for the same, ranking for each group was arrived at.Step 3: Each group was assigned a specific weightage to arrive at a weighted value for consolidating said values from all four groups.Step 4: The summation of weighted values for all four groups was then sorted in descending order to arrive at the final ranking.
The relevance of selection of the parameters with the weightage so appropriated has been detailed below. Size Net sales: Net sales is equivalent to
the sales of goods – excise duty paid. Any manufacturing concern is
primarily recognised by its size and the same can well be reflected through the company’s sales activity. Herein, ‘net sales’ has been preferred over ‘gross sales’ as the latter includes collection of excise duty from customers as applicable to the company’s products. Thus, a higher levy of excise duty for the company’s products would inflate the company’s gross sales. The net sales figure ignores the levy of excise and reflects the value of goods sold with a mark-up on cost.
Analytical observation: Higher the sales, higher the ranking. Profit after tax (PAT): PAT is
equivalent to PBDITA – Depreciation – Interest – Tax paid.PAT value determines earnings of
the company post operating expenses, interest, depreciation, other non-operating expenses & tax. It reflects the company’s ability to recover its overall expenses (operating as well as non-operating) through a mark-up on the cost of goods manufactured. A company registering high sales, but still recording negative PAT figures is probably not prospering as the expenses are still left unrecovered.
Analytical observation: Higher the PAT, higher the ranking. Net Fixed Assets: Net fixed assets is
equivalent to gross fixed assets – depreciation. This reflects the book value of assets
owned by the company in the form of plants & equipment, land & buildings
T
Deciphering the
Manufacturing CompaniesManufacturing CompaniesTOP 500TOP 500
32 SEARCH - THE INDUSTRIAL SOURCEBOOK | J A N U A R Y 2 0 1 2
RANKING METHODOLOGY
(required for factory & office space), furniture & fixtures and intangible assets such as goodwill, etc. In case of manufacturing companies, the presence of fixed assets is essential to ensure the smooth flow of the production process. This is also a parameter of a company’s size as it broadly captures the capacity available for the production of the company’s products.
Analytical observation: Higher the net fixed assets, higher the ranking.Profitability PBDITA margin %: PBDITA
margin is equivalent to PBDITA / total income. The PBDITA ratio captures the
actual operating efficiency of a business as it ignores the financing cost and the capital charges (depreciation). The same can either be reflected through higher sales realisations (with a greater mark-up on cost), lower cost of operations or a combined mix of both. As PBDITA is calculated after excluding expenses such as raw material costs, other manufacturing expenses and labour/employee costs, the strategy of the company with regards to sourcing of raw materials also gets captured.
Analytical observation: Higher the PBDITA margin, higher the ranking. Return on capital employed (ROCE)
%: ROCE is equivalent to PBIT / average capital employed. This indicator measures the
company’s ability to generate returns in relation to the capital employed. ROCE can also be considered as a measure of efficiency as it gauges profitability in relation to the amount of capital employed. ROCE is particularly useful to analyse the performance in capital-intensive sectors as it reflects on whether the capital is employed in productive assets. In cases where the capital is not employed in righteous areas, the company’s revenue will be impacted leading to a decline in ROCE. Another aspect of decline in ROCE could be viewed from the increasing expenses of the company (including both operating and non-
operating expenses barring interest & tax outflow) thereby resulting in lower profits despite better sales performance. Optimally, from the industry’s parlance, the ROCE should be greater than the total cost of borrowings (cost of equity + cost of debt) for the company.
Analytical observation: Higher the ROCE, higher the ranking.Equity valuation Return on net worth (RONW) %:
RONW is equivalent to PAT / average net worth. This indicator measures the
company’s ability to generate returns
in relation to the company’s net worth. Since net worth comprises of equity share capital, the preferred share capital and the various reserves accumulated by the company over the years, it can be referred to the shareholders’ money. This parameter is therefore of utmost significance for the investor community who can gauge the performance of the company based on RONW. Similar to ROCE, this indicator measures the efficiency of the company in generating returns (operating & non-operating) over and above the total expenses (operating & non-operating). However, such returns are measured as against the shareholders’ capital as opposed to the total capital employed as in case of ROCE.
Analytical observation: Higher the RONW, higher the ranking. 365-day average market capitalisation:
Market capitalisation is equivalent to share price x number of shares outstanding.The average relates to the 365-day
period ending December 16, 2010. In the ranking methodology, the 365-day average market capitalisation has been used as against the market
capitalisation of a stock on a particular day. This is in view of the fact that stock markets have been and are always volatile in nature and quoting the indicator as on a particular day may well distort the company’s standing in the market in relation to other equities comprising our list. This indicator stands as a ‘status symbol’ for the listed companies with the company leading the market capitalisation being assumed as a company of good repute with good track record of both the promoters as well as the company in terms of financial performance. A
higher market capitalisation therefore indicates higher confidence of the investors in the company.
Analytical observation: Higher the 365-day average market capitalisation, higher the ranking.Capital structure Debt / equity (times): Debt / equity
ratio is equivalent to total debt (long-term & short-term) / equity capital. This indicator holds paramount
importance for the manufacturing concerns from the capital structure point of view. This ratio captures the financial leverage of a company and depicts its financial flexibility. Generally, for capital intensive manufacturing companies, this ratio tends to be higher as operations are asset intensive. However, a higher debt equity ratio, translates into a higher interest burden and any adversities in a company’s operations may render it difficult to service such fixed obligations. Hence, for companies which have a volatile revenue model, it may be prudent to have a low financial leverage. Analytical observation: Lower the debt / equity, higher the ranking.
Basis of size: 0.3
Basis of Profitability: 0.3
Basis of Equity valuation: 0.3
Basis of Capital structure: 0.1
Parameters WeightageNet sales 0.3PAT 0.5Net Fixed Assets
0.2
Parameters WeightagePBDITA Margin %
0.5
ROCE % 0.5
Parameters WeightageRONW % 0.5365 day Average Market Capitalisation
0.5
Parameters WeightageDebt/Equity 1.0
Table 1: Ranking parameters

34 SEARCH - THE INDUSTRIAL SOURCEBOOK | J A N U A R Y 2 0 1 2
Disclaimer:This ranking is prepared by CARE Research, a division of Credit Analysis & REsearch (CARE). CARE Research has taken utmost care to ensure accuracy and objectivity while developing this ranking based on information available in public domain. The data pertaining to the companies so ranked has been sourced through Prowess database. However, neither the accuracy nor completeness of information contained in this ranking is guaranteed. CARE Research operates independently of ratings division and this ranking does not contain any confi dential information obtained by ratings division, which they may have obtained in the regular course of operations. The opinion expressed in this ranking cannot be compared to the rating assigned to the company within this industry by the ratings division. The opinion expressed is also not a
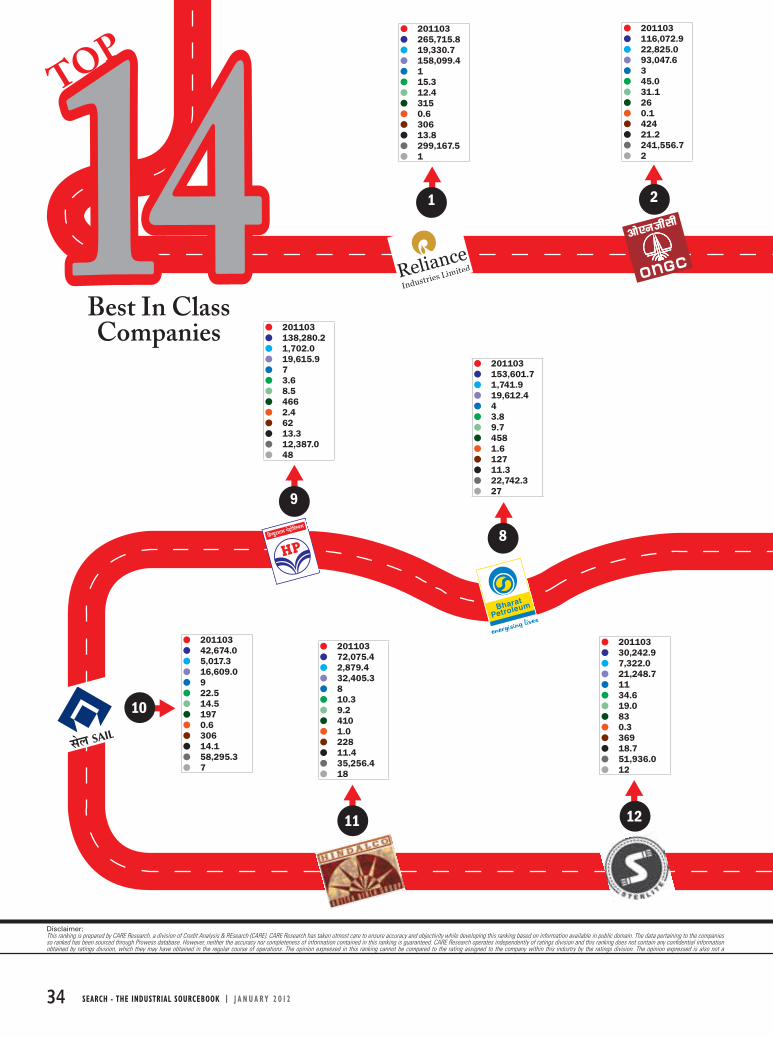
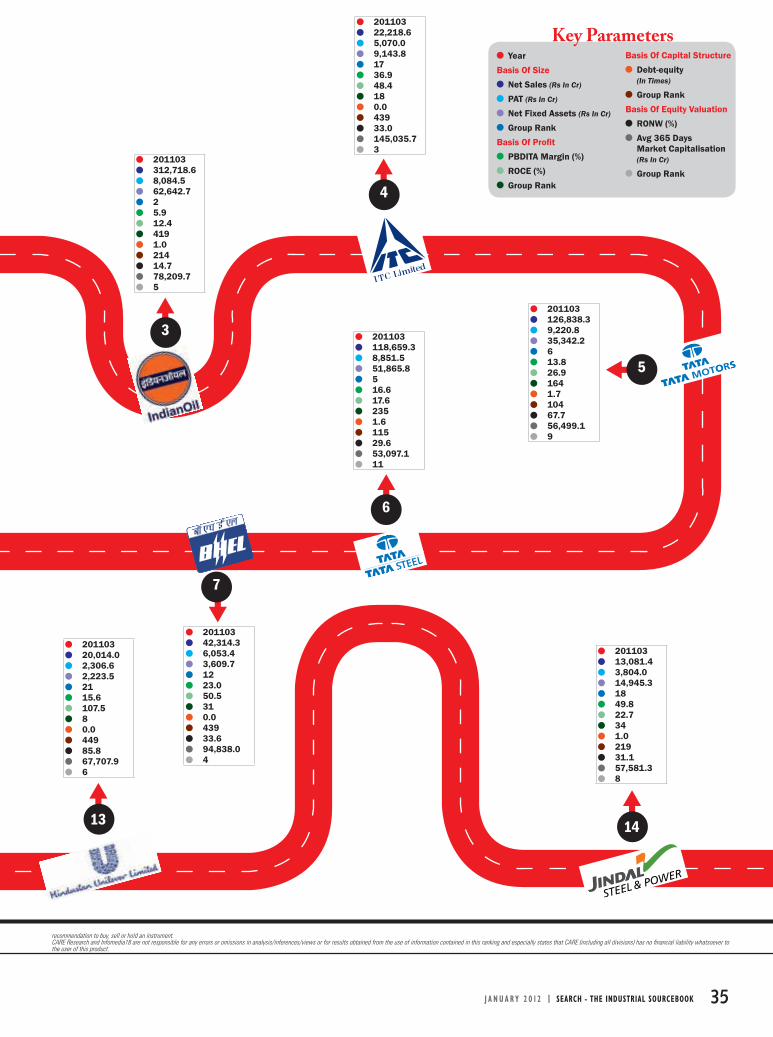
14TOP
Best In Class Companies
201103265,715.819,330.7158,099.4115.312.43150.630613.8299,167.51
201103116,072.922,825.093,047.6345.031.1260.142421.2241,556.72
201103 153,601.7 1,741.9 19,612.4 4 3.8 9.7 458 1.6 127 11.3 22,742.3 27
201103 138,280.2 1,702.0 19,615.9 7 3.6 8.5 466 2.4 62 13.3 12,387.0 48
201103 42,674.0 5,017.3 16,609.0 9 22.5 14.5 197 0.6 306 14.1 58,295.3 7
201103 72,075.4 2,879.4 32,405.3 8 10.3 9.2 410 1.0 228 11.4 35,256.4 18
201103 30,242.9 7,322.0 21,248.7 11 34.6 19.0 83 0.3 369 18.7 51,936.0 12
2
8
9
10
11 12
1414 1
J A N U A R Y 2 0 1 2 | SEARCH - THE INDUSTRIAL SOURCEBOOK 35
recommendation to buy, sell or hold an instrument.CARE Research and Infomedia18 are not responsible for any errors or omissions in analysis/inferences/views or for results obtained from the use of information contained in this ranking and especially states that CARE (including all divisions) has no fi nancial liability whatsoever to the user of this product.
201103 312,718.6 8,084.5 62,642.7 2 5.9 12.4 419 1.0 214 14.7 78,209.7 5
201103 22,218.6 5,070.0 9,143.8 17 36.9 48.4 18 0.0 439 33.0 145,035.7 3
201103 126,838.3 9,220.8 35,342.2 6 13.8 26.9 164 1.7 104 67.7 56,499.1 9
201103 118,659.3 8,851.5 51,865.8 5 16.6 17.6 235 1.6 115 29.6 53,097.1 11
201103 42,314.3 6,053.4 3,609.7 12 23.0 50.5 31 0.0 439 33.6 94,838.0 4
201103 13,081.4 3,804.0 14,945.3 18 49.8 22.7 34 1.0 219 31.1 57,581.3 8
Year
Basis Of Size
Net Sales (Rs In Cr)
PAT (Rs In Cr)
Net Fixed Assets (Rs In Cr)
Group Rank
Basis Of Profi t
PBDITA Margin (%)
ROCE (%)
Group Rank
Basis Of Capital Structure
Debt-equity (In Times)
Group Rank
Basis Of Equity Valuation
RONW (%)
Avg 365 Days Market Capitalisation (Rs In Cr)
Group Rank
Key Parameters
201103 20,014.0 2,306.6 2,223.5 21 15.6 107.5 8 0.0 449 85.8 67,707.9 6
3
4
6
7
13 14
5
COMPANY NAME YEARBASIS OF SIZE
NET SALES ( ` CR.) PAT ( ` CR.) NET FIXED ASSETS( ` CR.)
36 SEARCH - THE INDUSTRIAL SOURCEBOOK | J A N U A R Y 2 0 1 2
FINA
L RAN
K
GROU
P RA
NKIN
G
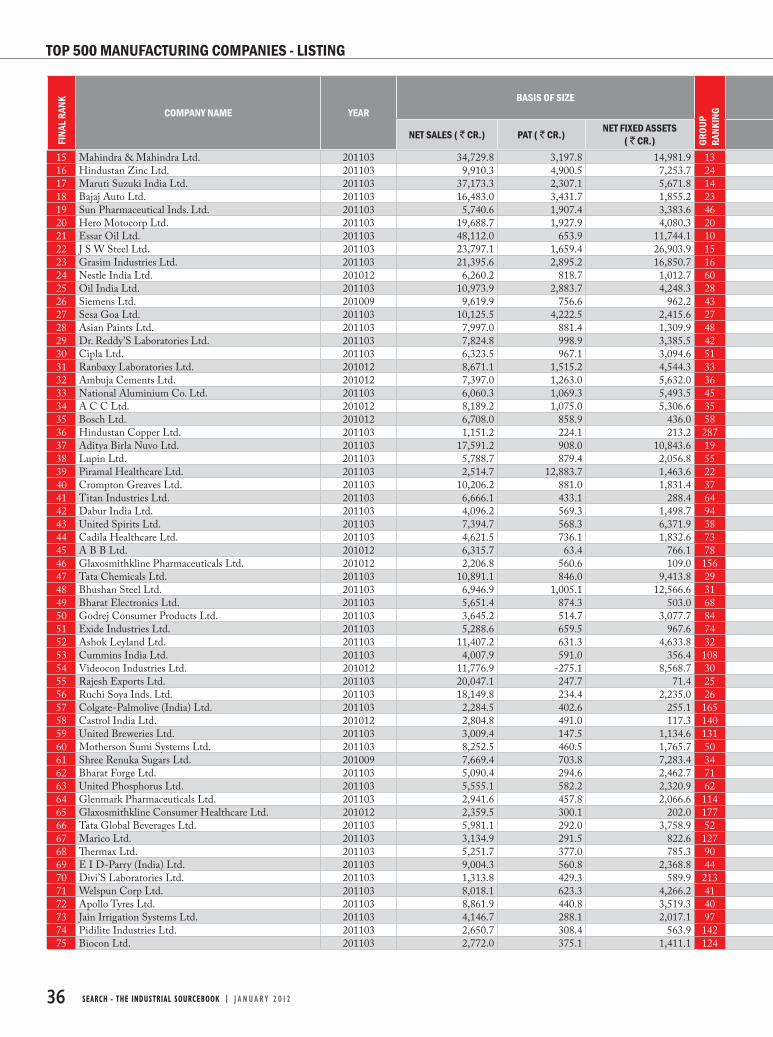
TOP 500 MANUFACTURING COMPANIES - LISTING
15 Mahindra & Mahindra Ltd. 201103 34,729.8 3,197.8 14,981.9 1316 Hindustan Zinc Ltd. 201103 9,910.3 4,900.5 7,253.7 2417 Maruti Suzuki India Ltd. 201103 37,173.3 2,307.1 5,671.8 1418 Bajaj Auto Ltd. 201103 16,483.0 3,431.7 1,855.2 2319 Sun Pharmaceutical Inds. Ltd. 201103 5,740.6 1,907.4 3,383.6 4620 Hero Motocorp Ltd. 201103 19,688.7 1,927.9 4,080.3 2021 Essar Oil Ltd. 201103 48,112.0 653.9 11,744.1 1022 J S W Steel Ltd. 201103 23,797.1 1,659.4 26,903.9 1523 Grasim Industries Ltd. 201103 21,395.6 2,895.2 16,850.7 1624 Nestle India Ltd. 201012 6,260.2 818.7 1,012.7 6025 Oil India Ltd. 201103 10,973.9 2,883.7 4,248.3 2826 Siemens Ltd. 201009 9,619.9 756.6 962.2 4327 Sesa Goa Ltd. 201103 10,125.5 4,222.5 2,415.6 2728 Asian Paints Ltd. 201103 7,997.0 881.4 1,309.9 4829 Dr. Reddy’S Laboratories Ltd. 201103 7,824.8 998.9 3,385.5 4230 Cipla Ltd. 201103 6,323.5 967.1 3,094.6 5131 Ranbaxy Laboratories Ltd. 201012 8,671.1 1,515.2 4,544.3 3332 Ambuja Cements Ltd. 201012 7,397.0 1,263.0 5,632.0 3633 National Aluminium Co. Ltd. 201103 6,060.3 1,069.3 5,493.5 4534 A C C Ltd. 201012 8,189.2 1,075.0 5,306.6 3535 Bosch Ltd. 201012 6,708.0 858.9 436.0 5836 Hindustan Copper Ltd. 201103 1,151.2 224.1 213.2 28737 Aditya Birla Nuvo Ltd. 201103 17,591.2 908.0 10,843.6 1938 Lupin Ltd. 201103 5,788.7 879.4 2,056.8 5539 Piramal Healthcare Ltd. 201103 2,514.7 12,883.7 1,463.6 2240 Crompton Greaves Ltd. 201103 10,206.2 881.0 1,831.4 3741 Titan Industries Ltd. 201103 6,666.1 433.1 288.4 6442 Dabur India Ltd. 201103 4,096.2 569.3 1,498.7 9443 United Spirits Ltd. 201103 7,394.7 568.3 6,371.9 3844 Cadila Healthcare Ltd. 201103 4,621.5 736.1 1,832.6 7345 A B B Ltd. 201012 6,315.7 63.4 766.1 7846 Glaxosmithkline Pharmaceuticals Ltd. 201012 2,206.8 560.6 109.0 15647 Tata Chemicals Ltd. 201103 10,891.1 846.0 9,413.8 2948 Bhushan Steel Ltd. 201103 6,946.9 1,005.1 12,566.6 3149 Bharat Electronics Ltd. 201103 5,651.4 874.3 503.0 6850 Godrej Consumer Products Ltd. 201103 3,645.2 514.7 3,077.7 8451 Exide Industries Ltd. 201103 5,288.6 659.5 967.6 7452 Ashok Leyland Ltd. 201103 11,407.2 631.3 4,633.8 3253 Cummins India Ltd. 201103 4,007.9 591.0 356.4 10854 Videocon Industries Ltd. 201012 11,776.9 -275.1 8,568.7 3055 Rajesh Exports Ltd. 201103 20,047.1 247.7 71.4 2556 Ruchi Soya Inds. Ltd. 201103 18,149.8 234.4 2,235.0 2657 Colgate-Palmolive (India) Ltd. 201103 2,284.5 402.6 255.1 16558 Castrol India Ltd. 201012 2,804.8 491.0 117.3 14059 United Breweries Ltd. 201103 3,009.4 147.5 1,134.6 13160 Motherson Sumi Systems Ltd. 201103 8,252.5 460.5 1,765.7 5061 Shree Renuka Sugars Ltd. 201009 7,669.4 703.8 7,283.4 3462 Bharat Forge Ltd. 201103 5,090.4 294.6 2,462.7 7163 United Phosphorus Ltd. 201103 5,555.1 582.2 2,320.9 6264 Glenmark Pharmaceuticals Ltd. 201103 2,941.6 457.8 2,066.6 11465 Glaxosmithkline Consumer Healthcare Ltd. 201012 2,359.5 300.1 202.0 17766 Tata Global Beverages Ltd. 201103 5,981.1 292.0 3,758.9 5267 Marico Ltd. 201103 3,134.9 291.5 822.6 12768 Th ermax Ltd. 201103 5,251.7 377.0 785.3 9069 E I D-Parry (India) Ltd. 201103 9,004.3 560.8 2,368.8 4470 Divi’S Laboratories Ltd. 201103 1,313.8 429.3 589.9 21371 Welspun Corp Ltd. 201103 8,018.1 623.3 4,266.2 4172 Apollo Tyres Ltd. 201103 8,861.9 440.8 3,519.3 4073 Jain Irrigation Systems Ltd. 201103 4,146.7 288.1 2,017.1 9774 Pidilite Industries Ltd. 201103 2,650.7 308.4 563.9 14275 Biocon Ltd. 201103 2,772.0 375.1 1,411.1 124
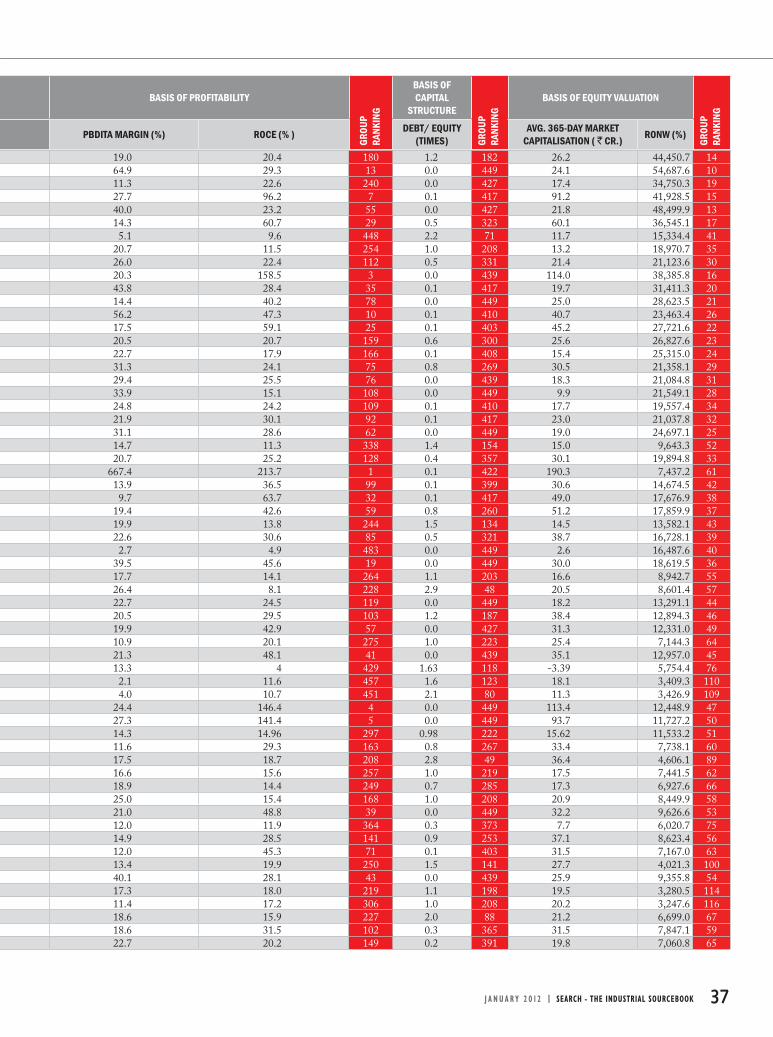
BASIS OF PROFITABILITYBASIS OF CAPITAL
STRUCTUREBASIS OF EQUITY VALUATION
PBDITA MARGIN (%) ROCE (% ) DEBT/ EQUITY (TIMES)
AVG. 365-DAY MARKET CAPITALISATION ( ` CR.) RONW (%)
J A N U A R Y 2 0 1 2 | SEARCH - THE INDUSTRIAL SOURCEBOOK 37
GROU
P RA
NKIN
G
GROU
P RA
NKIN
G
GROU
P RA
NKIN
G
19.0 20.4 180 1.2 182 26.2 44,450.7 1464.9 29.3 13 0.0 449 24.1 54,687.6 1011.3 22.6 240 0.0 427 17.4 34,750.3 1927.7 96.2 7 0.1 417 91.2 41,928.5 1540.0 23.2 55 0.0 427 21.8 48,499.9 1314.3 60.7 29 0.5 323 60.1 36,545.1 175.1 9.6 448 2.2 71 11.7 15,334.4 41
20.7 11.5 254 1.0 208 13.2 18,970.7 3526.0 22.4 112 0.5 331 21.4 21,123.6 3020.3 158.5 3 0.0 439 114.0 38,385.8 1643.8 28.4 35 0.1 417 19.7 31,411.3 2014.4 40.2 78 0.0 449 25.0 28,623.5 2156.2 47.3 10 0.1 410 40.7 23,463.4 2617.5 59.1 25 0.1 403 45.2 27,721.6 2220.5 20.7 159 0.6 300 25.6 26,827.6 2322.7 17.9 166 0.1 408 15.4 25,315.0 2431.3 24.1 75 0.8 269 30.5 21,358.1 2929.4 25.5 76 0.0 439 18.3 21,084.8 3133.9 15.1 108 0.0 449 9.9 21,549.1 2824.8 24.2 109 0.1 410 17.7 19,557.4 3421.9 30.1 92 0.1 417 23.0 21,037.8 3231.1 28.6 62 0.0 449 19.0 24,697.1 2514.7 11.3 338 1.4 154 15.0 9,643.3 5220.7 25.2 128 0.4 357 30.1 19,894.8 33
667.4 213.7 1 0.1 422 190.3 7,437.2 6113.9 36.5 99 0.1 399 30.6 14,674.5 429.7 63.7 32 0.1 417 49.0 17,676.9 38
19.4 42.6 59 0.8 260 51.2 17,859.9 3719.9 13.8 244 1.5 134 14.5 13,582.1 4322.6 30.6 85 0.5 321 38.7 16,728.1 392.7 4.9 483 0.0 449 2.6 16,487.6 40
39.5 45.6 19 0.0 449 30.0 18,619.5 3617.7 14.1 264 1.1 203 16.6 8,942.7 5526.4 8.1 228 2.9 48 20.5 8,601.4 5722.7 24.5 119 0.0 449 18.2 13,291.1 4420.5 29.5 103 1.2 187 38.4 12,894.3 4619.9 42.9 57 0.0 427 31.3 12,331.0 4910.9 20.1 275 1.0 223 25.4 7,144.3 6421.3 48.1 41 0.0 439 35.1 12,957.0 4513.3 4 429 1.63 118 -3.39 5,754.4 762.1 11.6 457 1.6 123 18.1 3,409.3 1104.0 10.7 451 2.1 80 11.3 3,426.9 109
24.4 146.4 4 0.0 449 113.4 12,448.9 4727.3 141.4 5 0.0 449 93.7 11,727.2 5014.3 14.96 297 0.98 222 15.62 11,533.2 5111.6 29.3 163 0.8 267 33.4 7,738.1 6017.5 18.7 208 2.8 49 36.4 4,606.1 8916.6 15.6 257 1.0 219 17.5 7,441.5 6218.9 14.4 249 0.7 285 17.3 6,927.6 6625.0 15.4 168 1.0 208 20.9 8,449.9 5821.0 48.8 39 0.0 449 32.2 9,626.6 5312.0 11.9 364 0.3 373 7.7 6,020.7 7514.9 28.5 141 0.9 253 37.1 8,623.4 5612.0 45.3 71 0.1 403 31.5 7,167.0 6313.4 19.9 250 1.5 141 27.7 4,021.3 10040.1 28.1 43 0.0 439 25.9 9,355.8 5417.3 18.0 219 1.1 198 19.5 3,280.5 11411.4 17.2 306 1.0 208 20.2 3,247.6 11618.6 15.9 227 2.0 88 21.2 6,699.0 6718.6 31.5 102 0.3 365 31.5 7,847.1 5922.7 20.2 149 0.2 391 19.8 7,060.8 65
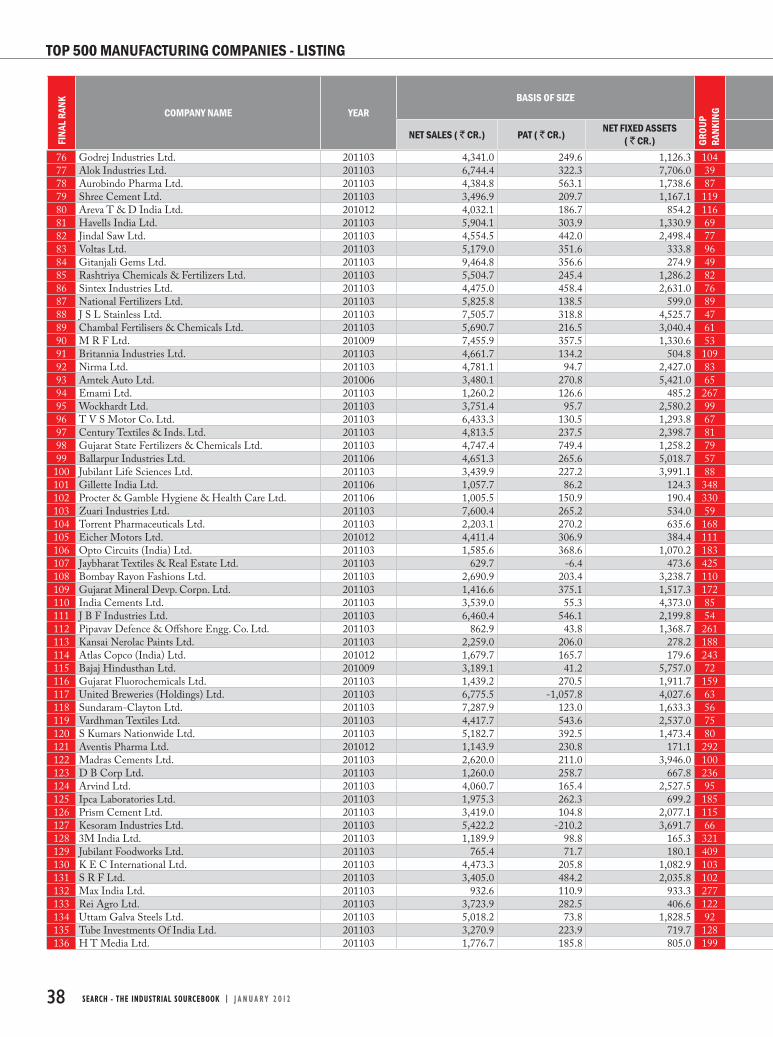
COMPANY NAME YEARBASIS OF SIZE
NET SALES ( ` CR.) PAT ( ` CR.) NET FIXED ASSETS( ` CR.)
38 SEARCH - THE INDUSTRIAL SOURCEBOOK | J A N U A R Y 2 0 1 2
FINA
L RAN
K
GROU
P RA
NKIN
G
TOP 500 MANUFACTURING COMPANIES - LISTING
76 Godrej Industries Ltd. 201103 4,341.0 249.6 1,126.3 10477 Alok Industries Ltd. 201103 6,744.4 322.3 7,706.0 3978 Aurobindo Pharma Ltd. 201103 4,384.8 563.1 1,738.6 8779 Shree Cement Ltd. 201103 3,496.9 209.7 1,167.1 11980 Areva T & D India Ltd. 201012 4,032.1 186.7 854.2 11681 Havells India Ltd. 201103 5,904.1 303.9 1,330.9 6982 Jindal Saw Ltd. 201103 4,554.5 442.0 2,498.4 7783 Voltas Ltd. 201103 5,179.0 351.6 333.8 9684 Gitanjali Gems Ltd. 201103 9,464.8 356.6 274.9 4985 Rashtriya Chemicals & Fertilizers Ltd. 201103 5,504.7 245.4 1,286.2 8286 Sintex Industries Ltd. 201103 4,475.0 458.4 2,631.0 7687 National Fertilizers Ltd. 201103 5,825.8 138.5 599.0 8988 J S L Stainless Ltd. 201103 7,505.7 318.8 4,525.7 4789 Chambal Fertilisers & Chemicals Ltd. 201103 5,690.7 216.5 3,040.4 6190 M R F Ltd. 201009 7,455.9 357.5 1,330.6 5391 Britannia Industries Ltd. 201103 4,661.7 134.2 504.8 10992 Nirma Ltd. 201103 4,781.1 94.7 2,427.0 8393 Amtek Auto Ltd. 201006 3,480.1 270.8 5,421.0 6594 Emami Ltd. 201103 1,260.2 126.6 485.2 26795 Wockhardt Ltd. 201103 3,751.4 95.7 2,580.2 9996 T V S Motor Co. Ltd. 201103 6,433.3 130.5 1,293.8 6797 Century Textiles & Inds. Ltd. 201103 4,813.5 237.5 2,398.7 8198 Gujarat State Fertilizers & Chemicals Ltd. 201103 4,747.4 749.4 1,258.2 7999 Ballarpur Industries Ltd. 201106 4,651.3 265.6 5,018.7 57100 Jubilant Life Sciences Ltd. 201103 3,439.9 227.2 3,991.1 88101 Gillette India Ltd. 201106 1,057.7 86.2 124.3 348102 Procter & Gamble Hygiene & Health Care Ltd. 201106 1,005.5 150.9 190.4 330103 Zuari Industries Ltd. 201103 7,600.4 265.2 534.0 59104 Torrent Pharmaceuticals Ltd. 201103 2,203.1 270.2 635.6 168105 Eicher Motors Ltd. 201012 4,411.4 306.9 384.4 111106 Opto Circuits (India) Ltd. 201103 1,585.6 368.6 1,070.2 183107 Jaybharat Textiles & Real Estate Ltd. 201103 629.7 -6.4 473.6 425108 Bombay Rayon Fashions Ltd. 201103 2,690.9 203.4 3,238.7 110109 Gujarat Mineral Devp. Corpn. Ltd. 201103 1,416.6 375.1 1,517.3 172110 India Cements Ltd. 201103 3,539.0 55.3 4,373.0 85111 J B F Industries Ltd. 201103 6,460.4 546.1 2,199.8 54112 Pipavav Defence & Off shore Engg. Co. Ltd. 201103 862.9 43.8 1,368.7 261113 Kansai Nerolac Paints Ltd. 201103 2,259.0 206.0 278.2 188114 Atlas Copco (India) Ltd. 201012 1,679.7 165.7 179.6 243115 Bajaj Hindusthan Ltd. 201009 3,189.1 41.2 5,757.0 72116 Gujarat Fluorochemicals Ltd. 201103 1,439.2 270.5 1,911.7 159117 United Breweries (Holdings) Ltd. 201103 6,775.5 -1,057.8 4,027.6 63118 Sundaram-Clayton Ltd. 201103 7,287.9 123.0 1,633.3 56119 Vardhman Textiles Ltd. 201103 4,417.7 543.6 2,537.0 75120 S Kumars Nationwide Ltd. 201103 5,182.7 392.5 1,473.4 80121 Aventis Pharma Ltd. 201012 1,143.9 230.8 171.1 292122 Madras Cements Ltd. 201103 2,620.0 211.0 3,946.0 100123 D B Corp Ltd. 201103 1,260.0 258.7 667.8 236124 Arvind Ltd. 201103 4,060.7 165.4 2,527.5 95125 Ipca Laboratories Ltd. 201103 1,975.3 262.3 699.2 185126 Prism Cement Ltd. 201103 3,419.0 104.8 2,077.1 115127 Kesoram Industries Ltd. 201103 5,422.2 -210.2 3,691.7 66128 3M India Ltd. 201103 1,189.9 98.8 165.3 321129 Jubilant Foodworks Ltd. 201103 765.4 71.7 180.1 409130 K E C International Ltd. 201103 4,473.3 205.8 1,082.9 103131 S R F Ltd. 201103 3,405.0 484.2 2,035.8 102132 Max India Ltd. 201103 932.6 110.9 933.3 277133 Rei Agro Ltd. 201103 3,723.9 282.5 406.6 122134 Uttam Galva Steels Ltd. 201103 5,018.2 73.8 1,828.5 92135 Tube Investments Of India Ltd. 201103 3,270.9 223.9 719.7 128136 H T Media Ltd. 201103 1,776.7 185.8 805.0 199
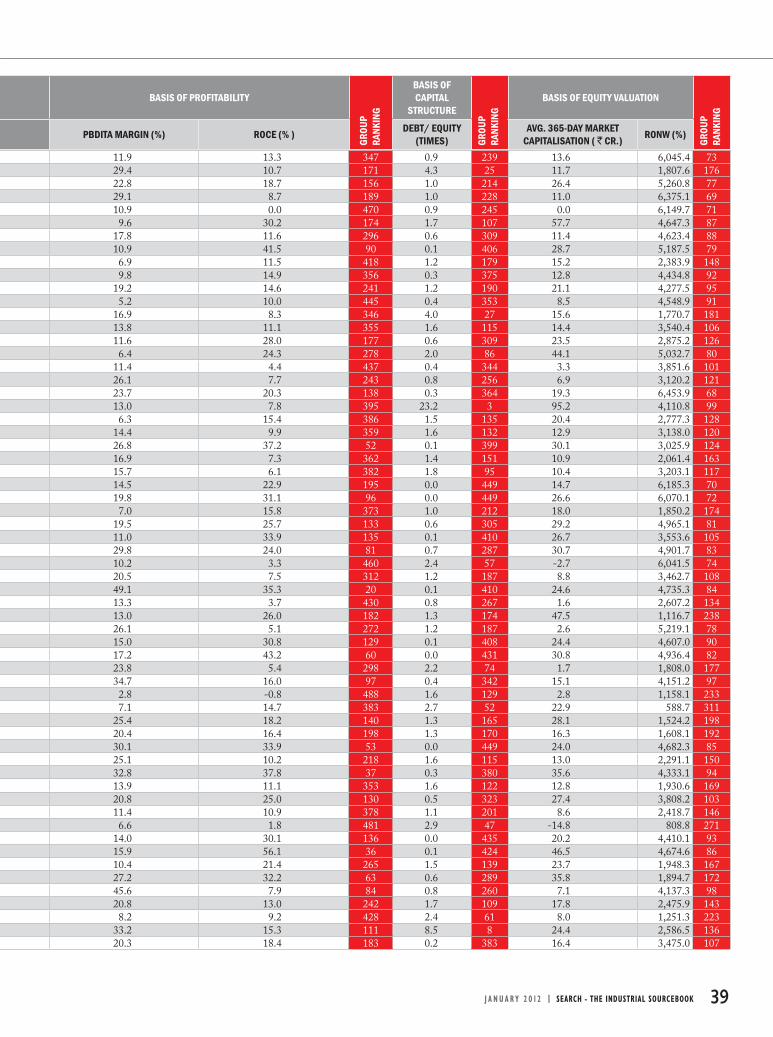
BASIS OF PROFITABILITYBASIS OF CAPITAL
STRUCTUREBASIS OF EQUITY VALUATION
PBDITA MARGIN (%) ROCE (% ) DEBT/ EQUITY (TIMES)
AVG. 365-DAY MARKET CAPITALISATION ( ` CR.) RONW (%)
J A N U A R Y 2 0 1 2 | SEARCH - THE INDUSTRIAL SOURCEBOOK 39
GROU
P RA
NKIN
G
GROU
P RA
NKIN
G
GROU
P RA
NKIN
G
11.9 13.3 347 0.9 239 13.6 6,045.4 7329.4 10.7 171 4.3 25 11.7 1,807.6 17622.8 18.7 156 1.0 214 26.4 5,260.8 7729.1 8.7 189 1.0 228 11.0 6,375.1 6910.9 0.0 470 0.9 245 0.0 6,149.7 719.6 30.2 174 1.7 107 57.7 4,647.3 87
17.8 11.6 296 0.6 309 11.4 4,623.4 8810.9 41.5 90 0.1 406 28.7 5,187.5 796.9 11.5 418 1.2 179 15.2 2,383.9 1489.8 14.9 356 0.3 375 12.8 4,434.8 92
19.2 14.6 241 1.2 190 21.1 4,277.5 955.2 10.0 445 0.4 353 8.5 4,548.9 91
16.9 8.3 346 4.0 27 15.6 1,770.7 18113.8 11.1 355 1.6 115 14.4 3,540.4 10611.6 28.0 177 0.6 309 23.5 2,875.2 1266.4 24.3 278 2.0 86 44.1 5,032.7 80
11.4 4.4 437 0.4 344 3.3 3,851.6 10126.1 7.7 243 0.8 256 6.9 3,120.2 12123.7 20.3 138 0.3 364 19.3 6,453.9 6813.0 7.8 395 23.2 3 95.2 4,110.8 996.3 15.4 386 1.5 135 20.4 2,777.3 128
14.4 9.9 359 1.6 132 12.9 3,138.0 12026.8 37.2 52 0.1 399 30.1 3,025.9 12416.9 7.3 362 1.4 151 10.9 2,061.4 16315.7 6.1 382 1.8 95 10.4 3,203.1 11714.5 22.9 195 0.0 449 14.7 6,185.3 7019.8 31.1 96 0.0 449 26.6 6,070.1 727.0 15.8 373 1.0 212 18.0 1,850.2 174
19.5 25.7 133 0.6 305 29.2 4,965.1 8111.0 33.9 135 0.1 410 26.7 3,553.6 10529.8 24.0 81 0.7 287 30.7 4,901.7 8310.2 3.3 460 2.4 57 -2.7 6,041.5 7420.5 7.5 312 1.2 187 8.8 3,462.7 10849.1 35.3 20 0.1 410 24.6 4,735.3 8413.3 3.7 430 0.8 267 1.6 2,607.2 13413.0 26.0 182 1.3 174 47.5 1,116.7 23826.1 5.1 272 1.2 187 2.6 5,219.1 7815.0 30.8 129 0.1 408 24.4 4,607.0 9017.2 43.2 60 0.0 431 30.8 4,936.4 8223.8 5.4 298 2.2 74 1.7 1,808.0 17734.7 16.0 97 0.4 342 15.1 4,151.2 972.8 -0.8 488 1.6 129 2.8 1,158.1 2337.1 14.7 383 2.7 52 22.9 588.7 311
25.4 18.2 140 1.3 165 28.1 1,524.2 19820.4 16.4 198 1.3 170 16.3 1,608.1 19230.1 33.9 53 0.0 449 24.0 4,682.3 8525.1 10.2 218 1.6 115 13.0 2,291.1 15032.8 37.8 37 0.3 380 35.6 4,333.1 9413.9 11.1 353 1.6 122 12.8 1,930.6 16920.8 25.0 130 0.5 323 27.4 3,808.2 10311.4 10.9 378 1.1 201 8.6 2,418.7 1466.6 1.8 481 2.9 47 -14.8 808.8 271
14.0 30.1 136 0.0 435 20.2 4,410.1 9315.9 56.1 36 0.1 424 46.5 4,674.6 8610.4 21.4 265 1.5 139 23.7 1,948.3 16727.2 32.2 63 0.6 289 35.8 1,894.7 17245.6 7.9 84 0.8 260 7.1 4,137.3 9820.8 13.0 242 1.7 109 17.8 2,475.9 1438.2 9.2 428 2.4 61 8.0 1,251.3 223
33.2 15.3 111 8.5 8 24.4 2,586.5 13620.3 18.4 183 0.2 383 16.4 3,475.0 107
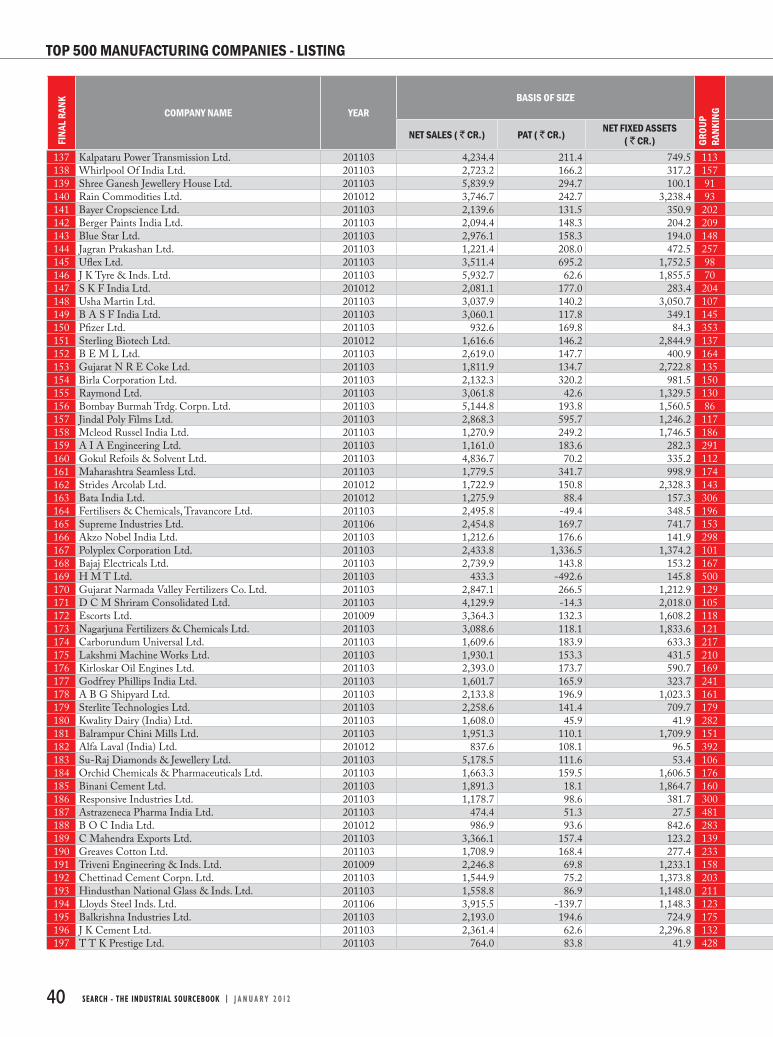
COMPANY NAME YEARBASIS OF SIZE
NET SALES ( ` CR.) PAT ( ` CR.) NET FIXED ASSETS( ` CR.)
40 SEARCH - THE INDUSTRIAL SOURCEBOOK | J A N U A R Y 2 0 1 2
FINA
L RAN
K
GROU
P RA
NKIN
G
TOP 500 MANUFACTURING COMPANIES - LISTING
137 Kalpataru Power Transmission Ltd. 201103 4,234.4 211.4 749.5 113138 Whirlpool Of India Ltd. 201103 2,723.2 166.2 317.2 157139 Shree Ganesh Jewellery House Ltd. 201103 5,839.9 294.7 100.1 91140 Rain Commodities Ltd. 201012 3,746.7 242.7 3,238.4 93141 Bayer Cropscience Ltd. 201103 2,139.6 131.5 350.9 202142 Berger Paints India Ltd. 201103 2,094.4 148.3 204.2 209143 Blue Star Ltd. 201103 2,976.1 158.3 194.0 148144 Jagran Prakashan Ltd. 201103 1,221.4 208.0 472.5 257145 Ufl ex Ltd. 201103 3,511.4 695.2 1,752.5 98146 J K Tyre & Inds. Ltd. 201103 5,932.7 62.6 1,855.5 70147 S K F India Ltd. 201012 2,081.1 177.0 283.4 204148 Usha Martin Ltd. 201103 3,037.9 140.2 3,050.7 107149 B A S F India Ltd. 201103 3,060.1 117.8 349.1 145150 Pfi zer Ltd. 201103 932.6 169.8 84.3 353151 Sterling Biotech Ltd. 201012 1,616.6 146.2 2,844.9 137152 B E M L Ltd. 201103 2,619.0 147.7 400.9 164153 Gujarat N R E Coke Ltd. 201103 1,811.9 134.7 2,722.8 135154 Birla Corporation Ltd. 201103 2,132.3 320.2 981.5 150155 Raymond Ltd. 201103 3,061.8 42.6 1,329.5 130156 Bombay Burmah Trdg. Corpn. Ltd. 201103 5,144.8 193.8 1,560.5 86157 Jindal Poly Films Ltd. 201103 2,868.3 595.7 1,246.2 117158 Mcleod Russel India Ltd. 201103 1,270.9 249.2 1,746.5 186159 A I A Engineering Ltd. 201103 1,161.0 183.6 282.3 291160 Gokul Refoils & Solvent Ltd. 201103 4,836.7 70.2 335.2 112161 Maharashtra Seamless Ltd. 201103 1,779.5 341.7 998.9 174162 Strides Arcolab Ltd. 201012 1,722.9 150.8 2,328.3 143163 Bata India Ltd. 201012 1,275.9 88.4 157.3 306164 Fertilisers & Chemicals, Travancore Ltd. 201103 2,495.8 -49.4 348.5 196165 Supreme Industries Ltd. 201106 2,454.8 169.7 741.7 153166 Akzo Nobel India Ltd. 201103 1,212.6 176.6 141.9 298167 Polyplex Corporation Ltd. 201103 2,433.8 1,336.5 1,374.2 101168 Bajaj Electricals Ltd. 201103 2,739.9 143.8 153.2 167169 H M T Ltd. 201103 433.3 -492.6 145.8 500170 Gujarat Narmada Valley Fertilizers Co. Ltd. 201103 2,847.1 266.5 1,212.9 129171 D C M Shriram Consolidated Ltd. 201103 4,129.9 -14.3 2,018.0 105172 Escorts Ltd. 201009 3,364.3 132.3 1,608.2 118173 Nagarjuna Fertilizers & Chemicals Ltd. 201103 3,088.6 118.1 1,833.6 121174 Carborundum Universal Ltd. 201103 1,609.6 183.9 633.3 217175 Lakshmi Machine Works Ltd. 201103 1,930.1 153.3 431.5 210176 Kirloskar Oil Engines Ltd. 201103 2,393.0 173.7 590.7 169177 Godfrey Phillips India Ltd. 201103 1,601.7 165.9 323.7 241178 A B G Shipyard Ltd. 201103 2,133.8 196.9 1,023.3 161179 Sterlite Technologies Ltd. 201103 2,258.6 141.4 709.7 179180 Kwality Dairy (India) Ltd. 201103 1,608.0 45.9 41.9 282181 Balrampur Chini Mills Ltd. 201103 1,951.3 110.1 1,709.9 151182 Alfa Laval (India) Ltd. 201012 837.6 108.1 96.5 392183 Su-Raj Diamonds & Jewellery Ltd. 201103 5,178.5 111.6 53.4 106184 Orchid Chemicals & Pharmaceuticals Ltd. 201103 1,663.3 159.5 1,606.5 176185 Binani Cement Ltd. 201103 1,891.3 18.1 1,864.7 160186 Responsive Industries Ltd. 201103 1,178.7 98.6 381.7 300187 Astrazeneca Pharma India Ltd. 201103 474.4 51.3 27.5 481188 B O C India Ltd. 201012 986.9 93.6 842.6 283189 C Mahendra Exports Ltd. 201103 3,366.1 157.4 123.2 139190 Greaves Cotton Ltd. 201103 1,708.9 168.4 277.4 233191 Triveni Engineering & Inds. Ltd. 201009 2,246.8 69.8 1,233.1 158192 Chettinad Cement Corpn. Ltd. 201103 1,544.9 75.2 1,373.8 203193 Hindusthan National Glass & Inds. Ltd. 201103 1,558.8 86.9 1,148.0 211194 Lloyds Steel Inds. Ltd. 201106 3,915.5 -139.7 1,148.3 123195 Balkrishna Industries Ltd. 201103 2,193.0 194.6 724.9 175196 J K Cement Ltd. 201103 2,361.4 62.6 2,296.8 132197 T T K Prestige Ltd. 201103 764.0 83.8 41.9 428
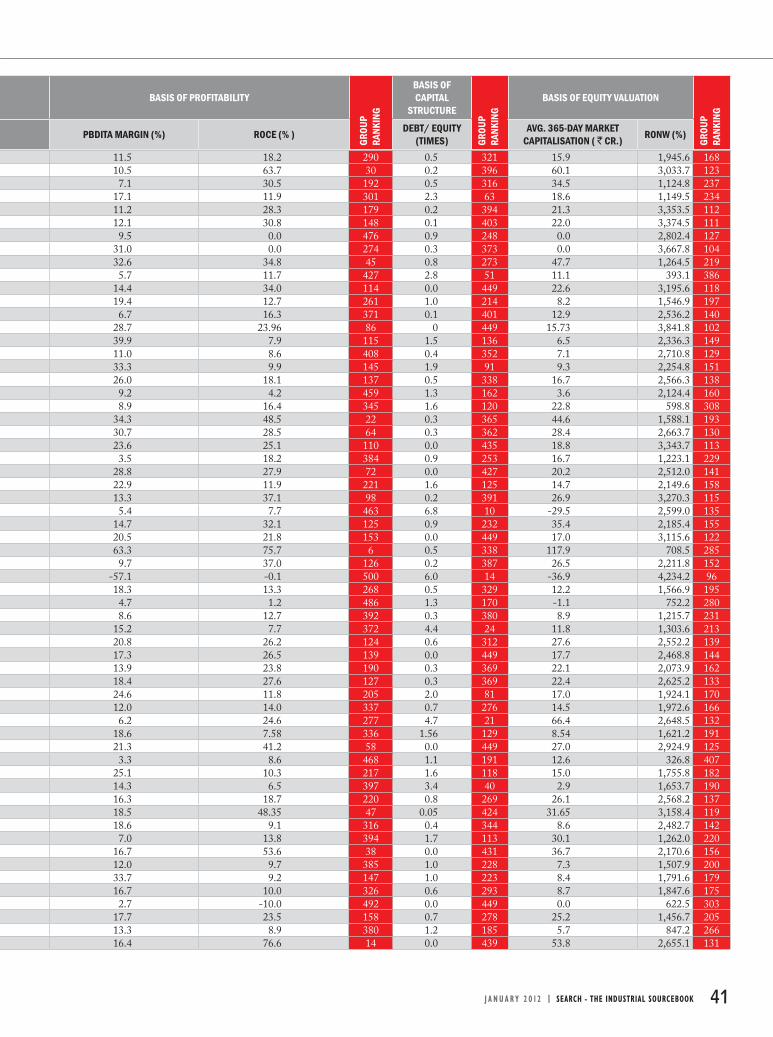
BASIS OF PROFITABILITYBASIS OF CAPITAL
STRUCTUREBASIS OF EQUITY VALUATION
PBDITA MARGIN (%) ROCE (% ) DEBT/ EQUITY (TIMES)
AVG. 365-DAY MARKET CAPITALISATION ( ` CR.) RONW (%)
J A N U A R Y 2 0 1 2 | SEARCH - THE INDUSTRIAL SOURCEBOOK 41
GROU
P RA
NKIN
G
GROU
P RA
NKIN
G
GROU
P RA
NKIN
G
11.5 18.2 290 0.5 321 15.9 1,945.6 16810.5 63.7 30 0.2 396 60.1 3,033.7 1237.1 30.5 192 0.5 316 34.5 1,124.8 237
17.1 11.9 301 2.3 63 18.6 1,149.5 23411.2 28.3 179 0.2 394 21.3 3,353.5 11212.1 30.8 148 0.1 403 22.0 3,374.5 1119.5 0.0 476 0.9 248 0.0 2,802.4 127
31.0 0.0 274 0.3 373 0.0 3,667.8 10432.6 34.8 45 0.8 273 47.7 1,264.5 2195.7 11.7 427 2.8 51 11.1 393.1 386
14.4 34.0 114 0.0 449 22.6 3,195.6 11819.4 12.7 261 1.0 214 8.2 1,546.9 1976.7 16.3 371 0.1 401 12.9 2,536.2 140
28.7 23.96 86 0 449 15.73 3,841.8 10239.9 7.9 115 1.5 136 6.5 2,336.3 14911.0 8.6 408 0.4 352 7.1 2,710.8 12933.3 9.9 145 1.9 91 9.3 2,254.8 15126.0 18.1 137 0.5 338 16.7 2,566.3 1389.2 4.2 459 1.3 162 3.6 2,124.4 1608.9 16.4 345 1.6 120 22.8 598.8 308
34.3 48.5 22 0.3 365 44.6 1,588.1 19330.7 28.5 64 0.3 362 28.4 2,663.7 13023.6 25.1 110 0.0 435 18.8 3,343.7 1133.5 18.2 384 0.9 253 16.7 1,223.1 229
28.8 27.9 72 0.0 427 20.2 2,512.0 14122.9 11.9 221 1.6 125 14.7 2,149.6 15813.3 37.1 98 0.2 391 26.9 3,270.3 1155.4 7.7 463 6.8 10 -29.5 2,599.0 135
14.7 32.1 125 0.9 232 35.4 2,185.4 15520.5 21.8 153 0.0 449 17.0 3,115.6 12263.3 75.7 6 0.5 338 117.9 708.5 2859.7 37.0 126 0.2 387 26.5 2,211.8 152
-57.1 -0.1 500 6.0 14 -36.9 4,234.2 9618.3 13.3 268 0.5 329 12.2 1,566.9 1954.7 1.2 486 1.3 170 -1.1 752.2 2808.6 12.7 392 0.3 380 8.9 1,215.7 231
15.2 7.7 372 4.4 24 11.8 1,303.6 21320.8 26.2 124 0.6 312 27.6 2,552.2 13917.3 26.5 139 0.0 449 17.7 2,468.8 14413.9 23.8 190 0.3 369 22.1 2,073.9 16218.4 27.6 127 0.3 369 22.4 2,625.2 13324.6 11.8 205 2.0 81 17.0 1,924.1 17012.0 14.0 337 0.7 276 14.5 1,972.6 1666.2 24.6 277 4.7 21 66.4 2,648.5 132
18.6 7.58 336 1.56 129 8.54 1,621.2 19121.3 41.2 58 0.0 449 27.0 2,924.9 1253.3 8.6 468 1.1 191 12.6 326.8 407
25.1 10.3 217 1.6 118 15.0 1,755.8 18214.3 6.5 397 3.4 40 2.9 1,653.7 19016.3 18.7 220 0.8 269 26.1 2,568.2 13718.5 48.35 47 0.05 424 31.65 3,158.4 11918.6 9.1 316 0.4 344 8.6 2,482.7 1427.0 13.8 394 1.7 113 30.1 1,262.0 220
16.7 53.6 38 0.0 431 36.7 2,170.6 15612.0 9.7 385 1.0 228 7.3 1,507.9 20033.7 9.2 147 1.0 223 8.4 1,791.6 17916.7 10.0 326 0.6 293 8.7 1,847.6 1752.7 -10.0 492 0.0 449 0.0 622.5 303
17.7 23.5 158 0.7 278 25.2 1,456.7 20513.3 8.9 380 1.2 185 5.7 847.2 26616.4 76.6 14 0.0 439 53.8 2,655.1 131
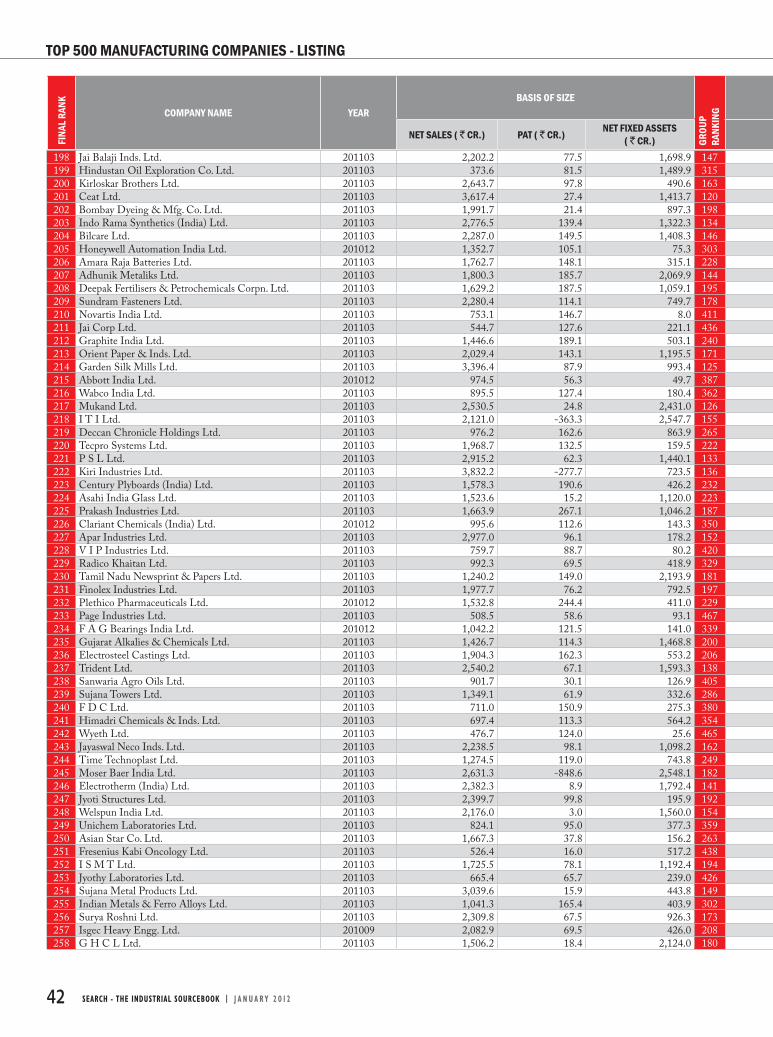
COMPANY NAME YEARBASIS OF SIZE
NET SALES ( ` CR.) PAT ( ` CR.) NET FIXED ASSETS( ` CR.)
42 SEARCH - THE INDUSTRIAL SOURCEBOOK | J A N U A R Y 2 0 1 2
FINA
L RAN
K
GROU
P RA
NKIN
G
TOP 500 MANUFACTURING COMPANIES - LISTING
198 Jai Balaji Inds. Ltd. 201103 2,202.2 77.5 1,698.9 147199 Hindustan Oil Exploration Co. Ltd. 201103 373.6 81.5 1,489.9 315200 Kirloskar Brothers Ltd. 201103 2,643.7 97.8 490.6 163201 Ceat Ltd. 201103 3,617.4 27.4 1,413.7 120202 Bombay Dyeing & Mfg. Co. Ltd. 201103 1,991.7 21.4 897.3 198203 Indo Rama Synthetics (India) Ltd. 201103 2,776.5 139.4 1,322.3 134204 Bilcare Ltd. 201103 2,287.0 149.5 1,408.3 146205 Honeywell Automation India Ltd. 201012 1,352.7 105.1 75.3 303206 Amara Raja Batteries Ltd. 201103 1,762.7 148.1 315.1 228207 Adhunik Metaliks Ltd. 201103 1,800.3 185.7 2,069.9 144208 Deepak Fertilisers & Petrochemicals Corpn. Ltd. 201103 1,629.2 187.5 1,059.1 195209 Sundram Fasteners Ltd. 201103 2,280.4 114.1 749.7 178210 Novartis India Ltd. 201103 753.1 146.7 8.0 411211 Jai Corp Ltd. 201103 544.7 127.6 221.1 436212 Graphite India Ltd. 201103 1,446.6 189.1 503.1 240213 Orient Paper & Inds. Ltd. 201103 2,029.4 143.1 1,195.5 171214 Garden Silk Mills Ltd. 201103 3,396.4 87.9 993.4 125215 Abbott India Ltd. 201012 974.5 56.3 49.7 387216 Wabco India Ltd. 201103 895.5 127.4 180.4 362217 Mukand Ltd. 201103 2,530.5 24.8 2,431.0 126218 I T I Ltd. 201103 2,121.0 -363.3 2,547.7 155219 Deccan Chronicle Holdings Ltd. 201103 976.2 162.6 863.9 265220 Tecpro Systems Ltd. 201103 1,968.7 132.5 159.5 222221 P S L Ltd. 201103 2,915.2 62.3 1,440.1 133222 Kiri Industries Ltd. 201103 3,832.2 -277.7 723.5 136223 Century Plyboards (India) Ltd. 201103 1,578.3 190.6 426.2 232224 Asahi India Glass Ltd. 201103 1,523.6 15.2 1,120.0 223225 Prakash Industries Ltd. 201103 1,663.9 267.1 1,046.2 187226 Clariant Chemicals (India) Ltd. 201012 995.6 112.6 143.3 350227 Apar Industries Ltd. 201103 2,977.0 96.1 178.2 152228 V I P Industries Ltd. 201103 759.7 88.7 80.2 420229 Radico Khaitan Ltd. 201103 992.3 69.5 418.9 329230 Tamil Nadu Newsprint & Papers Ltd. 201103 1,240.2 149.0 2,193.9 181231 Finolex Industries Ltd. 201103 1,977.7 76.2 792.5 197232 Plethico Pharmaceuticals Ltd. 201012 1,532.8 244.4 411.0 229233 Page Industries Ltd. 201103 508.5 58.6 93.1 467234 F A G Bearings India Ltd. 201012 1,042.2 121.5 141.0 339235 Gujarat Alkalies & Chemicals Ltd. 201103 1,426.7 114.3 1,468.8 200236 Electrosteel Castings Ltd. 201103 1,904.3 162.3 553.2 206237 Trident Ltd. 201103 2,540.2 67.1 1,593.3 138238 Sanwaria Agro Oils Ltd. 201103 901.7 30.1 126.9 405239 Sujana Towers Ltd. 201103 1,349.1 61.9 332.6 286240 F D C Ltd. 201103 711.0 150.9 275.3 380241 Himadri Chemicals & Inds. Ltd. 201103 697.4 113.3 564.2 354242 Wyeth Ltd. 201103 476.7 124.0 25.6 465243 Jayaswal Neco Inds. Ltd. 201103 2,238.5 98.1 1,098.2 162244 Time Technoplast Ltd. 201103 1,274.5 119.0 743.8 249245 Moser Baer India Ltd. 201103 2,631.3 -848.6 2,548.1 182246 Electrotherm (India) Ltd. 201103 2,382.3 8.9 1,792.4 141247 Jyoti Structures Ltd. 201103 2,399.7 99.8 195.9 192248 Welspun India Ltd. 201103 2,176.0 3.0 1,560.0 154249 Unichem Laboratories Ltd. 201103 824.1 95.0 377.3 359250 Asian Star Co. Ltd. 201103 1,667.3 37.8 156.2 263251 Fresenius Kabi Oncology Ltd. 201103 526.4 16.0 517.2 438252 I S M T Ltd. 201103 1,725.5 78.1 1,192.4 194253 Jyothy Laboratories Ltd. 201103 665.4 65.7 239.0 426254 Sujana Metal Products Ltd. 201103 3,039.6 15.9 443.8 149255 Indian Metals & Ferro Alloys Ltd. 201103 1,041.3 165.4 403.9 302256 Surya Roshni Ltd. 201103 2,309.8 67.5 926.3 173257 Isgec Heavy Engg. Ltd. 201009 2,082.9 69.5 426.0 208258 G H C L Ltd. 201103 1,506.2 18.4 2,124.0 180

BASIS OF PROFITABILITYBASIS OF CAPITAL
STRUCTUREBASIS OF EQUITY VALUATION
PBDITA MARGIN (%) ROCE (% ) DEBT/ EQUITY (TIMES)
AVG. 365-DAY MARKET CAPITALISATION ( ` CR.) RONW (%)
J A N U A R Y 2 0 1 2 | SEARCH - THE INDUSTRIAL SOURCEBOOK 43
GROU
P RA
NKIN
G
GROU
P RA
NKIN
G
GROU
P RA
NKIN
G
16.0 9.7 339 1.9 90 8.0 1,098.2 23968.0 7.5 28 0.5 323 7.1 2,209.7 1539.2 15.9 352 0.5 333 12.0 1,225.2 2284.4 9.7 455 1.2 184 4.3 341.7 401
12.6 10.5 370 3.5 37 7.6 1,517.9 19915.0 21.6 201 1.1 198 28.2 753.0 27816.5 15.7 256 1.2 185 15.8 998.6 24911.5 29.4 162 0.0 449 21.6 2,125.0 15915.0 32.3 117 0.2 396 24.9 1,729.5 18532.6 14.5 120 3.5 38 23.4 961.9 25324.0 18.0 154 0.7 276 19.1 1,453.9 20611.5 15.7 321 1.4 154 22.1 1,227.6 22629.6 33.5 56 0.0 439 22.6 2,398.5 14735.0 6.1 160 0.0 435 4.6 2,458.8 14522.8 16.2 181 0.2 387 13.5 1,711.2 18716.4 18.4 222 0.6 293 17.2 1,074.4 2418.6 12.8 388 2.3 63 16.6 351.2 3979.9 29.72 175 0 449 19.5 2,200.7 154
23.0 57.6 24 0.0 449 38.8 2,104.7 16113.1 11.7 354 4.0 28 5.5 318.7 416
-12.5 0.0 497 0.0 449 0.0 897.1 26035.2 18.3 82 0.2 383 12.8 1,699.8 18815.7 0.0 440 1.1 194 0.0 1,419.5 21014.2 8.2 375 2.4 58 6.7 390.6 387-1.3 -7.0 493 1.3 162 -28.2 468.3 35916.4 19.6 212 0.9 242 34.3 1,392.3 21117.9 9.0 323 7.0 9 7.2 1,304.0 21420.9 15.2 209 0.5 338 19.3 976.9 25218.5 46.5 51 0.0 449 31.5 1,880.3 1737.0 40.3 118 0.4 349 30.3 677.6 293
16.2 39.9 73 0.5 316 51.0 2,037.6 16515.7 11.9 319 0.8 272 11.3 1,783.7 18029.1 10.4 178 1.6 120 17.3 829.6 26711.3 10.7 381 1.2 182 12.6 991.1 25121.4 19.1 167 0.5 315 25.0 1,234.5 22520.1 47.0 46 0.9 235 52.6 2,155.3 15719.5 35.4 77 0.0 449 23.6 1,747.7 18320.4 8.2 307 0.3 375 8.0 992.6 25019.1 9.8 302 0.9 232 9.6 1,015.8 24716.0 9.2 348 3.6 36 13.0 309.1 4237.4 12.0 409 2.5 56 19.3 1,908.9 171
13.3 12.21 342 0.93 235 8.99 1,492.9 20127.1 30.4 69 0.0 439 26.4 1,796.7 17828.6 11.6 169 1.0 214 14.3 1,725.6 18638.6 53.12 15 0.01 439 37.44 2,050.0 16416.1 14.0 285 1.3 165 12.7 577.3 31518.9 17.7 199 0.9 242 20.0 1,262.9 221-1.9 -12.2 498 57.5 1 -165.3 647.8 30012.6 7.3 405 3.5 38 1.3 213.8 45211.5 26.3 188 0.8 256 18.7 701.1 28715.1 9.0 361 2.6 54 0.5 371.9 39219.2 20.4 176 0.1 410 16.1 1,551.4 1964.5 6.9 469 1.7 104 10.3 1,184.0 232
19.1 7.5 329 2.6 55 6.3 1,734.5 18415.4 10.0 344 2.1 76 13.6 657.0 29914.5 15.1 292 0.1 402 12.9 1,676.0 1896.5 8.23 450 1.57 127 2.24 209.2 456
33.0 26.9 61 0.7 280 24.6 1,248.0 2248.4 11.7 401 2.2 73 19.2 373.1 3917.9 18.9 324 0.5 333 15.5 682.9 292
20.7 7.3 311 2.0 83 2.0 395.5 384
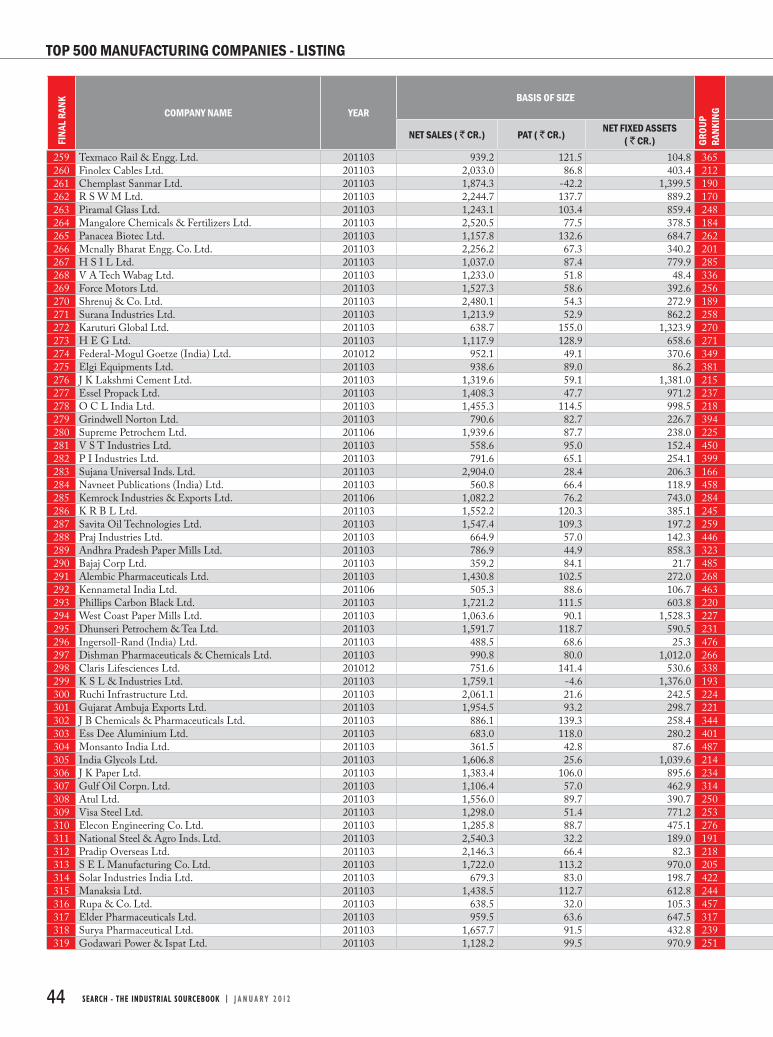
COMPANY NAME YEARBASIS OF SIZE
NET SALES ( ` CR.) PAT ( ` CR.) NET FIXED ASSETS( ` CR.)
44 SEARCH - THE INDUSTRIAL SOURCEBOOK | J A N U A R Y 2 0 1 2
FINA
L RAN
K
GROU
P RA
NKIN
G
TOP 500 MANUFACTURING COMPANIES - LISTING
259 Texmaco Rail & Engg. Ltd. 201103 939.2 121.5 104.8 365260 Finolex Cables Ltd. 201103 2,033.0 86.8 403.4 212261 Chemplast Sanmar Ltd. 201103 1,874.3 -42.2 1,399.5 190262 R S W M Ltd. 201103 2,244.7 137.7 889.2 170263 Piramal Glass Ltd. 201103 1,243.1 103.4 859.4 248264 Mangalore Chemicals & Fertilizers Ltd. 201103 2,520.5 77.5 378.5 184265 Panacea Biotec Ltd. 201103 1,157.8 132.6 684.7 262266 Mcnally Bharat Engg. Co. Ltd. 201103 2,256.2 67.3 340.2 201267 H S I L Ltd. 201103 1,037.0 87.4 779.9 285268 V A Tech Wabag Ltd. 201103 1,233.0 51.8 48.4 336269 Force Motors Ltd. 201103 1,527.3 58.6 392.6 256270 Shrenuj & Co. Ltd. 201103 2,480.1 54.3 272.9 189271 Surana Industries Ltd. 201103 1,213.9 52.9 862.2 258272 Karuturi Global Ltd. 201103 638.7 155.0 1,323.9 270273 H E G Ltd. 201103 1,117.9 128.9 658.6 271274 Federal-Mogul Goetze (India) Ltd. 201012 952.1 49.1 370.6 349275 Elgi Equipments Ltd. 201103 938.6 89.0 86.2 381276 J K Lakshmi Cement Ltd. 201103 1,319.6 59.1 1,381.0 215277 Essel Propack Ltd. 201103 1,408.3 47.7 971.2 237278 O C L India Ltd. 201103 1,455.3 114.5 998.5 218279 Grindwell Norton Ltd. 201103 790.6 82.7 226.7 394280 Supreme Petrochem Ltd. 201106 1,939.6 87.7 238.0 225281 V S T Industries Ltd. 201103 558.6 95.0 152.4 450282 P I Industries Ltd. 201103 791.6 65.1 254.1 399283 Sujana Universal Inds. Ltd. 201103 2,904.0 28.4 206.3 166284 Navneet Publications (India) Ltd. 201103 560.8 66.4 118.9 458285 Kemrock Industries & Exports Ltd. 201106 1,082.2 76.2 743.0 284286 K R B L Ltd. 201103 1,552.2 120.3 385.1 245287 Savita Oil Technologies Ltd. 201103 1,547.4 109.3 197.2 259288 Praj Industries Ltd. 201103 664.9 57.0 142.3 446289 Andhra Pradesh Paper Mills Ltd. 201103 786.9 44.9 858.3 323290 Bajaj Corp Ltd. 201103 359.2 84.1 21.7 485291 Alembic Pharmaceuticals Ltd. 201103 1,430.8 102.5 272.0 268292 Kennametal India Ltd. 201106 505.3 88.6 106.7 463293 Phillips Carbon Black Ltd. 201103 1,721.2 111.5 603.8 220294 West Coast Paper Mills Ltd. 201103 1,063.6 90.1 1,528.3 227295 Dhunseri Petrochem & Tea Ltd. 201103 1,591.7 118.7 590.5 231296 Ingersoll-Rand (India) Ltd. 201103 488.5 68.6 25.3 476297 Dishman Pharmaceuticals & Chemicals Ltd. 201103 990.8 80.0 1,012.0 266298 Claris Lifesciences Ltd. 201012 751.6 141.4 530.6 338299 K S L & Industries Ltd. 201103 1,759.1 -4.6 1,376.0 193300 Ruchi Infrastructure Ltd. 201103 2,061.1 21.6 242.5 224301 Gujarat Ambuja Exports Ltd. 201103 1,954.5 93.2 298.7 221302 J B Chemicals & Pharmaceuticals Ltd. 201103 886.1 139.3 258.4 344303 Ess Dee Aluminium Ltd. 201103 683.0 118.0 280.2 401304 Monsanto India Ltd. 201103 361.5 42.8 87.6 487305 India Glycols Ltd. 201103 1,606.8 25.6 1,039.6 214306 J K Paper Ltd. 201103 1,383.4 106.0 895.6 234307 Gulf Oil Corpn. Ltd. 201103 1,106.4 57.0 462.9 314308 Atul Ltd. 201103 1,556.0 89.7 390.7 250309 Visa Steel Ltd. 201103 1,298.0 51.4 771.2 253310 Elecon Engineering Co. Ltd. 201103 1,285.8 88.7 475.1 276311 National Steel & Agro Inds. Ltd. 201103 2,540.3 32.2 189.0 191312 Pradip Overseas Ltd. 201103 2,146.3 66.4 82.3 218313 S E L Manufacturing Co. Ltd. 201103 1,722.0 113.2 970.0 205314 Solar Industries India Ltd. 201103 679.3 83.0 198.7 422315 Manaksia Ltd. 201103 1,438.5 112.7 612.8 244316 Rupa & Co. Ltd. 201103 638.5 32.0 105.3 457317 Elder Pharmaceuticals Ltd. 201103 959.5 63.6 647.5 317318 Surya Pharmaceutical Ltd. 201103 1,657.7 91.5 432.8 239319 Godawari Power & Ispat Ltd. 201103 1,128.2 99.5 970.9 251
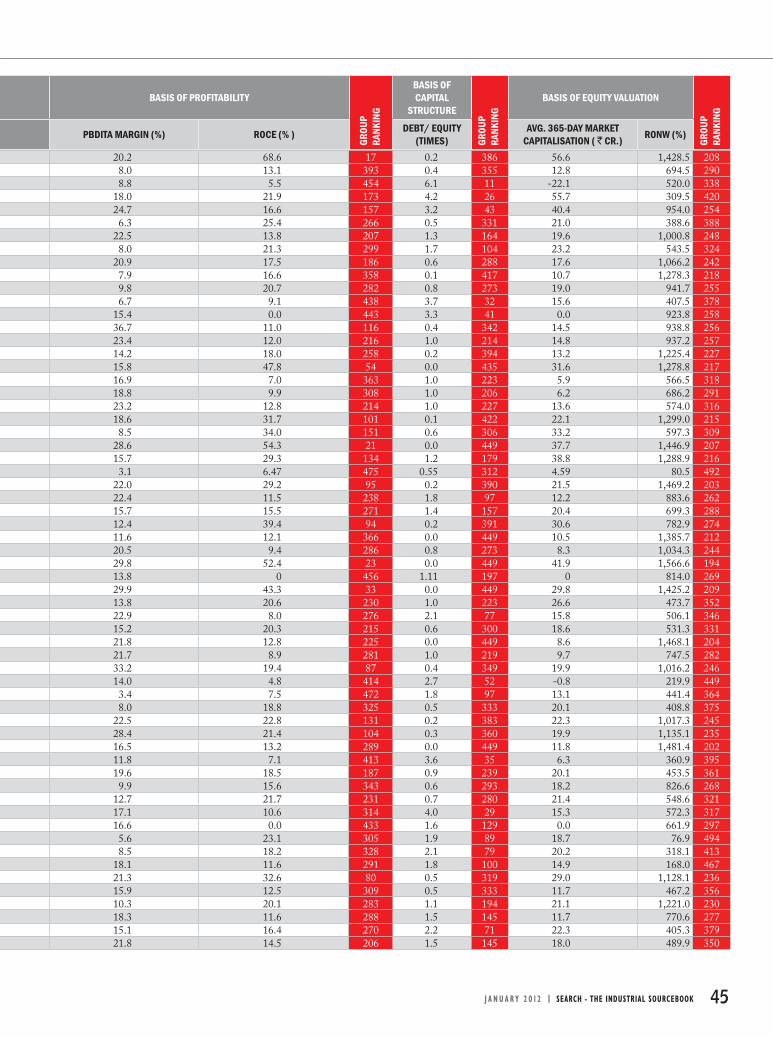
BASIS OF PROFITABILITYBASIS OF CAPITAL
STRUCTUREBASIS OF EQUITY VALUATION
PBDITA MARGIN (%) ROCE (% ) DEBT/ EQUITY (TIMES)
AVG. 365-DAY MARKET CAPITALISATION ( ` CR.) RONW (%)
J A N U A R Y 2 0 1 2 | SEARCH - THE INDUSTRIAL SOURCEBOOK 45
GROU
P RA
NKIN
G
GROU
P RA
NKIN
G
GROU
P RA
NKIN
G
20.2 68.6 17 0.2 386 56.6 1,428.5 2088.0 13.1 393 0.4 355 12.8 694.5 2908.8 5.5 454 6.1 11 -22.1 520.0 338
18.0 21.9 173 4.2 26 55.7 309.5 42024.7 16.6 157 3.2 43 40.4 954.0 2546.3 25.4 266 0.5 331 21.0 388.6 388
22.5 13.8 207 1.3 164 19.6 1,000.8 2488.0 21.3 299 1.7 104 23.2 543.5 324
20.9 17.5 186 0.6 288 17.6 1,066.2 2427.9 16.6 358 0.1 417 10.7 1,278.3 2189.8 20.7 282 0.8 273 19.0 941.7 2556.7 9.1 438 3.7 32 15.6 407.5 378
15.4 0.0 443 3.3 41 0.0 923.8 25836.7 11.0 116 0.4 342 14.5 938.8 25623.4 12.0 216 1.0 214 14.8 937.2 25714.2 18.0 258 0.2 394 13.2 1,225.4 22715.8 47.8 54 0.0 435 31.6 1,278.8 21716.9 7.0 363 1.0 223 5.9 566.5 31818.8 9.9 308 1.0 206 6.2 686.2 29123.2 12.8 214 1.0 227 13.6 574.0 31618.6 31.7 101 0.1 422 22.1 1,299.0 2158.5 34.0 151 0.6 306 33.2 597.3 309
28.6 54.3 21 0.0 449 37.7 1,446.9 20715.7 29.3 134 1.2 179 38.8 1,288.9 2163.1 6.47 475 0.55 312 4.59 80.5 492
22.0 29.2 95 0.2 390 21.5 1,469.2 20322.4 11.5 238 1.8 97 12.2 883.6 26215.7 15.5 271 1.4 157 20.4 699.3 28812.4 39.4 94 0.2 391 30.6 782.9 27411.6 12.1 366 0.0 449 10.5 1,385.7 21220.5 9.4 286 0.8 273 8.3 1,034.3 24429.8 52.4 23 0.0 449 41.9 1,566.6 19413.8 0 456 1.11 197 0 814.0 26929.9 43.3 33 0.0 449 29.8 1,425.2 20913.8 20.6 230 1.0 223 26.6 473.7 35222.9 8.0 276 2.1 77 15.8 506.1 34615.2 20.3 215 0.6 300 18.6 531.3 33121.8 12.8 225 0.0 449 8.6 1,468.1 20421.7 8.9 281 1.0 219 9.7 747.5 28233.2 19.4 87 0.4 349 19.9 1,016.2 24614.0 4.8 414 2.7 52 -0.8 219.9 4493.4 7.5 472 1.8 97 13.1 441.4 3648.0 18.8 325 0.5 333 20.1 408.8 375
22.5 22.8 131 0.2 383 22.3 1,017.3 24528.4 21.4 104 0.3 360 19.9 1,135.1 23516.5 13.2 289 0.0 449 11.8 1,481.4 20211.8 7.1 413 3.6 35 6.3 360.9 39519.6 18.5 187 0.9 239 20.1 453.5 3619.9 15.6 343 0.6 293 18.2 826.6 268
12.7 21.7 231 0.7 280 21.4 548.6 32117.1 10.6 314 4.0 29 15.3 572.3 31716.6 0.0 433 1.6 129 0.0 661.9 2975.6 23.1 305 1.9 89 18.7 76.9 4948.5 18.2 328 2.1 79 20.2 318.1 413
18.1 11.6 291 1.8 100 14.9 168.0 46721.3 32.6 80 0.5 319 29.0 1,128.1 23615.9 12.5 309 0.5 333 11.7 467.2 35610.3 20.1 283 1.1 194 21.1 1,221.0 23018.3 11.6 288 1.5 145 11.7 770.6 27715.1 16.4 270 2.2 71 22.3 405.3 37921.8 14.5 206 1.5 145 18.0 489.9 350
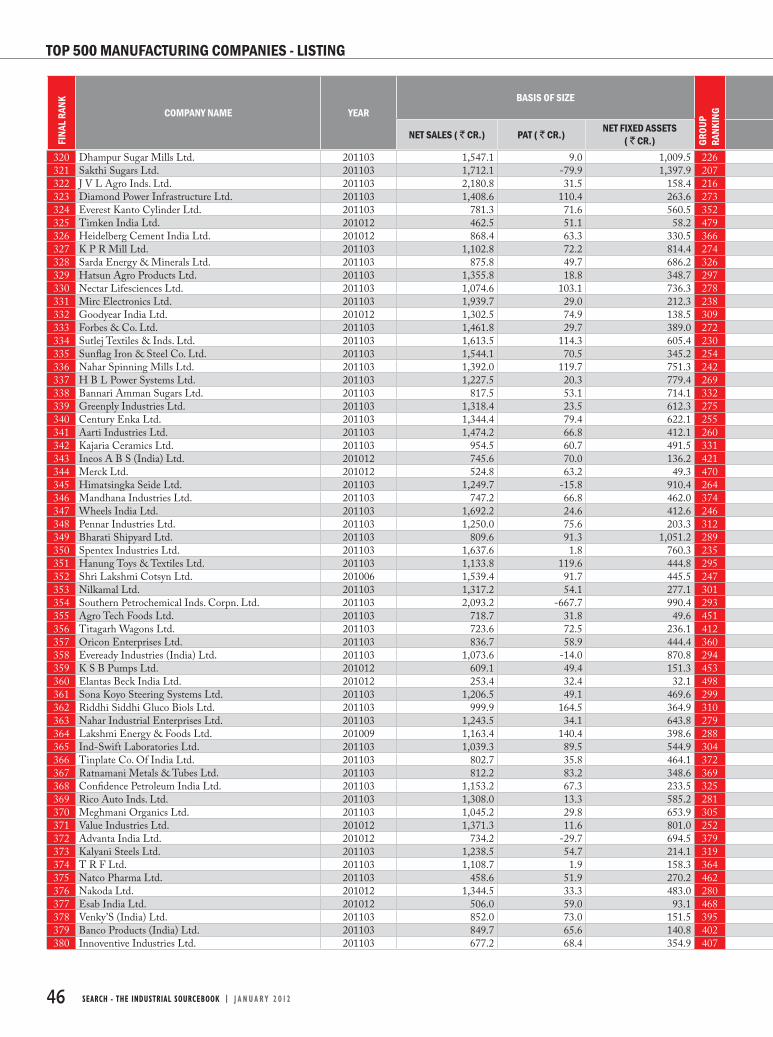
COMPANY NAME YEARBASIS OF SIZE
NET SALES ( ` CR.) PAT ( ` CR.) NET FIXED ASSETS( ` CR.)
46 SEARCH - THE INDUSTRIAL SOURCEBOOK | J A N U A R Y 2 0 1 2
FINA
L RAN
K
GROU
P RA
NKIN
G
TOP 500 MANUFACTURING COMPANIES - LISTING
320 Dhampur Sugar Mills Ltd. 201103 1,547.1 9.0 1,009.5 226321 Sakthi Sugars Ltd. 201103 1,712.1 -79.9 1,397.9 207322 J V L Agro Inds. Ltd. 201103 2,180.8 31.5 158.4 216323 Diamond Power Infrastructure Ltd. 201103 1,408.6 110.4 263.6 273324 Everest Kanto Cylinder Ltd. 201103 781.3 71.6 560.5 352325 Timken India Ltd. 201012 462.5 51.1 58.2 479326 Heidelberg Cement India Ltd. 201012 868.4 63.3 330.5 366327 K P R Mill Ltd. 201103 1,102.8 72.2 814.4 274328 Sarda Energy & Minerals Ltd. 201103 875.8 49.7 686.2 326329 Hatsun Agro Products Ltd. 201103 1,355.8 18.8 348.7 297330 Nectar Lifesciences Ltd. 201103 1,074.6 103.1 736.3 278331 Mirc Electronics Ltd. 201103 1,939.7 29.0 212.3 238332 Goodyear India Ltd. 201012 1,302.5 74.9 138.5 309333 Forbes & Co. Ltd. 201103 1,461.8 29.7 389.0 272334 Sutlej Textiles & Inds. Ltd. 201103 1,613.5 114.3 605.4 230335 Sunfl ag Iron & Steel Co. Ltd. 201103 1,544.1 70.5 345.2 254336 Nahar Spinning Mills Ltd. 201103 1,392.0 119.7 751.3 242337 H B L Power Systems Ltd. 201103 1,227.5 20.3 779.4 269338 Bannari Amman Sugars Ltd. 201103 817.5 53.1 714.1 332339 Greenply Industries Ltd. 201103 1,318.4 23.5 612.3 275340 Century Enka Ltd. 201103 1,344.4 79.4 622.1 255341 Aarti Industries Ltd. 201103 1,474.2 66.8 412.1 260342 Kajaria Ceramics Ltd. 201103 954.5 60.7 491.5 331343 Ineos A B S (India) Ltd. 201012 745.6 70.0 136.2 421344 Merck Ltd. 201012 524.8 63.2 49.3 470345 Himatsingka Seide Ltd. 201103 1,249.7 -15.8 910.4 264346 Mandhana Industries Ltd. 201103 747.2 66.8 462.0 374347 Wheels India Ltd. 201103 1,692.2 24.6 412.6 246348 Pennar Industries Ltd. 201103 1,250.0 75.6 203.3 312349 Bharati Shipyard Ltd. 201103 809.6 91.3 1,051.2 289350 Spentex Industries Ltd. 201103 1,637.6 1.8 760.3 235351 Hanung Toys & Textiles Ltd. 201103 1,133.8 119.6 444.8 295352 Shri Lakshmi Cotsyn Ltd. 201006 1,539.4 91.7 445.5 247353 Nilkamal Ltd. 201103 1,317.2 54.1 277.1 301354 Southern Petrochemical Inds. Corpn. Ltd. 201103 2,093.2 -667.7 990.4 293355 Agro Tech Foods Ltd. 201103 718.7 31.8 49.6 451356 Titagarh Wagons Ltd. 201103 723.6 72.5 236.1 412357 Oricon Enterprises Ltd. 201103 836.7 58.9 444.4 360358 Eveready Industries (India) Ltd. 201103 1,073.6 -14.0 870.8 294359 K S B Pumps Ltd. 201012 609.1 49.4 151.3 453360 Elantas Beck India Ltd. 201012 253.4 32.4 32.1 498361 Sona Koyo Steering Systems Ltd. 201103 1,206.5 49.1 469.6 299362 Riddhi Siddhi Gluco Biols Ltd. 201103 999.9 164.5 364.9 310363 Nahar Industrial Enterprises Ltd. 201103 1,243.5 34.1 643.8 279364 Lakshmi Energy & Foods Ltd. 201009 1,163.4 140.4 398.6 288365 Ind-Swift Laboratories Ltd. 201103 1,039.3 89.5 544.9 304366 Tinplate Co. Of India Ltd. 201103 802.7 35.8 464.1 372367 Ratnamani Metals & Tubes Ltd. 201103 812.2 83.2 348.6 369368 Confi dence Petroleum India Ltd. 201103 1,153.2 67.3 233.5 325369 Rico Auto Inds. Ltd. 201103 1,308.0 13.3 585.2 281370 Meghmani Organics Ltd. 201103 1,045.2 29.8 653.9 305371 Value Industries Ltd. 201012 1,371.3 11.6 801.0 252372 Advanta India Ltd. 201012 734.2 -29.7 694.5 379373 Kalyani Steels Ltd. 201103 1,238.5 54.7 214.1 319374 T R F Ltd. 201103 1,108.7 1.9 158.3 364375 Natco Pharma Ltd. 201103 458.6 51.9 270.2 462376 Nakoda Ltd. 201012 1,344.5 33.3 483.0 280377 Esab India Ltd. 201012 506.0 59.0 93.1 468378 Venky’S (India) Ltd. 201103 852.0 73.0 151.5 395379 Banco Products (India) Ltd. 201103 849.7 65.6 140.8 402380 Innoventive Industries Ltd. 201103 677.2 68.4 354.9 407

BASIS OF PROFITABILITYBASIS OF CAPITAL
STRUCTUREBASIS OF EQUITY VALUATION
PBDITA MARGIN (%) ROCE (% ) DEBT/ EQUITY (TIMES)
AVG. 365-DAY MARKET CAPITALISATION ( ` CR.) RONW (%)
J A N U A R Y 2 0 1 2 | SEARCH - THE INDUSTRIAL SOURCEBOOK 47
GROU
P RA
NKIN
G
GROU
P RA
NKIN
G
GROU
P RA
NKIN
G
10.2 6.51 432 1.79 97 1.77 305.3 4265.0 1.34 485 9.02 7 -53.04 134.6 4822.9 12.2 446 0.6 293 15.1 219.1 448
13.3 20.7 237 0.9 247 26.4 558.4 31919.0 7.5 333 0.5 327 10.4 852.4 26518.1 20.4 185 0.0 449 14.4 1,260.2 22214.7 13.3 313 0.0 449 8.6 883.8 26321.8 9.9 267 1.3 174 12.9 535.1 33018.0 8.5 331 0.9 239 7.9 739.4 2836.6 13.9 399 3.2 44 25.4 612.6 305
22.3 14.1 202 1.1 198 15.4 539.8 3263.8 12.5 434 0.6 298 11.4 305.8 424
10.0 47.9 66 0.0 449 31.3 664.9 2947.6 10.9 415 1.3 165 10.6 513.4 342
18.5 22.1 165 3.2 42 57.3 242.5 43810.9 15.4 335 0.9 235 15.9 437.5 36521.1 13.2 233 2.0 84 19.6 313.2 4198.6 5.8 453 1.5 149 3.8 497.4 347
18.8 7.7 330 0.7 278 7.5 720.4 2848.6 9.2 423 1.8 101 8.2 461.9 360
14.0 14.0 310 0.6 289 13.2 382.1 39013.5 15.3 304 1.0 206 13.9 393.3 38515.4 0.0 444 1.3 169 0.0 663.3 29615.6 33.9 106 0.0 449 23.1 889.1 26119.5 23.5 146 0.0 449 15.5 1,061.5 2438.3 3.6 467 1.4 152 -3.0 362.3 393
20.1 17.3 196 1.6 123 24.5 752.9 2797.6 14.7 379 1.5 139 11.8 249.4 437
12.1 35.0 121 0.8 260 38.0 518.3 33756.1 10.6 48 3.7 33 9.7 420.3 3749.7 7.8 426 16.7 4 3.3 117.5 485
18.9 15.4 232 2.0 85 26.6 421.5 37113.0 12.7 340 2.4 59 23.8 206.4 45710.5 17.1 318 0.9 253 17.6 432.0 367
-24.8 -20.9 499 0.0 449 0.0 409.6 3767.2 28.8 211 0.0 449 19.4 899.1 259
17.4 19.0 204 0.3 375 15.3 774.5 27614.3 17.1 269 0.3 380 13.1 578.5 3135.6 2.9 482 0.6 309 -2.4 320.5 412
15.4 19.0 229 0.0 431 13.2 810.1 27020.7 31.7 89 0.0 449 21.5 1,083.9 24012.1 20.7 251 1.7 110 25.7 318.8 41025.9 43.6 40 0.9 242 62.0 348.7 39615.8 7.6 368 1.8 93 5.6 222.3 44519.5 14.1 245 1.1 191 21.1 255.0 43415.5 10.8 334 1.7 110 21.1 317.5 41512.3 9.1 389 1.4 161 11.4 545.9 32220.4 18.2 184 0.6 300 20.8 530.9 33210.4 33.0 143 0.5 327 33.7 386.4 38910.8 10.0 396 1.5 142 4.3 209.9 45415.1 7.7 374 1.5 149 6.2 321.8 40912.3 6.64 412 1.81 95 2.55 78.8 4936.7 2.5 479 1.2 177 -5.9 540.4 3289.6 17.3 322 0.7 283 18.3 326.3 4063.1 6.2 478 2.3 66 1.3 471.1 353
20.4 15.6 213 0.6 292 15.8 750.3 2816.1 11.6 425 2.2 69 18.6 153.3 473
19.5 49.3 42 0.0 449 32.9 776.3 27514.3 32.8 122 0.4 344 30.4 525.9 33513.2 21.1 234 0.4 355 19.9 536.6 32925.6 32.0 68 1.9 91 51.8 541.1 323
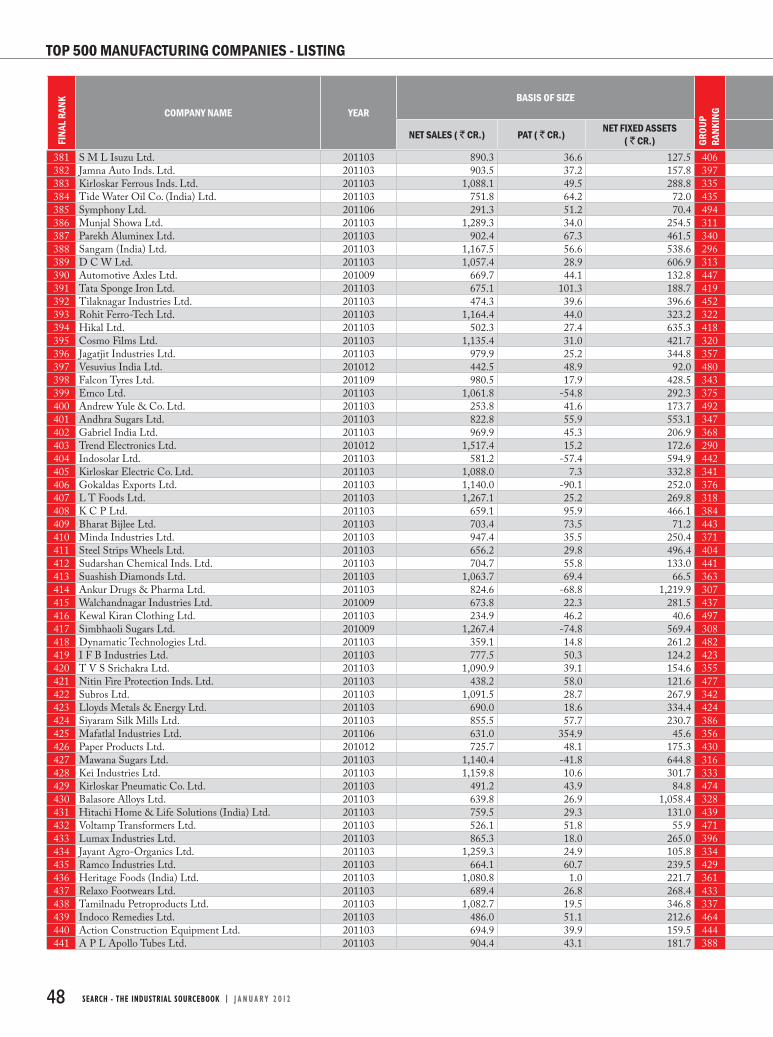
COMPANY NAME YEARBASIS OF SIZE
NET SALES ( ` CR.) PAT ( ` CR.) NET FIXED ASSETS( ` CR.)
48 SEARCH - THE INDUSTRIAL SOURCEBOOK | J A N U A R Y 2 0 1 2
FINA
L RAN
K
GROU
P RA
NKIN
G
TOP 500 MANUFACTURING COMPANIES - LISTING
381 S M L Isuzu Ltd. 201103 890.3 36.6 127.5 406382 Jamna Auto Inds. Ltd. 201103 903.5 37.2 157.8 397383 Kirloskar Ferrous Inds. Ltd. 201103 1,088.1 49.5 288.8 335384 Tide Water Oil Co. (India) Ltd. 201103 751.8 64.2 72.0 435385 Symphony Ltd. 201106 291.3 51.2 70.4 494386 Munjal Showa Ltd. 201103 1,289.3 34.0 254.5 311387 Parekh Aluminex Ltd. 201103 902.4 67.3 461.5 340388 Sangam (India) Ltd. 201103 1,167.5 56.6 538.6 296389 D C W Ltd. 201103 1,057.4 28.9 606.9 313390 Automotive Axles Ltd. 201009 669.7 44.1 132.8 447391 Tata Sponge Iron Ltd. 201103 675.1 101.3 188.7 419392 Tilaknagar Industries Ltd. 201103 474.3 39.6 396.6 452393 Rohit Ferro-Tech Ltd. 201103 1,164.4 44.0 323.2 322394 Hikal Ltd. 201103 502.3 27.4 635.3 418395 Cosmo Films Ltd. 201103 1,135.4 31.0 421.7 320396 Jagatjit Industries Ltd. 201103 979.9 25.2 344.8 357397 Vesuvius India Ltd. 201012 442.5 48.9 92.0 480398 Falcon Tyres Ltd. 201109 980.5 17.9 428.5 343399 Emco Ltd. 201103 1,061.8 -54.8 292.3 375400 Andrew Yule & Co. Ltd. 201103 253.8 41.6 173.7 492401 Andhra Sugars Ltd. 201103 822.8 55.9 553.1 347402 Gabriel India Ltd. 201103 969.9 45.3 206.9 368403 Trend Electronics Ltd. 201012 1,517.4 15.2 172.6 290404 Indosolar Ltd. 201103 581.2 -57.4 594.9 442405 Kirloskar Electric Co. Ltd. 201103 1,088.0 7.3 332.8 341406 Gokaldas Exports Ltd. 201103 1,140.0 -90.1 252.0 376407 L T Foods Ltd. 201103 1,267.1 25.2 269.8 318408 K C P Ltd. 201103 659.1 95.9 466.1 384409 Bharat Bijlee Ltd. 201103 703.4 73.5 71.2 443410 Minda Industries Ltd. 201103 947.4 35.5 250.4 371411 Steel Strips Wheels Ltd. 201103 656.2 29.8 496.4 404412 Sudarshan Chemical Inds. Ltd. 201103 704.7 55.8 133.0 441413 Suashish Diamonds Ltd. 201103 1,063.7 69.4 66.5 363414 Ankur Drugs & Pharma Ltd. 201103 824.6 -68.8 1,219.9 307415 Walchandnagar Industries Ltd. 201009 673.8 22.3 281.5 437416 Kewal Kiran Clothing Ltd. 201103 234.9 46.2 40.6 497417 Simbhaoli Sugars Ltd. 201009 1,267.4 -74.8 569.4 308418 Dynamatic Technologies Ltd. 201103 359.1 14.8 261.2 482419 I F B Industries Ltd. 201103 777.5 50.3 124.2 423420 T V S Srichakra Ltd. 201103 1,090.9 39.1 154.6 355421 Nitin Fire Protection Inds. Ltd. 201103 438.2 58.0 121.6 477422 Subros Ltd. 201103 1,091.5 28.7 267.9 342423 Lloyds Metals & Energy Ltd. 201103 690.0 18.6 334.4 424424 Siyaram Silk Mills Ltd. 201103 855.5 57.7 230.7 386425 Mafatlal Industries Ltd. 201106 631.0 354.9 45.6 356426 Paper Products Ltd. 201012 725.7 48.1 175.3 430427 Mawana Sugars Ltd. 201103 1,140.4 -41.8 644.8 316428 Kei Industries Ltd. 201103 1,159.8 10.6 301.7 333429 Kirloskar Pneumatic Co. Ltd. 201103 491.2 43.9 84.8 474430 Balasore Alloys Ltd. 201103 639.8 26.9 1,058.4 328431 Hitachi Home & Life Solutions (India) Ltd. 201103 759.5 29.3 131.0 439432 Voltamp Transformers Ltd. 201103 526.1 51.8 55.9 471433 Lumax Industries Ltd. 201103 865.3 18.0 265.0 396434 Jayant Agro-Organics Ltd. 201103 1,259.3 24.9 105.8 334435 Ramco Industries Ltd. 201103 664.1 60.7 239.5 429436 Heritage Foods (India) Ltd. 201103 1,080.8 1.0 221.7 361437 Relaxo Footwears Ltd. 201103 689.4 26.8 268.4 433438 Tamilnadu Petroproducts Ltd. 201103 1,082.7 19.5 346.8 337439 Indoco Remedies Ltd. 201103 486.0 51.1 212.6 464440 Action Construction Equipment Ltd. 201103 694.9 39.9 159.5 444441 A P L Apollo Tubes Ltd. 201103 904.4 43.1 181.7 388
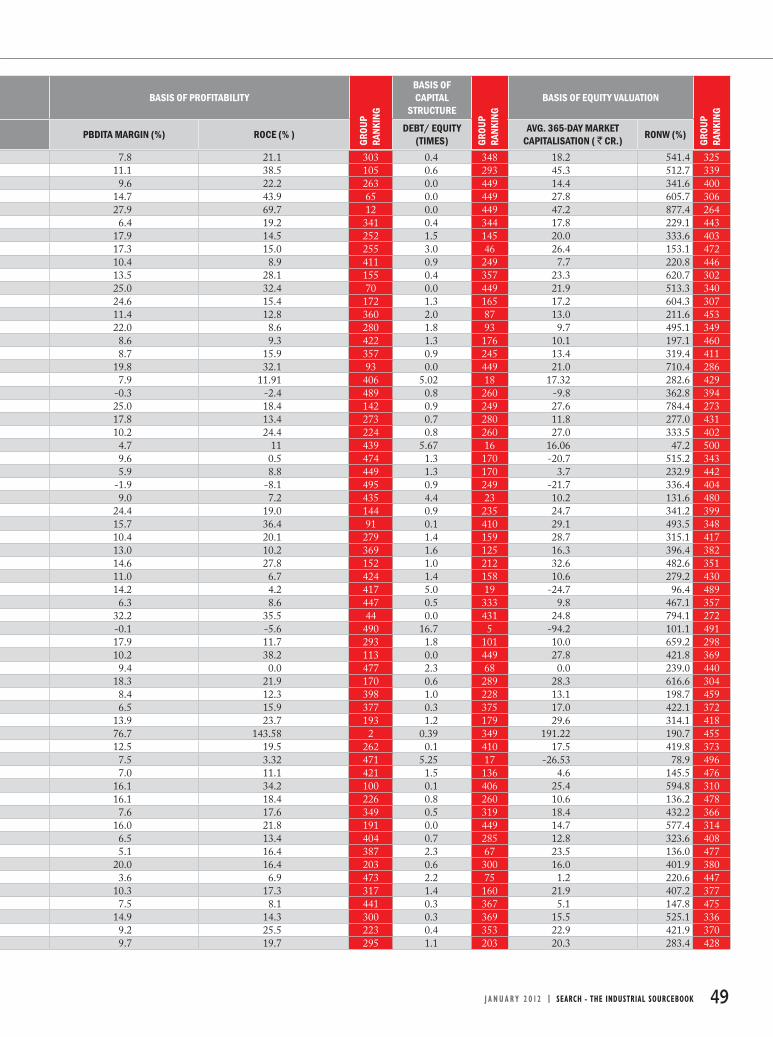
BASIS OF PROFITABILITYBASIS OF CAPITAL
STRUCTUREBASIS OF EQUITY VALUATION
PBDITA MARGIN (%) ROCE (% ) DEBT/ EQUITY (TIMES)
AVG. 365-DAY MARKET CAPITALISATION ( ` CR.) RONW (%)
J A N U A R Y 2 0 1 2 | SEARCH - THE INDUSTRIAL SOURCEBOOK 49
GROU
P RA
NKIN
G
GROU
P RA
NKIN
G
GROU
P RA
NKIN
G
7.8 21.1 303 0.4 348 18.2 541.4 32511.1 38.5 105 0.6 293 45.3 512.7 3399.6 22.2 263 0.0 449 14.4 341.6 400
14.7 43.9 65 0.0 449 27.8 605.7 30627.9 69.7 12 0.0 449 47.2 877.4 2646.4 19.2 341 0.4 344 17.8 229.1 443
17.9 14.5 252 1.5 145 20.0 333.6 40317.3 15.0 255 3.0 46 26.4 153.1 47210.4 8.9 411 0.9 249 7.7 220.8 44613.5 28.1 155 0.4 357 23.3 620.7 30225.0 32.4 70 0.0 449 21.9 513.3 34024.6 15.4 172 1.3 165 17.2 604.3 30711.4 12.8 360 2.0 87 13.0 211.6 45322.0 8.6 280 1.8 93 9.7 495.1 3498.6 9.3 422 1.3 176 10.1 197.1 4608.7 15.9 357 0.9 245 13.4 319.4 411
19.8 32.1 93 0.0 449 21.0 710.4 2867.9 11.91 406 5.02 18 17.32 282.6 429
-0.3 -2.4 489 0.8 260 -9.8 362.8 39425.0 18.4 142 0.9 249 27.6 784.4 27317.8 13.4 273 0.7 280 11.8 277.0 43110.2 24.4 224 0.8 260 27.0 333.5 4024.7 11 439 5.67 16 16.06 47.2 5009.6 0.5 474 1.3 170 -20.7 515.2 3435.9 8.8 449 1.3 170 3.7 232.9 442
-1.9 -8.1 495 0.9 249 -21.7 336.4 4049.0 7.2 435 4.4 23 10.2 131.6 480
24.4 19.0 144 0.9 235 24.7 341.2 39915.7 36.4 91 0.1 410 29.1 493.5 34810.4 20.1 279 1.4 159 28.7 315.1 41713.0 10.2 369 1.6 125 16.3 396.4 38214.6 27.8 152 1.0 212 32.6 482.6 35111.0 6.7 424 1.4 158 10.6 279.2 43014.2 4.2 417 5.0 19 -24.7 96.4 4896.3 8.6 447 0.5 333 9.8 467.1 357
32.2 35.5 44 0.0 431 24.8 794.1 272-0.1 -5.6 490 16.7 5 -94.2 101.1 49117.9 11.7 293 1.8 101 10.0 659.2 29810.2 38.2 113 0.0 449 27.8 421.8 3699.4 0.0 477 2.3 68 0.0 239.0 440
18.3 21.9 170 0.6 289 28.3 616.6 3048.4 12.3 398 1.0 228 13.1 198.7 4596.5 15.9 377 0.3 375 17.0 422.1 372
13.9 23.7 193 1.2 179 29.6 314.1 41876.7 143.58 2 0.39 349 191.22 190.7 45512.5 19.5 262 0.1 410 17.5 419.8 3737.5 3.32 471 5.25 17 -26.53 78.9 4967.0 11.1 421 1.5 136 4.6 145.5 476
16.1 34.2 100 0.1 406 25.4 594.8 31016.1 18.4 226 0.8 260 10.6 136.2 4787.6 17.6 349 0.5 319 18.4 432.2 366
16.0 21.8 191 0.0 449 14.7 577.4 3146.5 13.4 404 0.7 285 12.8 323.6 4085.1 16.4 387 2.3 67 23.5 136.0 477
20.0 16.4 203 0.6 300 16.0 401.9 3803.6 6.9 473 2.2 75 1.2 220.6 447
10.3 17.3 317 1.4 160 21.9 407.2 3777.5 8.1 441 0.3 367 5.1 147.8 475
14.9 14.3 300 0.3 369 15.5 525.1 3369.2 25.5 223 0.4 353 22.9 421.9 3709.7 19.7 295 1.1 203 20.3 283.4 428
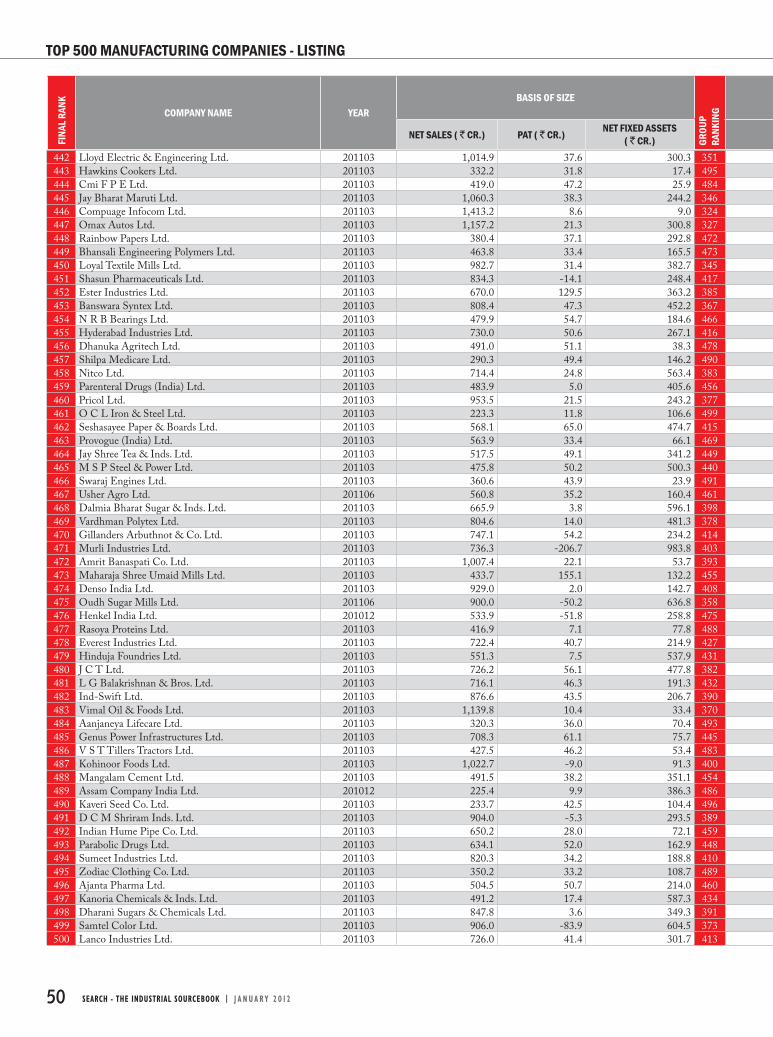
COMPANY NAME YEARBASIS OF SIZE
NET SALES ( ` CR.) PAT ( ` CR.) NET FIXED ASSETS( ` CR.)
50 SEARCH - THE INDUSTRIAL SOURCEBOOK | J A N U A R Y 2 0 1 2
FINA
L RAN
K
GROU
P RA
NKIN
G
TOP 500 MANUFACTURING COMPANIES - LISTING
442 Lloyd Electric & Engineering Ltd. 201103 1,014.9 37.6 300.3 351
443 Hawkins Cookers Ltd. 201103 332.2 31.8 17.4 495
444 Cmi F P E Ltd. 201103 419.0 47.2 25.9 484
445 Jay Bharat Maruti Ltd. 201103 1,060.3 38.3 244.2 346
446 Compuage Infocom Ltd. 201103 1,413.2 8.6 9.0 324
447 Omax Autos Ltd. 201103 1,157.2 21.3 300.8 327
448 Rainbow Papers Ltd. 201103 380.4 37.1 292.8 472
449 Bhansali Engineering Polymers Ltd. 201103 463.8 33.4 165.5 473
450 Loyal Textile Mills Ltd. 201103 982.7 31.4 382.7 345
451 Shasun Pharmaceuticals Ltd. 201103 834.3 -14.1 248.4 417
452 Ester Industries Ltd. 201103 670.0 129.5 363.2 385
453 Banswara Syntex Ltd. 201103 808.4 47.3 452.2 367
454 N R B Bearings Ltd. 201103 479.9 54.7 184.6 466
455 Hyderabad Industries Ltd. 201103 730.0 50.6 267.1 416
456 Dhanuka Agritech Ltd. 201103 491.0 51.1 38.3 478
457 Shilpa Medicare Ltd. 201103 290.3 49.4 146.2 490
458 Nitco Ltd. 201103 714.4 24.8 563.4 383
459 Parenteral Drugs (India) Ltd. 201103 483.9 5.0 405.6 456
460 Pricol Ltd. 201103 953.5 21.5 243.2 377
461 O C L Iron & Steel Ltd. 201103 223.3 11.8 106.6 499
462 Seshasayee Paper & Boards Ltd. 201103 568.1 65.0 474.7 415
463 Provogue (India) Ltd. 201103 563.9 33.4 66.1 469
464 Jay Shree Tea & Inds. Ltd. 201103 517.5 49.1 341.2 449
465 M S P Steel & Power Ltd. 201103 475.8 50.2 500.3 440
466 Swaraj Engines Ltd. 201103 360.6 43.9 23.9 491
467 Usher Agro Ltd. 201106 560.8 35.2 160.4 461
468 Dalmia Bharat Sugar & Inds. Ltd. 201103 665.9 3.8 596.1 398
469 Vardhman Polytex Ltd. 201103 804.6 14.0 481.3 378
470 Gillanders Arbuthnot & Co. Ltd. 201103 747.1 54.2 234.2 414
471 Murli Industries Ltd. 201103 736.3 -206.7 983.8 403
472 Amrit Banaspati Co. Ltd. 201103 1,007.4 22.1 53.7 393
473 Maharaja Shree Umaid Mills Ltd. 201103 433.7 155.1 132.2 455
474 Denso India Ltd. 201103 929.0 2.0 142.7 408
475 Oudh Sugar Mills Ltd. 201106 900.0 -50.2 636.8 358
476 Henkel India Ltd. 201012 533.9 -51.8 258.8 475
477 Rasoya Proteins Ltd. 201103 416.9 7.1 77.8 488
478 Everest Industries Ltd. 201103 722.4 40.7 214.9 427
479 Hinduja Foundries Ltd. 201103 551.3 7.5 537.9 431
480 J C T Ltd. 201103 726.2 56.1 477.8 382
481 L G Balakrishnan & Bros. Ltd. 201103 716.1 46.3 191.3 432
482 Ind-Swift Ltd. 201103 876.6 43.5 206.7 390
483 Vimal Oil & Foods Ltd. 201103 1,139.8 10.4 33.4 370
484 Aanjaneya Lifecare Ltd. 201103 320.3 36.0 70.4 493
485 Genus Power Infrastructures Ltd. 201103 708.3 61.1 75.7 445
486 V S T Tillers Tractors Ltd. 201103 427.5 46.2 53.4 483
487 Kohinoor Foods Ltd. 201103 1,022.7 -9.0 91.3 400
488 Mangalam Cement Ltd. 201103 491.5 38.2 351.1 454
489 Assam Company India Ltd. 201012 225.4 9.9 386.3 486
490 Kaveri Seed Co. Ltd. 201103 233.7 42.5 104.4 496
491 D C M Shriram Inds. Ltd. 201103 904.0 -5.3 293.5 389
492 Indian Hume Pipe Co. Ltd. 201103 650.2 28.0 72.1 459
493 Parabolic Drugs Ltd. 201103 634.1 52.0 162.9 448
494 Sumeet Industries Ltd. 201103 820.3 34.2 188.8 410
495 Zodiac Clothing Co. Ltd. 201103 350.2 33.2 108.7 489
496 Ajanta Pharma Ltd. 201103 504.5 50.7 214.0 460
497 Kanoria Chemicals & Inds. Ltd. 201103 491.2 17.4 587.3 434
498 Dharani Sugars & Chemicals Ltd. 201103 847.8 3.6 349.3 391
499 Samtel Color Ltd. 201103 906.0 -83.9 604.5 373
500 Lanco Industries Ltd. 201103 726.0 41.4 301.7 413
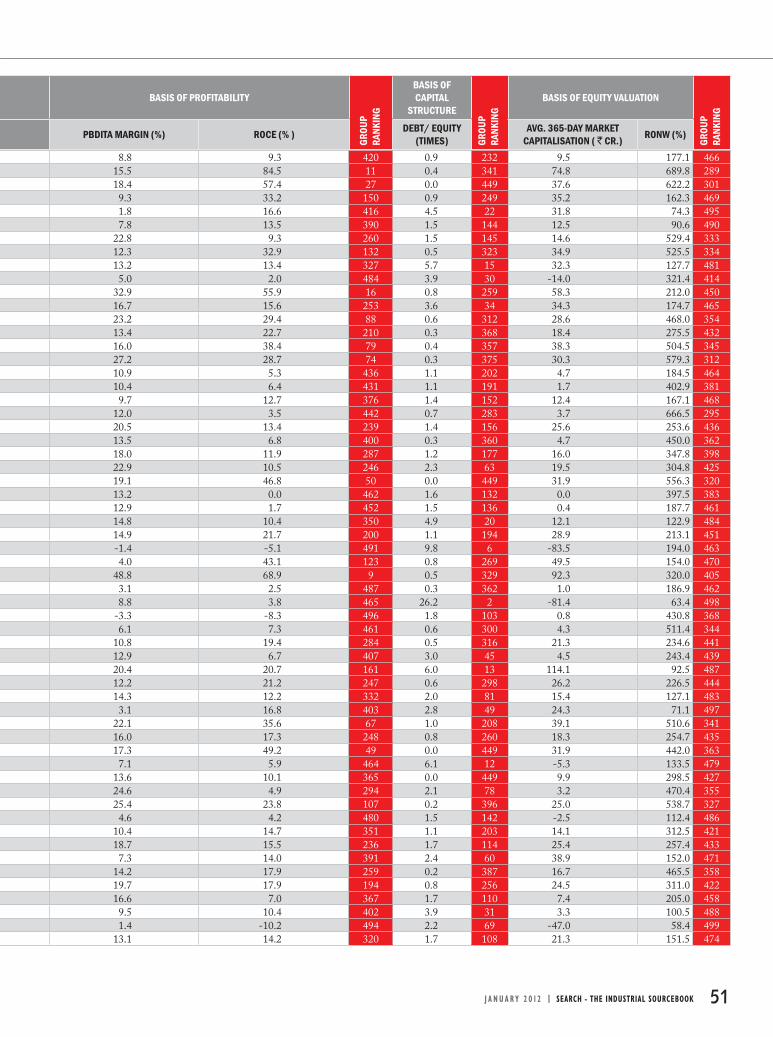
BASIS OF PROFITABILITYBASIS OF CAPITAL
STRUCTUREBASIS OF EQUITY VALUATION
PBDITA MARGIN (%) ROCE (% ) DEBT/ EQUITY (TIMES)
AVG. 365-DAY MARKET CAPITALISATION ( ` CR.) RONW (%)
J A N U A R Y 2 0 1 2 | SEARCH - THE INDUSTRIAL SOURCEBOOK 51
GROU
P RA
NKIN
G
GROU
P RA
NKIN
G
GROU
P RA
NKIN
G
8.8 9.3 420 0.9 232 9.5 177.1 466
15.5 84.5 11 0.4 341 74.8 689.8 289
18.4 57.4 27 0.0 449 37.6 622.2 301
9.3 33.2 150 0.9 249 35.2 162.3 469
1.8 16.6 416 4.5 22 31.8 74.3 495
7.8 13.5 390 1.5 144 12.5 90.6 490
22.8 9.3 260 1.5 145 14.6 529.4 333
12.3 32.9 132 0.5 323 34.9 525.5 334
13.2 13.4 327 5.7 15 32.3 127.7 481
5.0 2.0 484 3.9 30 -14.0 321.4 414
32.9 55.9 16 0.8 259 58.3 212.0 450
16.7 15.6 253 3.6 34 34.3 174.7 465
23.2 29.4 88 0.6 312 28.6 468.0 354
13.4 22.7 210 0.3 368 18.4 275.5 432
16.0 38.4 79 0.4 357 38.3 504.5 345
27.2 28.7 74 0.3 375 30.3 579.3 312
10.9 5.3 436 1.1 202 4.7 184.5 464
10.4 6.4 431 1.1 191 1.7 402.9 381
9.7 12.7 376 1.4 152 12.4 167.1 468
12.0 3.5 442 0.7 283 3.7 666.5 295
20.5 13.4 239 1.4 156 25.6 253.6 436
13.5 6.8 400 0.3 360 4.7 450.0 362
18.0 11.9 287 1.2 177 16.0 347.8 398
22.9 10.5 246 2.3 63 19.5 304.8 425
19.1 46.8 50 0.0 449 31.9 556.3 320
13.2 0.0 462 1.6 132 0.0 397.5 383
12.9 1.7 452 1.5 136 0.4 187.7 461
14.8 10.4 350 4.9 20 12.1 122.9 484
14.9 21.7 200 1.1 194 28.9 213.1 451
-1.4 -5.1 491 9.8 6 -83.5 194.0 463
4.0 43.1 123 0.8 269 49.5 154.0 470
48.8 68.9 9 0.5 329 92.3 320.0 405
3.1 2.5 487 0.3 362 1.0 186.9 462
8.8 3.8 465 26.2 2 -81.4 63.4 498
-3.3 -8.3 496 1.8 103 0.8 430.8 368
6.1 7.3 461 0.6 300 4.3 511.4 344
10.8 19.4 284 0.5 316 21.3 234.6 441
12.9 6.7 407 3.0 45 4.5 243.4 439
20.4 20.7 161 6.0 13 114.1 92.5 487
12.2 21.2 247 0.6 298 26.2 226.5 444
14.3 12.2 332 2.0 81 15.4 127.1 483
3.1 16.8 403 2.8 49 24.3 71.1 497
22.1 35.6 67 1.0 208 39.1 510.6 341
16.0 17.3 248 0.8 260 18.3 254.7 435
17.3 49.2 49 0.0 449 31.9 442.0 363
7.1 5.9 464 6.1 12 -5.3 133.5 479
13.6 10.1 365 0.0 449 9.9 298.5 427
24.6 4.9 294 2.1 78 3.2 470.4 355
25.4 23.8 107 0.2 396 25.0 538.7 327
4.6 4.2 480 1.5 142 -2.5 112.4 486
10.4 14.7 351 1.1 203 14.1 312.5 421
18.7 15.5 236 1.7 114 25.4 257.4 433
7.3 14.0 391 2.4 60 38.9 152.0 471
14.2 17.9 259 0.2 387 16.7 465.5 358
19.7 17.9 194 0.8 256 24.5 311.0 422
16.6 7.0 367 1.7 110 7.4 205.0 458
9.5 10.4 402 3.9 31 3.3 100.5 488
1.4 -10.2 494 2.2 69 -47.0 58.4 499
13.1 14.2 320 1.7 108 21.3 151.5 474


54 SEARCH - THE INDUSTRIAL SOURCEBOOK | J A N U A R Y 2 0 1 2
tarting with textiles in the late seventies, Reliance Group pursued a strategy of backward vertical integration – in
polyester, fibre intermediates, plastics, petrochemicals, petroleum refining and oil & gas exploration and production – to be fully integrated along the materials and energy value chain. Carrying the legacy forward, in 2010-11, Reliance Industries Limited (RIL) attained the largest profit growth in its history with record operating and financial results from each of the three core segments of petrochemicals, refining & marketing and oil & gas. The turnover achieved for the year was Rs2,58,651 crore — a growth of 29% over the previous year. The increase in revenue was due to 11% rise in volumes and 18% rise in prices. During the year, exports, including deemed exports, were higher by 33% at Rs1,46,667 crore. According to company officials, this landmark growth was the result of strong global economic recovery, India’s consumer demand for products & services linked to a better quality of life and best in class manufacturing achievements at all its plants.
Reliance entered into three partnerships in shale gas in North America, thereby establishing itself as one of the leading foreign investors in this emerging unconventional hydrocarbon opportunity. The company also announced strategic partnership with BP, which will enable the company to exploit the full potential of India’s domestic oil & gas portfolio. Growth through these partnerships is going to be a key part of the company’s strategy. Stepping into the digital space, RIL acquired ownership of pan-India broadband wireless access licence in 2010.
PERFORMANCE HIGHLIGHTSIn line with its aspirations of ongoing
growth, Reliance is investing its resources in core businesses across the integrated energy chain. It is also taking an initiative of investing in new technologies and businesses that help meet the changing aspirations of millions of Indian consumers. RIL attained various milestones in the last fiscal year. Some of them are: Production from KG-D6 for FY-
11 was 7.95 million barrels (MMBL) of crude oil, and 720 billion cubic feet (BCF) of natural gas — a growth of 97.6% and 41.7%, respectively.
In FY11, Reliance entered into four joint ventures (JV) in the USA.
These JVs, over a period, will enhance Reliance’s position in the development of unconventional natural gas & oil resources and develop new competencies in operating new businesses.
It processed 66.6 million metric tonne (MMT) of crude — the highest ever at its Jamnagar refinery complex.
The company made five oil discoveries in the on-land exploratory block CB–ONN–2003/1 (CB-10 A&B) in the Cambay basin, awarded under the NELP-V round of exploration bidding.
Q2 PERFORMANCERIL reported a 37% increase in its topline to Rs78,569 crore, while its net profit grew 16% to Rs5,703 crore during the quarter ended Sept 2011. RIL’s gross refining margin (GRM) for the quarter was at US$10.1 per barrel as against US$7.9 per barrel in the corresponding period of the previous year. Operating margins fell 380 bps to 12.5% as the cost of raw materials as a percentage to net sales rose 390 bps to 80.6% and purchases during the quarter rose 10 bps to 0.6%, while staff costs fell 20 bps to 0.9% and other expenses fell 120 bps to 5.5%. The operating profit rose 5% to Rs9,844 crore.
For the quarter ended September 2011, the sales of petrochemicals division increased 40% to Rs21,066 crore representing 23% of total revenues of the company. PBIT improved 10% at Rs2,422 crore, which was 34% of total PBIT. The capital employed decreased 15% to Rs31,091 crore representing 13% of total capital employed. Refining contributed 73% of the company’s total revenues in Q2FY12, rose 37% to Rs68,096 crore in the quarter ended September 2011. The PBIT increased 40% to Rs3,075
Participating and investing in India’s growth has been the fundamental principle of Reliance Industries Limited (RIL) and this is what has yet again taken RIL to the pole position in Top 500 Manufacturing. With the thrust on new businesses, new technologies & new partnerships, Reliance is traversing contours of new waves of growth. Going forward, value creation through operating excellence and new initiatives will be the key to growth for RIL.
STHE POLE STAR
Reliance Industries

J A N U A R Y 2 0 1 2 | SEARCH - THE INDUSTRIAL SOURCEBOOK 55
RIL - ANALYSING THE TOP 14
crore accounting for 44% of the total. The capital employed in this segment decreased 5% to Rs72,223 crore. For the quarter ended September 2011, the sales of the oil and gas division decreased 17% to Rs3,563 crore representing 4% of total revenues of the company. The decline was due to lower production from KG-D6 and Panna Mukta Tapti (PMT) blocks partly offset by higher crude oil price realisation. The PBIT too decreased 10% to Rs1,531 crore, which was 22% of the total. The capital employed decreased 49% to Rs27,339 crore representing 11% of total capital employed.
Commenting on the results, Mukesh D Ambani, CMD, Reliance Industries, said, “Our first half financial performance has been consistent. The increase in profits was largely driven by improved performance in the refining and petrochemicals business. All our manufacturing facilities operated at record levels with refineries achieving operating rates of 110%. RIL has a strong balance sheet and sustained earning base to pursue growth opportunities.”
THE UPHILL TASK In the oil & gas business, deep-water exploration and development operations present technological challenges and operating risks. The challenge for RIL is to ensure optimum level of production, safe and reliable operations while maintaining the highest level of health, safety and environment standards.
As far as its refining and marketing business is concerned, RIL competes globally with a number of large energy companies some of which also produce
crude oil and are integrated in their refining operations. Global sourcing involves inventory, logistics and pricing risks, which necessitates the need for significant risk mitigation strategies. The merchant nature of its refining business means that RIL faces extensive
competition in international markets for the sale of key transportation fuels. RIL benefits from the quality of its assets, an unprecedented level of operational integration as well as an experienced team that has demonstrated its ability to deliver globally competitive refining margins, cost competitiveness and consistently high operating rates.
Going by the market sentiments, IDBI Capital research analysts, in one of the reports, have revised PAT estimates downwards by 14% driven primarily by lower GRM assumption and decline in production volume from KG-D6. The company is facing significant delay in approvals for its capex plan in E&P assets. Further, arbitration process against the government’s decision on curbing cost recovery made in the KG-D6 block may aggravate the situation. However, the company has aggressive plans in telecom, natural gas marketing and financial business, which are not factored owing to the gestation period involved.
CAUTIOUS OUTLOOKAs per Nomura Financial Advisory And Securities India estimates, RIL has to tread the path cautiously owing to arbitration proceedings. The beginning of arbitration further exacerbates the impasse on KG-D6 block and also the overall E&P investment climate in India. However, such arbitration proceedings and also the planned move (if true) to amend the
existing Production Sharing Contract, primarily to penalise contractors, would be a negative for further and much needed investments in Indian E&P. In recent years, investor concerns on E&P have significantly increased over regulatory and policy uncertainties. These have included the government’s move to decline tax holiday on gas, government’s interference in pricing and marketing of gas, long delays in approval process of discoveries, work programmes and budgets, etc.
The government’s tough stance on the royalty and cess issue while approving Cairn India ownership
change has also not gone down well
with investors in our view. Such policy/regulatory uncertainties, are reflected in significantly reduced interest in new NELP rounds, and also significantly curtailed exploration & development efforts in recent years.
Overall, the company is strategically positioned to capitalise on the ever-increasing demand for petroleum products in the East African countries. It entered into high-growth aviation fuel segment this year and has a presence at 14 airports in India. The company plans to sharpen its focus on global markets for a significant part of petroleum products produced at the Jamnagar refinery.
Information sourced by Prerna Sharma
Turnover`2,58,651 crore ($ 58.0 billion)
Net Profi t`20,286 crore ($ 4.5 billion)
Total Assets`2,84,719 crore ($ 63.8 billion)
Turnover (` crore)
45
,40
4
50
,09
6
56
,247
73
,16
4
89
,124
118
,35
4
139
,26
9
146
,32
8
20
0,4
00 25
8,6
51
2001-02
2002-03
2003-04
2004-05
2005-06
2006-07
2007-08
2008-09
2009-10
2010-11
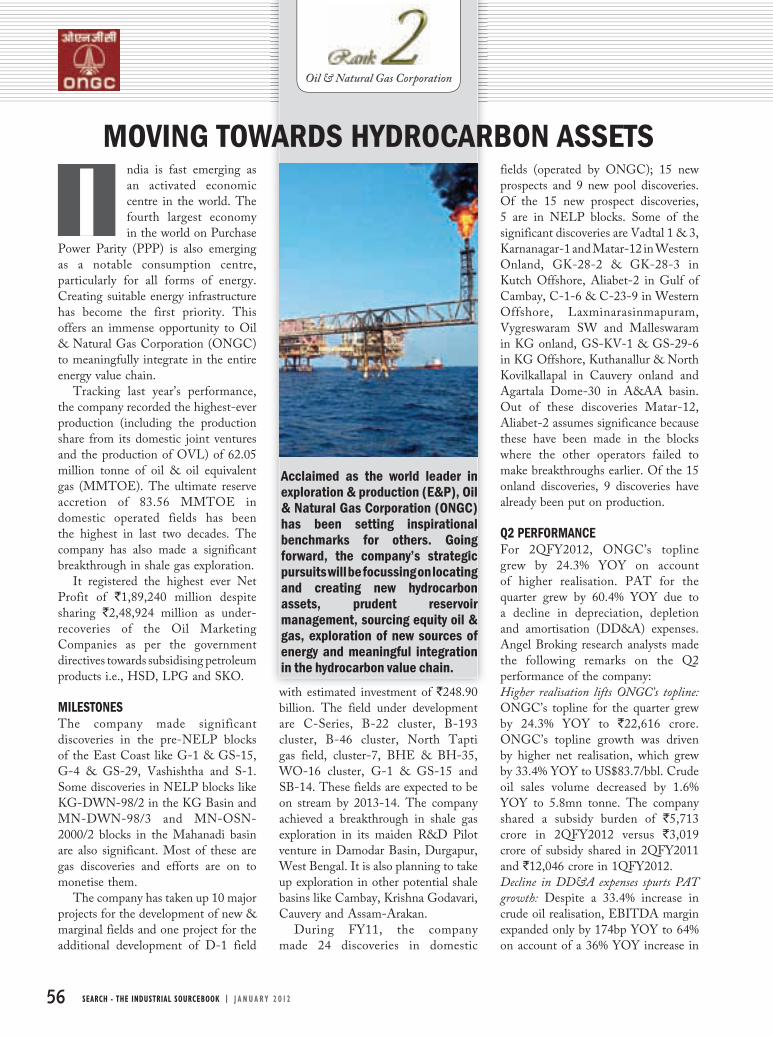
56 SEARCH - THE INDUSTRIAL SOURCEBOOK | J A N U A R Y 2 0 1 2
ndia is fast emerging as an activated economic centre in the world. The fourth largest economy in the world on Purchase
Power Parity (PPP) is also emerging as a notable consumption centre, particularly for all forms of energy. Creating suitable energy infrastructure has become the first priority. This offers an immense opportunity to Oil & Natural Gas Corporation (ONGC) to meaningfully integrate in the entire energy value chain.
Tracking last year’s performance, the company recorded the highest-ever production (including the production share from its domestic joint ventures and the production of OVL) of 62.05 million tonne of oil & oil equivalent gas (MMTOE). The ultimate reserve accretion of 83.56 MMTOE in domestic operated fields has been the highest in last two decades. The company has also made a significant breakthrough in shale gas exploration.
It registered the highest ever Net Profit of `1,89,240 million despite sharing `2,48,924 million as under-recoveries of the Oil Marketing Companies as per the government directives towards subsidising petroleum products i.e., HSD, LPG and SKO.
MILESTONESThe company made significant discoveries in the pre-NELP blocks of the East Coast like G-1 & GS-15, G-4 & GS-29, Vashishtha and S-1. Some discoveries in NELP blocks like KG-DWN-98/2 in the KG Basin and MN-DWN-98/3 and MN-OSN-2000/2 blocks in the Mahanadi basin are also significant. Most of these are gas discoveries and efforts are on to monetise them.
The company has taken up 10 major projects for the development of new & marginal fields and one project for the additional development of D-1 field
with estimated investment of `248.90 billion. The field under development are C-Series, B-22 cluster, B-193 cluster, B-46 cluster, North Tapti gas field, cluster-7, BHE & BH-35, WO-16 cluster, G-1 & GS-15 and SB-14. These fields are expected to be on stream by 2013-14. The company achieved a breakthrough in shale gas exploration in its maiden R&D Pilot venture in Damodar Basin, Durgapur, West Bengal. It is also planning to take up exploration in other potential shale basins like Cambay, Krishna Godavari, Cauvery and Assam-Arakan.
During FY11, the company made 24 discoveries in domestic
fields (operated by ONGC); 15 new prospects and 9 new pool discoveries. Of the 15 new prospect discoveries, 5 are in NELP blocks. Some of the significant discoveries are Vadtal 1 & 3, Karnanagar-1 and Matar-12 in Western Onland, GK-28-2 & GK-28-3 in Kutch Offshore, Aliabet-2 in Gulf of Cambay, C-1-6 & C-23-9 in Western Offshore, Laxminarasinmapuram, Vygreswaram SW and Malleswaram in KG onland, GS-KV-1 & GS-29-6 in KG Offshore, Kuthanallur & North Kovilkallapal in Cauvery onland and Agartala Dome-30 in A&AA basin. Out of these discoveries Matar-12, Aliabet-2 assumes significance because these have been made in the blocks where the other operators failed to make breakthroughs earlier. Of the 15 onland discoveries, 9 discoveries have already been put on production.
Q2 PERFORMANCEFor 2QFY2012, ONGC’s topline grew by 24.3% YOY on account of higher realisation. PAT for the quarter grew by 60.4% YOY due to a decline in depreciation, depletion and amortisation (DD&A) expenses. Angel Broking research analysts made the following remarks on the Q2 performance of the company:Higher realisation lifts ONGC’s topline: ONGC’s topline for the quarter grew by 24.3% YOY to `22,616 crore. ONGC’s topline growth was driven by higher net realisation, which grew by 33.4% YOY to US$83.7/bbl. Crude oil sales volume decreased by 1.6% YOY to 5.8mn tonne. The company shared a subsidy burden of `5,713 crore in 2QFY2012 versus `3,019 crore of subsidy shared in 2QFY2011 and `12,046 crore in 1QFY2012. Decline in DD&A expenses spurts PAT
growth: Despite a 33.4% increase in crude oil realisation, EBITDA margin expanded only by 174bp YOY to 64% on account of a 36% YOY increase in
Acclaimed as the world leader in exploration & production (E&P), Oil & Natural Gas Corporation (ONGC) has been setting inspirational benchmarks for others. Going forward, the company’s strategic pursuits will be focussing on locating and creating new hydrocarbon assets, prudent reservoir management, sourcing equity oil & gas, exploration of new sources of energy and meaningful integration in the hydrocarbon value chain.
IMOVING TOWARDS HYDROCARBON ASSETS
Oil & Natural Gas Corporation
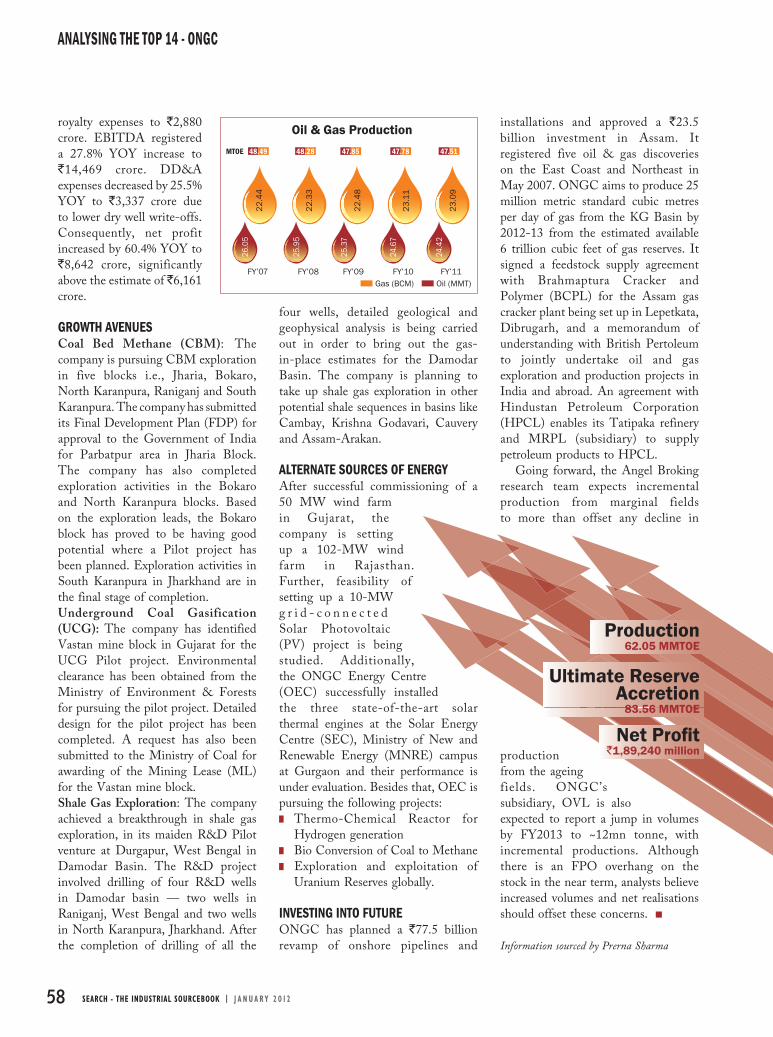
58 SEARCH - THE INDUSTRIAL SOURCEBOOK | J A N U A R Y 2 0 1 2
ANALYSING THE TOP 14 - ONGC
royalty expenses to `2,880 crore. EBITDA registered a 27.8% YOY increase to `14,469 crore. DD&A expenses decreased by 25.5% YOY to `3,337 crore due to lower dry well write-offs. Consequently, net profit increased by 60.4% YOY to `8,642 crore, significantly above the estimate of `6,161 crore.
GROWTH AVENUESCoal Bed Methane (CBM): The company is pursuing CBM exploration in five blocks i.e., Jharia, Bokaro, North Karanpura, Raniganj and South Karanpura. The company has submitted its Final Development Plan (FDP) for approval to the Government of India for Parbatpur area in Jharia Block. The company has also completed exploration activities in the Bokaro and North Karanpura blocks. Based on the exploration leads, the Bokaro block has proved to be having good potential where a Pilot project has been planned. Exploration activities in South Karanpura in Jharkhand are in the final stage of completion.Underground Coal Gasification (UCG): The company has identified Vastan mine block in Gujarat for the UCG Pilot project. Environmental clearance has been obtained from the Ministry of Environment & Forests for pursuing the pilot project. Detailed design for the pilot project has been completed. A request has also been submitted to the Ministry of Coal for awarding of the Mining Lease (ML) for the Vastan mine block.Shale Gas Exploration: The company achieved a breakthrough in shale gas exploration, in its maiden R&D Pilot venture at Durgapur, West Bengal in Damodar Basin. The R&D project involved drilling of four R&D wells in Damodar basin — two wells in Raniganj, West Bengal and two wells in North Karanpura, Jharkhand. After the completion of drilling of all the
four wells, detailed geological and geophysical analysis is being carried out in order to bring out the gas-in-place estimates for the Damodar Basin. The company is planning to take up shale gas exploration in other potential shale sequences in basins like Cambay, Krishna Godavari, Cauvery and Assam-Arakan.
ALTERNATE SOURCES OF ENERGYAfter successful commissioning of a 50 MW wind farm in Gujarat, the company is setting up a 102-MW wind farm in Rajasthan. Further, feasibility of setting up a 10-MW g r i d - c o n n e c t e d Solar Photovoltaic (PV) project is being studied. Additionally, the ONGC Energy Centre (OEC) successfully installed the three state-of-the-art solar thermal engines at the Solar Energy Centre (SEC), Ministry of New and Renewable Energy (MNRE) campus at Gurgaon and their performance is under evaluation. Besides that, OEC is pursuing the following projects: Thermo-Chemical Reactor for
Hydrogen generation Bio Conversion of Coal to Methane Exploration and exploitation of
Uranium Reserves globally.
INVESTING INTO FUTURE ONGC has planned a `77.5 billion revamp of onshore pipelines and
installations and approved a `23.5 billion investment in Assam. It registered five oil & gas discoveries on the East Coast and Northeast in May 2007. ONGC aims to produce 25 million metric standard cubic metres per day of gas from the KG Basin by 2012-13 from the estimated available 6 trillion cubic feet of gas reserves. It signed a feedstock supply agreement with Brahmaptura Cracker and Polymer (BCPL) for the Assam gas cracker plant being set up in Lepetkata, Dibrugarh, and a memorandum of understanding with British Pertoleum to jointly undertake oil and gas exploration and production projects in India and abroad. An agreement with Hindustan Petroleum Corporation (HPCL) enables its Tatipaka refinery and MRPL (subsidiary) to supply petroleum products to HPCL.
Going forward, the Angel Broking research team expects incremental production from marginal fields to more than offset any decline in
production from the ageing fields. ONGC’s subsidiary, OVL is also expected to report a jump in volumes by FY2013 to ~12mn tonne, with incremental productions. Although there is an FPO overhang on the stock in the near term, analysts believe increased volumes and net realisations should offset these concerns.
Information sourced by Prerna Sharma
Oil & Gas Production
FY’07
MTOE 48.49 48.28 47.85 47.78 47.51
FY’08 FY’09 FY’10 FY’11Gas (BCM) Oil (MMT)
22
.44
22
.33
22
.48
23
.11
23
.09
26.0
5
25.9
5
25.3
7
24.6
7
24.4
2
Production62.05 MMTOE
Ultimate Reserve Accretion
83.56 MMTOE
Net Profi t`1,89,240 million

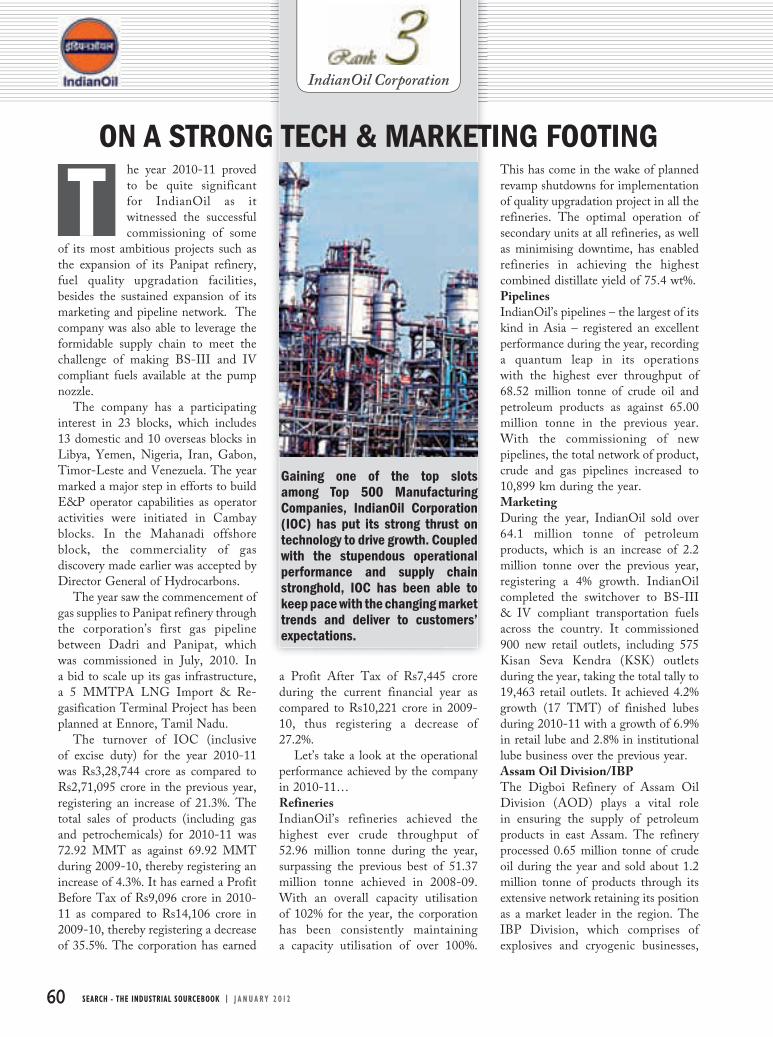
60 SEARCH - THE INDUSTRIAL SOURCEBOOK | J A N U A R Y 2 0 1 2
he year 2010-11 proved to be quite significant for IndianOil as it witnessed the successful commissioning of some
of its most ambitious projects such as the expansion of its Panipat refinery, fuel quality upgradation facilities, besides the sustained expansion of its marketing and pipeline network. The company was also able to leverage the formidable supply chain to meet the challenge of making BS-III and IV compliant fuels available at the pump nozzle.
The company has a participating interest in 23 blocks, which includes 13 domestic and 10 overseas blocks in Libya, Yemen, Nigeria, Iran, Gabon, Timor-Leste and Venezuela. The year marked a major step in efforts to build E&P operator capabilities as operator activities were initiated in Cambay blocks. In the Mahanadi offshore block, the commerciality of gas discovery made earlier was accepted by Director General of Hydrocarbons.
The year saw the commencement of gas supplies to Panipat refinery through the corporation’s first gas pipeline between Dadri and Panipat, which was commissioned in July, 2010. In a bid to scale up its gas infrastructure, a 5 MMTPA LNG Import & Re-gasification Terminal Project has been planned at Ennore, Tamil Nadu.
The turnover of IOC (inclusive of excise duty) for the year 2010-11 was Rs3,28,744 crore as compared to Rs2,71,095 crore in the previous year, registering an increase of 21.3%. The total sales of products (including gas and petrochemicals) for 2010-11 was 72.92 MMT as against 69.92 MMT during 2009-10, thereby registering an increase of 4.3%. It has earned a Profit Before Tax of Rs9,096 crore in 2010-11 as compared to Rs14,106 crore in 2009-10, thereby registering a decrease of 35.5%. The corporation has earned
a Profit After Tax of Rs7,445 crore during the current financial year as compared to Rs10,221 crore in 2009-10, thus registering a decrease of 27.2%.
Let’s take a look at the operational performance achieved by the company in 2010-11…RefineriesIndianOil’s refineries achieved the highest ever crude throughput of 52.96 million tonne during the year, surpassing the previous best of 51.37 million tonne achieved in 2008-09. With an overall capacity utilisation of 102% for the year, the corporation has been consistently maintaining a capacity utilisation of over 100%.
This has come in the wake of planned revamp shutdowns for implementation of quality upgradation project in all the refineries. The optimal operation of secondary units at all refineries, as well as minimising downtime, has enabled refineries in achieving the highest combined distillate yield of 75.4 wt%.PipelinesIndianOil’s pipelines – the largest of its kind in Asia – registered an excellent performance during the year, recording a quantum leap in its operations with the highest ever throughput of 68.52 million tonne of crude oil and petroleum products as against 65.00 million tonne in the previous year. With the commissioning of new pipelines, the total network of product, crude and gas pipelines increased to 10,899 km during the year.MarketingDuring the year, IndianOil sold over 64.1 million tonne of petroleum products, which is an increase of 2.2 million tonne over the previous year, registering a 4% growth. IndianOil completed the switchover to BS-III & IV compliant transportation fuels across the country. It commissioned 900 new retail outlets, including 575 Kisan Seva Kendra (KSK) outlets during the year, taking the total tally to 19,463 retail outlets. It achieved 4.2% growth (17 TMT) of finished lubes during 2010-11 with a growth of 6.9% in retail lube and 2.8% in institutional lube business over the previous year. Assam Oil Division/IBPThe Digboi Refinery of Assam Oil Division (AOD) plays a vital role in ensuring the supply of petroleum products in east Assam. The refinery processed 0.65 million tonne of crude oil during the year and sold about 1.2 million tonne of products through its extensive network retaining its position as a market leader in the region. The IBP Division, which comprises of explosives and cryogenic businesses,
Gaining one of the top slots among Top 500 Manufacturing Companies, IndianOil Corporation (IOC) has put its strong thrust on technology to drive growth. Coupled with the stupendous operational performance and supply chain stronghold, IOC has been able to keep pace with the changing market trends and deliver to customers’ expectations.
TON A STRONG TECH & MARKETING FOOTING
IndianOil Corporation
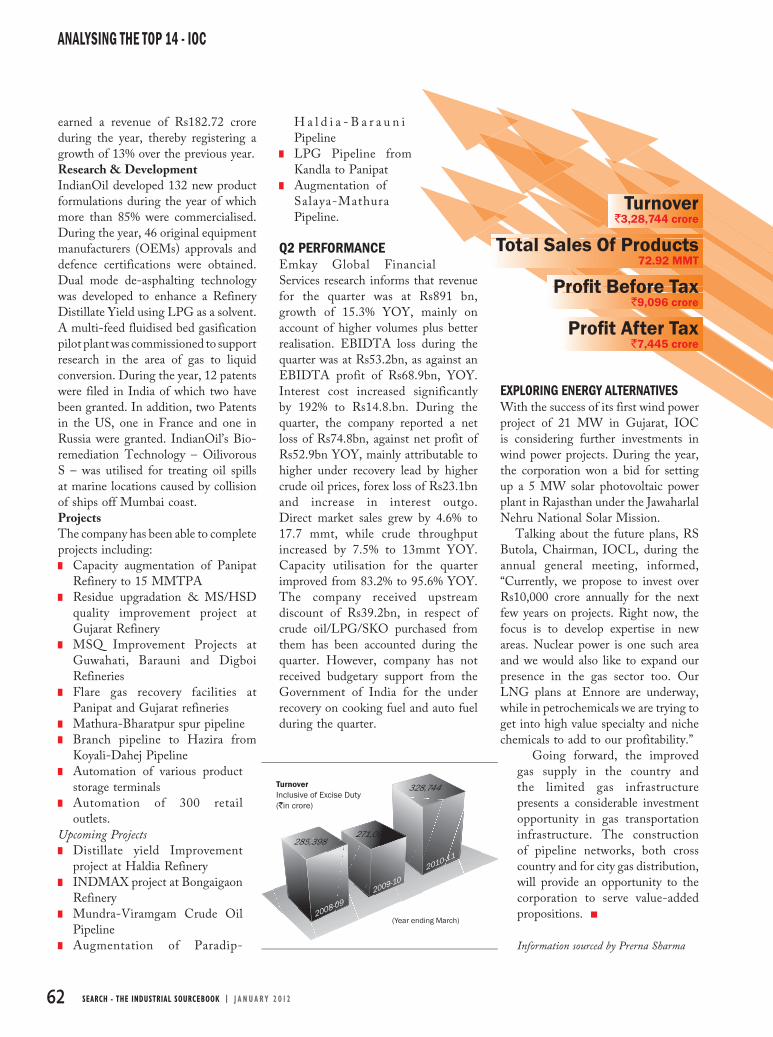
62 SEARCH - THE INDUSTRIAL SOURCEBOOK | J A N U A R Y 2 0 1 2
ANALYSING THE TOP 14 - IOC
Turnover`3,28,744 crore
Total Sales Of Products72.92 MMT
Profi t Before Tax`9,096 crore
Profi t After Tax`7,445 crore
TurnoverInclusive of Excise Duty (`in crore)
285,398271,095
328,744
2008-09
2009-10
2010-11
(Year ending March)
earned a revenue of Rs182.72 crore during the year, thereby registering a growth of 13% over the previous year.Research & DevelopmentIndianOil developed 132 new product formulations during the year of which more than 85% were commercialised. During the year, 46 original equipment manufacturers (OEMs) approvals and defence certifications were obtained. Dual mode de-asphalting technology was developed to enhance a Refinery Distillate Yield using LPG as a solvent. A multi-feed fluidised bed gasification pilot plant was commissioned to support research in the area of gas to liquid conversion. During the year, 12 patents were filed in India of which two have been granted. In addition, two Patents in the US, one in France and one in Russia were granted. IndianOil’s Bio-remediation Technology – Oilivorous S – was utilised for treating oil spills at marine locations caused by collision of ships off Mumbai coast.ProjectsThe company has been able to complete projects including: Capacity augmentation of Panipat
Refinery to 15 MMTPA Residue upgradation & MS/HSD
quality improvement project at Gujarat Refinery
MSQ Improvement Projects at Guwahati, Barauni and Digboi Refineries
Flare gas recovery facilities at Panipat and Gujarat refineries
Mathura-Bharatpur spur pipeline Branch pipeline to Hazira from
Koyali-Dahej Pipeline Automation of various product
storage terminals Automation of 300 retail
outlets.Upcoming Projects
Distillate yield Improvement project at Haldia Refinery
INDMAX project at Bongaigaon Refinery
Mundra-Viramgam Crude Oil Pipeline
Augmentation of Paradip-
H a l d i a - B a r a u n i Pipeline
LPG Pipeline from Kandla to Panipat
Augmentation of Salaya-Mathura Pipeline.
Q2 PERFORMANCEEmkay Global Financial Services research informs that revenue for the quarter was at Rs891 bn, growth of 15.3% YOY, mainly on account of higher volumes plus better realisation. EBIDTA loss during the quarter was at Rs53.2bn, as against an EBIDTA profit of Rs68.9bn, YOY. Interest cost increased significantly by 192% to Rs14.8.bn. During the quarter, the company reported a net loss of Rs74.8bn, against net profit of Rs52.9bn YOY, mainly attributable to higher under recovery lead by higher crude oil prices, forex loss of Rs23.1bn and increase in interest outgo. Direct market sales grew by 4.6% to 17.7 mmt, while crude throughput increased by 7.5% to 13mmt YOY. Capacity utilisation for the quarter improved from 83.2% to 95.6% YOY. The company received upstream discount of Rs39.2bn, in respect of crude oil/LPG/SKO purchased from them has been accounted during the quarter. However, company has not received budgetary support from the Government of India for the under recovery on cooking fuel and auto fuel during the quarter.
EXPLORING ENERGY ALTERNATIVESWith the success of its first wind power project of 21 MW in Gujarat, IOC is considering further investments in wind power projects. During the year, the corporation won a bid for setting up a 5 MW solar photovoltaic power plant in Rajasthan under the Jawaharlal Nehru National Solar Mission.
Talking about the future plans, RS Butola, Chairman, IOCL, during the annual general meeting, informed, “Currently, we propose to invest over Rs10,000 crore annually for the next few years on projects. Right now, the focus is to develop expertise in new areas. Nuclear power is one such area and we would also like to expand our presence in the gas sector too. Our LNG plans at Ennore are underway, while in petrochemicals we are trying to get into high value specialty and niche chemicals to add to our profitability.”
Going forward, the improved gas supply in the country and the limited gas infrastructure presents a considerable investment opportunity in gas transportation infrastructure. The construction of pipeline networks, both cross country and for city gas distribution, will provide an opportunity to the corporation to serve value-added propositions.
Information sourced by Prerna Sharma
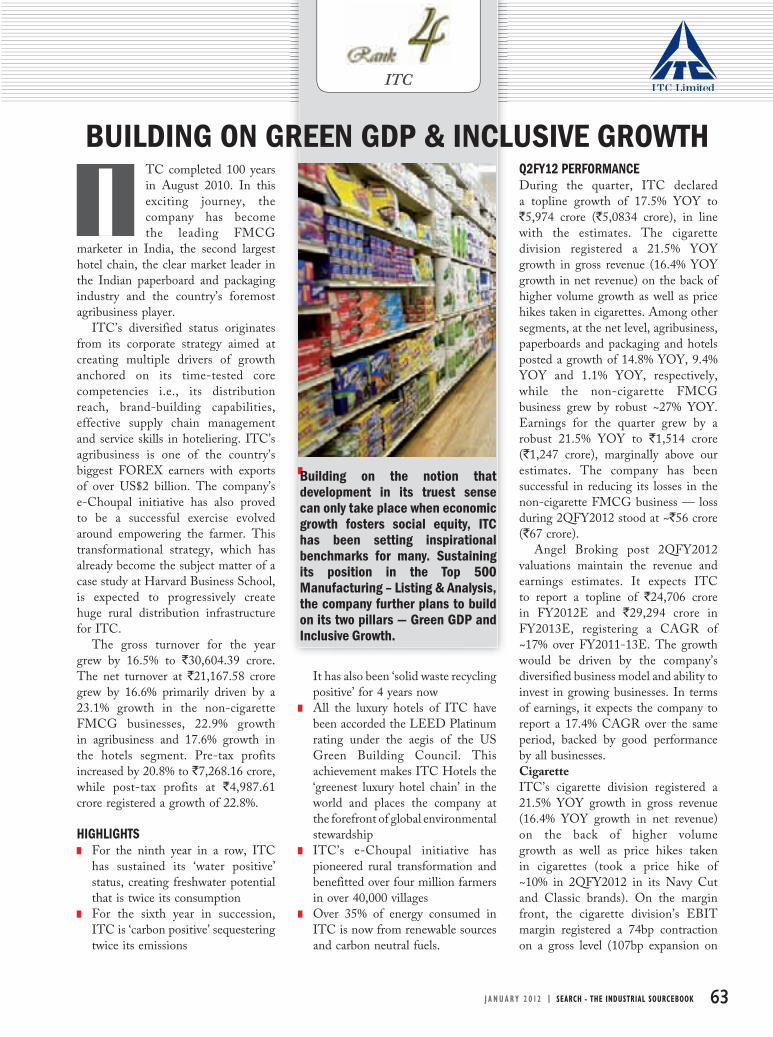
J A N U A R Y 2 0 1 2 | SEARCH - THE INDUSTRIAL SOURCEBOOK 63
TC completed 100 years in August 2010. In this exciting journey, the company has become the leading FMCG
marketer in India, the second largest hotel chain, the clear market leader in the Indian paperboard and packaging industry and the country’s foremost agribusiness player.
ITC’s diversified status originates from its corporate strategy aimed at creating multiple drivers of growth anchored on its time-tested core competencies i.e., its distribution reach, brand-building capabilities, effective supply chain management and service skills in hoteliering. ITC’s agribusiness is one of the country’s biggest FOREX earners with exports of over US$2 billion. The company’s e-Choupal initiative has also proved to be a successful exercise evolved around empowering the farmer. This transformational strategy, which has already become the subject matter of a case study at Harvard Business School, is expected to progressively create huge rural distribution infrastructure for ITC.
The gross turnover for the year grew by 16.5% to `30,604.39 crore. The net turnover at `21,167.58 crore grew by 16.6% primarily driven by a 23.1% growth in the non-cigarette FMCG businesses, 22.9% growth in agribusiness and 17.6% growth in the hotels segment. Pre-tax profits increased by 20.8% to `7,268.16 crore, while post-tax profits at `4,987.61 crore registered a growth of 22.8%.
HIGHLIGHTS For the ninth year in a row, ITC
has sustained its ‘water positive’ status, creating freshwater potential that is twice its consumption
For the sixth year in succession, ITC is ‘carbon positive’ sequestering twice its emissions
It has also been ‘solid waste recycling positive’ for 4 years now
All the luxury hotels of ITC have been accorded the LEED Platinum rating under the aegis of the US Green Building Council. This achievement makes ITC Hotels the ‘greenest luxury hotel chain’ in the world and places the company at the forefront of global environmental stewardship
ITC’s e-Choupal initiative has pioneered rural transformation and benefitted over four million farmers in over 40,000 villages
Over 35% of energy consumed in ITC is now from renewable sources and carbon neutral fuels.
Q2FY12 PERFORMANCEDuring the quarter, ITC declared a topline growth of 17.5% YOY to `5,974 crore (`5,0834 crore), in line with the estimates. The cigarette division registered a 21.5% YOY growth in gross revenue (16.4% YOY growth in net revenue) on the back of higher volume growth as well as price hikes taken in cigarettes. Among other segments, at the net level, agribusiness, paperboards and packaging and hotels posted a growth of 14.8% YOY, 9.4% YOY and 1.1% YOY, respectively, while the non-cigarette FMCG business grew by robust ~27% YOY. Earnings for the quarter grew by a robust 21.5% YOY to `1,514 crore (`1,247 crore), marginally above our estimates. The company has been successful in reducing its losses in the non-cigarette FMCG business — loss during 2QFY2012 stood at ~`56 crore (`67 crore).
Angel Broking post 2QFY2012 valuations maintain the revenue and earnings estimates. It expects ITC to report a topline of `24,706 crore in FY2012E and `29,294 crore in FY2013E, registering a CAGR of ~17% over FY2011-13E. The growth would be driven by the company’s diversified business model and ability to invest in growing businesses. In terms of earnings, it expects the company to report a 17.4% CAGR over the same period, backed by good performance by all businesses.Cigarette ITC’s cigarette division registered a 21.5% YOY growth in gross revenue (16.4% YOY growth in net revenue) on the back of higher volume growth as well as price hikes taken in cigarettes (took a price hike of ~10% in 2QFY2012 in its Navy Cut and Classic brands). On the margin front, the cigarette division’s EBIT margin registered a 74bp contraction on a gross level (107bp expansion on
Building on the notion that development in its truest sense can only take place when economic growth fosters social equity, ITC has been setting inspirational benchmarks for many. Sustaining its position in the Top 500 Manufacturing – Listing & Analysis, the company further plans to build on its two pillars — Green GDP and Inclusive Growth.
IBUILDING ON GREEN GDP & INCLUSIVE GROWTH
ITC
64 SEARCH - THE INDUSTRIAL SOURCEBOOK | J A N U A R Y 2 0 1 2
ANALYSING THE TOP 14 - ITC
Net turnover at `21,167.58 crore grew by 16.6% primarily driven by a 23.1% growth in the non-cigarette FMCG businesses, 22.9% growth in agribusiness and 17.6% growth in the hotels segment.
FACT
FACT
FACT
Gross Turnover`30,604.39 crore
PAT`4,987.61 crore
net level), aided by price hikes. The cigarette business is poised for double-digit growth in terms of revenue and EBIT in FY2012E.Non-cigarette FMCG ITC’s non-cigarette FMCG business registered a steady revenue growth of 27.2% YOY at net level to `1,341 crore (`1,056 crore), driven by an impressive performance from all product categories. Also, losses of the business reduced to `56 crore (`67 crore). Going ahead, it expects revenue traction in the segment to continue and losses to reduce, though breakeven is likely to be achieved only in FY2013.Hotels businessITC’s hotels business at net level registered a flat growth of 1.1% YOY to `211 crore (`209 crore) during the quarter due to a weak global economic scenario and slowdown in the Indian economy. The business segment reported an EBIT margin of 20.6% (expansion of 149bp YOY),
driving modest 9% YOY growth in EBIT. The hotels
business is well on track to post a 21% CAGR in revenue during FY2011-13E, aided by low base and uptick in the economic activity. Moreover, the margin of the business is likely to register significant improvement as ARR recovers.Paperboard and packaging The paperboard and packaging business registered a strong revenue growth of 9.4% YOY (10% on a net level) to `1,055 crore (`960 crore). However, the EBIT margin of the
segment registered an impressive expansion of 185bp YOY to 27.5%, driven by a combination of better product mix and higher realisation.Agribusiness ITC’s agribusiness registered a 14.8% YOY growth in revenue to `1,435 crore (`1,205 crore). The business segment reported a flat EBIT margin of 16.6%, aiding 18% YOY growth in EBIT.
THE CO-CREATION OF SOCIETAL VALUE As per Sharekhan estimates, ITC’s cigarette business, which contributes around 60%, continues to be a cash cow for the company. The company endeavours to make a mark in the Indian FMCG market and with successful brands such as Bingo,
Sunfeast and Aashirwaad, ITC is already in the
reckoning among the best in the industry. With its
new portfolio of personal care products gaining market share,
its FMCG business promises to compete with the likes of Hindustan
Unilever and Procter & Gamble.After a sharp increase of 16%
in Union Budget FY2010-11, the government has spared cigarettes from an excise duty hike in the FY2012 budget. Also, key states including Kerala, Karnataka, Andhra Pradesh and Maharashtra have kept VAT on cigarettes unchanged in their respective state budgets. ITC’s cigarette sales volumes are expected to grow at mid single digits in FY2012. ITC’s other businesses, such as hotel, agri, non-cigarette FMCG business and paper, paperboard & packaging, are showing a strong up-move and will provide a cushion to the overall profit in FY2012.
An increase in taxation and the government’s intention to curb the consumption of tobacco products remain the key risks to ITC’s cigarette
business over the longer term. The analysts at Sharekhan expect ITC’s bottom line to grow at a CAGR of about 21.2% over FY2011-13.
Angel Broking analysts expect ITC to report a topline of `24,706 crore in FY2012E and `29,294 crore in FY2013E, registering a CAGR of ~17% over FY2011-13E. The growth would be driven by the company’s diversified business model and ability to invest in growing businesses. In terms of earnings, the company is expected to report a 17.4% CAGR over the same period, backed by good performance by all businesses.
A strong rural connect, which has earned the trust of millions of farmers, a spirit of innovation and a focus on game changing R&D, sharpen ITC’s competitive strengths as it moves into the future. In addition, unique strengths in trade marketing and distribution, world-class manufacturing, superior service delivery, together with a rich experience in branding and deep consumer insights add enduring vitality to the company.
YC Deveshwar, Chairman, ITC, has put it perfectly, “It is my belief that innovative energies of business can also be much better harnessed to deliver meaningful solutions in co-creating societal value. Incentivising outcomes, therefore, is the key to drive business innovation and managerial capacity for societal value creation. It is my strong belief that, going forward, the company’s relentless endeavour to create new benchmarks in sustainable business practices will lend it a unique source of competitive advantage in an increasingly challenging socio-economic environment.”
Information sourced by Prerna Sharma

SEA
RC
H
Vol
-III
- J
an 2
012
Ad
Nam
e: F
lir s
yste
m
Pg
No.
65
SEARCH Vol-III - Jan 2012 Ad Name: Flir system Pg No. 65

SEA
RC
H V
ol-III - Jan 2012 Ad N
ame: E
ssen Deinki Pg N
o. 66
SEARCH Vol-III - Jan 2012 Ad Name: Essen Deinki Pg No. 66

J A N U A R Y 2 0 1 2 | SEARCH - THE INDUSTRIAL SOURCEBOOK 67
upported by its strong distinct product offerings in both commercial vehicle (CV) as well as passenger vehicle (PV)
ranges, Tata Motors Limited recorded a turnover of `52,136 crore — a growth of 35.9% over the previous year. The lower EBITDA of 9.9% as compared to 11.7%, the previous year has been registered owing to an increase in raw material cost and fixed marketing expenses. The Profit Before Tax and Profit After Tax for 2010-11 was ̀ 2,197 crore and `1,812 crore, respectively, as compared to `2,830 crore and `2,240 crore in the previous year. Jaguar Land Rover (JLR) has shown tremendous results in 2010-11, both in terms of volumes and revenue, better product mix, favourable exchange rates and higher margins. The company strives to be at the forefront of innovation and works to launch products aimed at the emerging needs of its customers. It continues to develop and build on its in-house capabilities and works with the right partners to ensure that it has competitive product offerings.
As the global markets recovered coupled with a strong focus on product and market initiatives, particularly at JLR, the Tata Motors Group turnover in 2010-11 grew by 33.1% to `1,23,133 crore. Tata Motors Group recorded its highest-ever Consolidated Profit Before Tax of `10,437 crore (`3,523 crore in 2009-10) and the Consolidated Profit for the Year of `9,274 crore (`2,571 crore in 2009-10).
The overall Tata Motors Group sales at 10,80,994 vehicles crossed the one-million-mark in 2010-11, higher by 24.2% as compared to the previous year. The global sales of all CVs were at 5,12,731 units, while the global sales of all PVs were at 5,68,263 units.
The company recorded a sale of 7,78,540 vehicles in 2010-11 — a growth of 22.8% over the previous year
in the Indian domestic market representing a 24.3% market share in the Indian industry. It exported 58,089 vehicles from India — a growth of 70.3% over the previous year.
It increased CV sales in the Indian market to an all-time high of 4,58,828 vehicles in 2010-11, representing a market share of 61.8%. A
strong product portfolio, improved reach and penetration in the market and focus on customer-oriented initiatives including finance enablement, ensured a 22.7% growth in CV sales. Some of the key highlights were: The company crossed the 4 million
cumulative vehicle sales mark for its CVs.
The company continued to focus on customer-centric initiatives, improved the sales of the Prima, and launched product variants to strengthen its product offerings. The company introduced its CNG Hybrid City Bus range and showcased it at the Commonwealth Games in Delhi. The company’s sales of passenger
vehicles in the Indian market (inclusive of Tata, Fiat and JLR brands) were at its highest ever at 3,19,712 vehicles, representing a market share of 13% in 2010-11. Some of the key highlights were: The company crossed the 2 million
cumulative vehicle sales mark for its PVs.
In June 2010, the Sanand plant for the production of the Nano was inaugurated. The company completed delivery on the bookings of the Nano and opened sales in various states in a phased manner.
Nano sales increased to 70,431 vehicles — a growth of 129% from 30,763 vehicles in the previous year. The company focussed on increasing the reach and penetration for the Nano and also financing enablement for potential customer segments. The Nano bagged the gold prize in the Best New Product segment u n d e r t h e
Keeping up with the innovation culture, Tata Motors Limited launched many new variants in the market not only in India, but also overseas. Catering to a whole host of customers from entry-level to commercial vehicles, the company has been able to deliver to its customers’ expectations. Standing tall on the fi fth position in the Top 500 Manufacturing Companies, the company is all set to expand its portfolio with product innovation & customer satisfaction.
SCAPITALISING ON PRODUCT INNOVATION
Tata Motors
27,7
15
29,2
23
26,5
56
37,4
47
48,2
24
6.9 6.9
3.8
6.0
3.8
12.8 11.7
10.1
15.1
10.3
4,34
9
4,35
5
2,93
8
2,77
1
4,09
6
(` in
Cro
re)
Turnover, EBIDTA And PAT As A Percent Of Turnover
Net IncomeExcise DutyEBIDTA MarginPAT As A Percent of Turnover
(In P
erce
ntag
e)

68 SEARCH - THE INDUSTRIAL SOURCEBOOK | J A N U A R Y 2 0 1 2
ANALYSING THE TOP 14 - TATA MOTORS
374
459
260
320
58
668
837
22.7
%
23%
70.3
%
25.2
%
34
Volume Growth
CV
Dom
estic
PV
Dom
estic
Expo
rtTo
tal
(Number in thousands)
FY10 FY11
Turnover`1,23,133 crore
Profi t Before Tax`10,437 crore
transportation category at the 2010 Edison Award, symbolising persistence and excellence personified as also the world’s oldest and coveted international award for ‘Good Design’ in 2010 conferred by the Chicago Athenaeum: Museum of Architecture and Design together with the European Centre for Architecture Art Design and Urban Studies in the category of transportation.
The company continues to keenly focus on international markets and expects to launch its new product range in many of these markets. An assembly plant in South Africa is being set up and is expected to start production next year.
Q2 PERFORMANCETata Motors Limited reported quarterly numbers, which were a mixed bag as the domestic business dragged, while JLR clocked strong volumes and a good margin performance. The consolidated topline registered ~35,939 crore (up 25.8% YOY) as JLR’s topline grew to ~£2929 million (up 30.3% YOY) and standalone business grew to ~12,954 crore (up 15.2% YOY). The consolidated EBITDA margin stood at 13.4%. As per ICICI Direct research analysts, the domestic CV segment has weathered the rough H1 with beyond expectations volume growth in the MHCV and LCV segments of ~8% & 29% YTD, respectively. The negative remained on the domestic compact car segment and entry level Sedan segment, which has seen strongest buyer sentiment dent with Tata Motors Limited witnessing
~18% YTD decline. On JLR, volumes have gone up 23.3% YOY at 68,000 units with ASPs rising ~5.7% YOY, with favourable geography mix led by China.
PREVAILING RISKSThe company has to wither the impact of
hardening interest rates and other inflationary trends as hardening of consumer interest rates could have an adverse impact on the automotive industry, mainly in terms of interest cost on automotive loans. Inflation could also have a negative impact on growth and consequently, on automobile sales in the domestic market.
Notwithstanding is the fuel price hike. The Kirit Parikh Committee recommendations that the retail prices of petrol and diesel to be market determined and that an additional excise duty of `80,000 per car to be levied on diesel cars if implemented, could adversely impact demand. Increase in raw material cost has been putting pressures on the input costs of the company.
To counter the threat of growing global competition, the company continues to intensify its drive to improve quality and product offering, while maintaining its low-cost product development/sourcing advantage.
New project execution holds the key for the company’s growth going forward. Timely introduction of new products, their acceptance in the marketplace and managing the complexity of operations across various manufacturing locations, would be the key to sustain competitiveness. It also needs to strengthen its supply chain and distribution network.
Taking a cue from the recent strike by Maruti Suzuki workforce, labour unrest has been one of the biggest
issues for the corporate world. Tata Motors Limited needs to maintain a healthy balance between the two i.e., to get the best productivity & quick time to market with the workforce satisfied and empowered.
EXPANDING BOUNDARIESGoing forward, the company would continue to focus on retaining its advantage of market reach and penetration. In order to ensure that, it has plans to introduce new products, variants and fuel-efficient products. These will offer superior value to customers and improve the company’s market position. Aggressively pursuing opportunities in the international markets as a part
of its internationalisation drive,
including evaluation of possible overseas manufacturing, will offer a bigger growth avenue for the company. JLR is expected to turn aggressive and launch newer models to enrich its product mix further (Range Rover Evoque, 12 MY JLR models). The management is also increasingly focussed on the growing Chinese market where volumes have touched ~20,405 units in H1 and expects to clock ~40,000 units in FY12E. Seconding these thoughts, ICICI Direct research analysts remain positive on the long-term structural nature of Tata Motors Limited’s business and find great value in the brands and the franchises.
Information sourced by Prerna Sharma

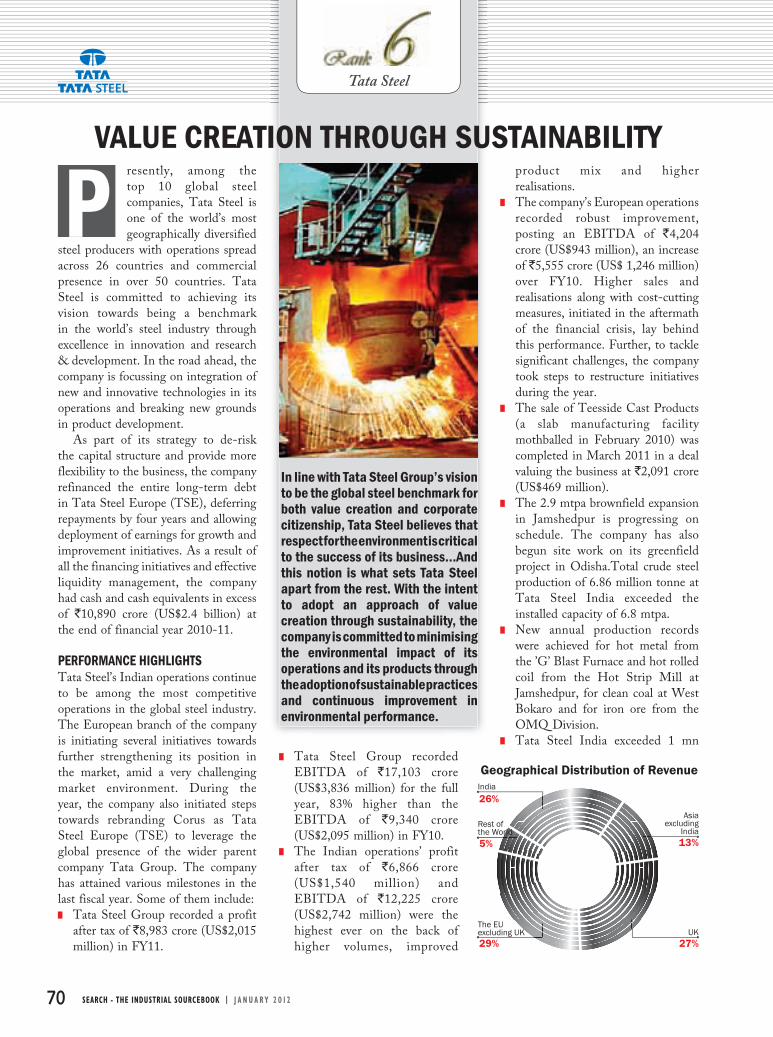
70 SEARCH - THE INDUSTRIAL SOURCEBOOK | J A N U A R Y 2 0 1 2
resently, among the top 10 global steel companies, Tata Steel is one of the world’s most geographically diversified
steel producers with operations spread across 26 countries and commercial presence in over 50 countries. Tata Steel is committed to achieving its vision towards being a benchmark in the world’s steel industry through excellence in innovation and research & development. In the road ahead, the company is focussing on integration of new and innovative technologies in its operations and breaking new grounds in product development.
As part of its strategy to de-risk the capital structure and provide more flexibility to the business, the company refinanced the entire long-term debt in Tata Steel Europe (TSE), deferring repayments by four years and allowing deployment of earnings for growth and improvement initiatives. As a result of all the financing initiatives and effective liquidity management, the company had cash and cash equivalents in excess of `10,890 crore (US$2.4 billion) at the end of financial year 2010-11.
PERFORMANCE HIGHLIGHTS Tata Steel’s Indian operations continue to be among the most competitive operations in the global steel industry. The European branch of the company is initiating several initiatives towards further strengthening its position in the market, amid a very challenging market environment. During the year, the company also initiated steps towards rebranding Corus as Tata Steel Europe (TSE) to leverage the global presence of the wider parent company Tata Group. The company has attained various milestones in the last fiscal year. Some of them include: Tata Steel Group recorded a profit
after tax of `8,983 crore (US$2,015 million) in FY11.
Tata Steel Group recorded EBITDA of `17,103 crore (US$3,836 million) for the full year, 83% higher than the EBITDA of `9,340 crore (US$2,095 million) in FY10.
The Indian operations’ profit after tax of `6,866 crore (US$1,540 million) and EBITDA of `12,225 crore (US$2,742 million) were the highest ever on the back of higher volumes, improved
product mix and higher realisations.
The company’s European operations recorded robust improvement, posting an EBITDA of `4,204 crore (US$943 million), an increase of `5,555 crore (US$ 1,246 million) over FY10. Higher sales and realisations along with cost-cutting measures, initiated in the aftermath of the financial crisis, lay behind this performance. Further, to tackle significant challenges, the company took steps to restructure initiatives during the year.
The sale of Teesside Cast Products (a slab manufacturing facility mothballed in February 2010) was completed in March 2011 in a deal valuing the business at `2,091 crore (US$469 million).
The 2.9 mtpa brownfield expansion in Jamshedpur is progressing on schedule. The company has also begun site work on its greenfield project in Odisha.Total crude steel production of 6.86 million tonne at Tata Steel India exceeded the installed capacity of 6.8 mtpa.
New annual production records were achieved for hot metal from the ’G’ Blast Furnace and hot rolled coil from the Hot Strip Mill at Jamshedpur, for clean coal at West Bokaro and for iron ore from the OMQ Division.
Tata Steel India exceeded 1 mn
In line with Tata Steel Group’s vision to be the global steel benchmark for both value creation and corporate citizenship, Tata Steel believes that respect for the environment is critical to the success of its business…And this notion is what sets Tata Steel apart from the rest. With the intent to adopt an approach of value creation through sustainability, the company is committed to minimising the environmental impact of its operations and its products through the adoption of sustainable practices and continuous improvement in environmental performance.
PVALUE CREATION THROUGH SUSTAINABILITY
Tata Steel
26%
Geographical Distribution of RevenueIndia
Rest of the World
The EU excluding UK
Asia excluding
India
UK
5%
29% 27%
13%
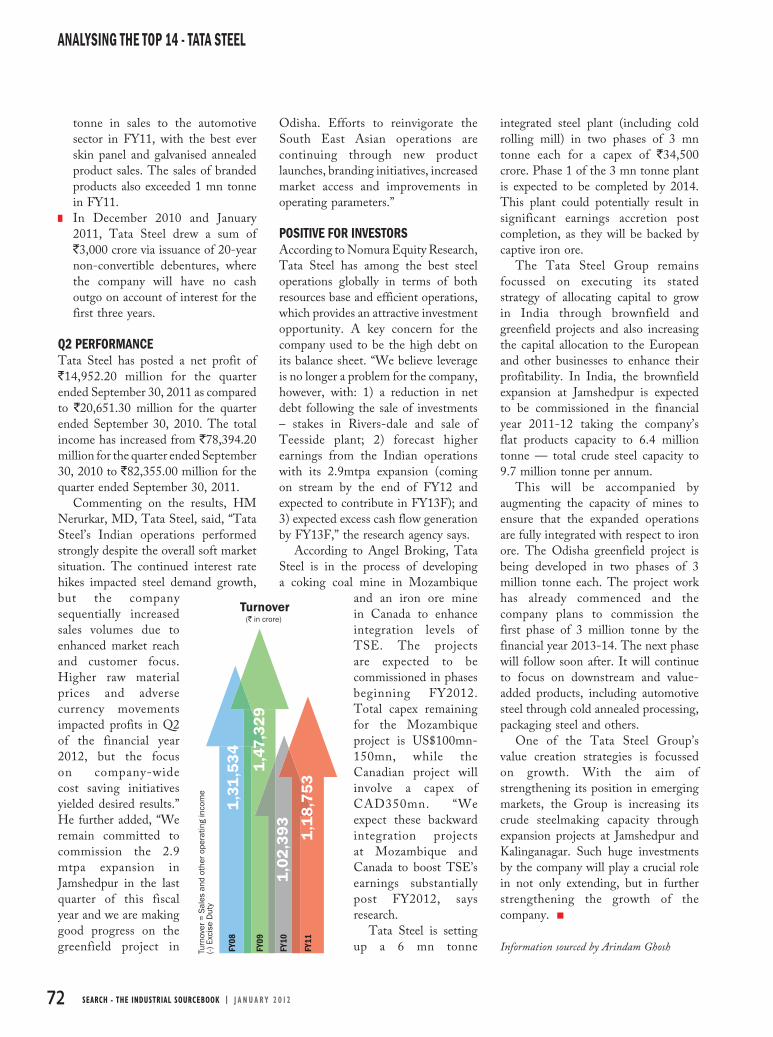
72 SEARCH - THE INDUSTRIAL SOURCEBOOK | J A N U A R Y 2 0 1 2
ANALYSING THE TOP 14 - TATA STEEL
Turnover
1,3
1,5
34 1,4
7,32
91
,02,
393
1,1
8,75
3
(` in crore)
Turn
over
= S
ales
and
oth
er o
pera
ting
inco
me
(-) E
xcis
e D
uty
FY08
FY09
FY10
FY11
tonne in sales to the automotive sector in FY11, with the best ever skin panel and galvanised annealed product sales. The sales of branded products also exceeded 1 mn tonne in FY11.
In December 2010 and January 2011, Tata Steel drew a sum of `3,000 crore via issuance of 20-year non-convertible debentures, where the company will have no cash outgo on account of interest for the first three years.
Q2 PERFORMANCE Tata Steel has posted a net profit of `14,952.20 million for the quarter ended September 30, 2011 as compared to `20,651.30 million for the quarter ended September 30, 2010. The total income has increased from `78,394.20 million for the quarter ended September 30, 2010 to `82,355.00 million for the quarter ended September 30, 2011.
Commenting on the results, HM Nerurkar, MD, Tata Steel, said, “Tata Steel’s Indian operations performed strongly despite the overall soft market situation. The continued interest rate hikes impacted steel demand growth, but the company sequentially increased sales volumes due to enhanced market reach and customer focus. Higher raw material prices and adverse currency movements impacted profits in Q2 of the financial year 2012, but the focus on company-wide cost saving initiatives yielded desired results.” He further added, “We remain committed to commission the 2.9 mtpa expansion in Jamshedpur in the last quarter of this fiscal year and we are making good progress on the greenfield project in
Odisha. Efforts to reinvigorate the South East Asian operations are continuing through new product launches, branding initiatives, increased market access and improvements in operating parameters.”
POSITIVE FOR INVESTORSAccording to Nomura Equity Research, Tata Steel has among the best steel operations globally in terms of both resources base and efficient operations, which provides an attractive investment opportunity. A key concern for the company used to be the high debt on its balance sheet. “We believe leverage is no longer a problem for the company, however, with: 1) a reduction in net debt following the sale of investments – stakes in Rivers-dale and sale of Teesside plant; 2) forecast higher earnings from the Indian operations with its 2.9mtpa expansion (coming on stream by the end of FY12 and expected to contribute in FY13F); and 3) expected excess cash flow generation by FY13F,” the research agency says.
According to Angel Broking, Tata Steel is in the process of developing a coking coal mine in Mozambique
and an iron ore mine in Canada to enhance integration levels of TSE. The projects are expected to be commissioned in phases beginning FY2012. Total capex remaining for the Mozambique project is US$100mn-150mn, while the Canadian project will involve a capex of CAD350mn. “We expect these backward integration projects at Mozambique and Canada to boost TSE’s earnings substantially post FY2012, says research.
Tata Steel is setting up a 6 mn tonne
integrated steel plant (including cold rolling mill) in two phases of 3 mn tonne each for a capex of `34,500 crore. Phase 1 of the 3 mn tonne plant is expected to be completed by 2014. This plant could potentially result in significant earnings accretion post completion, as they will be backed by captive iron ore.
The Tata Steel Group remains focussed on executing its stated strategy of allocating capital to grow in India through brownfield and greenfield projects and also increasing the capital allocation to the European and other businesses to enhance their profitability. In India, the brownfield expansion at Jamshedpur is expected to be commissioned in the financial year 2011-12 taking the company’s flat products capacity to 6.4 million tonne — total crude steel capacity to 9.7 million tonne per annum.
This will be accompanied by augmenting the capacity of mines to ensure that the expanded operations are fully integrated with respect to iron ore. The Odisha greenfield project is being developed in two phases of 3 million tonne each. The project work has already commenced and the company plans to commission the first phase of 3 million tonne by the financial year 2013-14. The next phase will follow soon after. It will continue to focus on downstream and value-added products, including automotive steel through cold annealed processing, packaging steel and others.
One of the Tata Steel Group’s value creation strategies is focussed on growth. With the aim of strengthening its position in emerging markets, the Group is increasing its crude steelmaking capacity through expansion projects at Jamshedpur and Kalinganagar. Such huge investments by the company will play a crucial role in not only extending, but in further strengthening the growth of the company.
Information sourced by Arindam Ghosh

74 SEARCH - THE INDUSTRIAL SOURCEBOOK | J A N U A R Y 2 0 1 2
HEL has grown in stature over the years with continued inflow of orders, manufacturing prowess and a continued
thrust on technology leading to a strong presence in domestic and international markets as a major supplier of power plant equipment besides establishing substantial inroads in select segment of products in the industrial sector and Railways. During 2010-11, the company witnessed growth in turnover by 26.89% to `43,337 crore from `34,154 crore in the previous year. The turnover (net of excise duty) increased by 26.49% from `32,861 crore in 2009-10 to `41,566 crore in 2010-11. Profit before Tax for 2010-11 is placed at `9,006 crore as against `6,591 crore during 2009-10 — a growth of 36.64% as compared to the previous year. The Profit After Tax is placed at `6,011 crore as against `4,311 crore during 2009-10 — a growth of 39.43% over previous year. Increase in turnover coupled with savings in material cost over the previous year has contributed to the better financial performance during the year.
BHEL had many accomplishments in various business areas. Some of them are: In spite of difficult market
conditions, BHEL booked orders of 7 Boilers and 9 Turbine-Generators with supercritical parameters from public as well as private sector utilities
The order of the first 700 MW Nuclear TG (2 sets) for KAPP 3, 4 from NPCIL in consortium with Alstom, new rating introduced
Export orders from 24 countries across five continents.
Q2 PERFORMANCE BHEL’s revenue for 2QFY12 grew 24% YOY to `103b, driven by strong execution. Adjusted EBITDA margin
was 17%, down 260 bps YOY. The EBITDA margin declined mainly due to higher provisions on account of contractual obligations and liquidated damages. Reported PAT of `14.1b was positively impacted by `1,660m (pre-tax) change in accounting policy related to provision of leave encashment.
As per Motilal Oswal research estimates, growth in the power segment revenue was muted during 2QFY12 — up 11% YOY to `78b. The industry segment posted strong growth – up
78% YOY to `30b – as a number of projects are reaching advanced stages of revenue recognition. Power division contributed 72% to total revenue and the industry division contributed 28%.
BHEL booked new orders worth `143b in 2QFY12, up 6% YOY, driven by strong order inflow in the Industry segment (up 134% YOY to `51b). The power segment orders declined 18% YOY to `135b due to industry-wide slowdown. Adjusted EBITDA margin declined 260 bps YOY, led by the power segment. The EBITDA margin was impacted by a sharp rise in other expenditure (up 78% YOY at 10.6% of sales), which, in turn, was driven by much higher provisions. Change in accounting policy, which resulted in lower staff cost during the quarter, however, boosted EBITDA by `1.66b, a part of which is recurring in nature. In the light of growing concerns on the power segment, analysts at Motilal Oswal have lowered order intake estimates by 11% for FY12 and by 15% for FY13. They expect the order intake to decline by 3% in FY12 and to register a marginal growth of 3% in FY13.
The company is well on track to expand capacity to 20GW per annum by the end of FY12. Analysts believe that with expanded capacity, BHEL will be able to grow production at an accelerated pace in FY13-14.
The company maintained that execution on all power projects is on track, which will help boost the power
Established more than 40 years ago, BHEL is the largest engineering and manufacturing enterprise of India in the energy & infrastructure-related sectors. It is among the world’s rarest few who have the capability to manufacture an entire range of power plant equipment. Standing tall on such strong pillars, BHEL has been demonstrating robust performance in terms of growth, performance and profi tability. With overfl owing order books for the current year, the company is slated to post yet another record performance in the near term.
BOF ENVIOUS ORDER BOOKS & POTENTIAL PROFITS
Bharat Heavy Electricals Ltd
2006-07
2007-08
2008-09
2008-10
2010-11
35643
50270
59678 5903760507
Orders secured (` in crore)
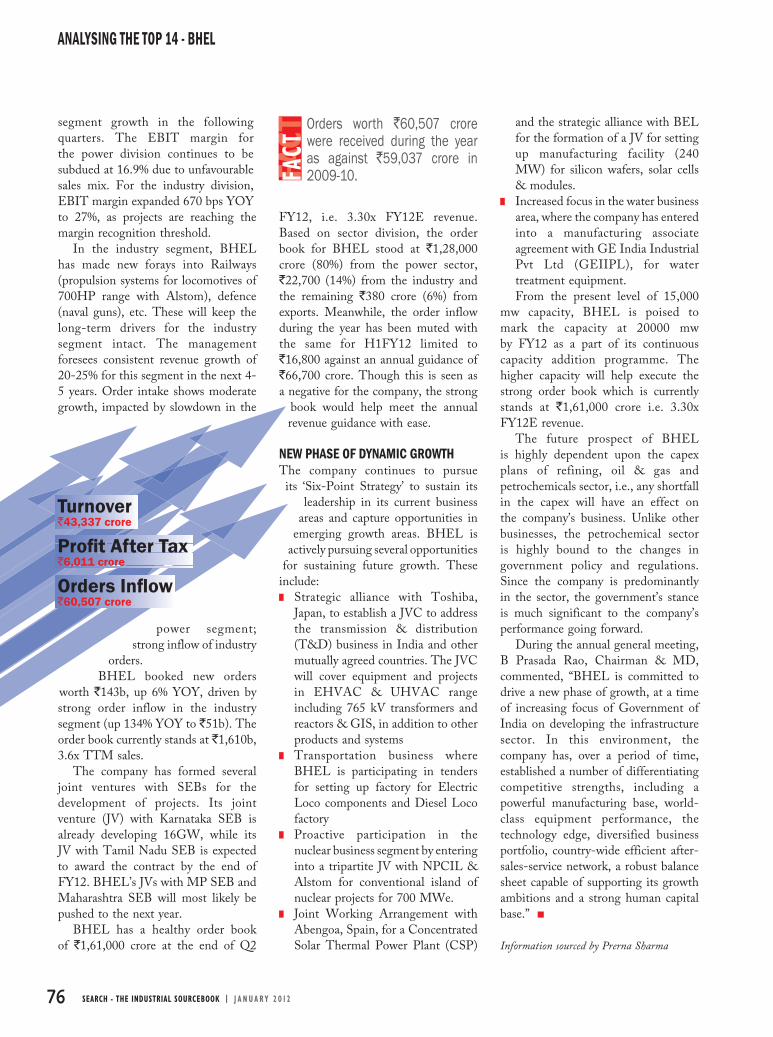
76 SEARCH - THE INDUSTRIAL SOURCEBOOK | J A N U A R Y 2 0 1 2
ANALYSING THE TOP 14 - BHEL
Orders worth `60,507 crore were received during the year as against `59,037 crore in 2009-10.FA
CTFA
CTFA
CT
Turnover`43,337 crore
Profi t After Tax`6,011 crore
Orders Infl ow`60,507 crore
segment growth in the following quarters. The EBIT margin for the power division continues to be subdued at 16.9% due to unfavourable sales mix. For the industry division, EBIT margin expanded 670 bps YOY to 27%, as projects are reaching the margin recognition threshold.
In the industry segment, BHEL has made new forays into Railways (propulsion systems for locomotives of 700HP range with Alstom), defence (naval guns), etc. These will keep the long-term drivers for the industry segment intact. The management foresees consistent revenue growth of 20-25% for this segment in the next 4-5 years. Order intake shows moderate growth, impacted by slowdown in the
power segment; strong inflow of industry
orders.BHEL booked new orders
worth `143b, up 6% YOY, driven by strong order inflow in the industry segment (up 134% YOY to `51b). The order book currently stands at `1,610b, 3.6x TTM sales.
The company has formed several joint ventures with SEBs for the development of projects. Its joint venture (JV) with Karnataka SEB is already developing 16GW, while its JV with Tamil Nadu SEB is expected to award the contract by the end of FY12. BHEL’s JVs with MP SEB and Maharashtra SEB will most likely be pushed to the next year.
BHEL has a healthy order book of `1,61,000 crore at the end of Q2
FY12, i.e. 3.30x FY12E revenue. Based on sector division, the order book for BHEL stood at `1,28,000 crore (80%) from the power sector, `22,700 (14%) from the industry and the remaining `380 crore (6%) from exports. Meanwhile, the order inflow during the year has been muted with the same for H1FY12 limited to `16,800 against an annual guidance of `66,700 crore. Though this is seen as a negative for the company, the strong
book would help meet the annual revenue guidance with ease.
NEW PHASE OF DYNAMIC GROWTHThe company continues to pursue its ‘Six-Point Strategy’ to sustain its
leadership in its current business areas and capture opportunities in
emerging growth areas. BHEL is actively pursuing several opportunities
for sustaining future growth. These include: Strategic alliance with Toshiba,
Japan, to establish a JVC to address the transmission & distribution (T&D) business in India and other mutually agreed countries. The JVC will cover equipment and projects in EHVAC & UHVAC range including 765 kV transformers and reactors & GIS, in addition to other products and systems
Transportation business where BHEL is participating in tenders for setting up factory for Electric Loco components and Diesel Loco factory
Proactive participation in the nuclear business segment by entering into a tripartite JV with NPCIL & Alstom for conventional island of nuclear projects for 700 MWe.
Joint Working Arrangement with Abengoa, Spain, for a Concentrated Solar Thermal Power Plant (CSP)
and the strategic alliance with BEL for the formation of a JV for setting up manufacturing facility (240 MW) for silicon wafers, solar cells & modules.
Increased focus in the water business area, where the company has entered into a manufacturing associate agreement with GE India Industrial Pvt Ltd (GEIIPL), for water treatment equipment.From the present level of 15,000
mw capacity, BHEL is poised to mark the capacity at 20000 mw by FY12 as a part of its continuous capacity addition programme. The higher capacity will help execute the strong order book which is currently stands at `1,61,000 crore i.e. 3.30x FY12E revenue.
The future prospect of BHEL is highly dependent upon the capex plans of refining, oil & gas and petrochemicals sector, i.e., any shortfall in the capex will have an effect on the company’s business. Unlike other businesses, the petrochemical sector is highly bound to the changes in government policy and regulations. Since the company is predominantly in the sector, the government’s stance is much significant to the company’s performance going forward.
During the annual general meeting, B Prasada Rao, Chairman & MD, commented, “BHEL is committed to drive a new phase of growth, at a time of increasing focus of Government of India on developing the infrastructure sector. In this environment, the company has, over a period of time, established a number of differentiating competitive strengths, including a powerful manufacturing base, world-class equipment performance, the technology edge, diversified business portfolio, country-wide efficient after-sales-service network, a robust balance sheet capable of supporting its growth ambitions and a strong human capital base.”
Information sourced by Prerna Sharma

78 SEARCH - THE INDUSTRIAL SOURCEBOOK | J A N U A R Y 2 0 1 2
Fortune 500 company, Bharat Petroleum Corporation Limited (BPCL) has interests in oil refining and
marketing of petroleum products. It is the third largest refining company in India with a capacity of 12 mmtpa at its Mumbai facility and 7.5 mmtpa at Kochi. BPCL has majority stake (63%) in Numaligarh Refineries, a 3 mmtpa refinery in the northeast. BPCL has investments in IGL (22.5%) and Petronet LNG (12.5%). BPCL is a public sector firm in which the Government of India holds 54.93%.
The aggregate refinery throughput at BPCL’s refineries at Mumbai and Kochi and that of its subsidiary company, Numaligarh Refinery Limited (NRL) in 2010-11 was 24.03 Million Metric Tonne (MMT) as compared to 23.03 MMT in 2009-10. The market sales volume of the BPCL Group for 2010-11 stood at 29.58 MMT, as compared to 28.25 MMT in the previous year. The Group also exported 2.61 MMT of petroleum products during the year as against 2.51 MMT in 2009-10.
During 2010-11, the BPCL Group achieved a sales turnover of `1,66,038.80 crore as compared to `1,33,749.10 crore recorded in 2009-10. The profit after tax for the year stood at `1,742.06 crore as against `1,719.98 crore in 2009-10.
Among the key developments during the year was the announcement of five oil & gas discoveries in Mozambique, Brazil and Indonesia from exploration blocks where BPCL’s wholly owned subsidiary company, Bharat PetroResources Limited, has participating interest. This augurs well for the future in terms of oil & gas equity for the company once production starts in these blocks.
The year also saw the commissioning of the 6 Million Metric Tonne
(MMTPA) per annum grassroots refinery in Bina, Madhya Pradesh, which was set up by Bharat Oman Refineries Limited (BORL). BORL is a company promoted by BPCL and in which Oman Oil Company and the Madhya Pradesh Government are partners. Once all the units stabilise, the refinery would go a long way in meeting the product requirements of BPCL in central and northern parts of the country. The Kochi refinery also commissioned the capacity expansion and modernisation project, which saw the refinery’s processing capacity increase from 7.5 MMTPA
to 9.5 MMTPA.
Q2FY12As per ICICI Direct research, BPCL declared its Q2FY12 results with revenues of `42,301.9 crore, EBITDA loss of `2,694.8 crore and net loss of `3,229.3 crore. The results are below the estimates mainly on account of higher net under-recoveries, forex losses of ~`800 crore and low refining margins. The downstream companies shared a net subsidy burden of 66.67% in Q2FY12. The GRM decreased to $1.6/barrel in Q2FY12 compared to $2.8/barrel in Q2FY11 mainly on account of custom duty reduction in June end. Brent crude oil prices estimates of US$100/barrel, have been maintained going forward. The gross under-recoveries are expected at ~`1,10,950 crore and ~`83,500 crore in FY12E and FY13E, respectively. Analysts assume net under-recoveries for downstream companies at 8.8% in FY12E and FY13E.
The crude oil throughput remained
BPCL remains committed towards strengthening its core business of refi ning and marketing of petroleum products. Towards this end, major plans have been drawn up for enhancing the port and distribution infrastructure and setting up of new retails outlets, particularly in the rural markets. With the intent to facilitate timely completion of projects at the right cost, BPCL is well on its way to secure India’s future energy needs.
ASECURING INDIA’S FUTURE ENERGY NEEDS
Bharat Petroleum Corporation Ltd
Market Sales Volume(Million Metric Tonne)
2010-11 2009-10 2008-09 2007-08 2006-07
3.56
1.13
5.62
0.28
18.6
8
17.2
20.
236.
280.
923.
24
3.03
0.92
6.84
0.20
16.1
6
14.7
50.
236.
920.
962.
93
2.73
0.88
6.70
0.13
13.0
1
29.2
7
27.8
9
27.1
6
25.7
9
23.4
5
LPG Aviation Direct Lubes Retail
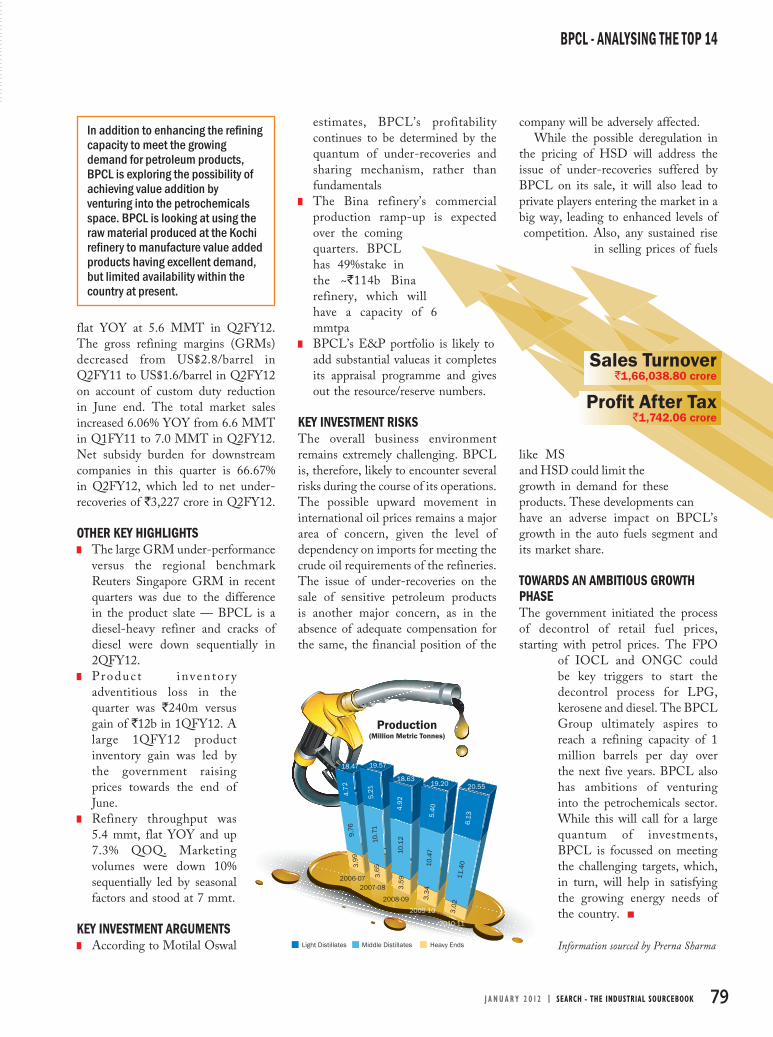
J A N U A R Y 2 0 1 2 | SEARCH - THE INDUSTRIAL SOURCEBOOK 79
BPCL - ANALYSING THE TOP 14
Sales Turnover`1,66,038.80 crore
Profi t After Tax`1,742.06 crore
18.47 19.57
18.6319.20 20.55
4.72
5.2
1
4.9
2
5.4
0
6.1
3
9.7
63
.99
10.7
13
.65
10.1
23
.59
10.4
73
.34
11.4
03.
02
2006-072007-08
Light Distillates Middle Distillates Heavy Ends
Production(Million Metric Tonnes)
2008-09
2009-10
2010-11
In addition to enhancing the refi ning capacity to meet the growing demand for petroleum products, BPCL is exploring the possibility of achieving value addition by venturing into the petrochemicals space. BPCL is looking at using the raw material produced at the Kochi refi nery to manufacture value added products having excellent demand, but limited availability within the country at present.
flat YOY at 5.6 MMT in Q2FY12. The gross refining margins (GRMs) decreased from US$2.8/barrel in Q2FY11 to US$1.6/barrel in Q2FY12 on account of custom duty reduction in June end. The total market sales increased 6.06% YOY from 6.6 MMT in Q1FY11 to 7.0 MMT in Q2FY12. Net subsidy burden for downstream companies in this quarter is 66.67% in Q2FY12, which led to net under-recoveries of `3,227 crore in Q2FY12.
OTHER KEY HIGHLIGHTS The large GRM under-performance
versus the regional benchmark Reuters Singapore GRM in recent quarters was due to the difference in the product slate — BPCL is a diesel-heavy refiner and cracks of diesel were down sequentially in 2QFY12.
P roduc t invento ry adventitious loss in the quarter was `240m versus gain of `12b in 1QFY12. A large 1QFY12 product inventory gain was led by the government raising prices towards the end of June.
Refinery throughput was 5.4 mmt, flat YOY and up 7.3% QOQ. Marketing volumes were down 10% sequentially led by seasonal factors and stood at 7 mmt.
KEY INVESTMENT ARGUMENTS According to Motilal Oswal
estimates, BPCL’s profitability continues to be determined by the quantum of under-recoveries and sharing mechanism, rather than fundamentals
The Bina refinery’s commercial production ramp-up is expected over the coming quarters. BPCL has 49%stake in the ~`114b Bina refinery, which will have a capacity of 6 mmtpa
BPCL’s E&P portfolio is likely to add substantial valueas it completes its appraisal programme and gives out the resource/reserve numbers.
KEY INVESTMENT RISKSThe overall business environment remains extremely challenging. BPCL is, therefore, likely to encounter several risks during the course of its operations. The possible upward movement in international oil prices remains a major area of concern, given the level of dependency on imports for meeting the crude oil requirements of the refineries. The issue of under-recoveries on the sale of sensitive petroleum products is another major concern, as in the absence of adequate compensation for the same, the financial position of the
company will be adversely affected.While the possible deregulation in
the pricing of HSD will address the issue of under-recoveries suffered by BPCL on its sale, it will also lead to private players entering the market in a big way, leading to enhanced levels of competition. Also, any sustained rise
in selling prices of fuels
like MS and HSD could limit the growth in demand for these products. These developments can have an adverse impact on BPCL’s growth in the auto fuels segment and its market share.
TOWARDS AN AMBITIOUS GROWTH PHASE The government initiated the process of decontrol of retail fuel prices, starting with petrol prices. The FPO
of IOCL and ONGC could be key triggers to start the decontrol process for LPG, kerosene and diesel. The BPCL Group ultimately aspires to reach a refining capacity of 1 million barrels per day over the next five years. BPCL also has ambitions of venturing into the petrochemicals sector. While this will call for a large quantum of investments, BPCL is focussed on meeting the challenging targets, which, in turn, will help in satisfying the growing energy needs of the country.
Information sourced by Prerna Sharma
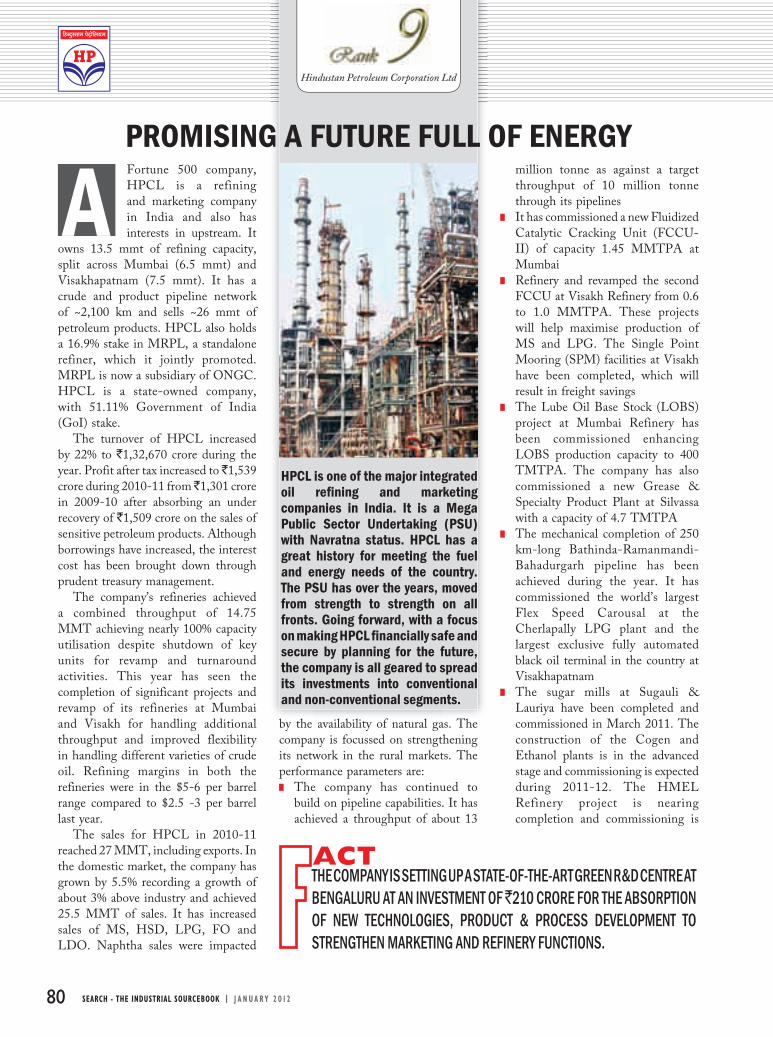
80 SEARCH - THE INDUSTRIAL SOURCEBOOK | J A N U A R Y 2 0 1 2
Fortune 500 company, HPCL is a refining and marketing company in India and also has interests in upstream. It
owns 13.5 mmt of refining capacity, split across Mumbai (6.5 mmt) and Visakhapatnam (7.5 mmt). It has a crude and product pipeline network of ~2,100 km and sells ~26 mmt of petroleum products. HPCL also holds a 16.9% stake in MRPL, a standalone refiner, which it jointly promoted. MRPL is now a subsidiary of ONGC. HPCL is a state-owned company, with 51.11% Government of India (GoI) stake.
The turnover of HPCL increased by 22% to `1,32,670 crore during the year. Profit after tax increased to ̀ 1,539 crore during 2010-11 from ̀ 1,301 crore in 2009-10 after absorbing an under recovery of `1,509 crore on the sales of sensitive petroleum products. Although borrowings have increased, the interest cost has been brought down through prudent treasury management.
The company’s refineries achieved a combined throughput of 14.75 MMT achieving nearly 100% capacity utilisation despite shutdown of key units for revamp and turnaround activities. This year has seen the completion of significant projects and revamp of its refineries at Mumbai and Visakh for handling additional throughput and improved flexibility in handling different varieties of crude oil. Refining margins in both the refineries were in the $5-6 per barrel range compared to $2.5 -3 per barrel last year.
The sales for HPCL in 2010-11 reached 27 MMT, including exports. In the domestic market, the company has grown by 5.5% recording a growth of about 3% above industry and achieved 25.5 MMT of sales. It has increased sales of MS, HSD, LPG, FO and LDO. Naphtha sales were impacted
by the availability of natural gas. The company is focussed on strengthening its network in the rural markets. The performance parameters are: The company has continued to
build on pipeline capabilities. It has achieved a throughput of about 13
million tonne as against a target throughput of 10 million tonne through its pipelines
It has commissioned a new Fluidized Catalytic Cracking Unit (FCCU-II) of capacity 1.45 MMTPA at Mumbai
Refinery and revamped the second FCCU at Visakh Refinery from 0.6 to 1.0 MMTPA. These projects will help maximise production of MS and LPG. The Single Point Mooring (SPM) facilities at Visakh have been completed, which will result in freight savings
The Lube Oil Base Stock (LOBS) project at Mumbai Refinery has been commissioned enhancing LOBS production capacity to 400 TMTPA. The company has also commissioned a new Grease & Specialty Product Plant at Silvassa with a capacity of 4.7 TMTPA
The mechanical completion of 250 km-long Bathinda-Ramanmandi-Bahadurgarh pipeline has been achieved during the year. It has commissioned the world’s largest Flex Speed Carousal at the Cherlapally LPG plant and the largest exclusive fully automated black oil terminal in the country at Visakhapatnam
The sugar mills at Sugauli & Lauriya have been completed and commissioned in March 2011. The construction of the Cogen and Ethanol plants is in the advanced stage and commissioning is expected during 2011-12. The HMEL Refinery project is nearing completion and commissioning is
HPCL is one of the major integrated oil refi ning and marketing companies in India. It is a Mega Public Sector Undertaking (PSU) with Navratna status. HPCL has a great history for meeting the fuel and energy needs of the country. The PSU has over the years, moved from strength to strength on all fronts. Going forward, with a focus on making HPCL fi nancially safe and secure by planning for the future, the company is all geared to spread its investments into conventional and non-conventional segments.
APROMISING A FUTURE FULL OF ENERGY
Hindustan Petroleum Corporation Ltd
THE COMPANY IS SETTING UP A STATE-OF-THE-ART GREEN R&D CENTRE AT BENGALURU AT AN INVESTMENT OF `210 CRORE FOR THE ABSORPTION OF NEW TECHNOLOGIES, PRODUCT & PROCESS DEVELOPMENT TO STRENGTHEN MARKETING AND REFINERY FUNCTIONS.
ACT

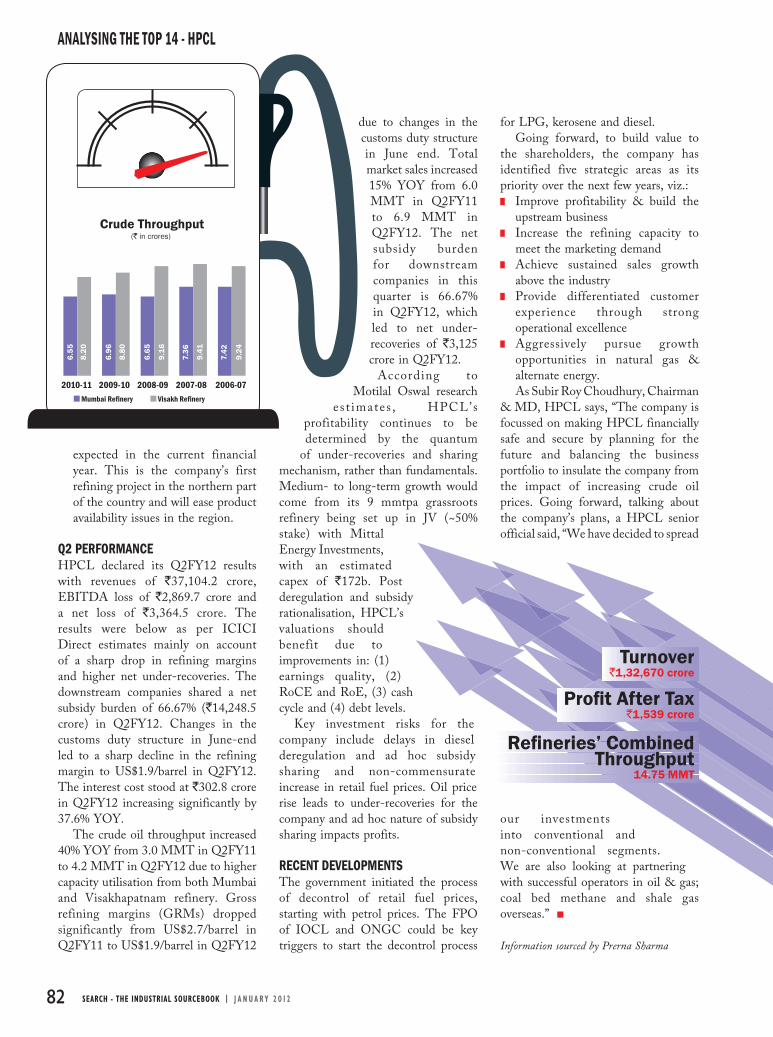
82 SEARCH - THE INDUSTRIAL SOURCEBOOK | J A N U A R Y 2 0 1 2
ANALYSING THE TOP 14 - HPCL
Turnover`1,32,670 crore
Profi t After Tax`1,539 crore
Refi neries’ Combined Throughput
14.75 MMT
2010-11 2009-10 2008-09 2007-08 2006-07
6.55
8.20
6.96
8.80
6.65
9.16
7.36
9.41
7.42
9.24
Crude Throughput(` in crores)
Mumbai Refi nery Visakh Refi nery
expected in the current financial year. This is the company’s first refining project in the northern part of the country and will ease product availability issues in the region.
Q2 PERFORMANCEHPCL declared its Q2FY12 results with revenues of `37,104.2 crore, EBITDA loss of `2,869.7 crore and a net loss of `3,364.5 crore. The results were below as per ICICI Direct estimates mainly on account of a sharp drop in refining margins and higher net under-recoveries. The downstream companies shared a net subsidy burden of 66.67% (`14,248.5 crore) in Q2FY12. Changes in the customs duty structure in June-end led to a sharp decline in the refining margin to US$1.9/barrel in Q2FY12. The interest cost stood at `302.8 crore in Q2FY12 increasing significantly by 37.6% YOY.
The crude oil throughput increased 40% YOY from 3.0 MMT in Q2FY11 to 4.2 MMT in Q2FY12 due to higher capacity utilisation from both Mumbai and Visakhapatnam refinery. Gross refining margins (GRMs) dropped significantly from US$2.7/barrel in Q2FY11 to US$1.9/barrel in Q2FY12
due to changes in the customs duty structure in June end. Total market sales increased 15% YOY from 6.0 MMT in Q2FY11 to 6.9 MMT in Q2FY12. The net subsidy burden for downstream companies in this quarter is 66.67% in Q2FY12, which led to net under-recoveries of `3,125 crore in Q2FY12.
According to Motilal Oswal research
es t imates , HPCL’s profitability continues to be determined by the quantum
of under-recoveries and sharing mechanism, rather than fundamentals. Medium- to long-term growth would come from its 9 mmtpa grassroots refinery being set up in JV (~50% stake) with Mittal Energy Investments, with an estimated capex of `172b. Post deregulation and subsidy rationalisation, HPCL’s valuations should benefit due to improvements in: (1) earnings quality, (2) RoCE and RoE, (3) cash cycle and (4) debt levels.
Key investment risks for the company include delays in diesel deregulation and ad hoc subsidy sharing and non-commensurate increase in retail fuel prices. Oil price rise leads to under-recoveries for the company and ad hoc nature of subsidy sharing impacts profits.
RECENT DEVELOPMENTSThe government initiated the process of decontrol of retail fuel prices, starting with petrol prices. The FPO of IOCL and ONGC could be key triggers to start the decontrol process
for LPG, kerosene and diesel.Going forward, to build value to
the shareholders, the company has identified five strategic areas as its priority over the next few years, viz.: Improve profitability & build the
upstream business Increase the refining capacity to
meet the marketing demand Achieve sustained sales growth
above the industry Provide differentiated customer
experience through strong operational excellence
Aggressively pursue growth opportunities in natural gas & alternate energy.As Subir Roy Choudhury, Chairman
& MD, HPCL says, “The company is focussed on making HPCL financially safe and secure by planning for the future and balancing the business portfolio to insulate the company from the impact of increasing crude oil prices. Going forward, talking about the company’s plans, a HPCL senior official said, “We have decided to spread
our investments into conventional and non-conventional segments. We are also looking at partnering with successful operators in oil & gas; coal bed methane and shale gas overseas.”
Information sourced by Prerna Sharma

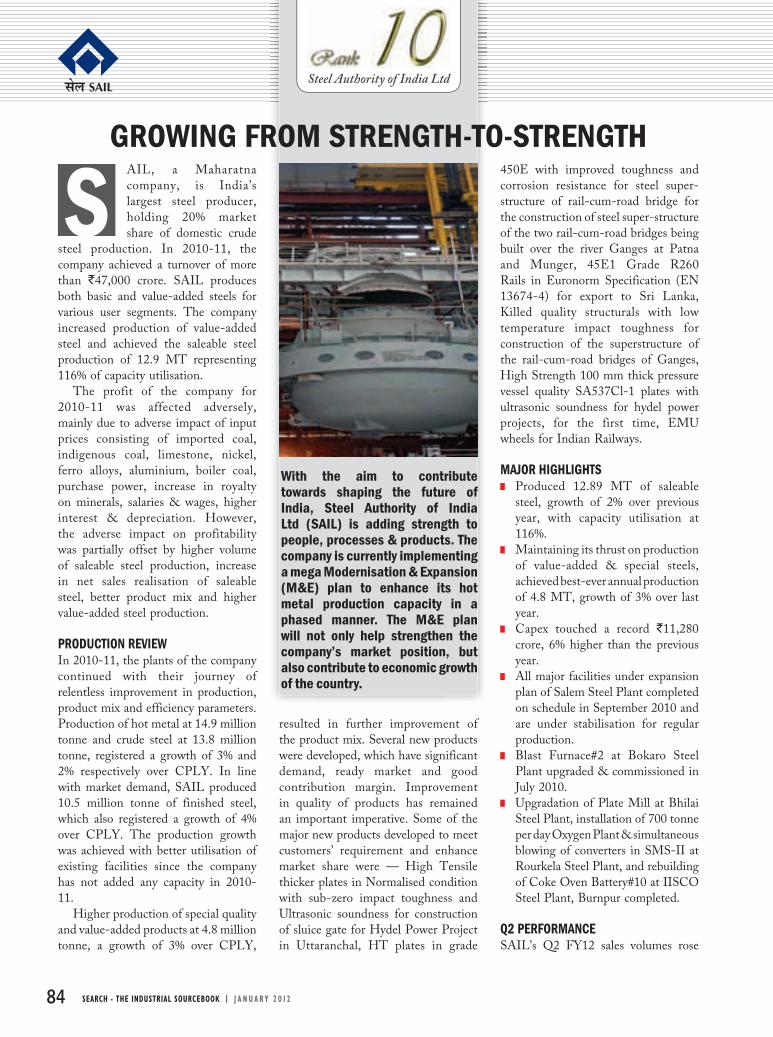
84 SEARCH - THE INDUSTRIAL SOURCEBOOK | J A N U A R Y 2 0 1 2
AIL, a Maharatna company, is India’s largest steel producer, holding 20% market share of domestic crude
steel production. In 2010-11, the company achieved a turnover of more than `47,000 crore. SAIL produces both basic and value-added steels for various user segments. The company increased production of value-added steel and achieved the saleable steel production of 12.9 MT representing 116% of capacity utilisation.
The profit of the company for 2010-11 was affected adversely, mainly due to adverse impact of input prices consisting of imported coal, indigenous coal, limestone, nickel, ferro alloys, aluminium, boiler coal, purchase power, increase in royalty on minerals, salaries & wages, higher interest & depreciation. However, the adverse impact on profitability was partially offset by higher volume of saleable steel production, increase in net sales realisation of saleable steel, better product mix and higher value-added steel production.
PRODUCTION REVIEW In 2010-11, the plants of the company continued with their journey of relentless improvement in production, product mix and efficiency parameters. Production of hot metal at 14.9 million tonne and crude steel at 13.8 million tonne, registered a growth of 3% and 2% respectively over CPLY. In line with market demand, SAIL produced 10.5 million tonne of finished steel, which also registered a growth of 4% over CPLY. The production growth was achieved with better utilisation of existing facilities since the company has not added any capacity in 2010-11.
Higher production of special quality and value-added products at 4.8 million tonne, a growth of 3% over CPLY,
resulted in further improvement of the product mix. Several new products were developed, which have significant demand, ready market and good contribution margin. Improvement in quality of products has remained an important imperative. Some of the major new products developed to meet customers’ requirement and enhance market share were — High Tensile thicker plates in Normalised condition with sub-zero impact toughness and Ultrasonic soundness for construction of sluice gate for Hydel Power Project in Uttaranchal, HT plates in grade
450E with improved toughness and corrosion resistance for steel super-structure of rail-cum-road bridge for the construction of steel super-structure of the two rail-cum-road bridges being built over the river Ganges at Patna and Munger, 45E1 Grade R260 Rails in Euronorm Specification (EN 13674-4) for export to Sri Lanka, Killed quality structurals with low temperature impact toughness for construction of the superstructure of the rail-cum-road bridges of Ganges, High Strength 100 mm thick pressure vessel quality SA537Cl-1 plates with ultrasonic soundness for hydel power projects, for the first time, EMU wheels for Indian Railways.
MAJOR HIGHLIGHTS Produced 12.89 MT of saleable
steel, growth of 2% over previous year, with capacity utilisation at 116%.
Maintaining its thrust on production of value-added & special steels, achieved best-ever annual production of 4.8 MT, growth of 3% over last year.
Capex touched a record `11,280 crore, 6% higher than the previous year.
All major facilities under expansion plan of Salem Steel Plant completed on schedule in September 2010 and are under stabilisation for regular production.
Blast Furnace#2 at Bokaro Steel Plant upgraded & commissioned in July 2010.
Upgradation of Plate Mill at Bhilai Steel Plant, installation of 700 tonne per day Oxygen Plant & simultaneous blowing of converters in SMS-II at Rourkela Steel Plant, and rebuilding of Coke Oven Battery#10 at IISCO Steel Plant, Burnpur completed.
Q2 PERFORMANCESAIL’s Q2 FY12 sales volumes rose
With the aim to contribute towards shaping the future of India, Steel Authority of India Ltd (SAIL) is adding strength to people, processes & products. The company is currently implementing a mega Modernisation & Expansion (M&E) plan to enhance its hot metal production capacity in a phased manner. The M&E plan will not only help strengthen the company’s market position, but also contribute to economic growth of the country.
SGROWING FROM STRENGTH-TO-STRENGTH
Steel Authority of India Ltd
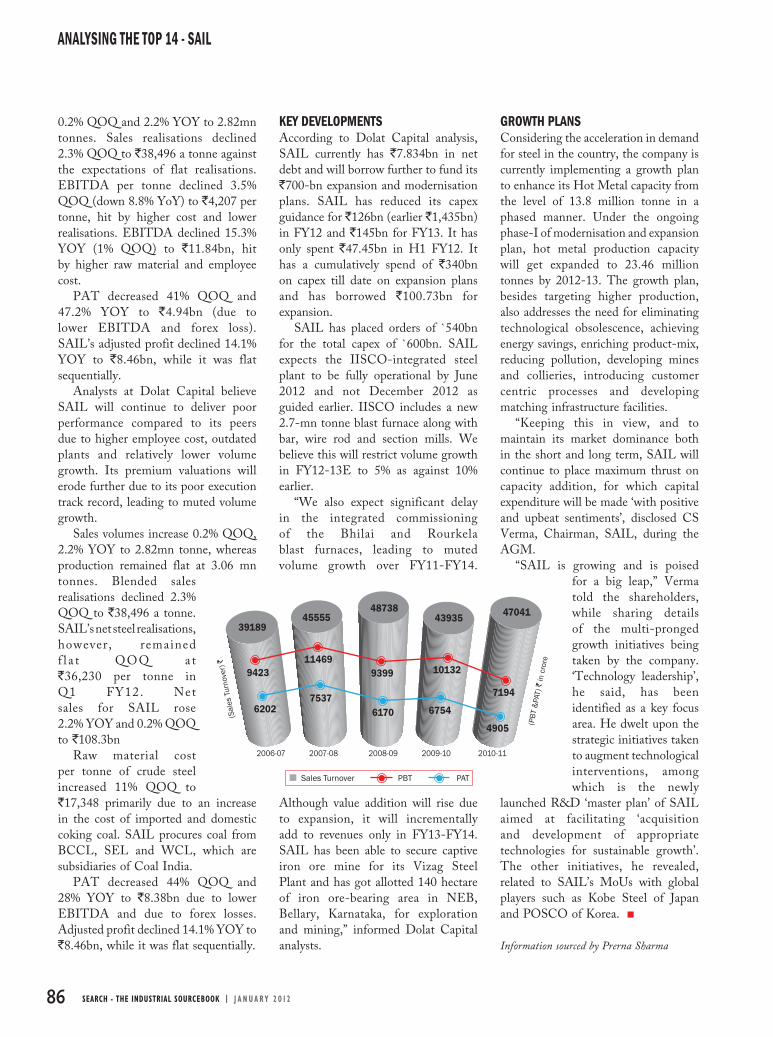
86 SEARCH - THE INDUSTRIAL SOURCEBOOK | J A N U A R Y 2 0 1 2
ANALYSING THE TOP 14 - SAIL
0.2% QOQ and 2.2% YOY to 2.82mn tonnes. Sales realisations declined 2.3% QOQ to `38,496 a tonne against the expectations of flat realisations. EBITDA per tonne declined 3.5% QOQ (down 8.8% YoY) to `4,207 per tonne, hit by higher cost and lower realisations. EBITDA declined 15.3% YOY (1% QOQ) to `11.84bn, hit by higher raw material and employee cost.
PAT decreased 41% QOQ and 47.2% YOY to `4.94bn (due to lower EBITDA and forex loss). SAIL’s adjusted profit declined 14.1% YOY to `8.46bn, while it was flat sequentially.
Analysts at Dolat Capital believe SAIL will continue to deliver poor performance compared to its peers due to higher employee cost, outdated plants and relatively lower volume growth. Its premium valuations will erode further due to its poor execution track record, leading to muted volume growth.
Sales volumes increase 0.2% QOQ, 2.2% YOY to 2.82mn tonne, whereas production remained flat at 3.06 mn tonnes. Blended sales realisations declined 2.3% QOQ to `38,496 a tonne. SAIL’s net steel realisations, however, remained f l a t QOQ a t `36,230 per tonne in Q1 FY12. Net sales for SAIL rose 2.2% YOY and 0.2% QOQ to `108.3bn
Raw material cost per tonne of crude steel increased 11% QOQ to `17,348 primarily due to an increase in the cost of imported and domestic coking coal. SAIL procures coal from BCCL, SEL and WCL, which are subsidiaries of Coal India.
PAT decreased 44% QOQ and 28% YOY to `8.38bn due to lower EBITDA and due to forex losses. Adjusted profit declined 14.1% YOY to `8.46bn, while it was flat sequentially.
KEY DEVELOPMENTSAccording to Dolat Capital analysis, SAIL currently has `7.834bn in net debt and will borrow further to fund its `700-bn expansion and modernisation plans. SAIL has reduced its capex guidance for `126bn (earlier `1,435bn) in FY12 and `145bn for FY13. It has only spent `47.45bn in H1 FY12. It has a cumulatively spend of `340bn on capex till date on expansion plans and has borrowed `100.73bn for expansion.
SAIL has placed orders of `540bn for the total capex of `600bn. SAIL expects the IISCO-integrated steel plant to be fully operational by June 2012 and not December 2012 as guided earlier. IISCO includes a new 2.7-mn tonne blast furnace along with bar, wire rod and section mills. We believe this will restrict volume growth in FY12-13E to 5% as against 10% earlier.
“We also expect significant delay in the integrated commissioning of the Bhilai and Rourkela blast furnaces, leading to muted volume growth over FY11-FY14.
Although value addition will rise due to expansion, it will incrementally add to revenues only in FY13-FY14. SAIL has been able to secure captive iron ore mine for its Vizag Steel Plant and has got allotted 140 hectare of iron ore-bearing area in NEB, Bellary, Karnataka, for exploration and mining,” informed Dolat Capital analysts.
GROWTH PLANSConsidering the acceleration in demand for steel in the country, the company is currently implementing a growth plan to enhance its Hot Metal capacity from the level of 13.8 million tonne in a phased manner. Under the ongoing phase-I of modernisation and expansion plan, hot metal production capacity will get expanded to 23.46 million tonnes by 2012-13. The growth plan, besides targeting higher production, also addresses the need for eliminating technological obsolescence, achieving energy savings, enriching product-mix, reducing pollution, developing mines and collieries, introducing customer centric processes and developing matching infrastructure facilities.
“Keeping this in view, and to maintain its market dominance both in the short and long term, SAIL will continue to place maximum thrust on capacity addition, for which capital expenditure will be made ‘with positive and upbeat sentiments’, disclosed CS Verma, Chairman, SAIL, during the AGM.
“SAIL is growing and is poised for a big leap,” Verma told the shareholders, while sharing details of the multi-pronged growth initiatives being taken by the company. ‘Technology leadership’, he said, has been identified as a key focus area. He dwelt upon the strategic initiatives taken to augment technological interventions, among which is the newly
launched R&D ‘master plan’ of SAIL aimed at facilitating ‘acquisition and development of appropriate technologies for sustainable growth’. The other initiatives, he revealed, related to SAIL’s MoUs with global players such as Kobe Steel of Japan and POSCO of Korea.
Information sourced by Prerna Sharma
(Sal
es T
urno
ver)
`
3918945555
4873843935 47041
942311469
9399 10132
7194
62027537
6170 6754
4905
Sales Turnover PBT PAT
(PB
T &
PAT)
` in
cro
re
2006-07 2007-08 2008-09 2009-10 2010-11

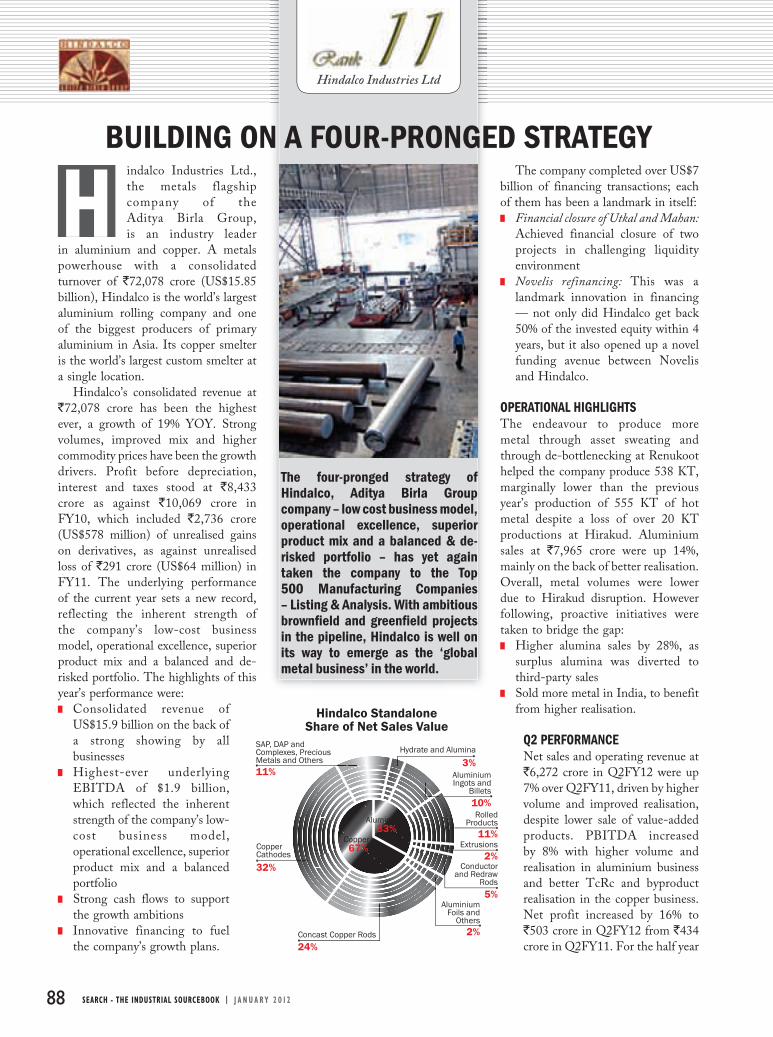
88 SEARCH - THE INDUSTRIAL SOURCEBOOK | J A N U A R Y 2 0 1 2
indalco Industries Ltd., the metals flagship company of the Aditya Birla Group, is an industry leader
in aluminium and copper. A metals powerhouse with a consolidated turnover of `72,078 crore (US$15.85 billion), Hindalco is the world’s largest aluminium rolling company and one of the biggest producers of primary aluminium in Asia. Its copper smelter is the world’s largest custom smelter at a single location.
Hindalco’s consolidated revenue at `72,078 crore has been the highest ever, a growth of 19% YOY. Strong volumes, improved mix and higher commodity prices have been the growth drivers. Profit before depreciation, interest and taxes stood at `8,433 crore as against `10,069 crore in FY10, which included `2,736 crore (US$578 million) of unrealised gains on derivatives, as against unrealised loss of `291 crore (US$64 million) in FY11. The underlying performance of the current year sets a new record, reflecting the inherent strength of the company’s low-cost business model, operational excellence, superior product mix and a balanced and de-risked portfolio. The highlights of this year’s performance were: Consolidated revenue of
US$15.9 billion on the back of a strong showing by all businesses
Highest-ever underlying EBITDA of $1.9 billion, which reflected the inherent strength of the company’s low-cost business model, operational excellence, superior product mix and a balanced portfolio
Strong cash flows to support the growth ambitions
Innovative financing to fuel the company’s growth plans.
The company completed over US$7 billion of financing transactions; each of them has been a landmark in itself: Financial closure of Utkal and Mahan:
Achieved financial closure of two projects in challenging liquidity environment
Novelis refinancing: This was a landmark innovation in financing — not only did Hindalco get back 50% of the invested equity within 4 years, but it also opened up a novel funding avenue between Novelis and Hindalco.
OPERATIONAL HIGHLIGHTSThe endeavour to produce more metal through asset sweating and through de-bottlenecking at Renukoot helped the company produce 538 KT, marginally lower than the previous year’s production of 555 KT of hot metal despite a loss of over 20 KT productions at Hirakud. Aluminium sales at `7,965 crore were up 14%, mainly on the back of better realisation. Overall, metal volumes were lower due to Hirakud disruption. However following, proactive initiatives were taken to bridge the gap: Higher alumina sales by 28%, as
surplus alumina was diverted to third-party sales
Sold more metal in India, to benefit from higher realisation.
Q2 PERFORMANCENet sales and operating revenue at `6,272 crore in Q2FY12 were up 7% over Q2FY11, driven by higher volume and improved realisation, despite lower sale of value-added products. PBITDA increased by 8% with higher volume and realisation in aluminium business and better TcRc and byproduct realisation in the copper business. Net profit increased by 16% to `503 crore in Q2FY12 from `434 crore in Q2FY11. For the half year
The four-pronged strategy of Hindalco, Aditya Birla Group company – low cost business model, operational excellence, superior product mix and a balanced & de-risked portfolio – has yet again taken the company to the Top 500 Manufacturing Companies – Listing & Analysis. With ambitious brownfi eld and greenfi eld projects in the pipeline, Hindalco is well on its way to emerge as the ‘global metal business’ in the world.
HBUILDING ON A FOUR-PRONGED STRATEGY
Hindalco Industries Ltd
Hindalco StandaloneShare of Net Sales Value
SAP, DAP and Complexes, Precious Metals and Others 3%
Copper Cathodes
Concast Copper Rods
Hydrate and Alumina
Aluminium Ingots and
Billets
Rolled Products
Extrusions
Conductor and Redraw
Rods
Aluminium Foils and
Others
10%
11%
2%
5%
2%24%
32%
11%
33%
67%
Aluminium
Copper

90 SEARCH - THE INDUSTRIAL SOURCEBOOK | J A N U A R Y 2 0 1 2
ANALYSING THE TOP 14 - HINDALCO INDUSTRIES
Consolidated Revenue`72,078 crore
PBDIT`8,433 crore
The company has embarked on an ambitious growth path with an announced investment plan of over US$6.5 billion in India
and overseas in the next three years.
ended September 30, 2011, revenues rose by 11%, PBITDA increased by 12% with increase in net profit by 18%.
In Q2FY12, aluminium revenues were higher at `2,213 crore up from `1,911 crore in Q2FY11 — a rise of 16% as a result of higher volumes and better aluminium prices on the LME. In the copper business, revenues were at `4,062 crore versus `3,951 crore in Q2FY11, on the back of higher LME and byproduct credits. Copper volumes were lower on account of the shutdown of one of the smelters up till mid July.
Alumina production was lower by 4% due to constrained supplies and poor quality of bauxite. Metal volume was higher by 16 per cent driven by higher production at Hirakud — in Q2FY11, Hirakud production was affected due to smelter outage. Metal
production at Renukoot increased by
2% on the back of continued focus on asset sweating.
Downstream production declined by 3% in the case of flat rolled products as compared to Q2FY11 due to demand sluggishness in the domestic market. Extrusion production was lower, consequent upon the continuation of a lock-out at the company’s Alupuram unit in Kerala.
ON AN EXPANSION SPREEHindalco has embarked on a massive capacity expansion drive, with plans to increase its capacity 3x to 1.64 mtpa through three greenfield projects viz.
Mahan, Aditya and Jharkhand. All the three projects consist of similar capacities i.e. 359 ktpa smelter with 900 MW captive power. The Mahan project is coming up in Bargwan, MP,
while the Aditya project would come up in Orissa. From the existing combined capacity of 1.5 mtpa, alumina refining capacity is being raised to 4.5 mtpa with additional 1.5 mtpa each in Utkal and Aditya projects. The cumulative total capex for these projects is pegged at ~`500 bn.
In case of brownfield projects, smelting capacity expansion in Hirakud has been progressing well and the company has already increased
its capacity to 161 ktpa in Q4FY11. Further
expansion to 213 ktpa along with a CPP of
100 MW is scheduled to be commissioned during the
end of FY12. The next phase of expansion to 360 ktpa with additional
CPP of 500 MW is under evaluation. The company is also in the process of transferring key equipment from FRP plant of Novelis in Rogerstone, UK to Hirakud at an estimated cost of ~`8 bn. This would enable the company to cater to the local and regional exports demand of superior engineering products, including can body stock. The company has also been evaluating expansion of its Belgaum special aluminium plant capacity from 189 ktpa to 301 ktpa.
Though there have been some delays in all the projects due to various externalities, analysts at Emkay Global Financial Services believe FY13 would see some comfort in terms of commissioning of Mahan and Utkal projects. We have assumed 90 kt of incremental production from Mahan in FY13. Further delay, however, would be a deterrent due to significant
cost overrun and lower volume. Hirakud smelter capacity was raised
from 1,55,000 tpa to 1,61,400 capacity in Q4FY11. By 2012 end, another 51,600 tpa capacity is scheduled to
be added to the Hirakud plant, which will take the total capacity at Hirakud to 2,13,000 tpa, along with a 100 MW captive power
plant. The next phase of expansion at Hirakud is planned to increase its capacity to 360 ktpa along with a corresponding increase in captive power from 467.5 MW to 967.5 MW. The environmental clearance for this is already in place.
This project involves the transfer of all key equipment for FRP production from Novelis plant at Rogerstone, UK to Hirakud. Also, orders placed for related and balancing equipment will enable the company to produce superior engineering products, including can body stock, for various markets. This project is expected to be complete by Q4FY12 or early FY13.
The specials plant capacity at Belgaum will be raised from 189 ktpa to 301 ktpa, along with a coal-based co-generation plant. Currently, natural gas adaptation for its rotary kilns is being evaluated. The company plans to invest US$300 mn to expand the aluminium rolling operations in Pinda to about 600 kt of aluminium sheets per year. This project is expected to come on stream by 2012.
Novelis has announced plans to invest US$400 mn in aluminium rolling and recycling operations in South Korea. This will increase aluminium sheet capacity in Asia to 1,000 kt annually. The new capacity is expected to be commissioned in financial year 2013.
Hindalco is set to start commissioning a 3,59,000 aluminium smelter along with a captive power plant of 900 MW during Q4FY12 at Bargwan, Madhya Pradesh. The estimated capex for the project is about `105 bn, of which `77.85 bn is being
J A N U A R Y 2 0 1 2 | SEARCH - THE INDUSTRIAL SOURCEBOOK 91
HINDALCO INDUSTRIES - ANALYSING THE TOP 14
financed by debt — `60 bn has already been drawn down. The major setback for the project lies in the fact that the coal block of Mahan still awaits Ministry of Environment and Forests clearances. Hindalco will have to either source coal from linkages or will have to import coal till clearances are received and a coal mine is developed. This may result in significantly higher operating cost.
Hindalco is in the process of setting up a 1.5 mtpa alumina plant along with a 90-MW captive cogeneration plant in Utkal, which has received all the clearances and licence for mining, is expected to be on stream by Q4FY13. The output from the Utkal plant will feed alumina to the Mahan and the Aditya smelters. The estimated project cost for the Utkal plant is about `72 bn, of which `49.06 bn will be financed through debt. The captive bauxite mines of the Utkal alumina project are located at Baphlimali hills of Kashipur
block in Orissa’s Rayagada district.
ON AN ASPIRATIONAL GROWTH PATHThe company has embarked on an aspirational growth path towards which, three new aluminium smelters and two new alumina refineries are being set up in Odisha, Madhya Pradesh and Jharkhand. With these projects on stream, aluminium smelting capacity will touch around 1.7 million tonne and alumina refining capacity around 6 million tonne. The site work on these greenfield projects is in various stages of progress.
The company’s strategy to achieve global size and scale through the acquisition of Novelis has demonstrated its merit and so far, things have worked
as per the plan. The de-risked business model of Novelis, where LME is a pass through, its robust product portfolio with over 50% going into the manufacturing of beverage cans and strong presence in emerging markets has shown its strength and is now poised for a transformational growth. It has already become value accretive for Hindalco and offers significant synergistic benefits going forward.
Hindalco is well poised to emerge as ‘one global metal business’ with the India-centric upstream business and the global value-added downstream business. The company has embarked on an ambitious growth path with an announced investment plan of over US$6.5 billion in India and overseas in the next three years. With these projects coming on stream, Hindalco is set for a quantum growth leap.
Information sourced by Prerna Sharma
Greenfi eld projects will signifi cantly enhance the scale of operations and will further improve the company’s cost competitiveness.
FACT
FACT
FACT
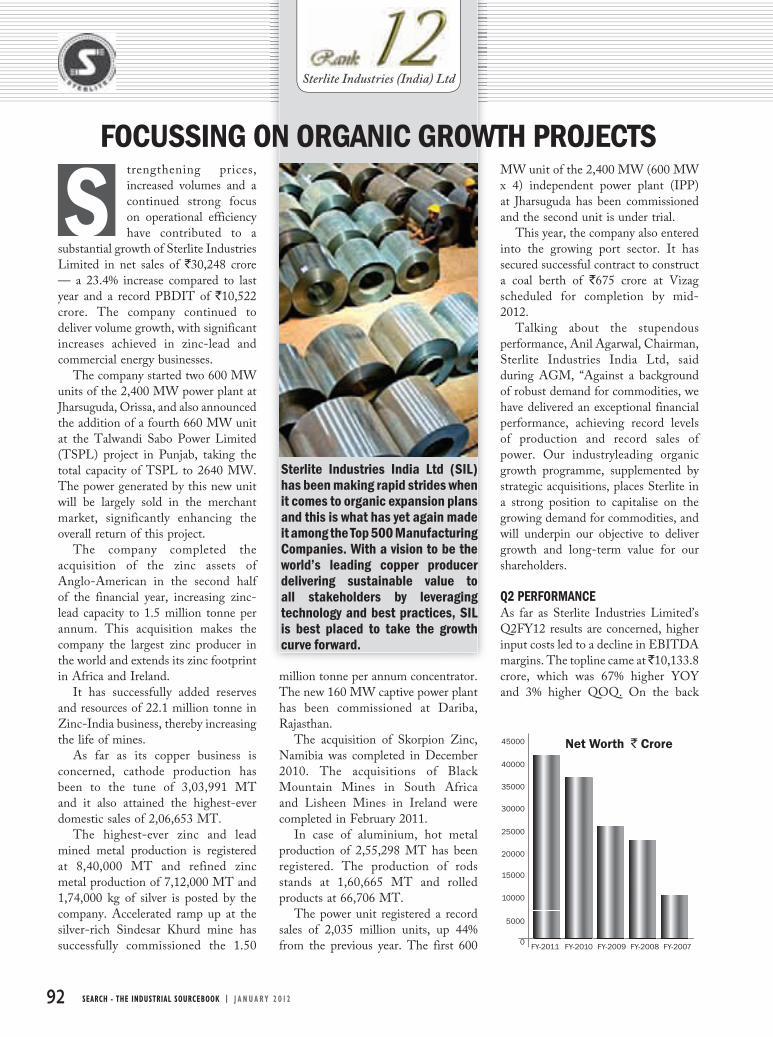
92 SEARCH - THE INDUSTRIAL SOURCEBOOK | J A N U A R Y 2 0 1 2
trengthening prices, increased volumes and a continued strong focus on operational efficiency have contributed to a
substantial growth of Sterlite Industries Limited in net sales of `30,248 crore — a 23.4% increase compared to last year and a record PBDIT of `10,522 crore. The company continued to deliver volume growth, with significant increases achieved in zinc-lead and commercial energy businesses.
The company started two 600 MW units of the 2,400 MW power plant at Jharsuguda, Orissa, and also announced the addition of a fourth 660 MW unit at the Talwandi Sabo Power Limited (TSPL) project in Punjab, taking the total capacity of TSPL to 2640 MW. The power generated by this new unit will be largely sold in the merchant market, significantly enhancing the overall return of this project.
The company completed the acquisition of the zinc assets of Anglo-American in the second half of the financial year, increasing zinc-lead capacity to 1.5 million tonne per annum. This acquisition makes the company the largest zinc producer in the world and extends its zinc footprint in Africa and Ireland.
It has successfully added reserves and resources of 22.1 million tonne in Zinc-India business, thereby increasing the life of mines.
As far as its copper business is concerned, cathode production has been to the tune of 3,03,991 MT and it also attained the highest-ever domestic sales of 2,06,653 MT.
The highest-ever zinc and lead mined metal production is registered at 8,40,000 MT and refined zinc metal production of 7,12,000 MT and 1,74,000 kg of silver is posted by the company. Accelerated ramp up at the silver-rich Sindesar Khurd mine has successfully commissioned the 1.50
million tonne per annum concentrator. The new 160 MW captive power plant has been commissioned at Dariba, Rajasthan.
The acquisition of Skorpion Zinc, Namibia was completed in December 2010. The acquisitions of Black Mountain Mines in South Africa and Lisheen Mines in Ireland were completed in February 2011.
In case of aluminium, hot metal production of 2,55,298 MT has been registered. The production of rods stands at 1,60,665 MT and rolled products at 66,706 MT.
The power unit registered a record sales of 2,035 million units, up 44% from the previous year. The first 600
MW unit of the 2,400 MW (600 MW x 4) independent power plant (IPP) at Jharsuguda has been commissioned and the second unit is under trial.
This year, the company also entered into the growing port sector. It has secured successful contract to construct a coal berth of `675 crore at Vizag scheduled for completion by mid-2012.
Talking about the stupendous performance, Anil Agarwal, Chairman, Sterlite Industries India Ltd, said during AGM, “Against a background of robust demand for commodities, we have delivered an exceptional financial performance, achieving record levels of production and record sales of power. Our industryleading organic growth programme, supplemented by strategic acquisitions, places Sterlite in a strong position to capitalise on the growing demand for commodities, and will underpin our objective to deliver growth and long-term value for our shareholders.
Q2 PERFORMANCEAs far as Sterlite Industries Limited’s Q2FY12 results are concerned, higher input costs led to a decline in EBITDA margins. The topline came at ̀ 10,133.8 crore, which was 67% higher YOY and 3% higher QOQ. On the back
Sterlite Industries India Ltd (SIL) has been making rapid strides when it comes to organic expansion plans and this is what has yet again made it among the Top 500 Manufacturing Companies. With a vision to be the world’s leading copper producer delivering sustainable value to all stakeholders by leveraging technology and best practices, SIL is best placed to take the growth curve forward.
SFOCUSSING ON ORGANIC GROWTH PROJECTS
Sterlite Industries (India) Ltd
45000
40000
35000
30000
25000
20000
15000
10000
5000
0FY-2011 FY-2010 FY-2009 FY-2008 FY-2007
Net Worth ` Crore

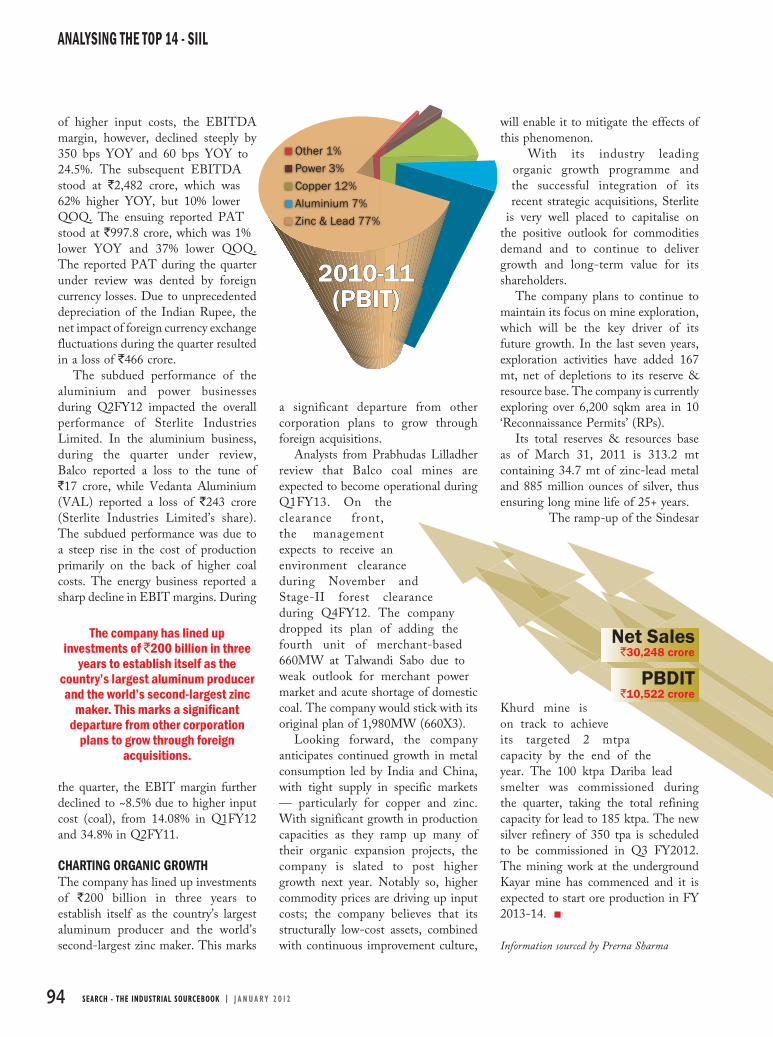
94 SEARCH - THE INDUSTRIAL SOURCEBOOK | J A N U A R Y 2 0 1 2
ANALYSING THE TOP 14 - SIIL
2010-11 2010-11 (PBIT)(PBIT)
Other 1%
Power 3%
Copper 12%
Aluminium 7%
Zinc & Lead 77%
Net Sales`30,248 crore
PBDIT`10,522 crore
The company has lined up investments of `200 billion in three
years to establish itself as the country’s largest aluminum producer and the world’s second-largest zinc
maker. This marks a signifi cant departure from other corporation
plans to grow through foreign acquisitions.
of higher input costs, the EBITDA margin, however, declined steeply by 350 bps YOY and 60 bps YOY to 24.5%. The subsequent EBITDA stood at `2,482 crore, which was 62% higher YOY, but 10% lower QOQ. The ensuing reported PAT stood at `997.8 crore, which was 1% lower YOY and 37% lower QOQ. The reported PAT during the quarter under review was dented by foreign currency losses. Due to unprecedented depreciation of the Indian Rupee, the net impact of foreign currency exchange fluctuations during the quarter resulted in a loss of `466 crore.
The subdued performance of the aluminium and power businesses during Q2FY12 impacted the overall performance of Sterlite Industries Limited. In the aluminium business, during the quarter under review, Balco reported a loss to the tune of `17 crore, while Vedanta Aluminium (VAL) reported a loss of `243 crore (Sterlite Industries Limited’s share). The subdued performance was due to a steep rise in the cost of production primarily on the back of higher coal costs. The energy business reported a sharp decline in EBIT margins. During
the quarter, the EBIT margin further declined to ~8.5% due to higher input cost (coal), from 14.08% in Q1FY12 and 34.8% in Q2FY11.
CHARTING ORGANIC GROWTHThe company has lined up investments of `200 billion in three years to establish itself as the country’s largest aluminum producer and the world’s second-largest zinc maker. This marks
a significant departure from other corporation plans to grow through foreign acquisitions.
Analysts from Prabhudas Lilladher review that Balco coal mines are expected to become operational during Q1FY13. On the clearance front, the management expects to receive an environment clearance during November and Stage-II forest clearance during Q4FY12. The company dropped its plan of adding the fourth unit of merchant-based 660MW at Talwandi Sabo due to weak outlook for merchant power market and acute shortage of domestic coal. The company would stick with its original plan of 1,980MW (660X3).
Looking forward, the company anticipates continued growth in metal consumption led by India and China, with tight supply in specific markets — particularly for copper and zinc. With significant growth in production capacities as they ramp up many of their organic expansion projects, the company is slated to post higher growth next year. Notably so, higher commodity prices are driving up input costs; the company believes that its structurally low-cost assets, combined with continuous improvement culture,
will enable it to mitigate the effects of this phenomenon.
With its industry leading organic growth programme and the successful integration of its recent strategic acquisitions, Sterlite
is very well placed to capitalise on the positive outlook for commodities demand and to continue to deliver growth and long-term value for its shareholders.
The company plans to continue to maintain its focus on mine exploration, which will be the key driver of its future growth. In the last seven years, exploration activities have added 167 mt, net of depletions to its reserve & resource base. The company is currently exploring over 6,200 sqkm area in 10 ‘Reconnaissance Permits’ (RPs).
Its total reserves & resources base as of March 31, 2011 is 313.2 mt containing 34.7 mt of zinc-lead metal and 885 million ounces of silver, thus ensuring long mine life of 25+ years.
The ramp-up of the Sindesar
Khurd mine is on track to achieve its targeted 2 mtpa capacity by the end of the year. The 100 ktpa Dariba lead smelter was commissioned during the quarter, taking the total refining capacity for lead to 185 ktpa. The new silver refinery of 350 tpa is scheduled to be commissioned in Q3 FY2012. The mining work at the underground Kayar mine has commenced and it is expected to start ore production in FY 2013-14.
Information sourced by Prerna Sharma

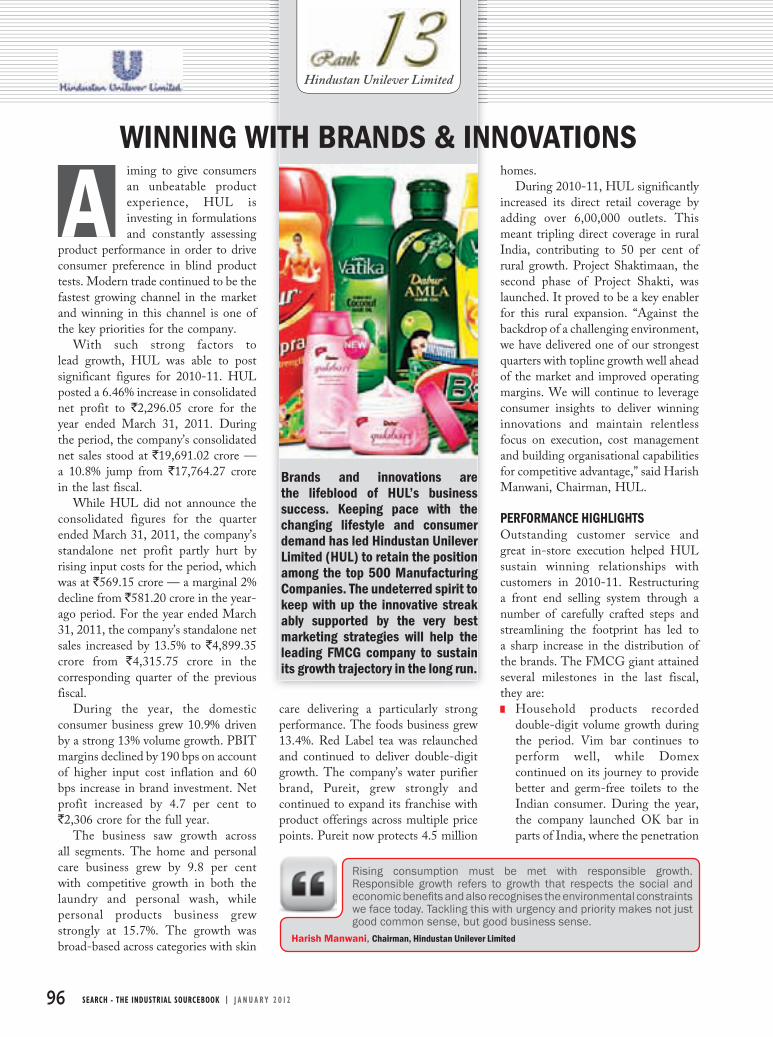
96 SEARCH - THE INDUSTRIAL SOURCEBOOK | J A N U A R Y 2 0 1 2
iming to give consumers an unbeatable product experience, HUL is investing in formulations and constantly assessing
product performance in order to drive consumer preference in blind product tests. Modern trade continued to be the fastest growing channel in the market and winning in this channel is one of the key priorities for the company.
With such strong factors to lead growth, HUL was able to post significant figures for 2010-11. HUL posted a 6.46% increase in consolidated net profit to `2,296.05 crore for the year ended March 31, 2011. During the period, the company’s consolidated net sales stood at `19,691.02 crore — a 10.8% jump from `17,764.27 crore in the last fiscal.
While HUL did not announce the consolidated figures for the quarter ended March 31, 2011, the company’s standalone net profit partly hurt by rising input costs for the period, which was at `569.15 crore — a marginal 2% decline from `581.20 crore in the year-ago period. For the year ended March 31, 2011, the company’s standalone net sales increased by 13.5% to `4,899.35 crore from `4,315.75 crore in the corresponding quarter of the previous fiscal.
During the year, the domestic consumer business grew 10.9% driven by a strong 13% volume growth. PBIT margins declined by 190 bps on account of higher input cost inflation and 60 bps increase in brand investment. Net profit increased by 4.7 per cent to `2,306 crore for the full year.
The business saw growth across all segments. The home and personal care business grew by 9.8 per cent with competitive growth in both the laundry and personal wash, while personal products business grew strongly at 15.7%. The growth was broad-based across categories with skin
care delivering a particularly strong performance. The foods business grew 13.4%. Red Label tea was relaunched and continued to deliver double-digit growth. The company’s water purifier brand, Pureit, grew strongly and continued to expand its franchise with product offerings across multiple price points. Pureit now protects 4.5 million
homes. During 2010-11, HUL significantly
increased its direct retail coverage by adding over 6,00,000 outlets. This meant tripling direct coverage in rural India, contributing to 50 per cent of rural growth. Project Shaktimaan, the second phase of Project Shakti, was launched. It proved to be a key enabler for this rural expansion. “Against the backdrop of a challenging environment, we have delivered one of our strongest quarters with topline growth well ahead of the market and improved operating margins. We will continue to leverage consumer insights to deliver winning innovations and maintain relentless focus on execution, cost management and building organisational capabilities for competitive advantage,” said Harish Manwani, Chairman, HUL.
PERFORMANCE HIGHLIGHTS Outstanding customer service and great in-store execution helped HUL sustain winning relationships with customers in 2010-11. Restructuring a front end selling system through a number of carefully crafted steps and streamlining the footprint has led to a sharp increase in the distribution of the brands. The FMCG giant attained several milestones in the last fiscal, they are: Household products recorded
double-digit volume growth during the period. Vim bar continues to perform well, while Domex continued on its journey to provide better and germ-free toilets to the Indian consumer. During the year, the company launched OK bar in parts of India, where the penetration
Brands and innovations are the lifeblood of HUL’s business success. Keeping pace with the changing lifestyle and consumer demand has led Hindustan Unilever Limited (HUL) to retain the position among the top 500 Manufacturing Companies. The undeterred spirit to keep with up the innovative streak ably supported by the very best marketing strategies will help the leading FMCG company to sustain its growth trajectory in the long run.
AWINNING WITH BRANDS & INNOVATIONS
Hindustan Unilever Limited
Rising consumption must be met with responsible growth. Responsible growth refers to growth that respects the social and economic benefi ts and also recognises the environmental constraints we face today. Tackling this with urgency and priority makes not just good common sense, but good business sense.
Harish Manwani, Chairman, Hindustan Unilever Limited
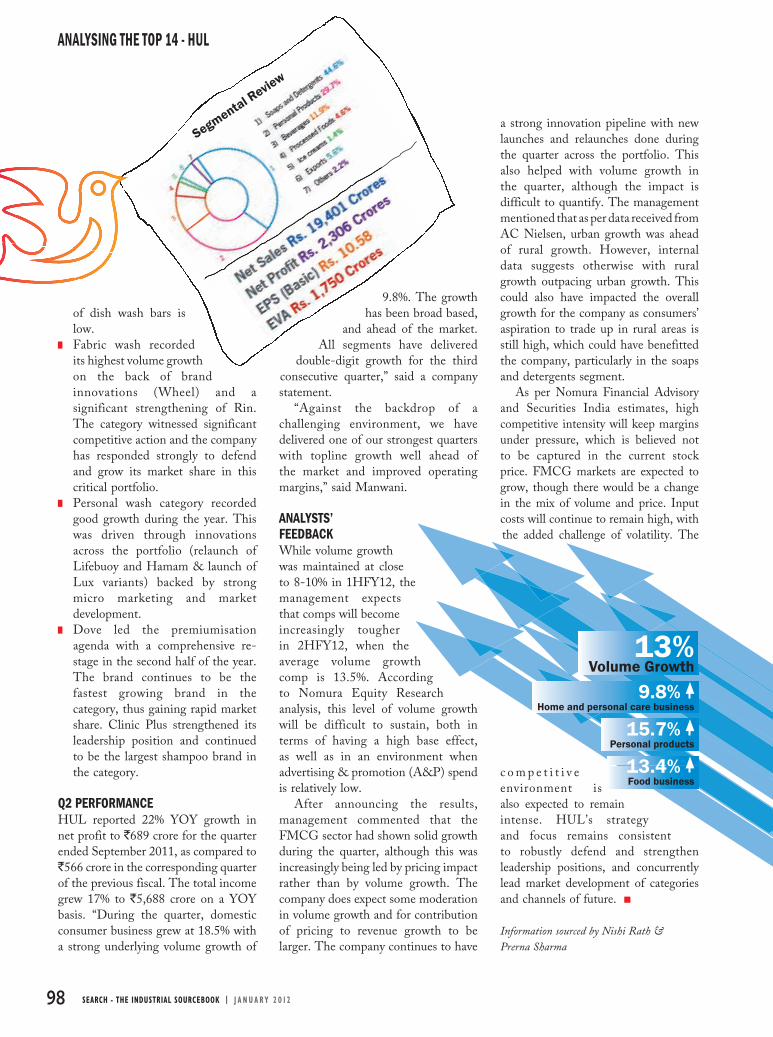
98 SEARCH - THE INDUSTRIAL SOURCEBOOK | J A N U A R Y 2 0 1 2
ANALYSING THE TOP 14 - HUL
13%Volume Growth
9.8% Home and personal care business
15.7% Personal products
13.4% Food business
Segmental Review
of dish wash bars is low.
Fabric wash recorded its highest volume growth on the back of brand innovations (Wheel) and a significant strengthening of Rin. The category witnessed significant competitive action and the company has responded strongly to defend and grow its market share in this critical portfolio.
Personal wash category recorded good growth during the year. This was driven through innovations across the portfolio (relaunch of Lifebuoy and Hamam & launch of Lux variants) backed by strong micro marketing and market development.
Dove led the premiumisation agenda with a comprehensive re-stage in the second half of the year. The brand continues to be the fastest growing brand in the category, thus gaining rapid market share. Clinic Plus strengthened its leadership position and continued to be the largest shampoo brand in the category.
Q2 PERFORMANCE HUL reported 22% YOY growth in net profit to `689 crore for the quarter ended September 2011, as compared to `566 crore in the corresponding quarter of the previous fiscal. The total income grew 17% to `5,688 crore on a YOY basis. “During the quarter, domestic consumer business grew at 18.5% with a strong underlying volume growth of
9.8%. The growth has been broad based,
and ahead of the market. All segments have delivered
double-digit growth for the third consecutive quarter,” said a company statement.
“Against the backdrop of a challenging environment, we have delivered one of our strongest quarters with topline growth well ahead of the market and improved operating margins,” said Manwani.
ANALYSTS’ FEEDBACKWhile volume growth was maintained at close to 8-10% in 1HFY12, the management expects that comps will become increasingly tougher in 2HFY12, when the average volume growth comp is 13.5%. According to Nomura Equity Research analysis, this level of volume growth will be difficult to sustain, both in terms of having a high base effect, as well as in an environment when advertising & promotion (A&P) spend is relatively low.
After announcing the results, management commented that the FMCG sector had shown solid growth during the quarter, although this was increasingly being led by pricing impact rather than by volume growth. The company does expect some moderation in volume growth and for contribution of pricing to revenue growth to be larger. The company continues to have
a strong innovation pipeline with new launches and relaunches done during the quarter across the portfolio. This also helped with volume growth in the quarter, although the impact is difficult to quantify. The management mentioned that as per data received from AC Nielsen, urban growth was ahead of rural growth. However, internal data suggests otherwise with rural growth outpacing urban growth. This could also have impacted the overall growth for the company as consumers’ aspiration to trade up in rural areas is still high, which could have benefitted the company, particularly in the soaps and detergents segment.
As per Nomura Financial Advisory and Securities India estimates, high competitive intensity will keep margins under pressure, which is believed not to be captured in the current stock price. FMCG markets are expected to grow, though there would be a change in the mix of volume and price. Input costs will continue to remain high, with the added challenge of volatility. The
c o m p e t i t i v e environment is also expected to remain intense. HUL’s strategy and focus remains consistent to robustly defend and strengthen leadership positions, and concurrently lead market development of categories and channels of future.
Information sourced by Nishi Rath &
Prerna Sharma

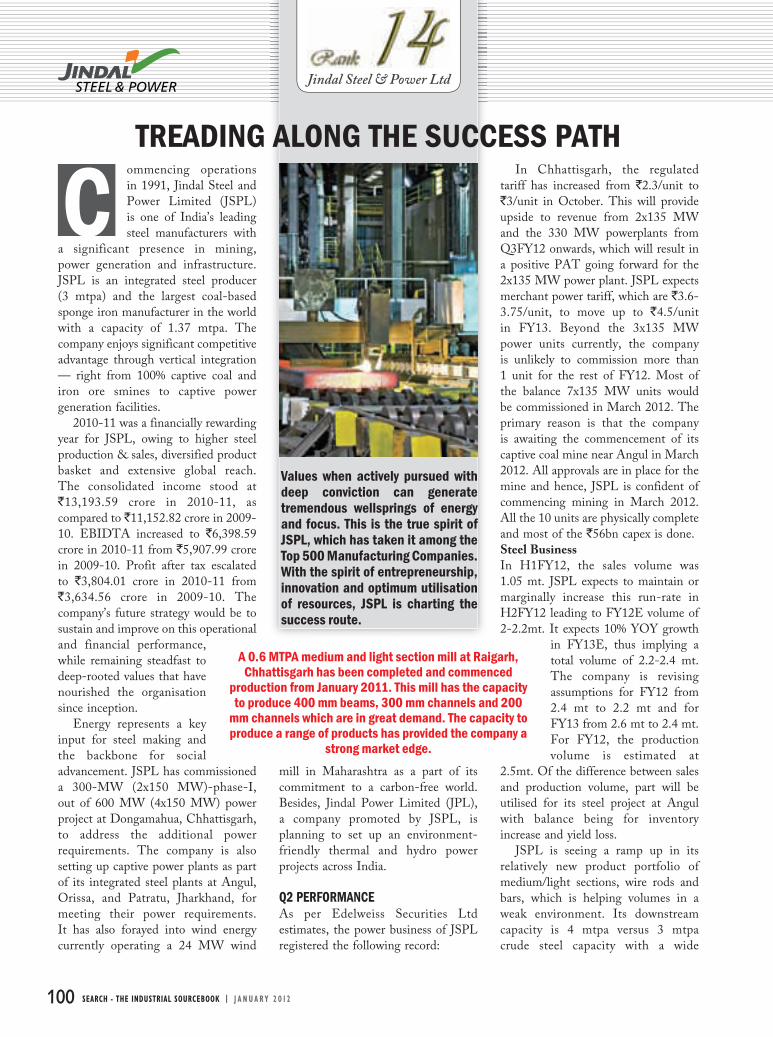
100 SEARCH - THE INDUSTRIAL SOURCEBOOK | J A N U A R Y 2 0 1 2
ommencing operations in 1991, Jindal Steel and Power Limited (JSPL) is one of India’s leading steel manufacturers with
a significant presence in mining, power generation and infrastructure. JSPL is an integrated steel producer (3 mtpa) and the largest coal-based sponge iron manufacturer in the world with a capacity of 1.37 mtpa. The company enjoys significant competitive advantage through vertical integration — right from 100% captive coal and iron ore smines to captive power generation facilities.
2010-11 was a financially rewarding year for JSPL, owing to higher steel production & sales, diversified product basket and extensive global reach. The consolidated income stood at `13,193.59 crore in 2010-11, as compared to `11,152.82 crore in 2009-10. EBIDTA increased to `6,398.59 crore in 2010-11 from `5,907.99 crore in 2009-10. Profit after tax escalated to `3,804.01 crore in 2010-11 from `3,634.56 crore in 2009-10. The company’s future strategy would be to sustain and improve on this operational and financial performance, while remaining steadfast to deep-rooted values that have nourished the organisation since inception.
Energy represents a key input for steel making and the backbone for social advancement. JSPL has commissioned a 300-MW (2x150 MW)-phase-I, out of 600 MW (4x150 MW) power project at Dongamahua, Chhattisgarh, to address the additional power requirements. The company is also setting up captive power plants as part of its integrated steel plants at Angul, Orissa, and Patratu, Jharkhand, for meeting their power requirements. It has also forayed into wind energy currently operating a 24 MW wind
mill in Maharashtra as a part of its commitment to a carbon-free world. Besides, Jindal Power Limited (JPL), a company promoted by JSPL, is planning to set up an environment-friendly thermal and hydro power projects across India.
Q2 PERFORMANCEAs per Edelweiss Securities Ltd estimates, the power business of JSPL registered the following record:
In Chhattisgarh, the regulated tariff has increased from `2.3/unit to `3/unit in October. This will provide upside to revenue from 2x135 MW and the 330 MW powerplants from Q3FY12 onwards, which will result in a positive PAT going forward for the 2x135 MW power plant. JSPL expects merchant power tariff, which are `3.6-3.75/unit, to move up to `4.5/unit in FY13. Beyond the 3x135 MW power units currently, the company is unlikely to commission more than 1 unit for the rest of FY12. Most of the balance 7x135 MW units would be commissioned in March 2012. The primary reason is that the company is awaiting the commencement of its captive coal mine near Angul in March 2012. All approvals are in place for the mine and hence, JSPL is confident of commencing mining in March 2012. All the 10 units are physically complete and most of the `56bn capex is done.Steel BusinessIn H1FY12, the sales volume was 1.05 mt. JSPL expects to maintain or marginally increase this run-rate in H2FY12 leading to FY12E volume of 2-2.2mt. It expects 10% YOY growth
in FY13E, thus implying a total volume of 2.2-2.4 mt. The company is revising assumptions for FY12 from 2.4 mt to 2.2 mt and for FY13 from 2.6 mt to 2.4 mt. For FY12, the production volume is estimated at
2.5mt. Of the difference between sales and production volume, part will be utilised for its steel project at Angul with balance being for inventory increase and yield loss.
JSPL is seeing a ramp up in its relatively new product portfolio of medium/light sections, wire rods and bars, which is helping volumes in a weak environment. Its downstream capacity is 4 mtpa versus 3 mtpa crude steel capacity with a wide
Values when actively pursued with deep conviction can generate tremendous wellsprings of energy and focus. This is the true spirit of JSPL, which has taken it among the Top 500 Manufacturing Companies. With the spirit of entrepreneurship, innovation and optimum utilisation of resources, JSPL is charting the success route.
CTREADING ALONG THE SUCCESS PATH
Jindal Steel & Power Ltd
A 0.6 MTPA medium and light section mill at Raigarh, Chhattisgarh has been completed and commenced
production from January 2011. This mill has the capacity to produce 400 mm beams, 300 mm channels and 200
mm channels which are in great demand. The capacity to produce a range of products has provided the company a
strong market edge.
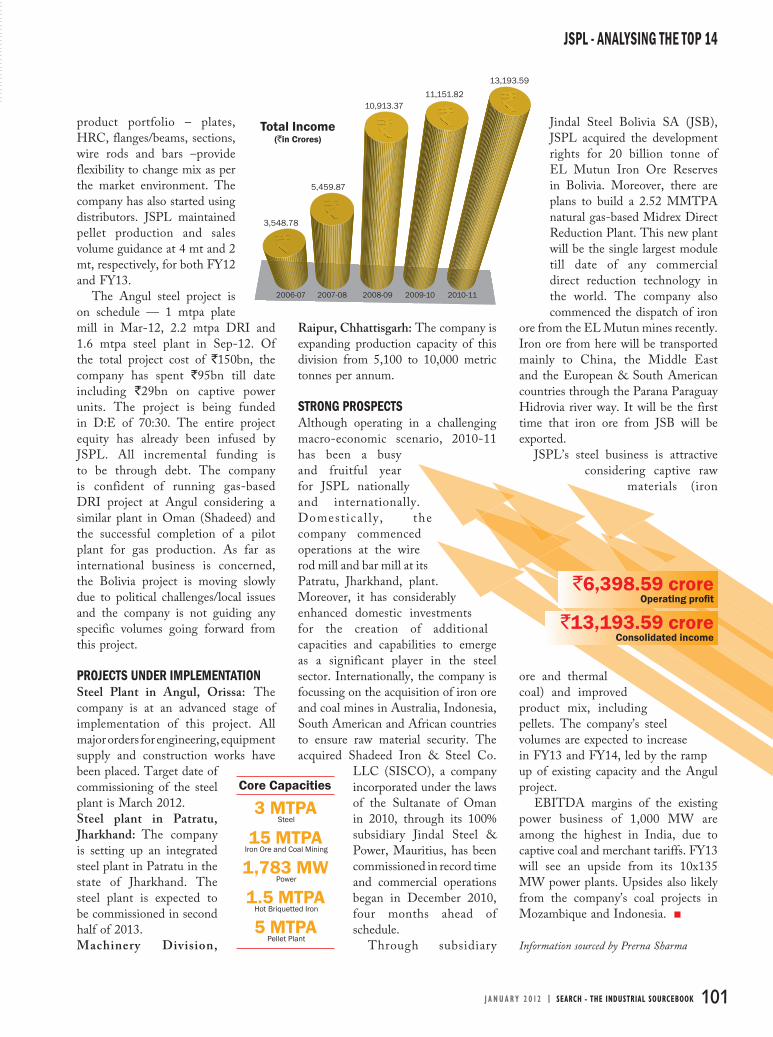
J A N U A R Y 2 0 1 2 | SEARCH - THE INDUSTRIAL SOURCEBOOK 101
JSPL - ANALYSING THE TOP 14
`6,398.59 croreOperating profi t
`13,193.59 croreConsolidated income
3,548.78
5,459.87
10,913.37
Total Income(`in Crores)
2006-07 2007-08 2008-09 2009-10 2010-11
11,151.82
13,193.59
Core Capacities
3 MTPASteel
15 MTPAIron Ore and Coal Mining
1,783 MWPower
1.5 MTPAHot Briquetted Iron
5 MTPAPellet Plant
product portfolio – plates, HRC, flanges/beams, sections, wire rods and bars –provide flexibility to change mix as per the market environment. The company has also started using distributors. JSPL maintained pellet production and sales volume guidance at 4 mt and 2 mt, respectively, for both FY12 and FY13.
The Angul steel project is on schedule — 1 mtpa plate mill in Mar-12, 2.2 mtpa DRI and 1.6 mtpa steel plant in Sep-12. Of the total project cost of `150bn, the company has spent `95bn till date including `29bn on captive power units. The project is being funded in D:E of 70:30. The entire project equity has already been infused by JSPL. All incremental funding is to be through debt. The company is confident of running gas-based DRI project at Angul considering a similar plant in Oman (Shadeed) and the successful completion of a pilot plant for gas production. As far as international business is concerned, the Bolivia project is moving slowly due to political challenges/local issues and the company is not guiding any specific volumes going forward from this project.
PROJECTS UNDER IMPLEMENTATIONSteel Plant in Angul, Orissa: The company is at an advanced stage of implementation of this project. All major orders for engineering, equipment supply and construction works have been placed. Target date of commissioning of the steel plant is March 2012.Steel plant in Patratu, Jharkhand: The company is setting up an integrated steel plant in Patratu in the state of Jharkhand. The steel plant is expected to be commissioned in second half of 2013.Machinery Division,
Raipur, Chhattisgarh: The company is expanding production capacity of this division from 5,100 to 10,000 metric tonnes per annum.
STRONG PROSPECTSAlthough operating in a challenging macro-economic scenario, 2010-11 has been a busy and fruitful year for JSPL nationally and internationally. Domest ica l ly , the company commenced operations at the wire rod mill and bar mill at its Patratu, Jharkhand, plant. Moreover, it has considerably enhanced domestic investments for the creation of additional capacities and capabilities to emerge as a significant player in the steel sector. Internationally, the company is focussing on the acquisition of iron ore and coal mines in Australia, Indonesia, South American and African countries to ensure raw material security. The acquired Shadeed Iron & Steel Co.
LLC (SISCO), a company incorporated under the laws of the Sultanate of Oman in 2010, through its 100% subsidiary Jindal Steel & Power, Mauritius, has been commissioned in record time and commercial operations began in December 2010, four months ahead of schedule.
Through subsidiary
Jindal Steel Bolivia SA (JSB), JSPL acquired the development rights for 20 billion tonne of EL Mutun Iron Ore Reserves in Bolivia. Moreover, there are plans to build a 2.52 MMTPA natural gas-based Midrex Direct Reduction Plant. This new plant will be the single largest module till date of any commercial direct reduction technology in the world. The company also commenced the dispatch of iron
ore from the EL Mutun mines recently. Iron ore from here will be transported mainly to China, the Middle East and the European & South American countries through the Parana Paraguay Hidrovia river way. It will be the first time that iron ore from JSB will be exported.
JSPL’s steel business is attractive considering captive raw
materials (iron
ore and thermal coal) and improved product mix, including pellets. The company’s steel volumes are expected to increase in FY13 and FY14, led by the ramp up of existing capacity and the Angul project.
EBITDA margins of the existing power business of 1,000 MW are among the highest in India, due to captive coal and merchant tariffs. FY13 will see an upside from its 10x135 MW power plants. Upsides also likely from the company’s coal projects in Mozambique and Indonesia.
Information sourced by Prerna Sharma
102 SEARCH - THE INDUSTRIAL SOURCEBOOK | J A N U A R Y 2 0 1 2
GLOSSARY
GLOSSARYBCF Billion Cubic Feet
CAGR Compounded Annual Growth Rate
GRM Gross Refining Margins
EBITDA Earnings Before Interest, Tax, Depreciation & Amortisation
EPS Earnings Per Share
OPM Operating Profit Margin
MCAP Market Capitalisation
MTPA Million Tonne Per Annum
PAT Profit After Tax
PBT Profit Before Tax
PBIT Profit Before Interest & Tax
PBDITA Profit Before Depreciation, Interest, Tax and Amortisation
ROCE Return On Capital Employed
RONW Return On Net Worth
TPA Tonne Per Annum
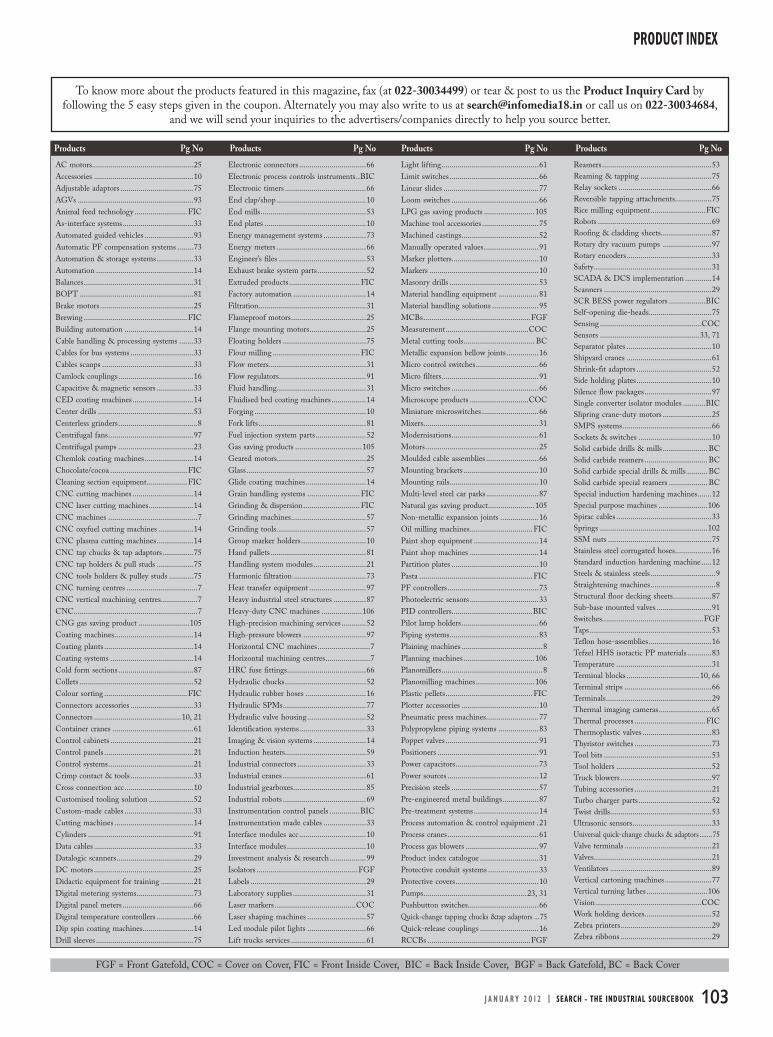
J A N U A R Y 2 0 1 2 | SEARCH - THE INDUSTRIAL SOURCEBOOK 103
PRODUCT INDEX
To know more about the products featured in this magazine, fax (at 022-30034499) or tear & post to us the Product Inquiry Card by following the 5 easy steps given in the coupon. Alternately you may also write to us at [email protected] or call us on 022-30034684,
and we will send your inquiries to the advertisers/companies directly to help you source better.
AC motors..................................................25
Accessories .................................................10
Adjustable adaptors ....................................75
AGVs .........................................................93
Animal feed technology ..........................FIC
As-interface systems ...................................33
Automated guided vehicles ........................93
Automatic PF compensation systems ........73
Automation & storage systems ..................33
Automation ................................................14
Balances ......................................................31
BOPT ........................................................81
Brake motors ..............................................25
Brewing ...................................................FIC
Building automation ..................................14
Cable handling & processing systems .......33
Cables for bus systems ...............................33
Cables scanps .............................................33
Camlock couplings .....................................16
Capacitive & magnetic sensors ..................33
CED coating machines ..............................14
Center drills ...............................................53
Centerless grinders .......................................8
Centrifugal fans ..........................................97
Centrifugal pumps .....................................23
Chemlok coating machines ........................14
Chocolate/cocoa ......................................FIC
Cleaning section equipment ....................FIC
CNC cutting machines ..............................14
CNC laser cutting machines ......................14
CNC machines ............................................7
CNC oxyfuel cutting machines .................14
CNC plasma cutting machines ..................14
CNC tap chucks & tap adaptors ...............75
CNC tap holders & pull studs ..................75
CNC tools holders & pulley studs ............75
CNC turning centres ...................................7
CNC vertical machining centres ..................7
CNC.............................................................7
CNG gas saving product .........................105
Coating machines .......................................14
Coating plants ............................................14
Coating systems .........................................14
Cold form sections .....................................87
Collets ........................................................52
Colour sorting .........................................FIC
Connectors accessories ...............................33
Connectors ...........................................10, 21
Container cranes ........................................61
Control cabinets .........................................21
Control panels ............................................21
Control systems ..........................................21
Crimp contact & tools ...............................33
Cross connection acc ..................................10
Customised tooling solution ......................52
Custom-made cables ..................................33
Cutting machines .......................................14
Cylinders ....................................................91
Data cables .................................................33
Datalogic scanners ......................................29
DC motors .................................................25
Didactic equipment for training ................21
Digital metering systems ............................73
Digital panel meters ...................................66
Digital temperature controllers ..................66
Dip spin coating machines .........................14
Drill sleeves ................................................75
Electronic connectors .................................66
Electronic process controls instruments ..BIC
Electronic timers ........................................66
End clap/shop ............................................10
End mills ....................................................53
End plates ..................................................10
Energy management systems .....................73
Energy meters ............................................66
Engineer’s files ...........................................53
Exhaust brake system parts ........................52
Extruded products ...................................FIC
Factory automation ....................................14
Filtration .....................................................31
Flameproof motors .....................................25
Flange mounting motors ............................25
Floating holders .........................................75
Flour milling ...........................................FIC
Flow meters ................................................31
Flow regulators ...........................................91
Fluid handling ............................................31
Fluidised bed coating machines .................14
Forging .......................................................10
Fork lifts .....................................................81
Fuel injection system parts .........................52
Gas saving products .................................105
Geared motors ............................................25
Glass ...........................................................57
Glide coating machines ..............................14
Grain handling systems ..........................FIC
Grinding & dispersion ............................FIC
Grinding machines .....................................57
Grinding tools ............................................57
Group marker holders ................................10
Hand pallets ...............................................81
Handling system modules ..........................21
Harmonic filtration ....................................73
Heat transfer equipment ............................97
Heavy industrial steel structures ................87
Heavy-duty CNC machines ....................106
High-precision machining services ............52
High-pressure blowers ...............................97
Horizontal CNC machines ..........................7
Horizontal machining centres ......................7
HRC fuse fittings.......................................66
Hydraulic chucks ........................................52
Hydraulic rubber hoses ..............................16
Hydraulic SPMs .........................................77
Hydraulic valve housing .............................52
Identification systems .................................33
Imaging & vision systems ..........................14
Induction heaters ........................................59
Industrial connectors ..................................33
Industrial cranes .........................................61
Industrial gearboxes ....................................85
Industrial robots .........................................69
Instrumentation control panels ...............BIC
Instrumentation made cables .....................33
Interface modules acc .................................10
Interface modules .......................................10
Investment analysis & research ..................99
Isolators ..................................................FGF
Labels .........................................................29
Laboratory supplies ....................................31
Laser markers ........................................COC
Laser shaping machines .............................57
Led module pilot lights .............................66
Lift trucks services .....................................61
Light lifting ................................................61
Limit switches ............................................66
Linear slides ...............................................77
Loom switches ...........................................66
LPG gas saving products .........................105
Machine tool accessories ............................75
Machined castings ......................................52
Manually operated values ...........................91
Marker plotters...........................................10
Markers ......................................................10
Masonry drills ............................................53
Material handling equipment ....................81
Material handling solutions .......................95
MCBs .....................................................FGF
Measurement .........................................COC
Metal cutting tools ................................... BC
Metallic expansion bellow joints ................16
Micro control switches ...............................66
Micro filters ................................................91
Micro switches ...........................................66
Microscope products .............................COC
Miniature microswitches ............................66
Mixers.........................................................31
Modernisations ...........................................61
Motors ........................................................25
Moulded cable assemblies ..........................66
Mounting brackets .....................................10
Mounting rails ............................................10
Multi-level steel car parks ..........................87
Natural gas saving product .......................105
Non-metallic expansion joints ...................16
Oil milling machines ...............................FIC
Paint shop equipment ................................14
Paint shop machines ..................................14
Partition plates ...........................................10
Pasta ........................................................FIC
PF controllers .............................................73
Photoelectric sensors ..................................33
PID controllers........................................BIC
Pilot lamp holders ......................................66
Piping systems ............................................83
Plaining machines ........................................8
Planning machines ...................................106
Planomillers ..................................................8
Planomilling machines .............................106
Plastic pellets ...........................................FIC
Plotter accessories ......................................10
Pneumatic press machines ..........................77
Polypropylene piping systems ....................83
Poppet valves ..............................................91
Positioners ..................................................91
Power capacitors .........................................73
Power sources .............................................12
Precision steels ...........................................57
Pre-engineered metal buildings ..................87
Pre-treatment systems ................................14
Process automation & control equipment .21
Process cranes .............................................61
Process gas blowers ....................................97
Product index catalogue .............................31
Protective conduit systems .........................33
Protective covers .........................................10
Pumps...................................................23, 31
Pushbutton switches ...................................66
Quick-change tapping chucks &tap adaptors ...75
Quick-release couplings .............................16
RCCBs ...................................................FGF
Reamers ......................................................53
Reaming & tapping ...................................75
Relay sockets ..............................................66
Reversible tapping attachments..................75
Rice milling equipment ...........................FIC
Robots ........................................................69
Roofing & cladding sheets .........................87
Rotary dry vacuum pumps ........................97
Rotary encoders ..........................................33
Safety ..........................................................31
SCADA & DCS implementation .............14
Scanners .....................................................29
SCR BESS power regulators ..................BIC
Self-opening die-heads...............................75
Sensing ..................................................COC
Sensors .................................................33, 71
Separator plates ..........................................10
Shipyard cranes ..........................................61
Shrink-fit adaptors .....................................52
Side holding plates .....................................10
Silence flow packages .................................97
Single converter isolator modules ...........BIC
Slipring crane-duty motors ........................25
SMPS systems ............................................66
Sockets & switches ....................................10
Solid carbide drills & mills ...................... BC
Solid carbide reamers ............................... BC
Solid carbide special drills & mills .......... BC
Solid carbide special reamers ................... BC
Special induction hardening machines .......12
Special purpose machines ........................106
Spirac cables ...............................................33
Springs .....................................................102
SSM nuts ...................................................75
Stainless steel corrugated hoses..................16
Standard induction hardening machine .....12
Steels & stainless steels ................................9
Straightening machines ................................8
Structural floor decking sheets ...................87
Sub-base mounted valves ...........................91
Switches..................................................FGF
Taps ............................................................53
Teflon hose-assemblies ...............................16
Tefzel HHS isotactic PP materials ............83
Temperature ...............................................31
Terminal blocks ....................................10, 66
Terminal strips ...........................................66
Terminals ....................................................29
Thermal imaging cameras ..........................65
Thermal processes ...................................FIC
Thermoplastic valves ..................................83
Thyristor switches ......................................73
Tool bits .....................................................53
Tool holders ...............................................52
Truck blowers .............................................97
Tubing accessories ......................................21
Turbo charger parts ....................................52
Twist drills ..................................................53
Ultrasonic sensors .......................................33
Universal quick-change chucks & adaptors .......75
Valve terminals ...........................................21
Valves ..........................................................21
Ventilators ..................................................89
Vertical cartoning machines .......................77
Vertical turning lathes ..............................106
Vision ....................................................COC
Work holding devices .................................52
Zebra printers .............................................29
Zebra ribbons .............................................29
Products Pg No Products Pg No Products Pg No Products Pg No
FGF = Front Gatefold, COC = Cover on Cover, FIC = Front Inside Cover, BIC = Back Inside Cover, BGF = Back Gatefold, BC = Back Cover
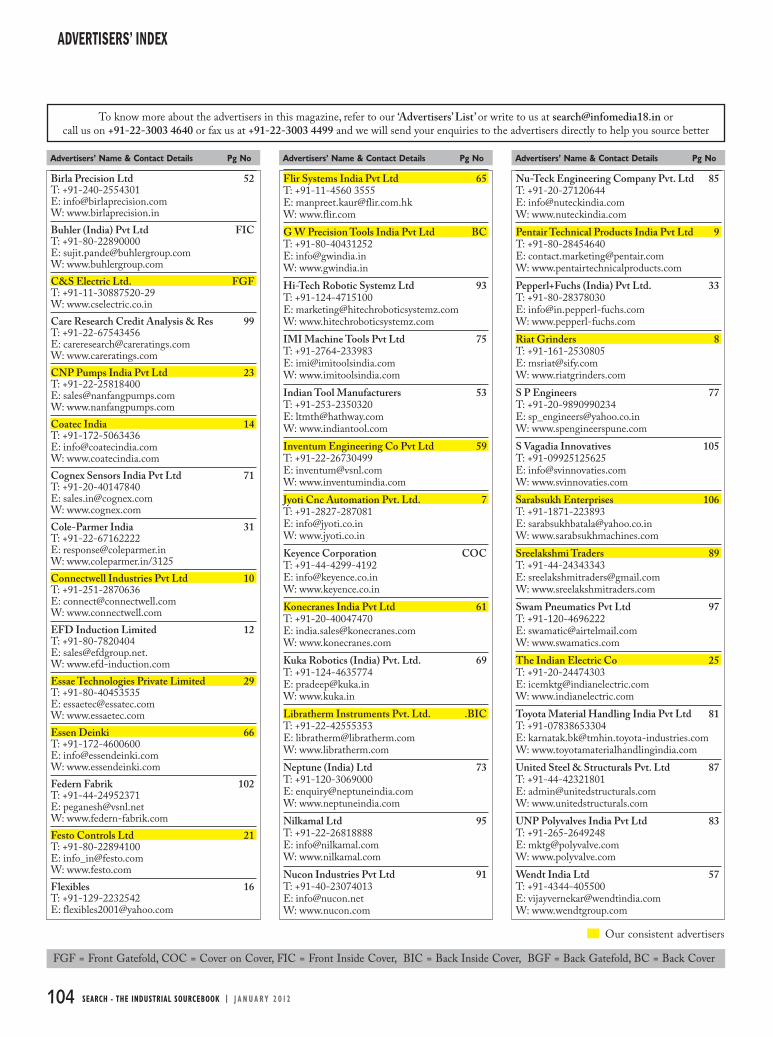
104 SEARCH - THE INDUSTRIAL SOURCEBOOK | J A N U A R Y 2 0 1 2
FGF = Front Gatefold, COC = Cover on Cover, FIC = Front Inside Cover, BIC = Back Inside Cover, BGF = Back Gatefold, BC = Back Cover
Our consistent advertisers
To know more about the advertisers in this magazine, refer to our ‘Advertisers’ List’ or write to us at [email protected] orcall us on +91-22-3003 4640 or fax us at +91-22-3003 4499 and we will send your enquiries to the advertisers directly to help you source better
ADVERTISERS’ INDEX
Flir Systems India Pvt Ltd 65T: +91-11-4560 3555 E: [email protected]: www.flir.com
G W Precision Tools India Pvt Ltd BCT: +91-80-40431252E: [email protected]: www.gwindia.in
Hi-Tech Robotic Systemz Ltd 93T: +91-124-4715100E: [email protected]: www.hitechroboticsystemz.com
IMI Machine Tools Pvt Ltd 75T: +91-2764-233983E: [email protected]: www.imitoolsindia.com
Indian Tool Manufacturers 53T: +91-253-2350320E: [email protected]: www.indiantool.com
Inventum Engineering Co Pvt Ltd 59T: +91-22-26730499E: [email protected]: www.inventumindia.com
Jyoti Cnc Automation Pvt. Ltd. 7T: +91-2827-287081E: [email protected]: www.jyoti.co.in
Keyence Corporation COCT: +91-44-4299-4192E: [email protected]: www.keyence.co.in
Konecranes India Pvt Ltd 61T: +91-20-40047470E: [email protected]: www.konecranes.com
Kuka Robotics (India) Pvt. Ltd. 69T: +91-124-4635774E: [email protected]: www.kuka.in
Libratherm Instruments Pvt. Ltd. .BICT: +91-22-42555353E: [email protected]: www.libratherm.com
Neptune (India) Ltd 73T: +91-120-3069000E: [email protected]: www.neptuneindia.com
Nilkamal Ltd 95T: +91-22-26818888E: [email protected]: www.nilkamal.com
Nucon Industries Pvt Ltd 91T: +91-40-23074013E: [email protected]: www.nucon.com
Birla Precision Ltd 52T: +91-240-2554301E: [email protected]: www.birlaprecision.in
Buhler (India) Pvt Ltd FICT: +91-80-22890000E: [email protected]: www.buhlergroup.com
C&S Electric Ltd. FGFT: +91-11-30887520-29W: www.cselectric.co.in
Care Research Credit Analysis & Res 99T: +91-22-67543456E: [email protected]: www.careratings.com
CNP Pumps India Pvt Ltd 23T: +91-22-25818400E: [email protected]: www.nanfangpumps.com
Coatec India 14T: +91-172-5063436E: [email protected]: www.coatecindia.com
Cognex Sensors India Pvt Ltd 71T: +91-20-40147840E: [email protected]: www.cognex.com
Cole-Parmer India 31T: +91-22-67162222E: [email protected]: www.coleparmer.in/3125
Connectwell Industries Pvt Ltd 10T: +91-251-2870636E: [email protected]: www.connectwell.com
EFD Induction Limited 12T: +91-80-7820404E: [email protected]. W: www.efd-induction.com
Essae Technologies Private Limited 29T: +91-80-40453535E: [email protected]: www.essaetec.com
Essen Deinki 66T: +91-172-4600600E: [email protected]: www.essendeinki.com
Federn Fabrik 102T: +91-44-24952371E: [email protected]: www.federn-fabrik.com
Festo Controls Ltd 21T: +91-80-22894100E: [email protected]: www.festo.com
Flexibles 16T: +91-129-2232542E: [email protected]
Advertisers’ Name & Contact Details Pg No Advertisers’ Name & Contact Details Pg No
Nu-Teck Engineering Company Pvt. Ltd 85T: +91-20-27120644E: [email protected]: www.nuteckindia.com
Pentair Technical Products India Pvt Ltd 9T: +91-80-28454640E: [email protected]: www.pentairtechnicalproducts.com
Pepperl+Fuchs (India) Pvt Ltd. 33T: +91-80-28378030E: [email protected]: www.pepperl-fuchs.com
Riat Grinders 8T: +91-161-2530805E: [email protected]: www.riatgrinders.com
S P Engineers 77T: +91-20-9890990234E: [email protected]: www.spengineerspune.com
S Vagadia Innovatives 105T: +91-09925125625E: [email protected]: www.svinnovaties.com
Sarabsukh Enterprises 106T: +91-1871-223893E: [email protected]: www.sarabsukhmachines.com
Sreelakshmi Traders 89T: +91-44-24343343E: [email protected]: www.sreelakshmitraders.com
Swam Pneumatics Pvt Ltd 97T: +91-120-4696222E: [email protected]: www.swamatics.com
The Indian Electric Co 25T: +91-20-24474303E: [email protected]: www.indianelectric.com
Toyota Material Handling India Pvt Ltd 81T: +91-07838653304E: [email protected]: www.toyotamaterialhandlingindia.com
United Steel & Structurals Pvt. Ltd 87T: +91-44-42321801E: [email protected]: www.unitedstructurals.com
UNP Polyvalves India Pvt Ltd 83T: +91-265-2649248E: [email protected]: www.polyvalve.com
Wendt India Ltd 57T: +91-4344-405500E: [email protected]: www.wendtgroup.com
Advertisers’ Name & Contact Details Pg No

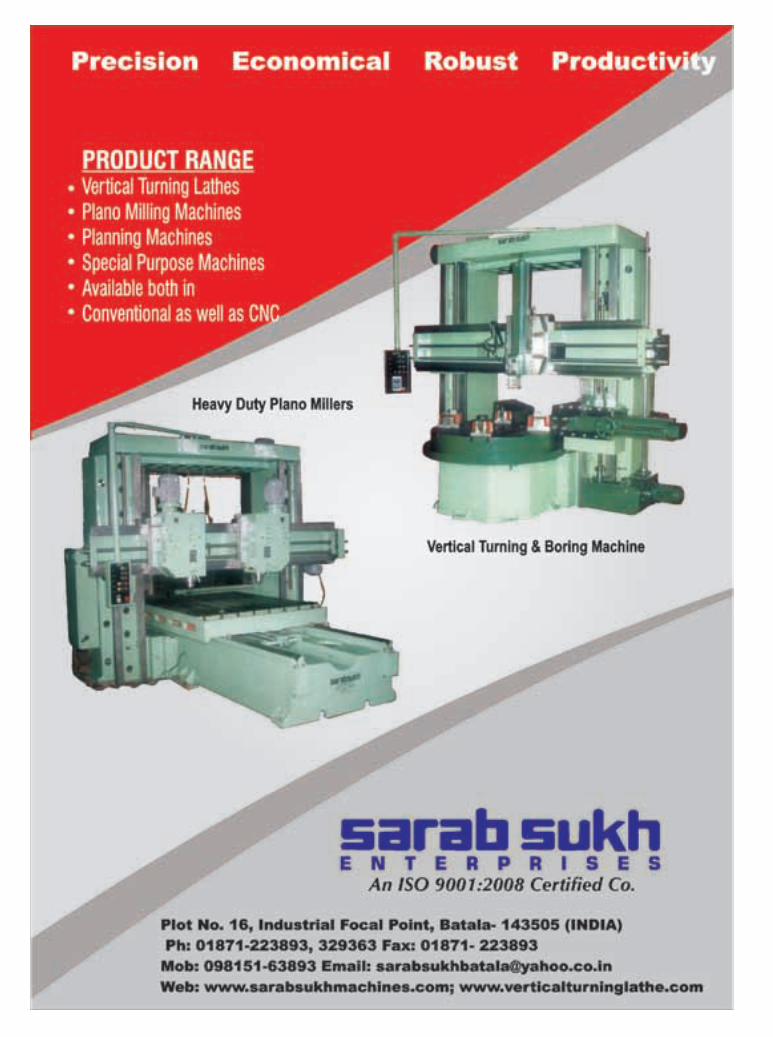

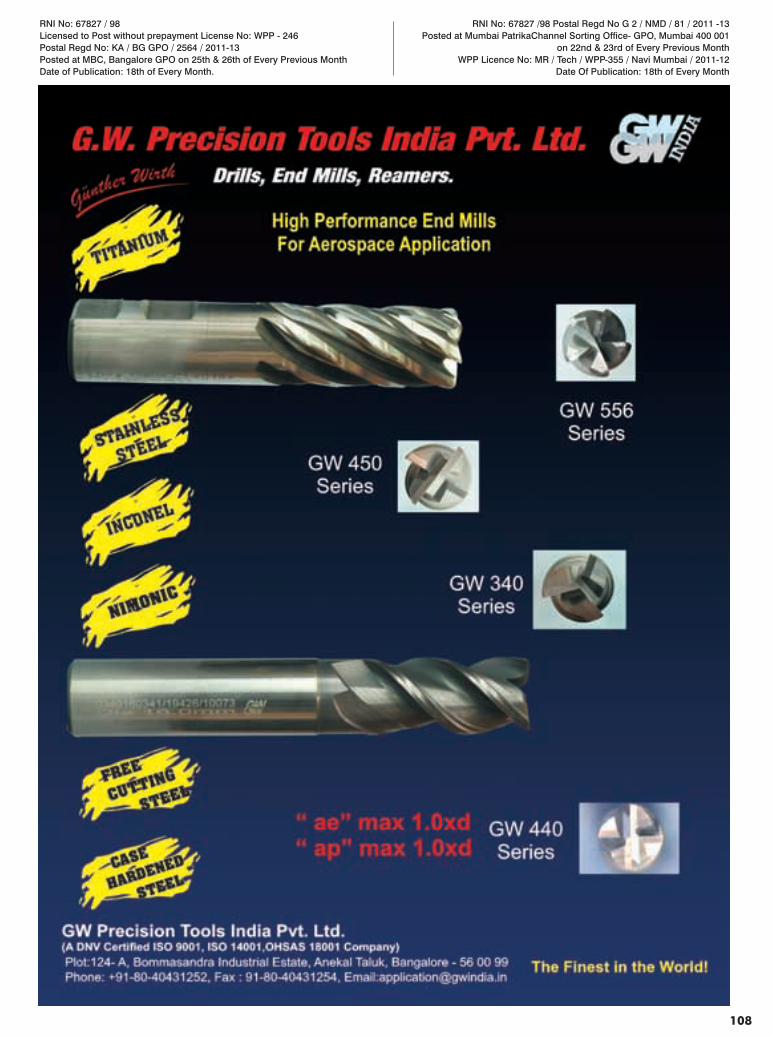
RNI No: 67827 /98 Postal Regd No G 2 / NMD / 81 / 2011 -13Posted at Mumbai PatrikaChannel Sorting Office- GPO, Mumbai 400 001
on 22nd & 23rd of Every Previous Month WPP Licence No: MR / Tech / WPP-355 / Navi Mumbai / 2011-12
Date Of Publication: 18th of Every Month
108
RNI No: 67827 / 98 Licensed to Post without prepayment License No: WPP - 246Postal Regd No: KA / BG GPO / 2564 / 2011-13Posted at MBC, Bangalore GPO on 25th & 26th of Every Previous MonthDate of Publication: 18th of Every Month.
Vo
l 15 No
01
Janu
ary 2012