Insuring Inequality: Sex-Based Mortality Tables and Women's ...

Seaman, Rosie (2017) Total mortality inequality in Scotland: the case for measuring lifespan variation. PhD thesis.
http://theses.gla.ac.uk/8318/
Copyright and moral rights for this work are retained by the author
A copy can be downloaded for personal non-commercial research or study, without prior
permission or charge
This work cannot be reproduced or quoted extensively from without first obtaining
permission in writing from the author
The content must not be changed in any way or sold commercially in any format or
medium without the formal permission of the author
When referring to this work, full bibliographic details including the author, title,
awarding institution and date of the thesis must be given
Enlighten:Theses
http://theses.gla.ac.uk/

Total mortality inequality in Scotland: the case for
measuring lifespan variation
Rosie Seaman, BA (Hons), MPH
Submitted in fulfilment of the requirements for the Degree of Doctor of
Philosophy
College of Social Sciences
University of Glasgow
2016

2
Abstract
Lifespan variation captures variation in age at death within a population as
opposed to the inequality in average health that exists between populations.
Higher lifespan variation equates to greater total inequality and is negatively
correlated with life expectancy. Lifespan variation has not previously been
measured for Scotland, where life expectancy and mortality rates are the worst
in Western Europe. Routinely measuring lifespan variation in Scotland
contributes to understanding the extent, and changing nature, of mortality
inequalities.
Lifespan variation estimates were calculated using data from the Human
Mortality Database and from Census population estimates, vital events data and
the Carstairs Score. Analyses included joinpoint regression, Age-specific
decomposition, Monte Carlo simulation, slope index of inequality, relative index
of inequality, and Age-cause specific decomposition.
Males in Scotland experience the highest level of lifespan variation in Western
Europe, increasing since the 1980s: the longest sustained increasing trend found
in Western Europe. Increasing mortality rates across working adult ages account
for Scotland‘s diverging trend. This age pattern of mortality was not evident in
England and Wales. Lifespan variation for males in the most deprived quintile
was higher in 2011 than in 1981 and the socioeconomic gradient steepened.
Premature deaths from external causes of death accounted for an increasing
proportion of lifespan variation inequalities. Without tackling the root causes of
social inequality Scotland may struggle to reduce total inequality and improve its
lifespan variation ranking within Western Europe.

3
Table of contents
Abstract ......................................................................... 2
Table of contents .............................................................. 3
List of tables .................................................................. 10
List of figures ................................................................. 11
List of Appendices ........................................................... 14
Acknowledgements .......................................................... 15
Author‘s declaration......................................................... 17
Conference presentations .................................................. 18
Peer-reviewed publications ................................................ 20
Abbreviations ................................................................. 21
1 Introduction ............................................................. 22
1.1 Mortality in Scotland .............................................. 22
1.2 Interpretation of lifespan variation in this thesis ............. 23
1.3 Definition of premature mortality in this thesis ............... 24
1.4 Research Questions ................................................ 25
1.5 Thesis structure .................................................... 27
2 Literature review ....................................................... 30
2.1 Literature review outline ......................................... 30
2.2 What is health? ..................................................... 32
2.2.1 Interpretation of health within this thesis ................ 32
2.2.2 Biomedical definition of health ............................. 32
2.2.3 The end of disease and the beginning of health ......... 34
2.2.4 Health as a human right ..................................... 35
2.2.5 A state of equilibrium ........................................ 36
2.2.6 Modelling the determinants of health ..................... 38
2.3 Health inequalities ................................................ 49
2.3.1 Defining health inequalities ................................. 50
2.3.2 Health inequalities or health inequities ................... 53
2.3.3 Theoretical explanations .................................... 55

4
2.4 Conceptual meaning and empirical measurement of health
inequalities ................................................................. 67
2.4.1 Normative judgements and pragmatic challenges ....... 68
2.4.2 Total inequality ............................................... 69
2.4.3 Multiple dimensions of inequality .......................... 72
2.5 Lifespan variation .................................................. 72
2.5.1 Epidemiological transition ................................... 73
2.5.2 International studies of lifespan variation ................ 75
2.5.3 Compression and expansion: maintaining the association
between life expectancy and lifespan variation ................... 77
2.5.4 Motivation for this thesis .................................... 80
2.6 Research gaps ...................................................... 81
2.6.1 Statistically assessing the change in trends ............... 81
2.6.2 Quantifying the impact of age specific mortality change
within Scotland compared to within England and Wales .......... 82
2.6.3 Lifespan variation differences at shared levels of life
expectancy ............................................................... 84
2.6.4 Changes to the socioeconomic gradient for lifespan
variation .................................................................. 86
2.6.5 Age and cause of death contributions to lifespan variation
within socioeconomic groups .......................................... 88
2.7 Literature review summary ....................................... 94
3 Data and methods ...................................................... 96
3.1 Introduction......................................................... 96
3.2 Section 1: Data ..................................................... 99
3.2.1 Human Mortality Database life tables ..................... 99
3.2.2 National Records of Scotland data ........................ 105
3.2.3 Measuring socioeconomic position in Scotland .......... 106
3.2.4 Constructing all-cause mortality life tables .............. 120
3.2.5 Modelling mortality rates at extreme old age ........... 132
3.2.6 Calculating lifespan variation .............................. 143
3.3 Section 2: Statistical tests, measures and methods ......... 146
3.3.1 Joinpoint regression ......................................... 148
3.3.2 Age-specific decomposition ................................ 151

5
3.3.3 Slope index of Inequality and Relative Index of Inequality
153
3.3.4 Monte-Carlo simulations .................................... 155
3.3.5 International Classification of Disease .................... 158
3.3.6 Cause specific mortality rates beyond age 85 ........... 161
3.3.7 Decomposing a difference in lifespan variation by age and
cause of death .......................................................... 162
3.4 Chapter summary ................................................. 163
4 Scotland‘s lifespan variation trend in Western Europe ........... 164
4.1 Introduction........................................................ 164
4.2 Background ........................................................ 166
4.2.1 Life expectancy .............................................. 166
4.2.2 Lifespan variation ............................................ 166
4.2.3 International evidence ...................................... 167
4.2.4 Distribution of age at death ................................ 167
4.2.5 Changing trends in Scotland ................................ 168
4.2.6 The correlation between life expectancy and lifespan
variation ................................................................. 168
4.2.7 Research gaps ................................................ 169
4.3 Data & methods ................................................... 170
4.3.1 Calculate lifespan variation ................................ 172
4.3.2 Joinpoint regression ......................................... 172
4.4 Results .............................................................. 172
4.4.1 Lifespan variation estimates: Scotland‘s annual ranking
within Western Europe ................................................ 172
4.4.2 Joinpoint regression: Scotland ............................. 174
4.4.3 Joinpoint regression: cross-national comparisons ....... 177
4.5 Discussion .......................................................... 185
4.5.1 Summary of results .......................................... 185
4.5.2 Comparison with existing studies .......................... 187
4.5.3 Strengths and limitations ................................... 187
4.5.4 Stage in epidemiological transition ....................... 188
4.5.5 Whole country comparisons ................................ 189
4.5.6 Premature mortality ......................................... 189

6
4.5.7 Research implications ....................................... 191
4.6 Conclusion ......................................................... 191
5 Age decomposition of change in lifespan variation trend over time
193
5.1 Introduction........................................................ 193
5.2 Background ........................................................ 194
5.2.1 Diminishing returns .......................................... 195
5.2.2 Age-specific mortality change in Scotland ............... 196
5.2.3 Research gaps ................................................ 197
5.3 Data and methods ................................................ 198
5.3.1 Five year average mortality rate .......................... 199
5.3.2 Age specific decomposition................................. 199
5.4 Results .............................................................. 200
5.4.1 Estimates of lifespan variation for five year time periods
200
5.4.2 Absolute and relative change between five year time
periods 202
5.4.3 Scotland and England and Wales .......................... 208
5.4.4 Age decomposition of change in lifespan variation ..... 212
5.5 Discussion .......................................................... 223
5.5.1 Summary of results .......................................... 223
5.5.2 Strengths ...................................................... 224
5.5.3 Explanations for Scotland‘s premature mortality problem
226
5.5.4 Lifespan variation independent of life expectancy ..... 227
5.5.5 Research implications ....................................... 228
5.6 Conclusion ......................................................... 229
6 Increasing inequality at shared levels of life expectancy ........ 230
6.1 Introduction........................................................ 230
6.2 Background ........................................................ 231
6.2.1 Research gap ................................................. 234
6.3 Data & methods ................................................... 234
6.4 Results .............................................................. 236

7
6.4.1 The association between life expectancy and lifespan
variation over time .................................................... 236
6.4.2 Death distributions .......................................... 239
6.4.3 Age-specific decomposition ................................ 245
6.5 Discussion .......................................................... 255
6.5.1 Summary of results .......................................... 255
6.5.2 Strengths and limitations ................................... 256
6.5.3 Comparisons with existing studies ......................... 257
6.5.4 Research implications ....................................... 259
6.6 Conclusions ........................................................ 260
7 Changes to the socioeconomic gradient for lifespan variation .. 263
7.1 Introduction........................................................ 263
7.1.1 Chapter outline and research questions .................. 265
7.2 Background ........................................................ 266
7.2.1 Mortality inequalities in Scotland ......................... 267
7.2.2 Socioeconomic gradient in lifespan variation ............ 268
7.2.3 Research gaps ................................................ 270
7.3 Data & methods ................................................... 271
7.3.1 Population estimates and mortality data ................. 271
7.3.2 Predicting mortality rates .................................. 272
7.3.3 Lifetable probabilities ....................................... 272
7.3.4 Slope index and relative index of inequality ............. 272
7.3.5 Monte Carlo simulations .................................... 273
7.4 Results .............................................................. 274
7.4.1 Deprivation gradient ......................................... 277
7.4.2 Change in lifespan variation achieved over time ........ 280
7.4.3 Slope index and relative index of inequality ............. 283
7.4.4 Scotland‘s deteriorating ranking within Western Europe
285
7.5 Discussion .......................................................... 289
7.5.1 Summary of results .......................................... 289
7.5.2 Strengths and limitations ................................... 290
7.5.3 Comparisons with existing studies ......................... 292
7.5.4 Research implications ....................................... 294

8
7.6 Conclusion ......................................................... 296
8 Age and cause specific decomposition of lifespan variation
inequalities .................................................................. 297
8.1 Introduction........................................................ 297
8.2 Background ........................................................ 299
8.2.1 Socioeconomic trends ....................................... 300
8.2.2 Cross-sectional gap .......................................... 300
8.2.3 Gap at comparable level of life expectancy ............. 301
8.2.4 Critical evaluation of lifespan variation scenarios ...... 303
8.2.5 Fluctuating .................................................... 303
8.2.6 Diverging ...................................................... 306
8.2.7 Stalling ........................................................ 307
8.2.8 Research gap ................................................. 309
8.3 Data & methods ................................................... 310
8.3.1 Cause specific mortality rates ............................. 310
8.3.2 Smoothing procedure ........................................ 311
8.3.3 Decomposition analysis ..................................... 312
8.4 Results .............................................................. 313
8.4.1 Change in lifespan variation over time ................... 313
8.4.2 Lifespan variation gap at same time point ............... 322
8.4.3 Lifespan variation gap at a similar level of life expectancy
331
8.5 Discussion .......................................................... 338
8.5.1 Summary of results .......................................... 338
8.5.2 Explanations for premature mortality in Scotland ...... 338
8.5.3 Comparisons with existing studies ......................... 341
8.5.4 Strengths and limitations ................................... 342
8.6 Conclusion ......................................................... 344
9 Discussion and conclusion ............................................ 346
9.1 Novelty of measuring lifespan variation ....................... 346
9.2 Summary of main findings ....................................... 349
9.2.1 Scotland‘s lifespan variation trend within Western Europe
353

9
9.2.2 Age specific mortality change over time in Scotland
distinguishable from age specific mortality change in England and
Wales 354
9.2.3 Increasing inequality in age at death at shared levels of
life expectancy ......................................................... 354
9.2.4 Increasing socioeconomic gradient for lifespan variation
associated with Scotland‘s deteriorating ranking within Western
Europe 358
9.2.5 Ages and causes of death accounting for increasing
socioeconomic inequalities in lifespan variation within Scotland
359
9.2.6 Explanations for Scotland‘s premature mortality problem
362
9.3 Strengths and limitations ........................................ 365
9.3.1 Lifespan variation estimates from complete period life
tables 365
9.3.2 Routine data .................................................. 367
9.3.3 Reflection on the Carstairs score .......................... 368
9.3.4 Excluded deaths .............................................. 369
9.3.5 Predicting mortality rates .................................. 369
9.3.6 Random fluctuations ......................................... 370
9.3.7 Potential for error in cause of death categories ........ 371
9.4 Future research directions ...................................... 372
9.5 Conclusion ......................................................... 375
Appendices ................................................................... 377
References ................................................................... 398

10
List of tables Table 1 Socioeconomic gradient for mortality in Scotland, 2000-2002, Males ... 52
Table 2 comparator countries and years for which complete period life tables
were used for analysis in Chapter 4 ................................................... 101
Table 3 Period life table column definitions ......................................... 103
Table 4 Summary of socioeconomic measures considered for this thesis ........ 108
Table 5 Postcode sector, population size and standard deviation ................ 113
Table 6 Carstairs Score variables (Brown et al., 2014) ..................................... 114
Table 7 Example of calculating Carstairs score, Postcode sector G41 3 (1991) . 116
Table 8 1981 aggregated population estimates and death counts used to
construct deprivation specific life tables ............................................. 122
Table 9 1991 aggregated population estimates and death counts used to
construct deprivation specific life tables ............................................. 123
Table 10 2001 aggregated population estimates and death counts used to
construct deprivation specific life tables ............................................. 124
Table 11 2011 aggregated population estimates and death counts used to
construct deprivation specific life tables ............................................. 125
Table 12 ICD codes assigned to cause of death categories ......................... 160
Table 13 comparator countries and years for which complete period life tables
were used for analysis in Chapter 4 ................................................... 171
Table 14 e† estimates calculated from five year average mortality rate ........ 201
Table 15 e† change over time, Males .................................................. 203
Table 16 e† change over time, Females .............................................. 204
Table 17 Decompositions carried out at shared levels of life expectancy, Males
.............................................................................................. 246
Table 18 Decompositions carried out at shared levels of life expectancy, Females
.............................................................................................. 246
Table 19 Lifespan variation estimates (with 95% CI) by socioeconomic
deprivation, Males ........................................................................ 275
Table 20 Lifespan variation estimates (with 95% CI) by socioeconomic
deprivation, Females .................................................................... 276
Table 21 The socioeconomic gradient for lifespan variation (e†) ................. 284
Table 22 Summary of lifespan variation scenarios describing inequalities between
most and least deprived socioeconomic groups ...................................... 308
Table 23 Aggregate contributions to lifespan variation gap between most and
least deprived quintile, by cause of death, Males ................................... 330
Table 24 Aggregate contributions to lifespan variation gap between most and
least deprived quintile, by cause of death, Females................................ 330

11
List of figures
Figure 1 Epidemiological triad of causal factors adapted from (Bhopal, 2012) ........ 39
Figure 2 The application of the epidemiological triad to the social determinants
of alcohol consumption adapted from (Bhopal, 2012) ..................................... 41
Figure 3 Rainbow model of health (Dahlgren and Whitehead, 1991) ........................... 43
Figure 4 Life course model of allostatic load and material, psychosocial and
behavioural factors (Robertson et al., 2015) ................................................... 46
Figure 5 Life course model: temporal context and lung function (Ben-Shlomo and Kuh,
2002) ........................................................................................... 47
Figure 6 Comparisons of life expectancy trends in UK countries and Sweden (National Records of Scotland, 2014b) ................................................................ 51
Figure 7 Age distributions of mortality, contrasting three countries at different
stages of epidemiological transition (Smits and Monden, 2009) .............................. 76
Figure 8 Summary of research stages ................................................... 97
Figure 9 Summary of data management processes .................................. 127
Figure 10 Log of mortality rate by age and deprivation quintiles (≤84) compared
to HMD (age 0-110+), 1981, males ..................................................... 133
Figure 11 Log of mortality rate by age from HMD (up to age 110+) compared with
fitted linear regression .................................................................. 136
Figure 12 Log mortality rate by age for HMD (up to age 110+) and for deprivation
quintiles (up to age 85+) compared with fitted linear regression (Model 1) ..... 137
Figure 13 Log mortality rate by age for deprivation quintiles (up to age 85+)
compared with fitted linear regression (model 1) and fitted linear regression
controlling for deprivation and including age interaction (model 2) ............. 139
Figure 14 Log mortality rate by age for deprivation quintiles (up to age 85+)
compared with fitted linear regression controlling for deprivation and including
age interaction (model 2) and Poisson regression (model 3a) .................... 140
Figure 15 Mortality rate by deprivation quintile (up to age 85+) compared with
Poisson regression (model 3a) and Poisson regression with Fractional Polynomial
function for age (model 3b)............................................................. 141
Figure 16 Log mortality rate by age for HMD (up to age 110+) comparing fitted
linear regression (model 1), fitted linear regression controlling for deprivation
and including age interaction (model 2), Poisson regression (model 3a), and
Poisson regression with fractional polynomial (model3b) .......................... 142
Figure 17 Summary of research stages ................................................ 147
Figure 18 Joinpoint regression output example ...................................... 150
Figure 19 Lifespan variation estimates and fitted joinpoint regression for
Scotland, Males ........................................................................... 174
Figure 20 Lifespan variation estimates and fitted joinpoint regression for
Scotland, Females ........................................................................ 176

12
Figure 21 Lifespan variation estimates and fitted joinpoint regression for 16
Western European comparator countries, Males ..................................... 178
Figure 22 Lifespan variation estimates and fitted joinpoint regression for 16
Western European comparator countries, Females ................................. 179
Figure 23 Modelled trends for lifespan variation for all 17 Western European
countries grouped by geographical region, Males ................................... 180
Figure 24 Modelled trends for lifespan variation for all 17 Western European
countries grouped by geographical region, Females ................................ 181
Figure 25 Change in lifespan variation trend in Scotland compared to each
Western European country, Males ..................................................... 182
Figure 26 Change in lifespan variation trend in Scotland compared to each
Western European country, Females .................................................. 183
Figure 27 Change in lifespan variation over time, Males ........................... 205
Figure 28 Change in lifespan variation over time, Females ........................ 206
Figure 29 Comparison of death distribution over time in Scotland and in England
and Wales, Males ......................................................................... 209
Figure 30 Comparison of death distribution over time in Scotland and in England
and Wales, Females ...................................................................... 211
Figure 31 Age specific components of total change in lifespan variation between
each five year time period in Scotland (black spikes) compared to in England and
Wales (grey spikes), Males .............................................................. 214
Figure 32 Age specific components of total change in lifespan variation between
each five year time period in Scotland (black spikes) compared to in England and
Wales (grey spikes), Females ........................................................... 215
Figure 33 Age contributions from mortality change between 1950-54 and 1955-59
to total change in lifespan variation, Males .......................................... 216
Figure 34 Contributions from mortality change between 1950-54 and 1955-59 to
total change in lifespan variation, Females .......................................... 218
Figure 35 Contributions from mortality change between 1965-69 and 1970-74 to
total change in lifespan variation, Males ............................................. 219
Figure 36 Contributions from mortality change between 1965-69 and 1970-74 to
total change in lifespan variation, Females .......................................... 220
Figure 37 Contributions from mortality change between 1995-99 and 2000-04 to
change in life expectancy, Males ...................................................... 221
Figure 38 Contributions from mortality change between 1995-99 and 2000-04 to
change in lifespan variation, Females ................................................. 223
Figure 39 Association between life expectancy and lifespan variation, Males .. 237
Figure 40 Association between life expectancy and lifespan variation, Females
.............................................................................................. 238
Figure 41 Comparison of death distributions in Scotland and England and Wales
when shared level of life expectancy achieved, Males ............................. 240
Figure 42 Comparison of death distributions in Scotland and England and Wales
when shared level of life expectancy achieved, Females .......................... 243

13
Figure 43 Age decomposition results at shared level of life expectancy, Males 249
Figure 44 Age decomposition results at shared level of life expectancy, Males 250
Figure 45 Age decomposition results at shared level of life expectancy, Females
.............................................................................................. 251
Figure 46 Age decomposition results at shared level of life expectancy, Females
.............................................................................................. 252
Figure 47 Socioeconomic gradient for lifespan variation, Males .................. 278
Figure 48 Socioeconomic gradient for lifespan variation, Females ............... 279
Figure 49 change in lifespan variation over time by deprivation quintile, Males
.............................................................................................. 281
Figure 50 change in lifespan variation over time by deprivation quintile, Females
.............................................................................................. 282
Figure 51 Comparison of lifespan variation estimates for Western Europe
countries and lifespan variation estimates by socioeconomic deprivation, Males
.............................................................................................. 286
Figure 52 Comparison of lifespan variation estimates for Western Europe
countries and lifespan variation estimates by socioeconomic deprivation,
Females .................................................................................... 287
Figure 53 Lifespan variation trends by socioeconomic deprivation ............... 314
Figure 54 Age distribution of death in 1981 compared to 2011 by socioeconomic
deprivation (Carstairs quintile), Males ................................................ 316
Figure 55 Age distribution of death in 1981 compared to 2011 by socioeconomic
deprivation (Carstairs quintile), Females ............................................. 317
Figure 56 Age and cause specific contributions to change in lifespan variation
between 1981 and 2011, by socioeconomic deprivation, Males ................... 319
Figure 57 Age and cause specific contributions to change in lifespan variation
between 1981 and 2011, by socioeconomic deprivation, Females ................ 320
Figure 58 Age distribution of death comparing most deprived quintile with least
deprived quintile, Males ................................................................. 323
Figure 59 Age distribution of death comparing most deprived quintile with least
deprived quintile, Females ............................................................. 324
Figure 60 Age and cause specific contributions to lifespan variation gap at each
time point, Males ......................................................................... 327
Figure 61 Age and cause specific contributions to lifespan variation gap at each
time point, Females ...................................................................... 328
Figure 62 Trends in lifespan variation by trends in life expectancy, by sex and
socioeconomic deprivation (Carstairs quintile) ...................................... 332
Figure 63 Age distribution of death at shared level of life expectancy, by sex and
socioeconomic deprivation (Carstairs quintile) ...................................... 334
Figure 64 Age and cause specific contributions to lifespan variation gap at shared
level of life expectancy, by sex and socioeconomic deprivation (Carstairs
quintile) .................................................................................... 336
Figure 65 Summary of research stages ................................................ 352

14
List of Appendices
Appendix 1 Pre-copyedited, author-produced PDF of an article accepted for
publication in The European Journal of Public Health following peer review. .. 378
Appendix 2 Pre-copyedited, author-produced PDF of an article accepted for
publication in Social Science and Medicine – Population Health following peer
review. ..................................................................................... 379
Appendix 3 Annual e† estimates for Western European countries 1950-2012 –
males ....................................................................................... 380
Appendix 4 Annual e† estimates for Western European countries 1950-2012 –
females .................................................................................... 383
Appendix 5 Years of significant change in trend (joinpoints) and Annual
Percentage Change (APC) for lifespan variation for each Western European
country, males ............................................................................ 386
Appendix 6 Years of significant change in trend (joinpoints) and Annual
Percentage Change (APC) for lifespan variation for each Western European
country, females ......................................................................... 389
Appendix 7 Full contributions from age 0 only, males (figure 43 and 44 show
contributions truncated to 0.06 years) ................................................ 392
Appendix 8 Full contributions from age 0 only , females (figure 45 and 46 show
contributions truncated to 0.06 years) ................................................ 393
Appendix 9 Age distribution of death (0-110+) by cause of death and Census
year, Males, Least deprived quintile .................................................. 394
Appendix 10 Age distribution of death (0-110+) by cause of death and Census
year, Males, Most deprived quintile ................................................... 395
Appendix 11 Age distribution of death (0-110+) by cause of death and Census
year, Females, Least deprived quintile ............................................... 396
Appendix 12 Age distribution of death (0-110+) by cause of death and Census
year, Females, Most deprived quintile ................................................ 397

15
Acknowledgements
Without a number of people this thesis would not have been possible. I am
extremely appreciative for the guidance provided by my two supervisors, Frank
Popham and Alastair Leyland. It has been a privilege to learn from you, work
with you and share ideas with you. Frank, I am particularly grateful for the level
of enthusiasm you have for research, it is contagious. Alastair, thank you for
having the confidence in my abilities as a statistician but I will always consider
myself to be a sociologist.
Thank you to Michael Green for taking the time to read a draft of this thesis and
for providing such encouraging feedback when it was needed most.
I am grateful to Denise Brown and Mirjam Allik for helping me to navigate the
challenges surrounding the measurement of area level deprivation.
I wish to thank the MRC for funding this PhD and for all of the support that has
been provided from everyone at the MRC/CSO Social and Public Health Sciences
Unit. I am particularly grateful to Helen Sweeting and Katie Buston for
encouraging me to gain the most out of every opportunity that has presented
itself. Thank you to Patricia Fisher, Avril Lague and Fiona McDonald for all of the
help they have provided in the final stages of this process.
I need to acknowledge the staff at NRS for providing me with the data I
required, and for putting up with me during a three month internship.
Thank you to Duncan Gillespie for your early thoughts on this project and to
Alyson van Raalte who was kind enough to share her insights into the data
required for the final chapter of this thesis.

16
I would not have started, let alone finished a PhD, had it not been for the
encouragement of my family. The support my parents have given me has been
above and beyond the call of duty. I hope the sense of pride you feel is worth it
because I will never be able to repay you for all that you have done. Thank you
to my older siblings; one who understands exactly what it takes to complete a
PhD, the other who cannot comprehend sitting in front of a computer screen for
12 hours a day. All of you are an on-going source of inspiration to me but for
very different reasons.
Finally, to all of the friends I have made over the past four years who provided
advice, support and more importantly distraction. Lauren – thanks for running,
spinning, and for helping me to achieve little things I never thought I would, you
have been one of the few sources of sanity in my life over the past year. Susan –
you have been a pillar of strength for me to lean on, thank you for all the times
you have helped me put the world to right and for being an amazing dancer.
Megan – thank you for answering my data questions with a smile and for always
having my best interests in mind, especially during the times I have not. A
special note has to go to Aidan for having the patience to live with me, and for
listening to my problems and pretending to care. Gillian – thank you for being a
much needed source of pragmatic advice, for continuously reminding me to keep
it all in perspective, and for hosting games nights. Jo and Ross – thanks for
always offering me your honest opinions on life with a cup of tea. Thank you to
Ruth for walking me through the PhD and making me laugh a lot along the way.
Nicola and John – thank you for helping me regain a level of self-confidence I
thought I had lost.

17
Author’s declaration
I declare that, except where explicit reference is made to the contribution of
others, that this dissertation is the result of my own work and has not been
submitted for any other degree at the University of Glasgow or any other
Institution.
Rosie Seaman

18
Conference presentations
The following conference presentations were based on analysis from the results
in chapters 4, 5 and 7 of this thesis:
Seaman, R., Leyland, A., & Popham, F. When and why did Scotland
become more unequal than England and Wales? Calculating and
decomposing lifespan variation since 1950. The Lancet, 384, S70. Public
Health Science Conference, Glasgow (2014)
Seaman, R., Leyland, A.H., & Popham, F. How have trends in lifespan
variation changed since 1950? A comparative study of 17 Western
European countries. The European Journal of Public Health, 26, 360-362.
7th European Public Health Conference, Glasgow (2014)
Seaman, R., Leyland, A.H., & Popham, F. OP41 Analysis of routine data
between 1981 and 2001: does socioeconomic deprivation explain high
levels of inequality in age at death within Scotland? Journal of
epidemiology and community health, 69, A26-A26. Society for Social
Medicine, Annual Scientific Meeting, Dublin (2015)
E5: Seaman, R., Leyland, A.H., & Popham, F. The double burden of health
inequality in Scotland: the case for measuring lifespan variation by
socioeconomic deprivation using routine data. The Farr Institute
International Conference, St Andrews (2015)
P7-58: Have Mortality Inequalities Increased in Scotland? The Case for
Measuring Life Expectancy and Lifespan Variation by Socioeconomic

19
Deprivation Using Routine Data. Population Association of America, Annual
Meeting, Washington D.C. (2016)
I declare that the research carried out for these conference presentations was
my own work: co-authors provided editorial advice.

20
Peer-reviewed publications
Some of the findings from chapter 4 and chapter 6 were incorporated into jointly
authored articles that were written and accepted for publication during the
course of this PhD:
Seaman, R., Leyland, A.H., & Popham, F. (2016). How have trends in
lifespan variation changed since 1950? A comparative study of 17 Western
European countries. The European Journal of Public Health, 26, 360-362.
Seaman, R., Leyland, A.H., & Popham, F. (2016). Increasing inequality in
age of death at shared levels of life expectancy: A comparative study of
Scotland and England and Wales. SSM - Population Health, 2, 724-731.
I declare that the research carried out for these publications was my own work:
co-authors provided editorial advice.

21
Abbreviations
HMD: Human Mortality Database
ICD: International Classification of Disease
LGD: Local Government District
NRS: National Records of Scotland
NS-SEC: National Statistics Socio-economic Classification
RGSC: Registrar General‘s Social Class
SAH: Self-Assessed Health
SIMD: Scottish Index of Multiple Deprivation
SYOA: Single Year of Age
WHO: World Health Organisation

22
1 Introduction
1.1 Mortality in Scotland
It is now well established that mortality outcomes in Scotland are relatively poor
within the context of Western Europe: the population of Scotland experience the
highest all-cause mortality rate and are expected to have the shortest lives
(McCartney et al., 2012b, Schofield et al., 2016, Leyland et al., 2007b).
Inequalities in mortality in Scotland, measured between the most and least
deprived socioeconomic groups, have also widened following the 1980s. This was
because the most deprived experienced the highest level of absolute mortality
to begin with and the smallest relative rate of improvement over time (Leyland
et al., 2007a, Leyland et al., 2007b, Norman et al., 2011).
Research has paid particular attention to the widening gap between males of
working age from the most deprived socioeconomic group compared to the least
deprived socioeconomic group. Increasing premature mortality rates for the
most deprived males of working age between 1981 and 2001 were largely due to
deaths from causes that can be categorised as ‗external‘: alcohol, substance
abuse, suicides, accidents and assaults (McCartney et al., 2012a, Walsh et al.,
2016, Schofield et al., 2016, Leyland et al., 2007a). In addition to representing a
tragic loss of potential life, this age pattern of mortality can be considered
counter intuitive: the economic cost of social interventions for reducing
premature adult deaths from external causes tends to be lower than the
economic cost of medical interventions for reducing old age deaths from chronic
diseases (Nau and Firebaugh, 2012, Smits and Monden, 2009).

Chapter 1: Introduction
23
Widening mortality inequalities are not a problem unique to Scotland: they are a
public health concern across many economically developed countries
(Mackenbach et al., 2003, Mackenbach et al., 2016a). Given that most of these
countries have comprehensive social welfare systems and some have
longstanding, formal commitments to reducing mortality inequalities (The
Scottish Government, 2010, Department of Health, 1999, Department of Health,
2013), their persistence over time is deemed to be one of public health‘s
greatest disappointments (Bambra, 2011a, Mackenbach, 2012).
Mortality inequalities are traditionally measured by comparing the difference in
average health status of predefined social groups. However this may not
demonstrate the full extent of the problem. Measuring the average health
difference between socioeconomic groups‘ risks assuming: that a homogenous
gain in health has been achieved for everyone within the same socioeconomic
group, or that health inequalities between individuals within the same
socioeconomic group have stayed constant over time. Recent research attention
has therefore been paid to the notion of total inequality: the variation in a
health outcome that exists between all individuals within a population (Gakidou
and King, 2002, Murray et al., 1999, Harper and Lynch, 2006). Limited research
has applied the concept of total inequality to measure the full extent of
mortality inequalities in Scotland (Popham and Boyle, 2010).
1.2 Interpretation of lifespan variation in this thesis
Lifespan variation is one outcome measure of total inequality: it is interpreted
as the average number of years of life lost per death (van Raalte et al., 2011,
Tuljapurkar, 2010, Shkolnikov et al., 2011) and higher lifespan variation equates

Chapter 1: Introduction
24
to greater inequality in the age at death (Murray et al., 1999, Gakidou and King,
2002, Harper and Lynch, 2006, Smits and Monden, 2009). The data required to
calculate lifespan variation are death counts and population estimates: this data
has a long history of being collected in Scotland (National Records of Scotland,
2016c).
Unlike improvements in life expectancy, which are achieved by reducing
mortality rates at any age, reductions in lifespan variation are age dependent:
mortality rates across premature ages of death must be reduced faster than
mortality rates across older ages (Zhang and Vaupel, 2009, Seligman et al.,
2016). This has led to lifespan variation being referred to as the ultimate
expression of inequality (Smits and Monden, 2009). Lifespan variation in this
thesis is considered to be a valid indicator of a society‘s ability to protect the
most vulnerable members of the population from the social and economic risks
associated with premature death (van Raalte et al., 2011, Smits and Monden,
2009, Seligman et al., 2016).
1.3 Definition of premature mortality in this thesis
In the context of this thesis a death is defined as premature if delaying it to an
older age would contribute to a decrease in lifespan variation. The precise age
which distinguishes premature and older deaths is different in each country and
tends to have increased over time (as life expectancy increases) meaning that a
much wider spread of ages contribute to decreasing lifespan variation relative to
earlier in time (Gillespie et al., 2014, Zhang and Vaupel, 2009). This is one
advantage of defining a death as premature in relation to lifespan variation: it
provides a definition that is specific to the population and temporal context

Chapter 1: Introduction
25
being studied. Zhang and Vaupel (2009) applied advanced methods to determine
exactly what this distinguishing age was in four countries between 1950 and
2005. Gillespie et al. (2014) similarly illustrated how shifts to threshold age and
the widening spread of ages being defined as premature have impacted the
correlation between life expectancy and lifespan variation. Although this thesis
does not apply the advanced methods required to establish the precise
distinguishing age the same technical definition derived from lifespan variation
is still applicable: a death is considered premature if delaying it to an older age
would have contributed to decreasing lifespan variation. Throughout the analysis
chapters specific age groups are referred to when describing the results in order
to aid interpretation.
1.4 Research Questions
The primary aim of this thesis was to measure, analyse and interpret lifespan
variation, a measure of total inequality, for Scotland. Twelve research questions
were developed to address this overarching aim. They are not mutually
exclusive, answering each individual research question helped to inform the
others. The 12 research questions, and the chapters which they are answered in,
are listed below:
Chapter 4
1. Has Scotland‘s lifespan variation ranking within Western Europe changed
over time?
2. Was the timing and relative rate of lifespan variation change in Scotland
comparable with any other Western European country?

Chapter 1: Introduction
26
Chapter 5
3. Which ages of death contributed to the lifespan variation trend in
Scotland?
4. Did the ages of death contributing to the lifespan variation trend in
Scotland differ from the ages of death contributing to the lifespan
variation trend in England and Wales?
Chapter 6
5. Was lifespan variation higher or lower in Scotland at a shared level of life
expectancy with England and Wales?
6. Which ages of death account for the lifespan variation gap between
Scotland and England and Wales at a shared level of life expectancy?
Chapter 7
7. Is there a socioeconomic gradient for lifespan variation in Scotland?
8. Has the socioeconomic gradient for lifespan variation in Scotland changed
over time?
9. Are changes to the socioeconomic gradient for lifespan variation in
Scotland related to Scotland‘s deteriorating lifespan variation ranking
within Western Europe over time?
Chapter 8
10. Which ages and causes of death contributed to changes in lifespan
variation, over time, for different socioeconomic groups in Scotland?

Chapter 1: Introduction
27
11. Which ages and causes of death contributed to the lifespan variation gap
between the most and least deprived socioeconomic groups in Scotland?
12. Which ages and causes of death contributed to the lifespan variation gap
between the most and least deprived socioeconomic groups, when life
expectancy was similar, in Scotland?
1.5 Thesis structure
Chapter 2 provides an overview of the literature that relates to health, mortality
inequalities and their empirical measurement. It highlights the empirical
evidence that has sought to explain Scotland‘s relatively worse mortality
experience within the context of Western Europe and in contrast to England and
Wales, its closest geographical comparator. It also focuses on the international
studies which have started to conceptualise and analyse mortality inequalities in
terms of lifespan variation.
Chapter 3 outlines the data used and methods of analysis applied to understand
lifespan variation inequalities in Scotland, including reflections on the strengths
and limitations.
Chapters 4 to 8 report the results of the analysis carried out. Each of these
chapters begins with a brief background section and summarises the relevant
data sources and methods of analysis. Each of these chapters concludes by
reflecting on the research implications in terms of this thesis and beyond.
Chapter 4 quantifies the population level lifespan variation trend in Scotland
compared to 16 other comparable Western European countries using lifetables
obtained from the Human Mortality Database.

Chapter 1: Introduction
28
Chapter 5 continues to focus on the population level lifespan variation trend in
Scotland using the same data. It identifies the age patterns of mortality driving
the lifespan variation trend within Scotland and within England and Wales in
order to determine if any age patterns of mortality change in Scotland were
distinguishable.
Chapter 6 extends the analysis of the population level trend in Scotland
compared to England and Wales by measuring the lifespan variation gap at
similar levels of life expectancy, albeit it at different points in chronological
time. This allows lifespan variation to be studied independently of life
expectancy.
Chapter 7 begins the process of analysing lifespan variation inequalities between
socioeconomic groups in Scotland in order to demonstrate that measures of total
inequality still adequately reflect inequities rather than just random variation. It
uses population estimates derived from the Census in 1981, 1991, 2001 and 2011
and relevant all-cause mortality data. It quantifies changes to the socioeconomic
gradient for lifespan variation and considers these changes within the context of
Scotland‘s deteriorating ranking relative to the rest of Western Europe.
Chapter 8 uses the Census population estimates and the relevant cause-specific
mortality data in order to quantify the age-cause specific contributions made to
lifespan variation inequalities in Scotland. This helps build a fuller picture of
what has driven total inequality in Scotland: evidence seeking to understand the
determinants of widening mortality gaps in one country is likely to be of interest
to other countries looking to ensure improvements in average population health
are achieved alongside reductions in inequality. Lifespan variation inequalities

Chapter 1: Introduction
29
between socioeconomic groups are measured in terms of the lifespan variation
change achieved over time by the most deprived compared to the lifespan
variation change achieved over time by least deprived, the lifespan variation gap
between the most and least deprived group at the same chronological time, and
the lifespan variation gap between the most and least deprived group at a
similar level of life expectancy.
Chapter 9 provides a summary of the main findings and the contributions these
make to the existing body of literature. It considers some of the strengths and
limitations of this thesis and highlights some areas that could benefit from
further research.

30
2 Literature review
The purpose of this literature review was to explore some of the theoretical
debates that have informed our understanding of health and health inequalities.
It summarises the multiple interpretations of health inequalities and multiple
measurements used in empirical research. This provides a foundation for linking
the thesis findings into internationally relevant debates surrounding health
inequalities and their empirical measurement. The literature review establishes
which theoretical explanations might be most relevant for health inequalities in
Scotland and identifies lifespan variation as a measure which might further our
understanding of health inequalities in this context. Theories emphasising the
structural determinants of health and recognising that relative deprivation could
impact health via psychosocial and materialist mechanisms are highlighted as
the most relevant for Scotland. These theories are then utilised throughout the
empirical analysis chapters of this thesis. The literature review has four main
sections.
2.1 Literature review outline
Section one (What is health?) attempts to compare and contrast different
concepts of health, how it is defined and how the determinants are understood.
This demonstrates the ambiguity of the meaning of health. It is important to
outline definitions of health before discussing health inequalities.
Section two (Health inequalities) describes existing definitions of health
inequalities. The distinction between health and health inequalities in this
literature review aims to demonstrate that the determinants of population

Chapter 2: Literature review
31
health and the determinants of health inequalities may not necessarily be the
same: the greatest gains in average population health may not always reduce
inequalities.
Section three (empirical measurement of health inequalities) then outlines some
of the theoretical explanations for the persistence and widening of health
inequalities in economically developed societies. The theoretical explanations
that are critically evaluated are those which have evolved from the Black report:
artefact, health selection, social sorting, cultural and behavioural, materialist
and structural, fundamental causes, psychosocial, and neo-materialist. The
Black report was published in 1980 by the Department of Health and Social
Security in the UK. It was produced by the working group on inequalities in
health.
Section three ends with a critical evaluation of the traditional, rarely contested,
concept of measuring health inequalities as differences in average health
between socioeconomic groups. It highlights the theoretical and empirical
limitations a traditional approach has for comparative research. It shows that
applying a total inequality concept can help to overcome these limitations and
can provide new insight into the changing nature of health inequalities. Lifespan
variation is identified as one empirical measure which reflects the theoretical
principles of total inequality.
Section four (Lifespan variation) summarises the existing studies which have
used lifespan variation to measure health inequalities. Lifespan variation seeks
to reflect the level of inequality in age at death that individuals and populations
face, lower lifespan variation suggest less variability in age at death and lower

Chapter 2: Literature review
32
total inequality: individuals in the population are tending to die around a similar
age. Although lifespan variation has been widely utilised in comparative studies
few have explicitly studied this dimension of inequality in Scotland.
2.2 What is health?
In this first section I discuss different definitions of health. I begin by discussing
how notions of health have evolved from biomedical and absolute
interpretations to conceptualising health as a subjective state which has
multiple determinants beyond the mechanisms that exist within the human
body.
2.2.1 Interpretation of health within this thesis
The descriptions of health discussed in this literature review provide a basis for
this thesis in the following ways. Firstly it shows that although a large body of
research studying health exists there remains a lot that is unknown. Secondly it
aims to demonstrate that health is a complex concept and that its determinants
interact in a number of ways. This could suggest that the use of mortality data
to capture health within this thesis may be inadequate. However, when the
results examining health inequalities in Scotland are presented it will be evident
that mortality is a valuable proxy for health: death data are being used within
this thesis in order to operationalise a measure, a measure that reflects a
complex social phenomenon as opposed to an isolated medically defined event.
2.2.2 Biomedical definition of health
The earliest notions of health saw it as the ‗absence of physical disease or
impairment‘ (Godlee, 2011). This definition reflects the biomedical discourse
which Smith (2008) suggests is explicitly concerned with disease rather than

Chapter 2: Literature review
33
health. It is associated with the desire to uncover the aetiology of diseases
within the human body and aims to make a distinction between sick individuals
and healthy individuals (Rose, 2001).
A biomedical model is concerned with the problems of individuals and suggests
that ill health is something which needs to be cured. Understanding health
within this disease centred framework ensures that the focus is on the
remediable aspects of illness and, in a clinical setting, aims to return individuals
to the desirable disease-free state as soon as possible (Naidoo and Wills, 2015).
However, the biomedical model is a heavily criticised concept. This is because a
disease centred approach does not account for what health means in the
absence of disease or in the absence of a formal medical diagnosis (Yuill, 2010).
Focusing on the absence of something that is objectively defined (e.g. a clinical
diagnosis) frames health as what it is not, as opposed to what health is when it is
interpreted subjectively (Barry and Yuill, 2012). For example individuals with
objectively diagnosed diseases may never feel sick whilst individuals free from
disease may experience feelings of sickness. It is important for concepts of
health to focus on the protective factors that ensure good health, as opposed to
focusing only on the risk factors that make individuals ill (Dahlgren and
Whitehead, 2006). Therefore it is argued that a biomedical definition has limited
scope because it focuses on health in negative and absolute terms and overlooks
the broader determinants of health beyond medical care (Naidoo and Wills,
2015). In pragmatic terms, empirical research also regularly uses measures of
health that are independent of clinical diagnosis (Kind et al., 1998).

Chapter 2: Literature review
34
2.2.3 The end of disease and the beginning of health
A more inclusive definition of health was constructed by the World Health
Organisation (WHO). It aimed to communicate the notion that health is more
than illness and disease, and is shaped by more than biological mechanisms and
healthcare (Nettleton, 2006, Yuill, 2010). It defined health as a ‗state of
complete physical, mental and social well-being‘ (World Health Organisation,
1948). Alongside this definition the WHO proposed that the ability for all
individuals to achieve well-being should be a consideration for all policies:
responsibility for health should be shared between healthcare professionals and
governments, policy makers and citizens themselves. The WHO definition is also
valued for distancing the notion of health from only the negative concept of
disease by incorporating ‗well-being‘, a positive attribute of health (Barry and
Yuill, 2012).
However the WHO definition has been the subject of some criticism because it
continues to understand health as an absolute achievement rather than
something which is relative. This critique is valid as meanings and expectations
of health are dependent on beliefs and socio-political and cultural contexts. The
attributes that are deemed to represent health in one society can easily be
deemed to be unhealthy in another. Studies have also highlighted that individual
interpretations of health vary across societies and across time in relation to the
same clinical symptoms (Mitchell, 2005).
In fact, Smith (2008) suggests health is nothing more than an illusion. It is highly
likely that everyone would be found to be diseased – either in terms of their
physical health, mental health or social wellbeing – given that there are

Chapter 2: Literature review
35
thousands of diseases recorded and catalogued. This has prompted many to
highlight that any notion of health as an absolute state will be unattainable for
all of the population, all of the time (Godlee, 2011, Jadad and O‘Grady, 2008).
Rather very few would be found to be in a complete state of health as it is a
social construct and cannot be understood or defined in absolute terms. In
response many have advocated that health be conceptualised as a resource
required for living rather than an aspirational end goal or a prescribed state of
being that can be achieved (Kälin et al., 2004, Susser, 1993). This principle
underpins the notion that health should be considered a basic human right.
2.2.4 Health as a human right
Health as a human right is another perspective which emphasises that the
responsibility for health falls upon societies not healthcare institutions (Arcaya
et al., 2015). Health as a human right can historically be linked to the argument
that health should be framed as having ‗great social and political value‘ which
first emerged during the industrial revolution. Some of the earliest advocates of
health as central to social development were, however, motivated by a
utilitarian philosophy, not by the desire to improve health for health‘s sake
(Susser, 1993). Asada (2005) further adds that the concept of health as a human
right has previously been undermined because the dominant assumption has
been that the ethics of health should only be concerned with individual patient-
practitioner relations as opposed to population level dynamics.
Despite the contested origins of conceptualising health as a human right,
societies have evolved to a perspective which attaches a higher value to health
above the mere application of healthcare (Susser, 1993, Arcaya et al., 2015).

Chapter 2: Literature review
36
Proponents of health as a human right argue that health is essentially an ethical
issue because the course of human development can be altered by decision
makers (World Health Organization, 1998). This was strongly evidenced in United
Nations, article 25 which formalised health as a human right in 1948 by stating
that:
―Everyone has the right to a standard of living adequate for the health and well-
being of himself and his family‖ (United Nations, 10 December 1948).
However this definition does not explicitly frame health as a human right but
instead frames it in relation to the ‗standard of living‘. This perhaps reflects the
ideological contention between the chain of causation of health: whether ill
health causes poverty or whether poverty causes ill health (Susser, 1993).
It took until 1984 for the WHO to incorporate the notion of health as a human
right when it argued that:
―Health is the extent to which an individual is able, on the one hand, to realise
aspirations and satisfy needs: and on the other hand, to cope with the
environment. Health is, therefore, seen as a resource for everyday life, not an
object of living; it is a positive concept emphasising social and personal
resources as well as physical capacities‖ (World Health Organization, 1984).
This revised WHO definition no longer sees health as a final outcome but as a
requirement for living.
2.2.5 A state of equilibrium
Current debates surrounding the concept of health therefore propose that it is
not a finite state but a state of balance individuals achieve within themselves,

Chapter 2: Literature review
37
and between themselves and their social and physical environment. Jadad and
O‘Grady (2008) propose that health should be defined as ‗the ability to adapt
and self-manage‘ and argue that health is something which exists in both the
absence and presence of disease or impairment (Sartorius, 2006). Susser (1993)
adds that understanding health as a human right seeks to reflect the notion that
‗it is not a given, immutable fate‘. This perspective allows for subjective
interpretations of health and recognises that experiences of health vary every
day.
Rather than understanding health as the absence of disease which is treated by
medical intervention, framing health in these terms proposes that health be
understood as a social necessity rather than an aspiration. Furthermore there is
a conscious attempt to communicate the fact that healthcare is not the primary
determinant of health: rather it sees health as having a relationship with
multiple causes beyond biomedical mechanisms and structures (Naidoo and
Wills, 2015). These causes include the physical and social environment alongside
lifestyle and biological factors, which have been termed the social determinants
of health.
Despite the evolution of concepts surrounding health a consensus has not yet
been reached. Instead it is argued that opposing definitions of health should not
be seen as mutually exclusive but rather used to demonstrate that
understandings of health differ across contexts, time, situations and societies
(Naidoo and Wills, 2015, Mitchell, 2005). These debates further emphasise the
important distinction that needs to be made between the clinical care of
individuals and public health of populations (Susser, 1993, Rose, 2001). Beckfield

Chapter 2: Literature review
38
and Krieger (2009) add that eco-social theories of health emphasise that the
health status of a population is not fixed but is contingent upon societal,
historical and ecological contexts.
Somewhat parallel to these evolving concepts of health are complex models
seeking to identify the causes of health. These models go beyond biomedical
cause and effect between vector-borne infections and disease outcomes. They
are generally referred to as socioecological models.
Socioecological models are based on the theoretical principle that there is no
single factor which can explain health: it is the outcome of interactions between
many factors. They attempt to understand the ways in which societal conditions
become embodied by populations. The following section will discuss three of
these models: the epidemiological triad, the rainbow of determinants, and a life
course model.
2.2.6 Modelling the determinants of health
Socioecological models seek to capture the hierarchy of social structures and the
elements within systems that may influence health. Similarly to a doctor
questioning a patient about their symptoms, family history and health
behaviours when seeking to provide a medical diagnosis, these models question
what aspects of our social and physical environment, and our responses to them,
cause the patterning of health and disease. Models of causation aim to organise
ideas and inform strategies for health promotion, health prevention or control of
diseases (Bhopal, 2012). Dahlgren and Whitehead (2006) argue that
socioecological models of health help to understand the root causes of health
which are necessary if effective policies are to be formulated.

Chapter 2: Literature review
39
2.2.6.1 Epidemiological triad of causal factors
The most basic attempt at capturing the relationship between health and its
wider determinants is the epidemiological triad of causal factors. The main idea
underpinning this model, and many other models, is that health is a consequence
of the interactions between the environment, the genetic or physical
characteristics of the individual and the agent of disease (Bhopal, 2012). The
aim of the triad was to communicate the notion of balance: all three elements
need to be assessed to fully understand the causes of health in general, or the
causes of a specific disease outcome. Figure 1 is a visual representations of the
triad.
Figure 1 Epidemiological triad of causal factors adapted from (Bhopal, 2012)

Chapter 2: Literature review
40
The agent usually refers to the biological pathogen that must be present for the
disease to occur, however its presence alone may not result in the disease
outcome.
The host element highlights the risk factors that may make an individual more
susceptible to the disease outcome.
The environment captures the elements which allow the opportunity for
exposure to present itself or the environment which brings the host and agent
together.
Although initially constructed to understand infectious disease, it is applicable
when thinking about the determinants of non-communicable diseases. This is
because it aims to identify the what (agent), who (host) and where
(environment) of a specific health outcome.
Under this model ill health occurs because of an interaction between the agent
and the vulnerable host within an enabling environment (Teutsch and Churchill,
2000). This concept was originally focused on infectious diseases such as the
transmission of malaria (agent) from a mosquito (vector) to a human (host)
(Centers for Disease Control and Prevention, 2012). However Bhopal (2012) gives
the example of tuberculosis to demonstrate the wider application of the triangle
model. Although tuberculosis has a single cause by definition, the tubercle
bacillus, it has multiple determinants such as poor housing conditions
(environment) or age (individual characteristic).Therefore over time the notion
of what constitutes an agent has changed to include social, environmental and
physical causes of diseases.

Chapter 2: Literature review
41
The application of the epidemiological triad to the social determinants is also
possible. For example alcohol can be considered an agent of disease and injury
(Bhopal, 2012). This is demonstrated in figure 2.
Figure 2 The application of the epidemiological triad to the social determinants of alcohol
consumption adapted from (Bhopal, 2012)
Excessive alcohol consumption can cause liver cirrhosis and the manufacturing,
distribution and marketing of alcohol are the vectors which bring together the
agent (alcohol) and the host (the population) if the (social) environment enables
it. Mapping the causes of liver cirrhosis in this framework can help identify
different points of entry for public health policies seeking to reduce liver
cirrhosis. For example minimum unit alcohol pricing is a legislative intervention
for modifying the consumption of alcohol. It is a response to the evidence
showing that alcohol harm amongst a population is related to the dose people

Chapter 2: Literature review
42
consume and the dose consumed is determined by price (Wagenaar et al., 2009).
Minimum unit pricing aims to improve the social environment surrounding
alcohol consumption via price regulation (Brennan et al., 2014, Purshouse et al.)
in order to alter the link between the host (the population) and the agent
(alcohol).
The epidemiological triad, although somewhat simplistic, successfully represents
the different dimensions which influence health and attempts to untangle multi-
dimensional relationships (Susser and Stein, 2009). However it is limited when
trying to understand agents that may cause multiple health outcomes or health
outcomes that have multiple causes rather than one cause. Bhopal (2012) adds
that it is not always possible to conceptualise the cause of a disease as an agent
and that the relationships between the host, agent and environment are rarely
understood.
In response more advanced socioecological models continue to conceptualise the
‗who‘, ‗what‘ and ‗where‘ of health but elaborate on the interacting
relationships. One of the most widely recognised models to do this was the
rainbow model of health introduced by Dahlgren and Whitehead (1991) shown in
figure 3.

Chapter 2: Literature review
43
2.2.6.2 The rainbow of social determinants
Figure 3 Rainbow model of health (Dahlgren and Whitehead, 1991)
Dahlgren and Whitehead (2006) state that the layers of the model should be
interpreted as the main general determinants of health. At the centre are the
characteristics individuals possess that can influence their health but are
considered to be fixed when looking at one point in time, for example age and
sex. Encompassing these are the interactions which, in theory, are modifiable by
policy or public health interventions.
Individual lifestyle factors, such as exercise or smoking, are the positive and
negative lifestyle factors which link with health outcomes.
Social and community networks may have an encouraging or discouraging
influence on lifestyle factors.

Chapter 2: Literature review
44
Elements of living and working conditions can determine an individual‘s ability
to maintain their own health.
Dominant economic, cultural and environmental circumstances exist in a
given society and at a given point in time.
Dahlgren and Whitehead (2006) intended the model to be used to highlight the
notion that the different layers are embedded and interact with one another.
They argue that these layers can be influenced by the decisions made by
individuals themselves but also by the decisions made by commercial or political
stakeholders in society.
These decisions can impact on health by: influencing positive health factors,
increasing protective factors, or reducing risk factors. Making a distinction
between these three groups of determinants can be challenging. In general
positive health factors are those which contribute to the maintenance of health
such as economic or social security or emotionally beneficial relationships and
control. Protective health factors are those which eliminate a risk. This could
include immunisation programmes, the promotion of healthy eating or social
support which encourages psychosocial health. Finally risk factors are the
preventable causes of disease such as the physical, social and economic
conditions which are detrimental to health. For example, the risk of poverty
that may result from unemployment is a risk factor that is not inevitable as it
can be mediated by social protection policies (Bambra, 2011c).
The rainbow model attempts to communicate the relationship between the
social elements and physical or biological manifestations of health at a
population level rather than at an individual level. It is powerful for mapping the

Chapter 2: Literature review
45
social determinants of health for specific populations at a given time. Its
weakness is that it provides little insight into how health evolves over periods of
time, how it is patterned over generations or how it is shaped by experiences at
the earliest stages of life (Reid, 2009, Ben-Shlomo and Kuh, 2002).
2.2.6.3 Life course model of health
Much like the rainbow model a life course model provides insight in to biological,
material, behavioural and psychosocial pathways (Ben-Shlomo and Kuh, 2002).
However a life course model sees the biological characteristics of health as
markers of an individual‘s past social position (Blane, 1999). It is concerned with
the long-term effects of physical and social exposures that occur across the life
course: before conception, gestation and childhood to adolescence, young
adulthood and old age (Ben-Shlomo and Kuh, 2002). For example Barker and
Martyn (1992) demonstrated that low birth weight was associated with coronary
heart disease in adulthood. Framing this study within a life course context
enabled the authors to argue that inadequate foetal nutrition may be an
important risk factor for CHD like traditional adult risk factors such as smoking.
Ben-Shlomo and Kuh (2002) argue that research risks misinterpreting a life
course model as merely the collection of exposure data across the life course
when it should be applied to explicitly understand the temporal ordering of
exposures and the interactions among exposures. It emphasises the importance
of accumulation of advantage or disadvantage across the life and seeks to
understand the social processes that aggravate or mediate the negative effects
on health (Blane, 1999).

Chapter 2: Literature review
46
A life course model therefore provides a different approach for understanding
where relationships between later life health outcomes and risk factors stem
from. Figure 4 is one attempt for communicating that material, psychosocial and
behavioural factors are mediating pathways linking social deprivation and
health.
Figure 4 Life course model of allostatic load and material, psychosocial and behavioural factors
(Robertson et al., 2015)
Ben-Shlomo and Kuh (2002) argue that the diagrammatical representation of
variables over the life course should explicitly state the temporal ordering of
exposures and their inter-relationships. This is the approach shown in figure 5
using the example of lung function. Although it captures the temporal ordering
of factors specifically influencing lung function it has general applications for

Chapter 2: Literature review
47
understanding the principles considered in epidemiological research which
adopts a life course approach.
Figure 5 Life course model: temporal context and lung function (Ben-Shlomo and Kuh, 2002)
Figure 5 identifies four pathways:
(1) Biological pathways suggesting limited foetal growth is associated with
decreased lung development, which over time causes respiratory problems later
in life

Chapter 2: Literature review
48
(2) Social pathways that increase exposures which are detrimental for adulthood
social circumstances such as high childhood deprivation being associated with
lower educational attainment that has implications for future income or
occupational opportunities
(3) Sociobiological pathways capturing the relationship between the social
exposures that impact biological factors. For example high maternal deprivation
may impact lung development in utero, lung function in childhood due to
environmental exposures and adult function
(4) Biosocial pathways suggest that biological factors can have a detrimental
impact on social processes. For example decreased lung function is associated
with increased risk of childhood infections and lower education attainment as a
consequence of school absence. Over the life course lower education attainment
limits employment opportunities and individuals are more likely to be exposed to
hazardous working condition. These hazardous conditions may be physical,
environmental and or psychosocial.
Ben-Shlomo and Kuh (2002) recognise that this interpretation of the life course
model is some-what crude. However it aims to highlight that distinguishing
between social and biological pathways can be arbitrary and that both require
attention to understand the causes of health.
The overview of competing concepts of health and models of the determinants
alludes to the challenging nature of public health research. Jadad and O‘Grady
(2008) suggest that if health is too complex a concept to define operational
measures of health may be unobtainable. However Godlee (2011) argues that
this is why debating contrasting concepts is important: because they

Chapter 2: Literature review
49
fundamentally impact how we recognise health, how we interpret health and
how we should attempt to measure it within research. Dahlgren and Whitehead
(2006) further emphasise that the determinants of health be distinguished from
the determinants of health inequalities because they are not conceptually the
same. Confusing these may result in policies which are effective in improving
levels of health but that are ineffective in tackling the health gradient.
2.3 Health inequalities
This second section focuses on different interpretations of health inequalities
and some of the theoretical explanations that have been proposed to explain
their persistence over time. This is relevant to this thesis for at least three
reasons.
Firstly it demonstrates that health inequalities research should not be thought of
as static but as a reflexive and evolving discipline. It needs to be responsive to
new empirical evidence and the changing nature of health inequalities over
time, and across different contexts.
Secondly it demonstrates the advancement within the discipline: from looking at
absolute and material influences on health, disease aetiology and risk factors to
introducing the psychosocial factors of relative deprivation into the theoretical
framework (Bartley, 2004, Dowler and Spencer, 2007).
Thirdly it helps to understand the contested recommendation made by the World
Health Organistation (2000): that health inequalities should be measured across
individuals independent of socioeconomic group membership or irrespective of
any other dimension of inequality. Lifespan variation is a measure which
facilitates this conceptual approach and that has a number of pragmatic

Chapter 2: Literature review
50
advantages for carrying out comparative research. Critically evaluating this
conceptual debate helps to demonstrate that there is no single approach for
measuring health inequalities, and that different interpretations reflect
different normative values. This chapter does not evaluate how we measure
socioeconomic group membership. The theoretical and scientific reasons behind
socioeconomic indicators are covered in detail in chapter 3 of this thesis.
2.3.1 Defining health inequalities
Although health inequalities have been documented across the world (Whitehead
et al., 1992, Marmot, 2005, Mackenbach et al., 2008) no single working
definition is adhered to.
One definition might refer to health inequalities as ‗the observable or
measurable differences in health‘ (Harper and Lynch, 2006). For example health
differences that exist between countries can be seen as health inequalities.
Sweden experiences high levels of population health and Scotland relatively low
in comparison. Life expectancy in these countries is used to illustrate this in
figure 6.

Chapter 2: Literature review
51
Figure 6 Comparisons of life expectancy trends in UK countries and Sweden (National Records of Scotland,
2014b)
Europe provides a valuable opportunity for comparative studies because of the
range of political, economic and epidemiological histories which may help to
identify opportunities for reducing health inequalities (Mackenbach et al., 2008).
However, broad social ecological studies which measure differences in health
across geographies may not strictly be studies of health inequalities as
conceptualised by others (Bartley, 2004).
This is because an alternative definition of health inequalities states that they
are the ‗systematic differences in the health of people occupying unequal
positions in society‘ (Graham, 2009). This perspective only deems differences in

Chapter 2: Literature review
52
health to be inequalities if they are patterned by a characteristic that reflect a
socioeconomic inequality (McCartney et al., 2013).
Socioeconomic or demographic groups that are of interest may include gender,
race and ethnicity, religion, sexual orientation, disability status, educational
attainment or occupational status (Bartley, 2004, Marmot et al., 1991, Harper
and Lynch, 2006). Table 1 illustrates the systematic gradient for life expectancy
and deaths (age 0-64 years old) for males in Scotland in 2001 by socioeconomic
deprivation as an example. This concept of health inequalities demonstrates that
there is a social gradient for health that affects everyone (Marmot, 2005,
Marmot et al., 2008). It is not simply that there is a gap between the richest and
the poorest, although this is the starkest gap: even those almost at the top of
the hierarchy experience worse health than those at the very top (World Health
Organization, 2008, Marmot, 2001).
Table 1 Socioeconomic gradient for mortality in Scotland, 2000-2002, Males
Life expectancy
(years)
₁Deaths age 0-64 per
100,000
Least deprived 1 77.7 176
2 75.3 238
3 73.9 302
4 72.1 157
Most deprived 5 68.9 612
₁ (Leyland et al., 2007a)

Chapter 2: Literature review
53
2.3.2 Health inequalities or health inequities
Across disciplines the term health inequalities has been used to refer to
measurable differences in health (Marmot, 2005, Bartley, 2004, Arcaya et al.,
2015). However, it has been suggested that the term health inequality may not
adequately reflect the extent to which a health difference is unjust, preventable
and unnecessary (Arcaya et al., 2015, Marmot et al., 2012).
The example that is often given is that health differences by age are measurable
but may not be unjust. A 20 year old will not have the same health as a 60 year
old but the 60 year old will have previously experienced the health of a 20 year
old and the 20 year old will one day experience the health of a 60 year old
(Kawachi et al., 2002). In contrast Arcaya et al. (2015) suggest that health
inequality is a term which is applicable in any circumstance where any quantity
of health is unequal, but the term health inequities implies that a moral
judgement be passed about whether the inequality is just.
Kawachi et al. (2002) highlights that health inequity requires a further
distinction to be made between inequalities achieved in health and inequalities
in opportunities for health. For example the consequences of smoking may be
seen as an inequality but not an inequity: the individual smoker, potentially, had
the same opportunity to achieve the same health as a non-smoker. However
there are contrasting view points for where responsibility for health is situated.
It could be argued that individuals should be held accountable for smoking or it
could be argued that individual free choice is limited by the environment and by
predisposing factors that lie outside of individual control (e.g. pricing, market
availability, tobacco control legislation and health education). Health inequity

Chapter 2: Literature review
54
therefore has a strong normative dimension (Fabienne, 2001) and there is no full
account of which health inequalities are distinguishable as unjust (Kawachi et
al., 2002). Fabienne (2001) argues that this is problematic when trying to
identify which normative judgement to pass when interpreting empirically
measured health inequalities. It also risks being an affront to many people‘s
sense of fairness and justice (Benzeval, 1995, Kawachi et al., 2002, Sen, 1992).
Therefore a health inequity theoretical framework is a problematic objective for
policies to pursue (Sen, 2002).
Instead it is proposed that health should be understood as the most important
condition for human life: it is a basic, common need and right (Kawachi et al.,
2002, Sen, 2002). This interpretation accepts that the distribution of health
should be fair but that this does not require judgement to be passed. Health as
human right does not discredit the valuable insights an equity argument
presents. Instead it recognises that all health inequalities should be deemed
unjust as they all tend to reflect fundamental differences in the distribution of
resources (Kawachi et al., 2002, Fabienne, 2001).
In summary critically evaluating the concept of health inequity can act as a
catalyst for specifying what it is in society that needs to be equalized (Sen,
2002). I chose to use the better established term health inequalities rather than
health inequities throughout this thesis. The term health inequality does not
inherently demand that a moral judgement be passed. The following section will
discuss the theoretical explanations for health inequalities.

Chapter 2: Literature review
55
2.3.3 Theoretical explanations
Bartley (2004) suggested that the existence of health inequalities, as evidenced
by a mortality gradient, came somewhat as a surprise when the Black report was
published for at least two reasons. Firstly, the UK population had had access to
free healthcare funded entirely by general taxation for over 30 years. Secondly,
improvements in income were perceived to have been large enough so that
poverty no longer directly impacted poor health and mortality. This prompted
some to comment that a welfare state founded on progressive taxation and
public service investments may be ineffective for reducing health inequalities.
The Black report did not accept this perspective and instead proposed four
explanations for the existence of health inequalities: the artefact explanation,
health selection, cultural/behavioural and materialist/structural.
In the years since the Black report this fourfold classification has been heavily
debated, a number of modifications presented, and several alternatives
proposed (Mackenbach, 2012, Macintyre, 1997, Bambra, 2011a). Attempts at
synthesising and disentangling these theories have also been made. For example
Macintyre (1997) set out to distinguish between hard and soft interpretations of
each theory. Mackenbach (2012) grouped a number of theoretical developments
in terms of whether they focused on: (1) social mobility and the composition of
socioeconomic groups over time, (2) the distribution of resources (material and
psychosocial), (3) the ability for resources to enable health improvement
(Grusky, 2010). Further critical reflections have focused on the ability for each
theory to explain the persistence of health inequalities over time, against their
ability to explain the widening of health inequalities over time (Mackenbach,
2012, Bambra, 2011a).

Chapter 2: Literature review
56
The following sub-section summarises these theories in terms of the Black
reports‘ broad fourfold classification but adds in some more recent
developments where appropriate. It does not provide an assessment of the
validity of each of these theories, nor does it provide a full account of empirical
studies which have tested them. Rather, it seeks to demonstrate that there is no
single theoretical explanation for health inequalities: theories co-exist,
stimulate critical development in one another, and are not mutually exclusive.
2.3.3.1 Artefact
Firstly the artefact explanation suggested that the measures used to capture
social deprivation or social status may have no empirical significance (Townsend
and Davidson, 1992, Fox et al., 1985). It was argued that empirical measures
failed to reflect the decreasing proportion of the population in the lowest social
class category. Therefore the health gap could be interpreted as an inevitable
consequence of social mobility within the UK if upward mobility improved the
health of the majority relative to those left behind. Townsend and Davidson
(1992) were quick to discredit this perspective. It was reported that the
reduction in the size of the lowest social class was relatively small. In addition
this did not account for why the health of those near the top of the hierarchy
was worse than those at the very top (Marmot, 2001). Therefore it was
concluded that any potential measurement artefact would have had a minimal
impact on the magnitude of health inequalities that were reported (Fox et al.,
1985).

Chapter 2: Literature review
57
2.3.3.2 Health Selection
Secondly a health selection explanation proposed that the social structure of
society reflected the health structure: healthy individuals experience upward
social mobility and sick individuals find themselves in the most disadvantaged
groups (Bartley, 2004). This interpretation of health selection flips the causal
relationship: social position is dependent upon health rather than social position
having implications for health (Townsend and Davidson, 1992, Boyle et al.,
2009b). To overly simplify this scenario, health is the causal variable and
occupational class is the outcome variable. It was strongly linked to Darwin‘s
notion of natural selection, with Macintyre (1997) highlighting that ‗natural‘ has
both biological and moral connotations when referring to health inequalities.
The lowest infant mortality rate experienced by the highest social class was used
as supporting evidence for this hypothesis: it was perceived to be a reflection of
the fact that this sub-group of the population was comprised of the fittest and
healthiest men and women (Fox et al., 1985). As a result it is hypothesised that
health inequalities, between socioeconomic groups, could have widened as a
consequence of healthy individuals experiencing upward social mobility and
unhealthy individuals experiencing downward social mobility (Boyle et al.,
2009b).
2.3.3.3 Social sorting
Earlier interpretations of selection effects saw health as a direct explanation for
socioeconomic position (e.g. reverse causality). Later approaches saw selection
effects as reflecting the relationship between health and socioeconomic
position, which is confounded by many other factors (Mackenbach, 2012). For

Chapter 2: Literature review
58
example the argument that psycho-social and behavioural changes associated
with downward selection are detrimental to health rather than health being the
underlying process causing downward selection (Fox et al., 1985).
Although a social selection theory is plausible there is no consensus surrounding
the potential impact it could have had on health gradients or how it can be
incorporated into strategies for reducing them. Some of the debates have
centred around whether the comparison of mobile and immobile populations is
most appropriate for the health differences between areas or if the net
difference between in and out flows provides more explanation (Boyle et al.,
2009b, Norman et al., 2011). Further studies have critically evaluated whether
increasing social mobility should be considered a viable policy option for
reducing health inequalities (Boyle et al., 2009b).
2.3.3.4 Cultural and behavioural explanations
The third explanation suggested that health inequalities persisted because of
different shared cultural practices that impacted health behaviour. There is
large body of research findings documenting systematic differences in health
behaviours across the social hierarchy: from the consumption of fats, sugars, and
salt to exercise, smoking, and drinking (Lahelma et al., 2010, Laaksonen et al.,
2008). Furthermore these behaviours can be clearly identified along the causal
pathways in the onset of disease and death.
However Townsend and Davidson (1992) point out at least four reasons why
health behaviours, by themselves, were an inadequate explanation. Firstly, they
argued that empirical research capturing health behaviours need to recognise
that health behaviours are only indicators of health which have limited

Chapter 2: Literature review
59
interpretation out of context. Secondly, a logical economic explanation for the
social patterning of negative health behaviours is often missing when
emphasising individuals as independent and autonomous decision makers in
relation to their health (Bartley, 2004, Dowler and Spencer, 2007). Thirdly, was
the prominent finding from the Whitehall study that health behaviours were
unable to fully account for the mortality gap between social groups. Only 25% of
the risk of death between occupation grades was due to the observed health
behaviour patterns (Marmot et al., 1991). Fourthly types of health behaviours
have changed over time, becoming more or less predominant, but the mortality
gradient has remained (McCartney et al., 2013).
Despite all of this, commentators point towards the tendency for Government
initiatives to rest upon the assumption that individuals act autonomously in
relation to their health even though evidence refutes this (Dowler and Spencer,
2007, Department of Health., 2005, McCartney et al., 2013). Bartley (2004)
argues that studies applying a cultural and behavioural framework tend to overly
focus on behaviour as the cause, that behaviours are the responsibility of the
individual, and that behaviours are ‗freely taken‘ by individuals. Seeing health
behaviours as determined entirely by individual choice removes any sense of
inequity. Therefore a health behaviours perspective contributes to our
understanding of the socioeconomic gradient but they do not fully explain its
persistence or its steepening over time. Instead it is argued that this perspective
should be used as a catalyst to push back the explanatory framework to help
understand why differences in health behaviours exist and question the social
contexts which they exist in (Macintyre, 1997). This task was better addressed
within a materialist/structural hypothesis.

Chapter 2: Literature review
60
2.3.3.5 Materialist / structural explanations
A materialist /structural explanation seeks to understand the impact economic
and social resources have for explaining the distribution of resources that
determine health and mortality (Macintyre, 1997, Mackenbach, 2012). It states
that health inequalities result from the unequal accumulation of exposures and
experiences that stem from the material inequalities (Lynch et al., 2001).
It is not difficult to decipher why material poverty would have previously
explained the burden of mortality on the lowest socioeconomic groups:
historically overcrowded and poorly sanitised living conditions experienced by
the lowest socioeconomic groups fuelled the spread of infectious disease (Link
and Phelan, 1995, Phelan et al., 2010). It is more challenging to understand why
this burden has persisted in capitalist economies that have driven economic
growth, reduced over-crowding, improved sanitation, enabled material gains in
wealth, and lowered absolute mortality rates (Townsend and Davidson, 1992,
Bartley, 2004).
Although the Black report introduced this hypothesis by discussing exploitation,
poverty and disease as causes of health inequality, Macintyre (1997) highlights
that greater emphasis within the report was placed on clarifying material versus
materialist interpretations.
A material interpretation assumes that material resources only impact health if
access to resources falls below optimal condition. Under this interpretation
excessive lifestyles only afforded by the rich may actually be seen as damaging
to health (e.g. ‗diseases of affluence‘), still the highest socioeconomic group
experience the lowest level of mortality (Townsend and Davidson, 1992).

Chapter 2: Literature review
61
Therefore a strict material perspective is flawed because it fails to see poverty
in relative terms to the current level of economic prosperity or the prevailing
social norms of society (Townsend, 1987, Townsend, 1979).
Materialist interpretations of poverty recognise that poverty is not a static entity
but a relative concept that changes within different contexts (Townsend, 1987).
Inequalities in access to material resources have remained a universal problem
throughout history (Mackenbach, 2012) and, as societies have developed, new
opportunities for inequalities have emerged. This is somewhat supported by the
fact that health inequalities have remained despite radical changes in the
diseases and risk factors assumed to explain them (Phelan et al., 2010). The
evolving nature of new opportunities for inequality was summarised by (Link and
Phelan, 1995) in their ‗Fundamental causes‘ theory.
2.3.3.6 Fundamental causes
It was proposed that the persisting socioeconomic gradient for health, and
ultimately death, were the consequence of the resources embodied within
socioeconomic groups: money, knowledge, power, and social capital. These
resources are beneficial for health against any prevailing disease profile in
society and help to negotiate all types of mechanisms (Phelan et al., 2010). In
addition mortality remains strongly patterned by material resources because the
types of resources that may drive health improvements or enable individuals to
negate risks are not finite: for example there is no absolute level of wealth,
knowledge or education that can be achieved (Townsend and Davidson, 1992).
The gradient in material welfare and health is therefore a consequence of the

Chapter 2: Literature review
62
most advantaged social groups disproportionately gaining more resources that
enable them to improve health and experience the greatest fall in deaths.
Subsequently, the position of the most disadvantaged has become relatively
worse off over time, but within the context of absolute improvements, meaning
it may actually be harder to partake in the socially accepted functions of a
richer society (Sen, 1992, Townsend and Davidson, 1992, Bartley, 2004). In this
context Sen (1992) argued that relative material deprivation can lead to
absolute deprivation in terms of capabilities: the ability to transform material
resources into valuable activities via real freedom and equal access to
opportunity. Bartley (2004) reiterates this by concluding that a materialist
approach does not see the absence of enough material wealth as impacting
health but that balancing psycho-social needs and biological needs is now
dependent upon material wealth.
Therefore the distinction between a material and materialist hypothesis tends to
be that money itself is not the causal factor impacting health but that the level
of relative resources and the ability those resources provide to mitigate risks are
(Bartley, 2004). Marmot and Wilkinson (2001) summarise that the difference is
between the damage done by absolute poverty versus the health implications of
relative inequality.
This theoretical framework clearly conveys the notion that poverty in modern
societies is more related to social participation than bare minimum survival
(Dowler and Spencer, 2007). The materialist framework for understanding health
inequalities has also evolved to encompass different mechanisms, in particular

Chapter 2: Literature review
63
psychosocial resources and social protection policies under a neo-materialist
perspective.
2.3.3.7 Psychosocial
Psychosocial mechanisms aimed to provide a biologically plausible account for
why health is socially patterned: which in turn leads to the mortality gradient
(Dowler and Spencer, 2007). Within this theoretical framework psychological
conditions, which are seen as a direct consequence of social inequality, also
have a direct impact on the body‘s biological processes.
Research evaluating the possible psychosocial mechanisms was initially
motivated by the so called ‗fight or flight‘ changes that happen in response to
external stimuli that are perceived to be dangerous. Psychological mechanisms
which link social exposure and physiological response may be worry, stress,
anxiety, insecurity, depression and vulnerability (Artazcoz et al., 2005, Marmot
and Wilkinson, 2001). Studies have demonstrated that perceived levels of stress
or acute mental stress (psychosocial mechanisms) are associated with
heightened cardiovascular responses and increases in blood pressure (biomedical
responses) (Carroll et al., 2011, Light et al., 1999).
Psychological conditions, triggered by the social environment, might interact
with the biological processes which facilitate the adoption of negative health
behaviours. One example that links to health behaviours is that biological
response to addictive substances may be altered under different psychological
conditions (Bartley, 2004). This example takes account of the distribution of
adverse social experiences, the distribution of health behaviours, and

Chapter 2: Literature review
64
subsequent distribution of health outcomes because social exposures are seen to
be embodied in our psychology and biology.
Wilkinson and Pickett (2010) argue in favour of psychosocial mechanism by
stating that health is not only damaged by material conditions but by our
responses to our social circumstance. Their understanding of social circumstance
was explicitly referring to the level of social stratification and the hierarchical
structure of society at a macro level (Wilkinson and Pickett, 2006). They
suggested that the distribution of wealth within a country may be more
important for health than the absolute level of wealth and that this acts through
psychosocial mechanisms (Graham, 2009, Wilkinson and Pickett, 2010, Wilkinson
and Pickett, 2006). However it is still a theory that has been the subject of
critical evaluation.
In a similar vein to critiques of health behaviour theories, Lynch et al. (2000)
argue that psychosocial theories can be unintentionally decontextualized, risk
being misappropriated with regressive political agendas, focus on the perception
of inequality detracting attention from structural causes, and reinforce low
expectations for structural change. Marmot and Wilkinson (2001) dispute this
interpretation: social structure and relative deprivation have profound
psychosocial impacts and to deny this burdens the responsibility for depression,
anxiety and insecurity with individuals. They further emphasise that psychosocial
mechanisms are important for clarifying a materialist perspective from a neo-
materialist perspective.

Chapter 2: Literature review
65
2.3.3.8 Neo-materialist
A neo-materialist theory sees inequalities in material wealth as reflective of the
negative exposures and lack of resources held by individuals due to systematic
inadequacies in the social infrastructure (Lynch et al., 2000). The relationship
between lower social inequality and better population health may be explained
by the psychosocial benefits provided by an egalitarian welfare system that
ensures higher levels of social protection for all of its citizens (Bambra, 2011a,
Bambra, 2013).
Social protection policies are a means of redistributing wealth. They generally
aim to protect the most vulnerable members of society from the effects of social
and economic risks (Bambra, 2009, van Raalte et al., 2014). This approach
suggests that high income inequality in itself is not problematic. Rather a
country could demonstrate high income inequality without there being
implications for health if other aspects of the social infrastructure improved.
This is somewhat of a contrast to a strictly psychosocial explanation for health
inequalities where income inequality is always problematic because perceptions
of relativity will always exist (Lynch et al., 2000). A neo-materialist view still
recognises the importance of relative deprivation but sees the redistribution of
materialist mechanisms as the solution for eradicating mortality inequalities: the
redistribution of income and resources through tax, cash and non-cash benefits
(Mackenbach, 2012).
There is a growing body of research which supports a neo-materialist hypothesis
by demonstrating the links between welfare redistribution, social protection
policies and lower mortality (Marmot et al., 2008, McCartney et al., 2016).

Chapter 2: Literature review
66
Perhaps the most widely cited examples are Scandinavian countries which tend
to afford high levels of social protection to the unemployed and retired members
of society but also ensure that publicly provided health care and education are
of a high standard for all (Bambra, 2011a, Popham et al., 2013).
Access to these resources in these societies is independent of individual
socioeconomic position explaining why there might be lower levels of health
inequality (Marmot et al., 2008). This is often contrasted to the social structure
in the USA where access to the resources which are required for social
participation is more dependent upon individual socioeconomic position. It is
perhaps not surprising then that the USA demonstrates one of the steepest
mortality gradients of any economically developed country (Singh, 2003,
Hummer and Hernandez, 2013).
However empirical evidence from Mackenbach et al. (2008) did not entirely
agree with this theoretical approach. They find that the magnitude of health
inequalities, when measured across socioeconomic groups, was not
systematically lower in countries which have a history of egalitarian welfare
policies. From this finding they concluded that a certain level of social
protection may mitigate health inequalities but may not provide a universal
explanation for their reduction across different countries.
Somewhat in contrast to this study Popham et al. (2013) demonstrated that
inequalities in countries with egalitarian welfare systems could be interpreted as
the smallest when measured using lifespan variation. This is considered a
measure of total inequality as it reflects the distribution of health across all
individuals rather than the difference in average health between socioeconomic

Chapter 2: Literature review
67
groups. The seemingly contradictory conclusions drawn from these two studies
reflect the fact that different approaches for measuring inequalities were taken.
The differences between these two approaches can be debated in terms of: (1)
the underlying normative judgements and (2) the pragmatic challenges. These
are discussed in the third section of this literature review chapter.
2.4 Conceptual meaning and empirical measurement of health
inequalities
It has become somewhat standard practice for quantitative research to strictly
conceptualise health inequalities as the differences between socioeconomic
groups (Marmot, 2001, Popham et al., 2013). Quantifying inequalities in this way
has been widely utilised for setting policy targets. Scotland, for example, set out
to improve health by 15% for the most deprived socioeconomic group as
measured against coronary heart disease, smoking and suicide indicators
(Munoz-Arroyo and Sutton, 2007).
However it is widely recognised that standard definitions and conceptual
measurements of socioeconomic position are problematic (Mackenbach et al.,
2016b). It is challenging to construct measures of socioeconomic inequality that
adequately capture determinants of health that affect everyone or that are able
to reflect the relative experiences that exist across an entire population (Munoz-
Arroyo and Sutton, 2007). This has led to a lack of consensus among researchers
and policy makers about which dimensions of socioeconomic inequality to
measure progress against (Mackenbach et al., 2016b, Kawachi et al., 2002,
Arcaya et al., 2015).

Chapter 2: Literature review
68
2.4.1 Normative judgements and pragmatic challenges
The underlying normative assumption driving the traditional measurement of
inequalities is that differences in health are only inequalities if they are
patterned by a socioeconomic inequality which renders the health difference
distinctly unequal (McCartney et al., 2013). However, the normative judgement
underpinning traditional concepts of health inequality presents a number of
pragmatic problems (Popham and Boyle, 2010, Mackenbach et al., 2008). These
can be summarised in reference to two commonly utilised measures of
socioeconomic deprivation: educational attainment and occupational social class
(van Raalte et al., 2011, Mackenbach et al., 2008).
Historical changes and cultural differences in terms of the socioeconomic
position afforded by a certain level of education or an occupation restrict
comparisons between countries and over time. The occupational structure of a
society has changed over time (Macintyre, 1997) and the social and monetary
value of an occupation is context specific. In a similar vein the educational
profile of populations can be altered over a generation making temporal
comparisons challenging and educational standards and practices vary between
countries (Mackenbach et al., 1997, Krieger et al., 1997).
Mackenbach (2012) adds that incomparable socioeconomic data may impact the
empirical results if variability in the data collection processes between countries
affects the reported differences in the magnitude of inequalities. Dibben and
Popham (2011) also suggest that the composition of socioeconomic groups within
countries is fundamentally a product of the welfare structure in each country.
This means that studying socioeconomic differences in health within countries,

Chapter 2: Literature review
69
and then making comparisons with contrasting countries, may not be appropriate
for understanding the impact of different welfare systems on health inequalities.
They present this argument in reference to the level of meritocracy within each
country: if there is a link between health and intellectual ability that is
independent of socioeconomic position then a meritocratic country would have a
concentration of health in the highest socioeconomic group. This would be
expected to result in steeper health gradient than a non-meritocratic country
where ability and health are distributed more evenly between socioeconomic
groups because the opportunity for social selection based on intellectual
characteristics is restricted (Mackenbach, 2012). Despite these limitations,
comparisons over time and between countries are deemed essential for assessing
the effectiveness of social, political and economic initiatives that governments
implement in order to reduce health inequalities (Murray et al., 1999).
One proposed solution is to instead measure total inequality. This interpretation
of inequality does not require any socioeconomic data to be operationalised.
This gives it an immediate pragmatic advantage over a traditional interpretation
of inequality as the difference between socioeconomic groups (Popham and
Boyle, 2010, Dibben and Popham, 2011, Le Grand, 1987, Harper and Lynch,
2006).
2.4.2 Total inequality
The conceptual meaning of total inequality is perhaps best demonstrated by
comparing it with one of the most common traditional approaches used for
monitoring health inequalities: the reporting of differences in average life
expectancy between socioeconomic groups (World Health Organization, 2010,

Chapter 2: Literature review
70
National Records Scotland, 2011). Life expectancy at birth reflects the average
number of years a new born can be expected to live for if the current mortality
conditions of the population were to remain (World Health Organization, 2010).
Although life expectancy at birth continues to be used in comparative studies,
some have suggested that remaining life expectancy at adult ages may be a
more appropriate indicator of inequality because infant deaths are now so rare
in economically developed countries (Tuljapurkar, 2010, Smits and Monden,
2009). Despite this contested issue life expectancy at birth continues to be one
of the most common indicators of population health (Murray et al., 2002, World
Health Organization, 2010).
However a difference in life expectancy, between socioeconomic groups, fails to
indicate a distinct dimension of inequality: differences in the distribution of age
at death. Measuring the distribution of an outcome is common practice in other
disciplines such as the study of income inequality in economics. The distribution
of income across individuals is deemed to be essential as comparisons
demonstrating similar averages may do so with different distributions (Murray et
al., 1999). Therefore if average levels of income are not deemed informative
enough then neither should average levels of health. Tuljapurkar (2010) adds
that distribution of age at death should be considered a primary outcome
variable in itself, much like the distribution of income can be.
The normative principles underpinning a total inequality perspective is that
health, by itself, is fundamental to well-being and there should be a concern for
inequalities in health regardless of whether it is correlated to any other
dimensions of socioeconomic inequality (Tuljapurkar, 2010, Gakidou and King,

Chapter 2: Literature review
71
2002, Murray et al., 1999). This approach for measuring and comparing health
inequalities was supported by the WHO when it proposed that the distribution of
health across individuals, regardless of socioeconomic group membership, be
monitored (World Health Organistation, 2000, Asada, 2005, Murray et al., 1999).
Despite the potential for total inequality measures to provide additional insights
in to the changing nature of health inequalities it has been met with criticism
(Kawachi et al., 2002).
Opponents have particularly focused on the normative principles driving a total
inequality approach arguing that it: removes the fundamental principle of
injustice, that it measures inequalities that are not inequities, and simply
reflects health differences or health disparities (Marmot, 2001, Dibben and
Popham, 2011). It is assumed that if no dimension of socioeconomic inequality is
measured then the socioeconomic factors amenable to interventions are being
overlooked (Carter-Pokras and Baquet, 2002).
Navarro (2000) further points out that this approach has been endorsed by the
WHO which is not primarily a scientific institution but a political one, whose
position must be assessed accordingly. Carter-Pokras and Baquet (2002) similarly
add that differing definitions used for health inequalities may reflect opposing
political ideologies and have implications for resource allocation.
A counter argument is that a traditional approach risks ignoring important
individual variations and the underlying array of health patterns (Murray et al.,
1999): measuring the average health differences between socioeconomic groups
risks assuming that a homogenous gain in health has been achieved for everyone

Chapter 2: Literature review
72
within the same socioeconomic group, or that health inequalities within these
groups have stayed constant over time.
Dibben and Popham (2011) summarise this debate effectively: If total inequality
were to reflect only random variation in health that is not unjust then the level
of total inequality should be comparable between countries (and between
socioeconomic groups). This is not the case (Smits and Monden, 2009, Shkolnikov
et al., 2011, Seaman et al., 2016a) and the difference in total inequality should
be understood as a consequence of inequity. Inevitable and unavoidable
differences would be randomly distributed across individuals (e.g. not socially
patterned) if there was no intervening social process at play. Therefore it is not
only a traditional approach that can measure whether a health difference is
unnecessary or unfair, total inequality can too.
2.4.3 Multiple dimensions of inequality
However the two approaches do not need to be interpreted as mutually
exclusive. Instead Harper and Lynch (2006) suggest that contrasting the
normative assumptions of the two approaches may help to highlight the
underlying intentions of health inequality initiatives: whether the goal is to
improve absolute health for everyone or to challenge relative inequalities.
Gakidou et al. (2000) add that the debates surrounding the quantification of
health inequalities should be concerned with: (1) explicitly defining quantities of
interest and (2) justifying why they are of interest.
2.5 Lifespan variation
This thesis therefore recognises that opinions are divided when it comes to the
conceptual meanings and measurement of health inequality. However a growing

Chapter 2: Literature review
73
body of research has provided insight into the changing nature of health
inequalities by estimating and interpreting the relativity of total inequality. One
of the most common measures used to do this is lifespan variation.
Lifespan variation is the variability in age at death that exists between all
individuals within a population and is considered complimentary to average life
expectancy. Multiple indices of lifespan variation exist and capture the degree
of mortality compression in a population (van Raalte and Caswell, 2013,
Tuljapurkar, 2010). Lifespan variation, like many indicators of population health
and inequality, only conveys meaning when it is reported comparatively (Rose,
2001). A lifespan variation of 10 years experienced at one point in time, in one
country, or by one socioeconomic group, can only be interpreted as favourable
or unfavourable by making appropriate comparisons. Higher lifespan variation
equates to greater inequality in the age at death (Murray et al., 1999, Gakidou
and King, 2002, Harper and Lynch, 2006, Smits and Monden, 2009).
International studies have compared population level trends for lifespan
variation over significant periods of time, compared lifespan variation trends
stratified by socioeconomic position, and investigated the level of lifespan
variation inequality independent of life expectancy (controlling for
epidemiological time) (van Raalte et al., 2014, Smits and Monden, 2009,
Gillespie et al., 2014).
2.5.1 Epidemiological transition
The theory of epidemiologic transition focuses on the changing patterns of
health, disease and mortality and the associated demographic, economic and
sociological changes. It proposes that disease intervention programmes may be a

Chapter 2: Literature review
74
determining factor for fertility change and for socioeconomic progression
(Omran, 1971).
Mackenbach et al. (1997) suggest that studies seeking to understand the
determinants of health inequalities should therefore control for epidemiological
time rather than calendar time. This involves comparing populations when they
achieve the same average health rather than comparing populations in terms of
contemporaneous time.
The notion of epidemiological time has been highlighted in wider health
inequalities literature as being particularly important. It is an approach that can
be applied in order to control for differences between countries if they are
known to be at different stages of a disease epidemic (e.g. cardiovascular
disease (Vallin and Meslé, 2004)) or to control for any lag time that may be
associated with diffusion of knowledge (Mackenbach, 2012, Smits and Monden,
2009). For example, it would be valuable to control for stages of the smoking
epidemic or control for stages of the cardiovascular revolution (interventions
introduced to control risk factors for cardiovascular disease) when comparing
populations. These epidemiological developments started at different points in
time for different countries and effects were socially patterned (Mackenbach et
al., 2008, Vallin and Meslé, 2004).
Measures of total inequality facilitate multiple comparisons of inequalities: over
time, between populations, and when controlling for epidemiological time. All of
these comparisons will be made in the analysis chapters of this thesis.
Traditional interpretations of inequality, as the average health difference
between socioeconomic groups, are less capable of making all of these

Chapter 2: Literature review
75
comparisons because they require consistent measures of socioeconomic position
(Mackenbach and Kunst, 1997). The literature review will now summarise some
of the international empirical studies that have applied lifespan variation as a
measure of inequality and identify the research questions that this thesis will
answer.
2.5.2 International studies of lifespan variation
A number of international studies have applied a total inequality concept of
health inequalities by measuring lifespan variation (Tuljapurkar, 2010,
Shkolnikov et al., 2011, van Raalte et al., 2011, Smits and Monden, 2009,
Gillespie et al., 2014). Lifespan variation seeks to reflect the level of
uncertainty that surrounds life expectancy in a population, lower lifespan
variation suggest less variability in age at death as individuals in the population
are tending to die around a similar age. Being able to measure the level of
uncertainty in age at death has implications for public sector investments in
areas as diverse as: education, healthcare, retirement, and pensions (Gillespie
et al., 2014). If individuals are informed about the level of certainty surrounding
their expected age at death then they may be better positioned to make
personal decisions about future finances and health (van Raalte et al., 2014).
Smits and Monden (2009) use three example countries to illustrate what is meant
by lifespan variation. They compare Niger, Brazil and Japan in the year 2000:
three countries at contrasting stages of development and therefore experiencing
different distributions in age at death. Comparing these three countries
demonstrates the standard processes of mortality development: falling childhood
deaths, increasing life expectancy, emergence of a single modal age at death for

Chapter 2: Literature review
76
the population, and decreasing lifespan variation (Gillespie et al., 2014). Figure
7 shows how lifetable deaths are distributed across all ages in the three
countries.
Figure 7 Age distributions of mortality, contrasting three countries at different stages of
epidemiological transition (Smits and Monden, 2009)
It is evident that the greatest proportion of deaths in Japan is between the ages
of 70 to 90 years old. This means the majority of the population would be
expected to reach these ages if they were exposed to the same mortality
conditions. This is in contrast to Niger and Brazil where infant mortality remains
high and a smaller proportion of the population live to older ages. Hence in
Japan there is less variation in age at death, which can be interpreted as lower
inequality, whilst Niger experiences the greatest variation in age at death.

Chapter 2: Literature review
77
Although a number of indices of lifespan variation exist these are found to be
highly correlated (van Raalte and Caswell, 2013). One of the most commonly
used is e† (van Raalte and Caswell, 2013, Shkolnikov et al., 2011). e† is the
average years of life lost per death in the population; it reflects the average
remaining years of life expectancy when a death occurs (van Raalte, 2011a).A
technical discussion of e† is included in the methods chapter of this thesis.
2.5.3 Compression and expansion: maintaining the association between life
expectancy and lifespan variation
Historical trends in life expectancy have been well documented and a
convergence in life expectancy at birth found for most developed countries
(Edwards, 2011, McCartney et al., 2012b). Increases in life expectancy have
historically been driven by steep mortality decreases at younger ages, outpacing
mortality decreases at older ages (Shkolnikov et al., 2011, Gillespie et al.,
2014).
As a result the countries with the highest life expectancy at any given time have
tended to have the lowest level of lifespan variation (Shkolnikov et al., 2011,
Edwards, 2011). This strongly suggests that increasing average population health
and decreasing levels of total inequality are compatible public health aims
(Edwards and Tuljapurkar, 2005, Shkolnikov et al., 2011, Smits and Monden,
2009).
Although improvements in life expectancy have almost universally continued
(with Russia and some Central African countries being noted exceptions (Notzon
et al., 1998, Bor et al., 2013) improvements in lifespan variation have not.
Recent attention has been paid to understanding how age specific mortality

Chapter 2: Literature review
78
change impacts lifespan variation trends (Smits and Monden, 2009, Seaman et
al., 2016a, Gillespie et al., 2014). There is some variability in the relationship
between life expectancy and lifespan variation for some countries. Maintaining
the optimal correlation depends on whether mortality compression continues to
outpace mortality expansion (Gillespie et al., 2014). Mortality expansion is when
the distribution becomes wider at the right hand tail because the age at death is
increasing. Mortality compression is when the age at death distribution becomes
narrower because younger age deaths (left hand tail) are being avoided and
pushed into older ages1.
Changes to mortality across young ages have historically driven the correlation
between increasing life expectancy and decreasing lifespan variation. This is
because mortality decline at young ages decreases lifespan variation by
compressing the distribution of age at death. As life expectancy increases more
ages at death are deemed to be premature and mortality compression is no
longer reliant on infant and childhood deaths. However, at the same time
mortality declines have shifted to older ages. These age processes of mortality
change can alter the correlation between increasing life expectancy and
decreasing lifespan variation.
Mortality decline at older ages can be associated with increases in lifespan
variation if the age at death causes mortality expansion but will still be
advantageous in terms of life expectancy. Mortality expansion increases lifespan
variation by delaying the age at death (Gillespie et al., 2014, Zhang and Vaupel,
2009). It is not yet inevitable that mortality expansion will cause countries to
experience increases in lifespan variation if premature mortality decline is
1 Alternatively mortality has to increase more slowly among younger ages than older ages.

Chapter 2: Literature review
79
maintained. Ensuring decreases in premature mortality rates means that
mortality compression counterbalances mortality expansion.
The USA is one of the most widely cited example countries where the age
pattern of mortality decline has led to increases in lifespan variation (Shkolnikov
et al., 2011, Gillespie et al., 2014). This can be explained by important changes
to the distribution in age at death: expansion of mortality into extreme old age
now coincides with smaller reductions in premature mortality (Oeppen, 2008).
Gillespie et al. (2014) further demonstrated that age specific mortality change
varied most across working adult ages when comparing the USA and Canada: in
the USA male mortality rates increased between 1983 and 1994 by 30% for ages
34 to 37 years old. In Canada there was a smaller increase of 17% across slightly
older ages (32 to 40 years old). This difference in the age specific pattern of
mortality change caused lifespan variation trajectories in the USA and Canada to
diverge.
Explaining why this is the case is challenging because many factors have caused
the age processes of mortality to change. Some differences in age related
mortality change between countries may reflect differences in terms of medical
care and public health advancements. Others may indicate an inability for
societies to provide an adequate social safety net to ensure all members of the
population can access the primary goods required for living (van Raalte, 2011a,
Vallin and Meslé, 2004, Tuljapurkar, 2010, Gillespie et al., 2014) with good
health being one the most fundamental requirements (Fabienne, 2001, Sen,
2002).

Chapter 2: Literature review
80
When comparing the USA and Canada it is valid to hypothesise that the
contrasting health care systems may play a role in the different distributions in
age at death: access to health care at working adult ages in the USA depends
largely on employer provided insurance and without it access to preventative
healthcare, that could reduce the risk of premature death, is restricted
(Gillespie et al., 2014, Wilper et al., 2009). However, if the only opportunity to
access adequate healthcare is through employment then increasing premature
mortality rates in the USA is a macroeconomic issue: it reflects the fact that the
social safety net, for ensuring access to primary goods in society, in the USA is
weak relative to a number of other countries (Brenner and Mooney, 1983,
Shkolnikov et al., 2011). The ability for the health care system to account for
differences in age patterns of mortality change is also weak for other countries
experiencing increasing lifespan variation, such as Scotland. This is because
health care in Scotland is provided irrespective of employment status, a system
that was founded on the principal of universal health care being provided for
free at the point of delivery (Timmins, 2001). Yet Scotland, like the USA, has
demonstrated recent increases in lifespan variation and its trend has diverged
from its closest geographical neighbours (Popham and Boyle, 2010).
2.5.4 Motivation for this thesis
Few studies measuring lifespan variation trends in cross national comparative
context have included Scotland despite it being the country in Western Europe
experiencing the poorest levels of life expectancy, having high rates of
premature death and unenviable levels of socioeconomic deprivation (McCartney
et al., 2012b, Leyland et al., 2007a). The study by Popham and Boyle (2010) is
an exception that has applied a measure of lifespan variation to Scotland.

Chapter 2: Literature review
81
Given that the international literature demonstrated that the desired association
between increasing life expectancy and decreasing lifespan variation was
dependent upon premature mortality (Gillespie et al., 2014, Shkolnikov et al.,
2011), it was fair to assume that Scotland would most likely be a country that
has failed to reduce lifespan variation as well as its closest comparators. This is
what Popham and Boyle (2010) identified: the lifespan variation trend in
Scotland had been higher than in comparable countries, equating to greater
inequality. However, of greater concern was the indication that lifespan
variation in Scotland had recently increased, suggesting worsening levels of total
inequality since around the 1990s. The worsening dimension of total inequality in
Scotland, which has largely been overlooked in public health research, was the
motivation for this thesis. Popham and Boyle (2010) also recognised that their
study was unable to identify how different socioeconomic groups have
contributed to worsening population level lifespan variation: this thesis
contributes to filling these research gaps.
2.6 Research gaps
2.6.1 Statistically assessing the change in trends
Although international comparative studies have established differences in
lifespan variation trends across countries, important research gaps still remain.
One such gap is that Scotland‘s trend has only been compared to a token number
of its closest comparator countries (Popham and Boyle, 2010). Another is that
the timing of any changes in Scotland‘s trend have not been statistically
assessed compared to other Western European countries. Evidence, using data
from as early as the mid-19th Century, suggests that lifespan variation reductions

Chapter 2: Literature review
82
have been slowing since as early as the 1950s for some countries but did not
start slowing until the 1970s for others (Edwards, 2011, Smits and Monden, 2009,
Shkolnikov et al., 2011). These research gaps are the focus of chapter 4 in this
thesis and are filled by answering the following research questions:
1. Has Scotland‘s relative lifespan variation ranking within Western Europe
changed over time?
2. Was the timing and relative rate of lifespan variation change in Scotland
comparable with any other Western European country?
2.6.2 Quantifying the impact of age specific mortality change within Scotland
compared to within England and Wales
International studies have further progressed to quantifying the age processes of
mortality, within countries, that have contributed to increases in life expectancy
and decreases in lifespan variation (Auger et al., 2014, Vaupel et al., 2011,
Gillespie et al., 2014). These studies have found that countries with the greatest
improvements in life expectancy and lifespan variation tend to be those who
have been most successful at reducing premature deaths (Shkolnikov et al.,
2011, Vaupel et al., 2011). This is because reducing premature deaths causes
mortality compression, i.e. a narrowing of the variation in age at death, whilst
reducing older age deaths causes mortality expansion, i.e. a widening of the
variation in age at death. While both processes improve life expectancy
reductions in lifespan variation can only be achieved through more mortality
compression than expansion (Popham et al., 2013, Shkolnikov et al., 2011,
Gillespie et al., 2014).

Chapter 2: Literature review
83
In the USA relatively large reductions in older age mortality have been
experienced alongside relatively poor reductions in premature mortality
(Shkolnikov et al., 2011). These two mortality processes explains why its life
expectancy is relatively low but somewhat higher than its lifespan variation
suggests. Some have pointed out that the combination of these two mortality
processes is counter-intuitive. The economic costs of social interventions for
reducing premature adult mortality – deaths associated with external causes –
tend to be relatively lower than the economic costs of medical interventions for
reducing old age mortality – deaths from chronic diseases (Smits and Monden,
2009, Nau and Firebaugh, 2012, Vallin and Meslé, 2004). The same age at death
characteristics may account for Scotland‘s population level lifespan variation
trend as it is known to have experienced relatively high premature mortality
(Leyland, 2004, Schofield et al., 2016).
Previous studies of premature mortality in Scotland found no change or even
increasing mortality rates for certain working age groups over time (Leyland,
2004, Norman et al., 2011, Leyland et al., 2007a). For example mortality rates
for males aged 15-29 years old increased between 1981 and 2001, while
mortality rates for males aged 30-44 years old demonstrated an initial decrease
before increasing, meaning that by the end of 2001 the rate had effectively
remained unchanged (Leyland et al., 2007a).
Many studies have compared health trends within Scotland to those within
England and Wales (Campbell et al., 2013, McCartney et al., 2012b). This
comparison is justifiable as they share social and economic contexts, and a
national government yet they have somewhat distinct mortality profiles. It is not

Chapter 2: Literature review
84
yet clear what age processes explain the unfavourable lifespan variation trend
within Scotland compared to within England and Wales. The analysis in chapter 5
contributes to filling this research gap by answering the following research
questions:
3. Which ages of death contributed to the lifespan variation trend in
Scotland?
4. Did the ages of death contributing to the lifespan variation trend in
Scotland differ from the ages of death contributing to the lifespan
variation trend in England and Wales?
2.6.3 Lifespan variation differences at shared levels of life expectancy
The age patterns of mortality driving improvements in life expectancy over time
tend to be ages where the greatest proportion of deaths occur (van Raalte et al.,
2011). Existing studies that have illustrated how tackling premature mortality
tends to drive improvements in lifespan variation over time (Shkolnikov et al.,
2011, van Raalte et al., 2014). However it is argued that comparative studies
should not simply evaluate trends in lifespan variation alongside trends in life
expectancy. This is because life expectancy and lifespan variation are strongly
correlated meaning that any reductions in lifespan variation over time would
almost completely be reflected by increases in life expectancy.
Rather Smits and Monden (2009) propose that lifespan variation should be
studied independently of life expectancy. This can be achieved if studies
compare levels of lifespan variation when a certain level of life expectancy has
been achieved, regardless of the year it is achieved. This is important if we are
to understand more about why countries reach a shared level of life expectancy

Chapter 2: Literature review
85
with different levels of lifespan variation. In turn this may provide information
for the different strategic options Governments have for improving average
population health and reducing inequality. Smits and Monden (2009)
demonstrate why this is by presenting two hypotheses.
Firstly the forerunner hypothesis suggests that countries reaching high life
expectancy first may do so with a lower lifespan variation than countries
achieving the same level of life expectancy later. This could stem from
forerunners focusing on public health improvements and the social determinants
of health that tend to reduce premature mortality (e.g. infant mortality,
sanitation, reducing risk of accidental death, social protection policies) before
moving onto more technical interventions and advanced medical practices
associated with reductions in older age mortality (Nau and Firebaugh, 2012).
Secondly the diffusion of knowledge hypothesis argues that countries achieving
the same level of life expectancy later may be better positioned to benefit from
the diffusion of public health knowledge surrounding the social determinants of
health. This could mean premature mortality is reduced more effectively and
efficiently (Oeppen, 2008). So although arriving at the same life expectancy
later they do so with a lower lifespan variation, especially if the diffusion of
knowledge surrounding premature mortality and the social determinants of
health outpace the impact of technical interventions which may reduce old age
mortality resulting in more compression than expansion.
Evidence is mixed. Smits and Monden (2009) find evidence for the diffusion of
knowledge hypothesis while Vaupel et al. (2011) find that lifespan variation is
very similar between countries when reaching a shared level of life expectancy.

Chapter 2: Literature review
86
Therefore chapter 6 seeks to understand the age patterns of mortality that
account for differences in lifespan variation between Scotland and England and
Wales at similar levels of life expectancy. This analysis answers the following
research questions:
5. Was lifespan variation higher or lower in Scotland at a shared level
of life expectancy with England and Wales?
6. Which ages of death account for the lifespan variation gap between
Scotland and England and Wales at a shared level of life
expectancy?
2.6.4 Changes to the socioeconomic gradient for lifespan variation
As previously discussed, studies have long established the association between
socioeconomic deprivation and mortality by measuring life expectancy; the least
deprived experience the highest life expectancy and the most deprived the
lowest (The Scottish Government., 2014, Singh and Siahpush, 2006). Fewer
studies have measured inequalities in lifespan variation by socioeconomic
deprivation (van Raalte et al., 2014, van Raalte et al., 2011).
These types of studies are important for at least three reasons. Firstly to help
address the criticism that a total inequality concept only reflects random
variation as opposed to capturing any form of social inequity (Dibben and
Popham, 2011, Murray et al., 1999). If lifespan variation only reflected
inevitable and unavoidable differences in age at death and there were no social
process at play (inequity) then lifespan variation differences between
populations would be minimal (Dibben and Popham, 2011).

Chapter 2: Literature review
87
Secondly to identify if the most deprived socioeconomic groups are exposed to a
double burden of inequality: the shortest average life expectancy and the
greatest amount of uncertainty about the age at which they will die. Thirdly to
increase our understanding of the ways in which different socioeconomic groups
contribute to lifespan variation inequalities at the population level.
One of the first large-scale international studies to systematically compare
lifespan variation by socioeconomic group was by van Raalte et al. (2011). They
used linked Census data and constructed three internationally comparable
educational levels as an indicator for socioeconomic deprivation: less than
secondary education, complete secondary education, and some tertiary
education. The lowest educational category was found to experience the highest
level of lifespan variation across all of the ten countries included (Belgium,
Czech Republic, Estonia, Finland, France, Norway, Poland, Slovenia, Sweden and
Switzerland). On average lifespan variation was 1.5 years higher for the lowest
education category compared to the highest. However the time period covered
for this study was limited, with data for the countries spanning ten years or less.
Changes to the educational distribution make longer temporal comparisons
challenging (van Raalte et al., 2014).
The study by van Raalte et al. (2014), looking at Finland only, was able to
address this issue by measuring occupational socioeconomic status between 1971
and 2010. It reiterated the finding that lifespan variation was higher for the
most deprived group but also found that the trend for the most deprived had
diverged to increasing lifespan variation. This illustrated that the socioeconomic
gradient for lifespan variation has steepened over time in Finland.

Chapter 2: Literature review
88
It is not yet known how lifespan variation in Scotland is patterned by any
measure of socioeconomic deprivation (Popham and Boyle, 2010). Nor have any
known studies formally quantified changes in the socioeconomic gradient for
lifespan variation over time and related these to its deteriorating lifespan
variation ranking within Western Europe. Chapter 7 therefore fills these research
gaps by answering the following questions:
7. Is there a socioeconomic gradient for lifespan variation in Scotland?
8. Has the socioeconomic gradient for lifespan variation in Scotland,
changed over time?
9. Are changes to the socioeconomic patterning of lifespan variation
in Scotland related to Scotland‘s deteriorating lifespan variation
ranking within Western Europe over time?
2.6.5 Age and cause of death contributions to lifespan variation within
socioeconomic groups
The two key studies by van Raalte utilised measures of socioeconomic
deprivation which only permitted the reporting of lifespan variation from adult
ages (van Raalte et al., 2014, van Raalte et al., 2011). This is a theoretically and
empirically valid approach: it reflects the argument that inequalities in
developed countries may be better reflected when reporting life expectancy and
lifespan variation from adult ages only as infant deaths are now rarer than in the
past (Smits and Monden, 2009). However it does mean that there was something
of a trade-off between capturing the full age distribution of mortality and
applying a measure of socioeconomic deprivation which will adequately capture
completed years of education or achieved occupation (van Raalte et al., 2011).

Chapter 2: Literature review
89
It is also a departure from the standard reporting of life expectancy from age 0
which is conventionally used to make international comparisons (World Health
Organization, 2010).
Chapters 7 and 8 of this thesis utilised an area based measure of socioeconomic
deprivation. An area level measure of socioeconomic deprivation can be applied
to the entire population meaning that age truncation is not necessary. This
approach has not previously been operationalised when studying lifespan
variation trends. This is an important research gap to fill as area based measures
of socioeconomic deprivation, compared to individual level indicators, are more
widely available, often updated more frequently, and are able to capture
multiple dimensions of deprivation (Payne, 2012, Kearns et al., 2000, Green,
2013). However this is not to say that area based measures are free from
limitation.
Firstly, area based measures tend to reflect the average deprivation
characteristics of the people living within an administrative area. Administrative
areas are created primarily for administrative purposes which means this
geographical context may not provide as much detail about the area level
aspects most important for health (Leyland et al., 2007a). Secondly, people
within areas are heterogeneous: some individuals living within a deprived area
may be affluent and some individuals living within affluent areas may be
deprived (Morgan and Baker, 2006, Leyland et al., 2007a). Thirdly, area level
measures must be recognised as distinct from individual socioeconomic
characteristics: one measure cannot be used as a substitute for the other.
However area level proxy measures are a powerful tool: their wide availability

Chapter 2: Literature review
90
reflects the fact that socioeconomic inequalities are so embedded within society
that they manifest across many aspects of life (Galobardes, 2012). The strengths
and weaknesses of measures of deprivation are evaluated further in chapter 3 of
this thesis (data and methods). The purpose of this section of the literature
review is to: identify research gaps within the lifespan variation literature and
demonstrate the value lifespan variation has for understanding mortality
inequalities in Scotland.
Although van Raalte et al. (2011) demonstrate that higher lifespan variation for
the most deprived groups in Finland is driven by differences in mortality rates
across ages 35-55 years old they were unable to account for the contributions
made below these ages. Accounting for deaths below these ages may be
particularly important in Scotland because mortality rates for males aged 15-29
years old from the most deprived group increased between 1981 and 2001
(Leyland et al., 2007a). However this may be in contrast to the mortality at the
youngest ages (below 15 years old) where Scotland has had relatively greater
improvements in mortality rates at some time points compared to England and
Wales (Campbell et al., 2013).
The potentially large contributions to lifespan variation in Scotland from these
ages may have been overlooked if the population had to be truncated in order to
apply an individual level measure of socioeconomic position. Therefore within
the context of this thesis it was valuable to utilise a measure of socioeconomic
deprivation from area level information because it allowed the whole age
distribution of death in the population to be studied. The age distribution does
not need to be truncated as is the case with alternative individual level

Chapter 2: Literature review
91
indicators. Studying the full age distribution of death by socioeconomic
deprivation can help to highlight further the population sub groups that may be
at risk of premature death (Seaman et al., 2015).
Additional insight into the social processes and aetiological pathways that are
driving population level inequality can be gained by including cause of death into
the analysis (van Raalte et al., 2014, van Raalte et al., 2015). Several studies
have identified the age and cause specific components driving the crude trends
in life expectancy and lifespan variation at the population level (Auger et al.,
2014, Karanikolos et al., 2012, Kelly and Preston, 2016). Some of these studies
have highlighted the consequence of harmful behaviours leading to premature
mortality, with particular attention being paid to smoking (van Raalte et al.,
2014, Kelly and Preston, 2016).
Smoking is known to be a major cause of death in Scotland with 1 in 5 deaths
being attributed (Gray and Leyland, 2009). This cause of death is also considered
to be one of the biggest drivers of health inequalities because it is so strongly
patterned by socioeconomic deprivation. For example 34% of adults in the most
deprived group in Scotland smoke compared to only 9% of the least deprived
group (National statistics, 2015). Kelly and Preston (2016) estimated that
population level life expectancy at age 50 in Scotland could be increased by 3.1
years for males and 3.6 years for females if smoking attributable deaths were
removed but did not account for socioeconomic inequality and did not estimate
lifespan variation.
In their study set in Finland van Raalte et al. (2014) did account for
socioeconomic deprivation and demonstrated that smoking had a large impact on

Chapter 2: Literature review
92
differences in life expectancy but little impact on lifespan variation. This was
because of the time lag associated with smoking attributable deaths.
Preventing deaths attributable to smoking could have limited impact on lifespan
variation as they would reduce deaths in ages that potentially contribute to
mortality expansion. This should not be interpreted as a moral judgement about
which ages and causes of death should be prevented but aims to emphasise that
causes of death have different implications for the age processes of mortality.
This reflects the argument that the drivers of life expectancy can differ from the
drivers of lifespan variation (Shkolnikov et al., 2011).
Diverging lifespan variation trends, either at the population level or amongst a
particular socioeconomic group, tend to occur when there is a lack of mortality
compression. This age process of mortality is found to be associated with
premature deaths from causes not attributable to smoking. For example van
Raalte et al. (2014) illustrated that external causes of death amongst the most
deprived socioeconomic group in Finland explained its higher lifespan variation
when it achieved a similar level of life expectancy as the least deprived group.
This was despite the fact that the most deprived group tended to have a
temporal advantage for reducing deaths from circulatory diseases, so
experiencing lower mortality rates from circulatory diseases when reaching the
same level of life expectancy as the least deprived.
In Scotland the causes of death which contributed to the rising mortality rates
following the 1980s were suicide, alcohol and substance abuse and violence
(Leyland et al., 2007b). These causes of death are strongly patterned by
socioeconomic deprivation suggesting that that socioeconomic inequalities in

Chapter 2: Literature review
93
Scotland may account for the diverging lifespan variation trend at the
population level (Popham and Boyle, 2010, Seaman et al., 2016a).
Although international studies have quantified the age and cause specific
contributions driving lifespan variation inequalities by socioeconomic deprivation
this has not been done for Scotland. This is an important research gap to fill
because analysing the social patterning of causes of death can help to inform
decision makers about which types of interventions could ensure future
improvement. For example declines in mortality from circulatory diseases have
been achieved by monitoring and medically treating risk factors such as high
blood pressure, while deaths from lung cancer have fallen over time due to
legislative changes and shifting social norms in smoking (Karanikolos et al., 2012,
van Raalte and Caswell, 2013). Chapter 8 therefore answers the remaining
research questions:
10. Which ages and causes of death contributed to changes in lifespan
variation, over time, for different socioeconomic groups in
Scotland?
11. Which ages and causes of death contributed to the lifespan
variation gap between the most and least deprived socioeconomic
groups in Scotland?
12. Which ages and causes of death contributed to the lifespan
variation gap between the most and least deprived, when life
expectancy was similar, in Scotland?

Chapter 2: Literature review
94
2.7 Literature review summary
In summary, this literature review chapter demonstrated some of the debates
surrounding the study of health, health inequalities and empirical measurements
in research.
The first section demonstrated that our understanding of health has changed
over time, moving from a medical definition to a wider social interpretation.
The second section discussed the persistence of health inequalities in developed
countries (Mackenbach et al., 2008, Marang-van de Mheen et al., 1998, Blane et
al., 1990). A number of theoretical developments were summarised including the
shift away from understanding absolute material poverty as the primary
determinant of health.
The third section then discussed the debates surrounding the conceptual
meaning of health inequalities and how the normative judgements we attach
determines how we quantify the magnitude of health inequalities. This has been
demonstrated by contrasting two, supposedly, different approaches: the
traditional concept of differences between socioeconomic groups compared with
a total inequality concept. It is not the aim of this thesis to make a distinction
between a right and a wrong approach. Rather, it aims to build upon the body of
international literature, demonstrating the value of using lifespan variation as a
measure of total inequality for studying health inequalities within Scotland.
The fourth section identified gaps in the existing lifespan variation literature.
Despite relatively poorer life expectancy at the population level and wider
mortality inequalities between the most and least deprived being well
documented for Scotland little is known about lifespan variation.

Chapter 2: Literature review
95
This thesis makes a unique contribution by analysing the population level
lifespan variation trend in Scotland and demonstrating how this reflects
socioeconomic inequalities in ages and causes of deaths. The following chapter
details the data sources and quantitative analysis methods that were used to
answer the research questions and make an empirical contribution to the
existing body of literature.

96
3 Data and methods
3.1 Introduction
The overarching aim of this thesis is to increase our understanding of mortality
inequalities in Scotland by estimating and analysing lifespan variation, a measure
of total inequality. Life tables are required to calculate lifespan variation. These
are constructed from death counts and population estimates. Life tables are
explained in more detail later in this chapter. In Scotland the agency responsible
for collating vital events statistics is National Records of Scotland (NRS). The
research questions in chapter 4, chapter 5 and chapter 6 required population life
tables while the research questions in chapter 7 and chapter 8 required life
tables stratified by a valid measure of socioeconomic position. Lifespan variation
was measured in this thesis by calculating e† which is interpreted as average
number of years remaining at death and measures life years lost when a death
occurs. A critical evaluation of e† is included later in this chapter.
Figure 8 summarises the broad research aims of each analysis chapter, the data
used and the statistical tests, measure, or method applied in order to answer
the specific research questions

97
Data
Chapter 5: Quantify ages of death driving lifespan
variation trend
Chapter 4: Describe the population level lifespan
variation trend
Chapter 6: Quantify ages of death driving lifespan variation gap at shared level
of life expectancy
Chapter 7: Evaluate changes to socioeconomic gradient
for lifespan variation
Chapter 8: Quantify ages and causes of death driving socioeconomic inequalities in
lifespan variation
Rese
arc
h a
ims
Analy
sis
Human Mortality
Database life tables
Joinpoint regression
Age-specific decomposition of population level
lifespan variation Calc
ula
te life
span v
aria
tion (e
†)
Constru
ct life
table
s stratifie
d b
y
socio
econom
ic d
epriv
atio
n
Monte-Carlo simulations
Slope Index and Relative index of
inequality
Age and cause specific decomposition of
lifespan variation by socioeconomic
deprivation
NRS death counts
NRS commissioned population
estimates
Carstairs score
Figure 8 Summary of research stages
Measurement

Chapter 3: Data and methods
98
Life table data suitable for answering the research questions in chapter 4,
chapter 5 and chapter 6 were available from the Human Mortality Database
(HMD). The HMD is highly regarded and allowed annual lifespan variation
estimates for the total population of Scotland to be calculated from 1950. This
was then analysed and cross-national comparisons carried out using joinpoint
regression (chapter 4) and age-specific decomposition (chapter 5 and 6).
However this data source does not include any information on socioeconomic
position.
Lifespan variation estimates stratified by a valid measure of socioeconomic
position were required to answer the research questions in chapter 7 and
chapter 8. Census population estimates for four most recent Census years (1981,
1991, 2001 and 2011) were obtained via a commissioned request from NRS.
These were matched with the relevant death counts, produced by NRS but
already held at the MRC/CSO Social and Public Health Science Unit, University of
Glasgow. These were subsequently matched with the Carstairs score, a validated
measure of socioeconomic deprivation that has been derived from four Census
variables at every Census since 1981. The stages of data management carried
out in order examine lifespan variation stratified by socioeconomic position are
described in this chapter: these included statistically modelling mortality rates
beyond the oldest age (85+) for which population estimates were available from
the NRS commissioned request. Monte-Carlo simulations, the slope index of
inequality and the relative index of inequality were used to answer the research
questions in chapter 7. Age and cause specific decomposition of lifespan
variation by socioeconomic deprivation were used to answer the research
questions in chapter 8.

Chapter 3: Data and methods
99
This chapter has two main sections. The first data section outlines the data
sources used and critically evaluates their strengths and limitations against
alternatives that were considered. The second section (methods, measures and
statistical tests) demonstrates the evolution of the analysis from descriptive
results through to those that allowed quantification and statistical inferences to
be drawn.
3.2 Section 1: Data
The first section of this chapter will discuss the two data sets that were used:
the life tables from the HMD, and the population estimates and death counts
from NRS matched with the Carstairs score used to construct life tables. These
data are considered secondary data: they were not intentionally collected for
the purposes of this thesis (Lumme et al., 2015).
3.2.1 Human Mortality Database life tables
The research questions in chapter 4, chapter 5 and chapter 6 were concerned
with assessing the population level lifespan variation trend for Scotland, over a
significant time period and in a cross-national comparative context. In order to
do this annual lifespan variation estimates had to be calculated for the total
population of each country. Lifespan variation is calculated from life tables
which are freely available from the HMD, upon registration.
The aim of the HMD is to formally record changes to population longevity in
order to enable research into its causes and consequences (Wilmoth et al.,
2007). In order to achieve this aim the HMD collects vital events statistics and
population estimates from a range of countries and produces comparable period
life tables. These data have a long history of being collected at the national

Chapter 3: Data and methods
100
level in Scotland, with death records beginning in the middle of the 19th Century
(National Records of Scotland, 2016c).
Chapters 4 utilises the period life table data for Scotland and 16 comparator
populations. The comparator countries and the years for which data were
available are given in table 2. Countries were grouped according to the
geographical regions used by Mackenbach et al. (2008). Chapters 5 and chapter 6
utilise the life table data for Scotland and for England and Wales only.

Chapter 3: Data and methods
101
Table 2 comparator countries and years for which complete period life tables were used for
analysis in Chapter 4
Country Years data available Country group(Mackenbach et al., 2008)
Scotland 1950-2011
West England & Wales 1950-2011
Northern Ireland 1950-2011
Ireland 1950-2009
Denmark 1950-2011
North Finland 1950-2009
Norway 1950-2009
Sweden 1950-2011
Austria 1956-2010
West Germany* 1956-2010 Continental
Switzerland 1950-2011
Belgium 1950-2012
France 1950-2012
Netherlands 1950-2009
Spain 1950-2009
Italy 1950-2009 South
Portugal 1950-2012
*West Germany is the area of unified Germany formally known as the Federal
Republic of Germany (FRG). The territory has changed over time but the
statistics here represent the regions that made up the FRG.

Chapter 3: Data and methods
102
3.2.1.1 Description of period life table
A period life table is a vital tool for carrying out demographic research which
displays a range of information about the mortality experience of a population
(Wunsch et al., 2013). The life tables utilised for this thesis were period life
tables. The population included in a period life table can be understood as a
synthetic or hypothetical population. This is because it does not record how an
actual birth cohort dies out (cohort life table) but rather models what would
happen to a population if a given set of mortality conditions were experienced
(Wunsch et al., 2013, Preston et al., 2001). Life tables are constructed
separately for males and females because of their differing mortality
experiences.
The definitions of the columns that make up a period life table are detailed in
table 3.

Chapter 3: Data and methods
103
Table 3 Period life table column definitions
x Single year of age (0-110+)
N population estimates by single year of age
D Deaths by single year of age
n Width of age interval
mx Death rate between ages x and x+n
qx Probability of death between ages x and x+n
ax Average length of survival between ages x and x+n of persons dying in the interval
lx Number of survivors at exact age x, assuming l(0) = 100,000
dx Number of deaths between ages x and x+n
Lx Number of person-years lived between ages x and x+n
Tx Number of person-years lived after exact age x
ex Life expectancy at exact age x (in years)
Age specific mortality rates (mx) are constructed from the number of deaths (D)
in each given year divided by the population estimates (N). qx shows the
probability of a person at that age dying in the next year of life. From this
probability a number of statistics can be derived. Transforming age specific
mortality rates into probabilities may lack precision if the numbers of deaths are
low or if the population at risk is small (Preston et al., 2001). The life tables
obtained from the HMD cover entire populations meaning limited consideration
needs to be given to small sample sizes. For example the full population of
Scotland has had an estimated population of at least 5,062,940 and between
53,661 and 65,747 deaths per year since 1954 (National Records of Scotland,

Chapter 3: Data and methods
104
2014b). Although the total sample size is not small when analysing population
trends this was a consideration when stratifying by socioeconomic deprivation.
This issue is addressed later on in this chapter.
The life tables obtained from the HMD were complete period life tables as
opposed to abridged life tables. Abridged life tables present the mortality
experience broken by age groups: a complete life table presents the mortality
experience for each single year of age. There are advantages and disadvantages
to using both approaches.
The main motivation for constructing abridged life tables arises from problems
stemming from age heaping, where by recording of age data may be
misclassified because of rounding to years ending in 0 or 5. This can result in an
overestimated and under estimation of age data when broken down by single
years of age that can be overcome by grouping 5 year age groups together
(Kostaki and Panousis, 2001). Small population sizes or rare events may also
make abridged life tables more appropriate. However a more precise
representation of the mortality experience of interest is provided when using
complete life tables (Preston et al., 2001).
The HMD provided robust complete period life tables that were suitable for
analysing Scotland‘s population level trend, relative to 16 comparator
populations over a substantial period of time (table 1). However these data
could not be used to stratify the population by socioeconomic position, which
has a long established association with mortality inequalities. The literature
review demonstrated why it is important to know how lifespan variation is

Chapter 3: Data and methods
105
patterned by socioeconomic position in Scotland, and why assessing the
socioeconomic gradient for lifespan variation over time is of interest.
3.2.2 National Records of Scotland data
The research questions in chapter 7 and chapter 8 were concerned with
assessing changes to the socioeconomic gradient for lifespan variation in
Scotland, over time. In order to do this lifespan variation estimates stratified by
a valid measure of socioeconomic position had to be calculated. Lifespan
variation is calculated from life tables which are constructed from the number
of deaths in a given year divided by the relevant population estimates.
Therefore the basic data required were deaths and population estimates
stratified by a valid measure of socioeconomic position.
The most robust population estimates are derived from the Census which is
carried out every ten years in Scotland. Census population estimates were
utilised in chapter 7 and chapter 8 of this thesis. Census population estimates
are updated annually to produce mid-year population estimates until the next
Census. Mid-year population estimates refer to the ‗usually resident‘ population
on June 30th every year while Census population estimates refer to the
population on Census day (Office for National Statistics, June 2016). NRS provide
the HMD with the relevant vital events statistics and population estimates for
Scotland. Although deaths and population estimates have a long history of being
collected in Scotland (National Records of Scotland, 2016c) it is challenging to
stratify the population by a consistent measure of socioeconomic position.

Chapter 3: Data and methods
106
3.2.3 Measuring socioeconomic position in Scotland
The measurement of socioeconomic position has evolved over time and no single
authoritative measure exists. Rather a number of measures are available each
capturing different social and economic characteristics across different levels
(e.g. individuals, households or areas) and across different stages of the life
course (e.g. infancy, childhood, adolescence and adulthood) (Krieger et al.,
1997, Bailey et al., 2003b). The inability for one measure to adequately capture
all dimensions of socioeconomic position reflects the complexity of the construct
(Galobardes et al., 2006). It is also important to recognise that optimal
indicators of socioeconomic position may change over time and the relevance of
indicators may differ between populations or cohorts (Næss et al., 2005). It is
therefore important to consider the conceptual basis of different measures of
socioeconomic position to ensure that the correct measure is used, results are
interpreted appropriately, and that the measure used is appropriate for making
the intended comparisons (Rose et al., 2005).
Four measure of socioeconomic position were considered for use within this
thesis: Registrar-General‘s Social Class (RGSC), National Statistics Socio-
economic classification (NS-SEC), the Carstairs score and the Scottish Index of
Multiple Deprivation (SIMD). The first two are measures of individual level social
class and the latter two are relative measures of area level socioeconomic
deprivation. Household level measures are not discussed as it would not have
been possible to derive a household level measure of socioeconomic position
from the death data obtained.

Chapter 3: Data and methods
107
In order to determine which approach and which measure of socioeconomic
position was most appropriate for this thesis the following criteria were
considered: (1) the relevance of the measure‘s conceptual and theoretical
framework (2) the availability of the measure and its ability to reflect a
consistent meaning over time (3) the ability for population data and death data
to be matched to the measure. The measures are summarised in relation to
these criteria in table 4 and a more detailed discussion follows.

108
Table 4 Summary of socioeconomic measures considered for this thesis
Occupation based social class (individual level) Relative socioeconomic deprivation (area level)
RGSC NS-SEC Carstairs SIMD
Theore
tical/
conceptu
al
fram
ew
ork
Conceptual basis constructed in retrospect. This alluded to culture being more important than material factors in explaining morality inequalities. Culture referred to knowledge of health and hygiene. Culture was perceived to be related to occupational status rather than to income or wealth.
Adapted Goldthorpe schema (sociological classification) which brought together social classes in terms of work and market situations. Internationally accepted and conceptually clear. Validated as a measure of health and as a predictor of health, education and numerous outcomes.
Conceptual basis established prior to construction. Variables selected on their ability to conceptualise relative deprivation in different areas. Variables selected on the basis that they would reflect the features of deprivation most relevant for health inequalities.
Datazones constructed to reflect physical boundaries, natural communities and households with similar social characteristics. Includes multiple domains that are weighted depending on the theoretical relevance for deprivation. Includes a measure of mortality and morbidity which means full indicator cannot be used for health research.
Availabilit
y &
consi
stency Introduced in 1913 as it applied to
1911 Census, cannot be directly derived for 2001 or 2011.
Introduced at the time of the 2001 Census and subsequently available for use in all official statistics and surveys.
Derived from four Census variables. Available for 1981, 1991, 2001 and 2011 Census.
Introduced in 2004. Subsequently available for 2006, 2009, 2012 and 2016.
Matc
h w
ith C
ensu
s pop.
& d
eath
s
Risk of numerator/denominator bias as occupation in Census may differ from occupation reported on death certificate. SLS linked data can overcome this but only available from 1991 (compromises criteria 2).
Risk of numerator/denominator bias as occupation in Census may differ from occupation reported on death certificate. SLS linked data can overcome this but only available from 1991 (compromises criteria 2).
Matching with deaths and Census population estimates possible using postcode sector.
Matching with deaths and Census population estimates possible using datazones .

Chapter 3: Data and methods
109
3.2.3.1 RGSC & NS-SEC
The RGSC is one of the oldest methods for categorising the socioeconomic
position of individuals based on their occupation. It was first applied in 1913 to
the 1911 Census. The ‗five social classes‘ aimed to capture the social division
between the upper, middle and working social classes.
The RGSC proposed that culture was more important for health than material
factors (Rose and Pevalin, 2003). Culture was interpreted as knowledge about
health and hygiene and was presented as being more related to occupation than
to income or wealth. This conceptual interpretation sees the hierarchy of
occupations as being important for health because it reflects the hierarchy of
occupations in terms of social reputation rather than in terms of income. This
was later changed and social class category was assigned to reflect occupational
skill as opposed to perceived social standing, although only 7% of occupations
were reassigned to a different social class (Rose, 1995). A clear conceptual
reasoning for assigning occupations to each social class was missing when this
measure was first derived and the theoretical interpretation of culture was only
developed in retrospect (Rose, 1995).
Further criticisms were directed at the RGSC as it had failed to respond
adequately to changes in the occupation structure over time: the decreasing
proportion of people in the lowest social class for example which was partly
caused by increased female participation in the labour market and partly caused
by changes to the skill set demanded by the economy (Leyland et al., 2007a).
This prompted the development of a new social class classification, the NS-SEC.
On appearances the two measures of occupation based social class may seem

Chapter 3: Data and methods
110
similar but it is not possible to read across the two measures (Rose and Pevalin,
2003, Leyland et al., 2007a).
The NS-SEC assigns a code to each occupation which corresponds to an
occupation unit group conceptualised in relation to Goldthorpe‘s schema (Rose
and Pevalin, 2003). The position of an occupation within the classification
structure reflects level of job authority, control and autonomy but is not
intended to be interpreted as a hierarchy, although it often is (Rose et al.,
2005). Goldthorpe‘s schema framed social class in terms of employment
relations as opposed to occupational status or skill. Employment relations are
concerned with: individual‘s capacity to sell or buy labour, an individual‘s
relationship with work, and the interactions with the employment structure that
exists in society. The theoretical framework aims to communicate the idea that
occupation based social classes do not exist in isolation but are defined in terms
of one another e.g. an individual cannot be an employee if they do not have an
employer (Krieger et al., 1997). Therefore NS-SEC is a measure of socioeconomic
position which seeks to capture the fact that employment relations and
regulations are mechanisms which impact the social structure of modern
societies (Goldthorpe, 2007, Krieger et al., 1997). This approach is
internationally recognised and a major strength of the empirical measurement is
that it was developed alongside a coherent theoretical framework (Rose et al.,
2005). However a clear conceptual basis does not mean that it was a suitable
measure for use within this thesis. It was inappropriate for the following three
reasons.

Chapter 3: Data and methods
111
Firstly, analysing trends over time are often restricted to short time periods if
using occupation based measures of social class. For instance the NS-SEC was
introduced in 2001 which meant that it would not have been possible to apply it
easily to the 1980s. This was when life expectancy improvements in Scotland
began to stall and premature mortality rates changed (McCartney et al., 2012b,
Leyland et al., 2007b).
Although the RGSC did enable social inequalities to be empirically studied for
most of the last century it was not directly derivable for 2001 and 2011. It is also
not appropriate to make direct comparisons between the RGSC and the NS-SEC
(Leyland et al., 2007a). They have distinct interpretations of the features of
employment that are important for social stratification which need to be
recognised if they are to be used appropriately. Therefore it would not have
been possible to construct stratified life tables that were theoretically and
empirically consistent over the time period of interest using an individual level
measure of occupation based social class.
Secondly, caution needs to be exercised when deriving health estimates for
social class subgroups from so called ‗unlinked data‘: these may be vulnerable to
numerator/denominator bias (Shkolnikov et al., 2007). This is because the
classification of social class derived from occupation on a death certificate is
reported by proximal sources and may be less accurate than social class derived
from self-reported occupation on the Census. This may result in the health
estimates being overestimated for some occupational groups and
underestimated for others (Carstairs and Morris, 1990, Shkolnikov et al., 2007).
The most accurate data for analysing health differences between social class

Chapter 3: Data and methods
112
groups is linked data (Shkolnikov et al., 2007). The Scottish Longitudinal Study
(SLS) is the largest, most comprehensive linked data set available for Scotland. It
links Census data from 1991 onwards with vital events, education and NHS data
for a 5%, nationally representative sample of the Scottish population (Boyle et
al., 2009a). These data could have been utilised in this thesis but as it only
began in 1991 it was not deemed to be an optimal source for trend analysis. The
temporal aspect of the SLS is one of its major limitations especially when
compared to the Office for National Statistics Longitudinal Study for England (LS)
which is linked to Decennial Census records from 1971 onwards (Gayle et al.,
2008).
Thirdly, socioeconomic measures derived from occupation are not directly
applicable to people who are not currently in employment (Galobardes et al.,
2006). One possible approach to overcome this could have been to obtain the
occupation based social class of spouses and assign based on this. This approach
can also be used when both spouses are employment, with the highest ranking
category in the household taken, to give a more detailed picture of the
magnitude of mortality differences between social classes. However it is an
approach that is criticised: household level social class is often identical to
individual class and is still unable to ascertain a social class category for
unmarried, cohabiting couples or single person households (Erikson and
Torssander, 2008). Being unable to assign everyone in the population to a social
class was problematic in the context of this thesis: it aimed to analyse lifespan
variation inequalities for the entire Scottish population. This is one of the
advantages of the Carstairs score and the Scottish Index of Multiple Deprivation

Chapter 3: Data and methods
113
which were considered for use within this thesis: they are measures applied to
areas rather than to individuals and are applicable to the entire population.
3.2.3.2 Carstairs Score & the SIMD
The Carstairs score is measure of relative deprivation that was first derived from
the 1981 Census. It is derived from four Census variables (table 6) taken from
small areas called postcode sectors; overcrowding, male unemployment, no car
ownership and low social class. A postcode sector is a group of postcodes that
are the same, minus the last two characters (for example G41 3**). Postcodes
and postcode sectors are subject to boundary changes over time meaning they
are not coterminous: a postcode and postcode sector boundaries are not
necessarily the same over time (National Records of Scotland, 2016b). Table 5
details the number of postcode sectors in Scotland, the mean population size
and the standard deviation at each Census year.
Table 5 Postcode sector, population size and standard deviation
Year Total number of postcode sectors Mean population size (SD)
1981 1010 4982.47 (3952.18)
1991 1001 4993.02 (3698.52)
2001 1010 5011.89 (3437.63)
2011 1012 5232.61 (3567.34)
The composite of the four variables used (see table 6) are considered to be a
summary measure of population deprivation suitable for constructing a score
which quantifies the level of relative deprivation in different areas (Carstairs
and Morris, 1990). Although the formal definitions of the variables used for the

Chapter 3: Data and methods
114
Carstairs score have changed between Census years the scores for each area
over time are highly correlated. This suggests that the underlying information
the variables aim to capture is similar or that deprivation has remained stable
over time (Leyland et al., 2007a). However the relevance of the variables for
capturing the meaning of deprivation across contexts and changes over time has
been questioned (Norman, 2010). Criticisms have focused on the importance car
ownership has for individual experiences of deprivation being fundamentally
different between rural and urban contexts, and for overcrowding to occur out
of choice and for cultural reasons rather than simply being a marker of
deprivation (Fischbacher, 2014).
Table 6 Carstairs Score variables (Brown et al., 2014)
Carstairs Score Census variables
Overcrowding
Persons living in a private household with a density of more than one person per room, as a proportion of all people in private households
Male unemployment
Economically active males seeking or waiting to start work, as a proportion of all economically active males
No car ownership
Persons in private households which do not own a car, as a proportion of all people in private households
Low social class
Persons in private households with an economically active head of household in social class IV or V, as a proportion of all people in private households with an economically active household reference person

Chapter 3: Data and methods
115
3.2.3.3 Calculating the Carstairs score
The Carstairs score is a standardised index of area deprivation which is
calculated from the unweighted combination of the four variables (Table 6)
standardised using z-scores. A z-score is a statistical method for measuring the
relationship between observations for a population sub-group and the mean of
those observations for the total population. In the case of the Carstairs index the
score for a variable in a postcode sector and the mean score for that variable for
Scotland. A z-score of zero means the score is the same as the population mean
score. A higher score indicates higher deprivation and a lower score (below zero)
indicates lower deprivation.
The method used is as follows:
1. Calculate the proportion of each of the four variables for each postcode
sector
2. Calculate the mean and standard deviation of the four variables for all of
Scotland
3. Compute the z-score for each component variable by postcode sector
4. Add together the four z-scores for each of the component variables by
postcode sector
Table 7 gives an example of how the Carstairs z-score is the sum of the
standardised values of each component variable using data for 1991 for postcode
sector G41 3.

Chapter 3: Data and methods
116
Table 7 Example of calculating Carstairs score, Postcode sector G41 3 (1991)
Census variable Mean SD calculation z-score
overcrowding 0.0816 0.074 0.044 =(0.0816-0.074)/0.044 0.173
unemployment 0.0981 0.13 0.084 =(0.098-0.13)/0.084 -.381
No car 0.396 0.338 0.178 =(0.396-0.338)/0.178 0.326
Low social class 0.116 0.208 0.086 =(0.116-0.208)/0.086 -1.07
Overall Carstairs score for G41 3 =0.173+-0.381+0.326+-1.07 -0.952
The continuous Carstairs index scores are often categorised into quintiles (fifths
of the distribution). The category cut-offs can delineate equal numbers of areas
(postcode sectors) in each quintile or equal numbers of person. The latter
‗population weighted quintiles‘ are preferable due to the uneven distribution of
persons across postal sectors. Table 8,9,10 and 11 shows there are around 1
million persons in each quintile at every Census year.
One important limitation of the Carstairs Score is that the variables it is derived
from are only collected once every ten years. This prompted the need for a
measure that could be updated more frequently. This issue was addressed with
the introduction of the SIMD in 2004.
3.2.3.4 SIMD
The SIMD is applied to small areas called datazones, each containing between
500-1000 household residents. Each datazone aims to reflect physical
boundaries, natural communities and households with similar social
characteristics (Flowerdew et al., 2007). The most recent publication was
SIMD16 and included 6,976 datazones. The mean population size of a datazone in
SIMD16 was 766.57 (SD 188.25) (The Scottish Government, 2016).

Chapter 3: Data and methods
117
The SIMD takes 38 indicators of deprivation and collates these into 7 domains:
employment, income, health and education; skills, training, and geographic
access to services; crime and housing (Scottish Executive, 2006). Many of the
indicators are updated annually and the domains are not solely reliant on Census
data which are inherently costly. These are some of the advantages of the SIMD
over the Carstairs score (Bailey et al., 2003b). However the full SIMD includes a
health domain which is derived from indicators of mortality and morbidity, thus
it is not suited for use in analyses trying to associate health and deprivation.
Health inequalities research tends to apply the income domain of the SIMD only
to overcome this problem (Seaman et al., 2015). This is deemed appropriate
because the income domain is one of the most heavily weighted domains and is
highly correlated with the overall score. On reflection this can make the
Carstairs score more appropriate for analysing health inequalities at an area
level as it intentionally sought out variables that were strongly associated with
health but does not include a health dimension, meaning the full score can be
applied.
Despite the empirical differences between the Carstairs score and the SIMD
these approaches are both highly regarded for attempting to incorporate a
multitude of measures to reflect the multifaceted nature of deprivation that
exists across structures in society (Townsend, 1987). They build upon
Townsend‘s (1987) concept of relative deprivation which emphasises that it is
the potential individuals have to access the resources required to enable them
to participate in the manner expected by society. Rather than only the potential
to access material resources it is the potential to engage in relationships,
partake in roles and adopt customary behaviours (Townsend, 1987). Deprivation

Chapter 3: Data and methods
118
is defined by Townsend (1987) as ‗a state of observable and demonstrable
disadvantage relative to the local community or wider society to which an
individual or group belongs‘. It is distinct from the concept of absolute poverty
because it is relative to the prevailing conditions. This means that the concept
of deprivation is unique to every known society and its interpretations can
evolve over time (Townsend, 1979).
3.2.3.5 Individual level and area level interpretations
The critical evaluation of the RGSC, NS-SEC, Carstairs score and SIMD has
illustrated some of the theoretical and empirical differences between measures
of socioeconomic position. These measures also differed in terms of whether
they aimed to act as a proxy for area level determinants or as proxy for
individual level determinants which require different interpretations that should
not be confused. An example helps to highlight the contention between area
level proxy measures which ‗capture characteristics of populations‘ and
individual level proxy measures which ‗capture characteristics of individuals‘
(Leyland et al., 2007a). GPs aiming to reduce inequalities between individuals by
providing preventative screening programmes may rely on the SIMD to target
those deprived, they may target an individual in a deprived area who is actually
well-off. So relying on an area level measure to reduce health inequalities
between individuals is problematic if there is an assumption that the underlying
characteristics of the population are socially homogenous (Fischbacher, 2014).
Area level measures can therefore be accused of overlooking the fact that
deprived and non-deprived individuals do not exclusively reside in deprived and
non-deprived areas (Leyland et al., 2007a).

Chapter 3: Data and methods
119
These limitations are counterbalanced by some empirical advantages. For
instance health inequalities research reports findings for a range of geographical
levels. Most of these higher geographies are built up from postcodes which are
deemed to be the most convenient way of allocating an area reference to
individuals based on their home address. Since home address is recorded for
individuals across services, for example on hospital admissions and GP registers,
this unit of measurement has an immediate advantage over social class or
occupation that is not. Therefore area-level measures are valuable for increasing
the opportunities available to researchers to help explain the causes of health
inequalities (Carstairs and Morris, 1990). Area level measures can also provide an
opportunity to capture subgroups of the population that were historically
excluded from traditional measures of occupation based social class, in
particular women, younger age groups and the unemployed. Although a
household level measure also has the potential to do this it was not possible to
derive a household level measure of socioeconomic position from the death data
that was obtained.
3.2.3.6 Subsection summary
The literature review described the body of evidence demonstrating the social
gradient that exists for mortality, particularly in Scotland. Assessing the
socioeconomic gradient for lifespan variation will add to our understanding of
mortality inequalities in Scotland. This has not previously been done despite long
running data being widely available. Complete period life tables, constructed
from death counts and population estimates are required to calculate lifespan
variation. The previous subsection critically evaluated the options available to
stratify the population of Scotland by socioeconomic position. Individual level

Chapter 3: Data and methods
120
social class and area level socioeconomic deprivation have been compared and
the strengths and weakness of each discussed.
The Carstairs Score was deemed to be most appropriate for the following
reasons. It could be utilised to cover the time period between 1981 and 2011,
albeit at ten year increments, which captures the time period when life
expectancy improvement in Scotland began to stall (McCartney et al., 2012b). It
had a clear conceptual basis prior to being constructed. The variables included
were intentionally selected to account for inequalities in health which is the
focus of this thesis (Carstairs and Morris, 1990). The Carstairs scores can be
aggregated to population weighted deprivation quintiles (as noted above)
allowing for a consistent meaning over time; even though deprivation will have
changed over time there is always a conceptual 20% most deprived compared
with a 20% least deprived. And finally a Carstairs Score for each part postcode
sector in Scotland has previously been calculated systematically and were
readily available at the time of research (MRC/CSO Social and Public Health
Sciences Unit University of Glasgow, 2016).
The following subsection details the data management processes that were
carried out to produce life tables for all-cause mortality by quintiles of
deprivation, as measured using the Carstairs Score. The Carstairs score data file
is freely available online (MRC/CSO Social and Public Health Sciences Unit
University of Glasgow, 2016).
3.2.4 Constructing all-cause mortality life tables
Life tables are constructed from age specific all-cause mortality rates that are
calculated from death counts and Census population estimates. Table 8 to table

Chapter 3: Data and methods
121
11 detail the aggregated population estimates and death counts used to
construct deprivation specific life tables at each Census year.

122
Table 8 1981 aggregated population estimates and death counts used to construct deprivation specific life tables
Population estimates NRS
commissioned Request
Total pop
variable
from Carstairs
All cause death counts
Males Females Persons 1, 2 Persons Males Females Persons 3
1981 data total 2,428,471 2,606,841 5,035,312 5,032,295 94,143 96,318 380,713
excluded from analysis 2,524 1,162 3,686 - 90 119 209
quintile 1 (least dep.) 480,582 523,678 1,004,260 1,004,457 16,748 19,230 35,978
quintile 2 483,834 516,776 1,000,610 1,000,695 18,335 19,279 37,614
quintile 3 480,644 512,768 993,412 993,206 18,088 18,199 36,287
quintile 4 493,061 532,936 1,025,997 1,026,153 20,602 20,412 41,014
quintile 5 (most dep.) 487,826 519,521 1,007,347 1,007,784 20,280 19,079 39,359
total included in analysis 2,425,947 260,5679 5,031,626 - 94,053 96,199 19,0252
11981 population estimates by individual postcode included 21 Armed forces postcodes which a Carstairs Score is not calculated for. 2Postcode data included 18
postcodes which could not be matched to higher level geography. 3Deaths excluded from the analysis in 1981, 1991 and 2001 did not contain adequate information
for assigning geography

123
Table 9 1991 aggregated population estimates and death counts used to construct deprivation specific life tables
1991
Population estimates NRS
commissioned Request
Total pop
variable
from Carstairs
All cause death counts
Males Females Persons Persons Males Females Persons 3
1991 data total 2,391,961 2,606,606 4,998,567 4,998,012 580,22 62,957 120,979
excluded from analysis 275 28 303 196 560 756
quintile 1 (least dep.) 493,588 528,558 1,022,146 1,022,146 9,758 12,053 21,811
quintile 2 470,435 505,303 975,738 975,738 11,002 11,947 22,949
quintile 3 480,450 521,528 1,001,978 1,001,726 11,255 12,193 23,448
quintile 4 473,864 523,921 997,785 997,785 12,300 12,946 25,246
quintile 5 (most dep.) 473,349 527,268 1,000,617 1,000,617 13,511 13,258 26,769
total included in analysis 2,391,686 2,606,578 4,998,264 - 57,826 62,397 120,223
3Deaths excluded from the analysis in 1981, 1991 and 2001 did not contain adequate information for assigning geography

124
Table 10 2001 aggregated population estimates and death counts used to construct deprivation specific life tables
Population estimates NRS
commissioned Request
Total pop
variable
from Carstairs
All cause death counts
Males Females Persons Persons Males Females Persons 3
2001 data total 2,432,494 2,629,517 5,062,011 5,062,011 81,611 90,056 171,667
excluded from analysis 0 0 0 - 36 37 73
quintile 1 (least dep.) 493,995 520,725 1,014,720 1,014,720 12,905 16,149 29,054
quintile 2 490,600 521,874 1,012,474 1,012,474 15,332 17,181 32,513
quintile 3 484,529 524,910 1,009,439 1009439 16266 18285 34551
quintile 4 484,503 528,994 1,013,497 1,013,497 17,151 18,307 35,458
quintile 5 (most dep.) 478,867 533,014 1,011,881 1,011,881 19,921 20,097 40,018
total included in analysis 2,432,494 2,629,517 5,062,011 - 81,575 90,019 17,1594
3Deaths excluded from the analysis in 1981, 1991 and 2001 did not contain adequate information for assigning geography

125
Table 11 2011 aggregated population estimates and death counts used to construct deprivation specific life tables
Population estimates NRS
commissioned Request
Total pop
variable
from Carstairs
All cause death counts
Males Females Persons Persons Males Females Persons
2011 data total 2,567,444 2,727,959 5,295,403 5,295,403 77,340 84,401 161,741
excluded from analysis 0 0 0 - 0 0 0
quintile 1 (least dep.) 510,021 546,807 1,056,828 1,056,828 17,670 18,201 35,871
quintile 2 512,340 546,570 1,058,910 1,058,910 15,891 16,946 32,837
quintile 3 512,778 545,654 1,058,432 1,058,432 15,290 17,180 32,470
quintile 4 513,485 544,783 1,058,268 1,058,268 15,089 17,083 32,172
quintile 5 (most dep.) 518,820 544,145 1,062,965 1,062,965 13,400 14,991 28,391
total included in analysis 2,567,444 2,727,959 5,295,403 - 77,340 84,401 161,741

Chapter 3: Data and methods
126
Detailed individual death record data for Scotland since 1974, produced by NRS,
are held by the MRC/CSO Social and Public Health Science Unit, University of
Glasgow. Population estimates by single year of age and geographical level
derived from the Census in 1981, 1991, 2001 and 2011 were obtained via a
commissioned request from NRS.
The population estimates files obtained were not consistent across all four
Census year (1981, 1991, 2001, and 2011) in terms of level of geography and
final open ended age group. Extensive data management was required in order
to match population estimates to death data and Carstairs Score on postcode
sector and then aggregate into population weighted deprivation quintiles. It was
also only possible to match these data with an open ended age category of 85+.
A complete period life tables require the final open ended age category to be
110+. Therefore the mortality rates beyond age 85 + had to be modelled.
The data management processes that were carried out will now be described
and the implications of missing data reflected upon. The data management
processes are summarised in figure 9.

127
Deaths by Carstairs quintile, SYOA and sex surrounding each census year e.g. deaths for 1981 were deaths from 1980, 1981 & 1982. 1991 is 2 years due to boundary
changed. Three years of data used
to provide more robust estimates.
1981 start here
NRS Population estimates by SYOA, sex &
individual postcode
Aggregate population estimates by SYOA, sex & Carstairs quintile and multiply by 3 to match number of
events
Match with Carstairs quintile on postcode sector and LGD (1991)
Council area (2001, 2011)
Match NRS population estimates to higher level geography (postcode sector and LGD) on
postcodes
Aggregate NRS population estimates by SYOA, sex,
postcode sector & LGD
Carstairs Score for each postcode sector and population weighted
quintile
Match deaths and population estimates on SYOA, sex &
Carstairs quintile
N D Age sex Year Quintile
18804 207 0 1 1981 1
19047 13 1 1 1981 1
8460 334 85+ 1 1981 1
. 286 86 1 1981 1
. 272 87 1 1981 1
. 223 88 1 1981 1
1991, 2001, 2011 start here
NRS Population estimates by SYOA, sex, postcode sector and
LGD/ council area
Higher level geography
Select postcodes frozen at January
1st 1981
Data
files to
be m
atc
hed
40 separate data files (4 Census year*5 quintiles* 2 sexes) each containing population estimates and deaths by SYOA (85+), sex year
and Carstairs quintile
Figure 9 Summary of data management processes
Key
SYOA ‗single year of
age‘
LGD ‗Local Government
District‘
Outp
ut d
ata
file

Chapter 3: Data and methods
128
3.2.4.1 1981
1981 population estimates by sex and SYOA (up to age 85+) were obtained for each
individual postcode in Scotland (117,102 postcodes in total). Extensive data
management processes were required to aggregate the population estimates by
single postcode to postcode sectors in order to match with the Carstairs
deprivation score. Deaths used for the Census year 1991 were from 1991 and 1992
to increase the number of events. Population estimates were multiplied by two
accordingly. All other Census years used three years‘ worth of death data and
population estimates were multiplied by three accordingly. Deaths occurring in
1990 had to be excluded because of changes to geographical boundaries.
3.2.4.2 Frozen postcodes
The geographical area attached to an individual postcode can change over time:
the size of the geographical area can be changed, the postcode can be removed
entirely from circulation, or reassigned to another area (‗postcode recycling‘). This
means that postcodes are only unique geographical identifiers at one point in time.
The population estimates derived from the Census are therefore covered by a
standard ‗frozen geography policy‘ (National Records of Scotland, 2013a). This
means the underlying postcode database is ‗frozen‘ as it stands on January 1st of
each Census year and all Census outputs are based on the postcodes active on this
date. The Carstairs Score is based on postcode sectors as derived from the Census
meaning that the underlying postcodes were also frozen as of January 1st.
The postcodes detailed in the population estimates therefore uniquely identified
each observation for 1981 but needed to be matched, and then aggregated, by
higher level geography data. This is because the Carstairs Score is based on part-

Chapter 3: Data and methods
129
postcode sector split by Local Government District (LGD) and cannot be matched
directly to individual postcodes.
The total number of individual postcodes used in Scotland, at the time of research,
was 184,560. Of these 117,102 postcodes were active on January 1st 1981 and had
population estimates. 117,063 were successfully matched with higher level
geography data. Of the 39 unmatched postcodes 21 were identified as ‗Armed
Forces‘ and were removed as the Carstairs Score is not calculated for ‗Armed
Forces‘. There was no higher level geography data for the remaining 18 postcodes
to be matched with. The total number of people residing in postcodes that that
could not be matched with higher level geography data was 2,104 which represents
0.04% of the total Scottish population estimates in 1981. Therefore it is valid to
assume that excluding these from the population denominator would not have
greatly impacted the results.
Matching individual postcodes with higher level geography data then enabled the
population estimates to be aggregated by postcode sector and LGD. The individual
postcodes were aggregated up to 1,136 postcode sectors but of these only 1,010
postcode sectors have a Carstairs score. This is because some postcode sectors in
Scotland have very small population sizes meaning that it would not be valid to
calculate a Carstairs score. The 126 postcode sectors that did not match with a
Carstairs score contained 1,582 individuals or 0.03% of the total population of
Scotland in 1981.
Once population estimates were aggregated for the remaining 1,010 postcode
sectors they were matched to the Carstairs score. The Carstairs score data set
contained a total population variable which provided an opportunity to validate

Chapter 3: Data and methods
130
the aggregation and matching processes applied to the population estimate data by
single year of age obtained from NRS for 1981. The total population variable for
each postcode sector in the Carstairs score was not identical to the sum of the
single year of age population estimates obtained from NRS for 84 postcode sectors.
The difference equated to 699 fewer individuals in the NRS commissioned data. A
small difference was expected. This is because the NRS commissioned data would
have been updated more recently than the total population variable in the
Carstairs file. It is not uncommon for population estimates derived from the Census
to be revised at a later date which would explain this small discrepancy.
A small number of deaths, 209 in total, had to be excluded from the 1981 analysis.
These deaths represented 0.05% of all deaths in Scotland in 1981. They were
excluded because the death certificate data were not detailed enough to attach
the death to the correct geography for matching with Carstairs score. At this point
it is appropriate to outline how a death is assigned to a geographical location in
Scotland.
3.2.4.3 Geographical location of deaths
There can be up to three sources of geographical information available on a death
certificate: place of normal residence, place of death, and place of occurrence.
Place of normal residence is the deceased most recent address of residence. Place
of death should reflect exactly where the person died, this could be a detailed
hospital address or it could be a location such as area of countryside or motorway.
Place of occurrence is used in the case of external causes of death and records
where the event occurred if known. It does not specify a precise location but

Chapter 3: Data and methods
131
rather identifiable places such as school, residential home or construction area
(General Register Office for Scotland, 2016).
NRS adopts the following policy for assigning geography to each death. Deaths of
Scottish residents that occur in Scotland are assigned to their place of normal
residence. Deaths of non-Scottish residents that occur in Scotland are assigned a
geography based on their place of death. Deaths of Scottish residents that occur
outside of Scotland are currently not included (General Register Office for
Scotland, 2015).
3.2.4.4 1991
1991 population estimates by sex and SYOA (up to age 90+) were obtained for each
postcode sector and LGD. This removed the need to match the data with higher
level geography and could be matched immediately with the Carstairs score and
matched with deaths. Two postcode sectors included in the NRS commissioned
population estimates were for shipping addresses and were excluded as no
Carstairs score would have been calculated. The population estimates for these
two postcode sectors contained 303 individuals or 0.01% of the Scottish population
in 1991. The NRS commissioned population estimates showed 252 more individuals
than the Carstairs population.
A total of 756 deaths could not be included in the analysis for 1991, again due to
inadequate geographical information on the death certificates. These deaths
represented 0.6% of the total number of deaths in 1991.
3.2.4.5 2001 and 2011
Population estimates for 2001 and 2011 were obtained by sex and SYOA for each
postcode sector and LGD. The open ended age group in 2001 was 85+. The older

Chapter 3: Data and methods
132
age groups in 2011 were grouped as follows: 85-89, 90-94 and 95+. These were
matched with the Carstairs score and matched with deaths. No population data
had to be excluded from the analysis for 2001 or 2011. There was also no
difference between the NRS commissioned population estimates and the Carstairs
population estimates for 2001 and 2011.
73 deaths could not be included in the analysis for 2001. These deaths did not have
adequate information on geography and represented 0.04% of the total deaths in
Scotland in 2001.
At this stage the open ended age group for the population estimate was not
consistent across the four census years and it was not yet possible to construct
complete life tables stratified by socioeconomic position. Deaths were by single
year of age and there was no open ended age group, the last age was the oldest
death that had occurred. A final open ended age category of 85+ was applied to
the population estimates and deaths across all Census years and the mortality rate
past this age modelled. The modelling process is now described.
3.2.5 Modelling mortality rates at extreme old age
To construct complete period life tables a mortality rate for each SYOA up to age
110+ was required. Given that the data available provided a number of known
parameters about the mortality experience and that the population level mortality
rate was available from the HMD up to 110+ it was possible to model a precise
description of the deprivation specific mortality rate beyond ages for which data
were available. The HMD provide a standard protocol for splitting open age
categories and smoothing death rates (Wilmoth et al., 2007). The method applied

Chapter 3: Data and methods
133
in this thesis used the results for Scotland as a whole from the HMD method and
fitted the shape of the curve to each deprivation quintile.
Figure 10 shows the log of mortality rates for males in 1981 by deprivation
quintile. These log mortality rates were calculated from the Census population and
mortality data for ages ≤85. The log mortality rate for all males in Scotland in 1981
from the HMD is plotted as an external comparator. This is for ages 0-110+
Figure 10 Log of mortality rate by age and deprivation quintiles (≤84) compared to HMD (age
0-110+), 1981, males
The following briefly summarises the history of predicting mortality rates beyond a
final age whose values cannot be calculated directly. It is followed by a discussion

Chapter 3: Data and methods
134
on the modelling process that was used in this thesis alongside a worked example.
This process was necessary in order to construct complete deprivation specific
period life tables up to age 110+ years old.
3.2.5.1 Gompertz’s law of mortality
The relationship between mortality and age is considered to be one of the oldest
topics studied in demography (Preston et al., 2001). One of the earliest insights
into mortality and age was by Gompertz (1825) who was aiming to evaluate the
age at which individuals are most likely to die. He produced a mathematical
formula which suggested a population‘s mortality rate increases exponentially with
age and found that the likelihood of dying doubles with every eight to ten years of
age up until 80 years old (Carnes and Olshansky, 2002). The formula showed that
the log of the mortality rate is a linear function of age (Preston et al., 2001). This
finding demonstrated the regularity and predictability of death and was labelled
the ‗law of mortality‘.
However Gompertz only intended the law of mortality formula to be used to
describe the relationship between age and underlying risk of mortality. This meant
it did not allow for causes of death attributable to external accidents or infections
which are assumed to be independent of age (Preston et al., 2001). Makeham
(1860) adapted the law of mortality to account for the constant age-independent
component of mortality. However this age-independent component tends to only
have a negligible impact in developed countries with relatively low mortality.
It is further argued that Gompertz‘s law of mortality over-predicts mortality at the
youngest ages and that it overlooks the fact that the rate of increase in the
mortality rate at extreme old ages may slow. Despite these critiques Gompertz‘s

Chapter 3: Data and methods
135
law of mortality has held over time and across populations, and is especially
accurate across ages 30 to 80 years old. Therefore Gompertz‘s law of mortality
demonstrated that it is possible to use age to model the log mortality rate if
objective data are unavailable.
Considering all of this the log mortality rate could be modelled as a linear function
of age. However an interaction could be included to allow the relationship
between age and the log mortality rate to slow, or a better model on the log scale
could be achieved with a Poisson regression. These three approaches were tested
to establish which was most appropriate for modelling a mortality rate beyond the
ages for which data were available for Scotland.
3.2.5.2 Modelling mortality rates
The predictor variables used were age (continuous) and deprivation (categorical).
Models were further stratified by year (1981, 1991, 2001 and 2011) and sex as the
mortality experience will have changed over time and is known to differ between
males and females.
In total the mortality rate was modelled across the 40 different data sets (4 years×
5 quintiles×2 sexes) that were produced from matching the population estimates
and death counts on Carstairs score (see figure 9). The modelled predictions were
evaluated by plotting them against the mortality rates for the total population of
Scotland from the HMD up to ages 110+. The final model selected for use was the
Poisson model which included a fractional polynomial for age. The stages carried
out to justify this decision are described in the following section using data for
males in 1981 as a worked example.

Chapter 3: Data and methods
136
3.2.5.3 Linear regression of log mortality rate on age (model 1)
The first model tested whether the relationship between age and the log mortality
rate was linear. The log mortality rate was predicted for ages 60 to 110+,
irrespective of deprivation. Age 60 was chosen as the relationship between age and
mortality rate was likely to be linear past this point.
The mortality rate data that were available from the HMD for ages 60 to 110 and
the fitted linear regression are shown in figure 11. From this plot it appears that
the linear regression is a good fit but may not accurately account for mortality at
extreme old ages where the HMD data shows the linear increase in log mortality
rate slowing.
Figure 11 Log of mortality rate by age from HMD (up to age 110+) compared with fitted linear
regression
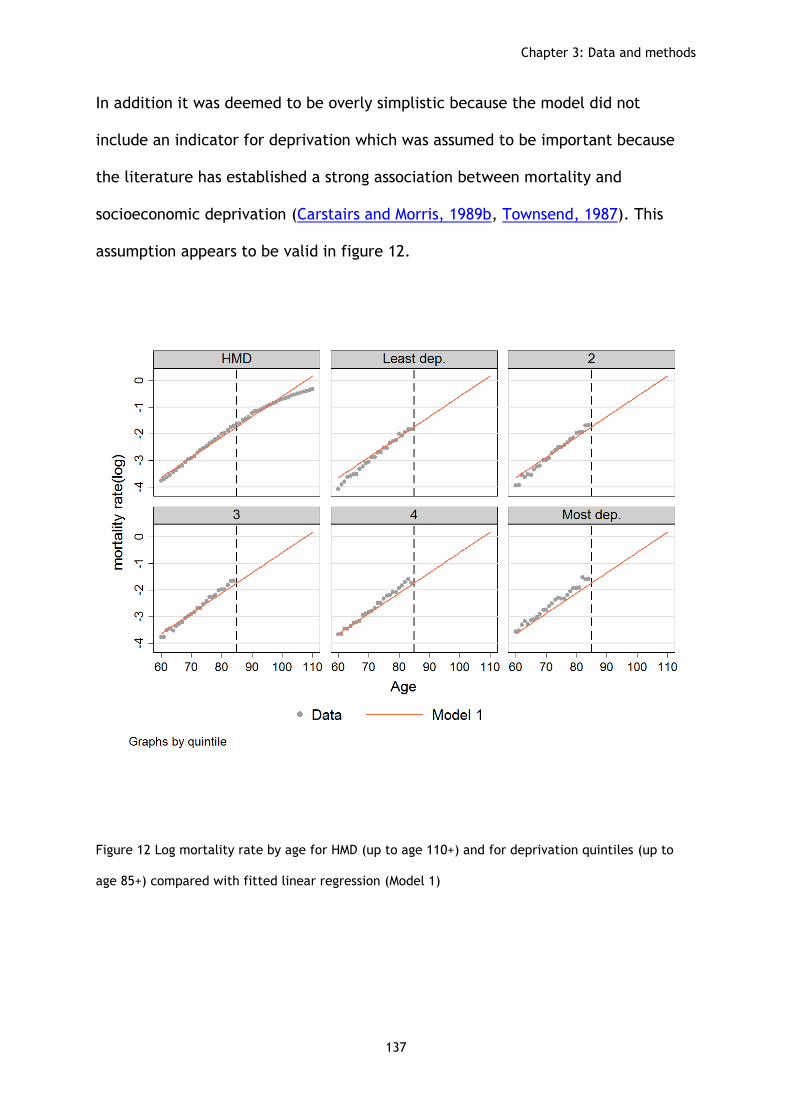
Chapter 3: Data and methods
137
In addition it was deemed to be overly simplistic because the model did not
include an indicator for deprivation which was assumed to be important because
the literature has established a strong association between mortality and
socioeconomic deprivation (Carstairs and Morris, 1989b, Townsend, 1987). This
assumption appears to be valid in figure 12.
Figure 12 Log mortality rate by age for HMD (up to age 110+) and for deprivation quintiles (up to
age 85+) compared with fitted linear regression (Model 1)

Chapter 3: Data and methods
138
Figure 12 shows that model 1 may overestimate the log mortality rate compared to
the data from ages 60 to 85 for the least deprived and may under estimate for the
most deprived. The data line and the model 1 line are not as close across ages 60
to 85 for the two extreme deprivation groups, the most and least deprived.
3.2.5.4 Linear regression of log mortality rate on age with age interaction
(model 2)
Model 2 aimed to account for the slowing increase in log mortality rate at extreme
old ages by allowing for a non-linear relationship between age and the log
mortality rate by including age and age squared, it also includes a categorical
indicator variable for deprivation.
The improved fit of the model is demonstrated in figure 13. It is difficult to
distinguish between the scatter plots for the data and the line for model 2 for the
ages where both were available. This indicates that the model would accurately
predict the log mortality rate into the ages where data were not available
assuming that the same pattern applies.

Chapter 3: Data and methods
139
Figure 13 Log mortality rate by age for deprivation quintiles (up to age 85+) compared with fitted
linear regression (model 1) and fitted linear regression controlling for deprivation and including age
interaction (model 2)
However the linear regression models predict the log mortality rate which means
that the results would need to be back transformed to obtain a mortality rate for
including in a full life table (Yang, 2012). A Poisson regression model removes this
issue and as a result can be considered more appropriate than a linear regression
model. It is also possible to use a fractional polynomial to account for the non-
linear relationship at older ages which selects the ‗best fit‘ for age rather than
simply allowing the linear relationship to change for different ages. These issues
were addressed in model 3a and 3b. Model 3b was the final model selected.

Chapter 3: Data and methods
140
3.2.5.5 Poisson regression of log mortality rate on age
A Poisson regression models the log of the expected count as a function of the
predictor variables (Yang, 2012). It removed the need to back transform the log
mortality rate as it predicts the mortality rate rather than the log (model 1 and
model 2). The log mortality rate taken from the predicted mortality rate from the
Poisson regression model 3a and log mortality rate predicted from the linear
regression model 2 are therefore very similar, demonstrated in figure 14.
Figure 14 Log mortality rate by age for deprivation quintiles (up to age 85+) compared with fitted
linear regression controlling for deprivation and including age interaction (model 2) and Poisson
regression (model 3a)

Chapter 3: Data and methods
141
Using age squared is a valid approach however the model could be improved by
including the function of age as a fractional polynomial. Fractional polynomials
provide a more flexible parameterization for continuous variables which produce a
wider range of curved shapes than those available from linear or quadratic
functions (Stata, 2016, Sauerbrei et al., 2006). Model 3b therefore included a
fractional polynomial function for age (term(2) ,term (3)) in the Poisson regression
for predicting the morality rate past age 85+ across deprivation quintiles. The
predicted mortality rate from the Poisson regression (model 3a) and the mortality
rate predicted from the Poisson regression model including the fractional
polynomial function for age (model 3b) are compared in figure 15 alongside the
data.
Figure 15 Mortality rate by deprivation quintile (up to age 85+) compared with Poisson regression
(model 3a) and Poisson regression with Fractional Polynomial function for age (model 3b)

Chapter 3: Data and methods
142
The results from all the models are compared with the data for the HMD in figure
16 for ages 85 to 110+, the ages for which data were unavailable.
Figure 16 Log mortality rate by age for HMD (up to age 110+) comparing fitted linear regression
(model 1), fitted linear regression controlling for deprivation and including age interaction (model
2), Poisson regression (model 3a), and Poisson regression with fractional polynomial (model3b)
Both the linear model with age squared (model 2) and the Poisson models (model
3a and model 3b) fit the mortality rate from the HMD better than the simple linear
regression (model 1). This is a strong indication that the Poisson model including a
fractional polynomial function for age would provide reliable estimates for the
mortality rates by deprivation quintile for which data could not be obtained. Model
3b was therefore applied to all 40 datasets (4 years×5 quintile×2 sexes).

Chapter 3: Data and methods
143
Using these predicted mortality rates (for ages 85-110+) it was possible to produce
full deprivation specific period life tables up to age 110+ years. These were
required to calculate lifespan variation the mortality outcome of interest to this
thesis. The following section describes e† the measure of lifespan variation
analysed throughout this thesis.
3.2.6 Calculating lifespan variation
e† is the sum of remaining life expectancy at each age, weighted by the number of
deaths at that age. This intuitive interpretation of e† is advantageous: it is the
average number of years remaining at death and measures life years lost when a
death occurs (van Raalte, 2011a).
This thesis reports lifespan variation from age 0 ( ). Other studies report lifespan
variation conditional on survival to older ages (van Raalte et al., 2012, van Raalte
et al., 2011, van Raalte et al., 2014). However these studies calculated lifespan
variation for populations stratified by measures of occupation and education
respectively. This meant that the measure of socioeconomic position being utilised
was not applicable to younger ages: ages when people not yet have an established
occupational status or have yet to complete their education. Reporting lifespan
variation from age 0 is valid within the context of this thesis for the following
reasons.
Firstly, the chapters in this thesis concerned with calculating lifespan variation
stratified by socioeconomic position used an area measure of socioeconomic
deprivation (Carstairs score) which is applicable to the whole population,
regardless of age.

Chapter 3: Data and methods
144
Secondly, existing studies have identified that Scotland‘s mortality disadvantage
following the 1980s may be driven by an excess of deaths across ages as young 15
to 29 years old (Leyland et al., 2007b). These ages would have been truncated out
of the analysis had lifespan variation contingent upon survival to age 31, the age
used by (van Raalte et al., 2014), been applied.
Finally, life expectancy is commonly reported and interpreted from age 0: the
expected length of life a new born can be expected to live given the current
mortality conditions (Preston et al., 2001). Therefore it was valid to include all
ages when studying lifespan variation in Scotland.
3.2.6.1 e† equation
Lifespan variation was measured using . This is the average remaining life
expectancy lost at each age, multiplied by the number of deaths at that age,
divided by the total number of deaths in the life table. For example in a
population of 100,00, if 2,000 people die age 60, and life expectancy at 60 was 20
years and life expectancy at 61 years was 19 years, lost life expectancy for those
dying age 60 would be
years. Carrying out this equation for
each age in the life table, and then summing the results for all ages, gives you the
total years of life expectancy lost for the period that the life table refers to
(Popham et al., 2013). estimates were calculated in StataSE13 and the equation
used in this thesis for can be summarised as:
∫
(van Raalte et al., 2014)

Chapter 3: Data and methods
145
Where
is the life table number of deaths at age x
is the average life expectancy at age x and x+1
is survivorship at the starting age of the integral (here, starting age is 0 years)
is the last open ended age (here 110+)
When is deemed to be relatively high this means some members of the
population are dying well before the average expected age at death and
contributing large amounts of lost-years of potential life (van Raalte et al., 2014).
If more members of the population are surviving to similar ages and dying closer to
the expected average age at death then will become smaller. If it was possible
for everyone in the population to die at the same age then remaining life
expectancy when death occurred would be zero and would subsequently be
zero.
e† is correlated with a number of other indices of lifespan variation. van Raalte
and Caswell (2013) demonstrated the correlation between e† , the Gini-
Coefficient, Theil‘s index, The mean logarithmic deviation, the Standard
deviation, Variance and Interquartile range. However e† may be more sensitive to
older age mortality. Therefore van Raalte et al. (2014) suggest that e† might show
more conservative estimates of lifespan variation differences by socioeconomic
deprivation because inequalities in lifespan variation tend to be driven by the
differences in premature working age mortality which e† is less sensitive to.
Overall the high correlation between measures of lifespan variation provides
reassurance that the broad trends and substantive conclusions reported in this

Chapter 3: Data and methods
146
thesis would have been similar irrespective of the statistical measure of lifespan
variation used (Vaupel et al., 2011).
3.3 Section 2: Statistical tests, measures and methods
The overarching aim of this thesis is to add to our understanding of mortality
inequalities in Scotland by measuring lifespan variation, a measure of total
inequality. The previous section of this chapter described the data utilised to
construct life tables in order to estimate lifespan variation. It concluded by
describing e†, the measure of lifespan variation that is analysed throughout this
thesis.
This second section discussed the statistical tests, measures and methods that
were used to analyse the lifespan variation estimates. The chapters that these
appear are summarised, once again, in figure 17 (right hand panel).

147
Data
Chapter 5: Quantify ages of death driving lifespan
variation trend
Chapter 4: Describe the population level lifespan
variation trend
Chapter 6: Quantify ages of death driving lifespan variation gap at shared level
of life expectancy
Chapter 7: Evaluate changes to socioeconomic gradient
for lifespan variation
Chapter 8: Quantify ages and causes of death driving socioeconomic inequalities in
lifespan variation
Rese
arc
h a
ims
Analy
sis
Human Mortality
Database life tables
Joinpoint regression
Age-specific decomposition of population level
lifespan variation Calc
ula
te life
span v
aria
tion (e
†)
Constru
ct life
table
s stratifie
d b
y
socio
econom
ic d
epriv
atio
n
Monte-Carlo simulations
Slope Index and Relative index of
inequality
Age and cause specific decomposition of
lifespan variation by socioeconomic
deprivation
NRS death counts
NRS commissioned Census population
estimates
Carstairs score
Figure 17 Summary of research stages
Measurement

Chapter 3: Data and methods
148
3.3.1 Joinpoint regression
Chapter 4 is concerned with assessing the change in the population level lifespan
variation trend for Scotland, in a cross-national comparative context. Looking at
Scotland‘s annual lifespan variation ranking within Western Europe since 1950
identifies if its ranking has changed over time and sufficiently answers the first
research question. Joinpoint regression was then used to formally describe the
changes in the lifespan variation trend data for Scotland and 16 comparable
Western European countries. Joinpoint regression analysis answers the second
research questions: it estimates the timing of any significant change in the
magnitude or direction of a health outcome variable and quantifies the rate of
change (annual percentage change) (Hegerl et al., 2013). The literature has
referred to joinpoint regression analysis: piecewise regression, segmented
regression, broken line regression, and multi-phase regression (Kim et al., 2000,
Goovaerts and Xiao, 2011, Hegerl et al., 2013). This thesis refers to this method of
analysis as joinpoint regression.
Joinpoint regression models were calculated using the software available from
Surveillance Research Cancer Control and Population Sciences National Cancer
Institute (2013). The lifespan variation estimates, calculated from the HMD life
tables, were imported into the joinpoint regression software. The joinpoint
analysis starts with a straight line and tests whether one or more statistically
significant joinpoints should be added. The number of joinpoints tends to be
specified at a maximum of three with a minimum of 5 observations between each
(Goovaerts and Xiao, 2011, Hegerl et al., 2013). This avoids the joinpoints from
being too close together or too close to either end of the time series. In practical

Chapter 3: Data and methods
149
terms this also decreases the number of solutions produced through the iterative
process and saves on computing time. For these reasons the default number of
joinpoint was used in this thesis (a maximum of three joinpoints) (Hegerl et al.,
2013). Sensitivity analysis was carried out by increasing the maximum number of
joinpoints to five: this did not change the substantive conclusions reported in the
results.
3.3.1.1 Annual percentage change
Trends in e† measured for each country can be calculated by the annual
percentage change (APC) from the slope of the regression model over the relevant
time interval. If the values of the 95% confidence intervals for the APC contained
zero then the APC was not statistically significant and there was uncertainty
surrounding the direction of change in trend.
Figure 18 shows an example output graph from the joinpoint regression analysis
with lifespan variation estimates (scatter) and the modelled trend (line).

Chapter 3: Data and methods
150
Figure 18 Joinpoint regression output example
From the modelled data the years that the lifespan variation trend changed were
identified. 95% confidence intervals for the year of change were reported in the
full model output. The annual percentage change (APC), between joinpoints, is
also reported with 95% confidence intervals in the full model output. This allows
for statistical inferences to be made about the significance of the timing of change
and the significance of the level of change (Hegerl et al., 2013).
Lif
esp
an v
ari
ati
on
Year

Chapter 3: Data and methods
151
3.3.2 Age-specific decomposition
Chapter 5 and chapter 6 extended the analysis of the population level data by
estimating the age-specific contributions made to the total difference in lifespan
variation (Shkolnikov and Andreev, 2010, Preston et al., 2001). The two chapters
differed in terms of how the time dimension was addressed in the analysis.
Chapter 5 identifies the ages of death that have contributed to the changing levels
of lifespan variation over chronological time within Scotland. It then assesses how
these compare to the ages of death that have contributed to the changing levels of
lifespan variation over time within England and Wales.
Chapter 6 is concerned with assessing levels of lifespan variation when life
expectancy was the same and is concerned with the notion that the two countries
may be at different stages of the epidemiological transition (epidemiological time)
(Smits and Monden, 2009). It aims to identify the ages of death that have
contributed to the lifespan variation gap when Scotland achieved the same level of
life expectancy as England and Wales, albeit later in time.
Both chapters are concerned with understanding the contributions from
differences in age-specific mortality rates to the difference between two life table
based quantities. This meant that the same age-specific decomposition method of
analysis could be employed in both chapters.
There are many ways to decompose a difference and Preston et al. (2001) suggests
the choice is, to an extent, arbitrary. Decomposition methods have been widely
applied in research to partition absolute changes over time for one population
(chapter 6) or absolute difference between two populations (chapter 7) into age-

Chapter 3: Data and methods
152
specific components (Shkolnikov et al., 2011, Auger et al., 2014, van Raalte et al.,
2014).
Age-specific decomposition was carried out using the stepwise decomposition
algorithm within the Microsoft Excel Spreadsheets developed by Shkolnikov and
Andreev (2010). This approach is appropriate for decomposing, by age, differences
in any aggregate measure that is estimated from age-specific mortality rates and
accounts for all ages including the oldest open ended age.
In order to obtain the decomposition components the mortality rates for the
relevant comparator life tables had to be imputed into the Microsoft excel
spreadsheet developed by (Shkolnikov and Andreev, 2010). The decomposition
components were then exported to StataSE13 in order to produce figures for
communicating the results.
The steps carried out for the age-specific decomposition are summarised as
follows:
1. Age specific mortality rates for two populations ( and ) are obtained
2. Lifespan variation from observed mortality rates calculated
3. Starting with age 0 - replace age specific mortality rate for with age
specific mortality rate for ), all other observed mortality rates
stay the same
4. Recalculate lifespan variation for with age specific mortality rate at
age 0 replaced from ),

Chapter 3: Data and methods
153
5. Take the lifespan variation calculated with the replaced mortality rate
for from the lifespan variation calculated from the observed mortality
rate for to get the age specific contribution
6. Repeat steps 3,4,5 replacing each single year of age (0-110+) in a
stepwise process
7. Repeat steps 3,4,5,6 in opposite direction - replacing age specific
mortality rate for with age specific mortality rate for
8. Take the average contribution for each single year of age from the two
replacement directions to get the age specific
contribution
3.3.3 Slope index of Inequality and Relative Index of Inequality
The research questions in chapter 7 are concerned with the impact socioeconomic
deprivation has for lifespan variation and quantifies changes to the socioeconomic
gradient for lifespan variation over time.
To analyse the gradient in lifespan variation by socioeconomic deprivation the
Slope Index of Inequality (SII) and the Relative Index of Inequality (RII) were used.
The SII communicates the absolute level of inequality in a health variable for social
groups. The RII communicates the inequality in relative terms (Mackenbach and
Kunst, 1997).The SII and RII are valuable methods of analysis to use because they
allow trends to be assessed by taking into account of all the data points not just
the extremes (Munoz-Arroyo and Sutton, 2007).
The SII is an attempt to estimate the absolute health difference between the most
and least deprived groups. It is interpreted as the absolute effect on health from

Chapter 3: Data and methods
154
moving from the lowest ranking socioeconomic group to the highest ranking
socioeconomic group.
Carstairs quintiles of socioeconomic deprivation rank the categories from 1 (least
deprived) to 5 (most deprived). The population of each socioeconomic deprivation
category are part of the cumulative total population. Each socioeconomic
deprivation category is assigned a variable which refers to the midpoint of their
range in the cumulative distribution of the total population.
This is straight forward when using population weighted quintiles as each contains
20% of the population. Therefore the first 20% has a range from 0% to 20% and the
midpoint is 0.10, the second 20% has a range from 20% to 40% and a midpoint value
of 0.30…the final 20% of the population has a range from 80% to 100% and is
assigned a midpoint value of 0.90 (Munoz-Arroyo and Sutton, 2007).
The SII is then the value of the slope coefficient of an ordinary least squares
regression between the dependent health variable and the independent
deprivation cumulative population variable: the larger the coefficient the greater
the impact of deprivation (Allik et al., 2016).
The Slope index regression equation is summarised as:
where
is the category of socioeconomic deprivation
is the average health status
is the average relative ranking of socioeconomic deprivation category in
the cumulative distribution of the population

Chapter 3: Data and methods
155
is the estimated health status of an individual in the lowest ranked
socioeconomic deprivation category
is the difference in average health status between an individual in the
lowest ranked socioeconomic deprivation quintile and an individual in the
highest ranked socioeconomic deprivation quintile (this is the SII value)
The SII is typically reported as the absolute difference in the health outcome. For
lifespan variation this is the absolute difference in years between the notionally
most deprived and notionally least deprived quintile. The RII summarises this as a
relative percentage difference and is derived from the same regression model.
The RII reported in this thesis was obtained by dividing the SII value by the mean
value of the outcome variable across all socioeconomic deprivation categories.
3.3.4 Monte-Carlo simulations
The lifespan variation estimates, stratified by socioeconomic deprivation, the SII,
and the RII results were subject to further statistical analysis in chapter 7: 95%
confidence intervals were calculated by carrying out a Monte-Carlo simulation
method. 95% confidence intervals allow the true population value of lifespan
variation, stratified by socioeconomic deprivation, to be statistically assessed.
This analysis is important to carry out because lifespan variation is calculated from
mortality rates and the numbers of deaths in the population are inherently
vulnerable to random, naturally occurring fluctuations. As a result the number of
deaths that occur in a population can be interpreted as one possible series that
could have occurred under the given set of circumstances (Curtin and Klein, 1995).

Chapter 3: Data and methods
156
In order to produce 95% confidence intervals 1,000 simulated death counts were
required for every age (0-110+) by socioeconomic deprivation (quintiles 1 to 5) in
each census year (1981, 1991, 2001 and 2011) and for males and females
separately.
Each single round of simulations produced 4,440 age specific death counts that
were used to calculate 4,400 age specific mortality rates. From the mortality rates
40 complete period life tables were produced (2 sexes, 4 years, and 5 deprivation
quintiles). The total number of simulations carried out produced 4,440,000
simulated age-specific death counts that were used to construct 40,000 simulated
life tables. The 2.5 and 97.5 percentiles from the simulated results were selected
for the 95% confidence interval limits.
The method used in this thesis is the fifth simulation method (MC) described in
detail by Lumme et al. (2015). This method was appropriate as the socioeconomic
group variable being used is grouped by proportions (quintiles). The numbers of
people in each quintile can be assumed to be stable as they are from a large
dataset: each quintile reflects 20% of the total population of Scotland. The fixed
proportions of each quintile means the ranking of the socioeconomic groups‘
remains fixed when the simulation is carried out and only the variability in the
health outcome (death counts used to calculate mortality rate) is modelled.
The steps of the MC simulation are as follows:
1. Obtain the population and death counts in each age group and
deprivation group

Chapter 3: Data and methods
157
2. Simulate the number of events subject to the constraint from the
observed number of events in age group. The probabilities used for the
multinomial distribution are estimated from the observed data: the
number of deaths in each age and deprivation group over the total
deaths in each age group
3. Repeat step 2 1,000 times to obtain 1,000 sets of data
4. Calculate age specific mortality rate (0-85+). Apply mortality rate
prediction method (Poisson regression with fractional polynomial).
Obtain mortality rate for ages 85-110+ for 1,000 data sets
5. Construct life tables from the mortality rates (0-110+) for the 1,000
simulated data sets
6. Calculate lifespan variation for the 1,000 simulated life tables
7. Calculate the SII and RII for the 1,000 simulations
8. Sort the simulated lifespan variation estimates and select the 2.5 and
97.5 percentiles to get 95% confidence interval limits
9. Sort the simulated SII estimates and select the 2.5 and 97.5 percentiles
to get 95% confidence interval limits
10. Sort the simulated RII estimates and select the 2.5 and 97.5 percentiles
to get 95% confidence interval limits
The 95% confidence intervals for the SII and RII allowed any uncertainty
surrounding the socioeconomic gradient to be statistically evaluated. If the limits
of the 95% confidence intervals for the SII or RII cross zero then there is

Chapter 3: Data and methods
158
uncertainty as to whether there is a true health difference between the most and
least deprived socioeconomic groups (Allik et al., 2016). Lumme et al. (2015)
summarises the value of this method of analysis when stating that ‗uncertainty in
an indicator is an essential question when making comparisons of equality‘.
3.3.5 International Classification of Disease
The analysis in chapter 8 uses the death record data collated by NRS and held by
the MRC/CSO Social and Public Health Sciences Unit, University of Glasgow.
Number of deaths by sex, single year of age and Carstairs deprivation quintile
across 5 cause-specific categories of death (derived from the International
Classification of Disease (ICD)) were obtained. The five cause specific categories in
this thesis are: external, cancers, circulatory, respiratory and an all other
category. The cause-specific categories were harmonized across version 9 and
version 10 of the ICD. The ICD has been used by WHO member states since 1994. It
has evolved from being a systematic classification of disease used for statistical
purpose to being applied in medical administration, epidemiology and health
services research (O'Malley et al., 2005).
Although the ICD is a standard diagnostic tool for population level health analysis
(World Health Organization, 2012) the vast amount of data on mortality patterns is
potentially incomprehensible. In its current iteration there are 120,000 total codes
(World Health Organization, 2004). As a result O'Malley et al. (2005) highlight that
researchers need to be reflexive about the extent to which ICD codes can be
considered a representation of true and observed variables which reflect a
person‘s true cause of death. The cause of death categories were informed by
those which have previously been used in existing studies (Leyland et al., 2007a,

Chapter 3: Data and methods
159
van Raalte et al., 2014). The cause-of-death categories are mutually exclusive
meaning that the each death is only assigned to one category. If no specific cause
of death was available or the death was ill-defined then it was assigned to the ―all
other causes‖ category.
Table 12 details the ICD codes that were included in the external, cancers,
circulatory and respiratory categories.

160
Table 12 ICD codes assigned to cause of death categories
Category
ICD-9 (1981 and 1991)
ICD-10 (2001 and 2011)
External
Comprising chronic liver disease, accidents, intentional self-harm and events of undetermined intent, mental and behavioural disorders due to use of drugs or alcohol, and assault
5710-5719,E800-E929, E950-E959,E980-E989, 3040-3049,3052-3059, 2910-2919,3030-3039, 3050,
E960-E969
K70-K709, K73-K749, V01-X599,Y85-Y869, X60-X849, Y870,Y872,Y10-Y349, F11-
F169,F18-F199, F10-F109, X85-Y099, Y871
Cancers
Comprising all malignant neoplasm
140-208
C00-97
Circulatory
Comprising Ischaemic heart disease and
cerebrovascular disease
390-459
I00-99
Respiratory
Comprising chronic obstructive pulmonary
disease and chronic lower respiratory diseases
460-519
J00-99
Other causes
All remaining ICD codes attributed to ‗other causes‘ category including deaths that had no cause of death listed or if the cause of death was ill defined. Remaining cause of death categories are infectious disease and diabetes
-
-

Chapter 3: Data and methods
161
3.3.6 Cause specific mortality rates beyond age 85
The numbers of cause-specific deaths by sex and SYOA were extracted for the
years surrounding each Census. 3 years‘ worth of death data (2 years for 1991)
were extracted to increase the number of events as deaths are inherently
vulnerable to random fluctuations (Lumme et al., 2015, Curtin and Klein, 1995).
The numbers of cause-specific deaths were then matched with Carstairs score
data on the postcode sector and local government district variable. The Census
population estimates by Carstairs score were then matched. This allowed the
numbers of cause-specific deaths by sex, SYOA and Carstairs score to be
transformed into cause-specific mortality rates for ages 0-85+.
In order to obtain cause specific mortality rates, up to an open ended age
interval of 110+, the modelled mortality rate used in chapter 7 was proportioned
out to reflect the cause specific proportions as they stood at age 84 for each
sex, quintile of deprivation and year combination. This approach assumed that
the proportion of the total deaths by sex, quintile of deprivation and year
remained constant across each single year of age for age ≥85. This gave cause-
specific mortality rates for age 0 to age 110+ for each sex, quintile of
deprivation and Census year (40 cause-specific data sets in total). The sum of
the cause-specific mortality rates for each sex, SYOA and quintile is always equal
to the all-cause mortality rate used for the analysis in chapter 7 of this thesis.

Chapter 3: Data and methods
162
3.3.7 Decomposing a difference in lifespan variation by age and cause of
death
Cause-specific mortality rates for age 0-110+ were then entered into the
Microsoft Excel program developed by Andreev and Shkolnikov (2012). The
decompositions in chapter 8 report a difference in by single year of age and 5
cause specific categories of death (see table 12) utilising the stepwise
decomposition method applied in the Microsoft Excel program developed by
Andreev and Shkolnikov (2012). This approach has previously been applied in the
literature to examine socioeconomic inequalities in lifespan variation (van
Raalte et al., 2014, van Raalte et al., 2012). The age-cause specific
decomposition method is similar to the age-specific decomposition (described in
section 3.3.2) and can be summarised as follows:
1. Two lifetables ( and ) each contain age-cause specific mortality
rates that are the equal to all cause age-specific deaths rates
combined (calculated as rows sums of age specific death rates)
2. Replacement for age and cause includes the calculation of the
change in the aggregate mortality measure resulting from the
replacement of mortality rate by
3. Replacement is performed for each combination of causes of death
other than
4. Replacement progress is made from the first age 0 to the last age
and is run twice ( and the average of the two
replacement cycles taken

Chapter 3: Data and methods
163
3.4 Chapter summary
This chapter had two sections. The first described the data required to calculate
lifespan variation, the measure of total inequality which is the primary focus of
this thesis. It outlined the data management processes required to estimate
lifespan variation stratified by socioeconomic deprivation. The strengths and
limitations of the data were considered and alternative measures of
socioeconomic position critically evaluated. The modelling process applied to
obtain mortality rates for ages ≥85 was outlined and e†, the measure of lifespan
variation used throughout this thesis, described. The second section discussed
the range of statistical tests, measures and methods of analysis utilised within
this thesis. The data chosen and the analysis applied were appropriate for
answering the research questions which were presented in the literature review
chapter of this thesis: different research questions may have demanded
different methods of analysis. This issue is reflected on throughout the thesis
especially when considering future research implications.

164
4 Scotland’s lifespan variation trend in Western Europe
4.1 Introduction
The literature review chapter of this thesis began by exploring some theories
surrounding health inequalities and their measurement in empirical research.
Health inequalities in Scotland have been the focus of much research attention:
it experiences the lowest level of life expectancy in Western Europe, widening
mortality inequalities between socioeconomic groups, and increasing premature
mortality rates for some ages (Leyland et al., 2007b, McCartney et al., 2012b).
Little is known about lifespan variation in Scotland despite suitable data for
estimating lifespan variation being widely available. Lifespan variation is a novel
measure of inequality that reflects the concept of total inequality: the amount
of inequality that exists across all individuals within a population. The concept
of total inequality has been contested in the health inequalities literature and
contrasted against a traditional concept of inequality: the difference in average
health between populations (Gakidou and King, 2002, Murray et al., 1999, Le
Grand, 1987). However both concepts of inequality should be measured
simultaneously in order to evaluate the extent to which the twin aims of public
health are being achieved: increases in average health alongside reductions in
inequality. Existing studies suggest these aims are not incompatible as
populations that have experienced greater reductions in total inequality have
experienced the greatest improvements in average population health and
narrower inequalities between socioeconomic groups (van Raalte et al., 2011,
Vaupel et al., 2011).Measuring and analysing lifespan variation in Scotland will

Chapter 4: Scotland‘s lifespan variation trend in Western Europe
165
help to identify how it can decrease the level of inequality in age at death the
population experiences which could subsequently improve its average
population health ranking within Western Europe. Chapter 3 outlined the data
sources and quantitative analysis methods required to achieve this.
This chapter begins the process of analysing the population level lifespan
variation trend for Scotland and the findings that are described build on those
which have already been published (Seaman et al., 2016a). It contributes to the
overarching aim of the thesis by answering the following research questions:
1. Has Scotland‘s lifespan variation ranking within Western Europe changed
over time?
2. Was the timing and relative rate of lifespan variation change in Scotland
comparable with any other Western European country?
Data used in this chapter are from the Human Mortality Database. The chapter
reports the annual estimates of lifespan variation that were calculated for 1950
to 2011, the most recent year for which data were available when the research
was carried out. The analysis seeks to formally assess changes to the lifespan
variation trend, from the calculated estimates, for Scotland relative to the
changes in 16 other Western European countries.
The chapter has four main sections. The first background section begins by
discussing changes to Scotland‘s life expectancy trend relative to Western
Europe and identifies that less is known about changes to Scotland‘s lifespan
variation trend. The second section then briefly describes the analysis methods
used to fill these research gaps. The third section reports the statistical findings.

Chapter 4: Scotland‘s lifespan variation trend in Western Europe
166
The fourth section provides a summary and identifies the research implications
of these findings and how they informed the analysis going forward in this thesis.
4.2 Background
Mortality in Scotland is high by Western European standards. Although the all-
cause mortality rate has fallen across Scotland premature mortality rates for
some ages from suicide, substance and alcohol abuse, and violence have risen
over the past three decades. These unfavourable mortality trends are reflected
in Scotland‘s life expectancy which is now the lowest in Western Europe
(McCartney et al., 2012b, Leyland et al., 2007b).
4.2.1 Life expectancy
Life expectancy estimates the average number of years a new-born can expect
to live for, given the current mortality conditions (Preston et al., 2001). It is one
of the most common indicators of population health that allows both
comparisons between countries to be made and changes over time to be
monitored (World Health Organization, 2010). Increasing life expectancy means
that the average age at death is being delayed. Annual increases in life
expectancy, which have almost universally been experienced, are therefore
interpreted as improving average population health. A lesser studied but equally
important dimension of mortality to measure over time and in cross-national
comparative research is lifespan variation (Smits and Monden, 2009, Shkolnikov
et al., 2011).
4.2.2 Lifespan variation
Lifespan variation estimates the amount of inequality in age at death that exists
between individuals. Decreasing lifespan variation means that deaths are being

Chapter 4: Scotland‘s lifespan variation trend in Western Europe
167
compressed around a common age, and that the age at death is becoming more
homogenous (Tuljapurkar, 2010, Smits and Monden, 2009). Having a relatively
homogenous age at death is seen as a sign of low inequality and can help inform
societal level decisions about healthcare, retirement and pensions (van Raalte et
al., 2014). Therefore, as previously discussed in the literature review chapter,
lifespan variation cannot simply be interpreted as random variation: it is a
measure of mortality that reflects social and systematic inequality.
4.2.3 International evidence
International studies have found that historically most countries have been able
to achieve the correlation between increasing life expectancy and decreasing
lifespan variation (Smits and Monden, 2009, Tuljapurkar, 2010, Shkolnikov et al.,
2011). This suggests that the twin aims of public health – to increase average
health and reduce inequality- are compatible. However there are indications
that some countries have failed to achieve both: countries which have been able
to achieve increases in life expectancy without reducing lifespan variation at a
comparable rate to other countries. The USA is one example country that has
already been studied (Shkolnikov et al., 2011).
4.2.4 Distribution of age at death
The reason why the relationship between life expectancy and lifespan variation
differs for the USA is due to the age distribution of mortality it experiences.
While improvements in life expectancy are achieved by reducing mortality at
any age, improvements in lifespan variation are generally achieved by reducing
premature deaths to ensure mortality compression. Mortality compression refers
to narrowing of the shape of the age distribution of death by reducing deaths
Chapter 4: Scotland‘s lifespan variation trend in Western Europe
168
across working adult ages. The opposing process is mortality expansion.
Expansion refers to the widening of the shape of the age distribution of death
which is mostly driven by pushing more deaths into older ages (van Raalte,
2011a, Oeppen, 2008). Therefore countries with stalling lifespan variation
trends tend to be those who have been less successful at reducing premature
mortality and those achieving less compression than expansion (van Raalte et
al., 2011). This is of direct relevance for Scotland as it is known to have a
persisting premature mortality problem (Norman et al., 2011, Leyland, 2004).
4.2.5 Changing trends in Scotland
Changes to Scotland‘s life expectancy trend were analysed by McCartney et al.
(2012b). Historically its life expectancy ranked around the European median but
the rate of improvement in Scotland began to slow following the 1950s
(McCartney et al., 2012b, National Records of Scotland, 2014b). This resulted in
several countries in Europe overtaking Scotland because they were able to
improve their life expectancy more rapidly. These countries included Spain,
Portugal, Italy and Finland. McCartney et al. (2012b) reported a further stalling
in Scotland‘s life expectancy following the 1970s. Consequently Scotland is now
only achieving the life expectancy that the best performing countries in Europe
achieved 40 years earlier: 76.9 and 80.9 years for men and women respectively
(The Scottish Government., 2014). This is a relatively low life expectancy for
such a high income country (Popham and Boyle, 2010).
4.2.6 The correlation between life expectancy and lifespan variation
Given the established correlation between life expectancy and lifespan variation
evidenced in the international literature, it is hypothesised that Scotland‘s

Chapter 4: Scotland‘s lifespan variation trend in Western Europe
169
lifespan variation trend may have also faltered around the same time. Popham
and Boyle (2010) calculated lifespan variation for Scotland for each decade since
1950. They demonstrated Scotland‘s average lifespan variation for each decade
up until the 1980s was close to the middle of the distribution of the countries
identified as comparators. Following the 1980s Scotland‘s lifespan variation
began to stall or slightly increase. By the mid 2000‘s Scotland‘s lifespan variation
was the worst in Western Europe. The only country with larger variation in
lifespan, included in the study by Popham and Boyle (2010), was the USA. This
evidence, combined with that of McCartney et al. (2012b), suggests that
Scotland may be burdened with the shortest average age at death and the
greatest inequality in age at death relative to the rest of Western Europe.
4.2.7 Research gaps
Although Popham and Boyle (2010) estimated lifespan variation for each decade
since the 1950s and alluded to the timing of lifespan variation change in
Scotland they did not statistically assess the change in trend or systematically
compare annual lifespan variation estimates in Scotland with Western Europe. It
is these important research gaps that the following analysis chapter fills.
Analysing the timing of any changes to lifespan variation in Scotland is important
for helping to inform future studies towards the possible causes of health
inequalities. However in order to establish if Scotland‘s lifespan variation trend
should be considered adverse the enquiry needs to be extended to include
comparable countries (Rose, 2001). Western Europe provides a valuable
opportunity for cross national comparative research as long running data are
available for countries with contrasting political, cultural, economic and

Chapter 4: Scotland‘s lifespan variation trend in Western Europe
170
epidemiological profiles (Mackenbach et al., 2008). This chapter employs
joinpoint regression to identify and compare changes to lifespan variation trends
since 1950. The emphasis is on understanding Scotland‘s trend, and not on
comparing all trends in the other Western European countries.
4.3 Data & methods
Data used in this chapter were sex specific life tables for Scotland and 16 other
Western European countries. A detailed description of a life table has already
been given in chapter 3 of this thesis (data and methods). Lifetables for the
years 1950 to 2011 were obtained from the Human Mortality Database, one of
the most highly regarded providers of comparative mortality data. These were
the most recent years of data available for all of the countries at the time of
research. When making formal comparisons between trends the length of time
series has to be the same. Data were available for Scotland from 1950-2011 but
when making formal comparisons these had to be restricted to match the years
that were available depending on the comparator country. The Western
European countries used and the years for which data were available to make
comparisons are detailed in table 13. These countries have been used in existing
studies as comparators with Scotland (Mackenbach et al., 2008, Leon et al.,
2003).

Chapter 4: Scotland‘s lifespan variation trend in Western Europe
171
Table 13 comparator countries and years for which complete period life tables were used for
analysis in Chapter 4
Country Years data available Country group
Scotland 1950-2011
West England & Wales 1950-2011
Northern Ireland 1950-2011
Ireland 1950-2009
Denmark 1950-2011
North Finland 1950-2009
Norway 1950-2009
Sweden 1950-2011
Austria 1956-2010
West Germany* 1956-2010 Continental
Switzerland 1950-2011
Belgium 1950-2012
France 1950-2012
Netherlands 1950-2009
Spain 1950-2009
Italy 1950-2009 South
Portugal 1950-2012
*West Germany is the area of unified Germany formally known as the Federal
Republic of Germany (FRG). The territory has changed over time but the
statistics here represent the regions that made up the FRG.

Chapter 4: Scotland‘s lifespan variation trend in Western Europe
172
4.3.1 Calculate lifespan variation
The first stage of the analysis calculates lifespan variation from these lifetables.
e† was used to measure lifespan variation and a detailed justification for this
measure is provided in chapter 3 (data and methods chapter). e† was calculated
in Stata SE13. A total of 2,076 lifetables were used to calculate annual estimates
of lifespan variation.
4.3.2 Joinpoint regression
The second stage of the analysis statistically assesses any change in lifespan
variation trends for Scotland and the 16 other Western European countries. This
was achieved by carrying out joinpoint regression analysis using the software
provided by the Surveillance Research Cancer Control and Population Sciences
National Cancer Institute (2013). A detailed description of joinpoint regression
analysis is given in chapter 3 of this thesis (data and methods). It tests whether
multiple straight lines joined together at ‗joinpoints‘ are statistically a better fit
to the trend data than a straight line (no joinpoints). In doing so it identifies the
best fitting time point at which the trend for any health outcome has changed
significantly in magnitude or direction (Hegerl et al., 2013). The joinpoint
regression reports the year of change and the level of annual percentage change
(APC) both with 95% confidence intervals.
4.4 Results
4.4.1 Lifespan variation estimates: Scotland’s annual ranking within Western
Europe
The annual e† estimates calculated for each country are detailed in appendix 3
and appendix 4, for males and females respectively.

Chapter 4: Scotland‘s lifespan variation trend in Western Europe
173
The range in lifespan variation between Western European countries has
compressed over time indicating that trends have, to an extent, converged.
Despite the convergence Scotland‘s ranking has worsened, indicating that some
of the comparable countries have been more successful at reducing total
inequality. This is the case for males and females.
In 1956 males in Scotland ranked 7th out of the 17 countries included in the
analysis and had a lifespan variation of 13.2 years. Portugal ranked 17th and had
a lifespan variation of 18.35 years. The country that ranked first was the
Netherlands with 12.25 years. By 2009 (the latest year for which all countries
had data available for when the research was undertaken) Scotland ranked 17th
and had a lifespan variation of 11.63 years. Sweden was ranked 1st with 9.76
years, closely followed by the Netherlands with 9.91 years. Portugal had
improved its position for males and ranked 14th with 11.17 years.
In 1956 females in Scotland ranked 8th and had a lifespan variation of 12.11
years. The country ranked 1st was Netherlands with 10.93 years. The country
with the worst rank was Portugal with 17.41 years. By 2009 females in Scotland
ranked 17th and had a lifespan variation of 10.35 years. In 2009 Spain ranked 1st
with a lifespan variation of 8.71 years. Portugal had improved its lifespan
variation to 9.19 years and ranked 9th. The Netherlands ranking had fallen to 10th
place with 9.37 years.
Scotland‘s worsening lifespan variation trend and the countries overtaking it are
not easy to visualise in a table format and, although the annual estimates of
lifespan variation allude to differences, formal statistical analysis can provide
further insight.

Chapter 4: Scotland‘s lifespan variation trend in Western Europe
174
4.4.2 Joinpoint regression: Scotland
Joinpoint regression models were therefore fitted to the annual lifespan
variation estimates in order to formally identify when the trend in Scotland
started to worsen, allowing comparator countries to overtake it, and to measure
the relative level of change.
4.4.2.1 Males
Figure 19 shows the lifespan variation estimates (scatter) with the fitted
joinpoint regression (line) for males in Scotland. The dashed lines from the x-
axis identify the years when a statistically significant change in trend was
identified.
Figure 19 Lifespan variation estimates and fitted joinpoint regression for Scotland, Males

Chapter 4: Scotland‘s lifespan variation trend in Western Europe
175
Although the lifespan variation trend for males in Scotland in 2011 was lower
than in 1950, indicating an overall decrease, the joinpoint regression analysis
identified two statistically significant changes to the rate of change over this
time series. The first change in trend identified was in 1955 (1952 to 1958). Prior
to this change lifespan variation had been decreasing at annual rate of -1.2% (-
1.8% to -0.7%). After 1955 the annual percentage change in lifespan variation fell
to -0.5% (-0.5% to -0.5%). This level of annual percentage change in lifespan
variation was maintained until 1989 (1986 to 1993). From 1989 to 2011 the trend
changed to be slightly increasing by 0.1% per year. However the 95% confidence
intervals for the increasing percentage change following 1989 cross zero (-0.0%
to 0.1%) indicating that there is some uncertainty about the statistical
significance of this increasing rate of change.
4.4.2.2 Females
Figure 20 shows the lifespan variation estimates (scatter plots) with the fitted
joinpoint regression (line) for Scotland for females.

Chapter 4: Scotland‘s lifespan variation trend in Western Europe
176
Figure 20 Lifespan variation estimates and fitted joinpoint regression for Scotland, Females
The lifespan variation for females in Scotland in 2011 was lower than in 1950.
The joinpoint regression analysis identified three statistically significant changes
to the rate of change over this time series. The first change in trend identified
was in 1956 (1954 to 1958). Prior to this change lifespan variation had been
decreasing at an annual rate of -1.9% (-2.3% to -1.6%). After 1956 the annual
percentage change in lifespan variation fell to -0.2% (-0.3% to -0.1%). This level
of annual percentage change in lifespan variation was maintained until 1971
(1963 to 1981). Following 1971 the decreasing rate of change improved again to -
0.4% (-0.4% to -0.4%). The trend then changed again in 2003 (1980 to 2009).
From 2003 to 2011 lifespan variation decreased by -0.1% for females in Scotland.
However the 95% confidence intervals for the decreasing percentage change
following 2003 include zero (-0.3% to 0.2%) indicating that there is some

Chapter 4: Scotland‘s lifespan variation trend in Western Europe
177
uncertainty as to whether females in Scotland did experience a decreasing rate
of change.
4.4.3 Joinpoint regression: cross-national comparisons
Figure 21 and figure 22 demonstrate how well the joinpoint regression fitted the
annual estimates of lifespan variation for the 16 comparator countries. Figure 21
is for males and figure 22 is for females. Note the different scales for each
country and the years which the time series begins at. The length of time series
differed for each country but when making formal comparisons between trends
the length of time series has to be the same. Data were available for Scotland
from 1950-2011 but when making formal comparisons this had to be restricted to
match the years that were available for the comparator country.

Chapter 4: Scotland‘s lifespan variation trend in Western Europe
178
Figure 21 Lifespan variation estimates and fitted joinpoint regression for 16 Western European
comparator countries, Males

Chapter 4: Scotland‘s lifespan variation trend in Western Europe
179
Figure 22 Lifespan variation estimates and fitted joinpoint regression for 16 Western European
comparator countries, Females
The relative position of the each lifespan variation trend over time and the
joinpoints identified for all countries can then be compared in figure 23 for
males and figure 24 for females. The countries are grouped by geographical
region to allow for easier interpretation.

Chapter 4: Scotland‘s lifespan variation trend in Western Europe
180
Figure 23 Modelled trends for lifespan variation for all 17 Western European countries grouped by
geographical region, Males

Chapter 4: Scotland‘s lifespan variation trend in Western Europe
181
Figure 24 Modelled trends for lifespan variation for all 17 Western European countries grouped by
geographical region, Females
For both males and females across Western European countries there is a general
decreasing trend. For females there is a greater convergence of lifespan
variation.
4.4.3.1 Comparing the timing of change
The year of change (95% CI) and APC (95% CI) for each country are detailed in
appendix 5 for males and appendix 6 for females. The years of change for
Scotland are compared to each of the years of change for each Western
European country. This is illustrated in figure 25 for males and figure 26 for
females. This gives a sense of how the timing of the change in trends for
Scotland compared with the timing of the change in trend in each of the 16

Chapter 4: Scotland‘s lifespan variation trend in Western Europe
182
comparator countries: most of the comparator countries maintained a
decreasing trend over the time period studied. No other Western European
country experienced a change in trend towards stagnating or slightly increasing
lifespan variation at this time.
Figure 25 Change in lifespan variation trend in Scotland compared to each Western European
country, Males

Chapter 4: Scotland‘s lifespan variation trend in Western Europe
183
Figure 26 Change in lifespan variation trend in Scotland compared to each Western European
country, Females
4.4.3.2 Comparing the level of change
It was also important to evaluate the level of change in each country compared
with the timing of change. In general the timings of change and levels of change
experienced in Scotland relative to the 16 other Western European countries can
be summarised in terms of: periods of rapid decline, periods of stagnation or
incline, and the most recent change in trend.
Periods of rapid decrease
There is a general trend of decreasing lifespan variation for males and females
across all Western European countries. Rapid decreases in lifespan variation for
all countries are found in the years immediately after 1950. Males in Scotland

Chapter 4: Scotland‘s lifespan variation trend in Western Europe
184
experienced a -1.2% (-1.8 to -0.7) decline in lifespan variation between 1950 and
1955. This is in contrast to Spain where males experienced the steepest decline
of -4.1% (-5.0 to -3.2) between the period 1950 and 1954.
At the start of the time period Sweden demonstrated one of the lowest absolute
levels of lifespan variation but was experiencing a relatively smaller decrease of
-0.6% (-0.7 to -0.5) between 1950 and 1984. Between 1950 and 1956 females in
Scotland were experiencing a decrease of -1.9% (-2.3 to-1.6).
Periods of stagnation or incline
Some countries have experienced periods of stagnating or slightly increasing
lifespan variation but have tended to return to a downward trend quite quickly.
Females in Norway for example experienced an increase of 0.5% (-0.2 to 1.3)
between 1981 and 1987. The confidence intervals for the APC cross 0 indicating
that the there is a lack of certainty as to whether the lifespan variation trend
has been increasing. This is the case when consulting the data in appendix 4:
between 1981 and 1987 lifespan variation increases between some years in
Norway but decreases between others. Scotland has always experienced
decreasing lifespan variation until the most recent change in trend.
Most recent change in trend
For males the most recent change in trend for a few countries has been towards
stagnating or slightly increasing. Males in Scotland have experienced an APC of
0.1% (-0.0 to 0.1%) since 1989 (1986 to 1993). Finland‘s most recent change in
trend was in 2002 (1981 to 2007) with a subsequent APC of 0.1% (-0.4 to 0.5).
The wider confidence intervals for Finland indicate that there is a lack of
certainty as to whether the lifespan variation trend has been increasing.

Chapter 4: Scotland‘s lifespan variation trend in Western Europe
185
Northern Ireland and Ireland have also recently demonstrated increasing or
slightly stagnating trends.
All of the most recent changes in trends for females have been towards
continued decline. However these are not significant declining trends for
Scotland, Belgium and Northern Ireland.
For females there is a strong convergence in trends not evident for males. The
convergence in trends means that several countries are competing to have the
lowest level of lifespan variation. This is in contrast to males: Sweden has almost
exclusively had the lowest level of lifespan variation over the time period
covered. The most recent period for females in Scotland appears to be
somewhat of an exception to this convergence. In 2009 Scotland had a lifespan
variation of over 10 years (10.4 years). This was partly due to it experiencing a
slowing in the rate of change: slowing from -1.9% (-2.3% to -1.6%) in 1950-1956
to -0.1% (-0.3 to 0.2%) in 2003-2011. This is in contrast to its nearest neighbours
England and Wales where the slowing rate of change has not been as large. It
experienced an APC of -1.3% (-1.6 to -0.9) in 1950-1956 to -0.4% (-0.4 to -0.4) in
1970-2011. The joinpoint regression analysis gives an indication as to which
countries have been experiencing similar changes in trends and helps to inform
an interpretation of Scotland‘s relative position.
4.5 Discussion
4.5.1 Summary of results
This chapter has formally assessed Scotland‘s lifespan variation trend in
comparison to the trends in 16 other Western European countries. The range in
lifespan variation between Western European countries became smaller over the

Chapter 4: Scotland‘s lifespan variation trend in Western Europe
186
time period indicating a convergence of trends. However Scotland‘s annual
lifespan variation ranking in Western Europe deteriorated from 7th (males) and
8th (females) position to 17th position. This was partly because other countries
were able to reduce lifespan variation at a faster rate and overtake Scotland,
despite having higher absolute levels of lifespan variation at the beginning of the
time period. It was also partly due to males in Scotland experiencing a diverging
lifespan variation trend from decreasing (at a relatively slower rate) to slightly
increasing lifespan variation, and to females in Scotland experiencing one of the
greatest reductions in the rate of relative change over time. Most countries have
been able to maintain a decreasing trend since 1950 and there is a particularly
notable convergence of trends for females in the comparator countries.
Although periods of slightly increasing lifespan variation are evidenced in a
number of countries these have returned to decreasing. The most recent change
in trend for males in Scotland is the longest sustained divergence in lifespan
variation of the countries included in the analysis. Although the trend is still
decreasing for females in Scotland the picture is still of concern: they have had
the highest level of absolute lifespan variation for the past 22 years. Therefore
males and females in Scotland are now in the unenviable position of ranking
highest in level of lifespan variation: meaning that the population experiences
the highest level of total inequality in Western Europe.
Lifespan variation reflects another dimension of health inequality that Scotland
performs poorly on when measured against comparable Western European
countries, thus adding further support for examining Scotland as a case study
country. Formally investigating the lifespan variation trend in Scotland

Chapter 4: Scotland‘s lifespan variation trend in Western Europe
187
demonstrates that although it is a country with relatively higher levels of
lifespan variation this has not always been the case.
4.5.2 Comparison with existing studies
The timing of the most recent change in lifespan variation trend for Scotland is
somewhat comparable with the trend analysis of life expectancy by McCartney
et al. (2012b). This study concluded that Scotland‘s life expectancy trend was
previously comparable with Western European countries but from around 1980
improvement in life expectancy faltered. No formal quantification of the life
expectancy trend was carried out by McCartney et al. (2012b) meaning direct
comparisons cannot be drawn even though the same time periods have been
covered and the same HMD data utilised. Despite this the similar timing of the
change in trends is not an unexpected result given that the international
literature has established a strong correlation between life expectancy and
lifespan variation (Smits and Monden, 2009, Oeppen, 2008).
4.5.3 Strengths and limitations
The findings reported here contribute to the body of research concerned with
the timing and extent of change to health inequalities across Western Europe
(Mackenbach et al., 2008, Popham et al., 2013, Smits and Monden, 2009). They
were produced using the highest quality lifetable data available and
demonstrate the most up-to-date estimates of lifespan variation across Western
European countries. Calculating annual lifespan variation estimates for Scotland
and 16 Western European countries, previously identified as valid comparators
(Leon et al., 2003, McCartney et al., 2012b), allowed Scotland‘s relative ranking
in each year to be assessed, answering research question one.

Chapter 4: Scotland‘s lifespan variation trend in Western Europe
188
The extensive time period covered facilitated the use of joinpoint regression
analysis. This is a well-established method for analysing trends in a number of
health outcomes such as cancer (Goovaerts and Xiao, 2011, Bosetti et al., 2008)
and suicide (Coope et al., 2014, Hegerl et al., 2013) but which has rarely been
utilised for understanding lifespan variation trends. This method of analysis
identified the timing of change and relative rate of change to the population
level lifespan variation trend in Scotland, answering the second research
question. Although the methods of analysis employed in this chapter adequately
answer the research question this does not mean that the results should not be
reflected upon.
4.5.4 Stage in epidemiological transition
The finding that Scotland‘s trend was distinguishable from most other Western
European countries is perhaps not surprising given that a long time period was
covered during which different countries were at different stages of the
epidemiological transition. This is important to consider when analysing
historical trends and when comparing countries at the same point in
chronological time as they may have been experiencing different processes of
modernization (Vallin and Meslé, 2004).
Omran (1971) summarised processes of modernization in terms of the general
mortality patterns and the factors driving them. He stated that societies tend to
experience three stages as they develop into industrialized countries with
advanced health care. The first stage tends to be characterised by high and
fluctuating mortality due to factors such as pestilence and famine. The second
stage is defined by rapid reductions in mortality due to receding pandemics. The

Chapter 4: Scotland‘s lifespan variation trend in Western Europe
189
third stage is characterised by a flattening in the reduction of mortality and the
increasing presence of degenerative and man-made diseases as opposed to
infectious diseases (Vallin and Meslé, 2004).
Therefore differences in trends in lifespan variation may be associated with
differences in the timing of mortality change being experienced. This has
prompted some to argue that cross-national comparative studies of health
inequalities should compare countries in terms of epidemiological time rather
than comparing countries in in terms of chronological time (Mackenbach et al.,
1997, Smits and Monden, 2009). The analysis in chapter 6 seeks to reflect this
debate and a more detailed discussion is provided there.
4.5.5 Whole country comparisons
In a similar vein it could be argued that comparing whole countries may be seen
as an overly crude approach: there is wide heterogeneity within countries
restricting any interpretation (Goovaerts and Xiao, 2011). The analysis in this
chapter did not assume that the factors driving lifespan variation within each
country would be the same: rather it acknowledged that the countries included
in the analysis captured a variety of social, political, economic and
epidemiological profiles. The chapter was concerned with the timing and level
of change and recognised that the analysis did not permit any conclusions about
the causes within each country to be drawn.
4.5.6 Premature mortality
Although the analysis in this chapter could not identify any single reason as to
why Scotland‘s lifespan variation trend diverged, it is hypothesised that
premature mortality will be part of the problem. This is because premature

Chapter 4: Scotland‘s lifespan variation trend in Western Europe
190
mortality has already been identified as driver of relatively higher lifespan
variation in the USA (Smits and Monden, 2009, Shkolnikov et al., 2011). However
this is not to say that premature mortality is the root cause of poorer population
health and higher inequality in Scotland: rather it should be interpreted as a
marker for the types of mechanisms linking social determinants and health
outcomes (McCartney et al., 2013).
van Raalte et al. (2011) argue that deaths at working ages could indicate the
failure of social protection policies to mitigate the risk of premature death for
the most vulnerable members of society. In a similar vein McCartney et al.
(2012b) argue that the stalling of life expectancy in Scotland may, in part, be
associated with the neo-liberal policies that were introduced during the 1980s.
Neo-liberalism is associated with policies that increase inequality, have a
negative impact on health outcomes and are associated with higher risk of
premature death (Peacock et al., 2014, Coburn, 2004). The neo-liberal policies
of the 1980s had a disproportionate impact on Scotland, where the effects of
deindustrialisation were more concentrated (Walsh et al., 2010).
Within Scotland increasing rates of premature mortality have been the focus of
much research attention. Mortality rates for males aged 15-29 years old
increased between 1981 and 2001 (Leyland, 2004, Norman et al., 2011). This is
the time when trends in life expectancy and lifespan variation in Scotland
changed suggesting that both of these trends may be partly explained by
premature mortality. Scotland‘s higher premature mortality problem is often
contrasted to the more favourable experience in England and Wales. However
Campbell et al. (2013) demonstrated that Scotland has had relatively greater

Chapter 4: Scotland‘s lifespan variation trend in Western Europe
191
improvements in mortality rates below ages 15 years old at some time points.
Fully understanding the implications these age differences in the distribution of
death have for population level trends is important for highlighting sub-groups
that are disadvantaged. Distinct age patterns of mortality can allude to the
types of social and aetiological process that may be causing Scotland‘s
unfavourable population level trends (Seaman et al., 2015).
4.5.7 Research implications
The findings demonstrating the timing of change therefore informed the
subsequent analysis in this thesis. The timing of stalling life expectancy
improvements in Scotland identified by McCartney et al. (2012b) corresponds
with the timing of the diverging lifespan variation trend. This could suggest that
the same changes to the age distribution of death in Scotland are responsible for
both of these outcome measures but this cannot be assumed. Although the two
outcome measures are highly correlated they capture distinct dimensions of
mortality: life expectancy improvements are achieved if the mortality rate at
any age is reduced over time but improvements in lifespan variation are age
dependant. Changes to age distribution of death and the impact these have had
on Scotland‘s lifespan variation trend have not yet been quantified.
4.6 Conclusion
Overall the study by McCartney et al. (2012b) and the analysis reported in this
chapter strongly suggest that sometime following the 1980s mortality processes
in Scotland began to change: these underlying changes were large enough to
have a visible, and long lasting impact on the population level trends. The timing
of these population level changes coincides with the timing of rising premature

Chapter 4: Scotland‘s lifespan variation trend in Western Europe
192
mortality rates for some age groups: alluding to the importance of tackling
premature mortality to ensure improvements in averages alongside reductions in
inequality. Future research quantifying the role premature mortality plays in
ensuring the twin aims of public health are achieved has implications far beyond
this thesis and to countries other than Scotland.

193
5 Age decomposition of change in lifespan variation
trend over time
5.1 Introduction
The previous chapter began the process of analysing the population level
lifespan variation trend within Scotland. It identified that Scotland ranks worst
for lifespan variation compared to 16 other Western European countries.
Scotland previously occupied a more favourable ranking but following the 1980s
failed to maintain the same relative rate of improvement for females and
diverged towards slightly increasing lifespan variation for males. This meant
other Western European countries, that had previously experienced higher
lifespan variation, were able to overtake Scotland. The findings described in this
next chapter extend the analysis of the population level lifespan variation trend
within Scotland by carrying out age-specific decomposition.
There are four main sections in this chapter. The first background section
summarises the age patterns of mortality decline that have historically been
required to maintain a decreasing lifespan variation trend. How changes to the
age-specific patterning of mortality have contributed to the changes in the
population level lifespan variation trend within Scotland has not yet been the
focus of any formal analysis. Therefore the chapter aims to answer the following
two research questions:
3. Which ages of death contributed to the lifespan variation trend within
Scotland?

Chapter 5: Age decomposition of change in lifespan variation over time
194
4. Did the ages of death contributing to the lifespan variation trend in
Scotland differ from the ages of death contributing to the lifespan
variation trend in England and Wales‘?
Answering these research questions begins to inform our understanding of why
the lifespan variation trend in Scotland diverged when it did. Analysing the ages
of death driving changes to lifespan variation in Scotland is important for helping
to understand the causes of higher inequality. In order to establish if the ages of
death driving Scotland‘s lifespan variation trend can be considered different or
problematic the enquiry needs to be extended to include an appropriate
comparison (Rose, 2001). England and Wales are appropriate comparators to
use: they are Scotland‘s closest geographical neighbour and share social and
economic contexts and a national government. The second section briefly
describes the age-specific decomposition analysis methods utilised to fill this
research gap. A more detailed description of the decomposition analysis methods
can be found in chapter 3 (data and methods). The third section reports the age-
specific decomposition results. Age-specific decomposition results in this chapter
are being used to understand which ages of death have driven the population
level lifespan variation trend within Scotland over time. The fourth section
summarises the results and outlines how they informed the thesis going forward.
5.2 Background
Reducing mortality rates across any age leads to increases in life expectancy but
decreases in lifespan variation are age dependent. Maintaining decreases in
lifespan variation over time depends on a country‘s ability to consistently reduce
mortality rates faster across ages that contribute to mortality compression than

Chapter 5: Age decomposition of change in lifespan variation over time
195
across ages that contribute to mortality expansion (Oeppen, 2008, Zhang and
Vaupel, 2009). Reducing deaths across ages that are well below the average life
expectancy generally lead to mortality compression and decrease lifespan
variation. A death was defined as premature within the context of this thesis if
delaying it to an older age would decrease lifespan variation.
Zhang and Vaupel (2009) showed that it is possible to define the precise age
which separates whether a death is considered ―early‖ or ―late‖ in terms of the
effect it will have on lifespan variation. The age which distinguishes ―early‖ and
―late‖ deaths is different in each country and tends to have increased over time
as life expectancy increases. Deaths that occur before the threshold age are
deemed to be ―early‖. Reducing ―early‖ deaths leads to mortality compression
which is beneficial for lifespan variation. Deaths that occur after the threshold
age are deemed to be ―late‖. Reducing ―late‖ deaths leads to mortality
expansion which is detrimental in terms of lifespan variation. For example the
distinguishing age in Japan in 1950 was 65 but by 2005 it was 84 (Zhang and
Vaupel, 2009). The threshold age in Scotland, and how it has changed over time,
will not be identified in this chapter. It is recognised that this could be the focus
of future research and demands more attention than could be given in this
thesis.
5.2.1 Diminishing returns
Historically the greatest mortality reductions have tended to be concentrated
across ages where the greatest proportion of the population dies (Vaupel, 1986).
In broad terms this has meant a shift from saving lives across infancy and
childhood – deaths more likely to have common causes that can be eradicated –

Chapter 5: Age decomposition of change in lifespan variation over time
196
to younger and older adult ages where a variety of causes may be interacting
with one another and that may be difficult to target (Oeppen, 2008, Nau and
Firebaugh, 2012). The shifting age profile of mortality ensured the greatest
impact in terms of life expectancy (Oeppen, 2008, Vaupel, 1986). However it
also means that it has become harder to maintain the same rate of decline in
lifespan variation: as premature deaths become rarer the marginal lifespan
variation gains made from reducing ―early‖ deaths tends to diminish (Vaupel,
1986). Tuljapurkar et al. (2000) add that over time the level of resources
required to reduce mortality rates has increased but the marginal effectiveness
has decreased because the causes of mortality are increasingly complex.
Despite these challenges most economically developed countries have continued
to experience a decreasing lifespan variation trend. Decreases in lifespan
variation are increasingly contingent upon reducing mortality rates across
―early‖ ages of death (Oeppen, 2008, van Raalte, 2011a, Zhang and Vaupel,
2009). Scotland‘s inability to reduce mortality rates at these ages might partly
explain why it is one of only a few countries that have not decreased lifespan
variation.
5.2.2 Age-specific mortality change in Scotland
Scotland is found to have experienced higher lifespan variation relative to
England and Wales when comparing the same time points. This finding was
evidenced in chapter 4. In any given year Scotland has also been less effective at
reducing premature mortality rates compared to England and Wales, with
mortality rates for some age groups increasing between 1981 and 2001 (Norman
et al., 2011, Leyland, 2004, Campbell et al., 2013). Norman et al. (2011)

Chapter 5: Age decomposition of change in lifespan variation over time
197
demonstrated that the mortality rate for males in the areas of Scotland
consistently classified as the most deprived increased between 1991 and 2001:
from 649 per 100,000 to 743 per 100,000. Leyland et al. ( 2007b) illustrated that
increasing premature mortality rates for ages 15-29 years between the same
time period were mostly due to deaths from external causes: alcohol misuse,
substance abuse, and suicides. Although age specific mortality change over time
has tended to always be to Scotland‘s detriment compared to England and Wales
(Campbell et al., 2013) the premature mortality patterns in Scotland are of
particular concern; they were masked when looking at all-cause mortality rates
for the total population of Scotland which have always decreased.
5.2.3 Research gaps
It is unlikely to be a coincidence that the timing of these increasing premature
mortality rates in Scotland strongly corresponds with the timing when lifespan
variation in Scotland diverged to a slightly increasing trend (Seaman et al.,
2016a). Considering the existing evidence, it is valid to speculate that
premature mortality in Scotland may account for the population level divergence
in lifespan variation trend following the 1980s. Yet this question has not yet
been the subject of any formal analysis. It is this research gap that this chapter
will fill.
This chapter formally quantifies the ages of death driving the population level
lifespan variation trend in Scotland over time compared to the ages of death
driving the population level lifespan variation trend in England and Wales. It is
important to understand if any of the age patterns of death driving higher and
diverging lifespan variation in Scotland were distinguishable from the age

Chapter 5: Age decomposition of change in lifespan variation over time
198
patterns in England and Wales, its closest comparator country. Any differences
in the age distribution of death may point to differences in the aetiological
pathways and social mechanisms that can better explain why population level
lifespan variation in these two seemingly comparable countries differs,
especially for males.
5.3 Data and methods
Data used in this chapter were sex specific lifetables for Scotland and England
and Wales. Although England and Wales are two separate countries the
governmental department responsible for collecting and reporting vital events
data in both is the Office for National Statistics (ONS) (Philipov, 2015). It is
National Records of Scotland who have responsibility over Scottish vital events
statistics (Jasilionis, 2015, National Records of Scotland, 2014a). Therefore it is
common practice in research and in official reporting of vital event statistics for
England and Wales to be combined (Campbell et al., 2013, Majeed, 2013). As a
result the data obtained from the Human Mortality Database were only available
in this format. Chapter 3 provides a detailed description of a life table. Sex
specific life tables for the years 1950-2010 for Scotland and for England and
Wales were used: this was a total of 240 life tables.
Data were obtained for males and females separately because of their different
mortality experiences. The sex differential in mortality is addressed within the
context of this thesis by stratifying the analysis by sex rather than analysing the
gap between males and females. This thesis recognises that there is a lifespan
variation difference between males and females but that this type of comparison
should be valued as a distinct research question in itself (Rigby and Dorling,

Chapter 5: Age decomposition of change in lifespan variation over time
199
2007, White et al., 2014). Although some descriptive comparisons are made
between the male trend and female trend this is not the focus of any formal
decomposition analysis in this thesis.
5.3.1 Five year average mortality rate
The annual age-specific mortality rates were aggregated for each five year time
period, beginning in 1950, and a five year average mortality rate calculated in
Stata SE13. This was to smooth the age specific mortality rates. The decision to
use five years‘ worth of data was informed by the approach used by van Raalte
et al. (2014) when decomposing lifespan variation trends in Finland between
1971 and 2010. It made the number of decompositions to be carried out more
manageable and the results clearer to interpret than annual changes in lifespan
variation which were analysed in chapter 4. An alternative approach would have
been to decompose the difference between the first and last year of each
decade, which was applied by van Raalte (2011b) when studying the lifespan
variation trend for Japanese females. Decomposing the difference between five
years provided a more detailed analysis of the trends than only looking at the
last year of each decade.
5.3.2 Age specific decomposition
The analysis in this chapter was used to partition the absolute change in lifespan
variation within each country, between each five year time period, into age
specific components. This was achieved by importing the five year mortality
rates calculated in Stata SE13 into Excel spreadsheets developed by (Shkolnikov
and Andreev, 2010). These spreadsheets apply Andreev‘s stepwise decomposition
algorithm. A description of the ‗general stepwise replacement algorithm‘ is

Chapter 5: Age decomposition of change in lifespan variation over time
200
given in the data and methods chapter of this thesis. In summary it is an
approach which is appropriate for decomposing, by age, changes in any
aggregate measure that is estimated from age-specific mortality rates and
accounts for all ages including the oldest open ended age.
This chapter applies stepwise decomposition to calculate the age-specific
contributions to the lifespan variation change within Scotland over time
compared to the lifespan variation change within England and Wales over time.
Decomposing lifespan variation changes within each country and then comparing
the results answers the two research questions. If the age specific mortality
change in Scotland differed from the age specific mortality change in England
and Wales this might suggest which aetiological processes and social mechanisms
may be responsible for Scotland‘s diverging lifespan variation trend. The
absolute change in life expectancy was also decomposed by age but is not
reported. Although the life expectancy analysis is of interest it was not required
to answer the specified research questions in this chapter.
5.4 Results
5.4.1 Estimates of lifespan variation for five year time periods
The estimates of lifespan variation (e†) calculated for each five year time period
are detailed in table 14.

Chapter 5: Age decomposition of change in lifespan variation over time
201
Table 14 e† estimates calculated from five year average mortality rate
Males Females
Years mx
averaged Scotland Eng. & Wales Scotland Eng. & Wales
1950-1954 13.94 13.04 13.18 12.28
1955-1959 13.25 12.49 12.24 11.68
1960-1964 13.00 12.41 12.03 11.52
1965-1969 12.77 12.25 11.90 11.46
1970-1974 12.51 12.07 11.79 11.33
1975-1979 12.19 11.72 11.61 11.07
1980-1984 11.84 11.40 11.30 10.84
1985-1989 11.58 11.21 11.04 10.66
1990-1994 11.49 11.04 10.88 10.43
1995-1999 11.53* 10.85 10.65 10.16
2000-2004 11.61* 10.72 10.45 9.94
2005-2009 11.55 10.67 10.31 9.79
*Increase in lifespan variation

Chapter 5: Age decomposition of change in lifespan variation over time
202
When using five year averaged mortality rates the trends for lifespan variation
generally correspond with the annual trends identified in the first chapters of
this thesis and reported here. For both males and females, absolute levels of
lifespan variation are higher in Scotland than England and Wales. This is the case
at any given time point covered in the analysis. Of particular relevance to this
thesis is the evidence that following the 1980s lifespan variation in Scotland
changed from decreasing to increasing for males.
5.4.2 Absolute and relative change between five year time periods
The absolute change and relative percentage change in lifespan variation
between each five year time period within Scotland and within England and
Wales were then calculated allowing further interpretation. The relative change
was calculated by dividing the change in lifespan variation by the absolute
lifespan variation estimate at the previous time point. The absolute changes in
lifespan variation are reported in table 15 for males and table 16 for females but
are perhaps easier to visualise in figure 27 and figure 28.

Chapter 5: Age decomposition of change in lifespan variation over time
203
Table 15 e† change over time, Males
Scotland England and Wales
Years mx averaged
absolute
(years)* %
absolute
(years)* %
(A) 1950-54 to 1955-59 -0.69 -4.93 -0.55 -4.22
(B) 1955-59 to 1960-64 -0.25 -1.91 -0.07 -0.60
(C) 1960 -64 to 1965-69 -0.23 -1.79 -0.17 -1.33
(D) 1965-69 to 1970-74 -0.26 -2.03 -0.18 -1.48
(E) 1970-74 to 1975-79 -0.32 -2.52 -0.35 -2.88
(F) 1975-79 to 1980-84 -0.35 -2.88 -0.31 -2.68
(G) 1980-84 to 1985-89 -0.26 -2.18 -0.19 -1.68
(H) 1985-89 to 1990-94 -0.10 -0.84 -0.18 -1.57
(I) 1990-94 to 1995-99 0.04 0.39 -0.18 -1.66
(J) 1995-99 to 2000-04 0.08 0.72 -0.13 -1.22
(K) 2000-04 to 2005-09 -0.07 -0.56 -0.05 -0.47
*these columns are the values that were decomposed by age
Increasing lifespan variation reflects increasing inequality in age at death

Chapter 5: Age decomposition of change in lifespan variation over time
204
Table 16 e† change over time, Females
Scotland England and Wales
Years mx averaged
absolute
(years)* %
absolute
(years)* %
(A) 1950-54 to 1955-59 -0.94 -7.16 -0.60 -4.89
(B) 1955-59 to 1960-64 -0.21 -1.75 -0.17 -1.43
(C) 1960-64 to 1965-69 -0.12 -1.02 -0.06 -0.48
(D) 1965-69 to 1970-74 -0.12 -0.98 -0.13 -1.12
(E) 1970-74 to 1975-79 -0.18 -1.53 -0.26 -2.33
(F) 1975-79 to 1980-84 -0.31 -2.63 -0.23 -2.10
(G) 1980-84 to 1985-89 -0.26 -2.33 -0.18 -1.63
(H) 1985-89 to 1990-94 -0.15 -1.40 -0.23 -2.17
(I) 1990-94 to 1995-99 -0.24 -2.19 -0.27 -2.59
(J) 1995-99 to 2000-04 -0.19 -1.79 -0.22 -2.12
(K) 2000-04 to 2005-09 -0.14 -1.37 -0.15 -1.54
*these columns are the values that were decomposed by age
Increasing lifespan variation reflects increasing inequality in age at death

205
Figure 27 Change in lifespan variation over time, Males

206
Figure 28 Change in lifespan variation over time, Females

Chapter 5: Age decomposition of change in lifespan variation over time
207
5.4.2.1 Males
At the earliest time points the decrease in lifespan variation was greater for
males in Scotland than males in England and Wales. For males in Scotland there
was a -0.25 years decrease in lifespan variation between 1955-59 and 1960-64.
This was greater than the -0.07 years decrease in England and Wales for the
same time period. During the middle of the time period the decrease in lifespan
variation for males in Scotland and males in England and Wales is similar: the
grey and black lines are closer. However this is always within the context of
higher absolute levels of lifespan variation in Scotland. The change in lifespan
variation in Scotland then diverges from England and Wales and crosses the zero
line. Between 1990-94 and 1995-99 there was a lifespan variation increase of
0.04 years. This is not the case for males in England and Wales: between 1990-94
and 1995-99 there was a still a decrease in lifespan variation of -0.18 years. This
is evident as the grey and black lines are furthest apart. Scotland then achieves
a small decrease in lifespan variation between 2000-04 and 2005-2009 and is
similar to the decrease in England and Wales, yet still within the context of
higher absolute levels of lifespan variation.
5.4.2.2 Females
The lifespan variation trend for females in Scotland and England and Wales was
always decreasing in this period. There have been times when females in
Scotland were experiencing relatively more favourable decreases, but within the
context of higher absolute lifespan variation. For example between 1960-64 and
1965-69 lifespan variation decreased in Scotland by -0.12 years while England
and Wales reduced it by -0.06 years. Over time the decreases for females in
Scotland have changed to be slightly smaller than the decreases in England and

Chapter 5: Age decomposition of change in lifespan variation over time
208
Wales and within the context of higher absolute levels of lifespan variation. For
example between 1985-89 and 1990-94 in Scotland lifespan variation decreased
by -0.15 years but in England and Wales it decreased by -0.23 years. The
divergence in Scotland evident for males is not evident for females.
5.4.3 Scotland and England and Wales
5.4.3.1 Death distributions
The fact that Scotland experienced a higher absolute level of lifespan variation
over the entire time period, alongside the differences in the level of change in
lifespan variation achieved and the increasing lifespan variation trend indicates
that the age distributions of death must differ between Scotland and England
and Wales. Figure 29 provides a comparison of the age distributions of death (%)
for males in Scotland and males in England and Wales for the earliest time
period (1950-54) and the latest time period (2005-09).

209
Figure 29 Comparison of death distribution over time in Scotland and in England and Wales, Males

Chapter 5: Age decomposition of change in lifespan variation over time
210
For males the death distributions for the two countries appear more similar in
1950-54 than in 2005-09. In 1950-54 the left hand tail of the distribution is long
and the percentage at deaths across these ages is slightly higher in Scotland than
in England and Wales. By 2005-09 this gap had widened and premature deaths
towards the left hand are higher in Scotland than in England and Wales. A
greater percentage at deaths in England and Wales occur at older ages in 2005-
09 than in Scotland in 2005-09. However perhaps of most concern is that the
percentage at deaths across the left hand tail of the distribution for males in
Scotland in 2005-09 is very similar to the percentage at deaths across the left
hand tail of the distribution for males in England and Wales in 1950-54. Infant
mortality is an exception.
Figure 30 provides a comparison of the age distributions of death (%) for females
in Scotland and females in England and Wales for the period 1950-54 and
2005-09.

211
Figure 30 Comparison of death distribution over time in Scotland and in England and Wales, Females
Chapter 5: Age decomposition of change in lifespan variation over time
212
For females the age at death distributions for the two countries are similar in
1950-54 than in 2005-09. In 1950-54 the percentage at deaths at ages in the left
hand tail of the distribution is slightly higher in Scotland than in England and
Wales. By 2005-09 this gap had widened and premature deaths towards the left
hand are higher in Scotland than in England and Wales. A greater percentage at
deaths in England and Wales occur at older ages in 2005-09 than in Scotland in
2005-09. However, unlike for males, the percentage at deaths across the left
hand tail of the distribution for females in Scotland in 2005-09 is lower than the
percentage at deaths across the left hand tail of the distribution for females in
England and Wales in 1950-54.
The remaining analysis in this chapter quantifies the impact changes to the age
specific mortality rates have had on the population level change in lifespan
variation. It compares Scotland with England and Wales in order to identify if
any of the age contributions in Scotland are distinguishable.
5.4.4 Age decomposition of change in lifespan variation
Age-specific decomposition results for lifespan variation throughout this chapter
are presented as spike graphs (figure 31 to figure 38). The spike graphs show the
age specific components that make up the total change in lifespan variation
between each five year time period. The spike graphs in this chapter and the
age process they reflect are interpreted in the following two ways.
Firstly, spikes which are below the zero line are desirable in terms of decreasing
lifespan variation. These correspond to ages at which mortality change has
contributed to decreasing lifespan variation. Decreases in lifespan variation are

Chapter 5: Age decomposition of change in lifespan variation over time
213
achieved if mortality rates are lower in the later time period across ―early‖ ages
of death which drive mortality compression.
Secondly, spikes which are above the red zero line correspond to ages at which
mortality change has contributed to increasing lifespan variation. Increases in
lifespan variation may occur through two different processes. Higher mortality
rates across ―early‖ ages of death later in time which prevent mortality
compression and lower mortality rates across ―late‖ ages of death later in time
which cause mortality expansion.

214
Figure 31 Age specific components of total change in lifespan variation between each five year time period in Scotland (black spikes) compared to in England
and Wales (grey spikes), Males

215
Figure 32 Age specific components of total change in lifespan variation between each five year time period in Scotland (black spikes) compared to in England
and Wales (grey spikes), Females

Chapter 5: Age decomposition of change in lifespan variation over time
216
Over time some of the age specific patterns and the size of the contributions in
Scotland are similar to England and Wales but there are also notable differences.
The age specific patterns driving lifespan variation over time can be described in
terms of whether the change in mortality rate within each country, later in
time, (1) contributed to mortality compression, (2) prevented mortality
compression, or (3) contributed to mortality expansion.
5.4.4.1 Dense contributions driving mortality compression
Between 1950-54 and 1955-59 Scotland experienced a decrease in lifespan
variation of -0.69 years for males. For the same time period males in England
and Wales experienced a decrease of -0.55 years. Between these two time
periods the general pattern of mortality decline in Scotland was similar to
England and Wales as illustrated in figure 33.
Figure 33 Age contributions from mortality change between 1950-54 and 1955-59 to total change
in lifespan variation, Males

Chapter 5: Age decomposition of change in lifespan variation over time
217
Contributions to mortality compression were made from reducing mortality rates
across most ages in Scotland and in England and Wales. These contributions can
be described as dense contributions: the spikes are consistent across all ages
without any fluctuations across the zero lines. The spikes for most ages in
Scotland and England and Wales are consistently below the red zero line. Lower
mortality rates, later in time, across ages 0 to 74 years old contributed -0.79
years to the total change in lifespan variation in Scotland. In England and Wales
lower mortality rates across these ages contributed -0.63 years to the total
change in lifespan variation. Although lower mortality rates across some older
ages were contributing to mortality expansion these contributions were offset.
In Scotland ages 75+ contributed 0.10 years to the change in lifespan variation.
In England and Wales ages 75+ contributed 0.07 years to the total change in
lifespan variation.
A similar pattern is illustrated for the total change in lifespan variation in the
earliest period for females in figure 34. However the contributions from lower
mortality rates later in time were larger than for males because the
improvements in lifespan variation were greater for females. For females in
Scotland falling mortality rates from ages 75+ contributed 0.11 years to the total
change in lifespan variation: in England and wales ages 75+ contributed 0.16
years to the total change in lifespan variation. These contributions were offset
by greater decreases in mortality rates across ages 0-74 years old: for females in
Scotland these ages contributed -1.06 years to the total change in lifespan
variation, for females in England and Wales the contribution to the total change
was -0.76 years.

Chapter 5: Age decomposition of change in lifespan variation over time
218
Figure 34 Contributions from mortality change between 1950-54 and 1955-59 to total change in
lifespan variation, Females
5.4.4.2 Fluctuating contributions
As time progresses the dense pattern driving mortality compression, and
contributing to decreasing lifespan variation, changes. For example the dense
contributions are no longer evident between 1965-69 and 1970-74 in either
Scotland or England and Wales. Rather fluctuating patterns are seen. Between
these time periods males in Scotland experienced a decrease in lifespan
variation of -0.26 years. For the same time periods males in England and Wales
experienced a decrease of -0.18 years. Between 1965-69 and 1970-74 the
general pattern of mortality decline in Scotland was similar to England and
Wales as illustrated in figure 35.

Chapter 5: Age decomposition of change in lifespan variation over time
219
Figure 35 Contributions from mortality change between 1965-69 and 1970-74 to total change in
lifespan variation, Males
For males in Scotland contributions to the total change in lifespan variation
between 1965-69 and 1970-74 from each age fluctuate and cross the zero line
but are relatively small. In England and Wales the density of the contributions is
reduced and there is some fluctuation but to a much lesser extent than in
Scotland. Decreasing mortality rates during the first year of life are continuing
to drive mortality compression. This, alongside limited contributions from older
ages to mortality expansion, means that an overall decreasing trend was
maintained. The same fluctuating pattern is seen when comparing females in
Scotland with females in England and Wales as illustrated in figure 36.

Chapter 5: Age decomposition of change in lifespan variation over time
220
Figure 36 Contributions from mortality change between 1965-69 and 1970-74 to total change in
lifespan variation, Females
Fluctuating contributions to lifespan variation in Scotland indicates that
mortality rates across all ages were not consistently lower later in time. The
absence of a fluctuating pattern in England and Wales demonstrates that
mortality rates were consistently lower later in time, although not as large as
the reductions made between earlier time points.
5.4.4.3 Offsetting mortality expansion
The most recent changes in the age specific patterns of death do not
demonstrate a fluctuating pattern. In both countries there is evidence of a shift
towards a two peaked distribution but the age patterns of change in Scotland
and in England and Wales are quite different.
A two peaked distribution is generally characterised by mortality compression at
the left of the distribution and mortality expansion at the right hand of the
distribution. In order to maintain decreases in lifespan variation the
contributions from the left hand of the distribution must offset the contributions

Chapter 5: Age decomposition of change in lifespan variation over time
221
from the right hand of the distribution. Scotland did not achieve this between
1990-94 and 1995-99 or between 1995-99 and 2000-04 (figure 37) but England
and Wales did.
Figure 37 Contributions from mortality change between 1995-99 and 2000-04 to change in life
expectancy, Males
Scotland‘s increasing lifespan variation was not due to mortality across
infant/early life ages. Mortality rates across ages 0 to 15 years old have tended
to always be lower in the later time period resulting in mortality compression
and contributing to decreasing lifespan variation.
Mortality rates across ages 16 to 69 years were not consistently lower in Scotland
in the later time period. For some premature adult ages mortality rates were
higher in the later time period, evidenced by the contributions to increasing
lifespan variation. This partly explains why Scotland‘s trend changed. Higher
mortality rates across ages 20 to 40 years old in 1995-99 compared to 1990-94
contributed 0.09 years to the total change in lifespan variation. Higher mortality
rates across ages 20 to 40 years old in 2000-04 compared to in 1995-99
contributed 0.04 years to the total change in lifespan variation.

Chapter 5: Age decomposition of change in lifespan variation over time
222
For males in Scotland decreasing mortality rates across ages 70+ contributed to
increasing lifespan variation by expanding the age distribution of death. 0.22
years of lifespan variation were added to the total change between 1995-99 and
2000-04 from expansion. This could not be counterbalanced by the -0.18 years
contributed from compression from ages <70 resulting in an overall increase in
lifespan variation of 0.04 years for males in Scotland (lifespan variation changes
over time detailed in table 14).
A similar pattern continued for males in Scotland between 1995-1999 and 2000-
04: decreasing mortality rates across ages 70+ contributed to increasing lifespan
variation by expanding the age distribution of death. 0.29 years of lifespan
variation were added to the total change between 2000-04 and 1995-99 from
expansion. This could not be counterbalanced by the -0.21 years contributed
from the compression from ages <70 resulting in an overall increase in lifespan
variation of 0.08 years.
This is not the case for males in England and Wales and there are no detrimental
contributions, in terms of lifespan variation, from premature adult ages. For
males in England and Wales mortality expansion from decreasing mortality rates
at older ages is being offset by the contributions from mortality compression.
Decreasing mortality rates causing expansion contributed 0.26 years to the total
lifespan variation change in England and Wales. Mortality compression
contributed -0.40 years in England and Wales.
These differences between Scotland and England and Wales are also found for
females. This is illustrated in figure 38. However the detrimental contributions

Chapter 5: Age decomposition of change in lifespan variation over time
223
for females in Scotland are not as large as they are for males in Scotland so an
overall decreasing trend was maintained.
Figure 38 Contributions from mortality change between 1995-99 and 2000-04 to change in
lifespan variation, Females
5.5 Discussion
5.5.1 Summary of results
This chapter extended the evaluation of the population level lifespan variation
trend in Scotland, in a cross-national comparative context, by applying age
decomposition analysis. Age decomposition analysis formally quantified the ages
of death driving the lifespan variation trend in Scotland and allowed any
differences, compared to England and Wales, to be identified. England and
Wales were deemed to be the most appropriate comparator countries because
they are Scotland‘s closest geographical neighbour and they share social,
economic and political contexts. Despite this Scotland and England and Wales
have contrasting mortality experiences. The analysis identified that detrimental
contributions, in terms of lifespan variation, were made from increasing
premature mortality rates in Scotland only: these contributions largely

Chapter 5: Age decomposition of change in lifespan variation over time
224
accounted for the increasing lifespan variation trend. This age pattern was
distinguishable from England and Wales; a distinction that was more evident
when making comparisons between males in the two countries than between
females.
The finding that the risk of death across some premature adult ages was higher
for males in Scotland in 2000-04 than in 1995-99 and in 1995-99 than 1990-94
was not unexpected and is consistent with the existing body of literature that
was published following the 2001 Census (Leyland et al., 2007b, Norman et al.,
2011). The analysis in this chapter adds to the existing body of knowledge
comparing Scotland with England and Wales and focusing on their contrasting
experiences of premature mortality. It has a number of research strengths.
5.5.2 Strengths
Firstly, measuring lifespan variation to understand the mortality experience in
Scotland is novel. Lifespan variation is calculated from death counts and
population estimates. Suitable, high quality data have been available for
Scotland for many years and lifespan variation is a measure of inequality which
has an intuitive interpretation: it captures the average number of life years lost
when death occurs within a population. Despite this, age decomposition analysis
of lifespan variation has not previously been carried out for Scotland.
The changes to the lifespan variation trend within each country were
decomposed by age using an established method developed by (Shkolnikov and
Andreev, 2010). Using a five year average mortality rate was informed by van
Raalte et al. (2014) study of lifespan variation trends in Finland between 1971
and 2010. This ensured that the number of decompositions carried out were

Chapter 5: Age decomposition of change in lifespan variation over time
225
manageable and straightforward to interpret in contrast to annual changes. An
alternative approach would have been to decompose the change between the
first and last year of each decade (van Raalte, 2011b) but this approach would
have relied on annual mortality data. Although population level mortality data
are fairly stable they are not immune to random fluctuations. Therefore a
further benefit of calculating an average mortality rate is that most random
fluctuations would have been smoothed.
A further strength is the significant time period covered and the robust
comparator country used to understand the relative context of Scotland‘s age
pattern of mortality. England and Wales were selected on the basis that they
share social, political and economic contexts with Scotland, along with a
national government, as well as being Scotland‘s closest geographical
neighbours. Despite all of these commonalities the two countries have
contrasting mortality experiences, with the difference in lifespan variation being
the focus of this thesis.
Studies comparing Scotland with England and Wales recognise that these two
countries share a national government and have been exposed to many of the
same social, economic and political contexts: factors which are deemed to be
important for population health (Bambra, 2011a, Campbell et al., 2013).
Although Scotland‘s trend could have been studied in isolation it is only possible
to recognise the adversity of a problem in a country by extending the enquiry
beyond the country of interest to account for any distinguishable differences in
exposures (Rose, 2001); differences in exposures that may account for their
contrasting mortality experiences.

Chapter 5: Age decomposition of change in lifespan variation over time
226
5.5.3 Explanations for Scotland’s premature mortality problem
A number of hypotheses have been proposed for Scotland‘s mortality
disadvantage within Western Europe and relative to comparable countries, such
as England and Wales. For example,Walsh et al. (2016) argue that Scotland was
more vulnerable to the impacts of deindustrialisation and the implications this
had for deprivation, poverty and the level of inequality in society. The
underlying mechanisms associated with these theories could be associated with
higher premature mortality.
The analysis in this chapter cannot ascribe any one reason why Scotland has
been at a relative disadvantage in terms of premature mortality. Nor can this
thesis provide any insight into the so called ‗Scottish effect‘: the inability for
area level social deprivation to account for Scotland‘s excess mortality relative
to England and Wales (Popham and Boyle, 2011). This thesis does not compare
Scotland with England and Wales while controlling for socioeconomic deprivation
but it appreciates the important questions this body of research has presented.
Similar to the literature specifically concerned with the ‗Scottish effect‘ this
thesis draws attention to Scotland‘s premature mortality problem and how this
has contributed to widening mortality inequalities over time.
However this chapter has identified that the different population level lifespan
variation trends in Scotland and England and Wales were driven by differences in
the age patterns of mortality change (Shkolnikov et al., 2011, van Raalte,
2011a). This does not mean that the different age patterns themselves are the
final explanation. Rather evaluating differences in the age patterns of mortality
decline is only able to identify the countries which are lagging behind and

Chapter 5: Age decomposition of change in lifespan variation over time
227
highlight the population sub-groups who are at risk of an untimely death. This is
no easy undertaking especially because the causes of differences in premature
deaths in adulthood are particularly complex with deaths at these ages being
influenced by a range of mechanisms that may take time to change (Nau and
Firebaugh, 2012, Vallin and Meslé, 2004). This is in contrast to historical changes
in mortality decline associated with deaths in infancy. These were more
uniformly achieved by all economically advanced countries because they tended
to have a common underlying cause that could be directly tackled (Smits and
Monden, 2009, Vallin and Meslé, 2004).
5.5.4 Lifespan variation independent of life expectancy
This chapter focused on comparing chronological changes in the age pattern of
mortality decline in Scotland with the contemporaneous chronological changes
within England and Wales. It quantified the impact any changes have had in
terms of lifespan variation. This thesis has so far demonstrated, in relation to
Scotland, that increases in life expectancy are not inevitably coupled with
decreases in lifespan variation. Therefore the relationship between inequality
and average population health is complex and these two measures are not simply
a substitute for one another.
However in any given year countries with the highest life expectancy tend to
have the lowest level of lifespan variation prompting some to question if lifespan
variation can provide any additional insight over and above what we can deduct
from measuring life expectancy. Criticisms focus on the fact that studies of
crude changes in lifespan variation will almost completely reflect the crude
changes in life expectancy (Smits and Monden, 2009). Therefore it has been

Chapter 5: Age decomposition of change in lifespan variation over time
228
argued that it is perhaps more appropriate to study differences in lifespan
variation between two populations when life expectancy is the same, regardless
of the whether the same level of life expectancy was achieved at the same
chronological time (Smits and Monden, 2009). This allows the relative difference
in lifespan variation independent of life expectancy to be examined. Identifying
the ages of death contributing to the difference in lifespan variation could
indicate the types of aetiology that have caused unequal mortality reductions
between relatively comparable countries experiencing similar levels of average
population health (Smits and Monden, 2009, Wilmoth and Horiuchi, 1999).
5.5.5 Research implications
This critical insight into the limitations of the analysis in this chapter (looking
only at crude changes over chronological time) therefore informed the analysis
going forward. It is not yet known if there are any distinguishable differences in
the age specific patterns of mortality when Scotland and England and Wales
achieved comparable levels of average population health regardless of
chronological time. This is the focus of the analysis in chapter 6.
It is important to reassess the concept of chronological time in order to better
highlight important differences in the complex determinants of mortality
decline, in particular across premature adult ages of death. The reasons why
some determinants may differ in one country compared to another could be
differences in terms of: public health strategies, medical advances, levels of
social protection, temporal context or stage of epidemiological transition
(Omran, 1971, Vallin and Meslé, 2004, Wilmoth and Horiuchi, 1999).

Chapter 5: Age decomposition of change in lifespan variation over time
229
Given that Scotland and England and Wales share similar social and economic
contexts and a national government it could be assumed that these important
determinants of age specific mortality decline are the same. However there
have been some notable differences highlighted in the literature (Walsh et al.,
2016, McCartney, 2012, Hanlon et al., 2005). For example the impact of
deindustrialisation was more profound for Scotland and it has historically been
exposed to higher levels of deprivation and greater levels of relative inequality.
Therefore the cross national comparative context of this chapter and chapter 6
help to inform our understanding of the types of determinants that might
explain why the age pattern of mortality decline in Scotland is distinguishable
from England and Wales, and which social determinants within Scotland could be
deemed most important for explaining lifespan variation.
5.6 Conclusion
The results in this chapter formally identified the ages of death which have
driven the crude lifespan variation trend for Scotland compared to the ages of
death in England and Wales. The decomposition analysis allowed distinguishable
age patterns of mortality decline in Scotland to be identified and formally
quantified the contributions made by changes to the age pattern of mortality.
Identifying differences in the age pattern of death between Scotland and Wales
helped understand the pathways and mechanisms accounting for Scotland‘s
higher levels of lifespan variation and its faltering improvement following the
1980s.

Chapter 6: Increasing inequality at shared levels of life expectancy
230
6 Increasing inequality at shared levels of life
expectancy
6.1 Introduction
The previous chapter examined changes to the age patterns of mortality driving
lifespan variation changes over time. It formally quantified the contributions
each age at death made to changes in lifespan variation over time within
Scotland compared to within England and Wales. The age patterns driving the
increase in lifespan variation in Scotland were distinguishable from the age
patterns in England and Wales, particularly for males. Higher premature
mortality rates in Scotland in recent years prevented mortality compression.
This meant the contributions to increasing lifespan variation from fewer deaths
at older ages (mortality expansion) were not offset.
This chapter continues to focus on lifespan variation in Scotland compared to
England and Wales. It utilises some of the same lifetable data obtained from the
HMD used in chapter 5 and applies the same age-specific decomposition analysis.
It extends our understanding and interpretation of population level lifespan
variation by comparing Scotland with England and Wales when the same level of
life expectancy was achieved, albeit at different points in time. This allows
lifespan variation to be studied independently of life expectancy which Smits
and Monden (2009) argue may be more appropriate for understanding the
different social determinants that may be most important for increasing average
health alongside reducing inequality.

Chapter 6: Increasing inequality at shared levels of life expectancy
231
There are four main sections in this chapter. The first background section
summarises the literature which has evaluated the reasons why countries
achieving a high level of life expectancy at different points in time may do so
with different levels of lifespan variation. Scotland has tended to achieve the
same level of life expectancy as England and Wales later in time but it is not yet
known whether this has been with any lifespan variation advantage or
disadvantage or what ages of death account for any lifespan variation gap.
Therefore this chapter answers the following research questions:
5. Was lifespan variation higher or lower in Scotland at a shared level of life
expectancy with England and Wales?
6. Which ages of death account for the lifespan variation gap between
Scotland and England and Wales at a shared level of life expectancy?
Answering these questions helps to understand which differences in the age-
specific processes of mortality change may be most important in terms of
achieving the association between high average population health and low
inequality. The second section briefly describes the data used for the analysis
and the interpretation of age-specific decomposition as it is applied within this
chapter. The third section describes the results. The final section outlines how
the findings from the population level analysis chapters informed the decision to
study deprivation specific trends in lifespan variation going forward in this
thesis.
6.2 Background
In any given year, countries with the highest levels of life expectancy tend to
have the lowest levels of lifespan variation (Smits and Monden, 2009, Vaupel et

Chapter 6: Increasing inequality at shared levels of life expectancy
232
al., 2011). Scotland currently experiences the lowest level of life expectancy
and highest level of lifespan variation in Western Europe (McCartney et al.,
2012b, Seaman et al., 2016a). This demonstrates the strong negative correlation
between life expectancy and lifespan variation.
Given the correlation, alongside the fact that they represent distinct dimensions
of mortality, Smits and Monden (2009) argued that it may be more appropriate
for cross national comparisons to focus on the lifespan variation gap when
similar levels of life expectancy were achieved, regardless of when they were
achieved. This approach allows differences in lifespan variation to be studied
independently of life expectancy.
This reinterpretation of the time dimension is important to explore as countries
reaching the same level of life expectancy, particularly at differing times, tend
to do so with underlying differences in age specific mortality rates, resulting in
different levels of lifespan variation (Shkolnikov et al., 2011, Auger et al., 2014,
Nau and Firebaugh, 2012). There are at least three possible scenarios that can
be considered. The first two were set out by Smits and Monden (2009) and this
thesis proposes the third scenario.
Firstly, countries reaching a level of life expectancy later in time may do so with
low levels of lifespan variation. Life expectancy pioneers have historically
reduced premature mortality rates the most in order to achieve their high levels
of life expectancy, which in turn equates to low lifespan variation. This means
countries arriving at a high life expectancy later in time will do so with very
similar levels of lifespan variation to the pioneers. This is termed the forerunner
hypothesis.

Chapter 6: Increasing inequality at shared levels of life expectancy
233
Secondly, countries reaching the same level of life expectancy later do so with
lower lifespan variation than life expectancy pioneers. This is because they have
a temporal advantage and can capitalise on the lessons already learnt about
reducing premature mortality rates from the countries ahead of them. Or as
Vallin and Meslé (2004) state ―the most recent arrivals advance more rapidly
than the pioneers‖. This is termed the diffusion hypothesis.
Thirdly, and perhaps surprisingly, there may be some developed countries
achieving the same life expectancy later in time but with considerably higher
levels of inequality. This suggests that there are countries that are failing to
benefit fully from their temporal advantage. This is somewhat counter-intuitive
as the economic cost of reducing premature adult mortality – deaths associated
with external causes – tend to be lower than the economic costs of reducing old
age mortality – deaths from chronic diseases (Smits and Monden, 2009, Nau and
Firebaugh, 2012). Vallin and Meslé (2004) therefore suggest that not all societies
are equally prepared to draw on the benefits of earlier innovation or replicate
outside practices. This thesis termed this the laggard hypothesis.
It is therefore argued that any relative difference in lifespan variation, at a
shared level of life expectancy, may reflect contrasting influences on mortality
rates between countries (Smits and Monden, 2009). These contrasting influences
may include differences in terms of: the social determinants of health, public
health strategies, temporal contexts, or stages of epidemiological transition
(Wilmoth and Horiuchi, 1999, Omran, 1971, Vallin and Meslé, 2004).
These broad types of determinants of mortality are relevant for Scotland and
have already been incorporated into some of the hypotheses proposed for

Chapter 6: Increasing inequality at shared levels of life expectancy
234
tackling Scotland‘s premature mortality problem. For example the association
between deindustrialisation, social deprivation and the level of social protection
provided to protect those most at risk of premature death (Walsh et al., 2016).
6.2.1 Research gap
The current literature looking at mortality in Scotland has tended to place an
emphasis on the upstream explanations that link structural changes in
employment and the political landscape to poverty, deprivation and in particular
inequality in Scotland. Yet the relative level of lifespan variation, a novel
measure of inequality, in Scotland has not previously been the focus of any
formal analysis. It is this research gap that this chapter will fill.
Measuring the lifespan variation gap between Scotland and England and Wales,
at similar levels of life expectancy, will help to distinguish between the three
internationally relevant scenarios put forward for describing population level
lifespan variation inequalities: the forerunner hypothesis, the diffusion
hypothesis, or the laggard hypothesis. Formally quantifying the ages of death
that account for the lifespan variation gap will provide further insight into the
types of aetiological pathways and social mechanisms that have caused uneven
patterns of mortality decline despite shared levels of average population health.
6.3 Data & methods
Data used in this chapter were the mortality rates from the sex specific life
tables for Scotland and England and Wales provided by the Human Mortality
Database. Chapter 3 provides a detailed description of a life table. The mortality
rates from the life tables for the years 1949-2013 (the latest available year at
the time of analysis) were used for the analysis in this chapter: this was a total

Chapter 6: Increasing inequality at shared levels of life expectancy
235
of 260 life tables. Results are reported for males and females separately because
their mortality experiences differ.
Age specific mortality rates from the lifetables were used to calculate a three
year rolling average annual mortality rate for each age and year from 1950 to
2012. The rolling average mortality rates give equal weight to each year. This
approach for smoothing annual mortality rates, which are inherently vulnerable
to random fluctuations, is consistent with the approach used by National Records
of Scotland (2014b). The rolling average mortality rates were converted to life
table probabilities of dying for males and females in Scotland and England and
Wales separately. From these lifetable probabilities life expectancy and lifespan
variation were calculated using methods implemented in a Microsoft Excel
spreadsheet provided by the Max Planck Institute for Demographic Research and
authored by Shkolnikov and Andreev (2010). It was appropriate to use 5 years‘
worth of data when comparing contemporaneous trends over time in order to
make the number of decompositions more manageable. Smoothing over 3 years‘
worth of mortality data allows for more detail and is commonly applied within
empirical research(Leyland et al., 2007b). For these reasons 3 years‘ worth of
data were aggregated going forward in this thesis.
The analysis reported in this chapter utilised stepwise decomposition methods to
calculate the age-specific contributions to any lifespan variation gap between
Scotland and England and Wales at shared levels of life expectancy. The same
level of life expectancy was also decomposed by age in order to illustrate that
inequalities in the age distribution of death can exist even when life expectancy
is comparable (Auger et al., 2014). This also establishes if the mortality rates

Chapter 6: Increasing inequality at shared levels of life expectancy
236
contributing to the lifespan variation gap were also detrimental to Scotland‘s
life expectancy even when overall life expectancy was similar. However the
primary focus of this thesis is on lifespan variation as a measure of inequality.
For this reason any discussion of the analysis of life expectancy is limited.
6.4 Results
6.4.1 The association between life expectancy and lifespan variation over
time
Figure 39 illustrates the level of lifespan variation that was achieved when the
same level of life expectancy was achieved in Scotland compared to in England
and Wales, for males. Figure 40 illustrates the same for females. Three
comparisons are highlighted in colour; when the lifespan variation advantage to
Scotland was greatest, when the lifespan variation gap was smallest and when
the lifespan variation disadvantage to Scotland was greatest.

Chapter 6: Increasing inequality at shared levels of life expectancy
237
Figure 39 Association between life expectancy and lifespan variation, Males

Chapter 6: Increasing inequality at shared levels of life expectancy
238
Scotland has tended to achieve a similar level of life expectancy approximately
ten years later than England and Wales. Scotland was previously able to achieve
the same level of life expectancy later in time than England and Wales with
slightly lower lifespan variation. Following 1985, for males, Scotland lost its
lifespan variation advantage when it achieved a similar level of life expectancy
later in time than England and Wales. For example males in Scotland reached
the same life expectancy in 2008 as males in England and Wales in 1999 (about
75 years) but lifespan variation was greater in Scotland (years highlighted in
figure 39). This same change is observed for females but the level of higher
lifespan variation, at a shared level of life expectancy, is not as large as seen for
Figure 40 Association between life expectancy and lifespan variation, Females

Chapter 6: Increasing inequality at shared levels of life expectancy
239
males in more recent years (the scatter plots for females in Scotland diverge
less).
6.4.2 Death distributions
The lifespan variation gap at shared levels of life expectancy means that the age
distributions of death must differ.
Figure 41 provides a comparison of the age distributions of death (%) for males in
Scotland and males in England and Wales when a similar level of life expectancy
was achieved. The three comparisons made are those highlighted in colour in
figure 39.

240
Figure 41 Comparison of death distributions in Scotland and England and Wales when shared level of life expectancy achieved, Males
Chapter 6: Increasing inequality at shared levels of life expectancy
241
For males the death distributions in Scotland and in England and Wales at a
shared level of life expectancy are never exactly identical; this is not
unexpected. Some of the differences in the age distributions are beneficial for
Scotland in terms of lifespan variation while others are detrimental in terms of
lifespan variation.
At a shared life expectancy of 66 years lifespan variation was 0.34 years lower in
Scotland. This life expectancy was achieved in both countries with a similar
percentage at deaths at younger ages and older ages. Lower lifespan variation in
Scotland, at this level of life expectancy, will partly be associated with the
slightly smaller percentage at deaths during the first year of life but will also be
because of the lower percentage at deaths across ages 70 to 90 years (black line
below the grey line). It is surprising that at this shared level of life expectancy
there was a higher percentage at deaths across ages 50 to 70 years old (the
black line is higher than the grey line) in Scotland.
At a shared life expectancy of 70 years lifespan variation was 0.06 years lower in
Scotland. This is a much smaller lifespan variation gap than at a shared life
expectancy of 66 years and the distributions of death are very similar. However
it is concerning that the percentage at deaths from around age 30 to around 65
are higher in Scotland than in England and Wales despite the fact that Scotland
achieved this life expectancy 8 years later.
At a shared life expectancy of 75 years lifespan variation was 0.74 years higher
in Scotland. This is a much larger lifespan variation gap than seen at lower levels
of life expectancy and in the opposite direction to the comparison at a shared
life expectancy of 66 years. It is therefore not surprising that there was a more
Chapter 6: Increasing inequality at shared levels of life expectancy
242
notable difference in the age distributions of death. The percentage at deaths
from around age 20 to around 60 are higher in Scotland than in England and
Wales despite the fact that Scotland achieved this life expectancy 9 years later.
Figure 42 provides a comparison of the age distributions of death (%) for females
in Scotland and females in England and Wales when a similar level of life
expectancy was achieved. The three comparisons made are those highlighted in
figure 40.

243
Figure 42 Comparison of death distributions in Scotland and England and Wales when shared level of life expectancy achieved, Females

Chapter 6: Increasing inequality at shared levels of life expectancy
244
For females the death distributions in Scotland and in England and Wales at a
shared level of life expectancy are never identical. Some of the differences in
the age distributions are beneficial in terms of lifespan variation while others
are detrimental to Scotland.
At a shared life expectancy of 71 years lifespan variation was 0.36 years lower in
Scotland. This life expectancy was achieved in both countries with a similar
percentage at deaths at younger ages and older ages. Lower lifespan variation in
Scotland, at this level of life expectancy, will partly be associated with the
slightly smaller percentage at deaths during the first year of life: the percentage
at deaths occurring across childhood and early life ages are also noteworthy
(black line lower than grey line). However it will also partly be because of the
lower percentage at deaths from age 80 years old which means there was
limited expansion (black line very close to or below the grey line). It is also
surprising that at this shared level of life expectancy there was a higher
percentage at deaths across ages 50 to 70 years old (the black line is higher than
the grey line) in Scotland despite the fact that it was achieved 6 years later in
time.
At a shared life expectancy of 76 years lifespan variation was 0.09 years higher
in Scotland. The lifespan variation gap has flipped to be to Scotland‘s
disadvantage and will partly be associated with the slightly higher percentage at
deaths at older ages leading to mortality expansion. It is of concern that the
percentage at deaths from around age 50 to around 70 are higher in Scotland
than in England and Wales despite the fact that Scotland achieved this life
expectancy 8 years later.

Chapter 6: Increasing inequality at shared levels of life expectancy
245
At a shared life expectancy of 80 years lifespan variation was 0.20 years higher
in Scotland. This is a larger lifespan variation gap than the earlier comparison.
Although the gaps between the distributions are not as wide as the earlier
comparisons there appears to be differences across more ages. The lifespan
variation disadvantage in Scotland will partly be associated with the slightly
higher percentages of deaths at older ages because these will contribute to
mortality expansion: this is detrimental in terms of lifespan variation but
indicates a greater proportion of the population are living to older ages. Perhaps
of greater concern is that the percentage at deaths from around age 30 to
around 65 are higher in Scotland than in England and Wales despite the fact that
Scotland achieved this life expectancy 9 years later. However the difference
between the two lines across these premature adult ages is not as large for
females as it is for males. There is a small gap between the distribution from
around age 70 to around age 80 years old with a lower percentage at deaths in
Scotland.
6.4.3 Age-specific decomposition
The contributions that any differences in the age patterns of mortality made to
the total lifespan variation gap between Scotland and England and Wales when
achieving a similar level of life expectancy, albeit at different points in time,
were quantified by carrying out age-specific decomposition. Decompositions
were carried out for males at 11 shared levels of life expectancy.
Decompositions for females were carried out 10 shared level of life expectancy.
The shared levels of life expectancy and the lifespan variation gap that was
decomposed by age are detailed in table 17 for males and table 18 for females.

Chapter 6: Increasing inequality at shared levels of life expectancy
246
Table 17 Decompositions carried out at shared levels of life expectancy, Males
Decomposition
number Shared life expectancy (approx.)
Year achieved
(England: Scotland)
Lifespan variation gap*
1 66 1950:1961 -0.34
2 67 1953:1971 -0.36
3 68 1959:1976 -0.17
4 69 1971:1981 -0.22
5 70 1977:1985 -0.06
6 71 1981:1990 0.05
7 72 1986:1995 0.29
8 73 1990:2000 0.46
9 74 1994:2004 0.57
10 75 1999:2008 0.74
11 76 2002:2010 0.66 *negative lifespan variation gap(-) is to Scotland‘s lifespan variation advantage i.e. lower lifespan variation at shared level of life expectancy
Table 18 Decompositions carried out at shared levels of life expectancy, Females
Decomposition
number Shared life expectancy (approx.)
Year achieved
(England: Scotland)
Lifespan variation
gap*
1 71 1950:1956 -0.69
2 72 1952:1962 -0.28
3 73 1955:1967 0.19
4 74 1961:1974 0.44
5 75 1968:1980 0.28
6 76 1976:1985 0.17
7 77 1982:1992 0.27
8 78 1987:1997 0.26
9 79 1993:2004 0.34
10 80 1999:2008 0.52 *negative lifespan variation gap(-) is to Scotland‘s lifespan variation advantage i.e. lower lifespan variation at shared level of life expectancy

Chapter 6: Increasing inequality at shared levels of life expectancy
247
The following section describes how to interpret the decomposition graphs
within the context of this chapter. The decomposition results are illustrated in
figure 43 and figure 44 for males. The decomposition results are reported in
figure 45 and figure 46 for females.
6.4.3.1 Description of decomposition graphs
There are two graphs for each decomposition. The first graph in column (a)
shows the contribution of age differences in mortality rates to life expectancy
(grey spikes). This is to demonstrate that age specific mortality can differ
between countries even when life expectancy is comparable (Auger et al.,
2014). If there were no differences in the age specific mortality rates, at the
same level of life expectancy, there would be no spikes as there would be zero
difference at every age. Chapter 4 established that there will be differences in
the age specific mortality rates because there were differences in lifespan
variation between Scotland and England and Wales.
The second graph in column (b) is the main focus of the analysis: it shows the
age contribution from differences in age-specific mortality rates to the lifespan
variation gap between Scotland and England and Wales when a shared level of
life expectancy was achieved (black spikes).
Comparing across column (a) and column (b) establishes if the differences in the
age specific mortality rates were to Scotland‘s life expectancy advantage (above
the red line in column a) or life expectancy disadvantage (below the red line in
column a) while simultaneously being to Scotland‘s lifespan variation advantage
(above the red line in column b) or to Scotland‘s lifespan variation disadvantage
(below the red line in column b).

Chapter 6: Increasing inequality at shared levels of life expectancy
248
The title of each graph states the years that are being compared and the level of
life expectancy or lifespan variation difference that the decomposition results
refer to (previously detailed in table 17 and table 18). The earlier year always
refers to when England and Wales achieved this life expectancy and the later
year always refers to when Scotland achieved this life expectancy. The
contributions from the first year of life (age zero) are truncated in the graph.
This was because the contributions dominated the scale when carrying out the
earliest decompositions (years when infant mortality was still relatively high).
The full contributions from the first year of life are provided in appendix 7 for
males and appendix 8 for females.

249
Figure 43 Age decomposition results at shared level of life expectancy, Males

250
Figure 44 Age decomposition results at shared level of life expectancy, Males

251
Figure 45 Age decomposition results at shared level of life expectancy, Females

252
Figure 46 Age decomposition results at shared level of life expectancy, Females

Chapter 6: Increasing inequality at shared levels of life expectancy
253
6.4.3.2 Decomposition at shared levels of life expectancy
There are some distinct differences in the age distributions of death between
the two countries revealing inequalities in age at death despite shared levels of
life expectancy. Scotland reached the same level of life expectancy as England
and Wales with lower mortality rates across some ages and higher mortality
rates across others. These inequalities in the age patterns can broadly be
described in terms of infant/early life mortality (age 0-15years old), premature
adult mortality (16-64years old) and older age mortality (65+years old).
Scotland has always reached the same level of life expectancy later with lower
or similar mortality rates across infant/early life ages (0-15 years old). The
advantage this gave Scotland‘s life expectancy and lifespan variation is
particularly evident for males at a shared life expectancy of 66 years old.
Scotland achieved this in 1961 with a lifespan variation of 13.06 years. England
and Wales achieved this in 1950 but with a lifespan variation of 13.40 years.
Lower mortality rates across infant/early life ages therefore simultaneously
improved average population health and reduced inequality because they
compressed the age distribution. The same pattern is found for females.
Over time the gains made from lower infant/early life mortality rates in
Scotland diminish. The much lower mortality rate during the first year of life in
Scotland in 1971 compared to mortality during the first year of life in England
and Wales in 1953 contributed 0.57 years of life expectancy advantage to
Scotland (though this advantage is balanced out by life expectancy
disadvantages at other ages) and -0.46 years of lifespan variation advantage.
The slightly lower mortality rate during the first year of life in Scotland in 2000,

Chapter 6: Increasing inequality at shared levels of life expectancy
254
compared to England and Wales in 1994, contributed 0.09 years of life
expectancy advantage to Scotland (though this advantage is balanced out by life
expectancy disadvantages at other ages) and -0.08 years of lifespan variation
advantage. This shows that mortality during the first year of life became more
comparable over time between Scotland and England and Wales at a shared level
of life expectancy and that Scotland‘s higher lifespan variation was not primarily
due to higher mortality during the first year of life.
Scotland had lower old age mortality rates (≥65) at some levels of shared life
expectancy. For example when comparing Scotland in 2008 with England and
Wales in 1999. Lower mortality rates at older ages in Scotland do not
simultaneously increase life expectancy and decrease lifespan variation. This is
because they contribute to mortality expansion. The contributions from lower
old age mortality are to Scotland‘s life expectancy advantage (column (a) grey
spikes above the red line) but to its lifespan variation disadvantage (column (b)
black spikes below the red line).
This contributed to Scotland achieving a similar life expectancy later but more
unequally than England and Wales. For example in 2008 Scotland achieved a life
expectancy of 75 years old with a lifespan variation of 11.55 years. England and
Wales achieved this level of life expectancy in 1999 but with a lifespan variation
of 10.81 years.
However, the main contribution to Scotland‘s greater lifespan variation at the
same level of life expectancy was higher mortality rates across ages that are
considered to be premature adult deaths (16-64years old).

Chapter 6: Increasing inequality at shared levels of life expectancy
255
Higher mortality rates for males age 16-64 years in Scotland, when it achieved
the same level of life expectancy as England and Wales but later, have always
been detrimental to its life expectancy and lifespan variation (contributions
always below the red line). This age pattern becomes more predominant over
time. It is perhaps most evident when the lifespan variation gap was greatest
(0.74 years) at a shared life expectancy of 75 years old: in Scotland this was
achieved in 2008 but had already been achieved by England and Wales in 1999.
A similar pattern was evident for females but to a much lesser extent. Higher
mortality rates for females age 16-64 years in Scotland, when it achieved the
same level of life expectancy as England and Wales but later, have mostly been
below the red line but some ages have fluctuated across the red line. The spikes
below the red line are shorter for females than the spikes for males indicating
that there is a less of mortality difference.
6.5 Discussion
6.5.1 Summary of results
Scotland has achieved the same level of life expectancy as England and Wales
around ten years later. Initially it did this with lower lifespan variation. It lost
this advantage following the 1980s. Although higher lifespan variation was partly
driven by expansion caused by falling mortality at older ages, higher working age
mortality in Scotland explained much of the higher lifespan variation. This
demonstrates that Scotland has failed to reach a high level of average health
with relatively lower inequality because unfavourable working adult mortality
rates have failed to offset lower old age mortality rates.

Chapter 6: Increasing inequality at shared levels of life expectancy
256
6.5.2 Strengths and limitations
The analysis in this chapter used the most robust, up-to-date data at the time of
research available from the Human Mortality Database (Philipov, 2015, Jasilionis,
2015). The annual mortality rates available from the HMD were used to calculate
a three year rolling average to account for any inherent random fluctuations in
the annual mortality rates.
The significant time period covered in this chapter is a further strength. The
time periods when lifespan variation was lower at shared levels of life
expectancy and when lifespan variation changed to be higher at shared levels of
life expectancy were all captured.
The comparator country, England and Wales, was chosen because it shares social
and economic contexts as well as a national Government with Scotland and is its
closest geographical neighbour. These countries also have had a longstanding,
formal commitment to reducing mortality inequalities (The Scottish
Government, 2008, Department of Health, 1999, Department of Health, 2013).
The different mortality experience of these countries has been the focus of
much research (Campbell et al., 2013, Carstairs and Morris, 1989b). The findings
in this chapter provided further evidence demonstrating the timing of mortality
change in Scotland, notably since the 1980s (Campbell et al., 2013, Norman et
al., 2011, Leyland et al., 2007b). It is important that there is consensus across
studies around the timing of change if we are to begin to evaluate the reasons
for change.

Chapter 6: Increasing inequality at shared levels of life expectancy
257
6.5.3 Comparisons with existing studies
This is not the first piece of research to identify a country which experiences
higher relative inequality in terms of lifespan variation or evaluate the
important age characteristics of mortality decline. The USA is perhaps one of the
most widely studied countries (Smits and Monden, 2009, Shkolnikov et al., 2011).
Comparative studies are important if we are to understand different levels of
inequality (lifespan variation) relative to neighbouring countries at the same
level of average population health (life expectancy). The changing level of
lifespan variation experienced in Scotland when it achieved the same level of
life expectancy as England and Wales, but later, makes it a valuable case study.
Case study countries such as Scotland and the USA can help us to understand
why age patterns of mortality have not been declining uniformly across
comparable countries.
Higher lifespan variation in Scotland, when arriving at a particular life
expectancy later than England and Wales, was partly explained by lower old age
mortality rates. This caused mortality expansion which adds uncertainty by
delaying the age at death. These lower old age mortality rates suggest that
Scotland may have experienced a temporal advantage across these ages but this
temporal advantage did not translate into lower mortality rates across all ages.
So when achieving the same life expectancy Scotland seems to have benefitted
temporally in terms of old age mortality and younger age mortality but not
premature adult mortality. The USA demonstrated a similar lack of mortality
compression due to higher adult premature mortality over time. In Scotland the
lack of mortality compression was coupled with higher levels of expansion
associated with lower old age mortality rates compared to England and Wales

Chapter 6: Increasing inequality at shared levels of life expectancy
258
when both countries had roughly the same life expectancy (Shkolnikov et al.,
2011). Unlike Scotland, the USA also had relatively worse young age mortality
rates further adding to its higher level of lifespan variation (Shkolnikov et al.,
2011). Like Scotland, the USA has become relatively more unequal than other
countries in recent decades and when achieving the same life expectancy (Smits
and Monden, 2009). So while not exactly the same, the USA and Scotland have
similar problems with high premature mortality that may suggest underlying root
causes.
Comparative research strongly suggests that the root causes of premature
mortality in the USA relate to its poor performance in tackling the social
determinants of health and high income inequality (Woolf and Aron, 2013). A
recent extensive review of mortality in Scotland also suggests that the lasting
effects of deindustrialisation, deprivation and higher inequality have resulted in
it experiencing an excess of 5,000 deaths per year compared to England and
Wales (Walsh et al., 2016). Social determinants of health and mortality may be
amenable to social and economic policies and the magnitude of inequality in
society alleviated (Bambra, 2011b, Coburn, 2000, McCartney et al., 2013).
Krieger et al. (1997) argue that society‘s commitment to minimising social and
economic risk and ensuring health for all is a mediating pathway between risk
factors (e.g. poverty, deindustrialisation and high income inequality) and
eventual outcome (e.g. premature death). This is supported by the finding that
societies with more egalitarian welfare systems, for redistributing income and
thus reducing inequality, experience lower mortality rates and narrower
mortality inequalities between socioeconomic groups (Vagerö and Lundberg,

Chapter 6: Increasing inequality at shared levels of life expectancy
259
1989, Popham et al., 2013). Therefore it is hypothesised that the degree of
relative inequality in economically developed societies is an important
determinant of mortality that is amenable to social, political and economic
interventions (Wilkinson, 1997, Wilkinson, 2005)
Considering this, the mechanisms linking deprivation and premature adult age
deaths in Scotland may be associated with its inability to reduce income
inequality and lower the economic and health risks associated with poverty.
Understanding how social and economic policies can reduce inequality and
minimise the risk of premature death has implications for countries across
Western Europe but is particularly important for Scotland as it contains some of
the poorest communities experiencing some of the highest premature mortality
rates in the UK (The poverty Site, 2016, McCartney et al., 2012b).
6.5.4 Research implications
The analysis of population level lifespan variation in Scotland has demonstrated
that premature mortality is part of the explanation for its divergence. However
it is not clear how lifespan variation inequalities are patterned by socioeconomic
deprivation within Scotland.
It is valid to hypothesis that lifespan variation will be highest for the most
deprived group: they are known to experience the highest risk of premature
death. International studies have also demonstrated that most deprived
experience a double burden of mortality inequality: the shortest expected
length of life and the greatest amount of inequality in individual age at death
(van Raalte et al., 2011). However reducing mortality rates at older ages can
also lead to high lifespan variation. This is because reducing premature deaths

Chapter 6: Increasing inequality at shared levels of life expectancy
260
causes mortality compression, i.e. a narrowing of the variation in age at death,
whilst reducing older age deaths causes mortality expansion, i.e. a widening of
the variation in age at death. While both processes improve life expectancy
reductions in lifespan variation can only be achieved through more mortality
compression than expansion (Popham et al., 2013, Shkolnikov et al., 2011). In
some Western European countries narrower inequalities in lifespan variation
between socioeconomic groups were due to decreasing mortality rates amongst
older ages in the least deprived group (van Raalte et al., 2011). The scale of
lifespan variation inequalities between socioeconomic groups has not previously
been measured for Scotland neither have changes to the scale of the
socioeconomic gradient over time been quantified.
6.6 Conclusions
The results in this chapter add to the body of evidence seeking to describe
lifespan variation inequalities between countries despite experiencing shared
levels of average population health. This approach may better account for
differences between populations in terms of epidemiological time. Some have
argued this concept of time is more important to control for than calendar time:
the magnitude of health inequalities between countries might be the result of
them being at different stages of the epidemiological transition (Mackenbach et
al., 1997, Smits and Monden, 2009) e.g. the smoking epidemic (Mackenbach et
al., 2008) or cardiovascular revolution (Vallin and Meslé, 2004).
This chapter set out to identify which of three proposed hypotheses might best
describe the lifespan variation gap between Scotland and England and Wales.
The forerunner hypothesis proposed that a country leading the way in terms of

Chapter 6: Increasing inequality at shared levels of life expectancy
261
life expectancy would also lead the way in terms of lifespan variation: a country
arriving at the same life expectancy later in time would do so with a very similar
level of inequality as the forerunner. The diffusion hypothesis suggested that the
country arriving at the same life expectancy later in time would be better
positioned to reduce mortality rates across all ages, especially premature
deaths, and would experience much lower inequality at a similar level of life
expectancy. The laggard hypothesis suggested that a country arriving at a
certain level of life expectancy later in time may do so with higher inequality
because they have not fully benefited from their temporal advantage: they may
have benefited from medical advancements for reducing deaths at ages that
expand the age distribution of death but have failed to address the social
determinants of health that are important for reducing deaths at ages which
compress the distribution of death.
The current lifespan variation gap between Scotland and England and Wales
would support a laggard hypothesis but previously would have supported a
diffusion hypothesis. Scotland always seems to have benefited from its temporal
advantage in terms of infant/childhood deaths and older age deaths: it always
had lower mortality rates at these ages when arriving at the same level of life
expectancy as England and Wales, albeit later on. However the lifespan variation
gains available from reducing infant and childhood deaths diminish as deaths at
these ages, thankfully, become rarer. Therefore it becomes increasingly
important for mortality rates across working adult ages to be lower for the
country arriving at the same life expectancy later in time. Scotland failed to
achieve this, relative to England and Wales. The failure to tackle premature
mortality has caused Scotland to experience higher lifespan variation at the

Chapter 6: Increasing inequality at shared levels of life expectancy
262
same level of life expectancy as its closest geographical neighbour, despite
arriving at the same level of life expectancy ten years later. Without tackling
premature working age mortality Scotland will not be able to simultaneously
achieve a high level of population health with a low level of inequality.

263
7 Changes to the socioeconomic gradient for lifespan
variation
7.1 Introduction
The previous three chapters have focused on measuring lifespan variation at the
population level for Scotland within a cross national comparative context.
Chapter 4 identified that Scotland has been unable to reduce lifespan variation
at the same rate as other countries within Western Europe causing its relative
ranking to worsen over time. This was particularly evident for males in Scotland
who have experienced increasing lifespan variation since the 1980s.
This diverging lifespan variation trend is in contrast to Scotland‘s nearest
neighbour England and Wales. Chapter 5 identified that the age patterns of
mortality driving the increasing lifespan variation trend within Scotland were
distinguishable from the age patterns within England and Wales. In particular
were the higher premature mortality rates in recent years in Scotland: these
prevented mortality compression. This meant Scotland was unable to offset the
detrimental contributions, in terms of lifespan variation although not life
expectancy, made from lower mortality rates across older ages. Lower mortality
rates across older ages increase inequality by expanding the age distribution of
death. England and Wales did not experience higher premature mortality rates
later in time and successfully offset detrimental contributions from old age
mortality in order to maintain a decreasing trend over time.

Chapter 7: Changes to the socioeconomic gradient for lifespan variation
264
Chapter 6 analysed the lifespan variation gap independent of life expectancy
and demonstrated that Scotland had a lifespan variation advantage, although it
has tended to achieve the same level of life expectancy around ten years later
than England and Wales. Following the 1980s Scotland lost its lifespan variation
advantage and started to achieve the same level of life expectancy later in time
and with higher inequality.
Although lower mortality rates across older ages contributed to Scotland‘s
lifespan variation disadvantage, of concern are the contributions made from
higher premature mortality rates when achieving a similar level of life
expectancy later in time. This suggests that Scotland has been able to benefit
from its temporal advantage in terms of old age mortality, capitalising on
lessons already learnt, but not in term of premature mortality. This can be
considered counter intuitive as the economic cost of reducing premature adult
mortality – deaths associated with external causes and the social determinants
of health – tend to be relatively lower than the economic costs of reducing old
age mortality – deaths from chronic diseases.
It is hypothesised that socioeconomic deprivation in Scotland explains much of
its premature mortality problem: premature deaths are more strongly associated
with socioeconomic deprivation. Traditionally life expectancy or age
standardised mortality have been used to measure the impact socioeconomic
deprivation has on mortality. It is now well established that the most
socioeconomically deprived groups experience the worst average mortality
outcomes: they have the shortest average life expectancy and the highest age-
standardised mortality rates. International studies measuring lifespan variation

Chapter 7: Changes to the socioeconomic gradient for lifespan variation
265
have started to demonstrate that there is a further dimension of socioeconomic
inequalities to consider: the most deprived socioeconomic groups also
experience the greatest amount of inequality in age at death.
These international studies have: quantified the lifespan variation gap between
the most and least deprived over time, examined how lifespan variation has
changed over time for each deprivation group, and measured the lifespan
variation gap between socioeconomic deprivation groups when a similar level of
life expectancy has been achieved irrespective of chronological time. None of
these analyses have been carried out for Scotland despite it being the country in
Western Europe with the poorest level of average life expectancy and widening
mortality inequalities between socioeconomic groups (McCartney et al., 2012b,
Leyland et al., 2007b).
The findings in this chapter begin analysing lifespan variation stratified by
socioeconomic deprivation within Scotland. It is the first analysis chapter in this
thesis to utilise the population estimates obtained from National Records of
Scotland, death count data and the Carstairs score data surrounding the four
Census years: 1981, 1991, 2001 and 2011. It extends the analysis and
interpretation of lifespan variation by producing 95% confidence intervals and
calculating the slope index of inequality and relative index of inequality.
7.1.1 Chapter outline and research questions
The structure of this chapter is consistent with the previous analysis chapters
and has four main sections. The first section summarises studies which have
examined increasing socioeconomic inequalities in mortality outcomes in
Scotland. It also highlights some international studies which have previously

Chapter 7: Changes to the socioeconomic gradient for lifespan variation
266
examined socioeconomic inequalities in lifespan variation which have not
previously been studied in Scotland. It is also unclear how the changing nature of
the socioeconomic gradient for lifespan variation in Scotland is related to its
lifespan variation ranking with Western Europe. Therefore the following chapter
answers the following research questions:
7. Is there a socioeconomic gradient for lifespan variation in Scotland?
8. How has the socioeconomic gradient for lifespan variation in Scotland
changed over time?
9. Are changes to the socioeconomic gradient for lifespan variation in
Scotland related to Scotland‘s deteriorating lifespan variation ranking
within Western Europe over time?
The second section briefly describes the data used and the analysis methods
applied to answer these research questions. The third section details the results.
The final section outlines how the results were used to inform the final analysis
chapter.
7.2 Background
Systematic inequalities in mortality between the most and least deprived
groups, whether measured by education, income or occupation, are found across
all economically developed countries (Mackenbach et al., 2008, Health, 2008).
These inequalities in death ultimately stem from inequalities in the social
determinants of health (Mackenbach and Kunst, 1997, Walsh et al., 2016). The
persistence of mortality inequalities over time, despite the introduction of

Chapter 7: Changes to the socioeconomic gradient for lifespan variation
267
comprehensive welfare programmes, is considered to be ―one of the greatest
disappointments of public health‖ (Mackenbach, 2012).
Phelan et al. (2010) further argue that mortality inequalities in economically
developed countries are a public health puzzle because the major causes and
risk factors for premature death which historically accounted for much of the
social patterning (e.g. infectious disease and malnutrition) have largely been
eradicated. This evidence suggests that the nature of mortality inequalities has
changed over time, and that changing risk factors reflect changes in the
underlying causes.
7.2.1 Mortality inequalities in Scotland
Leyland et al. ( 2007b) somewhat echo this reaction in relation to Scotland,
stating that the observed increase in mortality inequalities during the 1980s and
1990s were greatest for younger ages and for ―newer‖ causes of death (Leyland
et al., 2007b).For example increasing death rates for males aged 20-34 years old
during the 1990s were driven by suicide, drugs, alcohol and assaults (Mcloone,
2003).
These increasing mortality rates were also strongly patterned by socioeconomic
deprivation: Leyland et al. (2007a) observed that the all-cause mortality rate for
males age 15-29years old from the least deprived group fell by 25% between
1991 and 2001 but increased by 4% for the most deprived. Consequently the
mortality gradient in Scotland has steepened over time (Leyland et al., 2007a,
Leyland et al., 2007b) despite there being a formal commitment made to
reducing inequalities for the benefit of everyone (The Scottish Government,
2008).

Chapter 7: Changes to the socioeconomic gradient for lifespan variation
268
7.2.2 Socioeconomic gradient in lifespan variation
It has been long established that the most deprived socioeconomic groups are
expected to live for the shortest amount of time and have experienced the
slowest rate of improvement in age-standardised morality rates over time
(Leyland et al., 2007a). One proposed explanation for this is that relative
deprivation may be a stronger determinant of population health in economically
developed countries than absolute levels of material wealth. In the most
unequal countries the health of the most deprived group disproportionately
suffers but the health of the least deprived members is also relatively poor than
their counterparts in more equal countries (Wilkinson, 2005, Wilkinson and
Pickett, 2010, Wilkinson and Pickett, 2006). This implies that exposure to
relative inequality is a population health problem, prompting Wilkinson (1997) to
argue that national trends in mortality are likely to be a reflection of the
psychosocial burden of relative deprivation. This is supported by international
studies showing that the level of relative inequality within countries tends to be
more strongly correlated with mortality than average levels of income or
absolute measures of material wealth (Marmot and Bobak, 2000, Kaplan et al.,
1996, Smith and Egger, 1996, Lynch et al., 2001). Therefore Scotland‘s poorer
population level mortality trend, within the context of Western Europe, may be
associated with relative inequality within the country.
This hypothesis was explored by McCartney et al. (2012b) when they measured
the correlation between life expectancy and the index of economic freedom,
paying particular attention to Scotland‘s trend within the context of Western
Europe. They argued that the index of economic freedom was a valid measure of
neo-liberal economic policies, which are reported to have had a detrimental

Chapter 7: Changes to the socioeconomic gradient for lifespan variation
269
impact in terms of population level health and reducing relative inequality. This
study concluded that the inverse correlation between the Index of economic
freedom and life expectancy demonstrated that a greater change towards
neoliberalism (e.g. a change towards increasing inequality) was related to
smaller gains in life expectancy. Less common are studies seeking to understand
the relationship between relative inequality and lifespan variation.
Higher lifespan variation equates to greater inequality in age at death.
Therefore lifespan variation is considered a measure of inequality in itself,
irrespective of its correlation with any other measures of social or economic
position (Murray et al., 1999, Gakidou and King, 2002, Harper and Lynch, 2006).
Smits and Monden (2009) supported this perspective when they argued that
inequality in lifespan variation is the ultimate expression of inequality.
Consequently, lifespan variation can be seen as a valid indicator of a society‘s
ability to protect the most vulnerable members of society from the social and
economic risks associated with premature death (van Raalte et al., 2011). It is
therefore a particularly relevant measure to apply to Scotland, given that
Scotland‘s observed premature mortality problem is embedded within the
historical context of social and economic policies which may have contributed to
poverty and relative inequality (Walsh et al., 2016, Dorling et al., 2007,
McCartney et al., 2012b).
The few existing studies which have analysed the relationship between lifespan
variation and a measure of socioeconomic position show a strong socioeconomic
gradient: those occupying the lowest socioeconomic position experience the
highest level of lifespan variation. This finding holds when measuring

Chapter 7: Changes to the socioeconomic gradient for lifespan variation
270
socioeconomic position by education across ten European countries (van Raalte
et al., 2011) and by occupational social groups in Finland (van Raalte et al.,
2014). Alongside a traditional socioeconomic gradient for lifespan variation van
Raalte et al. (2014) identified that manual occupational groups experienced
higher lifespan variation than non-manual occupation groups at the same level of
remaining life expectancy. This difference at the same level of remaining life
expectancy increased over time and was driven by increasing differences in
premature mortality between occupational groups: older age mortality was
found to be extremely similar between occupation groups at the same level of
life expectancy.
7.2.3 Research gaps
In summary, differences in lifespan variation between socioeconomic groups and
at similar levels of life expectancy are important to measure as they may reflect
inequalities in exposures to the social determinants of mortality between
population sub-groups (Smits and Monden, 2009). Despite this, socioeconomic
inequalities in lifespan variation over time or at shared levels of life expectancy
have not previously been assessed for Scotland, nor have changes to the
magnitude of the socioeconomic gradient for lifespan variation been formally
quantified. It is also unclear if any changes to the socioeconomic gradient for
lifespan variation correspond to Scotland‘s deteriorating ranking within Western
Europe. It is these research gaps that this chapter will fill.
This chapter calculates lifespan variation for quintiles of socioeconomic
deprivation, as measured by the Carstairs score, for 1981, 1991, 2001 and 2011.
It then quantifies the magnitude of the socioeconomic gradient for lifespan

Chapter 7: Changes to the socioeconomic gradient for lifespan variation
271
variation by estimating the slope index of inequality and relative index of
inequality at each time point. The lifespan variation estimates, stratified by
socioeconomic deprivation, are then compared with the lifespan variation
estimates for Scotland and 16 other Western European countries (not stratified
by socioeconomic deprivation) which were reported in chapter 4.
7.3 Data & methods
Data used in this chapter were Census population estimates and death counts by
single-year of age matched with the Carstairs score of area level socioeconomic
deprivation.
7.3.1 Population estimates and mortality data
Census population estimates were derived from the four most recent census
years for which the Carstairs score was available: 1981, 1991, 2001, and 2011.
These were multiplied by three to increase the size of the denominator
population and to match with the number of years of death data. 1991 could
only be multiplied by two as the geographical unit, which the population
estimates are derived from, was subject to boundary changes in 1990 meaning
there would have been inconsistencies.
Death counts used were from the years surrounding the four most recent census
years: 1980-82, 1991-92, 2000-02 and 2010-2012. Using three years‘ worth of
death data (two years in the case of 1991-92) increased the number of events by
single year of age in order to smooth the age distribution of death which is
vulnerable to random fluctuations (Lumme et al., 2015). Using three years‘
worth of population and death data is an established approach within empirical
studies of mortality (Leyland et al., 2007b, Brown and Leyland, 2010).

Chapter 7: Changes to the socioeconomic gradient for lifespan variation
272
Population estimates and death data were matched with the Carstairs score
using postcode sector information. Postcode sectors were then aggregated into
quintiles of deprivation each representing 20% of the Scottish population.
7.3.2 Predicting mortality rates
There Census population estimates were available up to an open ended age
category of 85+ but a mortality rate by single year of age up to 110+ was
required. Therefore a Poisson model, with a fractional polynomial function for
age was used to estimate mortality rates beyond age 85+. The modelling process
applied is outlined in chapter 3.
7.3.3 Lifetable probabilities
The mortality rates calculated from the population estimates and death counts,
stratified by socioeconomic deprivation, were then converted into lifetables. A
total of 40 deprivation specific lifetables were produced: one for each quintile
of deprivation representing the mortality experience in 1981, 1991, 2001 and
2011 for males and females separately. A full description of how lifetable
probabilities were produced is outlined in the data and methods chapter.
From these lifetable probabilities lifespan variation was calculated using e†. This
is the same measure of lifespan variation that has been used throughout this
thesis. The formula used to calculate e† and a critical evaluation of this measure
are available in the data and methods chapter.
7.3.4 Slope index and relative index of inequality
In order to evaluate the scale of the deprivation gradient for lifespan variation
the Slope Index of Inequality (SII) and the Relative Index of Inequality (RII) were
calculated. A detailed discussion of the steps carried out to calculate the SII and

Chapter 7: Changes to the socioeconomic gradient for lifespan variation
273
RII is given in chapter 3. In summary the SII communicates the absolute level of
inequality in a health variable: in the case of this thesis, lifespan variation for
social groups. The RII communicates the inequality in relative terms. These
approaches allow trends to be assessed by taking into account the whole
population and not just the extremes of deprivation (Munoz-Arroyo and Sutton,
2007, Schneider et al., 2005).
7.3.5 Monte Carlo simulations
95% confidence intervals were produced for the lifespan variation estimates and
the slope and relative indices of inequality by carrying out 1,000 Monte-Carlo
simulations. This produced 1,000 simulated mortality rates for each age (0-
110+), sex, Census year and quintile of socioeconomic deprivation.
Calculating 95% confidence intervals allowed the estimate of lifespan variation,
stratified by socioeconomic deprivation, to be statistically assessed and the
statistical significance of any differences between quintiles of deprivation to be
established.
In relation to the SII and RII, if the limits of the 95% confidence intervals cross
zero then there is uncertainty as to whether there is a true health difference
(Allik et al., 2016).
The steps required to carry out the Monte-Carlo simulation method are discussed
in chapter 3. In summary it is important to calculate 95% confidence intervals as
the mortality data used to calculate lifespan variation is inherently vulnerable to
random fluctuations as a result the number of deaths that occur in a population
can be interpreted as one possible series that could have occurred under the
given set of circumstances (Curtin and Klein, 1995). It is also important as

Chapter 7: Changes to the socioeconomic gradient for lifespan variation
274
‗uncertainty in an indicator is an essential question when making comparisons of
equality‘ (Lumme et al., 2015).
7.4 Results
Table 19 details the lifespan variation estimates for males, with 95% confidence
intervals, for each deprivation quintile in Scotland in 1981, 1991, 2001 and 2011.
Table 20 details the same for females. These results answer the first research
question. It shows there is a strong deprivation gradient for lifespan variation
evident for both males and females. This can be visualised in figure 46 (males)
and figure 47(females).

275
Table 19 Lifespan variation estimates (with 95% CI) by socioeconomic deprivation, Males
Years
1981
(95% CI)
1991
(95% CI)
2001
(95% CI)
2011
(95% CI)
Least dep.
Quintile 1 11.18(11.04-11.33) 10.76(10.59-10.93) 10.40(10.26-10.54) 10.44(10.31-10.58)
Quintile 2 11.63(11.49-11.77) 11.10(10.93-11.26) 11.11(10.98-11.25) 10.94(10.80-11.09)
Quintile 3 11.73(11.59-11.87) 11.35(11.19-11.52) 11.36(11.21-11.52) 11.21(11.08-11.33)
Quintile 4 11.83(11.70-11.95) 11.82(11.65-11.99) 11.82(11.69-11.95) 11.57(11.44-11.70)
Quintile 5 12.19(12.06-12.32) 12.28(12.12-12.43) 12.92(12.79-13.05) 12.25(12.14-12.39)
Most dep.
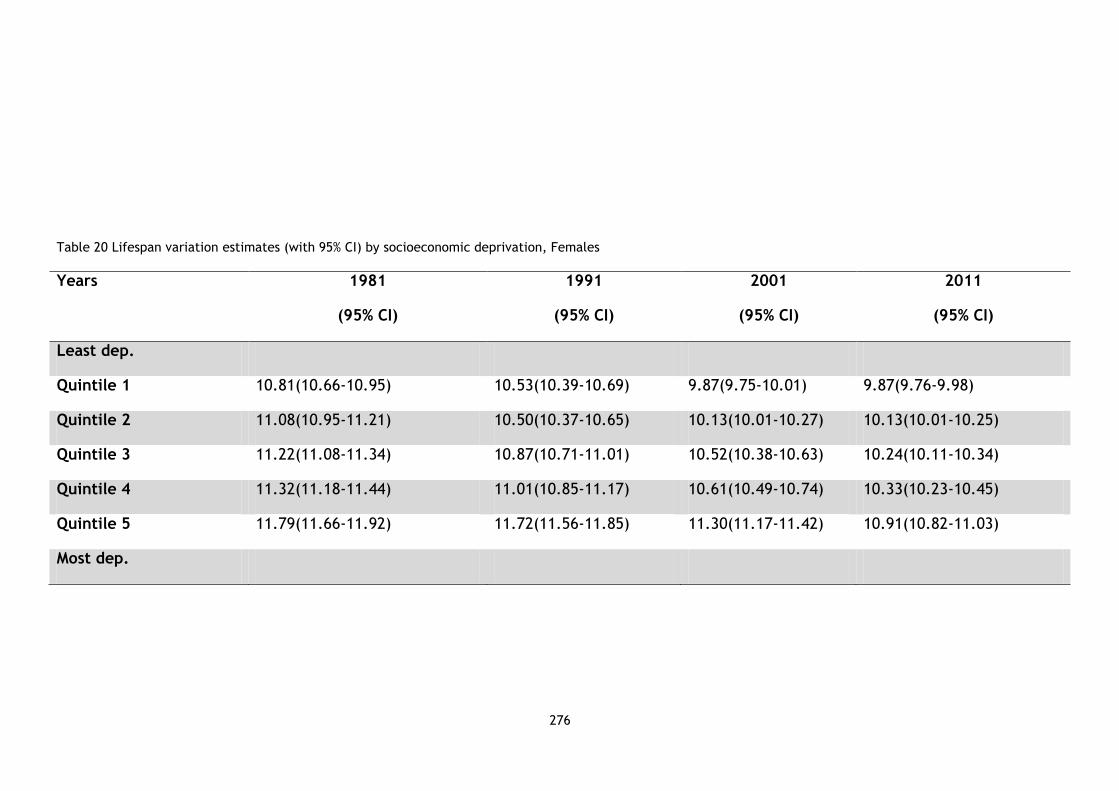
276
Table 20 Lifespan variation estimates (with 95% CI) by socioeconomic deprivation, Females
Years
1981
(95% CI)
1991
(95% CI)
2001
(95% CI)
2011
(95% CI)
Least dep.
Quintile 1 10.81(10.66-10.95) 10.53(10.39-10.69) 9.87(9.75-10.01) 9.87(9.76-9.98)
Quintile 2 11.08(10.95-11.21) 10.50(10.37-10.65) 10.13(10.01-10.27) 10.13(10.01-10.25)
Quintile 3 11.22(11.08-11.34) 10.87(10.71-11.01) 10.52(10.38-10.63) 10.24(10.11-10.34)
Quintile 4 11.32(11.18-11.44) 11.01(10.85-11.17) 10.61(10.49-10.74) 10.33(10.23-10.45)
Quintile 5 11.79(11.66-11.92) 11.72(11.56-11.85) 11.30(11.17-11.42) 10.91(10.82-11.03)
Most dep.

Chapter 7: Changes to the socioeconomic gradient for lifespan variation
277
7.4.1 Deprivation gradient
At each year the least deprived quintile experience the lowest level of lifespan
variation and the most deprived quintile experience the highest. This means that
the least deprived quintile experience the least amount of inequality in age at
death while the most deprived quintile experience the most amount of
inequality in age at death.
The analyses in chapters 4, 5 and 6 were concerned with the increasing lifespan
variation trend at the population level for males in Scotland. The lifespan
variation trend diverged for males during the 1980s. This change in trend was
found to be statistically significant. The analysis in this chapter finds that the
only group to experience a statistically significant increase in lifespan variation
between 1991 and 2001 was quintile 5, the most deprived 20% of the Scottish
population.
Over time the deprivation gradient for lifespan variation has steepened,
particularly for males. This can be visualised for males in figure 47 and for
females in figure 48. There is some improvement in the socioeconomic gradient
in 2011 but it is still steeper than the socioeconomic gradient in 1981.

278
Figure 47 Socioeconomic gradient for lifespan variation, Males

279
Figure 48 Socioeconomic gradient for lifespan variation, Females

Chapter 7: Changes to the socioeconomic gradient for lifespan variation
280
7.4.2 Change in lifespan variation achieved over time
The steepening of the gradient over time for males is driven by the fact that the
improvements in lifespan variation were unequally distributed across
socioeconomic groups. The unequal change in lifespan variation experienced
over time for each quintile can be visualised in figure 49 for males and figure 50
for females.

281
Figure 49 change in lifespan variation over time by deprivation quintile, Males

282
Figure 50 change in lifespan variation over time by deprivation quintile, Females

Chapter 7: Changes to the socioeconomic gradient for lifespan variation
283
Between 1981 and 2011 males from the most deprived quintile experienced
increases in lifespan variation but the least deprived experienced decreases. For
females, the most deprived quintile experienced decreases in lifespan variation
that were similar to the decreases achieved by the least deprived quintile but
within the context of higher absolute levels of lifespan variation.
It is interesting to note that between 2001 and 2011 the most deprived
experienced the greatest decrease and the least deprived experience an
increase for males and no change for females. However this is still within the
context of higher absolute levels of lifespan variation for the most deprived and
lower absolute levels of lifespan variation for the least deprived. Therefore this
did not negate the fact that between 1981 and 2011 males from the most
deprived quintile still experienced an overall increase in lifespan variation while
males from the least deprived experienced an overall decrease. For females the
total change between 1981 and 2011 is not as strongly patterned by
socioeconomic deprivation.
7.4.3 Slope index and relative index of inequality
The magnitude of the socioeconomic gradient for lifespan variation was
quantified by calculating the slope index of inequality and the relative index of
inequality. The results are reported in table 21 and answer the second research
question: the magnitude of the socioeconomic gradient for lifespan variation did
change over time. At first it steepened but there has been some improvement
between 2001 and 2011.

Chapter 7: Changes to the socioeconomic gradient for lifespan variation
284
Table 21 The socioeconomic gradient for lifespan variation (e†)
Males Females
SII (95% CI) RII (95% CI) SII (95% CI) RII (95% CI)
1981
1.10 (0.86 to 1.36)
0.09 (0.07 to 0.12)
1.10 (0.86 to 1.33)
0.10 (0.08 to 0.12)
1991
1.88 (1.60 to 2.18)
0.16 (0.14 to 0.19)
1.45 (1.19 to 1.68)
0.13 (0.11 to 0.15)
2001
2.87 (2.64 to 3.11)
0.25 (0.23 to 0.27)
1.66 (1.41 to 1.88)
0.16 (0.13 to 0.18)
2011
2.13 (1.90 to 2.36)
0.19 (0.17 to 0.21)
1.15 (0.96 to 1.35)
0.11 (0.09 to 0.13)
For males the SII in 1981 is interpreted as 1.10 years difference in lifespan
variation between the most and least deprived quintiles within Scotland. By 2011
this difference had increased to 2.13 years. The RII shows that lifespan variation
was 9% higher for males in the most deprived quintile in 1981 compared to the
least deprived quintile. By 2011 this difference had increased to 19%. The
absolute difference was greatest in 2001 at 2.87 years which is the equivalent of
a 25% difference in lifespan variation between the most and least deprived
quintiles.
The results for females are similar but the socioeconomic gradient is not as
steep and the changes over time are smaller. For females the SII in 1981 is
interpreted as 1.10 years differences in lifespan variation between the most and
least deprived quintiles within Scotland. By 2011 this difference had increased to
1.15 years. The RII shows that lifespan variation was 10% higher for females in
the most deprived quintile in 1981 compared to the least deprived quintile. By

Chapter 7: Changes to the socioeconomic gradient for lifespan variation
285
2011 this difference had increased to 11%. The absolute difference was greatest
in 2001 at 1.66 years which is the equivalent of a 16% difference in lifespan
variation between females in the most deprived quintile compared to females in
the least deprived quintiles.
7.4.4 Scotland’s deteriorating ranking within Western Europe
Much attention has been paid to Scotland‘s faltering mortality improvements
relative to the rest of Western Europe (McCartney et al., 2012b, Leyland et al.,
2007a). This prompted the analysis in Chapter 4 of this thesis, which focused on
Scotland‘s faltering lifespan variation trend over time and identified that it
currently had the highest level of lifespan variation within Western Europe.
Figure 51 (males) and figure 52 (females) looks at these differences again
compared with the lifespan variation differences stratified by socioeconomic
deprivation within Scotland. This answers the fourth research question put
forward at the beginning of this chapter: whether changes to the magnitude of
the socioeconomic gradient for lifespan variation in Scotland are related to its
deteriorating ranking within Western Europe.
Figure 51 and figure 52 situate Scotland (red dot) within the group of Western
European countries that were analysed in chapter 4 and for deprivation quintiles
for Scotland (blue dots). No statistical inference can be derived from the
descriptive analysis comparing Scotland‘s deteriorating ranking with the lifespan
variation estimates stratified by socioeconomic deprivation.

Chapter 7: Changes to the socioeconomic gradient for lifespan variation
286
Figure 51 Comparison of lifespan variation estimates for Western Europe countries and
lifespan variation estimates by socioeconomic deprivation, Males

Chapter 7: Changes to the socioeconomic gradient for lifespan variation
287
For males and females in Scotland lifespan variation in 2011 was highest in
Western Europe, with lifespan variation for males in France being very close.
The blue dots, on the right hand of each panel, provide some explanation for
why Scotland‘s lifespan variation ranking in Western Europe has deteriorated
over time by showing the 5 quintiles of deprivation.
For males in 1981 only the most deprived quintile had lifespan variation higher
than Scotland overall: the remainder had a lifespan variation that was close to
or lower than Scotland overall. The quintiles of deprivation with lower lifespan
variation were comparable to some other Western European countries. Countries
with lower lifespan variation than Scotland fell in the lifespan variation range of
11.28 years to 11.80 years: three of quintiles of deprivation also fall within this
Figure 52 Comparison of lifespan variation estimates for Western Europe countries and
lifespan variation estimates by socioeconomic deprivation, Females

Chapter 7: Changes to the socioeconomic gradient for lifespan variation
288
range while the least deprived quintile had a lifespan variation of 11.18 years
which was lower than Sweden the top ranking country.
This pattern changes over time: for males in 2011 the two most deprived
quintiles had lifespan variation higher than Scotland overall and the other three
had lower lifespan variation. The quintiles of deprivation with lower lifespan
variation were comparable to other Western European countries. Countries with
lower lifespan variation than Scotland fell in the lifespan variation range of 9.64
years to 11.23 years: the least deprived quintile had a lifespan variation of 10.44
years but this was still higher than West Germany, Spain, Ireland, Norway, Italy,
Switzerland, The Netherlands and Sweden. The most affluent 20% of the Scottish
population experience a higher level of lifespan variation than the average level
of lifespan variation experienced in these whole countries.
The findings are even more worrying for the quintiles which have higher lifespan
variation than that of Scotland and therefore all other countries within Western
Europe. Males from the most deprived quintile experiences 0.98 years more
inequality in age at death than the average for males in Scotland. This is in
contrast to males from the least deprived quintile which experienced 0.83 years
less inequality in age at death than the average for males in Scotland.
Although the absolute level of lifespan variation for females in Scotland is lower
than for males their position over time falls further behind the rest of Western
Europe. This is partly due to the greater convergence over time, in terms of
lifespan variation, for females across Western European countries: a
convergence not so evident for males. It is also because of Scotland‘s poorer
levels of lifespan variation.

Chapter 7: Changes to the socioeconomic gradient for lifespan variation
289
For females in 1981 only the most deprived quintile had lifespan variation higher
than Scotland overall: the remainder had a lifespan variation that was close to
or lower than Scotland overall. Countries with lower lifespan variation than
Scotland fell in the lifespan variation range of 9.90 years to 11.03 years: only the
least deprived quintile had a lifespan variation that fell within this range.
This pattern worsened over time: for females in 2011 the three most deprived
quintiles had lifespan variation higher than Scotland overall and the other two
had lower lifespan variation. The quintiles of deprivation with lower lifespan
variation were not comparable any other Western European country. Countries
with lower lifespan variation than Scotland fell in the lifespan variation range of
8.60 years to 9.77 years: the least deprived quintile had a lifespan variation of
9.87 years.
The findings are even more worrying for the quintiles which have higher lifespan
variation than that of Scotland and therefore all other countries within Western
Europe: the most deprived quintile experiences 0.78 years more inequality in
age at death than the average for Scotland. This is in contrast to the least
deprived quintile which experienced 0.27 years less inequality in age at death
than the average for Scotland.
7.5 Discussion
7.5.1 Summary of results
The analysis in this chapter identified that the socioeconomic gradient for
lifespan variation in Scotland has steepened over time. Although there was some
improvement in the gradient between 2001 and2011 the gradient was still
steeper than it had been in 1981. In 1981, 1991, 2001 and 2011 the most

Chapter 7: Changes to the socioeconomic gradient for lifespan variation
290
deprived group experienced the highest absolute level of inequality and the
least deprived experienced the lowest absolute level, this is true for males and
for females. For males the gradient became steeper over time because the least
deprived group experienced an overall decrease in lifespan variation between
1981 and 2011 but the most deprived group experienced an overall increase. For
females, all socioeconomic groups experienced an overall decrease and the
change in socioeconomic gradient was not as dramatic.
Over time a greater proportion of the population is experiencing higher levels of
lifespan variation than the Scottish population average. This is the case for
males and females. In 1981, only the most deprived quintile experienced higher
lifespan variation than the Scottish average. By 2001 the bottom two quintiles
were experiencing higher lifespan variation than the Scottish population
average. It is important to remember that each quintile represents 20% of the
Scottish population: each is a substantial proportion than cannot be written off
as outliers (Leyland et al., 2007a). It was therefore not surprising to find that
the steepening socioeconomic gradient corresponded with Scotland‘s
deteriorating lifespan variation ranking within Western Europe. By 2001 the least
deprived 20% of the Scottish population experienced a level of total inequality
higher than the average level experienced by entire populations of comparable
Western European countries.
7.5.2 Strengths and limitations
The population data for Scotland used in this chapter were derived from
Scotland‘s Census. This is one of the most reliable sources of population data
and its main purpose is to provide an accurate population count (National

Chapter 7: Changes to the socioeconomic gradient for lifespan variation
291
Records of Scotland, 2013b). A further strength of this chapter is the significant
period of time covered (1981-2011) and the robust measure of socioeconomic
deprivation used.
The Carstairs score has a strong theoretical framework and was constructed
specifically in order to understand mortality inequalities (Carstairs and Morris,
1989a). It is the only measure of deprivation in Scotland that is available
covering a thirty year time period (Brown et al., 2014). However it is not without
limitations.
The score‘s ability to capture the changing nature of deprivation over time has
been questioned (Tunstall et al., 2011). Particular attention has been paid
towards the changing levels of car ownership and the meaning this has for
relative deprivation being context specific (e.g. urban versus rural) (Norman,
2010).
The Carstairs score is an area level measure of deprivation rather than a
measure derived from individual level variables of socioeconomic position. This
means the results reported may be subject to the ecological fallacy: the extent
of an association found at the area level may differ from extent of an association
found at the individual level (Diez, 2002).
Despite these acknowledged short-comings, area level measures of deprivation
are an invaluable tool for research. They also have pragmatic advantages for
governments seeking to identify how resources should be distributed (Allik et
al., 2016, The Scottish Government and National Statistics, 2012).

Chapter 7: Changes to the socioeconomic gradient for lifespan variation
292
It was possible to statistically assess the true population value of lifespan
variation stratified by socioeconomic deprivation by producing measures of
uncertainty for lifespan variation.
Unfortunately no statistical inference can be derived from the descriptive
analysis comparing Scotland‘s deteriorating ranking with the lifespan variation
estimates stratified by socioeconomic deprivation. However each quintile which
falls above the average lifespan variation for Scotland provide an indication of
the extent of inequality in Scotland; this has implications in terms of inequality
within a European perspective (Leyland et al., 2007a). This analysis is therefore
important because it positions the widening inequality as a key factor which has
contributed to Scotland‘s unenviable mortality experience in Europe.
7.5.3 Comparisons with existing studies
The social patterning of lifespan variation in Scotland is consistent with
international studies that have analysed lifespan variation inequalities in
different countries by education (van Raalte et al., 2011) and in Finland by
occupation (van Raalte et al., 2014), the most deprived group experience the
greatest amount of inequality in age at death. However the increases in lifespan
variation over time for the most deprived in Scotland are somewhat starker than
the stagnating trend identified for the most deprived group, in terms of
occupation, in Finland between 1971 and 2010 (van Raalte et al., 2014).
The study by van Raalte et al. (2011) concluded that Finland had the largest
socioeconomic inequalities in lifespan variation but Scotland was not included.
Several authors have highlighted that international comparative research
including Scotland as a separate entity from the rest of the UK is rare. Despite

Chapter 7: Changes to the socioeconomic gradient for lifespan variation
293
the fact that it is a country that is comparable to many Western European
countries in terms of wealth, economic development and epidemiological
transitions (Leon et al., 2003, Popham and Boyle, 2010) it is not comparable in
terms of life expectancy (McCartney et al., 2012b). Although the analysis in this
chapter contributes to filling this research gap it is not possible to make direct
comparisons with the existing international studies of lifespan variation.
Although van Raalte et al. (2011) and van Raalte et al. (2014) applied the same
measure of lifespan variation (e†) as this thesis these two studies calculated
lifespan variation as conditional upon survival to age 35 and 31, respectively. It
was not possible to produce complete lifetables (beginning at age 0) because
information on occupation and education, the measures being used to reflect
socioeconomic position, are not meaningful for younger ages. In pragmatic terms
it was also the youngest age for which data were available across all countries of
interest (van Raalte et al., 2011). Similarly, Smits and Monden (2009) suggested
that studies interested in the social distribution mechanisms of adult mortality
should consider restricting analysis to ages 15+ because the causes of death
driving mortality change over time differ across ages: infectious disease and
effective medical intervention historically reduced infant and childhood deaths
rapidly, while adult mortality is influenced by more complex mechanisms that
change slowly (Vallin and Meslé, 2004). Smits and Monden (2009) further
estimated that 80% of all deaths in 2000 (one of the most recent years for which
they had data) occurred in ages 15+.
This thesis acknowledges these valid arguments but chose to measure e† from
age 0 for the following three reasons. Firstly it was deemed appropriate to

Chapter 7: Changes to the socioeconomic gradient for lifespan variation
294
measure e† from age 0 because life expectancy is traditionally reported and
interpreted at age 0. Smits and Monden (2009) recognise this issue when they
report lifespan inequality and life expectancy at all age groups for reasons of
comparison. Secondly the decomposition methods, applied in chapter 5, 6 and 8,
account for the contributions made from deaths at every age allowing the
relative distribution of contributions to be assessed. Finally it was possible in the
context of this thesis to measure lifespan variation from age 0 because the
measure of deprivation used was applicable to the whole population unlike the
measures used by van Raalte et al. (2014) and van Raalte et al. (2011).
7.5.4 Research implications
The evidence presented in this chapter, showing the strong patterning of
lifespan variation by socioeconomic deprivation, means that the age distribution
of death must differ between socioeconomic groups. The impact age specific
change in mortality has had in terms of lifespan variation was quantified by van
Raalte et al. (2014) and demonstrated that the contrasting lifespan variation
trends between 1971 and 2010 across occupation groups were largely due to
higher premature mortality rates associated with external causes of death. This
type of formal analysis has not yet been carried out for Scotland. However it
cannot simply be assumed that the same premature mortality problem
evidenced in Finland, will hold true for Scotland: reductions in older age
mortality can also prevent reductions in lifespan variation (van Raalte et al.,
2011).
However evidence from existing studies of Scotland strongly suggest that higher
premature mortality is a problem for Scotland (Leyland et al., 2007b, Mitchell et

Chapter 7: Changes to the socioeconomic gradient for lifespan variation
295
al., 2005, McCartney et al., 2016, Schofield et al., 2016). For example increasing
mortality rates for ages 15-29 years old were evident at the population level
between 1981-1991 and 1991- 2001 (Leyland et al., 2007a). This deteriorating
mortality pattern was largely caused by deaths from suicide, alcohol harm,
substance abuse and violence (Norman et al., 2011, Leyland et al., 2007b,
Leyland, 2004, Schofield et al., 2016).
Leyland et al. (2007a) demonstrate the extreme divergence in the social
patterning of external causes when discussing deaths from chronic liver disease,
which represent alcohol harm. Even though chronic liver disease was considered
a rare cause of death in 1981, the ratio of deaths for males from the least
deprived group to males from the most deprived group was still 1:4.8. By 2001
this ratio had increased to 1:17.5. A similar result was evidenced for females.
The analysis in chapters 5 and 6 of this thesis identified that premature
mortality, from all-causes of death, were detrimental in terms of Scotland‘s
population level lifespan variation trend. Chapter 7 demonstrated that lifespan
variation in Scotland is strongly patterned by socioeconomic deprivation. Existing
studies of mortality in Scotland have demonstrated increasing premature
mortality rates from external causes of death which the international literature
argues contribute to lifespan variation inequalities between socioeconomic
groups. Considering all of this evidence it is valid to hypothesis that premature
deaths from external causes will have also contributed to lifespan variation
inequalities in Scotland.
This is important to establish as different ages and causes of death reflect
different aetiological pathways and contrasting root causes . It is also a research

Chapter 7: Changes to the socioeconomic gradient for lifespan variation
296
question which will have relevance beyond this thesis: evidence seeking to
understand the determinants of widening mortality inequalities (as being
measured by lifespan variation) in one country is likely to be of interest to other
populations (Schofield et al., 2016, Mackenbach et al., 1997).
7.6 Conclusion
This chapter demonstrated that lifespan variation is strongly patterned by
socioeconomic deprivation in Scotland. The socioeconomic gradient for lifespan
variation has widened over time but showed signs of narrowing in 2011. This was
the case when measuring the socioeconomic gradient in absolute and relative
terms. Opposing trends between the most and least deprived quintiles in
Scotland contributed to the widening lifespan variation gradient: for the least
deprived quintile there was a decrease in lifespan variation between 1981 and
2011, for the most deprived quintile there was an increase. Over time a greater
proportion of the Scottish population have experienced a lifespan variation level
higher than the Scottish average.
Considering all of this evidence it is perhaps not surprising that Scotland‘s
lifespan variation ranking has deteriorated: earlier analysis in this thesis
identified that it now experiences the highest level of inequality in age at death
within Western Europe. Scotland may not be able to improve its position if it
does not ensure reductions in lifespan variation are experienced by all
socioeconomic groups. Identifying if any age and cause specific patterns of
mortality change are distinguishable between socioeconomic groups could help
to understand how Scotland can achieve this.

297
8 Age and cause specific decomposition of lifespan
variation inequalities
8.1 Introduction
The previous chapter of this thesis began the process of analysing lifespan
variation stratified by socioeconomic deprivation within Scotland. It
demonstrated the strong socioeconomic gradient for lifespan variation in
Scotland: a gradient that widened over time in absolute and relative terms.
Although there was some improvement in the gradient between 2001 and 2011,
the most recent time point, this was still steeper than it had been in 1981.
Initially, only the most deprived quintile in Scotland experienced a higher level
of inequality than the population average. Over time more quintiles of
deprivation experienced a higher level of lifespan variation than the Scottish
average. Each quintile represents 20% of the Scottish population, a significant
proportion. It was somewhat surprising to find that the lifespan variation
experienced by the most affluent quintile in Scotland has fallen further behind
the average lifespan variation experienced by whole countries in Western
European.
Evidence presented in chapter 5 of this thesis demonstrated that the age pattern
of mortality driving the population level lifespan variation trend in Scotland was
distinguishable from the age pattern driving the trend in England and Wales:
Scotland experienced higher mortality rates across working adult ages. The
detrimental contributions from these higher premature mortality rates increased

Chapter 8: Age and cause specific decomposition of lifespan variation inequalities
298
during the 1980s. This was around the same time that the population level
lifespan variation trend in Scotland diverged towards increasing lifespan
variation (as formally identified in chapter 4 of this thesis).
Chapter 6 of this thesis demonstrated that higher premature mortality rates in
Scotland also explained the increasing lifespan variation gap between Scotland
and England and Wales when achieving similar levels of life expectancy. This was
despite the fact that Scotland was achieving a level of life expectancy
comparable to England and Wales approximately ten years later in time.
Considering this, alongside the wider literature demonstrating persisting
premature death rates in Scotland, it is valid to hypothesise that widening
socioeconomic inequalities in lifespan variation could largely be due to the
higher risk of premature death that is disproportionately experienced by the
most deprived socioeconomic groups in society. However this has not previously
been the focus of any formal analysis for Scotland. Nor have cause specific
contributions to increasing socioeconomic inequalities in lifespan variation been
quantified. It is these research gaps that this chapter will fill.
The analysis in this chapter extends our understanding of the social patterning of
lifespan variation by visually inspecting differences in the age distributions of
death and decomposing lifespan variation inequalities into age and cause
specific contributions. This analysis was carried out in order to answer the final
three research questions of this thesis:
10. Which ages and causes of death contributed to changes in lifespan
variation, over time, for different socioeconomic groups in Scotland?

Chapter 8: Age and cause specific decomposition of lifespan variation inequalities
299
11. Which ages and causes of death contributed to the lifespan variation gap
between the most and least deprived socioeconomic groups in Scotland?
12. Which ages and causes of death contributed to the lifespan variation gap
between the most and least deprived socioeconomic groups, when life
expectancy was similar, in Scotland?
This chapter continues to utilise the same population estimates obtained from
National Records of Scotland, death count data and the Carstairs score data
surrounding the four Census years: 1981, 1991, 2001 and 2011. The aggregate
lifespan variation estimates reported in this chapter are therefore the same as
the lifespan variation estimates that were reported in chapter 7.
This is the only chapter in this thesis to utilise International Classification of
Diseases (ICD) data in order to assign each death to one of five, mutually
exclusive, cause specific categories: external causes, cancers, circulatory
diseases, respiratory diseases, and other causes. Like all of the previous
chapters, this chapter is made up of the following four sections: background,
data and methods, results, discussion and conclusion.
8.2 Background
Studies comparing lifespan variation inequalities between entire countries have
identified how differences in the ages of death contribute to the cross-sectional
lifespan variation gap (Shkolnikov et al., 2011, Vaupel et al., 2011) and the gap
at shared levels of life expectancy (Seaman et al., 2016b, van Raalte et al.,
2014). The literature has also progressed to quantify the ages and causes of
death driving: socioeconomic trends in lifespan variation, the lifespan variation
gap between socioeconomic groups at the same time point, and the lifespan

Chapter 8: Age and cause specific decomposition of lifespan variation inequalities
300
variation gap between socioeconomic groups when life expectancy was similar
(van Raalte et al., 2014, van Raalte et al., 2011).
8.2.1 Socioeconomic trends
In most Western European countries the least deprived socioeconomic group has
tended to experience the most favourable trends in lifespan variation and the
most deprived the most unfavourable (van Raalte et al., 2011, van Raalte et al.,
2014). Chapter 7 of this thesis demonstrated that this finding was replicated
when studying socioeconomic trends in lifespan variation in Scotland. Countries
with high population levels of lifespan variation have also been found to have
steeper socioeconomic gradients for lifespan variation (van Raalte et al., 2011).
International studies have demonstrated that socioeconomic differences in
lifespan variation trends are due to inequalities in the age and cause specific
patterns of mortality decline (Shkolnikov et al., 2011, van Raalte et al., 2014).
Although all socioeconomic groups have shifted the age distribution towards
older ages, the most deprived are found to have experienced a smaller shift
across working adult ages (van Raalte et al., 2014). This causes a lack of
mortality compression amongst the most deprived socioeconomic group(s) which
can result in a stagnating, or even increasing, lifespan variation. This is in
contrast with the experience of the least deprived group :mortality compression
over time, resulting in a decreasing lifespan variation.
8.2.2 Cross-sectional gap
The lifespan variation gap between socioeconomic groups at the same point in
time was assessed for ten European countries by van Raalte et al. (2011). This
study sought to understand if the same ages and causes of death causing the

Chapter 8: Age and cause specific decomposition of lifespan variation inequalities
301
most deprived socioeconomic group (as measured by education) to experience
lower life expectancy also caused them to experience higher lifespan variation.
The main reason for the lifespan variation gap between socioeconomic groups
was different mortality rates across working adult ages: a persisting left hand
tail across the age distribution was evident for the most deprived group.
However in a few countries there was a smaller gap between the socioeconomic
groups because the least deprived were experiencing mortality expansion which
also adds uncertainty to age at death. While measuring the cross-sectional
lifespan variation gap is important, it is also important to capture and interpret
lifespan variation independent of the level of life expectancy achieved (Smits
and Monden, 2009).
8.2.3 Gap at comparable level of life expectancy
Chapter 6 of this thesis critically evaluated the hypothesis proposed by Smits and
Monden (2009): that countries paving the way in terms of life expectancy may do
so with higher inequality than those following behind them. Countries lagging
behind, in terms of life expectancy, may experience a temporal advantage in
terms of reducing inequality because they are positioned to capitalise on lessons
already learnt for reducing premature mortality across ages that simultaneously
increases life expectancy and decreases inequality.
van Raalte et al. (2014) applies a similar hypothesis, but in reference to lifespan
variation inequalities between socioeconomic groups as opposed to countries,
stating that the knowledge surrounding health improvement and motivation for
health behaviour change would be diffused over time from the least deprived
quintile to the most deprived quintile. Under this argument we would expect

Chapter 8: Age and cause specific decomposition of lifespan variation inequalities
302
lifespan variation to be higher amongst the most deprived when looking at
chronological time but at a shared level of life expectancy lifespan would be
similar or lower. When studying Finland, van Raalte et al. (2014) found that this
was not the case. Lifespan variation was also higher amongst the most deprived
socioeconomic group, as measured by occupation, when achieving the same
level of life expectancy but later in time as the least deprived. This was despite
the fact that the most deprived appeared to experience a temporal advantage
(lower mortality rates) for circulatory diseases.
The lifespan variation disadvantage, at comparable level of life expectancy, was
largely explained by the most deprived socioeconomic group experiencing higher
premature mortality rates from causes of death that can be categorised as
external. It could be argued that deaths from external causes are more likely to
be associated with the social determinants of health and be amenable to
redistributive policies (Bambra, 2011a). However it is important to recognise
that stagnating lifespan variation can also be the result of saving lives at older
ages: deaths that are likely to be caused by chronic medical conditions and co-
morbidities which are more likely to be amenable to medical and health care
advances. However deaths at older ages may also be the result of lagged effects
of being exposed to socioeconomic determinants of health at earlier stages of
the life course (Nau and Firebaugh, 2012).
Studies measuring socioeconomic inequalities in lifespan variation and seeking to
identify the age and cause specific drivers are valuable for informing the
direction of future empirical research, interpreting the theoretical explanations
that exist for health inequalities, anticipating how socioeconomic inequalities

Chapter 8: Age and cause specific decomposition of lifespan variation inequalities
303
might change, and providing a basis for critically evaluating appropriate social
policy responses for addressing socioeconomic inequalities. van Raalte et al.
(2014) put forward three scenarios to illustrate these arguments: the fluctuating
scenario, the divergence scenario, and the stagnating scenario.
8.2.4 Critical evaluation of lifespan variation scenarios
van Raalte et al. (2014) was particularly concerned with understanding why life
expectancy tends to be strongly predictive of lifespan variation for all
socioeconomic groups when analysed at one single point in time but that the
ability for life expectancy to predict lifespan variation for entire countries is
much more ambiguous. In the context of this thesis, the following critical
evaluation is used to demonstrate why empirical studies of lifespan variation are
valuable for assessing the merit of existing theories of health inequalities
(Mackenbach, 2012). van Raalte et al. (2014) effectively summarises how
empirical lifespan variation findings could provide evidence for: health
behaviour explanations, social polarisation and psychosocial mechanism
theories, selection effects, or fundamental causes (table 22). Identifying which
scenario is applicable to lifespan variation inequalities in Scotland may help to
understand the causes of mortality inequalities (McCartney et al., 2012a).
8.2.5 Fluctuating
The first scenario hypothesised that the lifespan variation gap between the most
and least deprived groups over time could fluctuate from periods of widening to
periods of narrowing. Under this scenario the lifespan variation gap between the
most and least deprived could be very small at shared levels of life expectancy
as the most deprived group simply lag behind the least deprived. This scenario

Chapter 8: Age and cause specific decomposition of lifespan variation inequalities
304
could be interpreted as support for either a health behaviours explanation or for
a fundamental causes‘ framework.
It was suggested that that the least deprived socioeconomic group could pave
the way for adopting health behaviours that reduce premature mortality. Over
time the knowledge and motivation for health behaviours would be diffused to
lower socioeconomic groups: causing the lifespan variation gap to widen during
periods of rapid health improvement as the least deprived adopt new health
behaviours before returning to previous levels or narrowing as new health
behaviours diffuse to the most deprived.
This hypothesis was explored by looking at the role smoking played in the
diverging trends between socioeconomic groups, as measured by occupation (van
Raalte et al., 2015). It strongly suggested that smoking, one of the most
detrimental of all health behaviours, did not contribute to the lifespan variation
gap between the most and least deprived socioeconomic groups. Yet Kelly and
Preston (2016) demonstrated that smoking was the main driver of lower life
expectancy (conditional upon survival to age 50) in Scotland.
The inability for smoking to account for lifespan variation inequalities in Finland
while accounting for life expectancy in Scotland was somewhat surprising
considering that smoking is strongly patterned by socioeconomic deprivation.
However it is important to consider the aetiological pathways of different causes
of deaths. There is a substantial time lag between the exposure (smoking) and
the outcome (death). This means that smoking has a minimal impact on deaths
at younger ages but is the predominant behavioural factor for deaths at older
ages (van Raalte et al., 2015). Unfavourable levels of lifespan variation tend to

Chapter 8: Age and cause specific decomposition of lifespan variation inequalities
305
occur in populations where there is a lack of compression because of
unfavourable premature mortality rates: deaths that are less likely to be caused
by smoking. However a change in mortality rate at any age will have implications
for life expectancy. Similar findings were also evidenced by Shkolnikov et al.
(2011) when studying differences between the USA and England and Wales as a
whole: external causes of death accounted for inequalities in lifespan variation
but not in life expectancy.
The notion that health behaviours are the mechanism driving population health
has been heavily criticised. This hypothesis fails to recognise that health
behaviours are indicators of health that need to be interpreted with the relevant
context, relies on the notion that individuals act as autonomous and
independent decision makers in relation to their health, and inadequately
accounts for the fact that health behaviours have changed over time but the
mortality gradient has remained (McCartney et al., 2013, Bartley, 2004,
Townsend and Davidson, 1992, Dowler and Spencer, 2007). These theoretical
limitations are somewhat addressed by interpreting a fluctuating scenario as
support for a fundamental causes explanation for health inequalities.
A fundamental causes theory hypothesises that a socioeconomic gradient for
health is always present to some degree regardless of the changes to the disease
profile of the population(Link and Phelan, 1995, Phelan et al., 2010). This is not
because of inequalities in the distribution of health behaviours or individually
based risk factors but because socioeconomic status embodies the types of
resources (so called fundamental causes) that impact health: money, power,
prestige, and knowledge. These fundamental causes are always relevant for

Chapter 8: Age and cause specific decomposition of lifespan variation inequalities
306
protecting health regardless of changes to the disease profile and the
distribution of these resources is not altered by interventions. As the disease
profile changes or a new intervention is implemented the socioeconomic
gradient may fluctuate from narrowing to widening but the highest
socioeconomic will always maintain an advantage.
8.2.6 Diverging
The second scenario suggested that the least deprived may experience mortality
compression but the most deprived would not to the same extent. This would
cause the lifespan variation gap between socioeconomic groups to widen over
time and to widen at shared levels of life expectancy.
van Raalte et al. (2014) hypothesised that a divergence scenario could be the
consequence of increasing income inequalities, caused by the decline of heavy
industries and the rise in precarious employment. The disproportionate impact
these societal level changes had on the most deprived socioeconomic groups is
well documented with many arguing that these processes have resulted in
polarised societies (Bambra, 2010, Dorling, 2009). Societal level changes may
have feasibly impacted the age and cause specific patterns of mortality
experienced by socioeconomic groups if the mechanisms that help to mitigate
social and economic risks were restricted for the most deprived group only. This
could have had damaging effects on the psychosocial responses that are
hypothesised to be important for avoiding premature death causing a lack of
compression (Marmot and Wilkinson, 2001, Wilkinson and Pickett, 2006).
Another interpretation of a divergence scenario is that it would support a health
selection effects explanation for increasing mortality inequalities: either in

Chapter 8: Age and cause specific decomposition of lifespan variation inequalities
307
terms of ill health causing downward mobility or in terms of a meritocracy
increasing upward mobility for individuals with favourable health characteristics.
If either of these mechanisms were active then socioeconomic groups would
each be expected to become more homogenous in terms of health, leading to
widening inequalities. This would be reflected in growing differences in causes
of death when comparing socioeconomic groups, with external causes of deaths
becoming concentrated within the most deprived groups.
8.2.7 Stalling
The third scenario hypothesised that the absolute lifespan variation gap between
socioeconomic groups could remain constant over time. van Raalte et al. (2014)
suggest that this would support a fundamental causes framework for health
inequalities: the least deprived socioeconomic group are always able to maintain
a health advantage regardless of the types of mortality risk that the population
is exposed to over time because they are able to exploit their material,
psychosocial and knowledge resources (Link and Phelan, 1995, Phelan et al.,
2010). Causes of death would not be increasingly patterned by socioeconomic
deprivation. Instead, the least deprived would continue to demonstrate a
constant advantage across all causes.

308
Table 22 Summary of lifespan variation scenarios describing inequalities between most and least deprived socioeconomic groups
Desc
ripti
on o
f sc
enari
o
Lifespan variation gap between the most and least deprived groups over time fluctuates: from periods of widening to periods of narrowing Magnitude of lifespan variation gap depends on spend of health improvement in given time period Lifespan variation gap between the most and least deprived minimal at shared levels of life expectancy.
Lifespan variation gap widening over time and widening at shared life expectancy Least deprived experience mortality compression causing decreasing lifespan variation Most deprived do no experience mortality compression causing increasing lifespan variation
Lifespan variation gap between socioeconomic groups could remain constant over time All socioeconomic groups experience decreasing lifespan variation but least deprived always experience greatest decrease and always maintain an advantage Higher lifespan variation for most deprived at shared levels of life expectancy
Age-c
ause
specif
ic
patt
ern
s
Ages and causes of death driving lifespan variation gap associated with health behaviours e.g. smoking Lower mortality rates experienced by least deprived first before diffused to most deprived Most deprived may benefit from lower mortality rates at shared life expectancy as they capitalise on the lessons already learnt
Premature ages of death driving higher lifespan variation in the most deprived socioeconomic group External causes of death that are hypothesised to be associated with social determinants of health e.g. vulnerability to social and economic risk
Homogeneity of cause of death within different socioeconomic groups
Least deprived always experience lower mortality rates across all ages but ages and causes of death not distinctly different between socioeconomic groups
Most dep.
least dep.
Stalling
Scenario
Fundamental
causes
Diverging
Scenario
Social polarisation & Psychosocial mechanisms or Selection effects
Fluctuating
Scenario
Health
behaviours or
Fundamental
causes

Chapter 8: Age and cause specific decomposition of lifespan variation inequalities
309
8.2.8 Research gap
The critical evaluation of the three scenarios proposed by van Raalte et al.
(2014) illustrates why the age and cause specific pattern of mortality change and
the impact on socioeconomic inequalities in lifespan variation can be used to
evaluate existing hypotheses for health inequalities. This issue is of direct
relevance for studying Scotland.
The mortality differential in Scotland, relevant to a number of comparable
Western European countries, has been the focus of much research attention and
a number of theories proposed (Hanlon et al., 2005, Walsh et al., 2016,
Campbell et al., 2013, Walsh et al., 2010). Seventeen theories were categorised
by McCartney et al. (2012a) as either: artefactual explanations, downstream
explanations, midstream explanation, or upstream explanations. The
explanations which received the most support were those which understood
Scotland‘s mortality problem within the context of, and in response to the
consequences of, increasing relative deprivation.
Scotland is a country which experienced acute levels of deindustrialisation which
is evidenced to have had detrimental effects in terms of poverty, relative
inequalities and ultimately health (Graham et al., 2012, Walsh et al., 2010).
McCartney et al. (2012b) add that these social inequalities were exacerbated
further by the pursuit of neoliberal policies during the 1980s. Neoliberal policies
have been found to be associated with detrimental health outcomes, with a
limited time lag following their implementation, in Eastern Europe and the USA
(Stuckler et al., Beckfield and Krieger, 2009). Like these countries, previous
mechanisms for social protection in Scotland may have dissolved over time

Chapter 8: Age and cause specific decomposition of lifespan variation inequalities
310
(Walsh et al., 2016). These theoretical explanations recognise the important role
that the political economy plays in determining the distribution of resources,
and in particular those resources that enable individuals to fully participate in
the socially accepted standard of living (Townsend, 1987).
Further insight into these hypothesized drivers of population mortality can be
gained by studying lifespan variation. van Raalte et al. (2014) explicitly stated
that the proposed scenarios and the interpretations they presented should be
used to inform the analysis of lifespan variation inequalities in other
economically developed countries. It is still ambiguous as to which scenario, if
any, may adequately reflect the lifespan variation experience of Scotland.
Identifying the ages and causes of death which have been responsible for
widening inequalities in lifespan variation, and the most recent indications of
improvement, will provide further clarity. It is this research gap which is the
focus of the final analysis chapter of this thesis.
8.3 Data & methods
Data used in this chapter were the same as in the previous chapter: Census
population estimates and death counts by sex and single year of age, matched
with the Carstairs score of area level socioeconomic deprivation. A detailed
summary of these data are available in chapter 7 of this thesis.
8.3.1 Cause specific mortality rates
The analysis in chapter 7 required an all-cause mortality rate by single year of
age. The analysis in this chapter required cause specific mortality rates by single
year of age, the sum of which would equate to the all-cause mortality rate. The

Chapter 8: Age and cause specific decomposition of lifespan variation inequalities
311
cause of death categories needed to be mutually exclusive in order for the cause
specific rates to sum to the all-cause mortality rate used in chapter 7.
The International Classification of Diseases (ICD) was used to assign each death
into one of the following five categories: external causes, circulatory diseases,
respiratory diseases, cancers, or other causes. Cause of death categories were
harmonized to ensure that there was comparability between ICD9 and ICD10.
Full details on the relevant ICD codes included in each category can be found in
the data and methods chapter of this thesis.
The choice of categories was informed by the analysis carried out by van Raalte
et al. (2014) and by Leyland et al. (2007a). The existing literature on premature
mortality in Scotland has highlighted the impact deaths from suicide, alcohol
harm, substance abuse and violence have had in terms of inequality (Leyland,
2004, Walsh et al., 2016, Schofield et al., 2016). These causes of death have
been referred to as external causes or diseases of despair and are known to be
socially patterned (van Raalte et al., 2014, Alexander, 2008). It was important to
include circulatory diseases as these causes of death have driven mortality
decline in economically developed countries in the time period covered (van
Raalte et al., 2014, Vallin and Meslé, 2004). Respiratory diseases and cancers
reflect the other major causes of death in Scotland.
8.3.2 Smoothing procedure
Census population estimates were only available up to an open ended age group
of 85+. The analysis of lifespan variation estimates by socioeconomic deprivation
required cause-specific mortality rates up to an open ended age interval of

Chapter 8: Age and cause specific decomposition of lifespan variation inequalities
312
110+. This was to ensure comparability with the HMD data used for estimating
the population level lifespan variation trend.
In order to obtain cause specific mortality rates, up to an open ended age
interval of 110+, the all-cause mortality rate used in chapter 7 was proportioned
out to reflect the cause specific proportions as they stood at age 84 for each
sex, quintile of deprivation and year combination. This approach assumed that
the proportion of the total deaths by sex, quintile of deprivation and year
remained constant across each single year of age for age ≥85. This gave cause-
specific mortality rates for age 0 to age 110+ for each sex, quintile of
deprivation and Census year (40 cause-specific data sets in total). Although
results are reported for all ages, deaths at older ages generally have multiple
underlying causes (van Raalte et al., 2011). Therefore the distinction between
the causes of deaths beyond age 85 should be interpreted with caution.
8.3.3 Decomposition analysis
Age and cause specific decomposition analysis was performed by importing the
calculated age-cause-specific mortality rates in to an adapted version of the
Visual Basics Application program provided by Shkolnikov and Andreev (2010) and
applying the stepwise decomposition algorithm.
This results chapter focuses on the lifespan variation estimates for the most and
least deprived quintile only. This made the number of decompositions to be
carried out more manageable and the interpretation of the results clearer.
The results section reports a total of 12 decompositions. The first section reports
the decomposition of the change in lifespan variation achieved between 1981
and 2011 for the least deprived quintile and for the most deprived quintile. The

Chapter 8: Age and cause specific decomposition of lifespan variation inequalities
313
second section reports the lifespan variation gap between the most and least
deprived quintile at each year (1981, 1991, 2001 and 2011). The final section
reports the decomposition of the lifespan variation gap between the most and
least deprived quintile when they achieved the most comparable level of life
expectancy, albeit at different points in time. All decomposition analysis was
carried out for males and females separately because their mortality
experiences are known to differ.
The age distributions of death are plotted from the all-cause mortality rate (the
sum of the cause specific mortality rates) and briefly discussed before each
decomposition result: this allows a visual interpretation of where age
differences in mortality occurred and how the age distribution of death has
changed over time. Plotting the age distribution of the all-cause mortality rates,
as opposed to the age distribution of the cause-specific mortality rates, is
consistent with how the results have been presented in previous chapters of this
thesis and makes comparisons more straight forward. The age distributions of
the cause-specific mortality rates (age 0 to 110+) are reported in appendix 9 to
appendix 12 for the most and least deprived quintiles only.
8.4 Results
8.4.1 Change in lifespan variation over time
Figure 53 demonstrates the lifespan variation trends by sex and socioeconomic
deprivation at each census year: 1981, 1991, 2001 and 2011. These are the same
lifespan variation estimates reported in chapter 7 of this thesis.

314
Males
Females
Figure 53 Lifespan variation trends by socioeconomic deprivation

Chapter 8: Age and cause specific decomposition of lifespan variation inequalities
315
As was previously evidenced in chapter 7 of this thesis, lifespan variation
demonstrates a strong social pattern. Improvements in lifespan variation have
generally been achieved for females across all socioeconomic groups but this is
not the case for males. Over time males from the most deprived socioeconomic
group have experienced increasing lifespan variation which is interpreted as
increasing inequality in age at death within this group. This is in contrast to
males from the least deprived quintile who have generally experienced
decreasing lifespan inequality in age at death within this group, although
improvement appears to have stagnated between 2001 and 2011. It is important
to point out that the lifespan variation trends by socioeconomic deprivation are
not exclusively linear. These results suggest that over time the least deprived
have consistently experienced mortality compression but the most deprived have
not.
Plotting the age distributions of death from the life tables that were calculated
from the all-cause mortality rates for each sex, quintile of deprivation and year
can help to better understand this. Figure 54 compares the age distributions of
death in 1981 with the age distribution in 2011 for males in the least deprived
quintile and males in the most deprived quintile. Figure 55 shows the same for
females.

316
Figure 54 Age distribution of death in 1981 compared to 2011 by socioeconomic deprivation (Carstairs quintile), Males

317
Figure 55 Age distribution of death in 1981 compared to 2011 by socioeconomic deprivation (Carstairs quintile), Females

Chapter 8: Age and cause specific decomposition of lifespan variation inequalities
318
Over time the age distribution of death has shifted toward older ages. This is the
case for males and for females from the most and least deprived quintiles of
deprivation. However there are some notable differences to the change in the
age distribution of death achieved between 1981 and 2011.
The shift towards older ages is greater for the least deprived and the width of
the distribution appears narrower. For males and females from the most
deprived quintile there is a lingering tail to the left hand side of the distribution.
This is particularly evident for males, where the left hand tail of the distribution
for 2011 is slightly higher than the left hand tail of the distribution in 1981
around ages 30-40. This suggests that there has been a lack of mortality
compression because the proportion of premature adult age deaths has not
declined and this is reflected in the increasing lifespan variation estimates.
Figure 56 shows the decomposition results which quantified the age and cause
specific contributions to the change in lifespan variation between 1981 and 2011
by socioeconomic deprivation for males. Figure 57 shows the same for females.
Spikes above the zero line reflect the ages at which mortality change between
1981 and 2011 increased lifespan variation, thus contributed to increasing
inequality. Spikes below the zero line reflect the ages at which mortality change
between 1981 and 2011 decreased lifespan variation, thus contributing to
decreasing inequality. Each spike reports the combined total of the contributions
made by each cause of death at each single year of age.

319
Figure 56 Age and cause specific contributions to change in lifespan variation between 1981 and 2011, by socioeconomic deprivation, Males

320
Figure 57 Age and cause specific contributions to change in lifespan variation between 1981 and 2011, by socioeconomic deprivation, Females

Chapter 8: Age and cause specific decomposition of lifespan variation inequalities
321
For males from the least deprived quintile, lifespan variation was lower in 2011
than it had been in 1981 because mortality compression across younger ages
outpaced mortality expansion across older ages. The reduction in lifespan
variation for the least deprived quintile largely came from lower mortality rates
from circulatory causes and cancers. However lower mortality rates from
circulatory diseases in 2011 compared to in 1981 have also contributed to
mortality expansion, by saving lives at older ages. This could be expected as
circulatory diseases are the leading causes of death during this time period (van
Raalte et al., 2014). This age and cause specific pattern is also evident, but to a
much lesser extent, for males from the most deprived quintile: the length of the
spikes contributing to decreasing lifespan variation is much shorter indicating
that mortality rates from circulatory diseases were not reduced as much as in
the least deprived quintile.
These smaller gains do not explain why lifespan variation for males from the
most deprived quintile lifespan variation was higher in 2011 than it had been in
1981. This was caused by mortality compression failing to outpace mortality
expansion. For males in the least deprived quintile a total of 2.00 years of
inequality were added from mortality expansion but this was counterbalanced
because -2.74 years of inequality were reduced from mortality compression. This
equated to a total decrease in lifespan variation of -0.74 years between 1981
and 2011. For males in the most deprived quintile a total of 1.73 years of
inequality were added from mortality expansion but this was not
counterbalanced because only 1.66 years of inequality were reduced from
mortality compression. This equated to a total increase in lifespan variation of
0.07 years between 1981 and 2011.

Chapter 8: Age and cause specific decomposition of lifespan variation inequalities
322
Although some notable contributions to mortality expansion came from reducing
deaths from circulatory diseases across older ages for males from the most
deprived quintile, of concern are the contributions made to increasing lifespan
variation from external causes of death. Males‘ age 27 to 55 years old from the
most deprived quintile experienced higher mortality rates from external causes
of death in 2011 than in 1981. This expanded the age distribution of death and
added 0.37 years of inequality to the total change between 1981 and 2011.
These contributions to increasing lifespan variation between 1981 and 2011 were
not evident for the least deprived quintile. A similar pattern was found for the
most deprived females, but the contributions from external causes of death to
increasing lifespan variation were not as large as they were for males. Therefore
females from the most deprived quintile experienced a decrease in lifespan
variation between 1981 and 2011.
8.4.2 Lifespan variation gap at same time point
Figure 58 compares the age distributions of death for the most deprived quintile
with the age distribution of death for the least deprived quintile at the four time
points: 1981, 1991, 2001, and 2011. Figure 59 shows the same for females.

323
Figure 58 Age distribution of death comparing most deprived quintile with least deprived quintile, Males

324
Figure 59 Age distribution of death comparing most deprived quintile with least deprived quintile, Females

Chapter 8: Age and cause specific decomposition of lifespan variation inequalities
325
At all four time points the age distribution of death for the least deprived
quintile is shifted further towards older ages and the width of the distribution
appears narrower. This is the case for males and females. The age distributions
in 1981 are more similar than the age distribution in 2011. As time has
progressed the age distribution of death experienced by the most and least
deprived quintiles have become increasingly different. Of particular concern is
the difference in the left hand tail of the distribution. After 1981 the purple line
(least deprived) gets further away from the red line (most deprived) over
younger ages. The gap between the lines is particularly stark for males in 2001:
it is not a coincidence that this was when the lifespan variation gap was widest.
This suggests that there has been a lack of mortality compression for the most
deprived because the proportion of premature adult age deaths has not declined
and is reflected in the increasing lifespan variation estimates.
Figure 60 shows the decomposition results which quantified the age and cause
specific contributions to the lifespan variation gap between the most and least
deprived quintile in: 1981, 1991, 2001 and 2011. Figure 61 shows the same for
females.
Spikes above the zero line reflect the ages at which the difference in mortality
between the most and least deprived added to the lifespan variation gap. Spikes
below the zero line reflect the ages at which the difference in mortality
between the most and least deprived has reduced the lifespan variation gap
between the most and least deprived. Each spike reflects the combined total of
the contributions made by each cause of death at that single year of age. Higher
mortality rates in the most deprived quintile across ages that contribute to

Chapter 8: Age and cause specific decomposition of lifespan variation inequalities
326
mortality compression would increase the lifespan variation gap. Higher
mortality rates in the most deprived quintile across ages that contribute to
mortality expansion would decrease the lifespan variation gap. If there was no
difference in the age specific mortality rates there would be no spikes: there is
zero difference between the most and least deprived quintile across every age
(Seaman et al., 2016b).

327
Figure 60 Age and cause specific contributions to lifespan variation gap at each time point, Males

328
Figure 61 Age and cause specific contributions to lifespan variation gap at each time point, Females

Chapter 8: Age and cause specific decomposition of lifespan variation inequalities
329
Lifespan variation has always been higher in the most deprived quintile
compared to the least deprived quintile. For males and females the gap was
smallest in 1981 and highest in 2001. It is perhaps important to begin by
addressing the spikes below the line which have reduced the lifespan variation
gap. Most of these contributions occur across ages (ages which contribute to
mortality expansion) where the mortality rate was subject to smoothing (the
carrying forward of the proportion of causes from age 84 to ages ≥85 can be seen
in the graphs). However it demonstrates that the higher mortality rate amongst
the most deprived quintile was to their lifespan variation advantage because
they did not experience as much expansion as the least deprived quintile but
means that older age death rates are not improving as quickly as the least
deprived.
However it is differences in external causes of mortality across working adult
ages (ages that contribute to mortality compression) that provide much of the
explanation for the lifespan variation gap between the most and least deprived
quintile at every time point. This is particularly strong for males and the
external causes of death dominate the decomposition analysis in 2001 when the
lifespan variation gap was widest. Table 23 details the aggregate contributions
made to the lifespan variation gap between the most and least deprived by each
cause of death for males. Table 24 details the equivalent information for
females.

Chapter 8: Age and cause specific decomposition of lifespan variation inequalities
330
Table 23 Aggregate contributions to lifespan variation gap between most and least deprived quintile, by cause of death, Males
1981 1991 2001 2011
years % years % years % years %
External 0.55 55.05 0.71 46.43 1.64 65.26 1.26 69.50
Cancers 0.03 3.26 0.08 5.04 0.16 6.24 0.03 1.42
Circulatory 0.30 29.77 0.36 23.48 0.22 8.59 0.34 18.74
Respiratory -0.16 -15.86 -0.06 -3.76 -0.11 -4.43 -0.13 -7.35
Other 0.28 27.78 0.44 28.82 0.61 24.34 0.32 17.68
Total gap 1.01 100.00 1.53 100.00 2.52 100.00 1.81 100.00
Table 24 Aggregate contributions to lifespan variation gap between most and least deprived
quintile, by cause of death, Females
1981 1991 2001 2011
years % years % years % years %
External 0.24 23.94 0.38 31.82 0.55 38.61 0.53 50.45
Cancers 0.18 17.93 0.11 9.05 0.08 5.86 0.23 21.56
Circulatory 0.28 28.36 0.40 33.67 0.42 29.69 0.22 20.55
Respiratory 0.00 0.05 -0.03 -2.49 0.10 6.72 -0.08 -7.76
Other 0.29 29.72 0.33 27.95 0.27 19.12 0.16 15.21
Total gap 0.98 100.00 1.19 100.00 1.42 100.00 1.05 100.00

Chapter 8: Age and cause specific decomposition of lifespan variation inequalities
331
For males, higher mortality rates in external causes of death accounted for 55%
of the total lifespan variation gap in 1981. By 2011 external causes of death
accounted for 70% of the total lifespan variation gap. The percentage explained
by external deaths also increased for females: from 24% in 1981 to 50% in 2011.
Higher mortality rates from circulatory causes amongst the most deprived
compared to the least deprived have also added to the lifespan variation gap but
these contributions explain a smaller percentage of the gap than external causes
of death.
Although external causes of death are the main explanation for the lifespan
variation gap at each time point these may not account for the lifespan variation
gap when a shared level of life expectancy was achieved.
8.4.3 Lifespan variation gap at a similar level of life expectancy
Figure 62 plots life expectancy along the x axis and lifespan variation along the y
axis for all quintiles of socioeconomic deprivation. The analysis in this chapter
focuses on comparing the most deprived (red square) and least deprived quintile
(purple diamond) only. Given that life expectancy has increased for all
socioeconomic groups between each time period then it can be deduced from
the graphs that the lowest level of life expectancy relates to the first time point
(1981) and the highest life expectancy relates to the last time point (2011).

332
Males
Females
Figure 62 Trends in lifespan variation by trends in life expectancy, by sex and socioeconomic deprivation (Carstairs quintile)

Chapter 8: Age and cause specific decomposition of lifespan variation inequalities
333
At the same level of life expectancy, the least deprived quintile had lower
levels of lifespan variation. A finding of particular interest is that the highest
level of life expectancy achieved by the most deprived quintile in 2011 was
achieved by the least deprived in 1981. The fact that it is only possible to make
one comparison of the lifespan variation gap when a similar level of life
expectancy was achieved is in itself a point of concern. It is perhaps even more
surprising to find that the life expectancy achieved by the most deprived in 2011
was actually slightly higher (red square slightly further along the x axis) than the
life expectancy achieved by the least deprived in 1981 but that the most
deprived experienced this with higher inequality. This is particularly evident for
males (the gap on the y axis between the red square and the purple diamond is
much bigger than the gap for females).
Figure 63 compares the age distributions of death for the most deprived quintile
in 2011 with the age distribution of death for the least deprived quintile 1981:
the only two time points when the level of life expectancy was comparable. This
shows that the difference in the relationship between life expectancy and
lifespan variation is due to differences in the age distribution of mortality.

334
Males
Females
Figure 63 Age distribution of death at shared level of life expectancy, by sex and socioeconomic deprivation (Carstairs quintile)

Chapter 8: Age and cause specific decomposition of lifespan variation inequalities
335
For males and females the age distribution for the most deprived quintile in
2011 is shifted further along older ages, indicating a gross shift of the
distribution. However the proportion of deaths under the left hand tail of the
distribution is higher for the most deprived quintile in 2011 than the least
deprived quintile in 1981. This is much more apparent for males than for
females. For males the gap between the red line and the purple line across the
left hand tail of the distribution is much wider. A stronger message to take from
this is the fact that the proportion of premature adult deaths amongst the most
deprived quintile in 2011 was higher than the proportion of premature adult
deaths in the least deprived quintile 30 years earlier. The gap between the red
line and the purple line for females is much smaller across the left hand tail
than the gap for males but there is still a gap. Figure 64 reports the age and
cause specific decomposition of the lifespan variation gap between the most and
least deprived quintile when life expectancy was similar.
Spikes above the zero line reflect the ages at which the difference in mortality
between the most and least deprived, when life expectancy was comparable,
added to the lifespan variation gap. Spikes below the zero line reflect the ages
at which the difference in mortality rates, when life expectancy was similar,
reduced the lifespan variation gap between the most and least deprived. Each
spike reflects the cumulative total of the contributions made by each cause of
death at that single year of age. If there was no difference in the age specific
mortality rates there would be no spikes indicating there is zero difference
between the most and least deprived quintile across every age (Seaman et al.,
2016b).

336
Males
Females
Figure 64 Age and cause specific contributions to lifespan variation gap at shared level of life expectancy, by sex and socioeconomic deprivation (Carstairs quintile)

Chapter 8: Age and cause specific decomposition of lifespan variation inequalities
337
It is important to state that the contributions from older ages should be
interpreted with caution as these were subject to smoothing (the carrying
forward of the proportion of causes from age 84 to ages ≥85 can be seen in the
graphs). This is important to consider when discussing the contributions from
circulatory diseases (purple contributions). These contributions are above and
below the zero line at different ages. Lower mortality rates from circulatory
diseases between ages 50 and 70 years old compressed the age distribution of
death for the most deprived. Lower mortality rates from circulatory diseases
experienced by the most deprived quintile in 2011 that occurred across ages
>70 expanded the age distribution of death. These findings strongly suggest
that the most deprived experienced a temporal advantage in terms of lower
mortality rates from circulatory diseases reflecting the health care advances
made during the time period being studied (van Raalte et al., 2014, Vallin and
Meslé, 2004). However this does little to explain the lifespan variation gap, at a
similar level of life expectancy, because these lower mortality rates occurred
across ages that both add to and reduce the lifespan variation gap.
The higher lifespan variation experienced by the most deprived quintile
compared to the least deprived quintile, despite a shared level of life
expectancy, was largely explained by differences in external causes of death
across working adult ages. This is particularly evident for males, and is
reflected by the fact that the lifespan variation gap is larger than for females
(1.07 years and 0.10 years respectively).

Chapter 8: Age and cause specific decomposition of lifespan variation inequalities
338
8.5 Discussion
8.5.1 Summary of results
The findings in this chapter were produced to provide a clearer interpretation
of the explanations for lifespan variation inequalities between socioeconomic
groups in Scotland between 1981 and 2011. Differences in mortality rates from
circulatory diseases between socioeconomic groups were evident. However
these deaths largely occurred across ages of death that contributed to both
mortality expansion and mortality compression meaning they did little to
explain socioeconomic inequalities in lifespan variation. External causes of
death across working adult ages explain most of the lifespan variation
inequalities in Scotland. This finding was not unexpected considering the
evidence in chapter 5 and chapter 6 of this thesis, demonstrating the impact
premature deaths have had on lifespan variation at the population level, and
the substantial body of work that has focused on premature deaths from
external causes in Scotland (Schofield et al., 2016, Leyland, 2004, Norman et
al., 2011). Yet this age and cause-specific pattern of mortality is
counterintuitive: these deaths are more likely to be amenable to the social
determinants of health and should be less costly to reduce than deaths at older
ages associated with medical and health care advanced (Nau and Firebaugh,
2012, Vallin and Meslé, 2004). This is in addition to the fact that deaths at
these ages fundamentally represent a large loss of potential years of life.
8.5.2 Explanations for premature mortality in Scotland
The reasons causing these deaths are complex and a number of theoretical
explanations have been put forward to account for them (Mackenbach, 2012,

Chapter 8: Age and cause specific decomposition of lifespan variation inequalities
339
Lynch et al., 2001, Marmot, 2001). Particular attention has been paid to the
theories most likely to apply to Scotland. Emphasis has been placed on the
upstream, structural explanations for health inequalities and the potential for
social policies to escalate or mitigate risks associated with premature death
(McCartney et al., 2012a, Walsh et al., 2016, Schofield et al., 2016).
Unfortunately no definitive conclusions can be drawn from the analysis in this
chapter about which types of theories may best explain mortality inequalities
in Scotland. However the analyses chose to draw upon the theories that were
summarised in relation to three lifespan variation scenarios (van Raalte et al.,
2014) and aimed to evaluate if one of these scenarios would adequately
describe the empirical findings for lifespan variation inequalities in Scotland.
The scenarios proposed by van Raalte et al. (2014) aimed to assess whether the
following theories might account for lifespan variation inequalities: health
behaviours, social polarisation and psychosocial mechanisms, selection effects,
or fundamental causes. Although the theoretical interpretations of each
scenario are open to debate they are important for highlighting that the ages
and causes of death that have the greatest impact in terms of inequality may
be distinct from the ages and causes of death that have the greatest impact in
terms of average population health. Both of these issues should be considered
by governments when choosing public health strategies (Smits and Monden,
2009).
A diffusion scenario would be characterised by fluctuating socioeconomic
inequalities in lifespan variation: the least deprived would gain from health
improvements first causing the gap to widen before knowledge was diffused to

Chapter 8: Age and cause specific decomposition of lifespan variation inequalities
340
the most deprived causing the gap to narrow. It was hypothesised that this
scenario would suggest that health behaviours were the dominant mechanism
driving the persistence of inequalities in mortality.
A diverging scenario would be characterised by widening socioeconomic
inequalities in lifespan variation. If the empirical evidence reflected this
scenario it was hypothesised that explanations focused on the impact of social
polarisation on psychosocial mechanism were perhaps most appropriate for
explaining inequalities in the age and cause-specific patterns of death. It may
also indicate that socioeconomic groups are becoming increasingly homogenous
in terms of health if there are social sorting processes at play.
The final scenario proposed that lifespan variation inequalities may remain
constant over time because the most deprived are always positioned to negate
risk of premature death, irrespective of changes to the mortality risk profile.
This would suggest that a fundamental causes hypothesis would be a strong
theoretical framework.
The findings in this chapter indicate that a fluctuating scenario may not
adequately account for socioeconomic inequalities in lifespan variation in
Scotland: not all socioeconomic groups experienced a decrease in lifespan
variation. Instead it is suggested that the relationship between average
population and total inequality differs depending on socioeconomic deprivation
which would be more likely under a diverging or stalling scenario.
A diverging scenario described by van Raalte et al. (2014) is somewhat
reflected in the empirical findings for Scotland. An increasing lifespan variation
trend was found for the most deprived and a decreasing trend found for the

Chapter 8: Age and cause specific decomposition of lifespan variation inequalities
341
least deprived. This resulted in a widening cross-sectional gap over time
although there were some recent improvements in 2011.
A diverging scenario fits well with the upstream explanations that have
previously been put forward for mortality inequalities in Scotland (McCartney
et al., 2012b, Walsh et al., 2016). These explanations recognise the link
between widening mortality inequalities in Scotland and the consequences
these have for its public health standing within Western Europe (Walsh et al.,
2016, McCartney et al., 2012b, McCartney et al., 2012a). However, it is
important to recognise that each scenario is open to interpretation and a more
detailed interpretation would have been achieved if annual trend data have
been available. The research in this chapter was restricted to decennial data
which is not sufficient enough to draw any definitive conclusions. This
limitation was particularly problematic for making comparisons at shared levels
of life expectancy between the most and least deprived quintiles: only one
comparison was possible. Despite these limitations the international literature
also finds support for a diverging scenario (van Raalte et al., 2014).
8.5.3 Comparisons with existing studies
In Finland the most deprived group (as measured by occupation) experienced
stagnating lifespan variation and the least deprived decreasing lifespan
variation between 1971 and 2010. It is interesting to note that the increase in
lifespan variation was greater for the most deprived in Scotland than for the
most deprived in Finland. Unfortunately these two studies are not directly
comparable. The two studies utilised different socioeconomic indicators that
are derived from differing theoretical principles. Although both studies focused

Chapter 8: Age and cause specific decomposition of lifespan variation inequalities
342
on the same general time period the analysis in this chapter was only able to
report decennial lifespan variation estimates by socioeconomic deprivation.
This is because the Carstairs measure of area level socioeconomic deprivation
is derived from the decennial Census. The study in Finland was able to report
lifespan variation for every five years. Although the measure of occupational
based socioeconomic status was available annually, five years‘ worth of data
were aggregated to increase the statistical power of the lifetables. The
measure of occupation applied by van Raalte et al. (2014) only permitted the
reporting of lifespan variation conditional upon survival to age 31. This chapter
reported lifespan variation from age 0 which again means the studies are not
directly comparable.
8.5.4 Strengths and limitations
Reporting lifespan variation from age 0 corresponds to the reporting of life
expectancy from age 0. The decomposition methods used allowed the
contributions from deaths at every single year of age, up to an open ended
interval of 110+, to be estimated. It was also possible to report lifespan
variation from age 0 in the context of this thesis because the measure of
deprivation used was applicable to the whole population: it utilised an area
level measure of socioeconomic deprivation not an individual level of
occupational socioeconomic position. However it has been suggested that
studies interested in the social distribution mechanisms of adult mortality
should consider restricting analysis to ages 15+. This is because the causes of
death driving mortality change over time differ across ages. Infectious disease
and effective medical intervention historically reduced infant and childhood
deaths rapidly. Adult mortality is influenced by more complex mechanisms that

Chapter 8: Age and cause specific decomposition of lifespan variation inequalities
343
change slowly (Vallin and Meslé, 2004, Smits and Monden, 2009). Smits and
Monden (2009) support this perspective by stating that 80% of all deaths in 2000
(one of the most recent years for which they had data) occurred in ages 15+.
Both approaches are recognised throughout the literature however it is
important to critically reflect on the choices made throughout the research
process to ensure that results are interpreted appropriately. The contributions
made to lifespan variation inequalities from ages ≥85, for example, need to be
interpreted with caution as the cause specific mortality rates at these ages
were subject to a smoothing technique previously applied (van Raalte et al.,
2011). Smoothing was required as population estimates were only available up
to an open ended age interval of 85+ but the analysis required a mortality rate
up to age 110+. It was also a valid approach as deaths at these older ages tend
to be associated with multiple causes and it may not always be possible to
distinguish between them (van Raalte et al., 2014).
Despite these limitations the analysis in this chapter makes an important
research contribution by being the first to formally quantify the impact unequal
age and cause specific patterns of mortality, within socioeconomic groups,
have had on lifespan variation inequalities in Scotland.
Lifespan variation is interpreted as the average years of life lost per death in
the population. This has an intuitive public health meaning that may be more
accessible to interpret than traditional measures of mortality inequalities such
as risk ratios. It is also a measure which reflects the theoretical principle that
inequality in health is an inequality irrespective of its correlation with any

Chapter 8: Age and cause specific decomposition of lifespan variation inequalities
344
other dimension of social inequality (Murray et al., 1999, Gakidou and King,
2002, Tuljapurkar, 2010).
The lifespan variation estimates were calculated using the most robust and up-
to-date mortality and population data available. The research applied a
validated measure of socioeconomic deprivation that was derived specifically
for studying health inequalities and covered a significant period of time. The
substantial period of time covered is also an advantage with the existing
literature suggesting that this is when mortality inequalities in Scotland began
to diverge from its closest comparator countries (Campbell et al., 2013,
McCartney et al., 2012b).
8.6 Conclusion
This chapter identified that external causes of death, across premature adult
ages, account for increasing socioeconomic inequalities in lifespan variation in
Scotland. Scotland must reduce deaths at these ages in order to simultaneously
achieve increases in life expectancy and reductions in inequality.
This type of evidence is valuable for extending our understanding of why health
inequalities have widened in most Western European countries, not only
Scotland. This is despite the fact that most of these countries have long
established welfare states and formal commitments to tackling inequality
(Bambra, 2011a, The Scottish Government, 2008, Mackenbach, 2012). However
the underlying causes of premature death are complex.
The results reported in this thesis, culminating in this chapter, strongly
supports the types of theoretical explanations that recognise the impact
relative deprivation has for distributing the risk of premature death. It is

Chapter 8: Age and cause specific decomposition of lifespan variation inequalities
345
argued that countries less successful at reducing these risks are those which
place less value on the role of social protection policies: policies which at the
very least are designed to protect the most vulnerable members of society and
at the very most may minimise the negative consequences of relative
deprivation that entire populations are exposed to (Wilkinson and Pickett,
2006).
In pragmatic terms social protection policies could be adopted to redistribute
the structural determinants of inequality such as income, wealth, employment
and housing. Targeting the structural determinants could minimise material
and psychosocial inequalities that stem from increasing relative deprivation
and ultimately ensure that all members of society are able to mitigate the
social and economic risks associated with an untimely death. However, this is
still fundamentally a theoretical problem: this thesis has demonstrated that the
concept of inequality is contested and how its structural determinants are
interpreted is an inherently political and ideological issue.

346
9 Discussion and conclusion
Chapter 9 concludes this thesis by building upon the discussion sections of each
of the analysis chapters. It has four sections and a final conclusion. The first
section revisits the concept of total inequality and the motivation for measuring
lifespan variation in Scotland. The second section summarises the main empirical
findings from the quantitative analyses carried out and relates these to some
existing, international studies of lifespan variation and the explanations put
forward for Scotland‘s premature mortality problem and steep inequalities. The
third section critically evaluates the strengths and limitations of this thesis in
terms of data used and the analysis methods applied. The fourth section
highlights some future research directions by discussing the potential for
incorporating subjective (self-assessed) data on health into empirical measures
of total inequality.
9.1 Novelty of measuring lifespan variation
This thesis measured, analysed and described lifespan variation in Scotland.
Lifespan variation is a novel measurement of mortality inequality that reflects
the concept of total inequality. Total inequality proposes that the distribution of
health should be considered a primary outcome variable in itself, much like the
distribution of income is in economics (Tuljapurkar, 2010). In economics it is
accepted that similar averages can be achieved with very different distributions.
Therefore income studies routinely measure the distribution of income across
individuals (Murray et al., 1999). The distribution of income is also important for
population health and health inequalities. It could be assumed that increasing

Chapter 9: Discussion and conclusion
347
average incomes would have been enough to reduce the mortality gradient.
However, mounting evidence suggests that it is the distribution of income
(relative deprivation) that is more important for population health and the
mortality gradient: the more egalitarian the distribution of income the higher
life expectancy tends to be (Wilkinson, 1989, Marmot and Wilkinson, 2001, Le
Grand, 1987).
Despite this evidence, traditional approaches for measuring health inequalities
have tended to only focus on average health and measure the extent of
inequalities in terms of the difference in average between populations (either
between countries or between socioeconomic groups within countries). This
approach cannot ascertain whether a homogenous gain in health has been
achieved for everyone within the same country or within the same
socioeconomic group, or whether health inequalities between individuals within
the same country or socioeconomic group have stayed constant over time
(Murray et al., 2002, Gakidou and King, 2002, Le Grand, 1987). Focusing on the
distribution of health also allows elements of the total amount of variance in
population health to be distinguished: not all elements of total health variance
will be related to socioeconomic deprivation but being able to better measure
the elements that are is valuable (Le Grand, 1987, Wilkinson, 1989). The
distribution of health is therefore an important dimension of inequality to
capture.
Lifespan variation measures the age distribution of death: higher lifespan
variation equates to greater variation and higher inequality in age at death
between individuals within a population. International studies have

Chapter 9: Discussion and conclusion
348
demonstrated the value lifespan variation has for providing insight into the
changing nature of health inequalities: countries with the highest level of life
expectancy tend to experience the lowest level of lifespan variation (Vaupel et
al., 2011). Further studies have found that the most deprived socioeconomic
groups experience a double burden of mortality inequality. In addition to having
the shortest life expectancy they experience the greatest amount of inequality
in age at death. This is in contrast to the least deprived socioeconomic group
who experience the highest life expectancy and lowest level of inequality in age
at death (van Raalte et al., 2014, van Raalte et al., 2011). This burgeoning body
of evidence suggests that reducing inequality should be seen as beneficial for
improving average health (Wilkinson, 2005) and increasing average health and
reducing inequality are not incompatible public health aims. These are issues
that have direct relevance when studying mortality inequalities in Scotland: it
has experienced the slowest improvements in life expectancy in Western Europe
and widening mortality inequalities between socioeconomic groups (Leyland et
al., 2007b, McCartney et al., 2012b). Although mortality inequalities in Scotland
have been the focus of much research attention total inequality, using lifespan
variation, has rarely been measured. This is despite the fact that long running
data, suitable for estimating lifespan variation are available. It was this research
gap that this thesis has contributed to filling.
Most of the theories put forward for poorer average health and higher mortality
in Scotland have emphasised socioeconomic deprivation and increasing relative
inequality (McCartney et al., 2012a, Walsh et al., 2016): these are widely
considered to be the most significant determinants of health, and ultimately
death, across economically developed countries (Mackenbach and Bakker, 2003,

Chapter 9: Discussion and conclusion
349
Bambra, 2013, Beckfield and Krieger, 2009). van Raalte et al. (2014) and (Smits
and Monden, 2009) effectively demonstrated that lifespan variation is a useful
tool for critically evaluating existing theoretical explanations for persisting
health inequalities in economically developed countries. This thesis has
demonstrated that measuring lifespan variation can help to better understand
the full extent of mortality inequalities in Scotland and has used lifespan
variation to aid the critical interpretation of the reasons for Scotland‘s poor
population health standing within Western Europe.
9.2 Summary of main findings
The aim of this thesis was conveyed in the following twelve research questions:
Chapter 4
1. Has Scotland‘s lifespan variation ranking within Western Europe changed
over time?
2. Was the timing and relative rate of lifespan variation change in Scotland
comparable with any other Western European country?
Chapter 5
3. Which ages of death contributed to the lifespan variation trend in
Scotland?
4. Did the ages of death contributing to the lifespan variation trend in
Scotland differ from the ages of death contributing to the lifespan
variation trend in England and Wales?
Chapter 6

Chapter 9: Discussion and conclusion
350
5. Was lifespan variation higher or lower in Scotland at a shared level of life
expectancy with England and Wales?
6. Which ages of death account for the lifespan variation gap between
Scotland and England and Wales at a shared level of life expectancy?
Chapter 7
7. Is there a socioeconomic gradient for lifespan variation in Scotland?
8. Has the socioeconomic gradient for lifespan variation in Scotland changed
over time?
9. Are changes to the socioeconomic gradient for lifespan variation in
Scotland related to Scotland‘s deteriorating lifespan variation ranking
within Western Europe over time?
Chapter 8
10. Which ages and causes of death contributed to changes in lifespan
variation, over time, for different socioeconomic groups in Scotland?
11. Which ages and causes of death contributed to the lifespan variation gap
between the most and least deprived socioeconomic groups in Scotland?
12. Which ages and causes of death contributed to the lifespan variation gap
between the most and least deprived socioeconomic groups, when life
expectancy was similar, in Scotland?
Figure 65 summarises the findings of this thesis in relation to the relevant
chapters, the data utilised, and the analysis carried out. Chapter 4 through 6
utilised data from the HMD for the population of Scotland to estimate lifespan

Chapter 9: Discussion and conclusion
351
variation. Chapter 7 and 8 utilised Census population estimates, vital events
data and the Carstairs score of area level deprivation to construct deprivation
specific lifetables, from which lifespan variation was estimated.

352
Measurement and Analysis
Data
Chapter 5: Quantify ages of death driving lifespan
variation trend
Chapter 4: Describe the population level lifespan
variation trend
Chapter 6: Quantify ages of death driving lifespan variation gap at shared
level of life expectancy
Chapter 7: Evaluate changes to socioeconomic gradient
for lifespan variation
Chapter 8: Quantify ages and causes of death driving socioeconomic inequalities in lifespan variation
Rese
arc
h a
ims
Human Mortality Database life
tables (1950-2011
Joinpoint
regression
Age-specific decomposition of population level lifespan
variation
Constru
ct life
table
s stratifie
d b
y
socio
econom
ic d
epriv
atio
n
Age and cause specific
decomposition of lifespan
variation by socioeconomic
deprivation
Scotland experiences highest e† (males and females) and longest, sustained increasing trend
(males) in Western Europe
e† gap at shared life expectancy explained by higher working adult age mortality in Scotland
relative to Eng. & Wales, despite arriving at life
expectancy 10 years later
e† decreased for least deprived but increased for most deprived causing socioeconomic
gradient to steepen over time: some recent improvement in 2011 but gradient still steeper
than 1981
By 2001 40% of the population experienced higher e† than population average
Steepening gradient corresponds to timing of Scotland‘s deteriorating ranking within Western
Europe
Differences in premature mortality rates from external causes of death explain an increasing
proportion of socioeconomic inequalities in lifespan variation in Scotland
Sum
mary
of fin
din
gs
Calc
ula
te life
span v
aria
tion (e
†) NRS death counts
Census population estimates
(commissioned)
Carstairs score
Monte-Carlo
simulations
Slope Index and Relative
index of
inequality
Mortality change over time differed between Scotland and Eng. & Wales across working adult
ages, accounting for divergence in e† trends
Figure 65 Summary of research stages

Chapter 9: Discussion and conclusion
353
9.2.1 Scotland’s lifespan variation trend within Western Europe
Chapter 4 demonstrated that Scotland is in the unenviable position of ranking
highest in terms of inequality in age at death in Western Europe. This was the
case for both males and females. Lifespan variation for females in Scotland
consistently decreased following 1950 but the trend demonstrated one of the
greatest reductions in the rate of change. This meant that lifespan variation for
females in Scotland has not converged with the lifespan variation for females in
most other Western European countries.
The results of the lifespan variation trend for males in Scotland were of further
concern. The trend diverged from decreasing lifespan variation to increasing
lifespan variation during the 1980s, the longest, sustained increasing trend found
in any of the Western European countries included in the analysis. These results
were not unexpected, considering that literature review reported the strong
correlation between life expectancy and lifespan variation (Vaupel et al., 2011,
Smits and Monden, 2009) and that relative rate of improvement in life
expectancy in Scotland has faltered since the 1980s (McCartney et al., 2012b).
The timing of Scotland‘s deteriorating lifespan variation ranking, relative to
comparable countries, was previously presented by Popham and Boyle (2010).
They estimated lifespan variation for each decade, beginning in 1950. Chapter 4
of this thesis was able to utilise more up-to-date data than Popham and Boyle
(2010) and formally analysed (joinpoint regression) the trend data but the
substantive conclusions reported are consistent.

Chapter 9: Discussion and conclusion
354
9.2.2 Age specific mortality change over time in Scotland distinguishable
from age specific mortality change in England and Wales
Differences in lifespan variation between countries are generally found to be
explained by differences in younger working age mortality rates. This finding has
been replicated across many international studies (Gillespie et al., 2014,
Shkolnikov et al., 2011, Vaupel et al., 2011). It has also been replicated in this
thesis beginning in chapter 5, which aimed to establish if the age specific
mortality change over time in Scotland differed from the age specific mortality
change over time in England and Wales. England and Wales are valuable
comparator countries to use for studying Scotland: they are geographical
neighbours, share social, political and economic contexts and a national
government. The findings in chapter 5 were consistent with previous cross
national studies of the age specific mortality changes driving differences in
lifespan variation: mortality change across working adult ages in Scotland was
distinguishable from that in England and Wales, causing Scotland to experience
higher lifespan variation and a diverging trend. This adds to the body of
evidence which has suggested Scotland has a premature mortality problem
(Campbell et al., 2013, Leyland, 2004, Norman et al., 2011).
9.2.3 Increasing inequality in age at death at shared levels of life expectancy
It is hypothesised that cross national differences in the age distribution of death
could be underpinned by differences in stages of the epidemiological transition
(Nau and Firebaugh, 2012, Smits and Monden, 2009). This was the impetus for
the analysis in chapter 6 of this thesis. The theory of epidemiologic transition
focuses on the changing patterns of health, disease and mortality and the
associated demographic, economic and sociological changes. It also proposes

Chapter 9: Discussion and conclusion
355
that disease intervention programmes may be a determining factor for fertility
change and for socioeconomic progression (Omran, 1971). The fact that stages of
epidemiological transition started at different points in time, for different
countries, (e.g. the smoking epidemic (Mackenbach et al., 2008)) or population
interventions introduced to control risk factors for cardiovascular disease (Vallin
and Meslé, 2004)) prompted the suggestion that it would be more appropriate
for cross national comparative studies of health to control for epidemiological
time as opposed to calendar time (Mackenbach et al., 1997, Smits and Monden,
2009).
Previous studies have attempted to control for epidemiological time by
comparing differences in lifespan variation, and the underlying age distributions
of death, at shared levels of average population health (life expectancy) (Smits
and Monden, 2009, Seaman et al., 2016b). Three possible scenarios were
subsequently presented for describing lifespan variation inequalities between
comparable countries at shared levels of life expectancy.
Firstly, the forerunner hypothesis proposed that countries leading the way in
terms of life expectancy would have done so by reducing deaths across ages that
lead to mortality compression and countries arriving at the same life expectancy
later in time would only be able to do so with a very similar level of lifespan
variation. Secondly, the diffusion hypothesis suggested that countries arriving at
a high level of life expectancy later in time would do so with lower lifespan
variation because they are able to capitalise on the lessons already learnt from
forerunner countries. Thirdly, this thesis added the laggard hypothesis which
proposed the opposite: countries arriving at a high level of life expectancy later

Chapter 9: Discussion and conclusion
356
in time would do so with higher lifespan variation because they have benefited
from interventions that increase life expectancy but contribute to mortality
expansion (e.g. reducing deaths around the ages where the greatest proportion
die (Vaupel, 1986)) but have not capitalised on the interventions required to
reduce inequalities.
International studies have suggested that most countries arriving to a high level
of life expectancy do so with very similar or lower lifespan variation that the
countries preceding them: only a few countries do so with higher lifespan
variation. The analysis in chapter 6 controlled for epidemiological time in order
to establish which scenario may best describe Scotland relative to England and
Wales. Scotland achieved the same high level of life expectancy as England and
Wales, later in time, with lower inequality. However following the 1980s
Scotland lost any lifespan variation advantage: it was achieving the same high
level of life expectancy as England and Wales, later in time, with higher
inequality. This was explained by the fact that Scotland was experiencing higher
premature mortality rates across working adult ages than England and Wales
despite arriving at a comparable level of life expectancy up to ten years later.
Lifespan variation differences between countries, despite controlling for average
population health (e.g. stage of the epidemiological transition), are thought to
reflect differences in terms of a country‘s capacity to replicate outside
practices or to capitalise on earlier innovations for mortality reduction (Vallin
and Meslé, 2004, Nau and Firebaugh, 2012). Historically rapid reductions in
mortality rates at infancy and childhood have been achieved: these are ages of
death that simultaneously improve average population health and reduce

Chapter 9: Discussion and conclusion
357
inequality. Deaths at these ages were also highly responsive to changes to the
social determinants of health in Western Europe (e.g. sanitation, housing,
education, welfare) and represented the most years of life expectancy to be
gained (Oeppen, 2008). However as countries transition through stages of
mortality development potential life expectancy gains from younger ages
diminish and a single, older modal age at death emerges (Gillespie et al., 2014).
This also means that the spread of ages of death considered to be premature
expands to include working adult ages (Zhang and Vaupel, 2009, Oeppen, 2008).
Reducing deaths at premature ages no longer represents the most gains in terms
of population level life expectancy but they are still the only means of reducing
inequality (mortality compression): even though each individual death at an
older age loses fewer years of expected life than a death at a younger age, the
total loss of years from deaths at older ages will be greater because a larger
proportion of the population now dies at these ages than premature ages
(Vaupel, 1986, Oeppen, 2008, Gillespie et al., 2014). A simplified summary
suggests that averting deaths at older ages may be more likely to be associated
with costly medical interventions or the lagged effects of social determinants of
health at earlier stages of the life course (Nau and Firebaugh, 2012). Of course
medical interventions and social determinants are not mutually exclusive
processes and both can help to avert deaths at any age. However, populations
risk increasing lifespan variation if they only focus on achieving steady declines
at older ages via medical interventions without continuing to tackle deaths at
premature ages via the social determinants of health. Therefore the laggard
phenomena, as demonstrated for Scotland, could be considered counter
intuitive.

Chapter 9: Discussion and conclusion
358
9.2.4 Increasing socioeconomic gradient for lifespan variation associated
with Scotland’s deteriorating ranking within Western Europe
It is hypothesised that Scotland‘s higher premature mortality rates, and
subsequent higher lifespan variation, relative to England and Wales may be
associated with socioeconomic deprivation (Schofield et al., 2016, Scott et al.,
2013, McCartney et al., 2013). The findings in chapter 7 and chapter 8 were
produced to increase our understanding of the impact socioeconomic deprivation
has for higher lifespan variation in Scotland within the context of Western
Europe.
Lifespan expectancy inequalities in Scotland are known to have increased over
time, in both absolute and relative terms. This was also the case when
measuring lifespan variation. Despite there being some improvement in the
socioeconomic gradient for lifespan variation between 2001 and 2011 it was still
steeper in 2011 than it had been in 1981. The steepening of the socioeconomic
gradient was associated with Scotland‘s deteriorating ranking within the Western
Europe.
Traditionally life expectancy or age standardised mortality have been used to
evaluate the impact socioeconomic deprivation has on mortality (Mackenbach et
al., 2003, Munoz-Arroyo and Sutton, 2007, Murray et al., 2002, Mackenbach and
Kunst, 1997). It has now been well established that the most socioeconomically
deprived groups have the shortest average life expectancy and the highest age-
standardised mortality rates. International studies, measuring lifespan variation,
have demonstrated that there is a further dimension of socioeconomic inequality
to consider: the most deprived socioeconomic groups also experience the

Chapter 9: Discussion and conclusion
359
greatest amount of inequality in age at death. Some of these studies conclude
that countries with steeper socioeconomic gradients for average health
measured have lower average population health, indicating that inequality is
detrimental for everyone (Wilkinson and Pickett, 2006, Vaupel et al., 2011).
Chapter 7 provided further support for this conclusion.
9.2.5 Ages and causes of death accounting for increasing socioeconomic
inequalities in lifespan variation within Scotland
Distinct age and cause specific patterns of mortality can allude to the types of
social and aetiological processes that may be causing inequalities in lifespan
variation in Scotland to widen over time (van Raalte et al., 2015, van Raalte et
al., 2014). The findings in chapter 8 illustrated differences in mortality rates
from circulatory diseases between socioeconomic groups. The least deprived
experienced lower mortality rates from circulatory diseases and the most
deprived experienced higher mortality rates from circulatory diseases. However
this cause specific pattern of mortality occurred across ages of death that
contributed to both mortality expansion (older ages) and mortality compression
(working adult ages) meaning they tended to counter balance one another and
did little to explain socioeconomic inequalities in lifespan variation. Higher
premature mortality rates from external causes of death for the most deprived
group occurred across younger ages which prevented mortality compression. This
age and cause specific pattern of mortality explained an increasing proportion of
lifespan variation inequalities in Scotland over time.
This finding demonstrates the emergence of ―newer‖ causes of death (Leyland
et al., 2007b) and suggests socioeconomic inequalities in mortality persist

Chapter 9: Discussion and conclusion
360
despite the nature and risk factors for mortality changing over time (Phelan et
al., 2010, Link and Phelan, 1995). van Raalte et al. (2014) described three
lifespan variation scenarios that may occur and outlined which theories of health
inequalities these might provide support for.
Firstly, the fluctuating scenario hypothesised that the socioeconomic gap in
lifespan variation between the most and least deprived groups could change
between periods of narrowing to periods of widening, but the lifespan variation
gap at shared levels of life expectancy would be minimal. This scenario could be
interpreted as support for either a health behaviours explanation or a
fundamental causes‘ explanation (Link and Phelan, 1995, Phelan et al., 2010).
Over time the knowledge and motivation for health behaviours could be diffused
to lower socioeconomic groups. However, the gap would widen during periods of
rapid health improvement as the least deprived adopt new health behaviours for
reducing premature mortality and narrow once the behaviour diffuses to the
most deprived. This explanation has been heavily criticised and does not seem to
account for lifespan variation inequalities: smoking, the most detrimental of
health behaviours, was unable to account for socioeconomic differences in
lifespan variation (van Raalte et al., 2015).
An alternative explanation for a fluctuating scenario would be the fundamental
causes‘ theory. This hypothesises that a socioeconomic gradient for health is
always present regardless of the disease profile of the population (Link and
Phelan, 1995, Phelan et al., 2010). This is not because of inequalities in the
distribution of health behaviours but because socioeconomic status embodies the
types of resources (so called fundamental causes) that impact health: money,

Chapter 9: Discussion and conclusion
361
power, prestige, and knowledge. Fundamental causes are always relevant for
protecting health but the socioeconomic gradient may fluctuate from narrowing
to widening as the disease profile changes or a new intervention is implemented
allowing for fundamental resources to be utilised (Scott et al., 2013).
Secondly, the diverging scenario suggested that the least deprived may
experience mortality compression but the most deprived would not, causing the
lifespan variation gap to widen over time and to widen at shared levels of life
expectancy. This scenario could be due to the consequence of increasing income
inequalities, the decline of heavy industries and the rise in precarious
employment, all of which have had a disproportionate impact on the most
deprived socioeconomic groups (Bambra, 2010, Dorling, 2009). This could have
impacted the psychosocial responses that are hypothesised to be important for
avoiding premature death causing a lack of compression in the most deprived
group only (Marmot and Wilkinson, 2001, Wilkinson and Pickett, 2006).
Another interpretation of a divergence scenario is that it would support a health
selection explanation, either in terms of ill health causing downward mobility or
in terms of a meritocracy increasing upward mobility for individuals with
favourable health characteristics. If either of these mechanisms were active
then socioeconomic groups would be expected to become more homogenous in
terms of health, causing trends to diverge.
Thirdly, the stalling scenario hypothesised that the absolute lifespan variation
gap between socioeconomic groups could remain constant over time because the
least deprived socioeconomic group are always able to maintain a health
advantage regardless of the types of mortality risk that the population is

Chapter 9: Discussion and conclusion
362
exposed to. Again this would provide evidence for a fundamental causes
explanation: the most deprived are able to exploit the material, psychosocial
and knowledge resources that are most important for health (Link and Phelan,
1995, Phelan et al., 2010).
The trends identified in chapter 7 showed that the lifespan variation gap
widened between 1981 and 2001 but showed signs of narrowing in 2011. This
feature was described in the fluctuating scenario proposed by van Raalte et al.
(2014). In Scotland the most deprived experienced higher lifespan variation
when achieving a comparable level of life expectancy as the least deprived,
despite reaching this level of life expectancy 30 years later. This was a feature
described in the diverging scenario but not in the fluctuating scenario. It was
suggested that a fluctuating scenario could be interpreted as evidence for the
fundamental causes‘ theory to explain increasing mortality inequalities, while a
diverging scenario could be interpreted as evidence for increasing income
inequalities to account for increasing mortality inequality.
9.2.6 Explanations for Scotland’s premature mortality problem
Fundamental causes‘ theory and increasing income inequalities are plausible
explanations for Scotland‘s premature mortality problem, which this thesis has
demonstrated caused it to experience the highest level of lifespan variation in
Western Europe and widening lifespan variation inequalities between
socioeconomic groups. Both of these explanations have been considered in the
existing literature measuring population health and inequality in Scotland in
terms of average health status (Scott et al., 2013, Walsh et al., 2010, McCartney
et al., 2012a).

Chapter 9: Discussion and conclusion
363
Scott et al. (2013) explicitly set out to test the applicability of the fundamental
causes‘ theory to Scotland. Their findings show support for this explanation
because the socioeconomic gradient for suicide, alcohol related and HIV deaths
has increased over time but there is no clear socioeconomic gradient for non-
preventable causes of death. Phelan and Link (2005) hypothesised that this
would be the case: the most advantaged socioeconomic groups would be able to
operationalise their resources most effectively in relation to reducing
preventable causes of death causing the socioeconomic gap to widen. Access to
fundamental resources would be of little benefit in relation to causes of death
that were not yet fully understood and there would be limited differences
between socioeconomic groups.
Walsh et al. (2010) set out to identify if high relative deprivation, poverty and
adverse health in Scotland were associated with its exposure to
deindustrialisation. The process of deindustrialisation disproportionately
impacted the most deprived areas in the Britain (Dorling et al., 2007) with some
of the worst affected areas being concentrated within the West Central region of
Scotland (Hanlon et al., 2006, Graham et al., 2012). Between 1971 and 2005 this
area of Scotland lost 62% of industrial employment, one of the most severe
losses out of 10 areas across Europe, and a subsequent slowing in the rate of life
expectancy improvement (Walsh et al., 2010). It is hypothesised that increased
alienation, anxiety and reduced control are psychosocial mechanisms which link
deindustrialisation, higher relative deprivation and risk of premature death
(Marmot and Wilkinson, 2001, McCartney, 2012, Wilkinson, 1997, Aldabe et al.,
2011).

Chapter 9: Discussion and conclusion
364
The potential for psychosocial mechanisms to link structural change and account
for increasing mortality inequalities is plausible but contested. Lynch et al.
(2000) argue that psychosocial interpretations are vulnerable to de-
contextualization and risk being associated with regressive political agendas. It
is assumed that psychosocial mechanisms focus on perceptions of inequality that
may not be amenable to intervention, rather than objective material
experiences that are structurally determined. Marmot and Wilkinson (2001)
dispute this: social structure and relative deprivation have profound psychosocial
impacts and to deny this burdens the responsibility for depression, anxiety and
insecurity with individuals. This argument is supported by the finding that some
societies have been able to minimise the impact structural changes have on
mortality by providing an adequate safety net during times of social or economic
uncertainty, which minimises the negative effects of psychosocial health
(Bambra, 2009). This suggests that increased adverse health outcomes
experienced in Scotland are not simply an inevitable outcome of
deindustrialisation and increasing income inequality but are the consequence of
a society‘s failure to manage and mitigate these processes (McCartney et al.,
2012b).
It is important to note that this thesis cannot provide any insight into
explanations for the so called ‗Scottish effect‘: the inability for area level social
deprivation to account for Scotland‘s excess mortality relative to England and
Wales (Popham and Boyle, 2011, Hanlon et al., 2005, Schofield et al., 2016,
Shelton, 2009). This thesis does not compare Scotland with England and Wales
while controlling for socioeconomic deprivation but it acknowledges that the
questions this body of research has raised are important. Similar to studies

Chapter 9: Discussion and conclusion
365
explicitly concerned with the ‗Scottish effect‘ this thesis draws attention to
Scotland‘s premature mortality problem. Similar to the ‗Scottish effect‘
literature, this thesis recognises that the determinants of population health are
too complex to be accounted for by one single theory. However, this thesis does
support the explanations that seeks to understand differences in Scotland, in
terms of structural changes, that could explain the aetiological pathways leading
to the higher risk of premature death that the population experiences
(McCartney et al., 2012a, Walsh et al., 2010). Although it is a weakness that no
definitive conclusions can be drawn from this thesis there are a number of
strengths worthy of highlighting.
9.3 Strengths and limitations
The findings presented in this thesis provide new insights into the full extent,
and changing nature, of mortality inequalities in Scotland by estimating and
decomposing lifespan variation. The data used and analyses applied were
appropriate for answering the relevant research questions: different research
questions may have demanded different data and analyses.
9.3.1 Lifespan variation estimates from complete period life tables
Lifespan variation estimates in this thesis were calculated from complete period
life tables. A lifetable provides a wealth of information about the mortality
experience of the given population making it a vital tool for carrying out
research (Wunsch et al., 2013). The population included in a period life table
can be understood as a synthetic or hypothetical population because it models
what would happen to a population if a given set of mortality conditions were
experienced (Wunsch et al., 2013, Preston et al., 2001). The use of complete
Chapter 9: Discussion and conclusion
366
life tables (e.g. single year of age) in this thesis is a major strength: they are a
more precise representation of the mortality experience of interest than
abridged life tables (Preston et al., 2001).
Lifespan variation in this thesis was reported from age zero. However, it has
been argued that health inequalities in developed countries may be better
reflected when reporting lifespan variation from adult ages only as infant deaths
are now rarer than in the past (Smits and Monden, 2009). Existing studies have
therefore reported lifespan variation conditional upon survival to older ages
when stratifying the population by education or occupation (van Raalte et al.,
2012, van Raalte et al., 2014). It is only possible to report lifespan variation
conditional upon survival to adulthood when using occupation or education to
measure socioeconomic deprivation because information on completed years of
education or achieved occupation is required. However it does mean that there
is something of a trade-off between capturing the full age distribution of
mortality and applying a measure of socioeconomic deprivation. It is also a
departure from the standard reporting of life expectancy from age 0 which is
used to make international comparisons (World Health Organization, 2010).
This thesis utilised an area level measure of socioeconomic deprivation which
allows the full age distribution of death to be captured and enables the
reporting of lifespan variation from age 0 which is consistent with the reporting
of the more commonly understood concept of life expectancy. It was also
appropriate within the context of Scotland as premature mortality rates for
males age 15-29 years old increased between 1981 and 2001 (Leyland et al.,
2007a). This age pattern of mortality that would have been truncated out of the

Chapter 9: Discussion and conclusion
367
results had measures of occupation or education been applied and lifespan
variation conditional upon survival to adulthood reported.
9.3.2 Routine data
The secondary data utilised for estimating lifespan variation are considered
robust as they were obtained from two highly regarded sources: the HMD and
NRS.
The HMD collects vital events statistics and population estimates from a range of
countries and applies a standard procedure for constructing period life tables,
thus making it suitable for cross national comparative research and the most
suitable data source for use in chapters 4 through 6 of this thesis. The lifetable
data provided by the Human Mortality Database aims to facilitate the
identification of changes to population longevity (Wilmoth et al., 2007) and
enabled this thesis to hypothesise about some of the causes and consequences in
Scotland (e.g. increasing variation in age at death (Gillespie et al., 2014)).
However, the HMD lifetable data does not permit the study of population sub-
groups meaning that an alternative data source had to be identified in order to
study the effects of socioeconomic deprivation on lifespan variation in Scotland.
Fortunately there are number of alternative data options available for studying
the relationship between socioeconomic deprivation and health inequalities in
Scotland, some of which were the focus of critical evaluation in chapter 3. This
thesis utilised the Carstairs score of area level deprivation because it met the
following criteria that were set out in chapter 3: the conceptual and theoretical
framework of the Carstairs score was relevant to the research questions, the
Carstairs score was available for an extended time period and reflected a

Chapter 9: Discussion and conclusion
368
consistent meaning of deprivation over time, and it was possible to match the
Carstairs score with population estimates and death data obtained from NRS.
Although the Carstairs score was deemed to be the most appropriate measure
for use within this thesis it is not without limitation.
9.3.3 Reflection on the Carstairs score
It has been argued that the Carstairs score may be an out of date measure of
socioeconomic deprivation (Schofield et al., 2016, Tunstall et al., 2011) and the
relevance of the variables used for capturing the meaning of deprivation across
contexts and over time has been questioned (Norman, 2010). For example the
meaning of car ownership is fundamentally different for individuals in rural
contexts compared to urban contexts. It is also acknowledged that overcrowding
may occur out of choice and for cultural reasons rather than simply being a
marker of deprivation (Fischbacher, 2014).
While still acknowledging these limitations the Carstairs score has a number of
strengths. Firstly, it is a measure of deprivation in Scotland that is available
covering a thirty year time period (Brown et al., 2014). Secondly, the Carstairs
score has a strong theoretical framework and was constructed specifically in
order to understand mortality inequalities (Carstairs and Morris, 1989a). The
four variables used (overcrowding, male unemployment, no car ownership and
low social class) were perceived to be a summary measure of population
deprivation suitable for constructing relative measure of area level deprivation
(Carstairs and Morris, 1990). Thirdly, the scores for each postcode sector at each
Census year are highly correlated despite changes to the formal definitions of
the variables. This indicates that the underlying information the variables aim to

Chapter 9: Discussion and conclusion
369
capture is similar or that deprivation has remained stable over time (Leyland et
al., 2007a).
It is important to acknowledge that the use of an area level measure of
deprivation means the results may be subject to the ecological fallacy: the
extent of an association found at the area level may differ from extent of an
association found at the individual level (Diez, 2002). Despite this, area level
measures of deprivation remain an invaluable, pragmatic tool for research
(Bailey et al., 2003a) and they are a means for governments to identify how
resources should be distributed (Allik et al., 2016, The Scottish Government and
National Statistics, 2012).
9.3.4 Excluded deaths
Although this thesis utilised routinely collected data some death counts could
not be included when constructing lifetables for chapter 7 and chapter 8 in this
thesis. Deaths had to be excluded if they did not contain sufficient information
on sex, age or postcode sector. These missing deaths represented a very small
proportion of the total number of deaths and it is unlikely that they would have
impacted the substantive results that have been reported.
9.3.5 Predicting mortality rates
A further restriction of the data used in chapter 7 and chapter 8 was the final
open ended age category of the Census population estimates was age 85+. In
order for the lifespan variation estimates to be consistent with those calculated
from the HMD (chapter 4 through 6) a final open ended age category of 110+ was
required. This limitation was overcome by predicting the mortality rates as a
function of age for age ≥85. Three modelling approaches were tested and the

Chapter 9: Discussion and conclusion
370
HMD mortality rates used as an external comparator. The final model applied
was a Poisson regression which included a fractional polynomial function for age
for predicting the morality rates for ages ≥85, by sex and deprivation quintile.
9.3.6 Random fluctuations
Chapter 7 permitted the population estimates of lifespan variation stratified by
socioeconomic deprivation to be statistically evaluated by carrying out 1,000
Monte Carlo simulations to produce 95% confidence intervals. This is important
to consider because lifespan variation is calculated from mortality rates and the
numbers of deaths in the population are inherently vulnerable to random,
naturally occurring fluctuations. Therefore the number of deaths that occur in a
population can be interpreted as one possible series that could have occurred
under the given set of circumstances (Curtin and Klein, 1995). This was a
weakness of the estimates utilised in chapter 4 through 6, for which 95%
confidence intervals were not produced.
Producing 95% confidence intervals for the 2,076 lifespan variation estimates
used in chapter 4 was beyond the scope of this project. Although this would have
allowed the results in chapter 4 to have been interpreted with more certainty it
is valid to interpret the estimates as robust for the following two reasons.
Firstly, the confidence intervals produced in chapter 7 were narrow and were
based on smaller population sizes. Secondly, the lifespan variation estimate
calculated for the population of Scotland, from the HMD lifetable data, did not
fall outside the distribution of the lifespan variation estimates for each quintile
of deprivation.

Chapter 9: Discussion and conclusion
371
The joinpoint regression analysis applied in chapter 4 produced 95% confidence
intervals for the timing of any significant change in trend and 95% confidence
intervals for the APC change for each segment of the regression line. It is
unlikely that carrying out the joinpoint regression analysis on upper and lower
lifespan variation estimates would have changed these substantive conclusions.
9.3.7 Potential for error in cause of death categories
The analysis in chapter 8 constructed cause specific categories of death from ICD
codes. The categories created were external, cancers, circulatory diseases,
respiratory diseases and all other. Grouping deaths by different diagnoses allows
patterns to be studied. However it is worth noting that processes involved in
coding of deaths and the construction of broad cause of death categories are
vulnerable to error (O'Malley et al., 2005). How deaths are classified for
statistical purposes is also an administrative process that can be subject to
change over time (National Records of Scotland, 2016a). The potential for these
issues to have impacted the substantive results is minimal: the ICD-9 and ICD-10
codes were harmonised so that the causes of death assigned to a category were
consistent over time and time trends in cause specific mortality could be
interpreted despite the ICD change (Rooney and Smith, 2000, Rooney et al.,
2002). The construction of categories was also informed by, but is not identical,
to those already used in published research (Leyland et al., 2007b, van Raalte et
al., 2014).
It was not possible to produce cause-specific mortality rates for ages ≥85
because Census population estimates were only available up to an open ended
age interval of 85+. Therefore a smoothing process was required in order for the

Chapter 9: Discussion and conclusion
372
lifespan variation estimates to be consistent with the estimates in chapter 4
through 7. The cause specific mortality rate at age 84 was carried forward to
ascertain the proportion of causes for ages ≥85. This approach was previously
applied by van Raalte et al. (2014). The sum of the cause specific mortality rates
for ages ≥85 was always equal to the all-cause mortality rate that was used in
chapter 7.
9.4 Future research directions
This thesis has used mortality data, as an indicator of health, to identify
systematic inequalities in age at death (lifespan variation) that exist within
Scotland. Lifespan variation reflects the novel concept of total inequality, an
area of research that requires further attention. The following subsection
explores the potential for subjective measures of self-reported health to be
incorporated into measures of total inequality.
The literature review of this thesis began by debating different interpretations
and definitions of health. Early concepts were focused on health being the
absence of disease and definitions of health were structured in response to the
need to control and understand communicable diseases (World Health
Organisation, 1948). Mortality data provides researchers with a robust, proximal
measure for health under this interpretation and has a number of pragmatic
advantages. Firstly, it is a legal requirement for a death to be recorded in most
developed countries meaning that long running, routinely collected data are
available for entire populations rather than for samples of the population.
Secondly, mortality data reflects an absolute state of being that cannot change.

Chapter 9: Discussion and conclusion
373
Over time definitions of health have evolved to consider the subjective
experience of health in both the presence and absence of disease and the notion
of well-being (Arcaya et al., 2015, Jadad and O‘Grady, 2008). Mortality data
remains an appropriate indicator for health in these terms: although individual
deaths are clinically defined events the age and cause specific expectations
surrounding death have changed over time and vary between populations
meaning death is relative in nature. The social patterning of death is also
reflective of complex social phenomenon beyond that of clinical health care.
The counter argument to this is that death inadequately reflects the
complexities of health because it is a single, irreversible, absolute state (Huber
et al., 2011, Walley et al., 2001). Declining death rates and changes to the
disease profile in many developed countries mean clinical definitions of health
are no longer enough to capture the full extent of worsening health inequalities
in societies which are increasingly characterised by chronic disease as opposed
to the risk of premature death (Mitchell, 2005).
Studies measuring inequalities in self-reported health have emerged in response
and demonstrate that differences in average self-reported health between
populations have also widened over time (Kunst et al., 2005). However, it is
important to note that self-reported measures have limitations. Mitchell (2005)
questions the comparability of self-reported measures of health given that the
meaning of illness, the willingness to report illness, and the level of awareness
and expectations surrounding health have changed over time and differ between
countries. Johnston et al. (2009) add that reporting error in self-report
measures of health might result in an under estimation of the health gradient

Chapter 9: Discussion and conclusion
374
compared to that found when using objective measures of health. Therefore
death may still be considered a more accurate indicator of actual health rather
than perceived health because we can be more certain about the elements of
poor health that precede a death (Green, 2013, Mitchell, 2005).
This debate suggests that objective and subjective measures of health are
mutually exclusive approaches, which is not the case. Healthy life expectancy
(also referred to as healthy life years or disability free life expectancy) is an
empirical measurement that incorporates death data and self-reported health
data in a life table. Healthy life expectancy indicates the average number of
years a person can be expected to live for free from illness and can be used to
indicate differences in health status that people experience while they are still
alive (Wood et al., 2006). Average levels of healthy life expectancy are now
being used across Europe to monitor population health, quality of life and
evaluate the health of an ageing workforce (European Commission, 2016,
Salomon et al., 2012). A number of approaches exist for estimating the
proportion of the population in the life table that are healthy. For example using
cross sectional data on limiting long term illness, life in good self-assessed
health, or years of life lived without a disability (Wood et al., 2006, Robine et
al., 1998).
In Scotland a male born in 2015 is expected to live for 76.9 years, 59.9 of which
would be in a healthy state. A female born in Scotland in 2015 is expected to
live for 81.0 years and 62.3 years of this would be in a healthy state (ScotPHo,
2016). Healthy life expectancy in Scotland also demonstrates a strong
socioeconomic gradient: years of life expected to be spent in a healthy state are

Chapter 9: Discussion and conclusion
375
lowest for the most deprived. An important finding is that the gradient for
healthy life expectancy is steeper than the gradient for life expectancy. The
difference in healthy life expectancy, between the most and least deprived in
Scotland, is 2.5 times greater than the difference in average life expectancy
(Wood et al., 2006). It is not clear what level of variation in healthy life
expectancy exists in Scotland or how variation in healthy life expectancy is
experienced by different socioeconomic groups. This could be the focus of future
research and help inform our understanding of how morbidity inequalities have
changed in response to changes in the mortality profile of the population.
9.5 Conclusion
To summarise, this thesis has identified that both males and females in Scotland
experience the highest levels of total inequality, as measured by lifespan
variation, in Western Europe. The lifespan variation trend for females in
Scotland has not converged with the rest of Western Europe, although it has
consistently been decreasing since 1950. The lifespan variation trend for males
in Scotland was decreasing up until the 1980s but then diverged; it has yet to
return to a decreasing trajectory meaning that it is the longest, sustained
increasing trend in Western Europe. Increasing total inequality in Scotland is a
dimension of mortality change that would have gone undetected when only
looking at the average mortality experience of a population.
Premature mortality in Scotland accounts for the high level of lifespan variation
and the unfavourable trends it has experienced. This age pattern of mortality
change in Scotland is distinguishable from England and Wales, and also accounts

Chapter 9: Discussion and conclusion
376
for the lifespan variation gap when these comparable countries were achieving a
similar level of life expectancy.
Higher lifespan variation in Scotland is unlikely due to it being at a different
stage of the epidemiological transition. It is perhaps more likely to be an
indication of an inadequate social safety net for ensuring all members of the
population can access the primary goods required for living (van Raalte, 2011a,
Vallin and Meslé, 2004, Tuljapurkar, 2010, Gillespie et al., 2014), with good
health being one the most fundamental requirements (Fabienne, 2001, Sen,
2002). This is further evidenced by the finding that Scotland‘s deteriorating
population level lifespan variation ranking within Western Europe is associated
with widening lifespan variation inequalities between socioeconomic groups
within Scotland. The least deprived have experienced decreasing lifespan
variation but the most deprived have experienced increasing lifespan variation,
causing the socioeconomic gradient for lifespan variation in Scotland to steepen
over time. Although there has been some recent improvement the
socioeconomic gradient for lifespan variation in 2011 was steeper than in 1981.
Premature deaths from external causes explained a greater proportion of
lifespan variation inequalities within Scotland in 2011 than in 1981.
Measuring lifespan variation in Scotland provides a more detailed account of the
changing nature of mortality inequalities: age at death within Scotland is more
unequal today than it was 30 years ago despite improvements in average life
expectancy. Routine measurement of lifespan variation is required to ascertain
whether increases in life expectancy and reductions in total inequality are being
achieved simultaneously: these public health goals are not incompatible.

377
Appendices

378
Appendix 1 Pre-copyedited, author-produced PDF of an article accepted for publication in The
European Journal of Public Health following peer review.
This is a pre-copyedited, author-produced PDF of an article accepted for publication in The
European Journal of Public Health following peer review. The version of record ‗Seaman, R.,
Leyland, A.H., & Popham, F. (2016). How have trends in lifespan variation changed since 1950? A
comparative study of 17 Western European countries. The European Journal of Public Health, 26,
360-362‘ is available online at: http://eurpub.oxfordjournals.org/content/26/2/360.abstract

379
Appendix 2 Pre-copyedited, author-produced PDF of an article accepted for publication in Social
Science and Medicine – Population Health following peer review.
This is a pre-copyedited, author-produced PDF of an article accepted for publication in Social
Science and Medicine – Population Health following peer review. The version of record ‗Seaman,
R., Leyland, A.H., & Popham, F. (2016). Increasing inequality in age at death at shared levels of
life expectancy: A comparative study of Scotland and England and Wales. SSM - Population
Health, 2, 724-731‘ is available online at:
http://www.sciencedirect.com/science/article/pii/S235282731630101X

380
Appendix 3 Annual e† estimates for Western European countries 1950-2012 – males
year Scot Eng&Wales N.Ire Denmark Finland Norway Sweden Belgium France Ireland Nether. Austria W.Ger Switz Italy Portugal Spain
1950 14.39 13.39 14.71 13.30 16.05 13.66 12.70 15.72 15.75 15.43 13.01 16.62
14.09 16.69 20.85 18.76
1951 14.07 13.13 14.41 13.35 15.04 13.76 12.64 15.20 15.41 15.04 13.01 16.07
13.88 16.39 20.28 18.06
1952 13.84 13.07 14.43 13.34 14.53 13.41 12.57 14.67 15.15 14.86 12.79 15.36
13.76 16.06 20.31 17.31
1953 13.84 12.91 14.37 13.07 14.48 13.15 12.60 14.33 14.67 14.37 12.89 15.03
13.62 15.60 19.65 16.41
1954 13.57 12.69 13.56 12.99 14.28 13.00 12.38 14.38 14.78 14.17 12.60 15.06
13.45 15.49 18.71 16.01
1955 13.42 12.55 13.32 12.86 14.16 13.01 12.33 14.26 14.56 13.74 12.45 15.01
13.31 15.32 19.14 16.11
1956 13.20 12.44 13.00 12.85 13.99 12.82 12.31 14.17 14.25 13.85 12.25 14.90 14.17 13.22 14.75 18.35 15.28
1957 13.41 12.63 13.14 12.72 14.06 12.96 12.27 14.03 14.29 13.65 12.32 15.15 14.19 13.24 15.18 19.03 15.54
1958 13.11 12.40 13.01 12.53 13.64 12.74 11.99 13.64 13.97 13.47 12.23 14.66 14.00 13.27 15.04 18.48 15.15
1959 13.13 12.43 12.92 12.62 13.81 12.82 12.08 13.72 13.96 13.38 12.45 14.69 13.99 13.12 14.97 18.69 15.03
1960 13.15 12.51 13.17 12.47 13.51 12.68 11.96 13.57 13.58 13.23 12.23 14.29 13.74 12.95 14.63 17.75 14.65
1961 12.95 12.40 13.14 12.55 13.57 12.62 11.97 13.60 13.75 13.05 12.43 14.10 13.87 13.16 14.65 18.87 14.88
1962 13.10 12.37 12.75 12.40 13.27 12.68 11.85 13.29 13.53 13.14 12.30 13.65 13.50 12.96 14.49 17.94 14.25
1963 12.86 12.27 12.96 12.41 13.31 12.37 11.87 13.23 13.49 12.90 12.16 13.62 13.25 12.79 14.44 17.10 14.25
1964 12.97 12.54 13.06 12.36 13.21 12.55 11.96 13.39 13.56 13.09 12.51 13.70 13.45 12.85 14.26 17.22 14.10
1965 12.82 12.40 13.08 12.43 13.15 12.64 11.78 13.12 13.35 12.80 12.26 13.33 13.09 12.38 13.94 16.57 13.97
1966 12.77 12.29 12.77 12.16 12.87 12.23 11.81 13.11 13.53 12.46 12.33 13.64 13.17 12.48 13.87 16.51 13.78
1967 12.86 12.29 12.85 12.27 12.83 12.39 11.82 13.00 13.35 12.87 12.45 13.43 13.12 12.68 13.70 16.25 13.69
1968 12.76 12.06 12.61 12.38 12.76 12.30 11.80 12.73 13.29 12.52 12.22 13.27 12.83 12.27 13.56 16.16 13.44
1969 12.64 12.20 12.96 12.31 12.88 12.36 11.78 12.89 13.31 12.35 12.28 13.27 12.98 12.44 13.67 15.68 13.33
1970 12.60 12.19 12.76 12.46 12.89 12.32 11.91 12.90 13.26 12.43 12.25 13.30 13.08 12.50 13.45 16.04 13.32
1971 12.67 12.19 12.67 12.42 12.92 12.30 11.88 12.81 13.23 12.52 12.17 13.45 13.11 12.41 13.39 15.74 12.92
1972 12.34 11.98 12.94 12.39 13.03 12.18 11.90 12.72 13.27 12.41 12.08 13.42 13.02 12.40 13.34 14.71 12.82
1973 12.50 12.01 13.38 12.24 12.85 12.12 11.63 12.52 13.07 12.36 12.00 13.27 12.89 12.18 12.99 14.85 12.69

381
1974 12.44 11.95 13.09 12.14 12.78 12.13 11.65 12.49 13.03 12.32 12.03 13.23 12.76 12.14 12.79 14.40 12.59
1975 12.37 11.82 13.01 12.20 12.76 12.05 11.64 12.22 12.89 12.32 11.74 12.91 12.68 12.08 12.57 15.00 12.46
1976 12.11 11.66 12.85 12.03 12.61 11.86 11.48 12.21 12.90 11.91 11.73 12.66 12.57 11.88 12.43 14.42 12.38
1977 12.36 11.73 12.74 12.12 12.59 11.86 11.61 12.32 12.94 11.94 11.90 12.77 12.49 12.06 12.34 14.07 12.30
1978 12.10 11.73 12.56 12.02 12.37 11.73 11.58 12.27 12.73 12.05 11.72 12.58 12.39 11.94 12.30 13.88 12.34
1979 12.02 11.64 12.45 12.01 12.41 11.79 11.53 12.13 12.79 11.92 11.62 12.65 12.31 11.84 12.20 13.78 12.35
1980 11.96 11.56 12.28 11.98 12.13 11.80 11.39 12.11 12.80 11.69 11.57 12.61 12.22 11.87 12.13 13.75 12.09
1981 11.93 11.46 12.09 11.91 12.23 11.49 11.24 11.99 12.63 11.63 11.42 12.37 12.01 11.74 11.97 13.69 12.05
1982 11.81 11.37 12.09 12.02 12.16 11.72 11.21 11.93 12.69 11.57 11.39 12.54 11.96 11.78 11.96 13.53 11.98
1983 11.72 11.30 11.94 11.95 11.87 11.60 11.12 11.78 12.54 11.50 11.28 12.31 11.81 11.72 11.74 13.32 11.87
1984 11.78 11.32 11.82 11.93 12.09 11.41 11.18 11.81 12.56 11.37 11.31 12.42 11.70 11.68 11.79 13.18 11.94
1985 11.55 11.13 11.73 11.98 11.79 11.57 11.02 11.69 12.42 11.15 11.13 12.15 11.55 11.53 11.62 13.07 11.79
1986 11.60 11.21 11.66 11.98 12.12 11.81 11.08 11.62 12.44 11.02 11.12 12.06 11.52 11.57 11.56 13.09 11.94
1987 11.59 11.31 11.70 12.12 12.11 11.79 11.05 11.82 12.44 11.08 11.13 11.99 11.52 11.64 11.63 13.01 12.11
1988 11.80 11.29 11.52 11.89 12.16 11.81 10.99 11.68 12.49 11.14 11.03 11.84 11.51 11.63 11.59 12.94 12.07
1989 11.37 11.12 11.31 11.97 12.25 11.69 11.02 11.49 12.50 11.15 10.86 11.83 11.38 11.61 11.61 12.88 12.21
1990 11.62 11.23 11.34 11.76 12.10 11.54 10.88 11.53 12.46 10.99 10.91 11.78 11.34 11.47 11.63 12.71 12.16
1991 11.57 11.10 11.42 11.79 12.16 11.40 10.85 11.57 12.54 11.13 10.82 11.82 11.38 11.70 11.68 12.95 12.22
1992 11.48 11.03 11.13 11.58 11.86 11.13 10.69 11.53 12.52 10.91 10.79 11.72 11.36 11.68 11.70 12.90 12.27
1993 11.27 10.86 11.18 11.35 11.59 10.79 10.52 11.43 12.42 10.76 10.63 11.67 11.25 11.40 11.46 12.58 12.08
1994 11.50 10.96 11.28 11.50 11.75 10.85 10.61 11.53 12.42 10.83 10.63 11.74 11.25 11.43 11.42 12.50 12.06
1995 11.48 10.87 11.22 11.32 11.62 10.71 10.40 11.44 12.23 10.77 10.56 11.58 11.20 11.26 11.43 12.64 12.01
1996 11.55 10.90 10.80 11.37 11.56 10.69 10.25 11.24 12.08 10.83 10.52 11.44 11.12 11.01 11.33 12.57 11.98
1997 11.51 10.86 10.91 11.25 11.54 10.60 10.27 11.18 11.94 10.84 10.44 11.25 11.09 10.86 11.12 12.49 11.65
1998 11.67 10.84 10.86 11.16 11.43 10.75 10.21 11.20 11.84 10.93 10.44 11.18 10.96 10.83 10.98 12.39 11.44
1999 11.51 10.80 10.82 11.06 11.43 10.56 10.12 11.24 11.77 10.74 10.34 11.15 10.93 10.68 10.90 12.19 11.35
2000 11.66 10.80 10.84 11.14 11.40 10.69 10.10 11.23 11.77 10.90 10.36 11.24 10.94 10.77 10.82 12.10 11.43

382
2001 11.73 10.77 10.81 10.97 11.32 10.57 10.12 11.20 11.79 10.81 10.34 11.16 10.92 10.67 10.83 12.06 11.34
2002 11.79 10.73 11.01 10.96 11.19 10.42 9.97 11.06 11.69 10.80 10.24 10.98 10.82 10.56 10.75 11.85 11.29
2003 11.48 10.66 10.66 10.93 11.25 10.38 10.01 10.90 11.56 10.64 10.15 11.00 10.77 10.32 10.40 11.58 11.15
2004 11.63 10.67 10.87 10.93 11.51 10.38 9.99 10.86 11.56 10.62 10.16 11.03 10.77 10.46 10.52 11.68 11.15
2005 11.51 10.61 11.21 10.80 11.51 10.23 9.85 10.83 11.46 10.43 10.00 10.93 10.69 10.25 10.33 11.43 11.00
2006 11.77 10.75 11.09 10.89 11.37 10.27 9.87 10.88 11.49 10.50 9.96 10.77 10.63 10.19 10.33 11.49 11.03
2007 11.70 10.71 11.10 10.90 11.47 9.99 9.83 10.93 11.42 10.58 9.89 10.82 10.64 10.08 10.21 11.31 10.91
2008 11.72 10.67 10.94 10.75 11.41 10.02 9.79 10.87 11.34 10.72 9.86 10.62 10.53 10.01 10.23 11.15 10.83
2009 11.63 10.67 11.06 10.52 11.25 10.14 9.76 10.75 11.36 10.87 9.91 10.78 10.52 10.08 10.07 11.17 10.74
2010 11.50 10.58 11.25 10.55
9.71 10.76 11.33
10.78 10.54 9.79
10.93
2011 11.50 10.56 10.90 10.42
9.64 10.77 11.29
10.56 9.84
11.05
2012
10.65 11.12
10.75

383
Appendix 4 Annual e† estimates for Western European countries 1950-2012 – females
year Scot Eng&Wales N.Ire Denmark Finland Norway Sweden Belgium France Ireland Nether. Austria W.Ger Switz Italy Portugal Spain
1950 13.81 12.67 13.91 12.08 13.88 12.17 11.58 14.11 14.45 15.21 11.89 15.10
12.68 15.62 20.27 18.14
1951 13.32 12.33 13.59 12.03 13.10 12.12 11.52 13.59 14.11 14.43 11.89 14.34
12.43 15.34 19.56 17.39
1952 13.22 12.28 13.42 11.97 12.87 11.98 11.39 13.27 13.88 14.56 11.75 13.72
12.34 14.93 19.63 16.65
1953 12.89 12.17 13.36 11.77 12.47 11.50 11.26 12.88 13.25 14.10 11.84 13.45
12.05 14.44 18.70 15.66
1954 12.66 11.98 12.65 11.60 12.27 11.31 11.05 12.92 13.38 13.52 11.49 13.38
11.99 14.17 17.79 15.28
1955 12.50 11.76 12.71 11.77 12.02 11.25 11.19 12.62 13.06 13.17 11.25 13.21
11.89 13.89 18.38 15.17
1956 12.11 11.62 12.30 11.56 11.96 11.18 10.98 12.40 12.68 13.12 10.93 13.03 12.47 11.55 13.31 17.41 14.38
1957 12.30 11.89 12.42 11.40 12.26 11.04 10.87 12.44 12.69 13.07 11.08 13.09 12.42 11.56 13.76 18.10 14.62
1958 12.21 11.56 12.03 11.18 11.60 11.04 10.79 12.09 12.35 12.75 10.98 12.84 12.29 11.38 13.55 17.33 14.08
1959 12.09 11.59 12.23 11.33 11.58 10.94 10.72 12.09 12.31 12.68 10.92 12.85 12.31 11.28 13.48 17.51 13.99
1960 12.01 11.55 12.26 11.13 11.20 10.83 10.70 11.76 12.00 12.57 10.81 12.43 12.05 11.04 13.09 16.43 13.49
1961 11.88 11.49 11.53 11.27 11.18 10.73 10.64 11.79 12.01 12.41 10.77 12.22 12.11 11.37 12.92 17.72 13.71
1962 12.04 11.48 12.09 11.06 10.93 10.64 10.47 11.70 11.79 12.32 10.65 12.08 11.84 11.16 12.81 16.55 13.14
1963 12.03 11.42 12.18 11.13 11.01 10.41 10.57 11.54 11.79 12.11 10.59 11.99 11.64 10.96 12.72 15.80 12.96
1964 12.19 11.66 11.87 10.96 10.79 10.64 10.67 11.70 11.80 12.33 10.79 11.94 11.76 11.05 12.55 15.87 12.91
1965 12.05 11.54 11.93 11.13 10.56 10.63 10.52 11.55 11.63 11.99 10.67 11.71 11.54 10.81 12.21 15.07 12.60
1966 11.94 11.46 11.92 10.85 10.69 10.43 10.37 11.54 11.68 11.88 10.65 11.76 11.53 10.77 12.21 14.93 12.52
1967 11.92 11.53 12.03 10.96 10.62 10.52 10.38 11.40 11.57 12.00 10.76 11.52 11.47 10.77 12.02 14.53 12.32
1968 11.69 11.30 11.92 11.13 10.45 10.42 10.36 11.16 11.50 11.77 10.57 11.47 11.25 10.68 11.84 14.52 12.06
1969 11.92 11.49 11.88 11.22 10.53 10.67 10.37 11.27 11.59 11.86 10.73 11.54 11.48 10.80 12.08 14.07 12.05
1970 11.85 11.44 11.93 11.18 10.46 10.25 10.54 11.32 11.40 11.84 10.64 11.48 11.41 10.63 11.79 14.39 11.74
1971 11.90 11.42 11.65 11.27 10.39 10.26 10.52 11.18 11.30 11.60 10.47 11.38 11.41 10.59 11.66 13.95 11.59
1972 11.70 11.34 11.85 11.11 10.27 10.19 10.41 11.19 11.34 11.57 10.42 11.45 11.32 10.53 11.61 12.91 11.41
1973 11.72 11.25 11.79 11.08 10.24 10.10 10.32 11.00 11.13 11.47 10.57 11.27 11.27 10.35 11.30 13.21 11.15

384
1974 11.77 11.22 11.57 10.85 10.33 10.09 10.36 10.94 11.02 11.25 10.46 11.23 11.17 10.36 11.08 12.51 11.01
1975 11.69 11.18 11.80 11.08 10.31 10.12 10.32 10.80 10.93 11.32 10.34 11.02 11.10 10.32 10.87 12.80 10.93
1976 11.44 10.96 11.86 10.87 10.28 10.12 10.19 10.78 10.81 11.06 10.36 10.75 10.97 10.11 10.77 12.38 10.74
1977 11.71 11.06 11.56 10.94 10.19 10.05 10.20 10.91 10.83 11.18 10.49 10.83 10.91 10.25 10.56 12.09 10.65
1978 11.62 11.14 11.66 10.96 10.05 10.06 10.16 10.74 10.68 11.12 10.39 10.51 10.81 10.10 10.55 11.77 10.64
1979 11.58 11.01 11.40 10.92 10.17 9.90 10.19 10.86 10.64 10.94 10.39 10.64 10.73 10.25 10.47 11.68 10.55
1980 11.51 11.00 11.42 11.04 9.87 9.90 10.09 10.71 10.58 10.91 10.34 10.56 10.63 10.10 10.41 11.59 10.32
1981 11.29 10.85 11.16 10.99 9.85 9.81 9.92 10.59 10.43 10.74 10.27 10.37 10.48 9.98 10.28 11.46 10.19
1982 11.17 10.80 11.42 11.08 10.00 9.98 10.05 10.58 10.47 10.83 10.24 10.42 10.45 9.96 10.26 11.38 10.21
1983 11.18 10.76 11.04 10.98 10.04 9.93 9.98 10.43 10.33 10.62 10.26 10.29 10.32 9.82 10.07 11.21 10.05
1984 11.35 10.78 10.91 11.02 9.96 9.94 9.92 10.36 10.33 10.66 10.19 10.33 10.29 9.96 10.12 11.05 10.01
1985 11.14 10.64 10.94 11.02 9.70 9.89 9.91 10.29 10.21 10.43 10.17 10.10 10.18 9.96 9.99 10.93 9.78
1986 10.97 10.65 10.77 11.22 9.79 10.24 9.84 10.23 10.18 10.33 10.15 10.09 10.11 9.81 9.97 10.99 9.88
1987 11.10 10.77 10.92 11.09 9.92 10.31 9.91 10.38 10.20 10.33 10.20 10.03 10.10 9.84 10.02 10.89 9.95
1988 11.04 10.68 11.00 11.18 9.88 10.24 9.81 10.36 10.20 10.41 10.00 9.90 10.08 9.85 9.92 10.73 9.88
1989 10.96 10.55 10.50 11.10 9.80 10.12 9.76 10.14 10.09 10.26 10.02 9.90 9.97 9.83 9.92 10.62 9.80
1990 10.96 10.60 10.73 10.99 9.84 10.14 9.76 10.19 10.00 10.37 9.99 9.89 9.88 9.73 9.80 10.40 9.76
1991 10.93 10.47 10.67 10.97 9.77 10.16 9.80 10.19 10.07 10.19 10.00 9.84 9.92 9.76 9.83 10.48 9.71
1992 10.95 10.46 10.47 10.84 9.75 9.87 9.68 10.19 10.03 10.19 10.01 9.84 9.86 9.71 9.84 10.39 9.70
1993 10.69 10.28 10.60 10.73 9.37 9.60 9.51 9.96 9.99 9.95 9.82 9.83 9.83 9.66 9.82 10.31 9.62
1994 10.90 10.35 10.49 10.79 9.49 9.73 9.60 10.11 10.02 9.92 9.86 9.84 9.79 9.65 9.73 10.31 9.58
1995 10.75 10.23 10.56 10.74 9.44 9.51 9.48 10.01 9.94 10.06 9.83 9.63 9.78 9.59 9.71 10.13 9.53
1996 10.76 10.23 10.28 10.75 9.29 9.59 9.43 9.86 9.83 9.87 9.85 9.58 9.70 9.35 9.78 10.05 9.47
1997 10.64 10.18 10.18 10.73 9.38 9.55 9.36 9.90 9.76 10.09 9.79 9.49 9.68 9.37 9.56 10.17 9.35
1998 10.63 10.12 10.11 10.69 9.38 9.51 9.37 9.94 9.72 9.86 9.70 9.41 9.59 9.21 9.47 10.00 9.19
1999 10.46 10.03 10.02 10.49 9.29 9.48 9.23 9.70 9.65 9.78 9.77 9.37 9.57 9.16 9.35 9.83 9.11
2000 10.57 10.08 10.03 10.55 9.33 9.48 9.30 9.77 9.63 9.87 9.75 9.38 9.56 9.23 9.36 9.82 9.18

385
2001 10.55 10.02 9.89 10.44 9.18 9.43 9.23 9.74 9.66 9.96 9.70 9.31 9.51 9.15 9.34 9.75 9.15
2002 10.45 9.90 9.92 10.26 9.06 9.39 9.11 9.58 9.58 9.68 9.67 9.19 9.46 9.11 9.25 9.67 9.03
2003 10.41 9.86 9.80 10.28 9.07 9.37 9.16 9.46 9.42 9.68 9.58 9.22 9.35 8.98 9.01 9.52 8.93
2004 10.35 9.87 10.06 10.20 9.29 9.40 9.19 9.47 9.59 9.68 9.57 9.21 9.38 8.99 9.17 9.54 8.95
2005 10.43 9.80 10.04 10.08 9.48 9.38 9.14 9.44 9.43 9.70 9.57 9.17 9.27 8.89 8.96 9.35 8.80
2006 10.39 9.88 9.99 10.04 9.20 9.16 9.08 9.50 9.51 9.51 9.42 8.99 9.24 9.00 8.97 9.31 8.85
2007 10.36 9.80 9.84 10.03 9.15 9.25 8.98 9.56 9.42 9.65 9.42 9.00 9.23 8.91 8.90 9.24 8.79
2008 10.32 9.73 9.91 9.99 9.12 9.21 8.94 9.46 9.43 9.65 9.38 8.92 9.13 8.78 8.87 9.16 8.73
2009 10.35 9.78 10.05 9.89 9.18 9.17 8.99 9.53 9.41 9.73 9.37 9.05 9.12 8.73 8.84 9.19 8.71
2010 10.32 9.71 10.05 9.81
8.89 9.46 9.37
9.00 9.12 8.76
9.03
2011 10.36 9.70 9.64 9.74
8.84 9.51 9.34
9.16 8.73
9.02
2012
9.29 9.20
8.81

386
Appendix 5 Years of significant change in trend (joinpoints) and Annual Percentage Change (APC)
for lifespan variation for each Western European country, males
Countries for Comparison Joinpoint (95% CI) Years APC (95 % CI)
Scotland:
United
Kingdom
(1950-2011)
Scotland 1950-1955 -1.25* (-1.8 to -0.7)
1955 (1952 to 1958) 1955-1989 -0.45* (-0.5 to -0.4)
1989 (1986 to 1993) 1989-2011 0.05 (-0.0 to 0.1)
England and
Wales
1950-1955 -1.23* (-1.7 to -0.8)
1955 (1953 to 1958) 1955-1970 -0.20* (-0.3 to -0.1)
1970 (1961 to 1975) 1970-1985 -0.55* (-0.6 to -0.5)
1985 (1980 to 1999) 1985-2011 -0.24* (-0.3 to -0.2)
Northern
Ireland
1950-1956 -2.19* (-2.8 to -1.6)
1956 (1954 to 1960) 1956-1974 -0.06 (-0.2 to 0.1)
1974 (1971 to 1978) 1974-1997 -0.77* (-0.9 to -0.7)
1997 (1992 to 2001) 1997-2011 19* (0.0 to 0.4)
Scotland:
Northern
Europe (1950-
2009)
Scotland 1950-1955 -1.26* (-1.8 to -0.7)
1955 (1952 to 1958) 1955-1990 -0.45* (-0.5 to -0.4)
1990 (1987 to 1994) 1990-2009 0.11* (0.0 to 0.2)
Denmark 1950-1960 -0.70* (-0.9 to -0.5)
1960 (1952 to 1964) 1960-1989 -0.16* (-0.2 to -0.1)
1989 (1957 to 1992) 1989-1993 -0.95 (-2.0 to 0.1)
1993 (1985 to 2005) 1993-2009 -0.45* (-0.5 to -0.4)
Finland 1950-1952 -4.64* (-7.9 to -1.3)
1952 (1952 to 1954) 1952-1964 -0.81* (-1.0 to -0.6)
1964 (1958 to 1970) 1964-2002 -0.39* (-0.4 to 0.4)
2002 (1981 to 2007) 2002-2009 0.08 (-0.4 to 0.5)
Norway 1950-1984 -0.45* ( -0.5 to -0.4)
1984 (1954 to 1986) 1984-1988 0.9 ( -0.6 to 2.4)
1988 (1986 to 1991) 1988-1993 -1.75* (-2.7 to -0.8)
1993 (1991 to 1997) 1993-2009 -0.50* (-0.6 to -0.4)
Sweden 1950-1962 -0.60* (-0.7 to -0.5)
1962 (1956 to 1967) 1962-1972 0.02 (-0.2 to 0.2)
1972 (1970 to 1980) 1972-2009 -0.54* (-0.6 to -0.5)
Scotland:
Central
Europe (1956-
Scotland 1956-1989 -0.46* (-0.5 to -0.4 )
1989 (1987 to 1993) 1989-2010 0.07 (-0.0 to 0.1)
Austria 1956-1963 -1.58* (-1.9 to -1.2)

387
2010) 1963(1958 to 1968) 1963-1973 -0.22 (-0.5 to 0.0)
1973 (1961 to 1976) 1973-1976 -1.28 (-3.9 to 1.4)
1976 (1968 to 2008) 1976-2010 -0.55* (-0.6 to -0.5)
West Germany 1956-1968 -0.83* (-0.9 to -0.7)
1968 (1966 to 1969) 1968-1971 0.62 (-0.9 to 2.1)
1971 (1970 to 1973) 1971-1985 -0.88* (-1.0 to -0.8)
1985 (1983 to 1988) 1985-2010 -0.41* (-0.4 to -0.4)
Switzerland 1956-1985 -0.47* (-0.5 to -0.4 )
1985 (1958 to 1989) 1985-1992 0.12 (-0.3 to 0.5)
1992 (1978 to 1995) 1992-1997 -1.28* (-2.1 to -0.5)
1997 (1989 to 2008) 1997-2010 -0.76* (-0.9 to -0.6)
Scotland:
Southern
Europe (1950-
2009)
Scotland 1950-1955 -1.26* (-1.8 to -0.7)
1955 (1952 to 1958) 1955-1990 -0.45* (-0.5 to -0.4)
1990 (1987 to 1994) 1990-2009 0.11* (0.00 to 0.2)
Italy 1950-1953 -2.09* (-3.3 to -0.8)
1953 (1952 to 1958) 1953-1985 -0.94* (-1.0 to -0.9)
1985 (1982 to 1988) 1985-1992 -0.08 (-0.4 to 0.5)
1992 (1989 to 1996) 1992-2009 -0.86* (-1.0 to -0.8)
Portugal 1950-1981 -1.37* (-1.4 to -1.3)
1981 (1958 to 1986) 1981-1997 -0.49* (-0.7 to -0.3)
1997 (1975 to 2007) 1997-2009 -0.95* (-1.2 to -0.7)
Spain 1950-1954 -4.08* (-5.0 to -3.2)
1954 (1952 to 1957) 1954-1978 -1.15* (-1.2 to -1.1)
1978 (1974 to 1983) 1978-1992 0.06 (-0.1 to 0.2)
1992 (1989 to 1996) 1992-2009 -0.73* (-0.8 to -0.6)
Scotland:
Western
Europe (1950-
2009)
Scotland 1950-1955 -1.26* (-1.8 to -0.7)
1955 (1952 to 1958) 1955-1990 -0.45* (-0.5 to -0.4)
1990 (1987 to 1994) 1990-2009 0.11* (0.0 to 0.2)
Belgium 1950-1952 -3.57* (-5.7 to -1.4 )
1952 (1952 to 1954) 1952-1960 -0.95* (-1.2 to -0.7)
1960 (1955 to 1977) 1960-1983 -0.58* (-0.6 to -0.5)
1983 (1974 to 1989) 1983-2009 -0.36* (-0.4 to -0.3)
France 1950-1960 -1.25* (-1.4 to -1.1)
1960 (1957 to 1962) 1960-1986 -0.36* (-0.4 to -0.3 )
1986 (1979 to 1990) 1986-1991 0.05 (-0.6 to 0.7)
1991 (1988 to 1994) 1991-2009 -0.59* (-0.6 to -0.5)
Ireland 1950-1955 -2.29* (-3.0 to -1.6)
1955 (1953 to 1961) 1955-1988 -0.65* (-0.7 to -0.6)
1988 (1957 to 1995) 1988-2007 -0.27* (-0.4 to -0.2)

388
2007 (1983 to 2007) 2007-2009 1.58 (-1.5 to 4.8)
Netherlands 1950-1956 -1.03* (-1.3 to -0.7)
1956 (1955 to 1959) 1956-1968 0.01 (-0.1 to 0.1)
1968 (1965 to 1971) 1968-2009 -0.56* (-0.6 to -0.5)

389
Appendix 6 Years of significant change in trend (joinpoints) and Annual Percentage Change (APC)
for lifespan variation for each Western European country, females
Countries for Comparison Joinpoint (95% CI) Years APC (95% CI)
Scotland:
United
Kingdom
(1950-2011)
Scotland 1950-1956 -1.94* (-2.3 to -1.6)
1956 (1954 to 1958) 1956-1971 -0.20* (-0.3 to -0.1)
1971 (1963 to 1981) 1971-2003 -0.40* (-0.4 to -0.4)
2003 ( 1980 to 2009) 2003-2011 -0.08 (-0.3 to 0.2)
Eng.& Wales 1950-1056 -1.28* (-1.6 to -0.9)
1956 (1954 to 1959) 1956-1971 -0.16* (-0.3 to -0.1)
1970 (1966 to 1975) 1970-2011 -0.41 (-0.4 to -0.4)
Northern
Ireland
1950-1958 -1.70* -2.1 to -1.3)
1958 (1953 to 1961) 1958-1975 -0.17* (-0.3 to -0.0)
1975 (1968 to 1981) 1975-2001 -0.63* (-0.7 to -0.6)
2001 (1994 to 2005) 2001-2011 -0.06 (-0.4 to 0.2)
Scotland:
Northern
Europe
(1950-2009)
Scotland 1950-1956 -1.91* (-2.3 to -1.5)
1956 (1954 to 1957) 1956-1979 -0.23* (-0.3 to -0.2)
1979 (1960 to 1981) 1979-1982 -1.00 (-3.2 to 1.2)
1982 (1963 to 2007) 1982-2009 -0.34* (-0.4 to -0.3)
Denmark 1950-1960 -0.83* (-1.0 to -0.6)
1960 (1952 to 1965) 1960-1979 -0.09* (-0.2 to -0.0)
1979 (1960 to 1992) 1979-1988 0.20 (-0.1 to 0.5)
1988 (1985 to 2007) 1988-2009 -0.55* (-0.6 to -0.5)
Finland 1950-1953 -3.19* (-4.9 to -1.4)
1953 (1952 to 1956) 1953-1965 -1.32* (-1.6 to -1.1)
1965 (1962 to 1968) 1965-2009 -0.37 (-0.4 to -0.3)
Norway 1950-1956 -1.73* (-2.3 to -1.2)
1956 (1953 to 1963) 1956-1981 -0.46* (-0.5 to -0.4)
1981 (1976 to 1985) 1981-1987 0.55 (-0.2 to 1.3)
1987 (1984 to 1990) 1987-2009 -0.51* (-0.6 to -0.4)
Sweden 1950-1959 -0.86* (-1.0 to -0.7)
1959 (1952 to 1963) 1959-1968 -0.36* (-0.6 to -0.2)
1968 (1960 to 1977) 1968-1971 0.37 (-1.5 to 2.2)
1971 (1969 to 1997) 1971-2009 -0.42* (-0.4 to -0.4)
Scotland:
Central
Europe
(1956-2010)
Scotland 1956-1979 -0.23* (-0.3 to-0.2)
1979 (1965 to 1981) 1979-1982 -1.02 (-3.2 to 1.2)
1982 (1980 to 2008) 1982-2010 -0.33* (-0.4 to -0.3)
Austria 1956-1965 -1.30* (-1.5 to -1.1)

390
1965 (1961 to 1969) 1965-1973 -0.41* (-0.7 to -0.1)
1973 (1969 to 1976) 1973-1978 -1.34* (-2.1 to -0.6)
1978 (1975 to 1986) 1978-2010 -0.55* (-0.6 to-0.5)
West Germany 1956-1968 -0.83* ( -0.9 to -0.8)
1968 (1965 to 1969) 1968-1971 0.39 (-0.8 to 1.6)
1971 (1970 to 1974) 1971-1985 -0.84* (-0.9 to -0.8)
1985 (1982 to 1988) 1985-2010 -0.45* (-0.5 to -0.4)
Switzerland 1956-1976 -0.61* (-0.7 to -0.5)
1976 (1958 to 1986) 1976-1994 -0.33* (-0.4 to -0.3)
1994 (1975 to 1997) 1994-1998 -1.01 (-2.1 to 0.1)
1998 (1986 to 2008) 1998-2010 -0.46* (-0.6 to -0.3)
Scotland:
Southern
Europe
(1950-2009)
Scotland 1950-1956 -1.91* (-2.3 to -1.5)
1956 (1954 to 1957) 1956-1979 -0.23* (-0.3 to -0.2)
1979 (1960 to 1981) 1979-1982 -1.00 (-3.2 to 1.2)
1982 (1963 to 2007) 1982-2009 -0.34* (-0.4 to -0.3)
Italy 1950-1954 -2.66* (-3.5 to -1.8)
1954 (1952 to 1957) 1954-1982 -1.17* (-1.2 to -1.1)
1982 (1969 to 1985) 1982-1995 -0.33* (-0.5 to -0.2)
1995 (1975 to 2002) 1995-2009 -0.72* (-0.9 to -0.6)
Portugal 1950-1954 -2.68* (-3.9 to -1.4)
1954 (1952 to 1964) 1954-1961 -1.16* (-1.8 to -0.5)
1961 (1956 to 1980) 1961-1979 -2.05* (-2.2 to -1.9)
1979 (1976 to 2007) 1979-2009 -0.79* (-0.9 to -0.7)
Spain 1950-1954 -4.50* (-5.3 to -3.7)
1954 (1952 to 1956) 1954-1974 -1.57* (-1.6 to -1.5)
1974 (1955 to 1978) 1974-1981 -1.03* (-1.5 to -0.6)
1981 (1975 to 2007) 1981-2009 -0.59* (-0.6 to -0.5)
Scotland:
Western
Europe
(1950-2009)
Scotland 1950-1956 -1.91* (-2.3 to -1.5)
1956 (1954 to 1957) 1956-1979 -0.23* (-0.3 to -0.2)
1979 (1960 to 1981) 1979-1982 -1.00 (-3.2 to 1.2)
1982 (1963 to 2007) 1982-2009 -0.34* (-0.4 to -0.3)
Belgium 1950-193 -2.68* (-3.8 to -1.5)
1953 (1952 to 1957) 1953-1961 -1.24* (-1.6 to -0.9)
1961 (1958 to 1965) 1961-2005 -0.48* (-0.5 to -0.5)
2005 (1967 to 2007) 2005-2009 0.14 (-0.6 to 0.9)
France 1950-1060 -1.77* (-1.9 to -1.6)

391
1960 (1952 to 1962) 1960-1969 -0.43* (-0.6 to -0.2)
1969 (1957 to 1984) 1969-1981 -0.81* (-0.9 to -0.7)
1981 (1976 to 2006) 1981-2009 -0.40* (-0.4 to -0.4)
Ireland 1950-1956 -2.53* (-3.0 to -2.1)
1956 (1954 to 1959) 1956-1987 -0.73* (-0.8 to -0.7)
1987 (1983 to 1995) 1987-2009 -0.36* (-0.4 to -0.3)
Netherlands 1950-1953 -0.24 (-1.2 to 0.7)
1953 (1952 to 1954) 1953-1956 -2.44* (-4.3 to -0.6)
1956 (1955 to 1957) 1956-1986 -0.25* (-0.3 to -0.2)
1986 (1969 to 2007) 1986-2009 -0.34* (-0.4 to -0.3)

392
Appendix 7 Full contributions from age 0 only, males (figure 43 and 44 show contributions truncated to 0.06 years)
shared ex (approx.)
Year achieved
(England: Scotland)
contribution from
age 0 at shared life expectancy
(years)
contribution from age 0 to lifespan
variation gap (years)
66 1950:1961 0.20 -0.16
67 1953:1971 0.57 -0.46
68 1959:1976 0.50 -0.41
69 1971:1981 0.47 -0.39
70 1977:1985 0.35 -0.29
71 1981:1990 0.25 -0.21
72 1986:1995 0.30 -0.25
73 1990:2000 0.23 -0.19
74 1994:2004 0.09 -0.08
75 1999:2008 0.11 -0.09
76 2002:2010 0.12 -0.10
The scale of the y axis in the decomposition figures was truncated at 0.06 years as contributions from mortality during the first year of life dominated the scale for the earliest years being compared. These are the full contributions made from the mortality rate difference during the first year of life.

393
Appendix 8 Full contributions from age 0 only , females (figure 45 and 46 show contributions truncated to 0.06 years)
shared ex (approx.)
Year achieved
(England: Scotland)
contribution from
age 0 at shared life expectancy
(years)
contribution from age 0 to lifespan
variation gap (years)
71 1950:1956 -0.02* 0.02*
72 1952:1962 0.16 -0.11
73 1955:1967 0.10 -0.13
74 1961:1974 0.27 -0.22
75 1968:1980 0.35 -0.30
76 1976:1985 0.31 -0.26
77 1982:1992 0.25 -0.24
78 1987:1997 0.24 -0.20
79 1993:2004 0.10 -0.07
80 1999:2008 0.10 -0.09 The scale of the y axis in the decomposition figures was truncated at 0.06 years as contributions from mortality during the first year of life dominated the scale for the earliest years being compared. These are the full contributions made from the mortality rate difference during the first year of life. *Scotland had a very slightly higher infant mortality rate (0.02657) than England and Wales (0.02624) meaning the mortality difference at age 0 made a small, detrimental contribution to Scotland’s lifespan variation.

394
Appendix 9 Age distribution of death (0-110+) by cause of death and Census year, Males, Least deprived quintile

395
Appendix 10 Age distribution of death (0-110+) by cause of death and Census year, Males, Most deprived quintile

396
Appendix 11 Age distribution of death (0-110+) by cause of death and Census year, Females, Least deprived quintile

397
Appendix 12 Age distribution of death (0-110+) by cause of death and Census year, Females, Most deprived quintile

398
References
ALDABE, B., ANDERSON, R., LYLY-YRJÄNÄINEN, M., PARENT-THIRION, A., VERMEYLEN, G., KELLEHER, C. C. & NIEDHAMMER, I. 2011. Contribution of material, occupational, and psychosocial factors in the explanation of social inequalities in health in 28 countries in Europe. Journal of Epidemiology and Community Health, 65, 1123-1131.
ALEXANDER, B. K. 2008. The globalisation of addiction:a study in poverty of the spirit, Oxford, Oxford University Press.
ALLIK, M., BROWN, D., DUNDAS, R. & LEYLAND, A. H. 2016. Developing a new small-area measure of deprivation using 2001 and 2011 census data from Scotland. Health & Place, 39, 122-130.
ANDREEV, E. M. & SHKOLNIKOV, V. M. 2012. An Excel spreadsheet for the decomposition of a difference between two values of an aggregate demographic measure by stepwise replacement running from young to old ages. Rostock: Max Planck Institute for Demographic Research (MPIDR Technical Report TR–2012–002).
ARCAYA, M. C., ARCAYA, A. L. & SUBRAMANIAN, S. V. 2015. Inequalities in health: definitions, concepts, and theories. Global Health Action, 8, 10.3402/gha.v8.27106.
ARTAZCOZ, L., BENACH, J., BORRELL, C. & CORTÈS, I. 2005. Social inequalities in the impact of flexible employment on different domains of psychosocial health. Journal of epidemiology and community health, 59, 761-767.
ASADA, Y. 2005. A framework for measuring health inequity. Journal of Epidemiology and Community Health, 59, 700-705.
AUGER, N., FEUILLET, P., MARTEL, S., LO, E., BARRY, A. D. & HARPER, S. 2014. Mortality inequality in populations with equal life expectancy: Arriaga's decomposition method in SAS, Stata, and Excel. Annals of Epidemiology, 24, 575-580.e1.
BAILEY, N., FLINT, J., GOODLAD, R., SHUCKSMITH, M., FITZPATRICK, S. & PRYCE, G. 2003a. Measuring deprivation in Scotland: developing a long-term strategy. Final Report, Scottish Executive Central Statistics Unit.
BAILEY, N., FLINT, J., GOODLAD, R., SHUCKSMITH, P., FITZPATRICK, S. & PRYCE, G. 2003b. Measuring deprivation in Scotland: Developing a long term strategy In: SCOTTISH EXECUTIVE CENTRAL STATISTICS UNIT (ed.) Scottish Centre for Research on Social Justice Universities of Glasgow and Aberdeen,. Edinburgh.
BAMBRA, C. 2009. Welfare State Regimes and the Political Economy of Health. Humanity & Society, 33, 99-117.
BAMBRA, C. 2010. Yesterday once more? Unemployment and health in the 21st century. Journal of epidemiology and community health, 64, 213-215.
BAMBRA, C. 2011a. Health inequalities and welfare state regimes: theoretical insights on a public health ‗puzzle‘. Journal of epidemiology and community health, 65, 740-745.
BAMBRA, C. 2011b. Work, worklessness and the political economy of health inequalities. Journal of epidemiology and community health, 65, 746-750.
BAMBRA, C. 2011c. Work, worklessness, and the political economy of health, Oxford, Oxford University Press.

399
BAMBRA, C. 2013. In defence of (social) democracy: on health inequalities and the welfare state. Journal of epidemiology and community health, 67, 713-714.
BARKER, D. J. & MARTYN, C. N. 1992. The maternal and fetal origins of cardiovascular disease. Journal of Epidemiology and Community Health, 46, 8-11.
BARRY, A. & YUILL, C. 2012. Understanding the Sociology of Health BARTLEY, M. 2004. Health inequality: An introduction to theories, concepts and
methods. BECKFIELD, J. & KRIEGER, N. 2009. Epi+ demos+ cracy: linking political systems
and priorities to the magnitude of health inequities—evidence, gaps, and a research agenda. Epidemiologic reviews, 31, 152-177.
BEN-SHLOMO, Y. & KUH, D. 2002. A life course approach to chronic disease epidemiology: conceptual models, empirical challenges and interdisciplinary perspectives. International journal of epidemiology, 31, 285-293.
BENZEVAL, M. 1995. Tackling inequalities in health. BHOPAL, R. 2012. Concepts of Epidemiology: Integrating the Ideas, Theories,
Principles and Methods of Epidemiology Oxford University Press,. BLANE, D. 1999. The life course, the social gradient, and health. Social
determinants of health. BLANE, D., SMITH, G. D. & BARTLEY, M. 1990. Social class differences in years of
potential life lost: size, trends, and principal causes. BMJ, 301, 429-432. BOR, J., HERBST, A. J., NEWELL, M.-L. & BÄRNIGHAUSEN, T. 2013. Increases in
adult life expectancy in rural South Africa: valuing the scale-up of HIV treatment. Science, 339, 961-965.
BOSETTI, C., BERTUCCIO, P., LEVI, F., LUCCHINI, F., NEGRI, E. & LA VECCHIA, C. 2008. Cancer mortality in the European Union, 1970–2003, with a joinpoint analysis. Annals of Oncology, 19, 631-640.
BOYLE, P. J., FEIJTEN, P., FENG, Z., HATTERSLEY, L., HUANG, Z., NOLAN, J. & RAAB, G. 2009a. Cohort profile: the Scottish longitudinal study (SLS). International Journal of Epidemiology, 38, 385-392.
BOYLE, P. J., NORMAN, P. & POPHAM, F. 2009b. Social mobility: evidence that it can widen health inequalities. Social science & medicine, 68, 1835-1842.
BRENNAN, A., MENG, Y., HOLMES, J., HILL-MCMANUS, D. & MEIER, P. S. 2014. Potential benefits of minimum unit pricing for alcohol versus a ban on below cost selling in England 2014: modelling study. BMJ : British Medical Journal, 349.
BRENNER, M. H. & MOONEY, A. 1983. Unemployment and health in the context of economic change. Social Science & Medicine, 17, 1125-1138.
BROWN, D., ALLIK, M., DUNDAS, R. & LEYLAND, A. H. 2014. Carstairs Scores for Scottish Postcode Sectors, Datazones and Output Areas from the 2011 Census.
BROWN, D. & LEYLAND, A. H. 2010. Scottish mortality rates 2000–2002 by deprivation and small area population mobility. Social science & medicine, 71, 1951-1957.
CAMPBELL, M., BALLAS, D., DORLING, D. & MITCHELL, R. 2013. Mortality inequalities: Scotland versus england and wales. Health & place, 23, 179-186.

400
CARNES, B. A. & OLSHANSKY, S. J. 2002. The quest for immortality: Science at the frontiers of aging, WW Norton & Company.
CARROLL, D., PHILLIPS, A. C., DER, G., HUNT, K. & BENZEVAL, M. 2011. Blood pressure reactions to acute mental stress and future blood pressure status: data from the 12-year follow-up of the West of Scotland Study. Psychosomatic medicine, 73, 737-742.
CARSTAIRS, V. & MORRIS, R. 1989a. Deprivation and mortality: an alternative to social class? Journal of Public Health, 11, 210-219.
CARSTAIRS, V. & MORRIS, R. 1989b. Deprivation: explaining differences in mortality between Scotland and England and Wales. BMJ: British Medical Journal, 299, 886-889.
CARSTAIRS, V. & MORRIS, R. 1990. Deprivation and health in Scotland. Health bulletin, 48, 162-175.
CARTER-POKRAS, O. & BAQUET, C. 2002. What is a "health disparity"? Public Health Reports, 117, 426-434.
CENTERS FOR DISEASE CONTROL AND PREVENTION. 2012. Principles of Epidemiology in Public Health Practice, Third Edition An Introduction to Applied Epidemiology and Biostatistics [Online]. Atlanta: U.S. Department of Health and Human Services. Available: http://www.cdc.gov/ophss/csels/dsepd/ss1978/lesson1/section8.html 2016].
COBURN, D. 2000. Income inequality, social cohesion and the health status of populations: the role of neo-liberalism. Social Science & Medicine, 51, 135-146.
COBURN, D. 2004. Beyond the income inequality hypothesis: class, neo-liberalism, and health inequalities. Social science & medicine, 58, 41-56.
COOPE, C., GUNNELL, D., HOLLINGWORTH, W., HAWTON, K., KAPUR, N., FEARN, V., WELLS, C. & METCALFE, C. 2014. Suicide and the 2008 economic recession: who is most at risk? Trends in suicide rates in England and Wales 2001-2011. Social Science & Medicine.
CURTIN, L. R. & KLEIN, R. J. 1995. Direct standardization (age-adjusted death rates), US Department of Health and Human Services, Public Health Service, Centers for Disease Control and Prevention, National Center for Health Statistics.
DAHLGREN, G. & WHITEHEAD, M. 1991. Policies and strategies to promote social equity in health. Stockholm: Institute for future studies.
DAHLGREN, G. & WHITEHEAD, M. 2006. European strategies for tackling social inequities in health: Levelling up Part 2. Genebra: WHO.
DEPARTMENT OF HEALTH 1999. Saving Lives: Our Healthier Nation (white paper) London
DEPARTMENT OF HEALTH 2013. Living Well for Longer: A call to action to reduce avoidable premature mortality. London
DEPARTMENT OF HEALTH. 2005. Tackling Health Inequalities: Status Report on the Programme for Action London.
DIBBEN, C. & POPHAM, F. 2011. Are socio-economic groupings the most appropriate method for judging health equity between countries? Journal of Epidemiology and Community Health, 65, 4-5.
DIEZ, R. 2002. A glossary for multilevel analysis. Journal of epidemiology and community health, 56, 588.
DORLING, D. 2009. Unemployment and health. Bmj, 338.

401
DORLING, D., RIGBY, J., WHEELER, B., BALLAS, D., THOMAS, B., FAHMY, E., GORDON, D. & LUPTON, R. 2007. Poverty, wealth and place in Britain, 1968 to 2005, The Policy Press for the Joseph Rowntree Foundation.
DOWLER, E. & SPENCER, N. 2007. Challenging health inequalities: from Acheson to Choosing Health, Policy Press.
EDWARDS, R. D. 2011. Changes in world inequality in length of life: 1970–2000. Population and Development Review, 37, 499-528.
EDWARDS, R. D. & TULJAPURKAR, S. 2005. Inequality in life spans and a new perspective on mortality convergence across industrialized countries. Population and Development Review, 31, 645-674.
ERIKSON, R. & TORSSANDER, J. 2008. Social class and cause of death. The European Journal of Public Health, 18, 473-478.
EUROPEAN COMMISSION. 2016. Healthy Life Years [Online]. Available: http://ec.europa.eu/health/indicators/healthy_life_years_en [Accessed 12/12/2016.
FABIENNE, P. 2001. Health equity and social justice. Journal of Applied Philosophy 18.
FISCHBACHER, C. M. 2014. Identifying ―Deprived Individuals‖: Are There Better Alternatives to the Scottish Index of Multiple Deprivation (SIMD) for Socioeconomic Targeting in Individually Based Programmes Addressing Health Inequalities in Scotland. Edinburgh, UK: Scottish Public Health Organisation.
FLOWERDEW, R., FENG, Z. & MANLEY, D. 2007. Constructing data zones for Scottish neighbourhood statistics. Computers, Environment and Urban Systems, 31, 76-90.
FOX, A. J., GOLDBLATT, P. O. & JONES, D. R. 1985. Social class mortality differentials: artefact, selection or life circumstances? Journal of epidemiology and community health, 39, 1-8.
GAKIDOU, E. & KING, G. 2002. Measuring total health inequality: adding individual variation to group-level differences. International Journal for Equity in Health, 1, 3.
GAKIDOU, E. E., MURRAY, C. J. & FRENK, J. 2000. Defining and measuring health inequality: an approach based on the distribution of health expectancy. Bulletin of the World Health Organization, 78, 42-54.
GALOBARDES, B. 2012. Socioeconomic inequalities in health: individual or area level; does it matter? BMC Public Health, 12, 171.
GALOBARDES, B., SHAW, M., LAWLOR, D. A., LYNCH, J. W. & DAVEY SMITH, G. 2006. Indicators of socioeconomic position (part 1). Journal of Epidemiology and Community Health, 60.
GAYLE, V., PLAYFORD, C. & LAMBERT, P. 2008. Scottish Social Survey Data, Past, Present and Future–Does Scotland Need its Own Data Strategy? Radical Statistics, 97, 82-97.
GENERAL REGISTER OFFICE FOR SCOTLAND 2015. Life Expectancy for Scotland: Methodology Guide. Edinburgh.
GENERAL REGISTER OFFICE FOR SCOTLAND 2016. Vital Events-Deaths-Background Information: Place of Death and Place of Occurrence.
GILLESPIE, D. S., TROTTER, M. & TULJAPURKAR, S. 2014. Divergence in Age Patterns of Mortality Change Drives International Divergence in Lifespan Inequality. Demography, 1-15.
GODLEE, F. 2011. What is health? BMJ, 343.

402
GOLDTHORPE, J. H. 2007. On sociology, Stanford University Press. GOMPERTZ, B. 1825. On the nature of the function expressive of the law of
human mortality, and on a new mode of determining the value of life contingencies. Philosophical transactions of the Royal Society of London, 115, 513-583.
GOOVAERTS, P. & XIAO, H. 2011. Geographical, temporal and racial disparities in late-stage prostate cancer incidence across Florida: a multiscale joinpoint regression analysis. International journal of health geographics, 10, 1.
GRAHAM, H. 2009. Understanding health inequalities, McGraw-Hill International. GRAHAM, P., WALSH, D. & MCCARTNEY, G. 2012. Shipyards and sectarianism:
How do mortality and deprivation compare in Glasgow and Belfast? Public health, 126, 378-385.
GRAY, L. & LEYLAND, A. H. 2009. Is the" Glasgow effect" of cigarette smoking explained by socio-economic status?: a multilevel analysis. BMC Public Health, 9, 1-8.
GREEN, M. 2013. Death in England and Wales: using a classificatory approach for researching mortality. University of Sheffield.
GRUSKY, D. 2010. Social stratification. In: RITZER, G. & RYANS, J. M. (eds.) The concise encyclopedia of sociology. Wiley-Blackwell.
HANLON, P., LAWDER, R. S., BUCHANAN, D., REDPATH, A., WALSH, D., WOOD, R., BAIN, M., BREWSTER, D. H., CHALMERS, J. & WALSH, D. 2005. Why is mortality higher in Scotland than in England and Wales? Decreasing influence of socioeconomic deprivation between 1981 and 2001 supports the existence of a ‗Scottish Effect‘. Journal of Public Health, 27, 199-204.
HANLON, P., WALSH, D. & WHYTE, B. 2006. Let Glasgow Flourish: A comprehensive report on health and its determinants in Glasgow and West Central Scotland. Glasgow Centre for Population Health.
HARPER, S. & LYNCH, J. 2006. measuring health inequalities In: OAKES, J. M. & KAUFMAN, J. S. (eds.) Methods in social epidemiology. John Wiley & Sons.
HEALTH, C. O. S. D. O. 2008. Closing the gap in a generation: health equity through action on the social determinants of health: final report of the commission on social determinants of health.
HEGERL, U., MERGL, R., DOGANAY, G., RESCHKE, K. & RUMMEL-KLUGE, C. 2013. Why Has the Continuous Decline in German Suicide Rates Stopped in 2007? PLoS ONE, 8, e71589.
HUBER, M., KNOTTNERUS, J. A., GREEN, L., HORST, H. V. D., JADAD, A. R., KROMHOUT, D., LEONARD, B., LORIG, K., LOUREIRO, M. I., MEER, J. W. M. V. D., SCHNABEL, P., SMITH, R., WEEL, C. V. & SMID, H. 2011. How should we define health? BMJ, 343.
HUMMER, R. A. & HERNANDEZ, E. M. 2013. The Effect of Educational Attainment on Adult Mortality in the United States*. Population bulletin, 68, 1-16.
JADAD, A. R. & O‘GRADY, L. 2008. How should health be defined? BMJ, 337. JASILIONIS, D. 2015. The Human Mortality Database: About mortality data for
Scotland [Online]. Available: http://www.mortality.org/cgi-bin/hmd/country.php?cntr=GBR_SCO&level=1 [Accessed 13th June 2016].
JOHNSTON, D. W., PROPPER, C. & SHIELDS, M. A. 2009. Comparing subjective and objective measures of health: Evidence from hypertension for the income/health gradient. Journal of Health Economics, 28, 540-552.
KÄLIN, W., MÜLLER, L. & WYTTENBACH, J. 2004. The face of human rights, Lars Muller Publishers.

403
KAPLAN, G. A., PAMUK, E. R., LYNCH, J. W., COHEN, R. D. & BALFOUR, J. L. 1996. Inequality in income and mortality in the United States: analysis of mortality and potential pathways. Bmj, 312, 999-1003.
KARANIKOLOS, M., LEON, D. A., SMITH, P. C. & MCKEE, M. 2012. Minding the gap: changes in life expectancy in the Baltic States compared with Finland. Journal of Epidemiology and Community Health, 66, 1043-1049.
KAWACHI, I., SUBRAMANIAN, S. V. & ALMEIDA-FILHO, N. 2002. A glossary for health inequalities. Journal of Epidemiology and Community Health, 56, 647-652.
KEARNS, A., GIBB, K. & MACKAY, D. 2000. Area deprivation in Scotland: A new assessment. Urban Studies, 37, 1535-1559.
KELLY, L. A. & PRESTON, S. H. 2016. The contribution of a history of heavy smoking to Scotland's mortality disadvantage. Population Studies, 70, 59-71.
KIM, H.-J., FAY, M. P., FEUER, E. J. & MIDTHUNE, D. N. 2000. Permutation tests for joinpoint regression with applications to cancer rates. Statistics in Medicine, 19, 335-351: (correction: 2001;20:655).
KIND, P., DOLAN, P., GUDEX, C. & WILLIAMS, A. 1998. Variations in population health status: results from a United Kingdom national questionnaire survey. Bmj, 316, 736-741.
KOSTAKI, A. & PANOUSIS, V. 2001. Expanding an abridged life table. Demographic Research, 5, 1-22.
KRIEGER, N., WILLIAMS, D. R. & MOSS, N. E. 1997. Measuring social class in US public health research: concepts, methodologies, and guidelines. Annual review of public health, 18, 341-378.
KUNST, A. E., BOS, V., LAHELMA, E., BARTLEY, M., LISSAU, I., REGIDOR, E., MIELCK, A., CARDANO, M., DALSTRA, J. A., GEURTS, J. J., HELMERT, U., LENNARTSSON, C., RAMM, J., SPADEA, T., STRONEGGER, W. J. & MACKENBACH, J. P. 2005. Trends in socioeconomic inequalities in self-assessed health in 10 European countries. International Journal of Epidemiology, 34, 295-305.
LAAKSONEN, M., TALALA, K., MARTELIN, T., RAHKONEN, O., ROOS, E., HELAKORPI, S., LAATIKAINEN, T. & PRÄTTÄLÄ, R. 2008. Health behaviours as explanations for educational level differences in cardiovascular and all-cause mortality: a follow-up of 60 000 men and women over 23 years. The European Journal of Public Health, 18, 38-43.
LAHELMA, E., LALLUKKA, T., LAAKSONEN, M., MARTIKAINEN, P., RAHKONEN, O., CHANDOLA, T., HEAD, J., MARMOT, M., KAGAMIMORI, S., TATSUSE, T. & SEKINE, M. 2010. Social class differences in health behaviours among employees from Britain, Finland and Japan: The influence of psychosocial factors. Health & Place, 16, 61-70.
LE GRAND, J. 1987. Inequalities in health: Some international comparisons. European Economic Review, 31, 182-191.
LEON, D. A., MORTON, S., CANNEGIETER, S. & MCKEE, M. 2003. Understanding the health of Scotland‘s population in an international context. A review of current approaches, knowledge and recommendations for new research directions. Part I. London: London school of Hygiene and Tropical Medicine.
LEYLAND, DUNDAS, R., MCLOONE, P. & BODDY, F. A. 2007a. Inequalities in mortality in Scotland, 1981-2001. In: MEDICAL RESEARCH COUNCIL: SOCIAL

404
AND PUBLIC HEALTH SCIENCES UNIT/CHIEF SCIENTIST OFFICE (ed.) occasional paper Glasgow
LEYLAND, DUNDAS, R., MCLOONE, P. & BODDY, F. A. 2007b. Cause-specific inequalities in mortality in Scotland: two decades of change. A population-based study. BMC Public Health, 7, 172-184.
LEYLAND, A. H. 2004. Increasing inequalities in premature mortality in Great Britain. Journal of Epidemiology and Community Health, 58, 296-302.
LIGHT, K. C., GIRDLER, S. S., SHERWOOD, A., BRAGDON, E. E., BROWNLEY, K. A., WEST, S. G. & HINDERLITER, A. L. 1999. High Stress Responsivity Predicts Later Blood Pressure Only in Combination With Positive Family History and High Life Stress. Hypertension, 33, 1458-1464.
LINK, B. G. & PHELAN, J. 1995. Social conditions as fundamental causes of disease. Journal of health and social behavior, 80-94.
LUMME, S., SUND, R., LEYLAND, A. H. & KESKIMÄKI, I. 2015. A Monte Carlo method to estimate the confidence intervals for the concentration index using aggregated population register data. Health Services and Outcomes Research Methodology, 15, 82-98.
LYNCH, J., SMITH, G. D., HILLEMEIER, M., SHAW, M., RAGHUNATHAN, T. & KAPLAN, G. 2001. Income inequality, the psychosocial environment, and health: comparisons of wealthy nations. The Lancet, 358, 194-200.
LYNCH, J. W., SMITH, G. D., KAPLAN, G. A. & HOUSE, J. S. 2000. Income inequality and mortality: importance to health of individual income, psychosocial environment, or material conditions. BMJ, 320, 1200-1204.
MACINTYRE, S. 1997. The Black Report and beyond: what are the issues? Social science & medicine (1982), 44, 723.
MACKENBACH, J. P. 2012. The persistence of health inequalities in modern welfare states: the explanation of a paradox. Social Science & Medicine, 75, 761-769.
MACKENBACH, J. P. & BAKKER, M. J. 2003. Tackling socioeconomic inequalities in health: analysis of European experiences. The Lancet, 362, 1409-1414.
MACKENBACH, J. P., BOS, V., ANDERSEN, O., CARDANO, M., COSTA, G., HARDING, S., REID, A., HEMSTRÖM, Ö., VALKONEN, T. & KUNST, A. E. 2003. Widening socioeconomic inequalities in mortality in six Western European countries. International journal of epidemiology, 32, 830-837.
MACKENBACH, J. P., KULHÁNOVÁ, I., ARTNIK, B., BOPP, M., BORRELL, C., CLEMENS, T., COSTA, G., DIBBEN, C., KALEDIENE, R. & LUNDBERG, O. 2016a. Changes in mortality inequalities over two decades: register based study of European countries. bmj, 353, i1732.
MACKENBACH, J. P., KULHÁNOVÁ, I., ARTNIK, B., BOPP, M., BORRELL, C., CLEMENS, T., COSTA, G., DIBBEN, C., KALEDIENE, R., LUNDBERG, O., MARTIKAINEN, P., MENVIELLE, G., ÖSTERGREN, O., PROCHORSKAS, R., RODRÍGUEZ-SANZ, M., STRAND, B. H., LOOMAN, C. W. N. & DE GELDER, R. 2016b. Changes in mortality inequalities over two decades: register based study of European countries. BMJ, 353.
MACKENBACH, J. P. & KUNST, A. E. 1997. Measuring the magnitude of socio-economic inequalities in health: an overview of available measures illustrated with two examples from Europe. Social science & medicine, 44, 757-771.
MACKENBACH, J. P., KUNST, A. E., CAVELAARS, A. E., GROENHOF, F., GEURTS, J. J., STUDYGROUP, A. & GUNNING-SCHEPERS, L. 1997. Socioeconomic

405
inequalities in morbidity and mortality in western Europe. Lancet, 349, 1655-1659.
MACKENBACH, J. P., STIRBU, I., ROSKAM, A.-J. R., SCHAAP, M. M., MENVIELLE, G., LEINSALU, M. & KUNST, A. E. 2008. Socioeconomic inequalities in health in 22 European countries. New England Journal of Medicine, 358, 2468-2481.
MAJEED, A. 2013. Life expectancy at birth and at age 65 for local areas in England and Wales. BMJ, 347, f6721.
MAKEHAM, W. M. 1860. On the law of mortality and the construction of annuity tables. The Assurance Magazine, and Journal of the Institute of Actuaries, 8, 301-310.
MARANG-VAN DE MHEEN, P. J., DAVEY SMITH, G., HART, C. L. & GUNNING-SCHEPERS, L. J. 1998. Socioeconomic differentials in mortality among men within Great Britain: time trends and contributory causes. Journal of epidemiology and community health, 52, 214-218.
MARMOT, M. 2001. From Black to Acheson: two decades of concern with inequalities in health. A celebration of the 90th birthday of Professor Jerry Morris. International journal of epidemiology, 30, 1165-1171.
MARMOT, M. 2005. Social determinants of health inequalities. Lancet, 365, 1099-1104.
MARMOT, M., ALLEN, J., BELL, R., BLOOMER, E. & GOLDBLATT, P. 2012. WHO European review of social determinants of health and the health divide. The Lancet, 380, 1011-1029.
MARMOT, M. & BOBAK, M. 2000. International comparators and poverty and health in Europe. British medical journal, 321, 1124.
MARMOT, M., FRIEL, S., BELL, R., HOUWELING, T. A. J. & TAYLOR, S. 2008. Closing the gap in a generation: health equity through action on the social determinants of health. The Lancet, 372, 1661-1669.
MARMOT, M. & WILKINSON, R. G. 2001. Psychosocial and material pathways in the relation between income and health: a response to Lynch et al. BMJ, 322, 1233-1236.
MARMOT, M. G., STANSFELD, S., PATEL, C., NORTH, F., HEAD, J., WHITE, I., BRUNNER, E., FEENEY, A. & SMITH, G. D. 1991. Health inequalities among British civil servants: the Whitehall II study. The Lancet, 337, 1387-1393.
MCCARTNEY, G. 2012. What would be sufficient to reduce health inequalities in Scotland? In: SCOTLAND, N. H. (ed.).
MCCARTNEY, G., BOUTTELL, J., CRAIG, N., CRAIG, P., GRAHAM, L., LAKHA, F., LEWSEY, J., MCADAMS, R., MACPHERSON, M., MINTON, J., PARKINSON, J., ROBINSON, M., SHIPTON, D., TAULBUT, M., WALSH, D. & BEESTON, C. 2016. Explaining trends in alcohol-related harms in Scotland, 1991–2011 (I): the role of incomes, effects of socio-economic and political adversity and demographic change. Public Health.
MCCARTNEY, G., COLLINS, C. & MACKENZIE, M. 2013. What (or who) causes health inequalities: Theories, evidence and implications? Health Policy, 113, 221-227.
MCCARTNEY, G., COLLINS, C., WALSH, D. & BATTY, G. D. 2012a. Why the Scots die younger: Synthesizing the evidence. Public Health, 126, 459-470.
MCCARTNEY, G., WALSH, D., WHYTE, B. & COLLINS, C. 2012b. Has Scotland always been the ‗sick man‘ of Europe? An observational study from 1855 to 2006. The European Journal of Public Health, 22, 756-760.

406
MCLOONE, P. 2003. Increasing mortality among adults in Scotland 1981 to 1999. The European Journal of Public Health, 13, 230-234.
MITCHELL, R. 2005. Commentary: The decline of death—how do we measure and interpret changes in self-reported health across cultures and time? International Journal of Epidemiology, 34, 306-308.
MITCHELL, R., FOWKES, G., BLANE, D. & BARTLEY, M. 2005. High rates of ischaemic heart disease in Scotland are not explained by conventional risk factors. Journal of epidemiology and community health, 59, 565-567.
MORGAN, O. & BAKER, A. 2006. Measuring deprivation in England and Wales using 2001 Carstairs scores. Health Stat Q, 31, 28-33.
MRC/CSO SOCIAL AND PUBLIC HEALTH SCIENCES UNIT UNIVERSITY OF GLASGOW. 2016. Carstairs Score [Online]. Available: https://www.sphsu.mrc.ac.uk/publications/carstairs-scores.html [Accessed 26/10/2016.
MUNOZ-ARROYO, R. & SUTTON, M. 2007. Measuring socio-economic inequalities in health: a practical guide. Edinburgh: ScotPHO.
MURRAY, C., GAKIDOU, E. & FRENK, J. 1999. Critical Reflection-Health inequalities and social group differences: What should we measure? Bulletin of the World Health Organization, 77, 537-544.
MURRAY, C. J., SALOMON, J. A. & MATHERS, C. 2002. Summary measures of population health [Online]. Available: http://www.who.int/healthinfo/paper02.pdf [Accessed 2016.
NÆSS, Ø., CLAUSSEN, B., THELLE, D. S. & SMITH, G. D. 2005. Four indicators of socioeconomic position: relative ranking across causes of death. Scandinavian journal of public health, 33, 215-221.
NAIDOO, J. & WILLS, J. 2015. Health studies: an introduction, Palgrave Macmillan.
NATIONAL RECORDS OF SCOTLAND 2013a. 2011 Census Supporting Information - NRS Frozen Geography Policy
NATIONAL RECORDS OF SCOTLAND 2013b. Release 1C - How the 2011 Census population estiamtes were obtained In: GOVERNMENT, T. S. (ed.). Edinburgh.
NATIONAL RECORDS OF SCOTLAND 2014a. Life expectancy for areas in Scotland, 2011-2013. In: THE SCOTTISH GOVERNMENT (ed.) Life expectancy. Edinburgh.
NATIONAL RECORDS OF SCOTLAND 2014b. Scotland's Population: The Registrar General's Annual Review of Demographic Trends.
NATIONAL RECORDS OF SCOTLAND. 2016a. How NRS Classifies Deaths for Statistical Purposes as (Probable) Suicides [Online]. Available: https://www.nrscotland.gov.uk/statistics-and-data/statistics/statistics-by-theme/vital-events/deaths/suicides/the-definition-of-the-statistics/how-nrs-classifies-deaths-for-statistical-purposes-as-probable-suicides [Accessed 12/12/2016.
NATIONAL RECORDS OF SCOTLAND. 2016b. NRS Postcode Sectors [Online]. Scottish Government Spatial Data Infrastructure. Available: https://www.spatialdata.gov.scot/geonetwork/srv/eng/csw [Accessed 29/11/2016.
NATIONAL RECORDS OF SCOTLAND. 2016c. Our History [Online]. Available: http://www.nrscotland.gov.uk/about-us/our-history [Accessed 26/10/2016.

407
NATIONAL RECORDS SCOTLAND 2011. Life Expectancy for areas in Scotland 2008-2010. In: NATIONAL STATISTICS (ed.). Edinburgh
NATIONAL STATISTICS 2015. Scotland's People Annual Report: Results from the 2014 Scottish Household Survey. In: THE SCOTTISH GOVERNMENT (ed.).
NAU, C. & FIREBAUGH, G. 2012. A new method for determining why length of life is more unequal in some populations than in others. Demography, 49, 1207-1230.
NAVARRO, V. 2000. Assessment of the World Health Report 2000. The Lancet, 356, 1598-1601.
NETTLETON, S. 2006. The sociology of health and illness, Polity. NORMAN, P. 2010. Identifying change over time in small area socio-economic
deprivation. Applied Spatial Analysis and Policy, 3, 107-138. NORMAN, P., BOYLE, P., EXETER, D., FENG, Z. & POPHAM, F. 2011. Rising
premature mortality in the UK‘s persistently deprived areas: Only a Scottish phenomenon? Social Science & Medicine, 73, 1575-1584.
NOTZON, F. C., KOMAROV, Y. M., ERMAKOV, S. P., SEMPOS, C. T., MARKS, J. S. & SEMPOS, E. V. 1998. Causes of declining life expectancy in Russia. JAMA, 279, 793-800.
O'MALLEY, K. J., COOK, K. F., PRICE, M. D., WILDES, K. R., HURDLE, J. F. & ASHTON, C. M. 2005. Measuring Diagnoses: ICD Code Accuracy. Health Services Research, 40, 1620-1639.
OEPPEN, J. Comparing the efficiency of mortality changes between countries: An evaluation of past and forecast levels in advanced economies. Annual meeting of the Population Association of America, New Orleans, 2008.
OFFICE FOR NATIONAL STATISTICS June 2016. Methodology Guide for Mid-2015 UK Population Estimates (England and Wales).
OMRAN, A. R. 1971. The Epidemiologic Transition: A Theory of the Epidemiology of Population Change. The Milbank Quarterly, 49, 509-538.
PAYNE, R. A. 2012. UK indices of multiple deprivation-a way to make comparisons across constituent countries easier. Health, 4, 13.5.
PEACOCK, M., BISSELL, P. & OWEN, J. 2014. Dependency denied: Health inequalities in the neo-liberal era. Social Science & Medicine, 118, 173-180.
PHELAN, J. C. & LINK, B. G. 2005. Controlling disease and creating disparities: a fundamental cause perspective. The Journals of Gerontology Series B: Psychological Sciences and Social Sciences, 60, S27-S33.
PHELAN, J. C., LINK, B. G. & TEHRANIFAR, P. 2010. Social conditions as fundamental causes of health inequalities theory, evidence, and policy implications. Journal of health and social behavior, 51, S28-S40.
PHILIPOV, D. 2015. The Human Mortality Database: About Mortality Data for England and Wales [Online]. Available: http://www.mortality.org/cgi-bin/hmd/country.php?cntr=GBRTENW&level=1 [Accessed 13th June 2016].
POPHAM, F. & BOYLE, P. 2010. Assessing socio-economic inequalities in mortality and other health outcomes at the Scottish national level. Edinburgh: Scottish Collaboration for Public Health Research and Policy.
POPHAM, F. & BOYLE, P. J. 2011. Is there a ‗Scottish effect‘for mortality? Prospective observational study of census linkage studies. Journal of Public Health, 33, 453-458.
POPHAM, F., DIBBEN, C. & BAMBRA, C. 2013. Are health inequalities really not the smallest in the Nordic welfare states? A comparison of mortality

408
inequality in 37 countries. Journal of epidemiology and community health, 67, 412-418.
PRESTON, S. H., HEUVELINE, P. & GUILLOT, M. 2001. Demography : measuring and modeling population processes, Malden, MA, Blackwell Publishers.
PURSHOUSE, R. C., MEIER, P. S., BRENNAN, A., TAYLOR, K. B. & RAFIA, R. Estimated effect of alcohol pricing policies on health and health economic outcomes in England: an epidemiological model. The Lancet, 375, 1355-1364.
REID, J. 2009. Excess mortality in Glasgow conurbation: exploring the existence of a Glasgow effect. University of Glasgow University of Glasgow
RIGBY, J. E. & DORLING, D. 2007. Mortality in relation to sex in the affluent world. Journal of epidemiology and community health, 61, 159-164.
ROBERTSON, T., BENZEVAL, M., WHITLEY, E. & POPHAM, F. 2015. The role of material, psychosocial and behavioral factors in mediating the association between socioeconomic position and allostatic load (measured by cardiovascular, metabolic and inflammatory markers). Brain, Behavior, and Immunity, 45, 41-49.
ROBINE, J.-M., ROMIEU, I., JAGGER, C. & EGIDI, V. 1998. Health expectancies in the European Union The European Community Household Panel: Data analysis. Reves Paper No, 320.
ROONEY, C., GRIFFITHS, C. & COOK, L. 2002. The implementation of ICD-10 for cause of death coding-some preliminary results from the bridge coding study. Health Statistics Quarterly, 31-41.
ROONEY, C. I. & SMITH, S. K. 2000. Implementation of ICD-10 for mortality data in England and Wales from January 2001. Health Statistics Quarterly, 41-51.
ROSE, D. 1995. Official social classifications in the UK. Social Research Update, 9.
ROSE, D. & PEVALIN, D. J. 2003. A researcher's guide to the national statistics socio-economic classification, SAGE Publications Ltd.
ROSE, D., PEVALIN, D. J. & O'REILLY, K. 2005. The National Statistics Socio-economic Classification: origins, development and use, Palgrave Macmillan Basingstoke.
ROSE, G. 2001. Sick individuals and sick populations. International Journal of Epidemiology, 30, 427-432.
SALOMON, J. A., WANG, H., FREEMAN, M. K., VOS, T., FLAXMAN, A. D., LOPEZ, A. D. & MURRAY, C. J. L. 2012. Healthy life expectancy for 187 countries, 1990–2010: a systematic analysis for the Global Burden Disease Study 2010. The Lancet, 380, 2144-2162.
SARTORIUS, N. 2006. The Meanings of Health and its Promotion. Croatian medical journal, 47, 662-664.
SAUERBREI, W., MEIER-HIRMER, C., BENNER, A. & ROYSTON, P. 2006. Multivariable regression model building by using fractional polynomials: Description of SAS, STATA and R programs. Computational Statistics & Data Analysis, 50, 3464-3485.
SCHNEIDER, M. C., CASTILLO-SALGADO, C., BACALLAO, J., LOYOLA, E., MUJICA, O. J., VIDAURRE, M. & ROCA, A. 2005. Methods for measuring health inequalities (Part II). Epidemiological Bulletin / PAHO, 26, 5-10.
SCHOFIELD, L., WALSH, D., MUNOZ-ARROYO, R., MCCARTNEY, G., BUCHANAN, D., LAWDER, R., ARMSTRONG, M., DUNDAS, R. & LEYLAND, A. H. 2016.

409
Dying younger in Scotland: Trends in mortality and deprivation relative to England and Wales, 1981–2011. Health & Place, 40, 106-115.
SCOTPHO. 2016. Healthy life expectancy: key points [Online]. Available: http://www.scotpho.org.uk/population-dynamics/healthy-life-expectancy/key-points.
SCOTT, S., CURNOCK, E., MITCHELL, R., ROBINSON, M., TAULBUT, M., TOD, E. & MCCARTNEY, G. 2013. What would it take to eradicate health inequalities? Testing the fundamental causes theory of health inequalities in Scotland.
SCOTTISH EXECUTIVE 2006. Scottish Index of Multiple Deprivation 2006 Technical Report. Edinburgh Scottish Executive.
SEAMAN, R., LEYLAND, A. H. & POPHAM, F. 2016a. How have trends in lifespan variation changed since 1950? A comparative study of 17 Western European countries. The European Journal of Public Health, 26, 360-362.
SEAMAN, R., LEYLAND, A. H. & POPHAM, F. 2016b. Increasing inequality in age of death at shared levels of life expectancy: A comparative study of Scotland and England and Wales. SSM - Population Health, 2, 724-731.
SEAMAN, R., MITCHELL, R., DUNDAS, R., LEYLAND, A. & POPHAM, F. 2015. How much of the difference in life expectancy between Scottish cities does deprivation explain? BMC Public Health, 15, 1-9.
SELIGMAN, B., GREENBERG, G. & TULJAPURKAR, S. 2016. Equity and length of lifespan are not the same. Proceedings of the National Academy of Sciences, 113, 8420-8423.
SEN, A. 1992. Inequality reexamined, Clarendon Press. SEN, A. 2002. Why health equity? Health economics, 11, 659-666. SHELTON, N. J. 2009. Regional risk factors for health inequalities in Scotland and
England and the ―Scottish effect‖. Social Science & Medicine, 69, 761-767.
SHKOLNIKOV & ANDREEV, E. M. 2010. Age-decomposition of a difference between two populations for any life-table quantity in Excel. In: MAX PLANCK INSTITUTE FOR DEMOGRAPHIC RESEARCH. (ed.). Rostock
SHKOLNIKOV, ANDREEV, E. M., ZHANG, Z., OEPPEN, J. & VAUPEL, J. W. 2011. Losses of expected lifetime in the United States and other developed countries: methods and empirical analyses. Demography, 48, 211-239.
SHKOLNIKOV, V. M., JASILIONIS, D., ANDREEV, E. M., JDANOV, D. A., STANKUNIENE, V. & AMBROZAITIENE, D. 2007. Linked versus unlinked estimates of mortality and length of life by education and marital status: evidence from the first record linkage study in Lithuania. Social science & medicine, 64, 1392-1406.
SINGH, G. K. 2003. Area Deprivation and Widening Inequalities in US Mortality, 1969–1998. American Journal of Public Health, 93, 1137-1143.
SINGH, G. K. & SIAHPUSH, M. 2006. Widening socioeconomic inequalities in US life expectancy, 1980–2000. International Journal of Epidemiology, 35, 969-979.
SMITH, G. D. & EGGER, M. 1996. Commentary: understanding it all--health, meta-theories, and mortality trends. BMJ: British Medical Journal, 313, 1584.
SMITH, R. 2008. The end of disease and the begining of health BMJ group blogs [Online]. Available from: http://blogs.bmj.com/bmj/2008/07/08/richard-smith-the-end-of-disease-and-the-beginning-of-health/.

410
SMITS, J. & MONDEN, C. 2009. Length of life inequality around the globe. Social Science & Medicine, 68, 1114-1123.
STATA. 2016. Fractional Polynomials [Online]. Available: http://www.stata.com/stata13/fractional-polynomials/ [Accessed 20/04/2016.
STUCKLER, D., BASU, S., SUHRCKE, M., COUTTS, A. & MCKEE, M. The public health effect of economic crises and alternative policy responses in Europe: an empirical analysis. The Lancet, 374, 315-323.
SURVEILLANCE RESEARCH CANCER CONTROL AND POPULATION SCIENCES NATIONAL CANCER INSTITUTE 2013. Joinpoint Regression Program 4.0.4. In: NATIONAL INSTITUTE OF HEALTH (ed.). Bethesda.
SUSSER, M. 1993. Health as a human right: an epidemiologist's perspective on the public health. American Journal of Public Health, 83, 418-426.
SUSSER, M. & STEIN, Z. 2009. Eras in epidemiology: the evolution of ideas, Oxford University Press.
TEUTSCH, S. M. & CHURCHILL, R. E. 2000. Principles and practice of public health surveillance, Oxford University Press, USA.
THE POVERTY SITE. 2016. Premature death [Online]. Available: http://www.poverty.org.uk/s60/index.shtml [Accessed 13th June 2016].
THE SCOTTISH GOVERNMENT 2008. Equally Well; report of the ministerial task force on health inequalities. In: THE SCOTTISH GOVERNMENT (ed.). Edinburgh
THE SCOTTISH GOVERNMENT 2010. Equally Well review in 2010. THE SCOTTISH GOVERNMENT 2016. Scottish Index of Multiple Deprivation: ranks
and domain ranks. In: THE SCOTTISH GOVERNMENT (ed.). Edinburgh National Statistics.
THE SCOTTISH GOVERNMENT & NATIONAL STATISTICS. 2012. Scottish index of multiple deprivation - most deprived datazones [Online]. Edinburgh Available: http://simd.scotland.gov.uk/publication-2012/simd-2012-results/overall-simd-results/most-deprived-datazones/ [Accessed 11/06/2013 2013].
THE SCOTTISH GOVERNMENT. 2014. Life expectancy and healthy life expectancy [Online]. Edinburgh The Scottish Government.,. Available: http://www.scotland.gov.uk/Topics/Statistics/Browse/Health/TrendLifeExpectancy [Accessed 14.04.2014 2014].
TIMMINS, N. 2001. The five giants: a biography of the welfare state, HarperCollins.
TOWNSEND, P. 1979. Poverty in the United Kingdom: a survey of household resources and standards of living, University of California Press.
TOWNSEND, P. 1987. Deprivation. Journal of social policy, 16, 125-146. TOWNSEND, P. & DAVIDSON, N. 1992. Inequalities in health: the Black report,
Penguin Harmondsworth. TULJAPURKAR, S. 2010. The final inequality: variance in age at death.
Demography and the Economy. University of Chicago Press. TULJAPURKAR, S., LI, N. & BOE, C. 2000. A universal pattern of mortality decline
in the G7 countries. Nature, 405, 789-792. TUNSTALL, H., MITCHELL, R., DORLING, D., GIBBS, J. & PLATT, S. 2011. Socio-
demographic diversity and unexplained variation in death rates between the most deprived areas in Britain. Journal of Epidemiology and Community Health, 65, 22-23.

411
UNITED NATIONS 10 December 1948. The Universal declaration of human rights,. Paris: available from http://www.un.org/en/universal-declaration-human-rights/.
VAGERÖ, D. & LUNDBERG, O. 1989. Health inequalities in Britain and Sweden. The Lancet, 334, 35-36.
VALLIN, J. & MESLÉ, F. 2004. Convergences and divergences in mortality: A new approach of health transition. Demographic Research, S2, 11-44.
VAN RAALTE, A. 2011a. Lifespan variation: Methods, trends and the role of socioeconomic inequality, Erasmus University Rotterdam.
VAN RAALTE, A., KUNST, A. E., LUNDBERG, O., LEINSALU, M., MARTIKAINEN, P., ARTNIK, B., DEBOOSERE, P., STIRBU, I., WOJTYNIAK, B. & MACKENBACH, J. P. 2012. The contribution of educational inequalities to lifespan variation. Popul Health Metr, 10, 3-3.
VAN RAALTE, A., MYRSKYLÄ, M. & MARTIKAINEN, P. 2015. The role of smoking on mortality compression: An analysis of Finnish occupational social classes, 1971-2010. Demographic Research, 32, 589-620.
VAN RAALTE, A. A. 2011b. The Japanase female age pattern of mortality decline. Lifespan variation: Methods, trends and the role of socioeconomic inequality University Medical Centre Rotterdam.
VAN RAALTE, A. A. & CASWELL, H. 2013. Perturbation Analysis of Indices of Lifespan Variability. Demography, 50, 1615-1640.
VAN RAALTE, A. A., KUNST, A. E., DEBOOSERE, P., LEINSALU, M., LUNDBERG, O., MARTIKAINEN, P., STRAND, B. H., ARTNIK, B., WOJTYNIAK, B. & MACKENBACH, J. P. 2011. More variation in lifespan in lower educated groups: evidence from 10 European countries. International journal of epidemiology, 40, 1703-1714.
VAN RAALTE, A. A., MARTIKAINEN, P. & MYRSKYLÄ, M. 2014. Lifespan Variation by Occupational Class: Compression or Stagnation Over Time? Demography, 51, 73-95.
VAUPEL, J. W. 1986. How change in age-specific mortality affects life expectancy. Population Studies, 40, 147-157.
VAUPEL, J. W., ZHANG, Z. & VAN RAALTE, A. A. 2011. Life expectancy and disparity: an international comparison of life table data. BMJ open, 1.
WAGENAAR, A. C., SALOIS, M. J. & KOMRO, K. A. 2009. Effects of beverage alcohol price and tax levels on drinking: a meta-analysis of 1003 estimates from 112 studies. Addiction, 104, 179-190.
WALLEY, J., WRIGHT, J., HUBLEY, J., ESCOTT, S., HOLLOWAY, K., SCHWEIGER, M. & WITTER, S. 2001. Public health: an action guide to improving health in developing countries, Oxford University Press.
WALSH, D., MCCARTNEY, G., COLLINS, C., TAULBUT, M. & BATTY, G. D. 2016. History, politics and vulnerabiliy: explaining excess mortality in Scotland and Glasgow. In: HEALTH, G. C. F. P. (ed.). Glasgow: Glasgow Centre for Population Health.
WALSH, D., TAULBUT, M. & HANLON, P. 2010. The aftershock of deindustrialization—trends in mortality in Scotland and other parts of post-industrial Europe. The European Journal of Public Health, 20, 58-64.
WHITE, A., MCKEE, M., DE SOUSA, B., DE VISSER, R., HOGSTON, R., MADSEN, S. A., MAKARA, P., RICHARDSON, N., ZATOŃSKI, W. & RAINE, G. 2014. An examination of the association between premature mortality and life

412
expectancy among men in Europe. The European Journal of Public Health, 24, 673-679.
WHITEHEAD, M., TOWNSEND, P. & DAVIDSEN, N. 1992. Inequalities in Health: The Black Report: the Health Divide, Penguin.
WILKINSON, R. G. 1989. Class mortality differentials, income distribution and trends in poverty 1921–1981. Journal of social policy, 18, 307-335.
WILKINSON, R. G. 1997. Socioeconomic determinants of health: Health inequalities: relative or absolute material standards? Bmj, 314, 591.
WILKINSON, R. G. 2005. The impact of inequality : how to make sick societies healthier, London, Routledge.
WILKINSON, R. G. & PICKETT, K. 2010. The spirit level: why more equal societies almost always do better, Allen Lane.
WILKINSON, R. G. & PICKETT, K. E. 2006. Income inequality and population health: a review and explanation of the evidence. Social science & medicine, 62, 1768-1784.
WILMOTH, J. R., ANDREEV, K., JDANOV, D., GLEI, D. A., BOE, C., BUBENHEIM, M., PHILIPOV, D., SHKOLNIKOV, V. & VACHON, P. 2007. Methods protocol for the human mortality database. University of California, Berkeley, and Max Planck Institute for Demographic Research, Rostock. URL: http://mortality. org [version 31/05/2007].
WILMOTH, J. R. & HORIUCHI, S. 1999. Rectangularization revisited: Variability of age at death within human populations. Demography, 36, 475-495.
WILPER, A. P., WOOLHANDLER, S., LASSER, K. E., MCCORMICK, D., BOR, D. H. & HIMMELSTEIN, D. U. 2009. Health insurance and mortality in US adults. American journal of public health, 99, 2289-2295.
WOOD, R., SUTTON, M., CLARK, D., MCKEON, A. & BAIN, M. 2006. Measuring inequalities in health: the case for healthy life expectancy. Journal of epidemiology and community health, 60, 1089-1092.
WOOLF, S. H. & ARON, L. Y. 2013. The US health disadvantage relative to other high-income countries: findings from a National Research Council/Institute of Medicine report. Jama, 309, 771-772.
WORLD HEALTH ORGANISATION 1948. WHO Constitution. Geneva. WORLD HEALTH ORGANISTATION 2000. The world health report 2000: health
systems: improving performance. In: ORGANIZATION., W. H. (ed.). WORLD HEALTH ORGANIZATION 1984. Health promotion: a discussion document
on the concept and principles: summary report of the Working Group on Concept and Principles of Health Promotion, Copenhagen, 9-13 July 1984.
WORLD HEALTH ORGANIZATION 1998. Health 21: An introduction to the health for all policy framework for the WHO European Region.
WORLD HEALTH ORGANIZATION 2004. International statistical classification of diseases and related health problems, World Health Organization.
WORLD HEALTH ORGANIZATION 2008. Commission on Social Determinants of Healthfinal report. Geneva, Switzerland: World Health Organization, Commission on Social Determinants of Health.
WORLD HEALTH ORGANIZATION 2010. World health statistics 2010, World Health Organization.
WORLD HEALTH ORGANIZATION. 2012. International classification of diseases (ICD) [Online]. Available: http://www.who.int/classifications/icd/en/.
WUNSCH, G., MOUCHART, M. & DUCHÊNE, J. 2013. The life table: modelling survival and death, Springer Science & Business Media.

413
YANG, J. 2012. Interpreting coefficients in regression with log-transformed variables. StatNews, 83.
YUILL, C. 2010. Key concepts in health studies. In: CRINSON, I. (ed.). London: SAGE Publications Ltd.
ZHANG, Z. & VAUPEL, J. 2009. The age separating early deaths from late deaths. Demographic Research, 20, 721-730.