Seafood Watch
73
Longfin Squid, Shortfin Squid Doryteuthis (Loligo) pealeii, Illex illecebrosus ©Scandinavian Fishing Yearbook US East Coast Bottom Trawl November 9, 2012 Oren Frey, Consulting Researcher Disclaimer Seafood Watch® strives to ensure all our Seafood Reports and the recommendations contained therein are accurate and reflect the most up-to-date evidence available at time of publication. All our reports are peer- reviewed for accuracy and completeness by external scientists with expertise in ecology, fisheries science or aquaculture. Scientific review, however, does not constitute an endorsement of the Seafood Watch program or its recommendations on the part of the reviewing scientists. Seafood Watch is solely responsible for the conclusions reached in this report. We always welcome additional or updated data that can be used for the next revision. Seafood Watch and Seafood Reports are made possible through a grant from the David and Lucile Packard Foundation.
Transcript of Seafood Watch

Longfin Squid, Shortfin Squid Doryteuthis (Loligo) pealeii, Illex illecebrosus
©Scandinavian Fishing Yearbook
US East Coast
Bottom Trawl
November 9, 2012 Oren Frey, Consulting Researcher
Disclaimer Seafood Watch® strives to ensure all our Seafood Reports and the recommendations contained therein are accurate and reflect the most up-to-date evidence available at time of publication. All our reports are peer-reviewed for accuracy and completeness by external scientists with expertise in ecology, fisheries science or aquaculture. Scientific review, however, does not constitute an endorsement of the Seafood Watch program or its recommendations on the part of the reviewing scientists. Seafood Watch is solely responsible for the conclusions reached in this report. We always welcome additional or updated data that can be used for the next revision. Seafood Watch and Seafood Reports are made possible through a grant from the David and Lucile Packard Foundation.

2
Final Seafood Recommendation
This report provides recommendations for two US domestic squid fisheries, longfin squid (Doryteuthis pealeii, formerly Loligo pealeii or Loligo pealei), and northern shortfin squid (Illex illecebrosus) found in the US Mid-Atlantic trawl fishery, which accounted for 77% of all US landings of the species in 2010.
Both species of squid are a Good Alternative.
Fishery Impacts on the Stock
Impacts on Other Species
Manage-ment
Habitat and Ecosystem
Overall
Rank
(Score)
Lowest scoring species
Rank*, Subscore, (Score)
Rank (Score)
Rank (Score)
Recommendation (Score)
Longfin Squid, Trawl Yellow
(3.05)
Loggerhead Sea Turtles
Red, (1.92,1.72)
Yellow (3)
Yellow (2.6)
GOOD ALTERNATIVE
(2.53)
Shortfin Squid, Trawl Yellow
(2.64)
Loggerhead Sea Turtles
Red, (1.92,1.92)
Yellow (3)
Yellow (2.6)
GOOD ALTERNATIVE
(2.51)
Scoring note – scores range from zero to five where zero indicates very poor performance and five indicates the fishing operations have no significant impact. * Rank and color in the 'Impacts on other Species' column is defined based on the Subscore rather than the Score. See scoring rules for more information.
3
Table of Contents
Executive Summary ....................................................................................................................................... 4
Introduction .................................................................................................................................................. 6
Analysis ....................................................................................................................................................... 12
Criterion 1: Stock for Which You Want a Recommendation ................................................................................... 12
Criterion 2: Impacts on other retained and bycatch stocks .................................................................................... 24
Criterion 3: Management Effectiveness .................................................................................................................. 37
Criterion 4: Impacts on the Habitat and Ecosystem ................................................................................................ 51
Overall Recommendation ........................................................................................................................... 60
Acknowledgements ..................................................................................................................................... 61
References .................................................................................................................................................. 62
Appendix A: Review Schedule .................................................................................................................... 70
About Seafood Watch® ............................................................................................................................... 71
Guiding Principles ....................................................................................................................................... 72

4
Executive Summary This report provides recommendations for two US domestic squid fisheries, longfin squid (Doryteuthis pealeii, formerly Loligo pealeii or Loligo pealei), and northern shortfin squid (Illex illecebrosus. Longfin squid is a pelagic schooling species of the family Loliginidae. It is found in continental shelf and slope waters from Newfoundland to the Gulf of Venezuela, and occurs in commercial abundance from Southern Georges Bank to Cape Hatteras. This report covers the US Mid-Atlantic trawl fishery, which accounted for 78% of all US landings of the species in 2010. The northern shortfin squid is a highly migratory species distributed from Labrador to Florida. It inhabits offshore continental shelf and slope waters and a small-mesh trawl fishery occurs near the edge of the continental shelf from Newfoundland to Cape Hatteras. The northern stock component, extending from Newfoundland to the Scotian Shelf, is assessed annually and managed by the Northwest Atlantic Fisheries Organization (NAFO). This report is on the southern component of the stock found in US waters from the Gulf of Maine south (NAFO Subareas 5 and 6).
Longfin squid and shortfin squid are highly resilient to fishing pressure. Regular stock assessments are performed for longfin squid and biomass has generally fluctuated around or above targets. While 2009 (most recent) estimates of biomass were near proposed targets and NMFS stock status is “not overfished,” biomass fluctuates widely from year to year. A proxy reference point for BMSY was proposed in 2010, and in recent decades biomass has not fallen below this threshold. However, there has been some disagreement about the techniques used to reach this reference point. Additionally, multiple generations of longfin squid have occurred since the last stock assessment. There is evidence that the longfin squid stock is only lightly exploited, as the stock has successfully supported the range of observed catches from 1976 to the present. However, the NMFS overfishing status is unknown. Shortfin squid stock status is unknown due to insufficient biomass data, although current landings and survey data suggest productivity is moderate and increasing. Accepted biological reference points for fishing mortality for shortfin squid do not exist and the impact of fishing mortality on this fishery is highly debated.
The scores for both the longfin and shortfin squid fisheries are limited by loggerhead sea turtles (Caretta caretta). Butterfish, which until recent years was in decline and is caught more than any other non-target species in the East Coast squid trawl fisheries, has been considered a high bycatch concern. Butterfish remains a stock of concern, but of greater concern is the take of loggerhead sea turtles in both fisheries. The population size of loggerhead sea turtles has been in decline over the past decade, and subpopulations of the species are listed as both threatened and endangered. The average annual capture of loggerhead sea turtles in bottom otter trawl gear used in the Atlantic mackerel, squid and
butterfish (MSB) fisheries combined has been estimated to be not more than 62 loggerhead sea turtles a year, of which 35 are expected to survive and 27 are expected to die or be seriously injured. Although this mortality alone may not threaten loggerhead sea turtle recovery, this impact must be considered in the context of the cumulative impacts of all fisheries on sea turtle populations. The management of the longfin squid fishery has effectively maintained stock biomass through the use of quotas, mortality caps, gear restrictions, and closed areas, but there is room to further incorporate scientific advice into management and to reduce occasional take of endangered/threatened and protected species. A suite of management measures have allowed the shortfin squid stock to recover from a period of low abundance. There are some concerns that the potential for recruitment

5
overfishing may still exist, particularly because this transboundary species is not managed jointly with the Canadian component of the stock. The shortfin squid fishery has lower levels of bycatch than the longfin squid fishery, and there is an established management system in place to monitor bycatch rates.
Longfin squid and shortfin squid habitat is sand and sand/mud along the continental shelf and slope and they are caught primarily by using bottom otter trawl gear. Benthic biological and physical structures may take some time to recover from trawling impact on this substrate. Recently, some shortfin squid landings have come from midwater trawl gear, but the extent to which bottom contact occurs with that gear is unknown. Although fishing effort by the domestic squid trawl fisheries is being effectively controlled, it is not actively being reduced and a substantial proportion of all representative habitats are unprotected, resulting in minimal mitigation for both longfin squid and shortfin squid fisheries. Shortfin squid and longfin squid are both exceptional forage species and there is still much to be learned about their roles in regional food webs, but recent independent research is encouraging.
6
Introduction
Scope of the analysis and ensuing recommendation This report provides recommendations for two US domestic squid fisheries. The longfin inshore squid (Doryteuthis pealeii, formerly Loligo pealeii or Loligo pealei) is a pelagic schooling species of the family Loliginidae. It is found in continental shelf and slope waters from Newfoundland to the Gulf of Venezuela, and occurs in commercial abundance from Southern Georges Bank to Cape Hatteras (Hendrickson and Jacobson 2006). This report is on the US Mid-Atlantic trawl fishery, which accounted for 78% of all US landings of the species in 2010 (MAFMC 2011b). The northern shortfin squid (Illex illecebrosus) is a highly migratory species distributed from Labrador to Florida. It inhabits offshore continental shelf and slope waters and a small-mesh trawl fishery occurs near the edge of the continental shelf from Newfoundland to Cape Hatteras (Hendrickson 2006). The northern stock component, extending from Newfoundland to the Scotian Shelf, is assessed annually and managed by the Northwest Atlantic Fisheries Organization (NAFO). This report is on the southern component of the stock, found in US waters from the Gulf of Maine south (NAFO Subareas 5 and 6). Specifically, this report is on the US Mid-Atlantic trawl fishery, which accounted for 77% of all US landings of the species in 2010 (MAFMC 2011d).
Species Overview i. Overview of the species and management bodies.
Longfin Squid Longfin squid are a short-lived species (~9 months) that have been targeted along the northeastern coast of the US since the 1880s, first as bait and now as food for humans and bait. The stock is roughly divided into a summer and winter spawned cohort, but it is believed a multitude of micro-cohorts exist. Longfin squid spawned in the summer are believed to exhibit a greater growth rate than those spawned in winter, although winter spawning has not been well studied (Hanlon et al. 2012). The majority of the longfin fishery usually (but not always) occurs during the winter and thus targets the summer-spawned cohort (NMFS 2011a). Longfin squid are under the jurisdiction of the Mid-Atlantic Fisheries Management Council (MAFMC), and are managed together with shortfin squid, Atlantic mackerel and butterfish under the Atlantic Mackerel, Squid, and Butterfish (MSB) Fishery Management Plan (FMP).
Shortfin Squid
Shortfin squid are a short-lived species (up to 215 days; NMFS 2004) that exhibit seasonal migration based upon water temperature, and spawn throughout the year. They winter in offshore continental slope waters and migrate inshore to the continental shelf during spring and summer in “microcohorts” (Hendrickson and Showell 2006) but are considered a unit stock throughout their range. Shortfin squid are targeted primarily from June to September as they migrate through prime fishing grounds. Like longfin squid, shortfin squid are under the jurisdiction of the MAFMC’s MSB FMP.

7
ii. Production statistics. Longfin Squid Although the fishery was formerly of minor importance to the US due to low market demand, squid have long been popular food fish in foreign markets and US longfin squid were targeted by foreign vessels from late 1960s to the mid-1980s (Hendrickson and Jacobson 2006). Landings peaked at 37,000 mt in 1973 (MAFMC 2011b; Figure 1). After this, extended US fishery jurisdiction reduced foreign allocations and by the late 1980s foreign landings had ended (Figure 1; (MAFMC 2011b). US landings of longfin squid averaged 17,181 mt from 1987-2009 (the period of domestic fishery dominance), with a median catch of 17,328 mt (MAFMC 2011b; Figure 1). During 1988-1995, catches were generally at or above this median. However, since in-season quotas were implemented in 2000, fishery closures have occurred at least once per year and catches have usually been below the median. Since 2005 catches have declined, and in 2010 reached their minimum since 1968 at 6,855 mt (NEFSC 2011), but rebounded slightly in 2011 (Didden 2012). Preliminary 2012 landings suggest the 2012 longfin squid fishery will produce at least as much as 2011 unless limited by the butterfish cap on the longfin fishery (Didden 2012). Longfin squid landings in 2010 were dominated by five US states: Rhode Island (49%), New York (26%), New Jersey (10%), Massachusetts (10%), and Connecticut (4%) (NMFS 2012a).
Figure 1. Longfin squid landings in the US EEZ by calendar year, 1963-2011. Data include all gear types. (Figure from MAFMC 2012d)
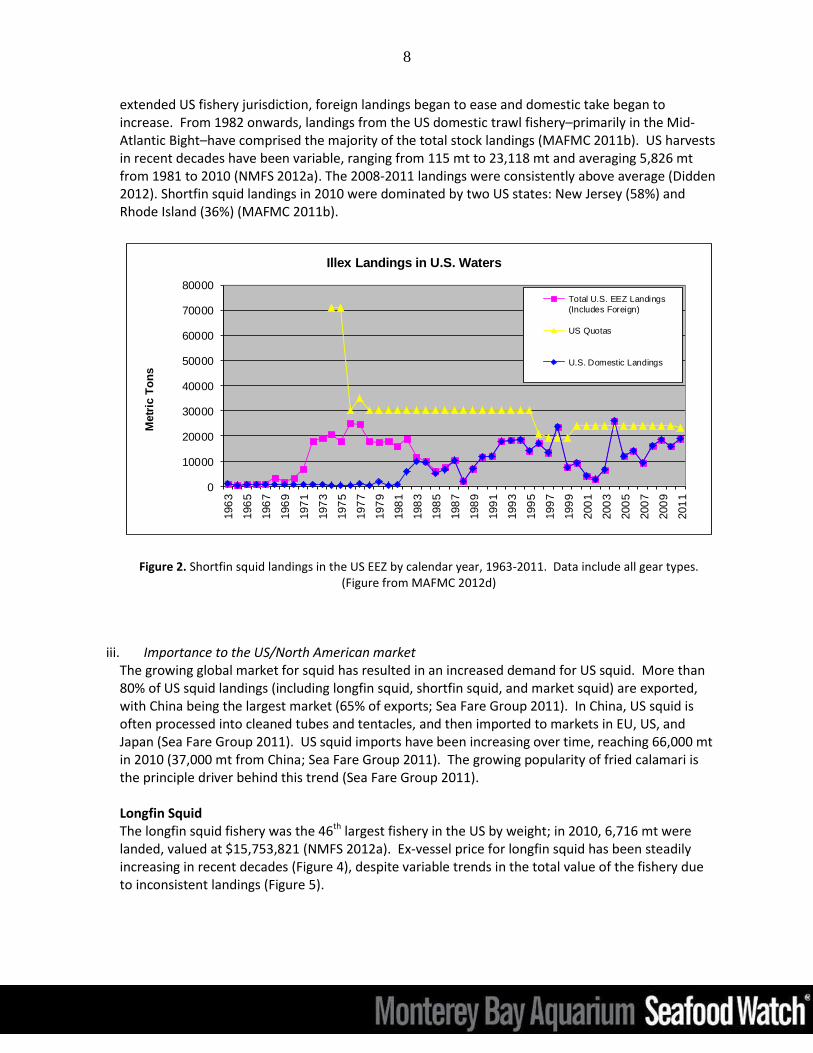
Shortfin Squid Total landings of the shortfin squid stock increased rapidly during the 1970s, from 1,600 mt in 1969 to a peak of 179,300 mt in 1979, and were mostly from the northern stock component in Canadian waters (Hendrickson and Showell 2006). After peaking at 162,100 mt in 1979, landings from the northern stock component declined rapidly to 400 mt in 1983 and have since remained at low levels (Hendrickson and Showell 2006). Similar to longfin squid, shortfin squid landings in US waters were dominated by foreign fleets in the 1970s and 1980s (Figure 2; MAFMC 2011b). With the advent of
8
extended US fishery jurisdiction, foreign landings began to ease and domestic take began to increase. From 1982 onwards, landings from the US domestic trawl fishery–primarily in the Mid-Atlantic Bight–have comprised the majority of the total stock landings (MAFMC 2011b). US harvests in recent decades have been variable, ranging from 115 mt to 23,118 mt and averaging 5,826 mt from 1981 to 2010 (NMFS 2012a). The 2008-2011 landings were consistently above average (Didden 2012). Shortfin squid landings in 2010 were dominated by two US states: New Jersey (58%) and Rhode Island (36%) (MAFMC 2011b).
0
10000
20000
30000
40000
50000
60000
70000
80000
196
3
196
5
196
7
196
9
197
1
197
3
197
5
197
7
197
9
198
1
198
3
198
5
198
7
198
9
199
1
199
3
199
5
199
7
199
9
200
1
200
3
200
5
200
7
200
9
201
1
Metr
ic T
on
s
Illex Landings in U.S. Waters
Total U.S. EEZ Landings
(Includes Foreign)
US Quotas
U.S. Domestic Landings
Figure 2. Shortfin squid landings in the US EEZ by calendar year, 1963-2011. Data include all gear types. (Figure from MAFMC 2012d)
iii. Importance to the US/North American market
The growing global market for squid has resulted in an increased demand for US squid. More than 80% of US squid landings (including longfin squid, shortfin squid, and market squid) are exported, with China being the largest market (65% of exports; Sea Fare Group 2011). In China, US squid is often processed into cleaned tubes and tentacles, and then imported to markets in EU, US, and Japan (Sea Fare Group 2011). US squid imports have been increasing over time, reaching 66,000 mt in 2010 (37,000 mt from China; Sea Fare Group 2011). The growing popularity of fried calamari is the principle driver behind this trend (Sea Fare Group 2011). Longfin Squid The longfin squid fishery was the 46th largest fishery in the US by weight; in 2010, 6,716 mt were landed, valued at $15,753,821 (NMFS 2012a). Ex-vessel price for longfin squid has been steadily increasing in recent decades (Figure 4), despite variable trends in the total value of the fishery due to inconsistent landings (Figure 5).

9
Figure 4. US longfin squid ex-vessel prices ($/mt), 1982-2011 (CPI adjusted, 1982 base). (Figure from MAFMC
2012d)
Figure 5. Market (ex-vessel nominal) values by calendar year of total US landings for longfin squid, 1982-2011. (Figure from MAFMC 2012d)
Shortfin Squid The shortfin squid fishery was the 29th largest fishery in the US by weight; in 201015,823 mt were landed, valued at $11,286,559 (NMFS 2012a). Shortfin squid landings are heavily influenced by year

10
to year availability of the resource in addition to market demand. Nominal price of shortfin squid has moved erratically since 1981 (Figure 6; NMFS 2012a), as has the total value generated by the fishery (Figure 7). This is not surprising given that both landings and price vary so much.
Figure 6. US shortfin squid ex-vessel prices ($/mt), 1981-2011 (CPI adjusted, 1982 base) . (Figure from
MAFMC 2012d)
Figure 7. Market (ex-vessel nominal) values by calendar year of total US landings for shortfin squid, 1981-
2011. (Figure from MAFMC 2012d)
11
iv. Common and market names Longfin Squid Longfin squid were previously referenced in the literature as Loligo pealeii (or pealei), prior to the name change to Doryteuthis pealeii (Hanlon 2012). Many papers still refer to longfin squid as “Loligo squid.”. Other common names for longfin squid include long-finned squid, winter squid, common squid, and boned squid (NMFS 2012d; FAO 2012b), and in neuroscience circles it is sometimes called the “Woods Hole squid.” Shortfin Squid Shortfin squid are typically referred to in the literature as “Illex squid” or simply “Illex.” It is also known by the common names northern short-finned squid and summer squid (FAO 2012a).
v. Primary product forms. Edible parts of squid include the arms, the mantle (tube), and the fins, with cleaned tubes and arms, squid rings, stuffed squid, squid steak and calamari being the primary product forms for human consumption (Sea Fare Group 2011). Squid are an excellent source of protein, selenium, riboflavin, and vitamin B12 (NFMS 2012d). Longfin Squid Although primarily used for human consumption, a portion of the annual catch of longfin squid is also used for bait purposes. Shortfin Squid Shortfin squid are generally used as bait in commercial and recreational fisheries, but can also be used for human consumption.

12
Analysis
Scoring guide All scores result in a zero to five final score for the criterion and the overall final rank. A zero
score indicates poor performance, while a score of five indicates high performance.
The full Seafood Watch® Fisheries Criteria that the following scores relate to are available on our website at www.seafoodwatch.org.
Criterion 1: Stock for Which You Want a Recommendation
Guiding principles
The stock is healthy and abundant. Abundance, size, sex, age and genetic structure should be maintained at levels that do not impair the long-term productivity of the stock or fulfillment of its role in the ecosystem and food web.
Fishing mortality does not threaten populations or impede the ecological role of any marine life. Fishing mortality should be appropriate given current abundance and inherent resilience to fishing while accounting for scientific uncertainty, management uncertainty, and non-fishery impacts such as habitat degradation.
Stock Fishery Inherent Vulnerability
Stock Status Fishing Mortality
Criterion 1
Rank Rank (Score) Rank (Score) Rank (Score)
Longfin Squid
Longfin Squid, Trawl
Low Low Concern (4)
Moderate Concern (2.33)
Yellow (3.05)
Shortfin Squid
Shortfin Squid, Trawl
Low Moderate Concern (3)
Moderate Concern (2.33)
Yellow (2.64)
Justification of Ranking Factor 1.1 Inherent Vulnerability: Low Vulnerability Key relevant information: Longfin squid and shortfin squid have a low inherent vulnerability due to their short lifespans, fast growth to maturity and rapid recruitment into the fishery.

13
Detailed rationale:
Factor Longfin Squid Score Source
Average age at maturity ~3 months 3
(Hanlon 2012; Hatfield and Cadrin 2002)
Average maximum age < 9 months 3 (Hanlon 2012; Macy and Brodziak 2001)
Reproductive strategy Demersal egg layer 2 (Hanlon 2012)
Density dependence No depensatory or compensatory
dynamics demonstrated or likely
2 (Hanlon 2012)
Score (mean of factor scores) 2.5, Low vulnerability
Factor Shortfin Squid Score Source
Average age at maturity <1 year 3 (Hendrickson 2004)
Average maximum age 1 year 3 (Hendrickson 2006)
Reproductive strategy Demersal Egg layer
2 (Hendrickson 2004)
Density dependence No depensatory or compensatory dynamics likely
2 (Dawe et al. 2000)
Score (mean of factor scores) 2.5, Low vulnerability
Factor 1.2 Stock Status Longfin Squid: Low Concern Key relevant information: Based upon the proposed BTHRESHOLD of 21,203 mt, in 2009 the longfin squid stock was believed to be well above the level of being overfished (Figure 10; NEFSC 2011; MAFMC 2011c). NMFS stock status is “not overfished,” although it is worth noting that multiple generations of longfin squid have occurred since the last stock assessment. Furthermore, estimated biomass has been well above thresholds in most years since the mid-1970s. Although the assessment process appears to have been robust, the biomass reference points proposed have not yet been widely accepted. There were some concerns about the proposed BMSY proxy, and one independent reviewer in the stock assessment review committee (SARC) expressed doubts about the applicability of the approach used in SAW-51 (Tingley 2011). However, the reviewers ultimately accepted the reference point.
Detailed rationale: Longfin squid exhibit seasonal migration based upon water temperature, and spawn throughout the year. They winter in offshore waters on the continental slope (~400 m deep) and migrate inshore to the
14
continental shelf during spring and summer in “microcohorts” (NMFS 2005). The stock is roughly divided into a summer and winter spawned cohort. Although those spawned in the summer are believed to show a greater growth rate than those spawned in winter, winter spawning has not been well studied (Hanlon et al. 2012). Within the range of commercial exploitation, the population is considered to be a single stock unit, however recent genetic research has opened the debate on possibility of multiple stocks (Buresch et al. 2006; Hanlon et al. 2012). The stock exhibits very large fluctuations in abundance due to varying reproductive success and recruitment, and survey biomass is often characterized by large inter-annual changes on the level of 2-3 fold (NEFSC 2011).

15
Figure 9. Annual estimates of longfin squid biomass (annual averages of NEFSC spring and fall survey biomass) (A), March-April biomass and consumption in relation to January-June catch, (B) and September-October biomass and consumption in relation to July-December catch (C). The grey lines represent the two-year moving averages which, in the top figure, indicate the 2009 value used for stock status determination. (Figure from NEFSC 2011)

16
The longfin squid stock was most recently assessed in 2010 at the 51st Stock Assessment Workshop (SAW-51). This assessment was based on refinement of a method used during the previous assessment (SAW-34 in 2002). Biomass estimates from Northeast Fisheries Science Center (NEFSC) spring (March-April) and fall (September-October) bottom trawl surveys from 2008-2009 were averaged and used in conjunction with seasonal and annual exploitation indices to compute catchability-adjusted swept-area biomass (NEFSC 2011). The spring and fall biomass estimates represent seasonal cohorts that are available to the January-June and July-December fisheries, respectively (NEFSC 2011). Only daytime catches were used to compute the biomass estimates because the capture efficiency of bottom trawls for longfin squid is highest during the day. Longfin squid biomass for 2009 was estimated to be 54,442 mt (80% CI = 38,452-71,783 mt) (NEFSC 2011). Although prior to 2010 a biomass reference point did not exist, SAW-51 was able to suggest a new biomass reference point, proposing:
The median of the annual averages of the spring and fall survey biomass during 1976-2008 is 76,329 mt. The stock appears to be lightly exploited, so assuming that the 1976-2008 median biomass estimate represents 90% of the stock’s carrying capacity (K) a new BMSY target of 50% of K (0.50*(76,329/0.90) = 42,405 mt) is recommended. An appropriate biomass threshold is 50% of BMSY (= 21,203 mt) (NEFSC 2011).
Based upon this proposed BTHRESHOLD of 21,203 mt, in 2009 the longfin squid stock was believed to be well above the level of being overfished (Figure 10; NEFSC 2011; MAFMC 2011c). NMFS stock status for this fishery is “not overfished,” although it is worth noting that multiple generations of longfin squid have occurred since the last stock assessment. Furthermore, estimated biomass has been well above thresholds in most years since the mid-1970s (Figure 11). Although the assessment process appears to have been robust, the biomass reference points proposed have not yet been widely accepted. There were some concerns about the proposed BMSY proxy, and one independent reviewer in the stock assessment review committee (SARC) expressed doubts about the applicability of the approach used in SAW-51 (Tingley 2011). However, the reviewers did accept the reference point.

17
Figure 10. Longfin squid biomass estimate (mt x1000) based on spring and fall survey averages for 2008-2009,
shown as a probability distribution. Also shown are proposed biomass reference points. (Figure from NEFSC 2011)
Figure 11. Annual biomass (averages of annual spring and fall biomass/ BMSY threshold) in relation to the proposed
biomass threshold (shown here as a relative value). (Figure from NEFSC 2011)

18
Shortfin Squid: Moderate Concern Key relevant information: Although current landings and survey data suggest productivity is likely moderate, shortfin squid stock status is unknown due to insufficient growth and biological data.
Detailed rationale: The most recent stock assessment for shortfin squid occurred in 2005 (SAW-42) and stock status could not be evaluated because there were no reliable estimates of stock biomass or exploitation rates (MAFMC 2006). This is due, primarily, to a lack of available survey data and other assessment resources for this short-lived species. Although new models show promise, an ongoing lack of seasonal maturity and age data continues to render insufficient conclusions (MAFMC 2011b). Spawning areas are also uncertain as there have been no direct observations of spawning in nature (Hendrickson 2004; MAFMC 2011d). Landings in 2004 were the highest on record (26,100 mt) and the fishery was closed because the quota was reached (NEFSC 2006). Results from a biomass dynamics model that utilized US fishery data from 1982 to 1993 led to shortfin squid reference points specified in the MSB FMP of BMSY=39,300 mt and FMSY=1.22 per year (NEFSC 2006). However, this model is now considered inappropriate to use to derive biological reference points for the shortfin squid stock because it does not address the semelparous (living for only a single season or year) life history of shortfin squid (NEFSC 2006). NMFS stock status is “Unknown” (NMFS 2012i).
The NEFSC conducts bottom trawl research surveys that occur during both the annual spring shortfin squid inshore migration onto the continental shelf and during the species’ autumn offshore migration (Hendrickson 2004). An unknown fraction of the stock is located beyond the area sampled in these surveys. During spring surveys, shortfin squid are collected in low numbers and at fewer stations than in the autumn surveys. However, the autumn survey occurs near the end of the fishing season and, therefore, autumn survey indices may represent indices of spawning stock escapement. These survey data (Figure 12) may have the best potential to gauge stock size as they are representative of biomass surviving fishing pressure over a spawning cycle (MAFMC 2011d).

19
0.0
5.0
10.0
15.0
20.0
25.0
30.0
35.0
40.0
19
67
19
68
19
69
19
70
19
71
19
72
19
73
19
74
19
75
19
76
19
77
19
78
19
79
19
80
19
81
19
82
19
83
19
84
19
85
19
86
19
87
19
88
19
89
19
90
19
91
19
92
19
93
19
94
19
95
19
96
19
97
19
98
19
99
20
00
20
01
20
02
20
03
20
04
20
05
20
06
20
07
20
08
20
09
20
10
20
11
Nu
mb
er
pe
r to
w
1967-2011 Fall NEFSC Illex Index (number per tow)
Fall NEFSC Index #/tow
Index Median
Error Bars are ± 2 standarddeviations to approximate the
0.00
2.00
4.00
6.00
8.00
10.00
12.00
14.00
19
67
19
68
19
69
19
70
19
71
19
72
19
73
19
74
19
75
19
76
19
77
19
78
19
79
19
80
19
81
19
82
19
83
19
84
19
85
19
86
19
87
19
88
19
89
19
90
19
91
19
92
19
93
19
94
19
95
19
96
19
97
19
98
19
99
20
00
20
01
20
02
20
03
20
04
20
05
20
06
20
07
20
08
20
09
20
10
20
11
kg p
er
tow
1967-2011 Fall NEFSC Illex Index (weight per tow)
Fall NEFSC Index kg/tow
Index Median
Error Bars are ± 2 standarddeviations to approximate the
Figure 12. Shortfin squid relative abundance (A) and biomass (B) indices from NEFSC fall surveys, 1967-2011.
(Figure from MAFMC 2012d)
While fall survey data are highly variable depending on environmental conditions, trends do exist (MAFMC 2011d). The number of shortfin squid per tow was at its highest during the peak years of the fishery in the 1970s. The average number of shortfin squid per tow has been above average in almost every year since 2002, indicating that the stock may be in a relatively productive state. However,
A
B

20
another trend is a gradual decline in the mean size of shortfin squid. Mean weight of squid was greatest during the high productivity period from 1976 to 1981, and lower in most years since. In 2005, shortfin squid caught in US waters on autumn trawl surveys reached the lowest mean weight on record (67 g), but mean weight increased to 104 g by 2009 (Hendrickson and Showell 2010). A comparison of mean shortfin squid body weight in US waters (NAFO SA 5+6) with weights of the Canadian stock (Div. 4VWX) shows similar trends of lower mean weight, despite variation due to difference in fishing effort and environmental conditions (Figure 13; NEFSC 2006).
Figure 13. Mean weight per individual (g) of shortfin squid caught in NAFO Subareas 5+6 autumn bottom trawl surveys (1967-2009) and Canadian Div. 4VWX July bottom trawl surveys (1970-2009). (Figure from Hendrickson and Showell 2010) Trends in abundance and individual size of shortfin squid are known to vary greatly with climatic conditions. Dawe and colleagues (2000) showed that shortfin squid abundance is positively related to a favorable oceanographic regime associated with a negative North Atlantic Oscillation (NAO) index (weak winter northwesterly winds), high water temperatures off Newfoundland and southward shifts in the position of the Gulf Stream and the boundary between shelf waters and offshore slope waters (Dawe et al. 2000). It has been hypothesized that carrying capacity for shortfin squid is limited and that the southern (US) stock component approaches its relatively stable limit each year (Dawe et al. 2007). Squid body size and physical condition are likely related to recruitment magnitude, indicating early peak spawning or rapid growth rate in warm years of high abundance (O’Dor and Dawe 2012). In the 2009 Ecosystem Status Report for the Northeast US Continental Shelf Large Marine Ecosystem (NES LME), NMFS tracked changes in key indicators of climate, physical forcing, ecosystem dynamics, and the role of humans in this system. Thermal conditions in the NES LME are changing due to warming of coastal and shelf waters and cooling in the northern end of the range. As a consequence, there has been a constriction of thermal habitats in the ecosystem, a northward shift in the distributions of some fish species and a shift to a warmer-water fish community (EAP 2009). Effects on the shortfin squid stock would appear to be higher productivity coupled with a constriction in habitat due to cooling in Canadian waters (FAO Subareas 3 + 4). Such changes will have unknown effects on stock status.

21
Factor 1.3 Fishing Mortality Longfin Squid: Moderate Concern Key relevant information: Based on the 2010 SAW-51 stock assessment, fishing mortality is at or below a sustainable level and is not expected to reduce stock productivity. However, the current F reference point is now considered inappropriate, and NMFS overfishing status is “unknown.”
Detailed rationale: The current FMSY proxy (0.31 per quarter or 1.24 per year) was calculated in the 34th SAW (2002) as the 75th percentile of quarterly exploitation indices during 1987-2000 (NEFSC 2002a). Based on this exploitation reference point, overfishing was not occurring in the longfin squid stock in 2009 because the exploitation index was 0.063, compared to FTHRESHOLD (75th percentile of exploitation indices during 1987-2009), which is 0.277 (NEFSC 2011). The 2009 exploitation index of 0.176 (catch in 2009 divided by the average of the spring and fall survey biomass during 2008-2009; 80% CI = 0.124-0.232) was slightly below the 1987-2008 median of 0.237 (Figure 17; NEFSC 2011).
Figure 17. Longfin squid exploitation index for 2009 shown as a probability distribution. (Figure from NEFSC 2011)
The 51st SAW, however, concluded that the current F reference point is inappropriate for this lightly exploited stock, as there is no clear statistical relationship between longfin squid catch and annual biomass estimates during 1975-2009. A new threshold reference point was not recommended. While the 2010 assessment posited that fishing mortality is probably low, without real-time assessment
22
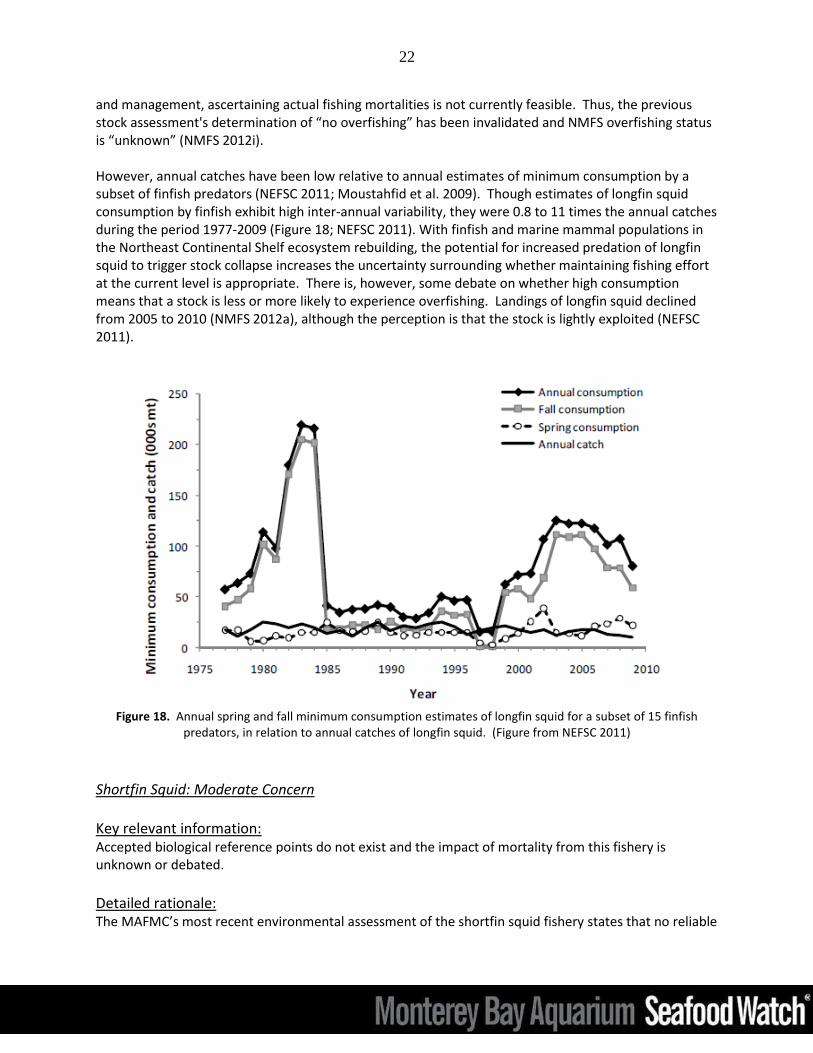
and management, ascertaining actual fishing mortalities is not currently feasible. Thus, the previous stock assessment's determination of “no overfishing” has been invalidated and NMFS overfishing status is “unknown” (NMFS 2012i). However, annual catches have been low relative to annual estimates of minimum consumption by a subset of finfish predators (NEFSC 2011; Moustahfid et al. 2009). Though estimates of longfin squid consumption by finfish exhibit high inter-annual variability, they were 0.8 to 11 times the annual catches during the period 1977-2009 (Figure 18; NEFSC 2011). With finfish and marine mammal populations in the Northeast Continental Shelf ecosystem rebuilding, the potential for increased predation of longfin squid to trigger stock collapse increases the uncertainty surrounding whether maintaining fishing effort at the current level is appropriate. There is, however, some debate on whether high consumption means that a stock is less or more likely to experience overfishing. Landings of longfin squid declined from 2005 to 2010 (NMFS 2012a), although the perception is that the stock is lightly exploited (NEFSC 2011).
Figure 18. Annual spring and fall minimum consumption estimates of longfin squid for a subset of 15 finfish
predators, in relation to annual catches of longfin squid. (Figure from NEFSC 2011)
Shortfin Squid: Moderate Concern Key relevant information: Accepted biological reference points do not exist and the impact of mortality from this fishery is unknown or debated.
Detailed rationale: The MAFMC’s most recent environmental assessment of the shortfin squid fishery states that no reliable

23
fishing mortality rate can be derived due to insufficient data on stock biomass (MAFMC 2011b). Previous estimates are considered invalid and the current MSY–based biological reference points are based on a biomass dynamics model that estimates MSY at 24,274 mt using data from 1982 to 1983 (NEFSC 1996). Amendment 8 of the FMP, which provides the basis of the current catch quota, specifies BMSY as 39,300 mt, MSY as 24,000 mt, and FMSY as 1.22 per year (MAFMC 1998). During 1999-2003, catches from NAFO Subareas 5+6 (the US stock) ranged between 2,750 t (in 2002) and 9,011 t (in 2000). The fishery was closed in September of 2004, when the highest catch on record (26,097 mt) was landed and the quota of 24,000 mt was exceeded. Landings declined to 9,022 in 2007, but then increased to 18,418 t in 2009 (Hendrickson and Showell 2010). Based on a number of qualitative analyses, including landing and survey trends, it was determined that overfishing was not likely to have occurred during 1999-2002 (MAFMC 2011d). Even though it has not been possible to evaluate fishing mortality on the stock of shortfin squid in more recent years, NMFS status remains as ‘no overfishing,’ based on the findings of SAW-42 in 2005 (NMFS 2012i). Shortfin squid is managed using quotas based on ‘acceptable biological catch’ (ABC) recommendations from the MAFMC’s Scientific and Statistical Committee (SSC). In 2011, the SSC recommended an ABC of 24,000 mt. The 24,000 mt ABC for shortfin squid is not an assessment-based ABC. The SSC has found that even though trawl survey CPUE and landings have varied, there do not appear to be any long-term trends; changes in landings could be the result of changes in abundance, availability, and/or market conditions. Additionally, there was no available evidence that landings of 24,000-26,000 mt had caused harm to the shortfin squid stock (Didden 2012). The SSC recommended this ABC for a three-year period (2012-2014), subject to SSC annual review. The fishery has not exceeded 24,000 mt except once in over 30 years (Didden 2012).
24
Criterion 2: Impacts on other retained and bycatch stocks
Guiding principles
The fishery minimizes bycatch. Seafood Watch® defines bycatch as all fisheries-related mortality or injury other than the retained catch. Examples include discards, endangered or threatened species catch, pre-catch mortality and ghost fishing. All discards, including those released alive, are considered bycatch unless there is valid scientific evidence of high post-release survival and there is no documented evidence of negative impacts at the population level.
Fishing mortality does not threaten populations or impede the ecological role of any marine life. Fishing mortality should be appropriate given each impacted species’ abundance and productivity, accounting for scientific uncertainty, management uncertainty and non-fishery impacts such as habitat degradation.
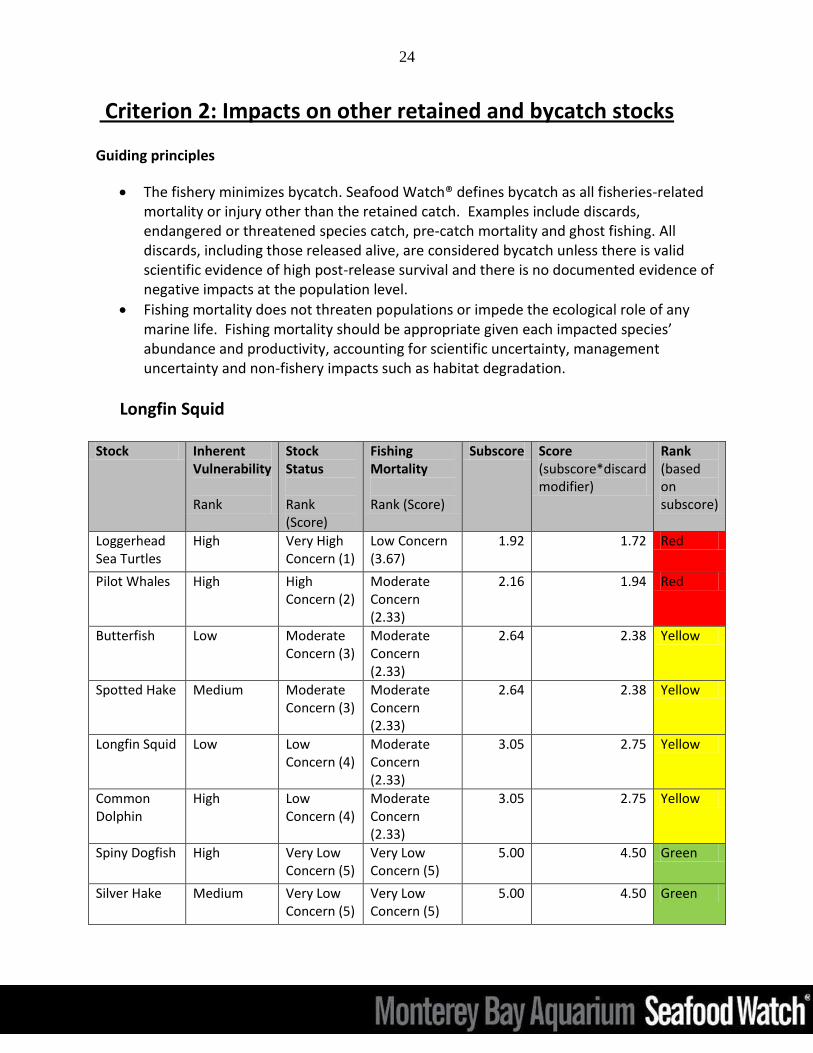
Longfin Squid
Stock Inherent Vulnerability Rank
Stock Status Rank (Score)
Fishing Mortality Rank (Score)
Subscore Score (subscore*discard modifier)
Rank (based on subscore)
Loggerhead Sea Turtles
High Very High Concern (1)
Low Concern (3.67)
1.92 1.72 Red
Pilot Whales High High Concern (2)
Moderate Concern (2.33)
2.16 1.94 Red
Butterfish Low Moderate Concern (3)
Moderate Concern (2.33)
2.64 2.38 Yellow
Spotted Hake Medium Moderate Concern (3)
Moderate Concern (2.33)
2.64 2.38 Yellow
Longfin Squid Low Low Concern (4)
Moderate Concern (2.33)
3.05 2.75 Yellow
Common Dolphin
High Low Concern (4)
Moderate Concern (2.33)
3.05 2.75 Yellow
Spiny Dogfish High Very Low Concern (5)
Very Low Concern (5)
5.00 4.50 Green
Silver Hake Medium Very Low Concern (5)
Very Low Concern (5)
5.00 4.50 Green
25
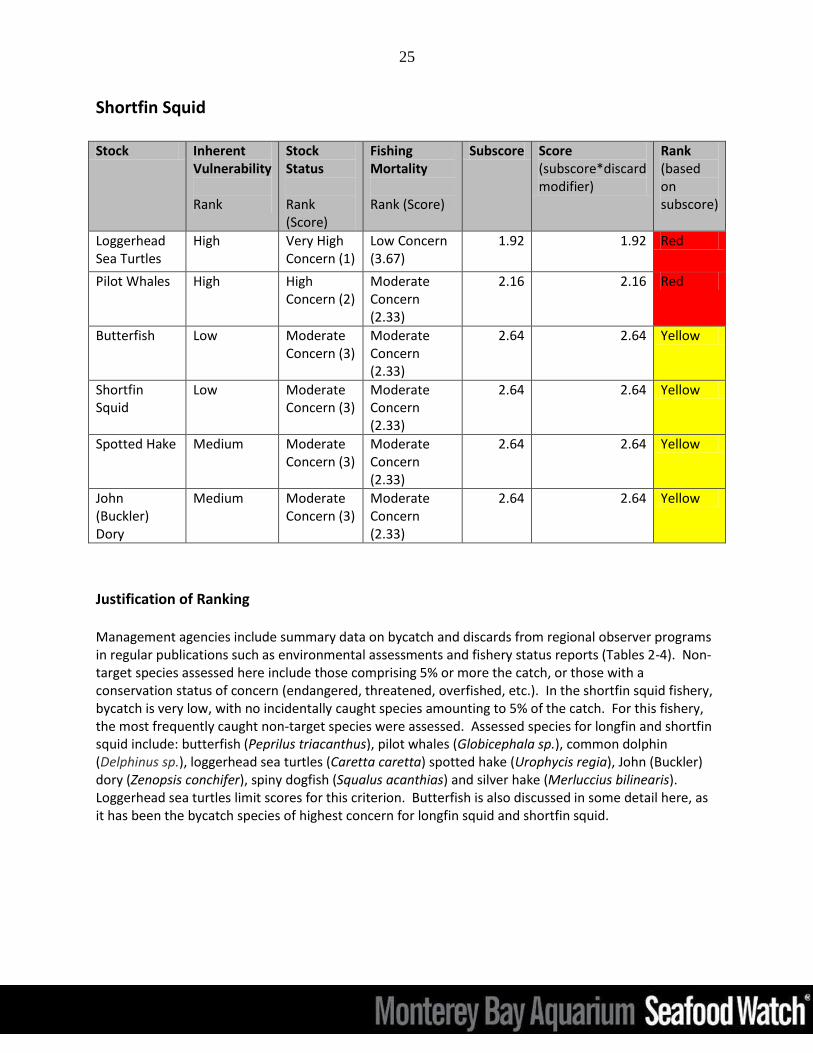
Shortfin Squid Stock Inherent
Vulnerability Rank
Stock Status Rank (Score)
Fishing Mortality Rank (Score)
Subscore Score (subscore*discard modifier)
Rank (based on subscore)
Loggerhead Sea Turtles
High Very High Concern (1)
Low Concern (3.67)
1.92 1.92 Red
Pilot Whales High High Concern (2)
Moderate Concern (2.33)
2.16 2.16 Red
Butterfish Low Moderate Concern (3)
Moderate Concern (2.33)
2.64 2.64 Yellow
Shortfin Squid
Low Moderate Concern (3)
Moderate Concern (2.33)
2.64 2.64 Yellow
Spotted Hake Medium Moderate Concern (3)
Moderate Concern (2.33)
2.64 2.64 Yellow
John (Buckler) Dory
Medium Moderate Concern (3)
Moderate Concern (2.33)
2.64 2.64 Yellow
Justification of Ranking Management agencies include summary data on bycatch and discards from regional observer programs in regular publications such as environmental assessments and fishery status reports (Tables 2-4). Non-target species assessed here include those comprising 5% or more the catch, or those with a conservation status of concern (endangered, threatened, overfished, etc.). In the shortfin squid fishery, bycatch is very low, with no incidentally caught species amounting to 5% of the catch. For this fishery, the most frequently caught non-target species were assessed. Assessed species for longfin and shortfin squid include: butterfish (Peprilus triacanthus), pilot whales (Globicephala sp.), common dolphin (Delphinus sp.), loggerhead sea turtles (Caretta caretta) spotted hake (Urophycis regia), John (Buckler) dory (Zenopsis conchifer), spiny dogfish (Squalus acanthias) and silver hake (Merluccius bilinearis). Loggerhead sea turtles limit scores for this criterion. Butterfish is also discussed in some detail here, as it has been the bycatch species of highest concern for longfin squid and shortfin squid.

26
Table 2. Key species observed taken and discarded in directed trips for longfin squid, based on unpublished NMFS Northeast Fisheries Observer Program data and unpublished dealer weighout data from 2006 to 2010. There are
2204.6 pounds in one metric ton. (Table from MAFMC 2011b)
Table 3. Key species observed taken and discarded in directed trips for shortfin squid, based on unpublished NMFS Northeast Fisheries Observer Program data and unpublished dealer weighout data from 2006-2010. There are
2204.6 pounds in one metric ton. (Table from MAFMC 2011b)
Factor 2.1 Inherent Vulnerability Butterfish: Low Vulnerability Key relevant information: With both sexes reaching maturity within a year, average life span of 2-3 years, average length of 30 cm, and a highly successful reproductive strategy, the FishBase vulnerability score for butterfish is 19 of 100 (Cheung et al. 2005).

27
Spotted Hake: Medium Vulnerability Key relevant information: FishBase vulnerability score for spotted hake is 38 of 100 (Cheung et al. 2005).
John (Buckler) Dory: Medium Vulnerability Key relevant information: FishBase vulnerability score for John (Buckler) dory is 51 of 100 (Cheung et al. 2005).
Spiny Dogfish: High Vulnerability Key relevant information: FishBase vulnerability score for spiny dogfish is 69 of 100 (Cheung et al. 2005).
Silver Hake: Medium Vulnerability Key relevant information: FishBase vulnerability score for silver hake is 54 of 100 (Cheung et al. 2005).
Pilot Whales: High Vulnerability Key relevant information: Pilot whales have high inherent vulnerability (Seafood Watch Criteria Document p.10).
Common Dolphins: High Vulnerability Key relevant information: Common dolphins have high inherent vulnerability (Seafood Watch Criteria Document p.10).
Loggerhead Sea Turtles: High Vulnerability Key relevant information: Loggerhead sea turtles have high inherent vulnerability (Seafood Watch Criteria Document p.10).
Factor 2.2 Stock Status
Butterfish: Moderate Concern Key relevant information: The butterfish stock has been in decline in recent decades. Recent rebuilding is encouraging, but the reasons for the decline are unknown and an accepted biomass reference point is currently lacking.
Detailed rationale: The butterfish is a small, short-lived fish sharing a similar habitat and life history as the longfin and shortfin squid. Butterfish form loose schools, migrate seasonally from inshore waters during the summer to offshore waters during winter and are primarily pelagic. They are prey to a variety of species, including silver hake, bluefish, swordfish, and longfin squid (Overholtz 2006). Until recent years, biomass estimates have been in decline since the 1980s, and NMFS had listed the stock status as ‘overfished’ (Figure 20). The butterfish stock was most recently assessed in 2009 at SAW-49 using data through 2008, and there was no evidence to suggest the status of the stock had improved

28
since the previous assessment at SAW-38 in 2003 (NMFS 2012i). Although biomass estimates exist (spawning biomass estimated to be 45,000 mt and total biomass estimated to be 88,800 mt; Figure 21), there is great uncertainty regarding the status of the butterfish stock (NEFSC 2010a). Despite low vulnerability due to life history characteristics such as a short lifespan, the butterfish population appears to have declined over time and the underlying causes for this decline are unknown. The population is currently in Year 3 of a 4-year rebuilding plan and survey results indicate that stock biomass appears to have increased by more than three-fold since 2006 (NMFS 2012i; Miller and Rago 2012). Due to concerns with previous assessment techniques, the ‘overfished’ status was voided in 2012 and replaced with ‘unknown.’ The status of the butterfish stock will likely remain as ‘unknown’ until biological reference points can be determined in a future assessment to indicate otherwise (MAFMC 2011b). Given the lack of a biological reference point for biomass, coupled with uncertainty as to the cause of the stock’s apparent decline in recent decades, butterfish remains a stock of concern.

29
0
100
200
300
400
500
600
700
800
900
1000
19
75
19
76
19
77
19
78
19
79
19
80
19
81
19
82
19
83
19
84
19
85
19
86
19
87
19
88
19
89
19
90
19
91
19
92
19
93
19
94
19
95
19
96
19
97
19
98
19
99
20
00
20
01
20
02
20
03
20
04
20
05
20
06
20
07
20
08
20
09
20
10
20
11
Nu
mb
er
pe
r to
w
1975-2011 Fall NEFSC Butterfish Index (number per tow)
Fall NEFSC Index #/tow
Index Median
Error Bars are ± 2 standard deviations to approximate the 95% confidence interval
0
5
10
15
20
25
30
19
75
19
76
19
77
19
78
19
79
19
80
19
81
19
82
19
83
19
84
19
85
19
86
19
87
19
88
19
89
19
90
19
91
19
92
19
93
19
94
19
95
19
96
19
97
19
98
19
99
20
00
20
01
20
02
20
03
20
04
20
05
20
06
20
07
20
08
20
09
20
10
20
11
kgp
er
tow
1975-2011 Fall NEFSC Butterfish Index (kg per tow)
Fall NEFSC Index kg/tow
Index Median
Error Bars are ± 2 standard deviations to approximate the 95% confidence interval
Figure 20. Butterfish relative abundance and biomass estimates from NEFSC fall trawl survey tows (Figure from
MAFMC 2012d)

30
Figure 21. Butterfish recruitment and biomass through 2008 (Figure from NEFSC 2010a)
Spotted Hake: Moderate Concern Key relevant information: There has been no stock assessment for spotted hake, and stock status is thus unknown.
John (Buckler) Dory: Moderate Concern Key relevant information: There has been no stock assessment for John dory, and stock status is thus unknown. Spiny Dogfish: Low Concern Key relevant information: The US Atlantic spiny dogfish stock experienced serious declines, low or failed recruitment, and decreased survivorship of pups throughout the 1990s, but has since been recovering. In 2009, the abundances reached levels high enough for the stock to be considered rebuilt and annual quotas have been increased by NMFS (Roberts 2011). NMFS stock status for spiny dogfish is ‘not overfished’ and ‘not approaching overfished’ (NMFS 2012i). Since stocks have only recently been rebuilt, precaution is needed to ensure biomass remains high, leading to some uncertainty.

31
Silver Hake: Very Low Concern Key relevant information: NMFS stock status is ‘not overfished’ for two stocks of silver hake: Gulf of Maine / Northern Georges Bank and Southern Georges Bank / Mid-Atlantic (NMFS 2012i).
Pilot Whales: High Concern Key relevant information: Because they are difficult to differentiate at sea, short-finned and long-finned pilot whales are often treated as a single species. Approximately 31,139 (CV=27%) pilot whales of both species are estimated to occur in the western North Atlantic (Taylor et al. 2011). NMFS’ best estimates for population sizes in US waters in the western North Atlantic are 24,674 (CV=0.45) short-finned pilot whales, with a minimum population size of 17,190, and 12,619 (CV=0.37) long-finned pilot whales, with a minimum population size of 9,333 (NMFS 2011c; NMFS 2011d). Although abundance estimates for the eastern tropical Pacific exhibited an increase from 1986 to 1990 and from 1998 to 2000, data are not available throughout the range of the species and there is no information on global abundance trends (Taylor et al. 2011). Long-finned pilot whales are listed as strategic species by the Marine Mammal Protection Act, whereas short-finned pilot whales are not. However, since the two species are difficult to differentiate at sea and inhabit overlapping ranges, their abundance estimates are combined (Waring et al. 2010).
Common Dolphins: Low Concern Key relevant information: The population of short-beaked common dolphins (Delphinus delphis delphis) off the US Atlantic coast is estimated at 120,743 animals (CV=0.23), based on two surveys conducted in 2004 (NMFS 2011e). The minimum population estimate for western North Atlantic common dolphin is 99,975 (NMFS 2011e). Although there are insufficient data to determine population trends, this species is considered abundant worldwide, except for a few specific populations. Short-beaked common dolphins (Delphinus delphis delphis) are not considered strategic species by the Marine Mammal Protection Act. The minimum population estimate in 2010 was 99,975, and the best estimate of abundance was 120,743 (CV = 0.23). However, stock status relative to the optimum sustainable population in the US Atlantic EEZ is unknown (Waring et al. 2010).
Loggerhead Sea Turtles: Very High Concern
Key relevant information: Loggerhead sea turtles are listed as ‘Threatened’ in the Northwest Atlantic (NMFS 2012h).
Detailed Rationale: The population size of loggerhead sea turtles has been in decline over the past decade (TEWG 2009). Annual nest numbers in the Western North Atlantic region have been generally decreasing, with a slight upturn in 2008 (TEWG 2009). Of particular concern are the deceases in the Peninsular Florida population, which represent approximately 80% of all the nests in the Western North Atlantic (TEWG 2009). There has been an overall 37% decrease in nests in the Peninsular Florida population between
32
1989 and 2007 (TEWG 2009). The northwest Atlantic distinct population segment (DPS) of loggerhead sea turtles, along with three other loggerhead DPS, has been listed as ‘Threatened’ under the US Endangered Species Act (NMFS 2012h). Five other loggerhead DPS are considered ‘Endangered’ (NMFS 2012h).
Factor 2.3 Fishing Mortality Butterfish: Moderate Concern Key relevant information: There has not been a directed fishery for butterfish in recent years. Butterfish are harvested as bycatch in squid fisheries and landings are limited to the butterfish ABC, currently placed at 1,811 mt. A butterfish mortality cap was placed on the longfin squid fishery in 2011. While the butterfish stock has increased since then, this cannot necessarily be attributed to the cap and the contribution of the squid fisheries to butterfish mortality is uncertain.
Detailed rationale: There has not been a directed fishery for butterfish since 2002. Instead, most butterfish are harvested as bycatch with both longfin and shortfin squid. Co-occurrence with shortfin squid is more likely during September and October when butterfish migrate into deeper offshore waters that constitute shortfin squid habitat (MAFMC, 2011c). Butterfish accounted for an average of 17% of all observed discards within the longfin squid fishery from 2006 to 2010 and 9.1% of the observed discards in the shortfin squid fishery over the same period, although butterfish are caught in the longfin squid fishery at a much greater scale (MAFMC 2011c). From 2006 to 2010, 94% of all butterfish landed in the longfin squid fishery and 73% of all butterfish landed in the shortfin squid fishery were discarded (MAFMC 2011b). For 2012, the commercial discard set-aside for butterfish was set at 66.67% (MAFMC 2011c). From 1965 to 1976 US butterfish landings averaged 2,051 mt. During the period 1977-1987, landings doubled to 5,252 mt. After peaking in 1984 at 12,000 mt, landings have declined sharply (Figure 24; MAFMC 2011b). The principal drivers behind this decline are thought to be low abundance, reductions in foreign landings, and a decline in Japanese demand for butterfish (MAFMC 2011b).

33
Figure 24. U.S. butterfish landings, 1965-2011 (Figure from MAFMC 2012d)
Butterfish are managed with mackerel, longfin squid and shortfin squid under the MSB FMP. Butterfish catches have been limited since the allowable biological catch (ABC) was reduced to 4,545 mt in 2005, and then to 1,500 mt in 2008 (MAFMC 2011b). These ABC reductions were in response to the results of SAW-38 in 2004, which concluded that the stock was overfished. The most recent assessment for this stock (SAW-49) gave the mortality reference point of FMSY=0.38 at MSY of 12,200 mt (NEFSC 2010a). In May 2010, the MAFMC’s SSC reviewed the results of SAW-49 and the NEFSC fall 2009 trawl survey indices for butterfish. Due to uncertainty in the assessment, the SSC recommended keeping the butterfish ABC at the status quo level of 1,500 mt for 2011. On January 1, 2011, NMFS implemented a binding butterfish mortality cap, allocated by trimester, to limit butterfish catch in the longfin squid fishery (MSB FMP Amendment 10). This cap is placed at 75% of the butterfish ABC (1,125 mt), applies to both butterfish landings and discards, and closes the longfin squid fishery once reached (MAFMC 2011c). Since the cap is tied to the butterfish ABC, high butterfish bycatch in the longfin squid fishery should not negatively impact the butterfish stock (Didden 2012).
As the stock of butterfish continue to decline despite having the ABC limits in place, it is unclear whether fishing is impairing recruitment and, thus, the overall effects of fishing mortality on butterfish is considered unknown (NEFSC 2010a; MAFMC 2011b). At its May 2011 meeting, the MAFMC’s SSC concluded that butterfish fishing mortality (landings and discards) has been low and that other factors—environmental conditions and low recruitment—may be primarily contributing to the decline of butterfish (NEFSC 2010a; MAFMC 2011c). It was agreed that overfishing was not likely occurring within the fishery, and this conclusion is supported by more recent research (Miller and Rago 2012). There will
34
likely be a butterfish fishery again in 2013 as this preliminary work has shown a rebound in butterfish abundance (Didden 2012). A new assessment is pending in 2013.
Spotted Hake: Moderate Concern Key relevant information: There is no targeted fishery for spotted hake. Spotted hake is caught in both the longfin squid and shortfin squid fisheries. Since overall bycatch is higher in the longfin squid fishery, it is caught at a much greater scale in that fishery. From 2006 to 2010, approximately 113 pounds of spotted hake were caught for every metric ton of longfin squid caught, compared to only 1.7 pounds of spotted hake per metric ton of shortfin squid caught. Almost all spotted hake that is caught is discarded (MAFMC 2011b). There has been no stock assessment for spotted hake, and the existence of overfishing is, thus, unknown.
John (Buckler) Dory: Moderate Concern Key relevant information: There is no targeted fishery for John dory. John dory is one of the more common bycatch species in the shortfin squid fishery, but since overall bycatch is low in this fishery, catch of John dory occurs at extremely low levels. From 2006 to 2010, approximately 1.8 pounds of John dory were caught for every metric ton of shortfin squid caught, with about half of that discarded (MAFMC 2011b). There has been no stock assessment for John dory, and the existence of overfishing is thus unknown.
Spiny Dogfish: Very Low Concern Key relevant information: From 2006 to 2010, approximately 162 pounds of spiny dogfish were caught for every metric ton of longfin squid caught, with almost all of it discarded (MAFMC 2011b). Spiny dogfish is managed under the spiny dogfish FMP, under joint jurisdiction of the Northeast Fishery Management Council (NEFMC) and the MAFMC. Atlantic spiny dogfish landings increased sharply with the advent of directed fisheries in the early 1990s, peaked in the mid-1990s, and declined just as sharply between the mid and late 1990s (Roberts 2011). NMFS status for spiny dogfish is that overfishing is not occurring (NMFS 2012i). In 2008, the fishing mortality rate was well below fishing mortality reference points (Rago & Sosebee 2010), which led to an increase in the annual quota.
Silver Hake: Very Low Concern Key relevant information: From 2006 to 2010, for every metric ton of longfin squid caught, approximately 154 pounds of silver hake were caught, with the majority being discarded (MAFMC 2011b). Silver hake, also known as whiting, is managed together as part of the Northeast Multispecies Groundfish Fishery. NMFS has determined that overfishing is not occurring in either the northern or southern stock, as mortality has stayed below the FMSY proxy (NMFS 2012i).

35
Pilot Whales: Moderate Concern Key relevant information: From 2000 to 2005, on 51,675 observed Northeast US bottom trawl tows, a total of 12 pilot whales (short-finned pilot whales and long-finned pilot whales not partitioned, due to the difficulty of identifying them to species) were observed taken in the gear (Rossman 2010). Six of the pilot whales were taken by the Northeast region multispecies groundfish fishery, while the other six were observed between August and December in the Mid-Atlantic longfin and shortfin squid fisheries. The total mean annual bycatch estimate over both regions during 2000–2005 was 72 pilot whales (Rossman 2010). This estimate is 29% of the current potential biological removal (PBR) level for this species, but is not fishery specific (Rossman 2010). Earlier estimates (1996-1999) are available for pilot whale deaths in the shortfin squid and longfin squid fishery (MAFMC 2011b). The estimated fishery-related mortality of pilot whales in the longfin squid fishery, based on only one observed take from 1996 to 1999, was 0 (zero) between 1996 and 1998 and 49 in 1999 (CV=0.97) (MAFMC 2011b). The estimated fishery-related mortality of pilot whales attributable to this shortfin squid fishery was: 45 in 1996 (CV=1.27), 0 in 1997, 85 in 1998 (CV=0.65), and 0 in 1999 (MAFMC 2011b). Based on a current PBR of 93 longfin pilot whales (conservatively assuming the pilot whale mortalities were all longfin pilot whales, which are a strategic stock with a lower PBR), this would amount to an average of 32.5 deaths per year or 35% of the PBR in the shortfin squid fishery, and 12.25 deaths per year or 13% of the PBR in the longfin squid fishery. Consideration of more recent years leads to a lower estimate for pilot whale take, as only one observed take occurred in the Mid-Atlantic bottom trawl fleet in 2006, and none in 2007 and 2008 (NEFSC 2010b). The 2004-2008 average annual pilot whale (multiple species) mortality attributed to Mid-Atlantic bottom trawl fisheries was 34 animals (CV=0.13) (NEFSC 2010b; MAFMC 2011b). The only small cetacean fishing mortality estimates attributable to specific squid fisheries are for pilot whales taken in the offshore longfin squid and shortfin squid fisheries. However, recent fishery specific estimates are not available. Fishing mortality due to the Mid-Atlantic bottom trawl fisheries is unlikely to exceed the PBR for pilot whales, but the squid fisheries are a substantial contributor to their mortality, and effective management is in place (through the Atlantic large whale take reduction plan).
Common Dolphin: Moderate Concern Key relevant information: From 2000 to 2005, on 51,675 observed Northeast US bottom trawl tows, a total of 39 common dolphins were observed taken in the gear (Rossman 2010). The offshore longfin squid fishery operating in the Mid-Atlantic region accounted for 59% of the observed take of common dolphin (Rossman 2010). The remaining common dolphin take was observed in the Northeast region, where the longfin squid fishery was also responsible for some of the take. The total mean annual bycatch estimate over both regions during 2000–2005 was 142 common dolphins (Rossman 2010). This estimate is 14% of the current PBR level for this species, but is not fishery specific (Rossman 2010). Total US fishery-related mortality and serious injury for this stock exceeded 10% and therefore could not be considered insignificant and approaching zero.

36
Loggerhead Sea Turtles: Low Concern Key relevant information: The Atlantic squid trawl fisheries have been known to interact with endangered and threatened sea turtles late in Trimester II and early in Trimester III (between August and October; MAFMC 2011c). The primary area of impact is likely in waters of the Mid-Atlantic from Virginia through New York. Loggerhead sea turtles are the primary turtle species likely to be adversely affected by the MSB fishery, as they are the most abundant species occurring in US North Atlantic waters (MAFMC 2011c). Sea sampling and observer data indicate that fewer interactions occur between fisheries that capture MSB and leatherback, Kemp's ridley, and green sea turtles (MAFMC 2011c). There have been 9 observed sea turtle takes in the MSB fishery during the past 11 years (using top species landed; NMFS 2010). All sea turtle takes have occurred in bottom otter trawl gear participating in the squid fishery. All sea turtles were released alive, except one 2002 take. The NEFSC, using vessel trip reports (VTR) data from 2000 to 2004, estimated the average annual capture of loggerhead sea turtles in bottom otter trawl gear used in the Atlantic MSB fisheries to be not more than 62 loggerhead sea turtles a year (NMFS 2010). Of this, 35 are expected to survive while 27 are expected to die or be seriously injured as a result of being captured in all MSB bottom trawls (NMFS 2010). NMFS also anticipates that up to two green sea turtles, two Kemp's ridley sea turtles, and two leatherback sea turtles will be incidentally taken (lethal or/non-lethal) in any given year in the MSB fishery based on the very low encounter rates for these species (NMFS 2010). NMFS does not believe it would be reasonable to expect the death, capture, or harassment of these numbers of sea turtles to diminish the viability of their populations or to appreciably reduce the recovery of sea turtle species in the Atlantic (NMFS 2010). However, although the likely impact on loggerhead populations is low in the MSB fisheries, the impact of the Atlantic squid trawl fisheries on sea turtle populations must be considered in the context of the cumulative impacts of all fisheries on sea turtle populations, as an estimated 4,600 sea turtle deaths per year are attributable to US fisheries (Finkbeiner et al. 2011). Management effectiveness at reducing mortalities (area restrictions and effort reductions) is unknown, but the squid fishery is not one of the primary anthropogenic contributors to mortality.
Factor 2.4 Overall Discard Rate Longfin Squid: 40%–60% Key relevant information: Based on 2006-2010 NMFS observer data as described in the most recent environmental assessment, discards in the longfin squid fishery are relatively high (about 58% of all catch by weight discarded) with butterfish, spiny dogfish, shortfin squid, hakes, scup, skates, flounders, and mackerel topping a varied list of discarded species (MAFMC 2011b).
Shortfin Squid: 0%–20% Key relevant information: Based on 2006-2010 NMFS observer data as described in the most recent environmental assessment, discards in the shortfin squid fishery are relatively low (less than 1% of all catch by weight discarded) with butterfish, spotted hake, John (buckler) dory, and other finfish being the most frequently discarded species (MAFMC 2011b).

37
Criterion 3: Management Effectiveness Guiding principle
The fishery is managed to sustain the long-term productivity of all impacted species. Management should be appropriate for the inherent resilience of affected marine life and should incorporate data sufficient to assess the affected species and manage fishing mortality to ensure little risk of depletion. Measures should be implemented and enforced to ensure that fishery mortality does not threaten the long-term productivity or ecological role of any species in the future.
Fishery Management: Harvest
Strategy Management: Bycatch Criterion 3
Rank (Score) Rank (Score) Rank
(Score)
Longfin Squid, Trawl
Moderate Concern (3) Moderate Concern (3) Yellow
(3)
Shortfin Squid, Trawl
Moderate Concern (3) Moderate Concern (3) Yellow
(3)
Justification of Ranking Factor 3.1 Management of fishing impacts on retained species: Fishery Mgmt
strategy and implement
Recovery of stocks of concern
Scientific research and monitoring
Scientific advice
Enforce Track record
Stakeholder inclusion
Longfin Squid, Trawl
Moderately Effective N/A
Moderately Effective
Moderately Effective
Highly Effective
Highly Effective
Highly Effective
Shortfin Squid, Trawl
Moderately Effective N/A
Moderately Effective
Moderately Effective
Highly Effective
Highly Effective
Highly Effective
Longfin Squid: Moderate Concern Key relevant information: Management Strategy and Implementation: Moderately Effective Long-finned squid are under the jurisdiction of the Mid-Atlantic Fisheries Management Council

38
(MAFMC) and are managed jointly by the Atlantic Mackerel, Squid, and Butterfish Fishery Management Plan (MSB FMP). In 1977 the MAFMC began the development of the (longfin and shortfin) Squid FMP. The MAFMC adopted the Squid FMP in 1978 and NMFS approved it in 1979 (MAFMC 2012a). There are two methods of modifying the FMP: amendments and frameworks. Since its initial adoption and approval, the original Squid FMP has undergone a number of updates. Amendment 1 to the Squid FMP was adopted in 1980 and extended the FMP for an indefinite amount of time beyond the end of the 1979-1980 fishing season. Shortly afterward, the MAFMC began work on Amendment 2, which would merge the squid, Atlantic mackerel and butterfish FMPs. Due to time constraints, Amendment 2 was not passed during the 1980 fishing season and was thus renamed Amendment 3. The MAFMC adopted Amendment 3 in 1981 and NMFS approved the Amendment in 1982, effectively merging management for the two squid species, Atlantic mackerel and butterfish (MAFMC 2012a). The new MSB FMP has also been subject to a number of amendments over the years. Table 7 provides a summary of the amendments and frameworks that have been made to the MSB FMP from 1984 to 2011 (MAFMC 2012a). Table 7. Amendments and frameworks made to the merged MSB FMP from 1984 to 2011. Longfin squid are referred to as ‘Loligo.’ (Table from MAFMC 2012a)
Year Document Management action 1984 Amendment 1 Implemented squid optimum yields (OY) adjustment mechanism
Revised Atlantic mackerel mortality rate
1986 Amendment 2 Equated fishing year with calendar year
Revised squid bycatch total allowable level of foreign fishing (TALFF) allowances
Implemented framework adjustment process
Converted expiration of fishing permits from indefinite to annual
1991 Amendment 3 Established overfishing definitions for all four species
1991 Amendment 4 Limited the activity of directed foreign fishing and joint venture transfers to foreign vessels
Allowed for specification of OY for Atlantic mackerel for up to three years
1996 Amendment 5 (Supplemental)
Adjusted Loligo MSY
Eliminated directed foreign fisheries for Loligo, Illex, and butterfish
Instituted a dealer and vessel reporting system
Instituted an operator permitting system
Implemented a limited access system for Loligo, Illex and butterfish
Expanded the management unit to include all Atlantic mackerel, Loligo, Illex, and butterfish under US jurisdiction
1997 Amendment 6 Revised the overfishing definitions for Loligo, Illex, and butterfish
Established directed fishery closure at 95% of domestic annual harvest (DAH) for Loligo, Illex and butterfish with post-closure trip limits for each species
Established a mechanism for seasonal management of the Illex fishery to improve the yield-per-recruit
1997 Amendment 7 Established consistency among FMPs in the NE region of the US relative
to vessel permitting, replacement and upgrade criteria

39
1998 Amendment 8 Brought the FMP into compliance with new and revised National Standards and other required provisions of the Sustainable Fisheries Act
Added a framework adjustment procedure
2001 Framework 1 Created a quota set-aside for the purpose of conducting scientific research
2002 Framework 2 Extended the moratorium on entry to the Illex fishery for an additional year
Established that previous year specifications apply when specifications for the management unit are not published prior to the start of the fishing year (excluding TALFF specifications)
Allowed for the specification of management measures for Loligo for a period of up to three years
2003 Framework 3 Extended the moratorium on entry to the Illex fishery for an additional
year
2004 Framework 4 Extended the moratorium on entry to the Illex fishery for an additional
five years
2007 Amendment 12 Standardized bycatch reporting methodology
2008 Amendment 9 Allowed for multi-year specifications for all four managed species (mackerel, butterfish, Illex, and Loligo) for up to 3 years
Extended the moratorium on entry into the Illex fishery, without a sunset provision
Adopted biological reference points for Loligo recommended by the stock assessment review committee (SARC)
Designated EFH for Loligo eggs based on available information
Prohibited bottom trawling by MSB-permitted vessels in Lydonia and Oceanographer Canyons
2010 Amendment 10 Implemented a butterfish rebuilding program
Increased the Loligo minimum mesh in Trimesters 1 and 3
Implemented a 72-hour trip notification requirement for the Loligo fishery
2010 Amendment 13 Omnibus Amendment that implemented Annual Catch Limits (ACLs), Annual Catch Targets (ACTs), and Accountability Measures (AMs).
2011 Amendment 11 Implemented Limited Access in the Atlantic mackerel fishery.
Updated EFH for all MSB species.
Established a recreational-commercial allocation
Important stock management measure implemented since 1996 have included the implementation of total allowable catch (TAC), mandatory submittal of vessel trip reports (VTRs) by fishermen who possess federal longfin squid/butterfish permits, a moratorium on fishery and incidental catch permits, a minimum codend mesh size requirement of 48 mm (1 7/8 in., inside stretched mesh), and a strengthener minimum size of 114 mm (4.5 in.). Since 2000, the longfin squid fishery has been subject to in-season quotas that were quarterly based from 2001 to 2006 and have been trimester-based during 2000 and from 2007 to 2012 (Table 8; NEFSC 2011; Hanlon et al. 2012). There are 351 permitted vessels that may potentially comprise the 2012 longfin squid / butterfish moratorium permit limited entry fleet (Federal Register 2012).
40
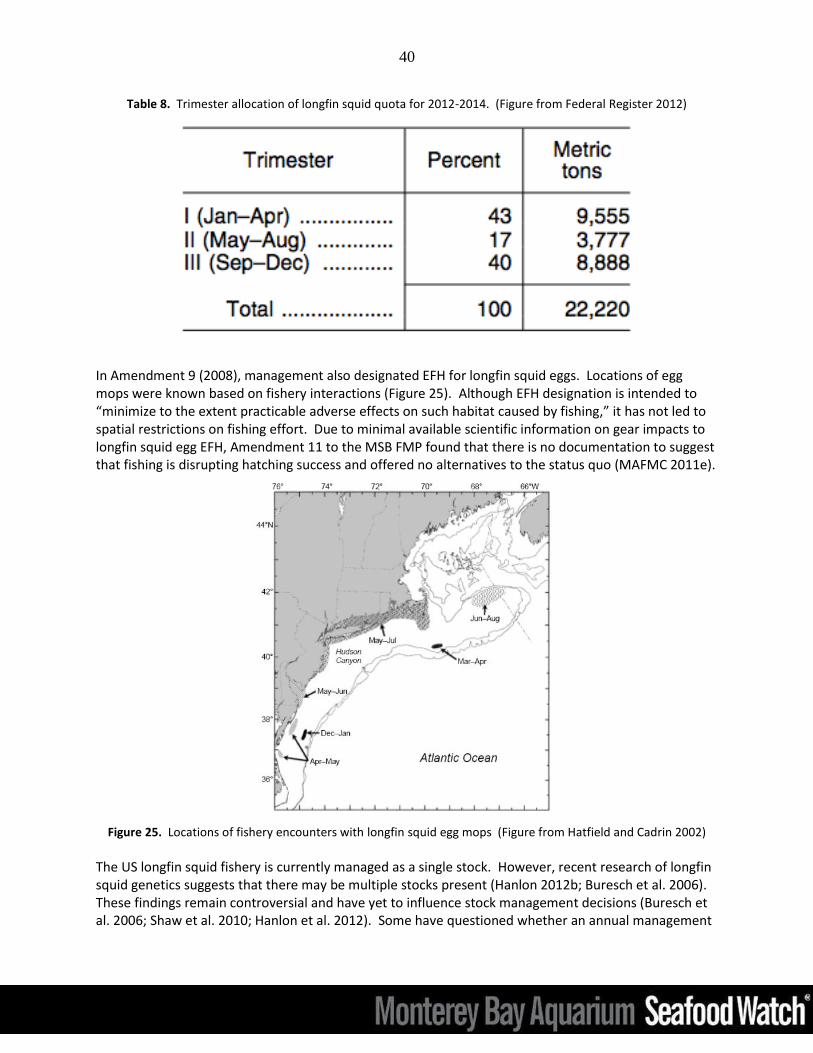
Table 8. Trimester allocation of longfin squid quota for 2012-2014. (Figure from Federal Register 2012)
In Amendment 9 (2008), management also designated EFH for longfin squid eggs. Locations of egg mops were known based on fishery interactions (Figure 25). Although EFH designation is intended to “minimize to the extent practicable adverse effects on such habitat caused by fishing,” it has not led to spatial restrictions on fishing effort. Due to minimal available scientific information on gear impacts to longfin squid egg EFH, Amendment 11 to the MSB FMP found that there is no documentation to suggest that fishing is disrupting hatching success and offered no alternatives to the status quo (MAFMC 2011e).
Figure 25. Locations of fishery encounters with longfin squid egg mops (Figure from Hatfield and Cadrin 2002)
The US longfin squid fishery is currently managed as a single stock. However, recent research of longfin squid genetics suggests that there may be multiple stocks present (Hanlon 2012b; Buresch et al. 2006). These findings remain controversial and have yet to influence stock management decisions (Buresch et al. 2006; Shaw et al. 2010; Hanlon et al. 2012). Some have questioned whether an annual management

41
strategy is appropriate for a semelparous species in which the entire population replaces itself every nine months. Given the short-lived nature of the longfin squid, some independent scientists have advised in-season management based on seasonal abundance indices (Roel 2011; Tingley 2011). However, comparison between spring and fall abundance indices for a given year have shown a positive correlation, which supports management’s assumption that successive cohorts are not entirely independent of each other (Roel 2011). There are some effective management measures in place, including limited access, hard quotas with near real-time closures, seasonal distribution of quota to avoid any cohort receiving excessive pressure, and mandatory submittal of VTRs by fishermen who possess federal longfin squid/butterfish permits. Although management of the longfin squid fishery has effectively maintained stock biomass through the use of quotas, mortality caps, gear restrictions, and closed areas, there is room to incorporate a more precautionary approach. For example, more precautions in the form of ecosystem-based management may be needed, as omitting predation from stock assessment models might lead to the designation of too high a TAC.
Recovery of stocks of concern: N/A Longfin squid are not currently a stock of concern, ranked as N/A.
Scientific Research and Monitoring: Moderately Effective The stock of longfin squid is assessed using fishery dependent data (landings, CPUE, etc.) and fishery independent surveys in the form of NEFSC annual spring and autumn bottom trawl surveys. Fall and spring surveys provide the greatest degree of overlap with longfin squid habitat. These surveys have documented that annual autumn relative abundance indices are highly variable, largely because relative abundance of the longfin squid population is strongly affected by oceanographic conditions (Hendrickson and Jacobson 2006). The combination of fishery dependent and independent data has allowed for biomass and fishing level targets to be determined, has provided estimates of stock size, and has made possible the characterization of uncertainty in estimates (Hendrickson and Jacobson 2006).
Additionally, MSB FMP Framework 1 (2001) established a set-aside quota of 0%–3% for the purposes of conducting scientific research, which is often utilized (MAFMC 2012a). Due to the high variability of the longfin squid stock, real-time assessment and monitoring are needed to better understand how much fishing it can sustain in a particular season or year. There may be a need for increased monitoring, due to the high variability of squid stocks.
Scientific Advice: Moderately Effective The MAFMC follows the scientific advice of its SSC to minimize chances of overfishing. However, assessment reviewers and other authors in the field have advised that additional research needs to be accomplished in order for managers to fully evaluate the impacts of various levels of fishing pressure. For example, scientific advice of the most recent Stock Assessment Workshop (NEFSC 2011) for the longfin squid included:
“The majority of the panel considered the data and assessment for Loligo provide an appropriate basis for developing management advice for this stock. This reviewer differs from this view, principally because of how the two, largely separate, cohorts with a lifespan of less than one year were handled within a set of ToR and approach to assessment and management that was highly annualized…Better understanding and modeling of seasonal cohort recruitment, growth, mortality, catch, effort and age would allow possibilities for within-season, or, at least, within year, assessment and management schemes to be explored” (Tingley 2011).

42
Other advice by Hanlon and colleagues (2012): “There are many subjects in need of study before the biology of D. pealeii is well understood… For conservation and ecosystem-based management of the fishery, there is a clear need for more detailed and definitive data on population genetics as well as the determination and designation of essential fish habitat that must be protected to ensure annual spawning and recruitment. The effects of the winter offshore fishery on the inshore fishery (or vice versa) need to be established” (Hanlon et al. 2012).
Finally, others have advised that predation mortality should be incorporated into longfin squid population modeling (Hanlon 2012b; Moustahfid et al. 2009). A model developed by Moustahfid and colleagues (2009) estimated that predation mortality on the longfin squid resource might be two to three times as high as F (Figure 25). More precaution in the form of ecosystem-based management may be needed, as omitting predation from stock assessment models might lead to the designation of too high a TAC. There are some concerns by scientists that managers are not using enough caution in their approach to this fishery, and it is yet to be determined if this advice is being adhered to.
Figure 25. Stacked area graph presenting seasonal predation (M2) and fishing mortality (F) rates for longfin squid
in the northwest Atlantic Ocean, 1987-2001. (Figure from Moustahfid et al. 2009)
Enforcement: Highly Effective Enforcement of the longfin squid fishery is enacted through quotas, vessel permitting, a mortality cap on butterfish bycatch, monitoring via limited observer coverage, mandatory trip reports (VTRs) and spatially regulated habitat (e.g. bottom trawling by MSB-permitted vessels is prohibited in Lydonia and Oceanographer Canyons; Hanlon et al. 2012). Monitoring of discards in the longfin squid fishery is compiled through the NMFS Observer Program Database, which includes data from trips that had trained observers onboard to document discards. From 2006 to 2010, observed landings comprised approximately 3.5% of total longfin squid caught (MAFMC 2011b), although with the implementation of the butterfish cap this has increased recently (Didden 2012). There is adequate enforcement in the longfin squid fishery.
Track Record: Highly Effective Current longfin squid biomass levels are considered within historical norms, with the understanding that biomass may fluctuate drastically from year to year due to the short-lived nature of the species (MAFMC

43
2011b). Overall trends in biomass and recruitment indicate effective management of the fishery. Amendments to the FMP show an adaptive capacity to encompass recent scientific research and data of longfin squid, bycatch species, and ecosystem impacts (Hanlon et al. 2012). Management has maintained stock biomass and has stayed within proposed reference points for fishing mortality in the past few years and there is no indication that this will change in the near future.
Stakeholder Inclusion: Highly Effective Management decisions for the longfin squid fishery, including the crafting of environmental impact statements, FMP changes, and proposed rules, follow an open process. Regular MAFMC meetings where management measures are discussed, as well as technical meetings, are open to the public, scientists, fishermen, and other stakeholders, and a calendar of upcoming meetings is posted online well in advance (MAFMC 2012c). Written comments can also be provided to the Council in advance. These meetings are also accessible via webinar to improve access. All testimony and comments are considered and incorporated into the official record. In addition, there is regular scientific input to the stock assessment process and results through the Regional Stock Assessment Review Committee (SARC). MAFMC advisory panels have recently been reworked, and include participants from commercial fishing, recreational fishing, and conservation groups. Advice from these panels is solicited on an annual basis.
Shortfin Squid: Moderate Concern Key relevant information: A suite of management measures have allowed the shortfin squid stock to recover from a period of low abundance. There are some concerns that the potential for recruitment overfishing may still exist, particularly because this transboundary species is not managed jointly with the Canadian component of the stock. There is some effective management in place in the shortfin squid fishery, but there is a need for increased precaution.
Detailed rationale: Management Strategy and Implementation: Moderately Effective Shortfin squid are also under the jurisdiction of the MAFMC and are managed jointly by the MSB FMP along with longfin squid, Atlantic mackerel, and butterfish. A major management accomplishment was the banning of foreign vessels targeting the shortfin squid resource in US waters. There has been no foreign participation since 1986 (O’Dor and Dawe 2012). The MSB FMP outlines the requirements of the MAFMC under the Sustainable Fisheries Act to set annual specifications for each species covered by the FMP. Shortfin squid are managed using quota systems, which ensure that the fishing mortality rates do not exceed guidelines to prevent overfishing. Each year, the MAFMC sets an ABC for shortfin squid through an open process (Dawe and Hendrickson 1998). From 1978 to 1995, ABC for shortfin squid was set at 30,000 mt. ABC was then reduced to 21,000 mt in 1996 and to 19,000 mt for 1997-1998 based on the most recent stock assessment at the time (Hendrickson et al. 1996). The ABC was subsequently set at 24,000 mt by the MAFMC SSC because it is a level of yield that has been supported by the fishery since 2000. ABC has since remained static, as there is no available evidence that landings of 24,000-26,000 mt have caused harm to the shortfin squid stock (Table 9; NAFO 2011; Didden 2012).

44
Table 9. Summary of recent specifications (and landings) for shortfin squid. All figures are in mt. (Figure from MAFMC 2011d)
This ABC was maintained for 2012-2014 (subject to annual review), although it was slightly modified by deducting estimated discards to arrive at a DAH of 22,915 mt (Federal Register 2012; MAFMC 2012b). Under the current management approach, the directed fishery for shortfin squid closes when 95% of ABC is taken (22,800 mt), slightly before reaching the DAC quota of 22,915 mt. A 10,000-pound trip limit is then put into effect for the remainder of the fishing year. The value of 22,800 mt is also the yield at 75% FMSY. Since minimal landings are expected after the fishery closes, the assumption has been that closing at 95% of ABC would be the equivalent of utilizing a 75% FMSY target (MAFMC 2011b). Management measures thus incorporate some precaution by setting the catch limit well below a dated reference point of uncertain appropriateness. This is important as there are many unknowns surrounding the population of shortfin squid as outlined in Criterion 1. Lower limits may be set if future assessments suggest the potential yield from the fishery is less than this level, or if economic and social factors warrant (Federal Register 2012). Another management strategy for the shortfin squid fishery is that vessels are exempt from the 48 mm minimum mesh size restriction placed on the longfin squid fishery, in particular areas, from June to September (O’Dor and Dawe 2012; Federal Register 2012). This is reasoned to be acceptable since bycatch levels in the shortfin squid fishery tend to be lower than in the longfin squid fishery (Federal Register 2012). Additionally, the council issued a moratorium on vessel entry, which still holds since the fleet has been assessed as capable of catching the entire quota (MAFMC 2011b). For 2012, the limited entry fleet consists of 76 permitted vessels that may potentially participate in the fishery (Federal Register 2012), though only 5–10 vessels make up most landings in most years (Didden 2012). Recent amendments to the FMP in place for shortfin squid management include:
In 2009, Amendment 9 prohibited bottom trawling by mackerel, squid and butterfish-permitted
vessels in Lydonia and Oceanographer Canyons.
All EFH designations were updated in Amendment 11 (2011). Although these designations are
intended to further mitigate fishery impacts, no alternatives have been proposed that would
restrict fishing effort (MAFMC 2011b).
The use of precaution and the successful implementation of hard quotas are encouraging. However, given the high variability of squid populations, real-time assessment and monitoring are needed to determine how much fishing the stock can sustain in a particular season or year. Also, due to the importance of shortfin squid to the ecosystem, there is a need to adopt a more ecosystem-based

45
management approach.
Recovery of stocks of concern: N/A Shortfin squid is not a stock of concern, therefore ranked as N/A.
Scientific Research and Monitoring: Moderately Effective Seasonal research surveys provide some information about local abundance trends on the U.S. continental shelf and on the Scotian Shelf, although there are no stock-wide assessments of abundance for the shortfin squid stock. The NEFSC spring bottom trawl survey occurs in March and the autumn survey later in the year at the end of the fishing season. These surveys capture important data but are not likely to sample efficiently or capture abundance in most areas (MAFMC 2006). Commercial catch is monitored via logbooks and a mandatory dealer reporting system whereby weekly purchases are reported to NMFS (O’Dor and Dawe 2012). Shortfin squid have also been monitored by the scientific community as an important biological indicator of oceanographic and climate change (Dawe et al. 2007). Additionally, MSB FMP Framework 1 (2001) established a set-aside quota of 0%–3% for the purposes of conducting scientific research (MAFMC 2012a), although this has not been utilized since the quotas are generally not achieved. Due to the high variability of squid populations, there may be need for increased monitoring.
Scientific Advice: Moderately Effective The MAFMC follows the scientific advice of its SSC and sets quotas designed to minimize the chances of overfishing. Generally, the SSC recommends ABC levels that take into account scientific uncertainty regarding stock status and biological reference points, and the Council relies on that ABC recommendation to set other specifications (Federal Register 2012). However, assessment reviewers and other authors in the field have identified additional research that needs to be accomplished in order for managers to fully evaluate the impacts of various levels of fishing pressure. More precaution in the form of real-time, ecosystem-based management may be needed, as omitting predation from stock assessment models might lead to the designation of too high a TAC. Some scientists have pointed out the need for joint management of this transboundary stock, as well as reconsideration of the US TAC. In a 2012 chapter, O’Dor and Dawe suggest:
Information on resource status in [NAFO] Subarea 5+6 is based largely on indices of the abundance of pre-recruit and recruited squid from spring and autumn bottom trawl surveys. Recognizing that shortfin squid resources in USA and Canadian waters likely comprise a single population, joint management of this species across all areas is advisable. Given the annual life cycle of this species, the basis for an annual Subarea 5+6 TAC of 24,000 t should be reviewed. There may be considerable potential for recruitment overfishing in fisheries for annual species. This may be particularly true for the US fishery area because that area may serve as a stable 'reserve' for shortfin squid in years of low total population abundance (O’Dor and Dawe 2012).
There are some concerns by scientists that managers are not taking enough of a precautionary approach.
Enforcement: Highly Effective Enforcement is in place via fishery closures, catch quotas, monitoring via limited observer coverage, mandatory trip reports (VTRs) and spatially regulated habitat as described above. Amendments to the MSB FMP have instituted a vessel entry moratorium, gear and area restrictions, quotas, and trip limits

46
(NMFS 2012e). At-sea enforcement is facilitated in partnership with the US Coast Guard. Although NMFS observers are used only for data collection and not for enforcement, there appears to be adequate enforcement in the shortfin squid fishery. Track Record: Highly Effective The shortfin squid stock has been considered stable since the low period in the early 1980s (O’Dor and Dawe 2012). Overall, landings have been fairly consistent, with the exception of a peak in 2004 when the quota was exceeded due to reporting issues. Management decisions have supported the recovery stock from the low abundance period of the early 1980s by instituting gear restrictions, removing foreign fishing pressure, and making the fishery limited access (MAFMC 2011b). Amendments and updates to the FMP are progressive and adaptive.
Stakeholder Inclusion: Highly Effective Management decisions for the shortfin squid fishery, including the crafting of environmental impact statements, FMP changes, and proposed rules, follow an open process. Regular MAFMC meetings where management measures are discussed, as well as technical meetings, are open to the public, scientists, fishermen, and other stakeholders, and a calendar of upcoming meetings is posted online well in advance (MAFMC 2012c). Written comments can be provided to the Council in advance. These meetings are also accessible via webinar to improve access. All testimony and comments are considered and incorporated into the official record. In addition, there is regular scientific input to the stock assessment process and results through the Regional Stock Assessment Review Committee (SARC). MAFMC advisory panels have been reworked recently, and include participants from commercial fishing, recreational fishing, and conservation groups. Advice from these panels is solicited annually at a minimum.
Factor 3.2 Management of fishing impacts on bycatch species
Fishery All Species Retained?
Critical? Mgmt strategy and implement
Scientific research and monitoring
Scientific advice
Enforce
Longfin Squid, Trawl No No
Moderately Effective
Moderately Effective
Highly Effective
Moderately Effective
Shortfin Squid, Trawl No No
Moderately Effective
Moderately Effective
Highly Effective
Moderately Effective
Longfin Squid: Moderate Concern Key relevant information: The longfin squid management strategy involves a continuing process of minimizing its relatively high bycatch. Since discards are accounted for throughout federal management, impacts on relevant species should be under control, but there is room for improvement. There is also room for improvement in
47
reducing the occasional take of endangered/threatened and protected species.
Detailed rationale: Management Strategy and Implementation: Moderately Effective In 2007, the MAFMC and Northeast Fishery Management Council (NEFMC) approved an omnibus amendment to all FMPs in the region, mandating a standardized bycatch reporting methodology (SBRM). Section 303(a)(11) of the MSA requires that all FMPs include “a standardized reporting methodology to assess the amount and type of bycatch occurring in the fishery” (NMFS 2011a). While the SBRM Omnibus Amendment appeared to be a step in the right direction, it has since been vacated by judicial order and an effort is underway to create a standardized method of bycatch reporting (Didden 2012). Overall, discards in the longfin squid fishery have been relatively high. Butterfish is the most commonly caught bycatch species within the longfin squid fishery and has been the chief species of concern. There is no directed fishery targeting butterfish, and most commercial landings come from longfin squid fishery bycatch. In 2010 a butterfish rebuilding plan was implemented (MSB FMP Amendment 10), and in 2011 a mortality cap was placed on butterfish landings, which when reached closes the longfin squid fishery (MAFMC 2012b). The cap is set at 75% of the butterfish ABC (0.75 * 1,500 mt = 1,125 mt), and is allocated by trimester as follows: Trimester I (January through April) – 65%; Trimester II (May through August) – 3.3%; Trimester III (September through December) – 31.7%. Although increases to the butterfish ABC have been proposed (MAFMC 2011c), the low status quo ABC has been maintained. The directed longfin squid fishery will close if 80% of the Trimester I butterfish mortality cap is projected to be harvested, and/or if 90% of the total cap is projected to be harvested in Trimester III. The mortality cap will still be tracked during Trimester II, but the catch and the mortality cap will be applied to Trimester III, along with overages and under age from Trimester I (MAFMC 2011c). The cap is seen as a progressive and precautionary measure, especially as it was projected that if reached it could result in direct losses of up to $16 million to the longfin squid fleet (NMFS 2011b; MAFMC 2009). If met, the butterfish cap on the longfin squid fishery also has the potential to limit catch of other non-target species in the fishery, including spiny dogfish, silver hake, shortfin squid, spotted hake and red hake (MAFMC 2011c). In 2011in its first year of implementation, the fishery stayed below the cap. There was a cap closure in the spring of 2012 and the SSC determined that the cap appears to be controlling butterfish mortality in the longfin squid fishery (Didden 2012). Gear restrictions (currently minimum width of inside of stretched net mesh is 1 7/8” in the summer and 2 1/8” at other times) and some spatial closures are also in place to reduce interactions with bycatch species (Hendrickson 2010). However, mesh selectivity studies have indicated that increased codend mesh size (from 1.875” to 2.5”) may not be an effective management measure. King and colleagues (2009) found that though this increase resulted in a significant reduction in bycatch of juvenile longfin squid, total marketable landings were reduced by 73.9% and there were no significant reductions in bycatch of other species (King et al. 2009). This study suggests that codend mesh size management is not necessarily an appropriate option for the longfin squid fishery. The longfin squid trawl fishery has experienced some interactions with protected and endangered/threatened species. Interactions with protected small cetaceans have been documented by observers during the offshore fishery in the fall/winter (during Trimesters I and III, when 35% and 29% of the longfin squid catch occurs, respectively). The longfin squid fishery is also known to interact with leatherback and loggerhead sea turtles late in Trimester II and early in Trimester III (between

48
August and October). The extent of these interactions, none of which have been determined to have negative population impacts of concern, is discussed in Criterion 2. Although a draft Atlantic Trawl Gear Take Reduction Strategy was written by NMFS in 2008, no regulations have been enacted in the longfin squid fishery to reduce the take of endangered/threatened and protected species (MAFMC 2011b). There are some strategies in place to reduce bycatch in the longfin squid fishery and these measures are somewhat precautionary, with bycatch caps and no indication of population impacts on bycatch species. However, there is need for increased precaution, to ensure that bycatch does not increase, and to reduce bycatch to the greatest extent practicable.
Scientific Research and Monitoring: Moderately Effective Bycatch monitoring is achieved via NMFS observer coverage on some trips; from 2006-2010, observed landings comprised approximately 3.5% of total longfin squid caught (MAFMC 2011b). Discard data for all observed otter trawl tows are extracted from the NEFSC Observer Database as well as from Vessel Trip Reports and the Dealer Database. These data are closely monitored so as to ensure the butterfish mortality cap is not exceeded within the longfin squid fishery. As a result of the implementation of the butterfish cap on the longfin squid fishery, observer coverage was substantially higher in 2011, with observed longfin squid landings comprising about 15% of total landings by weight (Didden 2012). The squid fishery is also involved with numerous cooperative research efforts with NMFS and academic institutions (Rutgers, UMass, Cornell) to reduce bycatch (Didden 2012). Further research has been carried out to determine the effect of codend mesh size on bycatch of butterfish and scup in the longfin squid fishery, as well as methods to limit bycatch of these species (Pol and Carr 2002; Bochenek et al. 2005; Hendrickson 2005). The NEFSC recently (2010) completed a study of three potential bycatch reduction devices (BRDs) with potential application to the longfin squid fishery (NMFS 2011b). None of these BRDs are currently being used in the fishery, as BRD designs and effectiveness are currently being tested and evaluated. Due to the similarity in size and life history between squid and butterfish, mechanical separation is unlikely and BRDs must rely on behavioral differences to attain separation (NMFS 2011b). As behavioral responses differ due to a number of factors (e.g. light, temperature, reproductive state and size of school), any BRD must be tested in several areas at different times to determine its effectiveness (NMFS 2011b). While regulatory and voluntary efforts made to date to reduce bycatch have been good, the MAFMC should continue to monitor and evaluate if additional efforts would be practicable, as required by the Magnuson Stevens Act.
Scientific Advice: Highly Effective There is scientific interest in reducing bycatch in the longfin squid fishery since both longfin squid and bycatch species play an important ecological role as a prey species to a host of predators (Staudinger and Juanes 2010). There is no indication that scientific advice is not followed, as the squid fishery is actively engaged in taking in scientific advice and trialing BRDs.
Enforcement: Moderately Effective Since the butterfish mortality cap was implemented for the longfin squid fishery in 2011, it has resulted in one closure of the longfin squid fishery (in spring 2012). Incidental takes of marine mammals and sea turtles have been documented and, therefore, enforcement needs to be adequate to monitor these interactions, but observer coverage is relatively low, leading to a lack of independent scrutiny of regulations; therefore, there is a need for increased monitoring of interactions with marine mammal and sea turtles (see also Enforcement factor in 3.1).

49
Shortfin Squid: Moderate Concern Key relevant information: The shortfin squid fishery has lower levels of bycatch than the longfin squid fishery, and there is an established management system in place to monitor bycatch rates. Limited occasional take of pilot whales has not been fully addressed.
Detailed rationale: Management Strategy and Implementation: Moderately Effective Measures taken by managers of the shortfin squid fishery include mechanisms for bycatch reporting, monitoring, and analysis, a SBRM performance standard, and a review and reporting process (NMFS 2008). Under SBRM, established in 2007 but since vacated, the NEFSC employed sampling designs developed to minimize bias to the maximum extent practicable in an attempt to ensure accurate data records of bycatch. Overall, bycatch in the shortfin squid fishery is relatively low, and the most frequently caught bycatch species are butterfish, spotted hake, and Buckler (John) dory (MAFMC 2011b). From 2006 to 2010, 91 shortfin squid trips (at least 50% shortfin squid by weight) made 962 hauls that were observed by NMFS-trained observers, equivalent to roughly 11% of shortfin squid landings over this time period. For every metric ton of shortfin squid caught on these trips, 6.1 lbs of butterfish, 1.7 lbs of spotted hake, and 1.8 lbs of Buckler (John) dory were caught (MAFMC 2011b). When longfin squid are caught incidentally in the fishery, an exemption from the minimum mesh size requirement otherwise in place for longfin squid allows for that species to be kept, reducing discards. There are no known interactions between the shortfin squid fishery and sea turtles. Available observer data suggests that pilot whales are the primary cetaceans to be affected by the fishery (FAO 2012a). The extent of these interactions, which have not been determined to have negative population impacts of concern, is discussed in Criterion 2, although precaution is needed to also include the cumulative impacts of all fisheries on these species. Under the Marine Mammal Protection Act, in 2006 NMFS convened the Atlantic Trawl Gear Take Reduction Team to address incidental mortality and injury of pilot whales, common dolphins, and Atlantic white-sided dolphins in Atlantic trawl fisheries (MAFMC 2011b). From 1995 to 2008, observers documented the discard of 216 swordfish on shortfin squid fishing trips (MAFMC 2011b). Management has since explored an alternative catch permit program that allows underutilized swordfish caught in the shortfin squid fishery to be retained. In August 2011, NMFS made available new Incidental HMS Squid Trawl permits to all shortfin squid moratorium permit holders, allowing for up to 15 incidentally caught swordfish to be retained per trip (NMFS 2012f). The new permitting system is intended only for the shortfin squid fishery, as swordfish discard rates were documented to be ten times higher than those in longfin squid fishery. This action aims to reduce dead discards of swordfish, improve fishery data collection, provide additional opportunities for the US swordfish quota to be attained, and accommodate traditional gears (e.g., trawls) that occasionally capture North Atlantic swordfish, while maintaining landings at incidental levels (NMFS 2012f). There are relatively low levels of discards in the fishery, mechanisms in place for bycatch reporting, monitoring, and analysis, and a review and reporting process (NMFS 2008). However, there is a need for increased precaution and mitigation measures to reduced bycatch to the greatest extent practicable.

50
Scientific Research and Monitoring: Moderately Effective Bycatch data are available for the shortfin squid fishery, but represent only a limited number of observed trips. Monitoring of discards in the shortfin squid fishery is compiled through the NMFS Observer Program Database, which includes data from trips that had trained observers onboard to document discards. The Northeast Fisheries Observer Program (NEFOP) serves as the primary mechanism to obtain data on bycatch and discards in the fishery. Observation of the fishery is also mandated by the Marine Mammal Protection Act, and the Mid-Atlantic shortfin squid trawl fishery is under Category 2 observation. Calculation of observer coverage rates occurs on an annual basis and is based on the amount of take observed in previous years. In recent years, NMFS observer coverage has generally been low (~11%; MAFMC 2011b) but varies considerably on an annual basis. From 1996 to 2007, the estimated observer coverage (measured in % of total trips observed) in the shortfin squid fishery was 3.7%, 6.21%, 0.97%, 2.84%, 11.11%, 0%, 0%, 8.74%, 5.07%, 6%, 15%, and 14%, respectively (NMFS 2012e).
Scientific Advice: Highly Effective There is no indication that scientific advice is not followed.
Enforcement: Moderately Effective Enforcement is provided via mandatory logbook reporting and observer coverage. At sea NEFOP observers monitor and document bycatch and discards attributed to the fishery (NMFS 2007). There is incidental take of marine mammals and sea turtles, therefore, there may be a need to increase enforcement in the shortfin squid fishery (see factor in 3.1).

51
Criterion 4: Impacts on the Habitat and Ecosystem Guiding principles
The fishery is conducted such that impacts on the seafloor are minimized and the ecological and functional roles of seafloor habitats are maintained.
Fishing activities should not seriously reduce ecosystem services provided by any fished species or result in harmful changes such as trophic cascades, phase shifts or reduction of genetic diversity.
Fishery Impact of gear on the substrate
Mitigation of gear impacts
EBFM Criterion 4
Rank (Score) Rank (Score) Rank (Score) Rank (Score)
Longfin Squid, Trawl
Moderate Concern (2)
Minimal mitigation (0.25)
Moderate Concern (3)
Yellow (2.6)
Shortfin Squid, Trawl
Moderate Concern (2)
Minimal mitigation (0.25)
Moderate Concern (3)
Yellow (2.6)
Justification Factor 4.1 Impact of the Fishing Gear on the Substrate: Moderate Concern Longfin Squid and Shortfin Squid Key relevant information: Longfin squid and shortfin squid habitat is sand and sand/mud along the continental shelf and slope and they are caught primarily using bottom otter trawl gear. Benthic biological and physical structures may take some time to recover from trawling impact on this substrate. Recently, some shortfin squid landings have come from midwater trawl gear, but the extent to which bottom contact occurs with that gear is unknown.
Detailed rationale: Longfin squid inhabit the continental shelf and the upper continental slope to depths of 400 m, occurring primarily in mud or sand/mud habitats (Hanlon et al. 2012). In 2010, the majority of long-finned squid were landed by bottom otter trawl gear and were caught in four NMFS statistical areas: 525, 616, 537, 622 (MAFMC 2011c). The primary bottom type in these areas is sand and sandy mud (Hanlon et al. 2012). Although the overall distribution limits of shortfin squid remain unclear, the young stages are associated with the continental edge of the Gulf Stream and subsequently with the adjacent

52
shelf, which is where the fishery is focused (Dawe and Warren 1993). Shortfin squid range from the surface to depths of 1000 m or more and are taken in waters from 0.5° to 27.3°C (Whitaker 1980). Like longfin squid, shortfin squid primarily inhabit sand or sand/mud habitats. The direct effects of trawling on soft bottom habitats include: 1) removal of organisms that create three-dimensional habitat such as depressions and burrows; 2) sediment resuspension (turbidity) and smoothing of sedimentary formations; and 3) removal of and/or damage to non-target species (Auster and Langton 1999). Longfin squid have been observed using shallow seafloor depressions and burrows created by other species such as skates, red hake and crabs (Auster and Langton 1999). Whether these three-dimensional features are used by longfin squid for cover from predators or to ambush prey is uncertain; however, the use of such features suggests that the fitness of individuals may be linked to small-scale patterns of habitat selection. While trawling degrades or removes such features and locally removes the species that produce them, recovery rates are assumed to be relatively rapid (Lindholm et al. 2004). The long-term effects of otter trawls, specifically on seafloor communities, are believed to vary depending on the specific configuration of gear used (including weight), the intensity of the trawling activity, and the type of habitat that is being fished (Pol and Carr 2002). Recovery times for biological structure could range from months to years and recovery for physical structure could range from days to months. While mobile sandy sediment communities can withstand 2–3 trawl passes per year without significant adverse change to physical structures or biota, recovery rates appear to be slower in muddy and structurally complex habitats, where they may cause permanent damage (Collie et al. 2000). In general, organisms in stable sediments such as gravel and mud suffer more adverse effects than those in unconsolidated sediments (Collie et al. 2000). While soft bottom habitats are generally less sensitive to disturbance by trawling than rocky bottoms and coral reefs, studies have found decreased habitat heterogeneity and epifaunal abundance in heavily trawled areas for both sandy bottom (Engel and Kvitek 1998) and mud bottom habitats (Hixon and Tissot 2007). Numerous reviews and meta-analyses document the severe effects of bottom trawling on epifaunal communities in low-disturbance muddy bottom habitats (Auster and Langton 1999, Norse and Watling 1999, Kaiser 2002, NRC 2002, Thrush and Dayton 2002, Kaiser et al. 2006). The aggregate impacts of trawling have been determined to be greater than the aggregate impacts of other bottom gear (e.g., scallop dredge) due to the greater surface area that is affected (NEFSC 2002b). Using a qualitative assessment approach, Stevenson and colleagues (2004) found that otter trawling in Atlantic EFH areas has a potentially high adverse impact on 18 life stages for 8 species, predominantly juveniles and adults; moderate impacts on 40 life stages of 21 species, predominantly juveniles, adults, and spawning adults; low impacts on about 30 life stages for 14 species, predominantly juveniles, adults, and spawning adults; no impacts on one life stage of one species, halibut eggs; and are not applicable to 67 life stages of 28 species, predominantly eggs and larvae (Stevenson et al. 2004; MAFMC 2011b). As it was completed in the same region, this study shed some light onto the possible gear impacts of bottom otter trawling by the squid fisheries (Stevenson et al.; MAFMC 2011b). However, it is extremely difficult to quantify the effects of trawling on the substrate and ecosystem, especially given the inter-annual variation in catch and effort in the squid fisheries. Given the potential degree of habitat impacts from trawling, it is conservative to conclude that there are moderate ecosystem impacts that would be associated with the habitat disruption/destruction associated with trawling even in the more resilient mud and sand habitats (NEFSC 2002b). According to NMFS

53
commercial landing statistics, in 2010 a substantial portion of shortfin squid landings (27%) were with midwater trawl gear (NMFS 2012a), which can minimize benthic impact if bottom contact is avoided (Chuenpagdee et al. 2003). This is the only year in the past decade that midwater trawl gear has comprised such a large amount of landings (Figure 27). However, it is unknown whether a) midwater otter trawls are a growing trend in the fishery and b) whether bottom contact is being avoided by midwater trawl nets.
Figure 27. US shortfin squid landings by bottom otter trawl and midwater otter trawl, 2000-2010. (Data from
NMFS 2012a)
Factor 4.2 Modifying Factor: Mitigation of Fishing Gear Impacts: Minimal Mitigation Longfin Squid and Shortfin Squid Key relevant information: Although bottom trawl fishing effort by the domestic squid trawl fisheries is being effectively controlled, it is not actively being reduced and a substantial proportion of all representative habitats are not protected. Detailed rationale: Measures enacted to mitigate the impacts of bottom trawl gear within the longfin squid and shortfin squid fisheries include some area closures and the designation of essential fish habitat for both squid species. MSB FMP Amendment 9 (2008) prohibited bottom trawling by MSB-permitted vessels in ecologically vulnerable Lydonia and Oceanographer Canyons, EFH areas that were already closed to the monkfish fishery (MAFMC 2012a). These are relatively small areas of sensitive habitat. Although not a result of squid management, Northeast Multispecies Closed Area and EFH Closed Areas (Figure 28) are also closed to the squid trawl fisheries. There are also two large gear-restricted areas for scup bycatch

54
avoidance that ban squid fishing during parts of the year (Powell et al. 2004). Collectively, these areas comprise a substantial closure but may not adequately encompass all representative habitats.
Figure 28. Areas closed to bottom trawling in the Northeast Region, including Lydonia and Oceanographer Canyons. EFH Closed Areas (pink) prohibit the use of mobile bottom-tending gear indefinitely. Northeast Multispecies Closed Areas, indicated in the legend by “Closures to All Gear Capable of Catching Groundfish” prohibit the use of gear capable of catching groundfish except in portions of the closed areas defined in the Special Access Program during certain times of the year (Figure from Packer et al. 2007). Additionally, EFH has been designated and updated for all life stages (eggs, pre-recruits, and recruits) of both shortfin squid and longfin squid (MAFMC 2011e). The EFH designations identify key habitats that

55
contribute to recruitment such as spawning and mating area, pre-recruits habitat and other area important for the regeneration of the stocks. EFH geographical designations are shown for shortfin squid (Figure 29) and longfin squid have not, however, led to any revised spatial management because data on fishing impacts to EFH—particularly egg EFH—is largely unavailable (MAFMC 2011e). Future closed areas to protect squid spawning areas could be an important measure to help maintain the health of these stocks (Hanlon 1998). Seafood Watch® concludes that although fishing effort by the domestic squid trawl fisheries is being effectively controlled, it is not actively being reduced. Mitigation of fishing gear impacts is rated “Minimal” for the longfin squid and shortfin squid fisheries.

56
Figure 29. Geographical designation of EFH for shortfin squid eggs (top; identified by abundance of mated
females), pre-recruits (bottom left) and adults (bottom right). (Figure from MAFMC 2011e)

57
Factor 4.3 Ecosystem and Food Web Considerations: Moderate Concern Longfin squid, along with shortfin squid and other small to medium sized fishes and invertebrates are called forage species because they provide prey for a wide range of predators such as fishes, marine mammals, and seabirds. Being relatively short-lived and with minimal energy reserves, squid populations can be greatly affected by changes to their planktonic food sources (e.g., as a result of changes in oceanographic conditions) as well as by predation levels, larval retention patterns, and water conditions. Forage species like squid occupy a middle trophic level and play the important ecological role of linking lower trophic level biomass to upper trophic levels. At higher and lower trophic levels, there are many species to facilitate these energy transfers, but the small number of forage species means their role is crucial to the food web (Alder and Pauly 2006). Because they are so critical to the marine ecosystem, removing forage species can impact marine mammals and seabirds (Baraff and Loughlin 2000, Tasker et al. 2000, Furness 2003, Becker and Beissinger 2006). One study estimated that forage species contribute $11.3 billion annually serving as food for other commercially important fish, while generating only $5.6 billion in direct catch, suggesting that forage species may be twice as valuable when unfished instead of fished (Pikitch et al. 2012). Kaschner and colleagues spatially modeled interactions between forage fisheries and marine mammal and seabird predators using data collected in the 1990s (Kaschner et al. 2006). The model results showed a much higher consumption of forage species by fisheries than by marine mammals (Figure 31). In contrast, in a study more focused on squid, Overholtz et al. (2000) estimated that consumption of longfin and shortfin squid by fish predators was equal to or exceeded squid landings in most years. Hunsicker et al. (2010) found that cephalopods provide substantial ecosystem services in support of fisheries and, on average, support 15% of global marine fisheries landings. Commercial fishing for krill, another important forage species, was banned by the National Oceanic and Atmospheric Administration (NOAA) in 2009 (74 Fed. Reg. 132, 13 July 2009) because the fishery was documented to have direct impacts on ecosystems (PFMC 2008b).
Figure 31. Mean estimated annual consumption of small pelagic forage species by marine mammals in comparison
to fishery catches in the 1990s. (Figure from Kaschner et al. 2006)

58
Longfin Squid and Shortfin Squid Key relevant information: Shortfin squid and longfin squid are both ‘exceptional species’ and, thus, important forage species, yet there is still much to be learned about their roles in regional food webs. But recent independent research is encouraging. Scientific assessment of these species’ physiology, genetics, and ecological role are now underway.
Detailed rationale: Longfin and shortfin squid are key forage species in the North Atlantic ecosystem, and their ecological roles are considered exceptional. These squid prey upon a vast variety of copepods, crustaceans, pelagic and benthic finfish, and other cephalopods throughout their different life stages (Dawe and Beck 1997; Hanlon et al. 2012; O’Dor and Dawe 2012). Fishing mortality impacts on squid abundance could have ecological spillover effects for a wide range of squid prey species. Both longfin squid and shortfin squid are important sources of standing biomass in their ecosystem, and are subject to both predation pressure and commercial harvesting (O’Dor and Dawe 2012; Hanlon et al. 2012). As stocks of currently overfished fish species continue to recover in the future, there may be an increase or shift in predatory demand on squid populations (Staudinger 2006; Staudinger and Juanes 2010). Within marine communities, individual’ trophic position is more accurately described by size rather than species. Thus, different sized squid are prey to different predators in the northwest Atlantic, including over 15 different finfish, elasmobranchs, marine mammals, and other squid (Staudinger and Juanes 2010; MAFMC 2011d). Within the longfin squid fishery, there is not believed to be a strong correlation between levels of commercial exploitation and standing biomass at this time. In contrast to Kaschner and colleagues’ modeling for forage species, impacts of the longfin squid fishery are considered to be low relative to natural levels of predation on the species. However, seasonal and regional predation has been shown to vary significantly for many predators. Although many previous assessments of predation pressure (e.g. using NMFS datasets) have examined predation only in the spring and fall, predation may be higher in the summer and winter, which could lead to more overlap with squid fisheries (Staudinger 2006). When fishing mortality and high predation mortality exhibit spatial and temporal overlap, high total mortality rates have the potential to cause local depletions, slow stock recovery, and ecosystem impacts (Hanlon et al. 2012; Moustahfid et al. 2009; Staudinger and Juanes 2010). In order to effectively manage longfin and shortfin squid and their predators sustainably, a holistic approach that considers multispecies interactions in near real-time is necessary. While scientific assessment of these species’ physiology, genetics, and ecological role are now underway, further research will be needed to evaluate the effects of fishing pressure and to determine areas of essential habitat that should be protected to ensure continued successful spawning and recruitment (Hanlon 1998; Staudinger and Juanes 2010; Hanlon et al. 2012). Outside of trawl impacts on substrate, little work has been done to evaluate the effects that commercial longfin and shortfin squid fishing has on local ecosystems. In a recent environmental assessment, the MAFMC explained:
Given the current uncertainty regarding [shortfin squid] stock dynamics it is not really possible to quantify the impact of any particular catch on this species’ availability for the various species and stocks of marine mammals, birds, and fish that prey on the managed resource. The Council did consider that specifications could be additionally reduced beyond other factors because of predator-prey considerations (MAFMC
59
2011b).
Recent studies have determined that longfin squid occupy an equivalent trophic position in the Mid-Atlantic Bight food web as some of their fish predators, suggesting that the species competes with mid- to high-level fishes (Hanlon et al. 2012; Logan et al. 2011; Logan and Lutcavage, In press). Shortfin squid and longfin squid are both exceptional forage species and there is still much to be learned about their roles in regional food webs, but recent independent research is encouraging. The MAFMC has not yet implemented ecosystem-based fishery management but does have an ongoing project to determine how best to incorporate ecosystem-based fishery management principles into decision making. The MAFMC is also in the initial phases of developing an amendment to conserve deep-water corals (Didden 2012).

60
Overall Recommendation Final Score = geometric mean of the four Scores (Criterion 1, Criterion 2, Criterion 3, Criterion 4). The overall recommendation is as follows:
Best Choice = Final Score >3.2, and no Red Criteria, and no Critical scores
Good Alternative = Final score >2.2, and Management (Criterion 3) is not Red, and no more than one Red Criterion, and no Critical scores, and does not meet the criteria for Best Choice (above)
Avoid = Final Score <=2.2, or Management (Criterion 3) is Red, or two or more Red Criteria, or one or more Critical scores.
Fishery Impacts on the Stock
Impacts on Other Species
Manage-ment
Habitat and Ecosystem
Overall
Rank
(Score)
Lowest scoring species
Rank*, Subscore, (Score)
Rank (Score)
Rank (Score)
Recommendation (Score)
Longfin Squid, Trawl Yellow
(3.05)
Loggerhead Sea Turtles
Red, (1.92,1.72)
Yellow (3)
Yellow (2.6)
GOOD ALTERNATIVE
(2.53)
Shortfin Squid, Trawl Yellow
(2.64)
Loggerhead Sea Turtles
Red, (1.92,1.92)
Yellow (3)
Yellow (2.6)
GOOD ALTERNATIVE
(2.51)
61
Acknowledgements Scientific review does not constitute an endorsement of the Seafood Watch® program, or its seafood recommendations, on the part of the reviewing scientists. Seafood Watch® is solely responsible for the conclusions reached in this report. Seafood Watch® would like to thank Michelle D. Staudinger of the University of Missouri Columbia and the National Climate Change & Wildlife Science Center, and two anonymous reviewers who graciously reviewed this report for scientific accuracy.

62
References Alder, J. and D. Pauly. 2006. On the Multiple Uses of Forage Fish: From Ecosystems to Markets. In:
Alder, J., Pauly, D., (Eds). On the multiple uses of forage fish: from ecosystems to markets. Fisheries Centre Research Reports 14(3). Fisheries Centre, University of British Columbia: viii-ix.
Auster, P. J. and R. W. Langton. 1999. The effects of fishing on fish habitat. American Fisheries Society Symposium 22:150-187.
Baraff, L. S. and T. R. Loughlin. 2000. Trends and potential interactions between pinnipeds and fisheries of New England and the U.S. West Coast. Marine Fisheries Review 62(4): 1-39.
Barange, M., M. Bernal, M. C. Cergole, L. A. Cubillos, C. L. Cunningham, G. M. Daskalov, J. A. A. De Oliveira, M. Dickey-Collas, K. Hill, D. J. Gaughan, L. D. Jacobson, F. W. Köster, J. Masse, H. Nishida, M. Ñiquen, Y. Oozeki, I. Palomera, S. A. Saccardo, A. Santojanni, R. Serra, S. Somarakis, Y. Stratoudakis, C. D. van der Lingen, A. Uriarte, and A. Yatsu. 2009. Current trends in the assessment and management of small pelagic fish stocks. In: Checkley, D., C. Roy, Y. Oozeki, J. Alheit (Eds.). Climate change and small pelagic fish stocks. Cambridge University Press, p. 191-255.
Becker, B. H. and S. R. Beissinger. 2006. Centennial decline in the trophic level of an endangered seabird after fisheries decline. Conservation Biology 20: 470-479.
Bochenek E. A., E. N. Powell, A. J. Bonner, and S. E. Banta. 2005. An assessment of scup (Stenotomus chrysops) and black sea bass (Centropristas striata) discards in the directed otter trawl fisheries in the Mid-Atlantic Bight. Fish. Bull. 103: 1-14.
Boyle, P. and P. G. Rodhouse. 2005. Cephalopods: Ecology and Fisheries. Blackwell Publishing, Oxford, UK. 452 p.
Buresch, K. C., G. Gerlach, and R. T. Hanlon. 2006. Multiple genetic stocks of longfin squid Loligo pealeii
in the NW Atlantic: stocks segregate inshore in summer, but aggregate offshore in winter. Marine Ecology Progress Series 310: 263-270.
Butler, J. L. 1989. Growth during the larval and juvenile stages of northern anchovy, Engraulis mordax, in the California Current during 1980-84. Fishery Bulletin 87: 645-652.
Carretta, J. V., K. A. Forney, E. Oleson, K. Martien, M. M. Muto, M. S. Lowry, J. Barlow, J. Baker, B. Hanson, D. Lynch, L. Carswell, R. L. Brownell Jr., J. Robbins, D. K. Mattila, K. Ralls, and M. C. Hill. 2010. US Pacific Marine Mammal Stock Assessments: 2010. NOAA Technical Memorandum, NOAA-TM-NMFS-SWFSC-476.
Cheung, W. W. L., T. J. Pitcher and D. Pauly. 2005. A fuzzy logic expert system to estimate intrinsic extinction vulnerabilities of marine fishes to fishing. Biol. Conserv. 124: 97-111.
Chuenpagdee, R., L. E. Morgan, S. M. Maxwell, E. A. Norse, and D. Pauly. 2003. Shifting gears: assessing collateral impacts of fishing methods in US waters. Front. Ecol. Environ. 1: 517-524.
CINMS. 2012. Marine Reserves Network Map. Channel Islands National Marine Sanctuary, NOAA. http://channelislands.noaa.gov/marineres/main.html
Collie, J. S., S. J. Hall, M. J. Kaiser, and I. R. Poiner. 2000. A quantitative analysis of fishing impacts on shelf-sea benthos. Journal of Animal Ecology 69:785-798.
Dawe, E.G. and P.C. Beck. 1997. Population structure, growth and sexual maturation of short-finned squid (Illex Illecebrosus) at Newfoundland. Can J. Fish. Aquat. Sci., 54: 137-146.
Dawe, E. G. and L. C. Hendrickson. 1998. A review of the biology, population dynamics, and exploitation of short-finned squid in the Northwest Atlantic Ocean in relation to the assessment and management of the resource. NAFO SCR. Doc. 98/59, Ser. No. N3051.

63
Dawe, E. G., E. B. Colbourne, and K. F. Drinkwater. 2000. Environmental effects on recruitment of short-finned squid (Illex illecebrosus). ICES Journal of Marine Science 57: 1002-1013.
Dawe, E. G., L. C. Hendrickson, E. B. Colbourne, K. F. Drinkwater, and M. A. Showell. 2007. Ocean climate effects on the relative abundance of short-finned (Illex illecebrosus) and long-finned (Loligo pealeii) squid in the northwest Atlantic Ocean. Fisheries Oceanography 16(4): 303-316.
Dawe, E. G. and W. Warren. 1993. Recruitment of short-finned squid in the Northwest Atlantic Ocean and some environmental relationships. J. Cephalopod Biol. 2(2): 1-21.
Didden, J. 2012. Personal Communication. Mid-Atlantic Fishery Management Council, Dover, DE. EAP. 2009. Ecosystem Assessment Report for the Northeast U.S. Continental Shelf Large Marine
Ecosystem. US Dept. Commer., Northeast Fish. Sci. Cent. Ref. Doc. 09-11, 34 p. http://www.nefsc.noaa.gov/publications/crd/crd0911/
Engel, J. and R. Kvitek. 1998. Effects of otter trawling on a benthic community in Monterey Bay National Marine Sanctuary. Conservation Biology 12:1204-1214.
Enticknap, B., A. Blacow, G. Shester, W. Sheard, J. Warrenchuk, M. LeVine, and S. Murray. 2011. Forage Fish: Feeding the California Current Large Marine Ecosystem. Oceana, Washington, D.C. http://oceana.org/sites/default/files/reports/Forage_Fish_OCEANA_2011_final.pdf
FAO. 2012a. Species Fact Sheets: Illex illecebrosus. Fisheries and Aquaculture Department. http://www.fao.org/fishery/species/2720/en.
FAO. 2012b. Species Fact Sheets: Loligo pealei. Fisheries and Aquaculture Department. http://www.fao.org/fishery/species/2714/en.
Federal Register. 2011. Rules and Regulations: MSB Amendment 11, Final Rule. Federal Register 76:215 (7 November 2011), p. 68642-68657.
Federal Register. 2012. Fisheries of the Northeastern United States; Atlantic Mackerel, Squid, and Butterfish Fisheries; Specifications and Management Measures, Final rule and interim specifications. Federal Register 77:55 (21 March 2012), p. 16472-16481. http://www.gpo.gov/fdsys/pkg/FR-2012-03-21/pdf/2012-6456.pdf
Finkbeiner, E. M., B. P. Wallace, J. E. Moore, R. L. Lewison, L. B. Crowder, and A. J. Read. 2011. Cumulative estimates of sea turtle bycatch and mortality in USA fisheries between 1990 and 2007. Biological Conservation 144: 2719-2727.
Fissel, B. E., N. C. H. Lo, and S. F. Herrick Jr. 2011. Daily egg production, spawning biomass and recruitment for the central subpopulation of northern anchovy, 1981-2009. CalCOFI Reports 52: 116-135.
Froese, R. and D. Pauly. Editors. 2011. FishBase. World Wide Web electronic publication. http://www.fishbase.org, version (02/2012).
Furness, R. W. 2003. Impacts of fisheries on seabird communities. Scientia Marina 67: 33-45. Glaser, S. M. 2011. Do albacore exert top-down pressure on northern anchovy? Estimating anchovy
mortality as a result of predation by juvenile north pacific albacore in the California current system. Fisheries Oceanography 20(3): 242-257.
Hammond, P. S., G. Bearzi, A. Bjørge, K. Forney, L. Karczmarski, T. Kasuya, W. F. Perrin, M. D. Scott, J. Y. Wang, R. S. Wells, and B. Wilson. 2008. Delphinus delphis. In: IUCN 2012 Red List of Threatened Species, Version 2012.2. http://www.iucnredlist.org
Hanlon, R. T. 1998. Mating systems and sexual selection in the squid Loligo: How might commercial fishing on spawning squids affect them? CalCOFI Reports 39: 92-100.
Hanlon, R. T. 2012. Personal Communication. Marine Biological Laboratory, Woods Hole, MA. Hanlon, R. T., K. Buresch, H. Moustafid, and M. Staudinger. 2012b. Doryteuthis pealeii, Longfin
inshore squid. In: Advances in Squid Biology, Ecology and Fisheries (In Press), Chapter 7. Nova Science Publishers, Inc.
64
Hatfield, E. M. C. and S. X. Cadrin. 2002. Geographic and temporal patterns in size and maturity of the longfin inshore squid (Loligo pealeii) off the northeastern United States. Fish. Bull. 100(2): 200-213.
Hendrickson, L. C. 2004. Population biology of northern shortfin squid (Illex illecebrosus) in the Northwest Atlantic Ocean and initial documentation of a spawning area. ICES J. Mar. Sci. 61: 252-266.
Hendrickson, L. 2005. Effectiveness of a square-mesh escape panel in reducing finfish bycatch in a small-mesh bottom trawl used in the longfin inshore squid (Loligo pealeii) fishery. U.S. Dep. Commer., Northeast Fish. Sci. Cent. Ref.Doc. 05-05; 37 p.
Hendrickson, L. 2006. Northern shortfin squid. In Status of Fisheries Resources off Northeastern United States. National Marine Fisheries Service. http://www.nefsc.noaa.gov/sos/spsyn/iv/sfsquid/
Hendrickson, L. and L. Jacobson. 2006. Longfin inshore squid (Loligo pealeii). In Status of Fishery Resources off the Northeastern US. National Marine Fisheries Service. http://www.nefsc.noaa.gov/sos/spsyn/iv/lfsquid/.
Hendrickson, L. C. and M. A. Showell. 2006. Assessment of northern shortfin squid (Illex illecebrosus) in Subareas 3+4 for 2005. NAFO SCR Doc. 06/46, Serial No. N5271. 16 p.
Hendrickson, L. C. 2010. Effects of a codend mesh size increase on size selectivity and catch rates in a small-mesh bottom trawl fishery for longfin inshore squid, Loligo pealeii. Fisheries Research 108(1): 42-51.
Hendrickson, L. C. and M.A. Showell. 2010. Assessment of Northern Shortfin Squid (Illex Illecebrosus) in Subareas 3+4 for 2009. Scientific Council Meeting, June 2010. Northwest Atlantic Fisheries Organization (NAFO). Ser. No. N5789. NAFO SCR Doc. 10/31.
Hixon, M. A. and B.N. Tissot. 2007. Comparison of trawled vs untrawled mud seafloor assemblages of fishes and macroinvertebrates at Coquille Bank, Oregon. Journal of Experimental Marine Biology and Ecology 344:23–34.
Hunsicker, M. E., T. E. Essington, R. Watson, and U. R. Sumaila. 2010. The contribution of cephalopods to global marine fisheries: can we have our squid and eat them too? Fish and Fisheries 11: 421-438.
Hunter, J. R. and B. J. Macewicz. 1980. Sexual maturity, batch fecundity, spawning frequency, and temporal pattern of spawning for the northern anchovy, Engraulis mordax, during the 1979 spawning season. CalCOFI Reports 21: 139-149.
Hunter, J. R. and S. R. Goldberg. 1980. Spawning incidence and batch fecundity in northern anchovy, Engraulis mordax. Fishery Bulletin 77(3): 641-652.
Jacobson, L. D., N. C. H. Lo, S. F. Herrick Jr., and T. Bishop. 1995. Spawning biomass of the Northern anchovy in 1995 and status of the coastal pelagic fishery during 1994. National Marine Fisheries Service Administrative Report LJ-95-11. La Jolla, CA.
Kaiser, M. J., J. S. Collie, S. J. Hall, S. Jennings, and I. R. Poiner. 2002. Modification of marine habitats by trawling activities: prognosis and solutions. Fish and Fisheries 3: 114–136.
Kaiser, M. J., K. R. Clarke, H. Hinz, M. C. V. Austen, P. J. Somerfield, and I. Karakassis. 2006. Global analysis of response and recovery of benthic biota to fishing. Marine Ecology Progress Series 311: 1–14.
Kaschner, K., V. Karpouzi, R. Watson, and D. Pauly. 2006. Forage fish consumption by marine mammals and seabirds. In: Alder, J. and D. Pauly (Eds). On the multiple uses of forage fish: from ecosystems to markets. Fisheries Centre Research Reports 14(3). Fisheries Centre, University of British Columbia: 33-46.
Kelleher, K. 2005. Discards in the world’s marine fisheries: an update. FAO Fisheries Technical paper. Issue 470. 154pp.
65
King, S. E., E. N. Powell and E. A. Bochenek. 2009. Effect of an increase in codend mesh size on discarding in the Loligo squid-directed fishery: a commercial-scale test. J. Northw. Atl. Fish. Sci. 40: 41-58. Doi:10.2960/J.v40m631.
Lange, A. M. and G. T. Waring. 1992. Fishery interactions between long-finned squid (Loligo pealei) and butterfish (Peprilus triacanthus) off the Northeast USA. J. Northw. Atl. Fish. Sci. 12: 49-62.
Leos, R. R. 1998. The biological characteristics of the Monterey Bay squid catch and the effect of a two-day-per-week fishing closure. CalCOFI Reports 39: 204-211.
Lindholm, J., P. Auster, and P. Valentine. 2004. Role of a large marine protected area for conserving landscape attributes of sand habitats on Georges Bank (Northwest Atlantic). Marine Ecology Progress Series 269: 61-68.
Logan, J. M., E. Rodriguez-Marin, N. Goni, S. Barreiro, H. Arrizabalaga, W. Golet, and M. Lutcavage. 2011. Diet of young Atlantic bluefin tuna (Thunnus thynnus) in eastern and western Atlantic foraging grounds. Marine Biology 158: 2147-2148.
Logan, J. M. and M. E. Lutcavage. In press. Assessment of trophic dynamics of cephalopods and large pelagic fishes in the central North Atlantic Ocean using stable isotope analysis. Deep Sea Research II, doi:10.1016/j.dsr2.2012.07.013.
MAFMC. 1998. Amendment 8 to the Atlantic Mackerel, Squid, and Butterfish (MSB) Fishery Management Plan (FMP). http://www.mafmc.org/fmp/pdf/SMB_Amend_8.pdf
MAFMC. 2006. 42nd Northeast Regional Stock Assessment Workshop (42nd SAW). Stock Assessment Report, Part A: Silver Hake, Atlantic Mackerel, and Northern Shortfin Squid. National Marine Fisheries Service, NOAA, Commerce. Ref. Doc. 06-09a.
MAFMC. 2009. Amendment 10 to the Atlantic Mackerel, Squid, and Butterfish (MSB) Fishery Management Plan (FMP). http://www.nero.noaa.gov/nero/regs/frdoc/09/09smbamend10FSEIS-web.pdf
MAFMC. 2011a. Amendment 14 to the Atlantic Mackerel, Squid, and Butterfish (MSB) Fishery Management Plan (FMP); Discussion document.
MAFMC. 2011b. 2012 Atlantic Mackerel, Squid and Butterfish Specifications and Management Measures; Environmental Assessment; Regulatory Impact Review; Initial Regulatory Flexibility Analysis. http://www.nero.noaa.gov/nero/regs/frdoc/11/11smb2012-2014specsEA.pdf
MAFMC. 2011c. 2011 Atlantic Mackerel, Squid, and Butterfish (MSB) Specifications Supplemental Environmental Assessment (SEA). http://www.nero.noaa.gov/nero/regs/frdoc/11/11SMB2011ButterfishSpecsRevisedEA.pdf
MAFMC. 2011d. Illex AP Informational Document. Mid Atlantic Fishery Management Council. April 2011. http://www.mafmc.org/fmp/msb_files/2012_Specs/Illex%20APInfo.pdf
MAFMC. 2011e. Amendment 11 to the Atlantic Mackerel, Squid, and Butterfish (MSB) Fishery Management Plan (FMP). http://www.mafmc.org/fmp/pdf/Amendment%2011%20FEIS%20-%20FINAL_2011_05_12.pdf
MAFMC. 2012a. History of the Atlantic Mackerel, Squid, and Butterfish FMP. http://www.mafmc.org/fmp/history/smb-hist.htm.
MAFMC. 2012b. Atlantic Mackerel, Squid, and Butterfish (MSB) 2012 Specifications. http://www.mafmc.org/fmp/msb_files/msbSpecs2012.htm.
MAFMC. 2012c. 2012 MAFMC Council Meetings. http://www.mafmc.org/meetings/meetings.htm MAFMC. 2012d. 2012 Atlantic Mackerel, Squid and Butterfish Fishery Information Documents.
Accessed October 19, 2012 at http://www.mafmc.org/meeting_materials/SSC/2012-05/SSC_2012_05.htm.
Marinovic, B., D. A Croll, and M. S. Mangel. 2003. Assessing the impact of climate change on the

66
California squid fishery: an integrated approach. California Sea Grant Program 03-04. Marinovic, B. 2007. New Model Links Ocean Conditions to Squid Biomass. California Sea Grant
Program. Methot, R. D. 1989. Synthetic estimates of historical abundance and mortality for northern anchovy.
American Fisheries Society Symposium 6: 66-82. Miller, T. and P. Rago. 2012. Empirical exploration of feasible bounds on butterfish stock size and fishing
mortality rates, 1975-2011. Report to the Mid-Atlantic Fishery Management Council Scientific and Statistical Committee. 14 p. Accessed November 8, 2012 at http://www.mafmc.org/meeting_materials/SSC/2012-05/2-Miller-Rago-2012-Butterfish-Logical-Assessment.pdf.
Moustahfid, H., M. C. Tyrrell, and J. S. Link. 2009. Accounting explicitly for predation mortality in surplus production models: an application to longfin inshore squid. North American Journal of Fisheries Management 29(6): 1555-1566.
MRAG Americas Inc. 2005. Final Report to Oceana: Wasted Resources: Bycatch and Discards in U.S. Fisheries. Report compiled by Harrington, J. M., R. A. Myers, and A. A. Rosenberg. 286pp.
NAFO. 2011. Scientific Council Meeting - 2011. SCS Doc. 11/16, Ser No. N5930, 236 p. NEFSC. 1996. Report of the 21st Regional Stock Assessment Workshop, Stock Assessment Review
Committee (SARC) Consensus Summary of Assessments. NEFSC Ref. Doc. 96-05d. 200p. NEFSC. 2002a. 34th Northeast Regional Stock Assessment Workshop (34th SAW), Public Review
Workshop. National Marine Fisheries Service. http://www.nefsc.noaa.gov/nefsc/publications/crd/crd0207/0207.pdf.
NEFSC. 2002b. Workshop on the Effects of Fishing Gear on Marine Habitats of the Northeastern United States. A Report of the Northeast Region Essential Fish Habitat Steering Committee., October 23-25, 2001, Boston, Massachusetts. Northeast Fish. Sci. Cent. Ref. Doc. 02-01; 86 p.
http://www.nefsc.noaa.gov/nefsc/publications/crd/crd0201/ NEFSC. 2006. 42nd Northeast Regional Stock Assessment Workshop (42nd SAW), 42nd SAW Assessment
Summary Report. Northeast Fish. Sci. Cent. Ref. Doc. 06-01, 61 p. National Marine Fisheries Service.
NEFSC. 2010a. 49th Northeast Regional Stock Assessment Workshop (49th SAW), Assessment Summary Report. National Marine Fisheries Service. http://www.nefsc.noaa.gov/saw/saw49/SARC49SummaryReport.pdf.
NEFSC. 2010b. Short-finned pilot whale (Globicephala macrorhynchus): Western North Atlantic Stock. http://www.nefsc.noaa.gov/publications/tm/tm219/72_SFPW.pdf
NEFSC. 2011. 51tst Northeast Regional Stock Assessment Workshop (51st SAW), Assessment Summary Report (2nd Edition). National Marine Fisheries Service.
http://www.nefsc.noaa.gov/saw/saw51/SARC51SummaryReport.pdf. NMFS. 2004. Assessment of Northern Shortfin Squid on the Eastern USA Shelf During 2004 and 2004.
SARC 42 Assessment Working Group. http://www.nefsc.noaa.gov/publications/crd/crd0609/pdfs/c.pdf.
NMFS. 2005. Essential Fish Habitat Source Document: Longfin Inshore Squid, Loligo pealeii, Life History and Habitat Characteristics; second edition.
NMFS. 2007. Draft Atlantic Trawl Gear Take Reduction Strategy. National Marine Fisheries Service. http://www.nero.noaa.gov/prot_res/atgtrp/meeting/7%20Draft%20Atlantic%20Trawl%20Take%20Reduction%20Plan.pdf
NMFS. 2008. Northeast Region Standardized Bycatch Reporting Methodology Omnibus Amendment. http://www.nero.noaa.gov/nero/hotnews/omnibus/
NMFS. 2009. Our living oceans. Report on the status of U.S. living marine resources, 6th edition. U.S.

67
Dep. Commer., NOAA Tech. Memo. NMFS-F/SPO-80, 369p. NMFS. 2010. Endangered Species Act Section 7 Consultation on the Federal Atlantic Mackerel, Squid
and Atlantic Butterfish Fishery Management Plan (FMP): Biological Opinion. 136 p. http://www.nero.noaa.gov/prot_res/section7/NMFS-signedBOs/SMB%20BIOP%202010.pdf
NMFS. 2011a. National Marine Fisheries Service. U.S. National Bycatch Report [W. A. Karp, L. L. Desfosse, S. G. Brooke, Eds.]. U.S. Dep. Commer., NOAA Tech. Memo. NMFS-F/SPO-117C, 508 p.
NMFS. 2011b. Annual Report to Congress on the Bycatch Reduction Engineering Program. 96p. NMFS. 2011c. Short-finned Pilot Whale (Globicephala macrorhynchus): Western North Atlantic Stock.
Accessed November 7, 2012 at http://www.nmfs.noaa.gov/pr/pdfs/sars/ao2011whps-wn.pdf NMFS. 2011d. Long-finned Pilot Whale (Globicephala melas melas): Western North Atlantic Stock.
Accessed November 7, 2012 at http://www.nmfs.noaa.gov/pr/pdfs/sars/ao2011whpl-wn.pdf NMFS. 2011e. Short-beaked Common Dolphin (Delphinus delphis delphis): Western North Atlantic
Stock. Accessed November 7, 2012 at http://www.nmfs.noaa.gov/pr/pdfs/sars/ao2011docs-wn.pdf
NMFS. 2012a. Annual Commercial Landings Statistics. Accessed February 19, 2012. http://www.st.nmfs.noaa.gov/st1/commercial/landings/annual_landings.html
NMFS. 2012d. FishWatch: US Seafood Facts: Longfin Squid. http://www.fishwatch.gov/seafood_profiles/species/squid/group_pages/index.html
NMFS. 2012e. Mid-Atlantic Bottom Trawl Fishery. Accessed 8 April 2012. http://www.nmfs.noaa.gov/pr/pdfs/fisheries/midatlantic_bottom_trawl.pdf
NMFS. 2012f. Atlantic Highly Migratory Species Fishery Compliance Guides. Quick Reference: Atlantic Swordfish Regulation. NOAA Fisheries Office of Sustainable Fisheries. http://www.nmfs.noaa.gov/sfa/hms/Compliance_Guide/Comm/Comm_Compliance_Guide_QR_Swordfish.pdf
NMFS. 2012h. Office of Protected Resources: Loggerhead Turtle (Caretta caretta). Accessed November 9, 2012 at http://www.nmfs.noaa.gov/pr/species/turtles/loggerhead.htm
NMFS. 2012i. Status of U.S. Fisheries, 3rd Quarter 2012. Table A. Summary of Stock Status for FSSI Stocks. Available at http://www.nmfs.noaa.gov/sfa/statusoffisheries/2012/third/Q3_2012_FSSI_nonFSSIstockstatus.pdf
NRC. 2002. Effects of trawling and dredging on seafloor habitat. A multi-author study prepared for NMFS by the National Research Council, Ocean Studies Board. National Academy Press, Washington, D.C., 126 p.
Norse, E. and L. Watling. 1999. Effects of mobile fishing gear: the biodiversity perspective. American Fisheries Society Symposium 22: 31-40.
O’Dor, R. K. and E. G. Dawe. 2012. Illex illecebsosus. In Advances in Squid Biology, Ecology and Fisheries. [R. Rosa, G. Peirce and R. K. O’Dor, Eds.]. In Press. Nova Science Publisher, Inc.
Okutani, T. and J. A. McGowan. 1969. Systematics, distribution, and abundance of the epiplanktonic squid (Cephalopoda, Decapoda) larvae of the California current, April, 1954-March, 1957. Bulletin of the Scripps Institute of Oceanography 14: 1-90.
Overholtz, W. 2006. Butterfish (Peprilus triacanthus). Status of Fishery Resources off the Northeastern US. Resource Evaluation and Assessment Division, Northeast Fisheries Science Center. http://www.nefsc.noaa.gov/sos/spsyn/op/butter/
Overholtz, W.J., J. S. Link, and L. E. Suslowicz. 2000. Consumption of important pelagic fish and squid by predatory fish in the northeastern USA shelf ecosystem with some fishery comparisons. ICES Journal of Marine Science 57: 1147–1159.

68
Packer, D., D. Boelke, V. Guida, and L. McGee. 2007. State of deep coral ecosystems in the Northeastern US region: Maine to Cape Hatteras. In: Lumsden S.E., T.F. Hourigan, A. Bruckner, and G. Dorr (Eds.) The state of deep coral ecosystems of the United States. NOAA, Silver Spring, MD.
Pecl, G. T. and G. D. Jackson. 2008. The potential impacts of climate change on inshore squid: biology, ecology, and fisheries. Reviews in Fish Biology and Fisheries 18: 373-385.
PFMC. 1998. Amendment 8 (to the Northern Anchovy Fishery Management Plan) incorporating a name change to: The Coastal Pelagic Species Fishery Management Plan. Pacific Fishery Management Council. http://www.pcouncil.org/coastal-pelagic-species/fishery-management-plan-and-amendments/amendment-8/
PFMC. 2008b. Management of krill as an essential component of the California Current ecosystem. Amendment 12 to the Coastal Pelagic Species Fishery Management Plan: Environmental Assessment, Regulatory Impact Review & Regulatory Flexibility Analysis. Pacific Fishery Management Council. http://www.pcouncil.org/wp-content/uploads/CPS_Am12_Krill_DraftEA.pdf
PFMC. 2009. Status of the Pacific Coast Coastal Pelagic Species Fishery and Recommended Acceptable Biological Catches: Stock Assessment and Fishery Evaluation (SAFE). Pacific Fishery Management Council 10: 1-137. http://www.pcouncil.org/coastal-pelagic-species/stock-assessment-and-fishery-evaluation-safe-documents/
PFMC. 2011. Status of the Pacific Coast Coastal Pelagic Species Fishery and Recommended Acceptable Biological Catches: Stock Assessment and Fishery Evaluation (SAFE). Pacific Fishery Management Council 12: 1-93. http://www.pcouncil.org/coastal-pelagic-species/stock-assessment-and-fishery-evaluation-safe-documents/
Pikitch, E., P.D. Boersma, I.L. Boyd, D.O. Conover, P. Cury, T. Essington, S.S. Heppell, E.D. Houde, M. Mangel, D. Pauly, É. Plagányi, K. Sainsbury, and R.S. Steneck. 2012. Little Fish, Big Impact: Managing a Crucial Link in Ocean Food Webs. Lenfest Ocean Program, Washington, D.C., 108 p.
Pol, M. and H. A. Carr. 2002. Scup bycatch reduction in Loligo squid fishery. NOAA/NMFS Marine Fisheries Initiative NA16FL1215. Final Report.
Powell, E. N., A. J. Bonner, B. Muller, and E. A. Bochenek. 2004. Assessment of the effectiveness of scup bycatch-reduction regulations in the Loligo squid fishery. Journal of Environmental Management 71 (2): 155-167.
Rago, P. J., and K. A. Sosebee. 2010. Biological reference points for the spiny dogfish. Northeast Fishery Science Center Reference Document 10-06; 52 p.
Roberts, S. 2011. Seafood Watch Seafood Report: Sharks and Dogfish. Monterey Bay Aquarium, Monterey, CA, 121 p.
Roel, B. 2011. CIE Independent Peer Review Report; 51st Stock Assessment Review Committee (SAW/SARC): Silver, red, and offshore hakes, and Loligo squid. Prepared for the Centre of Independent Experts, Centre for Environment, Fisheries, and Aquaculture Science (UK). http://www.nefmc.org/tech/cte_mtg_docs/110412-13/whiting/5b_SAW%2051%20Reviewer%20Rept_Roel.pdf
Rossman, M. C. 2010. Estimated bycatch of small cetaceans in northeast US bottom trawl fishing gear during 2000–2005. J. Northw. Atl. Fish. Sci. 42: 77–101. doi:10.2960/J.v42.m650:
Sea Fare Group. 2011. Quantification and Market Analysis of the Top 30 Seafood Species/Categories Consumed in the U.S. Prepared by Sea Fare Group for Monterey Aquarium Seafood Watch®, March 15, 2011.
Shaw, P. W., L. Hendrickson, N. J. McKeown, T. Stonier, M. J. Naud, and W. H. H. Sauer. 2010. Discrete spawning aggregations of loliginid squid do not represent genetically distinct populations. Marine Ecology-

69
Progress Series 408: 117-127. Staudinger, M.D. 2006. Seasonal and size-based predation on two species of squid by four fish
predators on the Northwest Atlantic continental shelf. Fish. Bull. 104: 605–615. Staudinger, M. D. and F. Juanes. 2010. A size-based approach to quantifying predation on
longfin inshore squid Loligo pealeii in the northwest Atlantic. Marine Ecological Progress Series 399: 225-241.
Stevenson D., L. Chiarella, D. Stephan, R. Reid, K. Wilhelm, J. McCarthy, and M. Pentony. 2004. Characterization of the fishing practices and marine benthic ecosystems of the northeast US shelf, and an evaluation of the potential effects of fishing on essential habitat. NOAA Tech Memo NMFS NE 181; 179 p. http://www.nefsc.noaa.gov/publications/tm/tm181/
Tasker, M. L., C. J. Camphuysen, J. Cooper, S. Garthe, W. A. Montevecchi, and S. J. M. Blaber. 2000. The impacts of fishing on marine birds. ICES Journal of Marine Science 57: 531-547.
Taylor, B. L., R. Baird, J. Barlow, S. M. Dawson, J. Ford, J. G. Mead, G. Notarbartolo di Sciara, P. Wade, and R. L. Pitman. 2011. Globicephala macrorhynchus. In: IUCN 2012 Red List of Threatened Species, Version 2012.2. http://www.iucnredlist.org
Thrush, S. F. and P. K. Dayton. 2002. Disturbance to marine benthic habitats by trawling and dredging: implications for marine biodiversity. Ann. Rev. Ecolog. Syst. 33: 449–473. Tingley, G. 2011. Individual CIE Report. SARC 51: silver hake, red hake, offshore hake, and the squid
Loligo pealeii. Prepared for the Centre of Independent Experts, Centre for Environment, Fisheries, and Aquaculture Science (UK). http://www.nefmc.org/tech/cte_mtg_docs/110412-13/whiting/5c_SAW%2051%20Reviewer%20Rept_Tingley.pdf
Turtle Expert Workgroup (TEWG). 2009. Assessment of the loggerhead turtle population in the Western North Atlantic Ocean. NOAA Technical Memorandum NMFS‐SEFSC‐575, 131p.
Whitaker, J. D. 1980. Squid catches resulting from trawl surveys off the southeastern United States. Mar. Fish. Rev. 42: 39-43.
70
Appendix A: Review Schedule The Mid-Atlantic Fishery Management Council convened a workshop on squid management in January, 2013 see: http://www.mafmc.org/events/SquidWorkshop.htm. The purpose of the workshop was to consider whether responsive harvest strategies are feasible and appropriate for optimizing yield in squid fisheries. Participants recommended improving squid management process along multiple timelines: Shorter Term It was recommended that the council consider operational improvements to enable the industry to achieve their current quota. Within the existing longfin quota, this might be achieved through flexibility in the trimester allocations or holding some portion of the annual quota in reserve, to be used in-season during a period of high abundance (any trimester). Other recommendations included broadening participation in electronic and real-time data collection. Medium Term Identify times (using fishery dependent and independent data) when in-season increases to the current quota would not jeopardize stocks. Indicators such as early season catches may allow in-season determinations that the squid stock is particularly robust. Longer Term Managers and scientists should expand ongoing efforts of working with the industry to improve data collection and assessment capabilities, as well as improving understanding of the ecological drivers of squid abundance. Population surveys are conducted regularly for squid; although population trends vary according to environmental conditions, there have not been any major population declines in recent years; therefore it is recommended to reassess longfin and shortfin squid in 2015

71
About Seafood Watch® Monterey Bay Aquarium’s Seafood Watch® program evaluates the ecological sustainability of wild-caught and farmed seafood commonly found in the United States marketplace. Seafood Watch defines sustainable seafood as originating from sources, whether wild-caught or farmed, which can maintain or increase production in the long-term without jeopardizing the structure or function of affected ecosystems. Seafood Watch makes its science-based recommendations available to the public in the form of regional pocket guides that can be downloaded from www.seafoodwatch.org. The program’s goals are to raise awareness of important ocean conservation issues and empower seafood consumers and businesses to make choices for healthy oceans. Each sustainability recommendation on the regional pocket guides is supported by a Seafood Report. Each report synthesizes and analyzes the most current ecological, fisheries and ecosystem science on a species, then evaluates this information against the program’s conservation ethic to arrive at a recommendation of “Best Choices,” “Good Alternatives” or “Avoid.” The detailed evaluation methodology is available upon request. In producing the Seafood Reports, Seafood Watch seeks out research published in academic, peer-reviewed journals whenever possible. Other sources of information include government technical publications, fishery management plans and supporting documents, and other scientific reviews of ecological sustainability. Seafood Watch Research Analysts also communicate regularly with ecologists, fisheries and aquaculture scientists, and members of industry and conservation organizations when evaluating fisheries and aquaculture practices. Capture fisheries and aquaculture practices are highly dynamic; as the scientific information on each species changes, Seafood Watch’s sustainability recommendations and the underlying Seafood Reports will be updated to reflect these changes. Parties interested in capture fisheries, aquaculture practices and the sustainability of ocean ecosystems are welcome to use Seafood Reports in any way they find useful. For more information about Seafood Watch and Seafood Reports, please contact the Seafood Watch program at Monterey Bay Aquarium by calling 1-877-229-9990. Disclaimer Seafood Watch® strives to have all Seafood Reports reviewed for accuracy and completeness by external scientists with expertise in ecology, fisheries science and aquaculture. Scientific review, however, does not constitute an endorsement of the Seafood Watch program or its recommendations on the part of the reviewing scientists. Seafood Watch is solely responsible for the conclusions reached in this report. Seafood Watch and Seafood Reports are made possible through a grant from the David and Lucile Packard Foundation.

72
Guiding Principles Seafood Watch defines sustainable seafood as originating from sources, whether fished1 or farmed, that can maintain or increase production in the long-term without jeopardizing the structure or function of affected ecosystems. The following guiding principles illustrate the qualities that capture fisheries must possess to be considered sustainable by the Seafood Watch program:
Stocks are healthy and abundant.
Fishing mortality does not threaten populations or impede the ecological role of any marine life.
The fishery minimizes bycatch.
The fishery is managed to sustain long-term productivity of all impacted species.
The fishery is conducted such that impacts on the seafloor are minimized and the ecological and functional roles of seafloor habitats are maintained.
Fishing activities should not seriously reduce ecosystem services provided by any fished species or result in harmful changes such as trophic cascades, phase shifts, or reduction of genetic diversity.
Based on these guiding principles, Seafood Watch has developed a set of four sustainability criteria to evaluate capture fisheries for the purpose of developing a seafood recommendation for consumers and businesses. These criteria are:
1. Impacts on the species/stock for which you want a recommendation 2. Impacts on other species 3. Effectiveness of management 4. Habitat and ecosystem impacts
Each criterion includes:
Factors to evaluate and rank
Evaluation guidelines to synthesize these factors and to produce a numerical score
A resulting numerical score and rank for that criterion Once a score and rank has been assigned to each criterion, an overall seafood recommendation is developed on additional evaluation guidelines. Criteria ranks and the overall recommendation are color-coded to correspond to the categories on the Seafood Watch pocket guide: Best Choices/Green: Are well managed and caught or farmed in environmentally friendly ways.
1 “Fish” is used throughout this document to refer to finfish, shellfish and other invertebrates.
73
Good Alternatives/Yellow: Buy, but be aware there are concerns with how they’re caught or farmed. Avoid/Red: Take a pass on these. These items are overfished or caught or farmed in ways that harm other marine life or the environment.