Seafood SucceSS - Alaska Seafood
12
Retail Consumer Research SEAFOOD SUCCESS Powered by Alaska
Transcript of Seafood SucceSS - Alaska Seafood

Retail Consumer
Research
Seafood SucceSSPowered by Alaska

Tr
yin
g T
o
inc
re
Ase
Co
ns
um
pT
ion
Tr
yin
g T
o
dec
reAs
eC
on
su
mp
Tio
n
nearly half of all Consumers are Trying To inCrease Their seafood ConsumpTion
Desired Change In Consumption By Protein Type n Affluent n General
Fish/ nuts chicken beAns veggie beeF Pork seAFood burgers
49% 48%
3% 7%
38%
42%
7% 9%
32% 36%
6% 8%
32%
38%
9% 9%
25% 28%
10%
13%
15%
23%
28% 26%
12%
17%
20%
27%
m o r e s a m e l e s s
27% 71% 1%
50% 46% 4%
20% 74% 6%
32% 66% 2%
59% 41% 0%
Seafood and pl ant-baSed are the only protein SourceS
that conSumerS began conSuming more of during the pandemic
Preferred Protein Type Consumption n o w vs l a s T y e a r
chicken
seAFood
beeF
Pork
PlAnt-bAsed
There’s so much to the story of
seafood from Alaska. Wild-caught
by generations of dedicated families
amid majestic snow-capped
mountains, rugged coastal shores
and pristine icy waters. Alaska is
where the best quality seafood
originates and according to
Datassential, calling out “Alaska
seafood” increases shoppers’
willingness to purchase. Read on
to learn more about consumer
seafood preferences and how Alaska
is a call-to-action, empowering the
supermarkets that promote it.
Consumers Want More Seafood
50%of consumers are choosing seafood more often than they did a year ago

unpreCedenTed growTh in 2020
huge grow Th aCross The seafood aisles
AnnuAl seAFood sAles by dePArtment 28% 36%2020
totAl seAFood sales increased
2020 Frozen seAFood
sales increased
new customers!
d e pa r T m e n T
Fresh seAFood
Frozen seAFood
grocery seAFood
totAl seAFood
$ $ C h a n g e
$ 7,157,261,912 24.9%
$ 6,792,090,847 35.7%
$ 2,680,811,593 21.3%
$ 16,630,164,352 28.4%
meAt
Produce
deli
seAFood
bAkery
18.7%
11.3%
0.3%
28.4%
–2.3%
According to the 2021 FMI Power of Seafood Report, the seafood department was a leader in the growth of grocery sales with an increase of
neArly 30% much stronger than meat, produce, deli and bakery.
26%of general consumerspurchased seafood for
the first time ever during the pandemic
Source: 2021 FMI Power of Seafood Report/Nielsen IQ
Source: 2021 FMI Power of Seafood Report/Nielsen IQ Source: 2021 FMI Power of Seafood Report/Nielsen IQ Source: 2021 FMI Power of Seafood Report/Nielsen IQ

35%of consumers are cooking more seafood
at home during the pandemic, with
MOST planning to continue after the
pandemic ends
continue cooking seafood at home after pandemic ends:
affluent 74%general 61%
heAlth & tAste lead the way as top 2 reasons
For choosing seAFood over other proteins
reaSonS for chooSing Seafood over other proteinS
n Affluent n General
It’s healthier overall
Prefer the taste
People in my household like seafood
It has more protein
It’s easier to prepare/cook
It’s more sustainable
I used to purchase it from restaurants, now I purchase
to cook from home
It’s more versatile
More variety available where I shop
Less of an environmental
impact
It’s been most available during the pandemic
It’s a better value
80% 61%
55% 57%
32% 23%
30% 24%
27% 21%
23% 26%
23% 16%
21% 22%
18% 12%
15% 10%
11% 9%
10% 15%
health & Flavor
Yet when it
comes to flavor
seafoodoutshines
55%while
plant-basedfalters
24%
for their
healthy appeal
Consumers select seafood
73%and
plant-basedfoods
74%

Consumer Shopping Behavior & Seafood
Cr avings and promoTions drive se afood purChases
Seafood purchaSing motivatorS n Affluent n General
Sales/promotions at the store
Had a craving for it
Saw a recipe for a seafood dish
Recommendations from friend/family
Displays at the grocery store
Family member asked for it
Recommendations from store employee
Saw an ad for a seafood dish
Free samples at store
54% 49%
50% 53%
34% 33%
22% 24%
19% 20%
18% 17%
15% 13%
14% 17%
12% 20%
your seAFood sAles stAFF is the
#1for consumers
looking for information on
seafood
resource
Fresh Freezer deli cAnned online seAFood Aisle counter Food counter Aisle
69% 57%
60%
69%
33% 42%
49%
59%
21% 25%
once a month+ Seafood purchaSing by grocery Store arean Affluent n General
where Consumers are shopping in The sTore

for encouraging consumers to eat more seafood at home
store ProvidedreciPe ideAs—
the #1 choice
5 toP
C o n s u m e rm o t i v a t o r s
for
choosingseAFood
over other
Proteins
More fresh optionsMore frozen options
Easy recipe ideasHealthy recipe ideas
Knowing the health benefitsKnowing the origin
Knowing the catch date
100% naturalLow cholesterol levels
Non-GMOOrganic
Product of the U.S.Wild caught
Sustainably sourcedEnvironmentally friendly
46%
35%
43%
44%
42%
38%
37%
49%
41%
35%
29%
42%
36%
43%
37%
42%
45%
42%
42%
40%
42%
42%
36%
39%
37%
39%
40%
42%
39%
41%
88%
80%
85%
85%
82%
80%
79%
86%
80%
72%
68%
83% 82%
78% 78%
en
vir
o
so
ur
ce
h
eAl
th
inFo
rm
Atio
n
vAr
iety
moTivaTors To Choose seafood over oTher proTeins when groCery shopping
n Yes, definitelyn Yes, maybe
#1 More fresh options 88%
#2 100% natural options 86%
#3* Easy recipe ideas 85%
#3* Healthy recipe ideas 85%
#4 Product of U.S.A. 83%
#5 Wild-caught 82%
*tied
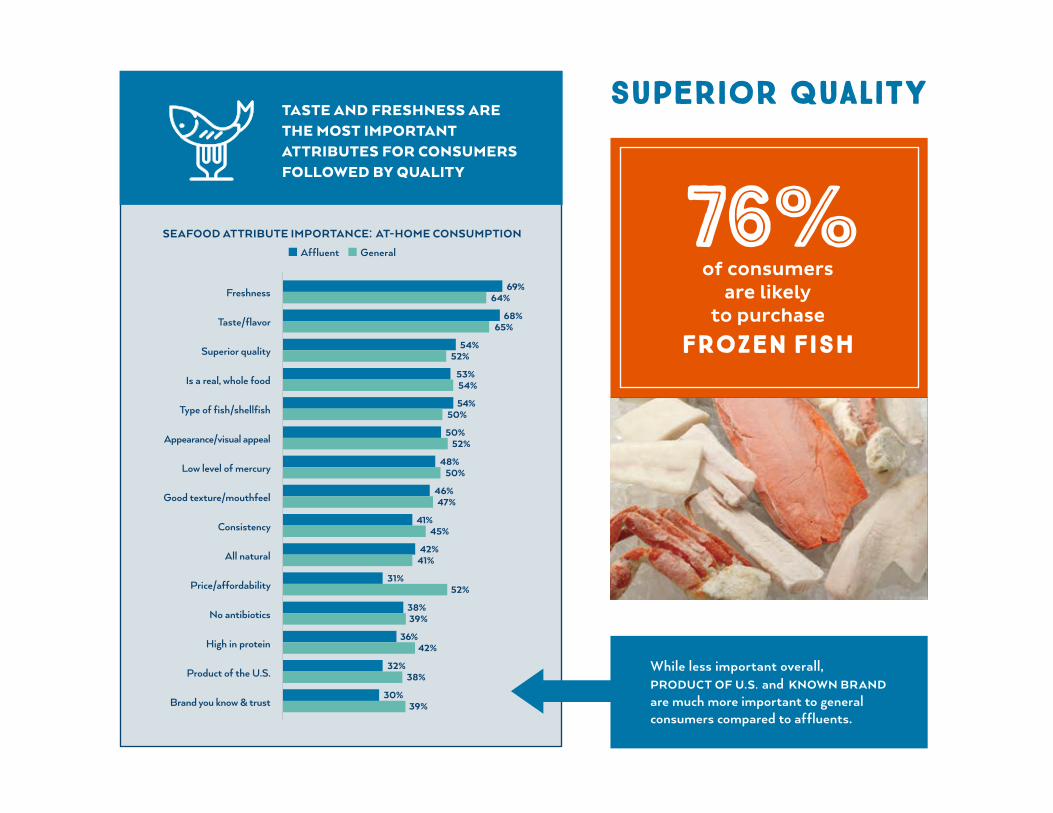
Seafood attribute importance: at-home conSumption
n Affluent n General
Freshness
Taste/flavor
Superior quality
Is a real, whole food
Type of fish/shellfish
Appearance/visual appeal
Low level of mercury
Good texture/mouthfeel
Consistency
All natural
Price/affordability
No antibiotics
High in protein
Product of the U.S.
Brand you know & trust
69% 64%
68% 65%
54% 52%
53% 54%
54% 50%
50% 52%
48% 50%
46% 47%
41% 45%
42% 41%
31% 52%
38% 39%
36% 42%
32% 38%
30% 39%
superior quality
While less important overall, product of u.S. and known brand are much more important to general consumers compared to affluents.
TasTe and freshness are The mosT imporTanT aTTribuTes for Consumers followed by qualiTy
76%of consumers
are likely to purchase
frozen fish

Consumers Want to Know the Origin…
and that it’s Wild-caught
Wild-cAught, origin And sustAinAbility are verY important when seleCting fish/seafood
Seafood attribute importance for ah preparation
n Affluent n General
The fish/seafood I buy is naturally
caught or wild
I know the source or origin of the
fish/seafood I buy
The fish/seafood I buy is sustainable
The fish/seafood I buy is caught close
to where I live
68%
62%
64%
64%
62%
65%
41%
42%
3 toP
reasons Consumers
prefer wild-Caught
seafood
tAste
less hArmFul Additives
heAlthier
5:1to farmed
Wildis preferred

Alaska Is Powerful and Drives Sales
Alaska king crab
Alaska pollock
Alaska king crab
Alaska pollock
Sablefish
Wild Alaska pollock
Wild-caught Alaska salmon
Alaska salmon
Wild Alaska cod
Alaska pollock
Alaska sole/flounder
Alaska halibut
Russia king crab
Swai/pangasius
King crab
Pollock
Previously frozen sablefish
Alaska pollock
Wild-caught salmon
Atlantic salmon
Pacific cod
Tilapia
Product of USA sole/ flounder
Fresh halibut
P R E F E R R E D S E A FO O D T Y P E S n Affluent n General
92% 85%
88% 80%
80% 72%
76% 73%
76% 65%
75% 69%
72% 70%
71% 68%
70% 67%
59% 52%
58% 50%
54% 55%
8% 15%
12% 21%
20% 28%
24% 28%
24% 35%
25% 31%
28% 30%
29% 32%
30% 33%
41% 48%
42% 50%
46% 46%
3 toP Consumer
desCriptors of seafood from alaska
nAturAl sAFe to eAt
suPeriorquAlity
Consumers prefer
AlAskAsAlmonvs. atl antiC salmon
7 10out oF
7 10out oFConsumers preferpolloCk when
WildAlAskAare Called out
and
Consumers prefer al ask a seafood by a wide margin

top agreement StatementS: Seafood generallyn Affluent n General
Consumers love al ask a seafood and believe The seafood is safe, naTur al and wild
Alaska seafood Alaska seafood Alaska seafood Alaska seafood Alaska seafood is safe to eat is natural is wild fisheries are is not as fresh cert. sustainable as farm-raised
86% 80% 77% 73%
69% 64% 52%
60%
23%
31%
promoTing The alaska origin is key To purChase
+ logo = $
impact of al aSk a Seafood on perceptionSn Affluent n General
Mentioning “Alaska seafood” increases consumers’ willingness to purchase and seeing the logo increases it even more
more likely to purchase
Unaffected
leSS likely to purchase
73% +4%
66% +6%
26% –4%
33% –6%
1% –1%
1% 0%
Change fromlogo addiTion
77%of affluent consumers are more likely to purchase seafood when they see the Alaska Seafood logo
72%of general consumers are more likely to purchase seafood when they see the Alaska Seafood logo
73%of consumers would paY more for seafood displaying the Alaska Seafood logo

the AlAskA seAFood logoextends beyond purchasing behavior,
including positive perceptions of the
grocery store overall, especially signaling
quality and sustainability
Store has high quality seafood
Store cares about seafood quality
Store recommends Alaska seafood
Store supports sustainable fisheries
Would recommend store’s seafood
82%
81%
77%
76%
72%
aSmi logo effect on Store perception
of consumers believe when a store features the Alaska Seafood logo that store supports
sustainable fisheries
76%
of consumers believe a store that displays the Alaska Seafood logo means the store sells
high qualitY seafood
82%
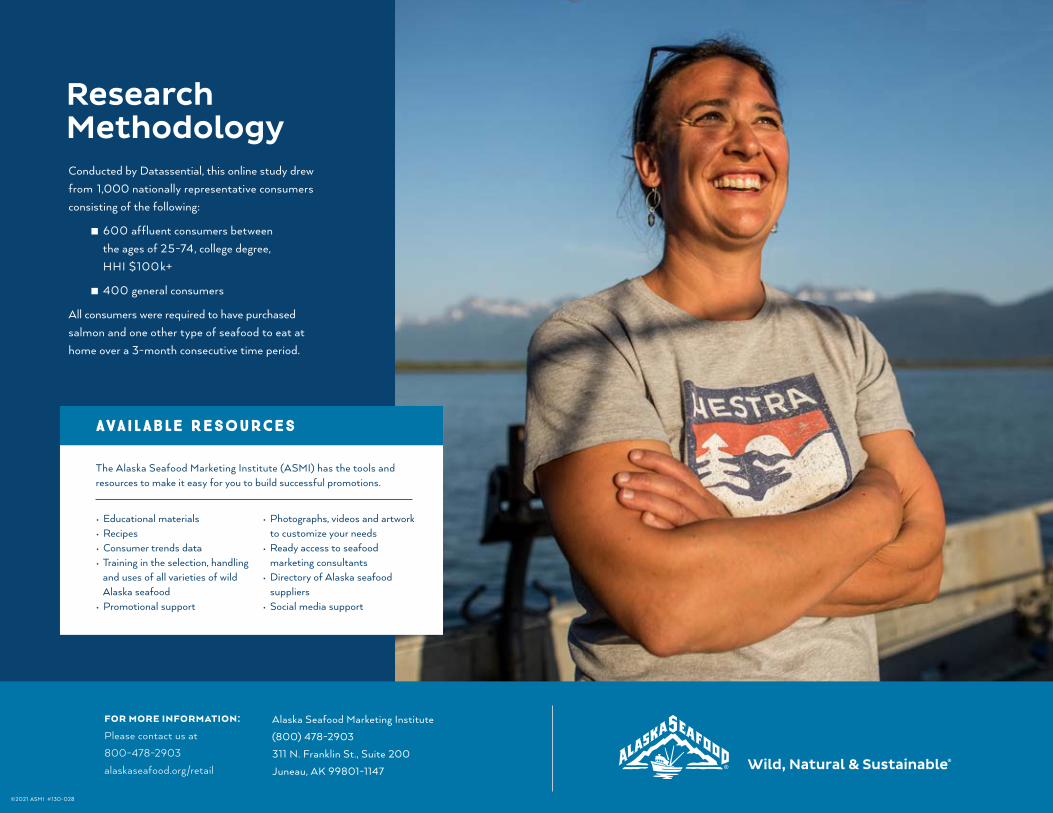
Research MethodologyConducted by Datassential, this online study drew from 1,000 nationally representative consumers consisting of the following:
n 600 affluent consumers between the ages of 25-74, college degree, HHI $100k+
n 400 general consumers
All consumers were required to have purchased salmon and one other type of seafood to eat at home over a 3-month consecutive time period.
Available resources
• Educational materials• Recipes• Consumer trends data• Training in the selection, handling
and uses of all varieties of wild Alaska seafood
• Promotional support
• Photographs, videos and artwork to customize your needs
• Ready access to seafood marketing consultants
• Directory of Alaska seafood suppliers
• Social media support
The Alaska Seafood Marketing Institute (ASMI) has the tools and resources to make it easy for you to build successful promotions.
Alaska Seafood Marketing Institute(800) 478-2903311 N. Franklin St., Suite 200Juneau, AK 99801-1147
for more informaTion:
Please contact us at 800-478-2903alaskaseafood.org/retail
©2021 ASMI #130-028