Seafood Demand Literature Review: Consumer preferences ...
38
1 Seafood Demand Literature Review: Consumer preferences, drivers of seafood demand, and demand for sustainable ocean management May 2019 Contents Scope of work ............................................................................................................................................... 2 Introduction .................................................................................................................................................. 2 Key messages ............................................................................................................................................... 4 Current demand for seafood ........................................................................................................................ 6 Forage Fish .............................................................................................................................................. 10 Bivalves ................................................................................................................................................... 10 The economics of seafood demand ............................................................................................................ 12 Income elasticity ..................................................................................................................................... 12 Own-price elasticity of demand .............................................................................................................. 16 Cross-price elasticity - substitution between land and ocean based sources ........................................ 18 Cross-price elasticity - substitution between types of fish ..................................................................... 21 Cross-price elasticity - substitution between wild and aquaculture fish ................................................ 22 Demand for fishmeal and fish oil ............................................................................................................ 22 Economic Conclusions............................................................................................................................. 24 Drivers of seafood preferences................................................................................................................... 25 Health ...................................................................................................................................................... 25 Technology .............................................................................................................................................. 26 Demand for sustainable ocean management ............................................................................................. 27 Eco-labeling ............................................................................................................................................. 27 Price Premiums ....................................................................................................................................... 28 Traceability.............................................................................................................................................. 28 Limitations .............................................................................................................................................. 29 Concluding Remarks.................................................................................................................................... 30 Work Cited .................................................................................................................................................. 31
Transcript of Seafood Demand Literature Review: Consumer preferences ...

1
Seafood Demand Literature Review:
Consumer preferences, drivers of seafood demand, and demand for sustainable ocean management
May 2019
Contents Scope of work ............................................................................................................................................... 2
Introduction .................................................................................................................................................. 2
Key messages ............................................................................................................................................... 4
Current demand for seafood ........................................................................................................................ 6
Forage Fish .............................................................................................................................................. 10
Bivalves ................................................................................................................................................... 10
The economics of seafood demand ............................................................................................................ 12
Income elasticity ..................................................................................................................................... 12
Own-price elasticity of demand .............................................................................................................. 16
Cross-price elasticity - substitution between land and ocean based sources ........................................ 18
Cross-price elasticity - substitution between types of fish ..................................................................... 21
Cross-price elasticity - substitution between wild and aquaculture fish ................................................ 22
Demand for fishmeal and fish oil ............................................................................................................ 22
Economic Conclusions ............................................................................................................................. 24
Drivers of seafood preferences ................................................................................................................... 25
Health ...................................................................................................................................................... 25
Technology .............................................................................................................................................. 26
Demand for sustainable ocean management ............................................................................................. 27
Eco-labeling ............................................................................................................................................. 27
Price Premiums ....................................................................................................................................... 28
Traceability .............................................................................................................................................. 28
Limitations .............................................................................................................................................. 29
Concluding Remarks.................................................................................................................................... 30
Work Cited .................................................................................................................................................. 31
2
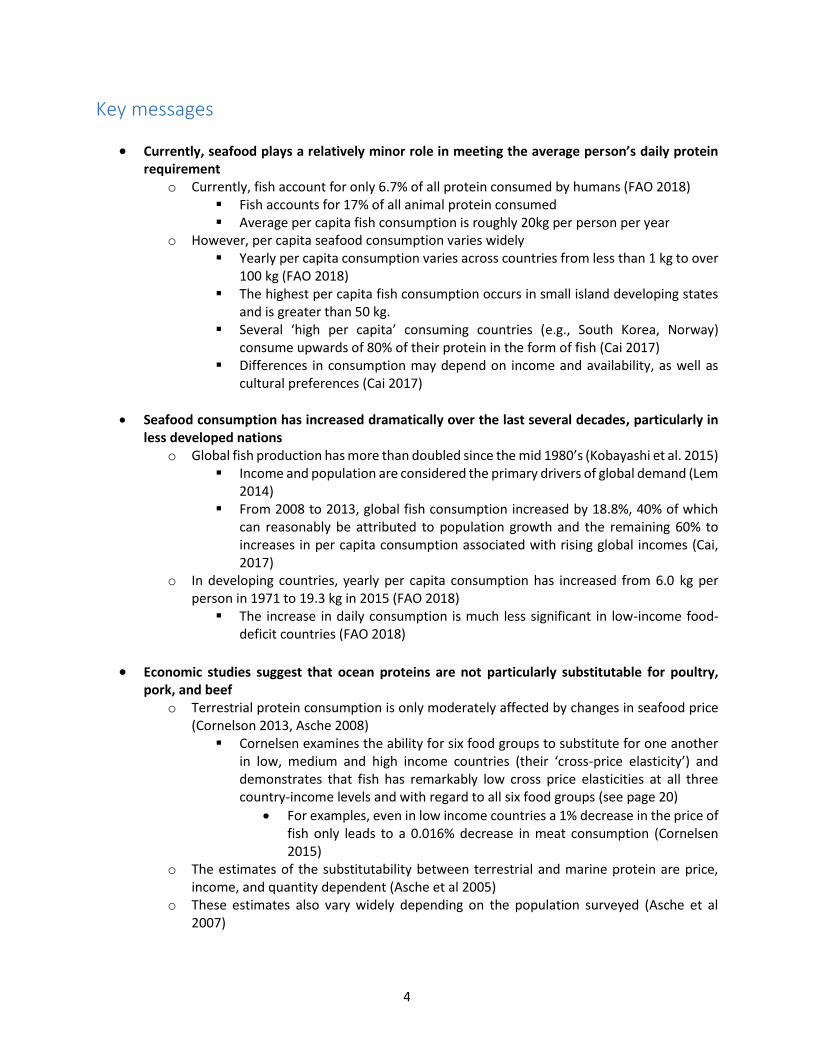
Scope of work The purpose of the following report is to supplement phase I work of the project entitled “Estimating the
Ocean’s True Potential for Feeding the Planet.” The primary focus of phase I is to construct a global supply
curve of protein from the ocean. We developed six supply curves, with each curve representing the
ocean’s production potential under an assumption about fishmeal and fish oil availability and feed
requirements. In practice, the demand for seafood is the primary driver of how much seafood is produced.
More research is needed to incorporate the role of demand in understanding the ocean’s true food system
potential. Here we review the literature on seafood demand to date to both frame and focus potential
future work. In essence, this report documents a global perspective of consumer preferences for seafood.
The information below may be used to facilitate projections of future seafood production and
consumption with the goal of informing a more sustainable trajectory. Primarily this work will focus on
the global demand for food fish. However, because of the interactions between food fish production and
fishmeal and fish oil production, a section is dedicated to the demand for fish oil and fishmeal specifically.
Introduction Sustenance is arguably the most basic of all humans needs. The word itself is derived from ‘sustain.’ So it
is ironic, in a sense, that today the provision of such sustenance is pressuring our natural ecosystems
beyond sustainable limits. To simply meet the basic human need, the average person needs roughly two
liters of drinking water, 2500 calories, and fifty grams of protein per day, as well as other macro and
micronutrients (Gleick 1996, Owen et al. 1986, Leonard and Robinson 1992, Pellet 1990). The World Food
Programme estimates that one in three people worldwide suffer from some form of malnutrition (World
Food Programme). However, for those with the means, diet is determined by a complex set of socio-
cultural factors such as preferences, context and identity. For many consumers in this category, these
drivers eclipse the concern for meeting the basic physical requirements for life. The environmental
pressure of the global food system is thus an aggregate of billions of individuals simply trying to survive
and billions using food to satisfy wants above and beyond food’s basic physical potential. As global
development continues, diets will be determined by choice rather than necessity. If we lived in a world
where food demand was determined by individuals’ desire to perfectly satisfy their nutritional
requirements at the lowest cost, nutritional supply curves would be sufficient to predict how, where, and
what food was produced. Conceptualizing a realistic global food system that is healthy for humans and
the planet requires us to think deeply about the role that food plays in peoples’ lives. Ultimately, we must
contend with the concept of palatability.

3
Fish account for roughly 6.5% of all protein consumed by humans. Fish is more than just protein, however,
as it supplies important micronutrients and fatty acids to consumers, human or otherwise (FAO 2012).
Furthermore, fish certainly provide well-being above and beyond its role is meeting consumers’ basic
nutritional requirements, as evidenced by the differences in price and demand for various food fish
species. The capacity of the planet to meet future demands for food will inevitably rely on the productivity
of the ocean (Pauly 2002). The premise of this project rests on three observations. First, the current global
food system is falling short, as discussed above, and seafood production has a role to play in curbing
hunger and malnutrition (Golden et al. 2016). Second, demand for seafood is expected to rise significantly
in the coming years (Delgado 2003, Cai 2017). Finally, there are notable concerns about the sustainability
of current production practices (Botsford et al. 1997, McClanahan et al. 2008). In mass, the three
observations present a critical challenge for future seafood production and food production as a whole:
meet future demand in a way that minimizes negative environmental and ecological impacts. Of key
importance in this task are the understanding the drivers of current demand for seafood, the potential
shifts in future demand, and the mechanisms by which demand may be augmented or nudged towards a
sustainable trajectory. This report reviews and synthesizes the best available scientific literature on these
themes and is organized as follows: First, current demand for seafood is reviewed, including a focus on
demand for forage fish and mollusks for direct human consumption. Second, the economics of seafood
demand are reviewed with particular emphasis on empirical estimates of price and income elasticities.
Third, drivers of seafood preferences are discussed. Fourth, consumer demand for seafood sustainability
is reviewed, highlighting eco-labeling. Finally, we make concluding remarks. Prior to these in-depth
reviews of the literature, we also synthesize the key messages that emerged from our review of this
literature as a whole.
4
Key messages
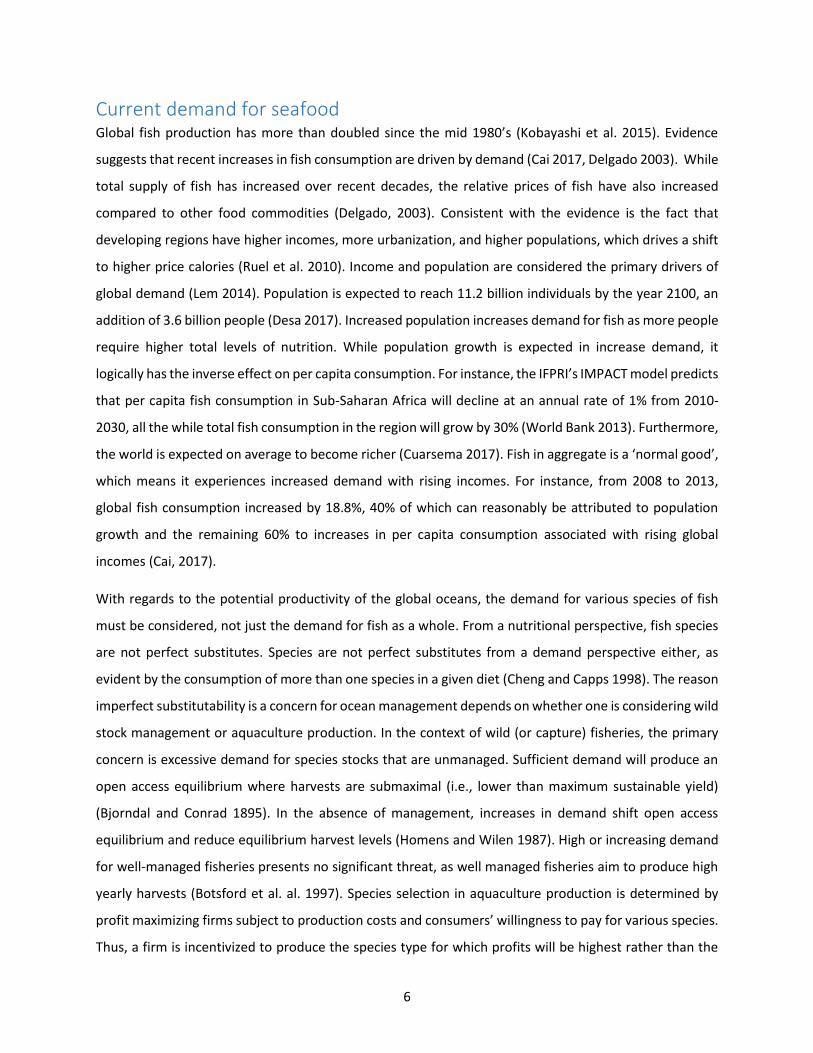
Currently, seafood plays a relatively minor role in meeting the average person’s daily protein requirement
o Currently, fish account for only 6.7% of all protein consumed by humans (FAO 2018) Fish accounts for 17% of all animal protein consumed Average per capita fish consumption is roughly 20kg per person per year
o However, per capita seafood consumption varies widely Yearly per capita consumption varies across countries from less than 1 kg to over
100 kg (FAO 2018) The highest per capita fish consumption occurs in small island developing states
and is greater than 50 kg. Several ‘high per capita’ consuming countries (e.g., South Korea, Norway)
consume upwards of 80% of their protein in the form of fish (Cai 2017) Differences in consumption may depend on income and availability, as well as
cultural preferences (Cai 2017)
Seafood consumption has increased dramatically over the last several decades, particularly in less developed nations
o Global fish production has more than doubled since the mid 1980’s (Kobayashi et al. 2015) Income and population are considered the primary drivers of global demand (Lem
2014) From 2008 to 2013, global fish consumption increased by 18.8%, 40% of which
can reasonably be attributed to population growth and the remaining 60% to increases in per capita consumption associated with rising global incomes (Cai, 2017)
o In developing countries, yearly per capita consumption has increased from 6.0 kg per person in 1971 to 19.3 kg in 2015 (FAO 2018)
The increase in daily consumption is much less significant in low-income food-deficit countries (FAO 2018)
Economic studies suggest that ocean proteins are not particularly substitutable for poultry, pork, and beef
o Terrestrial protein consumption is only moderately affected by changes in seafood price (Cornelson 2013, Asche 2008)
Cornelsen examines the ability for six food groups to substitute for one another in low, medium and high income countries (their ‘cross-price elasticity’) and demonstrates that fish has remarkably low cross price elasticities at all three country-income levels and with regard to all six food groups (see page 20)
For examples, even in low income countries a 1% decrease in the price of fish only leads to a 0.016% decrease in meat consumption (Cornelsen 2015)
o The estimates of the substitutability between terrestrial and marine protein are price, income, and quantity dependent (Asche et al 2005)
o These estimates also vary widely depending on the population surveyed (Asche et al 2007)

5
Scientific and anecdotal evidence suggests that preferences for seafood have changed historically, but there is little understanding of the mechanisms behind shifts in consumer preference
o Anecdotal evidence: In 1920, Danish fisherman discarded blue fin tuna accidentally caught in mackerel
nets (Pauly 1995) Halibut was considered ‘unpalatable’ prior to 1830 (Jacquet and Pauly 2007) In Asia, jellyfish now have a flourishing commercial market after over-exploitation
of their predators lead to a massive growth in their stock in Asian waters (Pitcher and Pauly 1998)
Examples such as these have even led notable scientists to suggest that changes in public taste accompany changing marine ecosystems (Jacquet and Pauly 2006)
o Significant drivers of consumer demand for seafood are health and safety concerns, concerns about production systems and new technologies, and desire for sustainable products (Lem 2014)
o Small scale interventions such as eco-labeling may affect consumer purchasing behavior, though not always with the intended consequences (Hallstein 2013)
While eco-labels and certifications have been shown to change purchasing behavior (at least in certain circumstances), the evidence that these programs actually result in better managed fisheries is contested
Evidence suggests that the Marine Stewardship Council, one of most prominent eco-labeling programs, does in fact accurately convey species stock health to consumers (Gutierrez et al. 2012)
The most recent models project seafood demand to 2025 and 2030. Cai et al (2017) suggest an increase in demand of 47 MMT in 2025 as compared to 2015 given current fish prices. Kobayashi et al. (2015) suggests a 20.1% increase (32 MMT) in seafood consumption in 2030 compared to 2015 levels (Kobayashi 2015) given future supply and demand mediated prices.
o Existing projections in the literature do not project further out than 2030. These models rely exclusively on income, price, and population effects. As well as
presenting scenario analysis for preference shifts, disease outbreaks, etc. Future projections are limited by accuracy of price, income, and population
changes and their effects on fish consumption over time o Cai et al. 2017 project future demand for five aggregate fish groups (marine fish,
freshwater and diadromous fish, crustaceans, shell mollusks, and cephalopods) Historical consumption of these five seafood categories can be seen in Figure 1. Projections suggest a supply-demand gap of 28 MMT, 55% of which is gap
between shellfish supply and demand and 45% of which is a gap between finfish supply and demand.
Future projections of demand for all five seafood categories can be seen in Figure 4.
6
Current demand for seafood Global fish production has more than doubled since the mid 1980’s (Kobayashi et al. 2015). Evidence
suggests that recent increases in fish consumption are driven by demand (Cai 2017, Delgado 2003). While
total supply of fish has increased over recent decades, the relative prices of fish have also increased
compared to other food commodities (Delgado, 2003). Consistent with the evidence is the fact that
developing regions have higher incomes, more urbanization, and higher populations, which drives a shift
to higher price calories (Ruel et al. 2010). Income and population are considered the primary drivers of
global demand (Lem 2014). Population is expected to reach 11.2 billion individuals by the year 2100, an
addition of 3.6 billion people (Desa 2017). Increased population increases demand for fish as more people
require higher total levels of nutrition. While population growth is expected in increase demand, it
logically has the inverse effect on per capita consumption. For instance, the IFPRI’s IMPACT model predicts
that per capita fish consumption in Sub-Saharan Africa will decline at an annual rate of 1% from 2010-
2030, all the while total fish consumption in the region will grow by 30% (World Bank 2013). Furthermore,
the world is expected on average to become richer (Cuarsema 2017). Fish in aggregate is a ‘normal good’,
which means it experiences increased demand with rising incomes. For instance, from 2008 to 2013,
global fish consumption increased by 18.8%, 40% of which can reasonably be attributed to population
growth and the remaining 60% to increases in per capita consumption associated with rising global
incomes (Cai, 2017).
With regards to the potential productivity of the global oceans, the demand for various species of fish
must be considered, not just the demand for fish as a whole. From a nutritional perspective, fish species
are not perfect substitutes. Species are not perfect substitutes from a demand perspective either, as
evident by the consumption of more than one species in a given diet (Cheng and Capps 1998). The reason
imperfect substitutability is a concern for ocean management depends on whether one is considering wild
stock management or aquaculture production. In the context of wild (or capture) fisheries, the primary
concern is excessive demand for species stocks that are unmanaged. Sufficient demand will produce an
open access equilibrium where harvests are submaximal (i.e., lower than maximum sustainable yield)
(Bjorndal and Conrad 1895). In the absence of management, increases in demand shift open access
equilibrium and reduce equilibrium harvest levels (Homens and Wilen 1987). High or increasing demand
for well-managed fisheries presents no significant threat, as well managed fisheries aim to produce high
yearly harvests (Botsford et al. al. 1997). Species selection in aquaculture production is determined by
profit maximizing firms subject to production costs and consumers’ willingness to pay for various species.
Thus, a firm is incentivized to produce the species type for which profits will be highest rather than the

7
species with the highest capacity for protein production. With regard to both wild-caught fisheries
production and aquaculture production, demand is a key determinant, and particularly the demand for
individual species or seafood types is critical. The section below outlines the available information to date
regarding the regionally explicit consumption of five fish types: marine fish, freshwater and diadromous
fish, crustaceans, shell mollusks, and cephalopods. Per Cai et al. 2017, the global composition of fish
consumption by species has taken the following trajectory:
Figure 1. Graphic from Cai et al. 2017 outlining the consumption of five marine commodity groups in 2008 and 2013. Found on page 10 of Cai et al. 2017

8
The largest change in per capita consumption, according to Cai, is due to the substantial increase in
consumption of freshwater and diadromous fish, particularly in Asia (Cai 2017). The most recent global
estimates of per capita consumption by species group are as follows (Table 1):
Species Per capita consumption
(kg/capita/year)
Percentage of total fish
consumption
Marine fish 7.23 36.7%
Freshwater and
diadromous fish
7.46 37.9%
Crustaceans 1.87 9.5%
Shell Mollusks 2.61 13.3%
Cephalopods 0.51 2.6%
Table 1 The global per capita consumption of various fish species. Data is taken from Cai et al. 2017, along with the species groupings. Cai et al. aggregate county level consumption data from 2013 for the five species groups from FAO food balance sheets.
The results above suggest the largest growth in the species group of freshwater and diadromous fish. This
is consistent with recent supply growth being fastest for certain low value species such as tilapia, carp,
and catfish (World Bank 2013). However, the information is also presented in a regionally explicit manner.
Globally, 38% of all fish produced or caught are traded internationally (FAO 2012). Therefore, considering
global supply and demand is required for understanding regional fisheries and aquaculture outcomes.
Below, the graphic depicts the consumption of the five commodity groups introduced above by region:

9
Figure 2. Graphic from Cai et al. 2017 outlining the consumption of five marine commodity groups in 2008 and 2013 for various regions. Found on page 11 of Cai et al. 2017
The information above shows significant heterogeneity in per capita consumption of fish by type and in
quantity. As described in detail in the section specifically discussing income elasticity, the information in
Figure 2 is used to understand the effect of income on per capita consumption. The level of aggregation
in Figure 2 is a common and practical means of aggregation. Understanding the demand for species at a
more disaggregate level is empirically challenging due to data limitations. However, it is still important to
understand the dynamics of demand for various fish types. Species with low relative demand provide an
interesting case study as these are the species where arbitrage opportunities may exist to leverage or
change consumer preferences to maximize the ocean’s productivity potential. For instance, where forage
fish species are often used in animal feeds (aquaculture and terrestrial animal feeds), there may be
opportunities to increase the productivity of the ocean in terms of availability of fish for human

10
consumption by increasing demand for species that are currently viewed unfavorably. Below we briefly
discuss two examples of these species types: forage fish and bivalves.
Forage Fish Forage fish, a common name given to small pelagic species such as anchovy, sardine, and herring, are
consumed both directly and indirectly (i.e., through fish oil or aquaculture products that use feed
containing fish) by humans worldwide. Forage fish are categorized as marine fish in Figure 2. Because of
the low price of forage fish generally, countries such as Ghana, Togo, and Nigeria often import forage fish
as a means of meeting domestic demand for cheap animal protein (Alder and Sumaila 2005). An
aggregated table in Alder and Pauly’s 2006 work shows how virtually all small fish species currently used
for fishmeal and fish oil reduction are or were eaten by humans. Perhaps more surprisingly, the per capita
direct human consumption (DHC) of forage fish in Europe increased during the late 1990s and early 2000s
(Alder and Pauly 2006). Alder and Pauly identify four drivers of consumption of small pelagics: increasing
wealth, substitution, increasing competition, and soybean price fluctuations. In rapidly developing areas
such as China, an increased demand for high value fish has been observed. The increased demand for high
value fish may offset demand for lower value fish species (Alder and Pauly 2006). Globally decreasing
prices of salmon has made substitution away from small pelagics and towards a traditionally higher value
fish possible as well (Asche and Tveteras 2005). Importantly, demand for higher value fish often comes
with an embedded demand for small pelagics used as feed in aquaculture system, which competes with
the demand for small pelagics for human consumption (Delgado 2003). As discussed below, the
alternative non-human consumption use of forage fish is primarily as an input to aquaculture or terrestrial
protein in the form of feed, which reduces total available protein for human consumption in an aggregate
sense. One possible mechanism by which to increase the total protein available for human consumption
is to drive demand for forage fish for DHC.
Bivalves In mass, the quantity of non-fed species produced via aquaculture has declined compared to high trophic
level species over the past decades, though non-fed species still account for roughly a third of all
aquaculture production (FAO 2012). In general, the bivalve market is growing substantially – 30% of the
supply demand gap described by Cai et al. is attributed to the shell mollusk species groups (Cai et al. 2017).
The FAO has also noted consistent growth in the bivalve market, where production has increased by
roughly 7% annually during the 1980s and 1990s (FAO 2004, FAO – Globefish). Bivalve aquaculture

11
production is considered low cost and relatively sustainable (Ferreira 2007). As described in the following
sections, bivalves and marine fish are relatively poor substitutes for consumers. The choice between large
high-value marine aquaculture species, such as salmon, and bivalves presents a significant environmental
and economic trade off (Ferreira 2007, Black 2001, Read and Fernandez 2003)

12
The economics of seafood demand Economics has a rich history of considering the demand for seafood, and food more generally. Economic
studies concerning demand for seafood generally takes the form of demand analysis and market
integration studies. The purpose is to estimate a key set of parameters associated with demand: income
elasticity, own-price elasticity, cross-price elasticity, and market integration. The fundamental assumption
underlying virtually all economic demand analysis is one of exogenous preferences., meaning that
underlying tastes are fixed and predetermined. The assumption implies that while determinants of
demand can change (such as demographics, income, and prices), that the structure of underlying
preferences is constant. The assumption is generally considered to hold across time. While preferences
across a population can be heterogeneous, aggregate demand is constructed using a representative agent
for a given population. The preference structure of agents that the aggregate consumer represents will
influence the parameter estimates. In this vein, it is particularly important to consider regional or
demographic differences of a sampled population. As will be discussed below, parameter estimates vary
widely depending on the reference population. Parameter estimates also depend crucially on the level of
aggregation of the commodity of interest. In empirical studies, a specific level of fish aggregation must be
assumed. For instance, estimates exist for the income and price elasticities of fish as a commodity group
as well as for finfish specifically. The theoretical implications of the level of aggregation of empirical
estimates is discussed below as well. The aggregation of fish species in previous research may present as
a modest roadblock in future work. Consider, for instance, how small pelagic fish have played a significant
role in the human diet dating back to at least Roman times (Alder and Pauly 2006). Small pelagics, such as
sardine and herring, are considered relatively easy to catch given their schooling habits (Tyedmers et al
2005). As such, it may be that protein from the ocean is best derived by focusing on forage fish given
adequate demand. However, empirical economic literature considering demand for forage fish is limited.
Best approximations to deal with the aggregation challenges are discussed below. The following sections
are organized first around the empirical parameters of interest in demand analysis: income elasticity, own-
price elasticity, and cross-price elasticity. We conclude discussing the relationship between fish oil,
fishmeal, and food fish demand.
Income elasticity The effect of income growth on per capita consumption is known as income elasticity of demand. An
income elasticity of 0.5 implies that a 1% increase in income will increase demand by 0.5%. The income
elasticity of demand for fish describes the percentage change in consumption of fish as a result of a
percentage change in income. The level of aggregation is significant with regard elasticity estimates, with

13
higher aggregation resulting in a higher likelihood of a good being normal (i.e., demand increases when
income increases) and less price elastic (i.e., demand does is not as responsive to changes in price) (Asche
2007). While income elasticities for fish depend greatly on the level of income of the population studied,
high income countries have a fish expenditure elasticity of demand roughly equal to 0.4, and lower and
middle income countries have higher fish expenditure elasticities (Muhammed 2015). While fish demand
will not increase as rapidly as income, it will continue to rise in absolute terms as global average incomes
increase (Cai 2017, Delgado 2003, Kobayashi 2015). Cai’s 2017 FAO report projects future short-term
supply and demand gaps for five aggregated seafood species: marine fish, crustaceans, shell mollusks,
cephalopods, and freshwater and diadromous fish. Income elasticities for each species group are
estimated for the twenty countries with the highest global fish consumption. The report suggests that in
aggregate the future demand for fish will far outpace supply increases (Cai 2017). This trend will not
necessarily hold for all types of fish across all income groups however. The following figure (Figure 3)
summarizes the regional specific income elasticities:

14
Figure 3. Income elasticity estimates as determined by and presented by Cai. Et al. 2017. Figure taken from Cai et al. 2017, page 21, figures 15A and 15B
Future demands are projected using the income elasticity estimates and population and income
projections. From 2008 to 2013, global fish consumption increased by 18.8%, 40% of which can reasonably
be attributed to population growth and the remaining 60% to increases in per capita consumption as a
result of increasing incomes (Cai, 2017). This global fish consumption data was used to estimate the
regional income elasticities of demand. The analysis suggests that given fixed prices and preferences the
world will demand an additional 47 million tons of fish in 2021 as compared to 2015. The supply side
projection is estimated using a linear extrapolation of aquaculture output and the assumption of fixed
output from wild fisheries. The composition of this gap with regard to fish species is shown below in Figure
4:

15
Figure 4 Cai et al. project the species composition of future demand-supply gaps in the early 2020's using population and income projections (Cai et al. 2017)
The result is an estimate demand-supply gap of 28 million tons in the early 2020’s with shellfish accounting
for 55% of the gap, while finfish account for the other 45%. Further, this report suggests, that given
constant wild catch, it would take 9.9% annual growth in aquaculture production to meet world fish
demand (Cai 2017). The FAO report implicitly endorses this current work by showing that if global fish
production continues unchecked we should expect to see needs continually unmet by unsustainable
production practices. The level of aggregation of the FAO report is such that all five species categories
present similar results, where demand continues to exceed supply.
Income elasticities are a point estimate for a given mean level of income or consumption. This is
particularly salient when considering long term demand projections where the marginal effects of income
elasticity of consumption at a given level do not extrapolate accurately far away from the observed level
of consumption. Muhammed et al. estimate expenditure elasticities for various food groups over low,

16
middle, and high income countries (Muhammed et al. 2013). Table 2 shows the resulting expenditure
elasticities for fish:
Table 2. Adapted expenditure elasticities for fish from Muhammed et al. 2013. Estimates are grouped by the income level of the
country.
Country income level Fish expenditure elasticity of demand
Low income 0.65
Middle income 0.52
High income 0.38
The results presented in Table 2 are consistent with Cai et al. 2017. Furthermore, Table 2 is consistent
with the observation that expenditure on food generally takes up a larger fraction of total expenditure in
poorer countries. In low income countries, food expenditures can occupy up to 62% of total expenditures,
whereas in middle and high income countries it is much less, around 6 – 30% (Gao, 2012).
Own-price elasticity of demand The own-price elasticity of a good measures the percentage change in demand as a result in a 1% change
in the price of that good. Of particular relevance in this discussion are the terms elastic, inelastic, and unit
elastic. Generally, food is considered to be price inelastic (Muhammed 2013) which generally means that
demand is not very sensitive to changes in price.
Price elasticity estimates of fish began with the classic study by Bell in 1968 (Bell 1968). A particularly
complete review of the history of price elasticity estimates for fish is given by Asche 2007. Asche notes
several key observations. First, methods have changed drastically over time, leading to variation of the
resulting estimates. Second, estimates are highly sensitive to the level of aggregation, as consumers can
substitute more effectively within a highly aggregated commodity group such as ‘fish.’ Accordingly, highly-
aggregated commodities tend to be less price elastic (Asche 2007).
Own price elasticities for fish have been estimated extensively in the literature, with a remarkable lack of
consistency in the results. A 2009 meta-analysis conducted by Gallet identified 1,014 own price elasticity
estimate studies with sufficient information for inclusion. Notably, the most common species groups with
own price elasticity estimates are salmon and shellfish. Moreover, Gallet’s meta-analysis concisely
outlines key sensitivities of the own price elasticity estimates: demand specification, data reliability, and

17
the method of estimation (Gallot 2009). Gallot reports the median absolute own price elasticities for fish
as a whole, salmon, and shellfish (Table 3):
Table 3. Median absolute own price elasticity estimates as per Gallot 2009 for various products.
Product Number of observations Median absolute own-price elasticity
Fish 833 0.79
Salmon 93 1.28
Shellfish 88 0.86
In general, aggregate estimates of fish own-price elasticities are around 0.5, substantially lower than any
other animal-meat protein (Andreyeva et al. 2010). The regional differences in own price elasticity
estimates is apparent in Gallot’s 2009 meta-analysis as well. In particular, Gallot notes that U.S. demand
is more price elastic than demand in other countries (Gallot 2009). Median absolute own price elasticities
of fish demand as estimated by Gallot are shown below (Table 4) for several countries.
Table 4. Median absolute own price elasticity estimates as per Gallot 2009 for various countries
Country Number of observations Median absolute own-price elasticity
US 237 1.08
UK 128 0.68
Japan 140 0.83
Other Countries 509 0.81
Timmer’s proposition suggests that own-price elasticities of demand are generally observed to be larger
for countries of lower income (Timmer 1989). This phenomenon is observed with aggregate fish price
elasticity of demand as well (Table 5).
Table 5 adapts price elasticities for fish from Muhammed et al. 2013. Estimates are grouped by the income level of the country.
Country income level Fish price elasticity of demand
Low income -0.48
Middle income -0.382
High income -0.278

18
While Timmer’s proposition holds, the price elasticities are still quite inelastic. There are several general
reasons for inelasticity. Necessities tend to be less elastic than luxuries as their consumption is required
and thus less prone to augmentation. Demand is less elastic when there are limited available substitutes.
Demand also tends to be less elastic for aggregated consumption goods such as fish as opposed to cod,
salmon, etc., due to a lack of substitutability between higher level consumption groups. Finally, price
elasticity of demand depends on the level of price and the shape of the demand function. For a linear
demand function, price elasticity is greatest when the price is also high and becomes more inelastic as
price decreases. The higher price elasticity of demand in poorer countries is observed broadly, not just for
fish. Mechanisms for adjusting to food price changes in poor countries include substituting to lower-
quality food, decreasing overall consumption, and shifting away from high nutrient towards calorie rich
foods (Ruel et al. 2010). Many of these options are undesirable for more affluent consumers, resulting in
less elastic price elasticities in richer countries. For a detailed account of income and own-price elasticities
for specific species in Asia, see Dey et al. 2008.
Cross-price elasticity - substitution between land and ocean-based sources The demand interactions between marine and terrestrial protein determine the extent to which additional
marine protein consumption will substitute for terrestrial protein sources in the diet. Classically this
relationship is characterized by the cross-price elasticity of demand. Again, cross-price elasticities are
estimated at a given price and income level (Andreyeva 2010). As a result, the estimated substitution likely
does not project consistently far away from the equilibrium of estimation (Deaton 1980). Furthermore,
preference heterogeneity or other changing demand determinants limits external validity of a given price
- income estimate (Muhammed 2011, Cornelsen 2015). The estimates below report cross-price elasticities
as estimated by Cornelsen, and own-price elasticities as estimated by Green 2013 and reported by
Cornelsen (Cornelsen and Green 2013). Due to the nature of the cross-price elasticity and its typical use
in higher-level expenditure studies, a high level of aggregation is often used (Asche 2007). Estimates of
the cross-price elasticity between a specific fish species and a cut of beef are virtually non-existent (Cheng
and Capps 1988). Fish has remarkably low cross price elasticities at all three country-income levels and
with regard to all six food groups. The low cross price elasticity between meat and fish is particularly non-
intuitive. Even in low income countries a 1% increase in the price of meat only leads to a 0.04% increase
in fish consumption (Cornelsen 2015). One particularly useful component of the Cornelsen meta-analysis

19
is that estimates are grouped by country-income, with a high, middle, and low income designation, though
only 38 countries had reliable estimates to include in the analysis (Cornelsen et al. 2015). The estimates
below (Tables 4-6) report cross-price elasticities as estimated by Cornelsen, and own-price elasticities as
estimated by Green 2013 and reported by Cornelsen. A slight copying error was corrected by the author.
The Cornelsen cross price elasticities confirm the Timmer proposition with regard to cross-price elasticities
as well, again justifying the intuition that more wealthy individuals are less price sensitive. It is important
to keep in mind that within country income differences will also result in a gradient of estimated
elasticities. Green 2013, in fact, suggests that within country variation for own price elasticities may be
larger than between country income levels (Green 2013). Cornelsen points out that this is likely true for
cross-price elasticities as well (Cornelsen 2015). The following figures (tables from Cornelsen 2015) show
the cross-price elasticities predicted by the Cornelsen meta-analysis:
Figure 5. Predictions of own and cross-price elasticities for major food groups for low income countries. Table is borrowed from Cornelsen 2015.

20
Figure 6. Predictions of own and cross price elasticities for major food groups for middle income countries. Table is borrowed from Cornelsen 2015.
Figure 7. Predictions of own and cross price elasticities for major food groups for high income countries. Table is borrowed from Cornelsen 2015.
Cheng and Capps estimate cross price elasticities between several specific types of seafood (crab, oysters,
shrimp, cod, sole, haddock, perch, and snapper) and poultry and red meat. Overall, their results are
consistent with Cornelsen, suggesting limited substitutability between fish and meat. Substitution is
slightly higher for fish and poultry as compared to fish and red meat, in general (Cheng and Capps 1988).
The resulting interpretation is that terrestrial protein is a relatively poor substitute for marine protein.
While low substitutability implies that decreases in fish price would not decrease terrestrial protein

21
consumption significantly, the effects of a shift in preferences on relative and absolute protein
consumption is ambiguous.
Cross-price elasticity -substitution between types of fish Estimates of cross-price elasticities between various fish species suggest the degree to which changes in
prices will redistribute fish consumption across species (Wessells 1994, Singh 2012, Jaffry 2008). These
studies rely generally on household scanner level data, or detailed diary-style reporting by households.
Due to the nature of a species-specific cross-price elasticity, the estimates are generally at the country
level. Aggregate cross-price elasticities of demand for specific species would be difficult to estimate at a
global scale due to lack of market integration, unclear availability, and heterogeneous preferences. While
estimates are available for high income countries (Japan, Wessell 1994; US, Singh 2012) and low income
countries (Bangladesh, Dey 2012), the results vary considerably. Of particular note is the fact that species
pairs may be complements or substitutes depending on the context and the species pair. The following
table shows one particular set of estimates, estimated using the Almost Ideal Demand System (AIDS), a
modeling framework that imposes basic assumptions about consumer preferences in order to easily
estimate parameters such as elasticities. It illustrates the potential for both substitute and complement
relationships within fish demand systems.
Figure 8. Results of an Almost Ideal Demand System modeling of fish demand in the United Kingdom. The table is borrowed from Fofana and Clayton 2003.

22
Cross-price elasticity – substitution between wild and aquaculture fish Demand interactions between aquaculture and wild caught fisheries play and important role in the future
of seafood. Research regarding market interactions of farmed and wild species has been both theoretical
and empirical. Bioeconomic theoretic models typically find that that the addition of aquaculture supply to
a market decreases prices of and pressure on wild stocks assuming the goods are perfect substitutes
(Anderson 1985, Anderson and Wilen 1986), though this depends critically on the market structure of
both wild and aquaculture markets (Anderson 1985). Empirical studies typically use market integration
techniques to test for integration of aquaculture of wild-caught markets, as cross-price elasticity estimates
require micro-data that differentiates between wild-caught and farmed products. In the Japanese salmon
market, Asche et al. find close substitutability between farmed and wild-caught species, where the influx
of farmed species led to price decreases of wild caught products (Asche et al 2005). Mickwitz et al. found
similar results in Finland with regard to wild salmon and farmed trout and salmon. They further identify
trade dynamics that influence the market behavior of these goods (Mitwitz et al. 1996). There has been
limited work to estimate the cross-price elasticities of wild-caught and farmed species. One notable study
concludes that all five available species of wild-caught salmon in Canadian markets are substitutes with
farmed Atlantic salmon (Pattern 2015).
The dynamics of the interactions between aquaculture and wild stocks are multifaceted. Significant
research has focused on the ecological interactions and risks associated with aquaculture production,
including disease outbreaks, genetic infiltration of wild stocks, and food competition (Hanson and Windsor
2006). Claims have been made that aquaculture is a vital mechanism by which to reduce pressure on
natural fisheries (Naylor 2000). While this seems to hold up theoretically, there is some recent empirical
evidence to the contrary (Anderson 1985, Longo et al. 2019)
Demand for fishmeal and fish oil Roughly 70% of global wild fisheries captures are directly consumed by humans as food (Shepard and
Jackson 2013). Other than direct human consumption, captures are primarily used as inputs for
aquaculture and terrestrial protein production in the form of feed inputs (Tacon and Metian 2008). Fish-
based inputs to animal protein production occur as fish oil and fishmeal exclusively derived from wild
caught fisheries (anchoveta, herring, etc.) and production scrap (Wijkstrom 2012). Termed ‘indirect
human consumption’ (IHC), supply of fish into secondary protein production (both terrestrial and marine)
results in trophic ascension and the loss of protein compared to true protein potential had a suitable
substitute been used instead (Alder and Pauly 2006). The protein feed conversion ratio can be used to
calculate the net loss in protein as a result of indirect human consumption (Siddiqui et al. 1988).

23
Importantly, all types of protein within a given feed must be accounted for in this calculation. Due to the
biological nature of these production processes, the net effect on global protein supply is negative, even
if the net effect on marine protein supply is ambiguous.
For a sufficiently low conversion ratio, aquaculture production is not even a net producer of fish
(Wijkstrom 2012). Shepard and Jackson claims that in 2009, 20.8 million tons of whole fish were reduced
into fishmeal and fish oil. In 2010, 73% of fishmeal and 71% of fish oil were used as inputs to aquaculture
with most of the remainder used as inputs to chicken and pork farming (Shepard and Jackson 2013). Fish
species with sufficient demand for direct consumption are never reduced. Other stocks are considered
‘industrial grade’ and are not used for direct human consumption, such as sandeels (Wijkstrom 2012). Of
particular interest, with regard to market interactions, are the species that are both consumed directly by
humans and used as inputs to secondary protein production. Such species are anchoveta, sadinellas, and
capelin for example, commonly called forage fish (Wijkstrom 2012, Alder and Pauly 2006). For food grade
reduced species stocks, the end use of the stock is driven by market forces, the dynamics of which are
complex. The production of marine and terrestrial aquaculture does not require fishmeal and fish oil as
inputs, it is used however because these inputs are of high nutritional value for the animals being
produced, the very same reason that fish is a highly nutritional food for humans (Naylor 2000, Torstensen
et al. 2008). Fishmeal and fish oil will be used as inputs to marine and terrestrial protein production
because of the high nutritional value as long as the price is sufficiently low (Olsen and Hasan 2012). There
is direct market competition between terrestrial and aquaculture protein producers for reduced fish
inputs. The relative demand for terrestrial and aquaculture protein supplies will determine how efficiently
reduced marine stocks are converted into protein for human consumption (Siddiqui et al 1988,
Torestensen et al. 2012). Of more interest is to what extent reduced species are demanded for direct
human consumption. Factors describing demand for forage fish for direct human consumption are
discussed above.
Demand for both terrestrial animal protein and marine animal protein are likely to increase over the
coming decades (Lem et al. 2014). As a result, additional fishmeal and fish oil may be demanded as feed
input. Evidence, however, suggests that the fraction of fishmeal and fish oil in aquaculture feeds is rapidly
decreasing (Shepard and Jackson 2013). The relative decoupling of aquaculture production from captured
fisheries supply will likely temper supply side market interactions between terrestrial and marine protein.
Relative decoupling, however, does not imply a net decrease in feed inputs. Production of aquaculture

24
protein continues to expand and demand for fishmeal and fish oil for aquaculture has remained relatively
constant as a function of increased production and feed efficiency (Kobayashi 2015).
Demand for fishmeal and fish oil as a production input for aquaculture will likely increase even given the
aquaculture production efficiency gains. While global fisheries cannot support the increased demand,
prices of fishmeal and fish oil are expected to rise. Where production substitution might occur towards
species with lower fish-based feed requirements, this effect will likely be dampened or unobserved
entirely due to the relatively higher income elasticities of fish feed intensive species as compared to low-
trophic alternatives. Thus it is possible for the increase in demand of feed-intensive species to overshadow
the increase in marginal production costs (Worldbank 2013). Currently, 75% of fishmeal is produced by
the reduction of small fish species (Shepard 2012). Should a larger portion be produced using fish
processing wastes, competition for small pelagics for reduction and for direct human consumption would
be reduced (Worldbank 2013).
Economic Conclusions The information discussed above is used to conduct economic demand forecasting. The typical
methodology involves construction of a set of demand functions using income, own-price, and cross-price
elasticities, and projecting future demand based on said estimates. This approach has been widely used
in the literature, including but not limited to the Fish to 2020 and Fish to 2030 models and Cai’s 2017
demand forecasting exercise (Delgado 2003, Cai 2017, Lem 2014, Kobayashi 2015). Where supply is also
modeled, prices are allowed to be endogenous. While this approach has been shown to provide
moderately accurate forecasting, there are several limitations worth highlighting (Kobayashi 2015). First,
estimates are highly dependent on the population of study and the external validity of applying estimates
generated with one population onto another population is questionable. Similarly, in estimating the
future demand due to an increase in income over time, we must constantly update the income elasticity
point estimate as the sample population becomes richer. Assuming that populations will have the same
income elasticity schedule over mean income level is a potentially problematic assumption. Further
interest in the estimation procedures for elasticities with regards to seafood are directed to Asche 2007.
Consult Fish to 2020, Fish to 2030, and Cai 2017 for additional information on forecasting approaches.
25
Drivers of seafood preferences There is strong scientific and anecdotal information that preferences for seafood have changed
historically. Whether or not the following trends in consumer demand truly break the assumption of
exogenous preferences is beyond the scope of this report, and functionally irrelevant to the task at hand.
In 1920, Danish fishermen discarded blue fin tuna accidentally caught in mackerel nets (Pauly 1995).
Halibut was thought ‘unpalatable’ prior to 1830 (Jacquet and Pauly 2007). One particularly interesting
case involves jellyfish in Asia. Not eaten with much regularity, jellyfish now have a flourishing commercial
market after over-exploitation of their predators led to a massive growth in their stock in Asian waters
(Pitcher and Pauly 1998). Examples such as this have even led notable scientists to suggest that changes
in public taste accompany changing marine ecosystems (Jacquet and Pauly 2007). There is strong evidence
of structural changes in preferences as well. Preferences for seafood strengthened in the early 1980’s in
the United States where per capita consumption of seafood increased by 50% even while the price of
seafood increased significantly relative to the price of other proteins (Edwards, 1992). Evidence for
strengthening preferences for seafood has also been noted in the UK (Burton and Young, 1991). The
relationship between changes in consumer preferences for seafood and the sustainability of stocks has
not been scientifically explored to our knowledge and no intuitive claim about the effects seems justified.
Understanding the drivers of seafood demand helps to elucidate how preferences may change over time.
A study of Norwegian seafood consumption identifies a large set of demographic drivers of seafood
consumption including: location, age, family size, presence of children, and education (Myrland 2000). In
theory these drivers could be included in demand forecasting. However, if the interest is in promoting
seafood consumption, the drivers mentioned above have particularly high momentum unrelated to
seafood consumption. A recent FAO report on the future supply and demand of seafood claims four
consumer drivers in the demand for seafood: safety and health concerns, a desire to promote corporate
sustainable responsibility, concern about production systems and new technologies, and a desire for
sustainable products (Lem 2014). Sections below are dedicated to health and technology, with a larger
focus following on the demand for sustainability is seafood production.
Health Evidence suggests that consumers are becoming far more concerned about the health of their diet (Lem
2014, Rohr 2005). A recent poll indicated that people rank health as the number one determinant of
happiness (Euromonitor International 2012). Seafood consumption has been shown to increase alongside
concern for healthy eating (Trondsen 2004). However, evidence regarding effective mechanisms for

26
delivering health information about food is mixed. While most studies report that consumers are
interested in nutritional information, only some studies suggest nutritional information actually changes
purchasing behavior (Grunert and Wills 2007). A recent study by Oster finds a minimal effect of disease
diagnoses on dietary choice, though certain household characteristics are predictive of a significant
response (Oster 2018). Furthermore, evidence suggests that consumers will not follow dietary
recommendations even when the health and environmental benefits are clearly understood (Leipamaa-
Leskinen 2007). There is evidence, however, that health information can promote certain types of fish
species over others. Providing information about omega 3 fatty acids and methylmercury to consumers
induced a shift away from a less healthy option, canned tuna (Marette 2007).
Technology Aquaculture in its modern form is a relatively new food production system. While the first aquaculture-
like production systems have been dated to the Neolithic age, modern intensification did not begin until
the 1960’s and development in nowhere near complete (European Commission). Due not just to its
novelty, aquaculture has seen significant pushback from consumers, governments, and various industries
(Naylor et al 2000, FAO 2008, Mazur and Curtis 2006). Informed critics often point to the unknown or
unappetizing social, economic, and environmental implications of mass aquaculture, detailed well by
Mazur and Curtis (Mazur and Curtis 2006). Improving the perception of aquaculture may increase demand
and allow for further development of the technology as a means of low cost protein production
(Gempesaw 1995).
27
Demand for sustainable ocean management It is well known that environmental information affects consumers’ stated willingness to pay for goods
and services (Bergstrom, 1990). How well the stated preference for environmental goods translates into
consumer purchases has been questioned extensively (Peattie 2001). In theory, eco-labeling works when
informing consumers changes purchasing behavior such that negative impacts of consumption are
reduced. Firms are incentivized to label products if labels garner a price premium or increase market share
such that firm profits increase (Mason 2013).
Eco-labeling Evidence regarding the implementation of ‘dolphin safe’ labeling in the United States suggests that eco-
labeling has a significant positive effect on tuna consumption, while negative media attention surrounding
dolphin deaths in tuna fisheries is negatively predictive of tuna purchases (Teisl et al. 2002). Eco-labeling
can take many forms, such as ‘dolphin safe’ logos and the ‘Certified Sustainable Seafood’ Marine
Stewardship Council logo. Evidence exists that within a given species, certified fish are preferred to
uncertified fish. For some consumers, a price premium is even warranted (Johnston and Roheim 2006).
Consumer preferences for sustainability are heterogeneous, just as preferences for fish species. One
limiting factor in the efficacy of eco-labeling is the lack of response to labeling in the Asian fish market,
where over 60% of seafood is consumed (Cai 2017). Furthermore, there is evidence that, to date,
certification programs are unsuccessful in developing markets (Stratodakis 2016). A further concern with
eco-labeling surrounds the ability of small-scale artisanal fisheries to become certified. History suggests
that certified fisheries are often large-scale commercial fisheries where multinational corporations with
sufficient resources stand to gain from certification. Profitable gains can be leveraged particularly for
fisheries that already meet sustainable harvesting criteria. Small scale fisheries that cannot afford (to pay
or organize) certification can be left disadvantaged without a clear net benefit to fisheries (Constance
2000). Environmental concern is one of the few predictors of sustainable seafood purchases. Wessels et
al. find a positive effect of belonging to an environmental organization on eco-labeled seafood purchases
(Wessels 2000).
While ‘traffic-light’ sustainability labeling has been shown to reduce consumption of less desirable
species, it does not result in one to one replacement by more sustainable fish products. A study of US
consumers shows a 15.3% reduction in overall seafood purchases (Hallstein 2013). Thus, it is important to
consider how consumers shift away from labeled products and the effect substitution might have on the
intended outcome of labeling. Furthermore, while labeling is functionally aimed at reducing information

28
asymmetry, consumer irrationality is still a concern. While the 15.3% decrease in consumption discussed
above in Hallstein’s analysis was driven entirely by a decrease in consumption of seafood products with a
‘yellow’ label, no statistical difference was seen in consumption of ‘green’ or ‘red’ products (Hallstein
2013). This is counter-intuitive to rational consumer behavior. Modeling of the dynamics of eco-labeling
has become significantly more complex over recent years. While in general, information appears to aid
consumer decision making, the complexity of multiple eco-labels for a single product, along with
uncertainty about the validity of labels’ claims can increase consumer confusion (Schmitt 2011, Youssef
2009).
Price Premiums Price premiums for sustainable fish products are intimately related to environmental marketing and eco-
labeling. Labeling or marketing is often required because the sustainability of most fish is not readily
apparent to consumers faced with many products often of the same species with varying degree of
environmental friendliness. Furthermore, suppliers rely on price premiums or increased market access to
justify environmental marketing. A 2011 study by Roheim and Asche demonstrate that Marine
Stewardship Council labeled frozen pollock is privy to an average 14.2% mark-up in London supermarkets
(Roheim and Asche 2011). Other environmental attributes have been shown to garner price premiums as
well. In UK markets, line-caught cod receives an 18% price premium, and haddock a 10% premium (Sogn-
Grundvag 2013). Importantly, the willingness to pay a price premium for eco-labeled products is
demographic dependent (Brecard 2009).
Traceability Traceability in seafood amounts to knowing the origin and species of fish at the point of sale. The
proposed benefits of seafood traceability are numerous and include food safety (Leal et al. 2015), the
potential for informal governance (Bailey et al. 2016), and sustainability (Jacquet and Pauly 2008). Given
the focus on demand for sustainable ocean management we consider the effects of seafood traceability
on consumer behavior. Increased traceability has been suggested to improve consumers’ ability to make
sustainable choices (Jacquet and Pauly 2008). Traceability has been promoted as an information campaign
that communicates directly with consumers in a way that allows consumers to hold producers
accountable (Bailey et al. 2016). Unfortunately, limited research into the effects of traceability on
consumer behavior has occurred. It has also been shown, however, that DNA-identified seafood is more
sustainable than the species listed on the corresponding label (Stawitz et al. 2016). Thus, the net impact
of mislabeling on species conservation and ocean management is unclear.

29
Limitations Importantly, the mechanisms described above do not result in sustainability by design, but must be
consciously oriented towards sustainable outcomes and validated scientifically. This concern may be
particularly relevant with regard to environmental marketing. Kangun et al. find that over 50% of
environmental advertising is either ‘deceptive’ or ‘misleading’ (Kangun et al 1991). Distinguishing between
‘sustainable’ and ‘unsustainable’ marketing can be difficult. Over the last several decades many fish
species have adopted new common names in an effort to promote demand. Slimeheads and Patagonian
toothfish became orange roughy and Chilean seabass (Pauly 2003); both species are classified ‘avoid’ by
Seafood Watch. If these species were sustainable options, this rebranding would most certainly be
considered environmental advertising.
Another consideration regarding the demand for sustainable ocean management is the efficacy of
consumer facing ‘sustainability’ programs. While eco-labels and certifications have been shown to change
purchasing behavior (at least in certain circumstances), the evidence that these programs actually result
in better managed fisheries is controversial. Products certified by the Marine Stewardship Council have
been studied most extensively, with contradictory reports. Subject to the definition of ‘overfishing’ as any
reduction of stock size below maximum sustainable yield, 31% of MSC certified stocks were identified as
overfished (Froese et al. 2012). However, if ‘overfishing’ is defined as a stock having biomass over 50%
below maximum sustainable yield, then not one of the MSC certified stocks is overfished (Agnew 2013).
The most comprehensive analysis of the MSC labeling was conducted by Gutierrez et al. 2012, which
suggests that MSC certified stocks are generally in better condition than uncertified stocks and improving
more rapidly (Gutierrez et al. 2012). However, due to the relatively recent certification of most MSC
certified stocks, there is no known causal estimate of the effect of certification on stock health.

30
Concluding Remarks Understanding the current and future demand for seafood is a complex task. Food provides many types
of value to consumers, much of which arguably has nothing to do with the food’s nutritional value.
Economics seeks to understand demand by focusing on income and price elasticities, often under the
assumption that preferences are fixed. While this is a simplification, it allows for significant traction with
regards to predicting the future demand of seafood based on income and supply projections. A
complementary approach, often found in the marketing literature, is to determine the drivers of seafood
consumption. Notably, trends in food safety, health, and eco-friendliness will likely contribute to
increased seafood demand over time. It is true, however, that preferences for seafood have changed over
time. The malleability of preferences presents both challenges for demand forecasting and potential
avenues to promote sustainability by nudging consumers towards sustainable choices.
The review presented here provides a detailed overview of demand for seafood broadly. The literature is
expansive and with topics covered by several disciplines using various research methods. Every attempt
has been made to be comprehensive, though the review is certainly not exhaustive. Questions regarding
methodology or particular research described should follow cited literature. Any additional comments or
questions can be directed to the corresponding author, Jason Maier.

31
Work Cited Agnew, D. J., et al. "Rebuttal to Froese and Proelss “Evaluation and legal assessment of certified
seafood”." Marine Policy 38 (2013): 551-553.
Agriculture Organization of the United Nations. Fisheries Department. The State of World Fisheries and
Aquaculture, 2000. Vol. 3. Food & Agriculture Org., 2000.
Alder, Jackie, and Daniel Pauly. "Human consumption of forage fish." Fisheries Centre Research Reports
14.3 (2006): 21-32.
Alder, Jacqueline, and Ussif Rashid Sumaila. "Western Africa: a fish basket of Europe past and present."
The Journal of Environment & Development 13.2 (2004): 156-178.
Alder, Jacqueline, et al. "Forage fish: from ecosystems to markets." Annual review of environment and
resources 33 (2008): 153-166.
Anderson, James L. "Market interactions between aquaculture and the common-property commercial
fishery." Marine Resource Economics 2.1 (1985): 1-24.
Andreyeva, Tatiana, Michael W. Long, and Kelly D. Brownell. "The impact of food prices on consumption:
a systematic review of research on the price elasticity of demand for food." American journal of public
health 100.2 (2010): 216-222.
Asche, Frank, Trond Bjørndal, and Daniel V. Gordon. "Studies in the demand structure for fish and
seafood products." Handbook of operations research in natural resources. Springer, Boston, MA, 2007.
295-314.
Asche, Frank, and Sigbjorn Tveteras. "Market interactions in aquaculture." 95th Seminar, December 9-
10, 2005, Civitavecchia, Italy. No. 56003. European Association of Agricultural Economists, 2005.
Bell, Frederick W. "The Pope and the price of fish." The American Economic Review 58.5 (1968): 1346-
1350.
Bergstrom, John C., John R. Stoll, and Alan Randall. "The impact of information on environmental
commodity valuation decisions." American Journal of Agricultural Economics 72.3 (1990): 614-621.
Bjorndal, Trond, and Jon Conrad. The dynamics of an open access fishery. No. 641-2016-43670. 1985.

32
Botsford, Louis W., Juan Carlos Castilla, and Charles H. Peterson. "The management of fisheries and
marine ecosystems." Science 277.5325 (1997): 509-515.
Brécard, Dorothée, et al. "Determinants of demand for green products: An application to eco-label
demand for fish in Europe." Ecological economics 69.1 (2009): 115-125.
Burton, Michael P., and Trevor Young. "Non‐parametric tests for changes in consumer preferences for
meat in Great Britain." Journal of Agricultural Economics 42.2 (1991): 138-145.
Cai, Junning, and P. Leung. Short-term projection of global fish demand and supply gaps. Fao, 2017.
Constance, Douglas H., and Alessandro Bonanno. "Regulating the global fisheries: The world wildlife
fund, unilever, and the marine stewardship council." Agriculture and Human Values 17.2 (2000): 125-
139.
Cornelsen, Laura, et al. "What happens to patterns of food consumption when food prices change?
Evidence from a systematic review and meta‐analysis of food price elasticities globally." Health
economics 24.12 (2015): 1548-1559.
Cuaresma, Jesús Crespo. "Income projections for climate change research: A framework based on
human capital dynamics." Global Environmental Change 42 (2017): 226-236.
Cushing, David Henry, and D. H. Cushing. The provident sea. Cambridge University Press, 1988.
Deaton, Angus, and John Muellbauer. Economics and consumer behavior. Cambridge university press,
1980.
Delgado, Christopher L. Fish to 2020: Supply and demand in changing global markets. Vol. 62. WorldFish,
2003.
Desa, Un. "World population prospects: The 2017 revision, key findings and advance tables." Working
PaperNo (2017).
Dey, Madan Mohan, et al. "Demand for fish in Asia: a cross‐country analysis." Australian Journal of
Agricultural and Resource Economics 52.3 (2008): 321-338.
Duarte, Carlos M., et al. "Will the oceans help feed humanity?." BioScience 59.11 (2009): 967-976.
Eden, Sally, Christopher Bear, and Gordon Walker. "Understanding and (dis) trusting food assurance
schemes: consumer confidence and the ‘knowledge fix’." Journal of rural Studies 24.1 (2008): 1-14.

33
Edwards, Steven F. "Evidence of structural change in preferences for seafood." Marine Resource
Economics 7.3 (1992): 141-151.
Euromonitor International. 2012. Top 10 consumer trends of 2012. https://blog.euromonitor.com/top-
10-consumer-trends-of-2012/. Accesed Feb. 2 2019.
Fofana, Abdulai, and Patty Clayton. Demand interaction between farmed Salmon and wild caught fish in
the United Kingdom. No. 138-2016-1994. 2003.
Food and Agriculture Organization of the United Nations. Fisheries Department. The state of world
fisheries and aquaculture. Food and Agriculture Organization of the United Nations, 1996.
Foresight. The Future of Food and Farming (2011) Final Project Report. The Government Office for
Science, London.
Froese, Rainer, and Alexander Proelss. "Evaluation and legal assessment of certified seafood." Marine
Policy 36.6 (2012): 1284-1289.
Gempesaw, Conrado M., et al. "Consumer perceptions of aquaculture products." American Journal of
Agricultural Economics 77.5 (1995): 1306-1312.
Gentry, Rebecca R., et al. "Offshore aquaculture: Spatial planning principles for sustainable
development." Ecology and evolution 7.2 (2017): 733-743.
Gleick, Peter H. "Basic water requirements for human activities: meeting basic needs." Water
international 21.2 (1996): 83-92.
Golden, Christopher D., et al. "Nutrition: Fall in fish catch threatens human health." Nature News
534.7607 (2016): 317
Green, Rosemary, et al. "The effect of rising food prices on food consumption: systematic review with
meta-regression." Bmj 346 (2013): f3703.
Grunert, Klaus G., and Josephine M. Wills. "A review of European research on consumer response to
nutrition information on food labels." Journal of public health 15.5 (2007): 385-399.
Gutiérrez, Nicolás L., et al. "Eco-label conveys reliable information on fish stock health to seafood
consumers." PLoS One 7.8 (2012): e43765.

34
Hallstein, Eric, and Sofia B. Villas-Boas. "Can household consumers save the wild fish? Lessons from a
sustainable seafood advisory." Journal of Environmental Economics and Management 66.1 (2013): 52-
71.
Hansen, Lars P., and Malcolm L. Windsor. "Interactions between Aquaculture and Wild Stocks of Atlantic
Salmon and other Diadromous Fish Species: Science and Management, Challenges and Solutions: An
introduction by the Conveners." ICES Journal of Marine Science 63.7 (2006): 1159-1161.
Homans, Frances R., and James E. Wilen. "A model of regulated open access resource use." Journal of
Environmental Economics and Management 32.1 (1997): 1-21.
Huang, Kuo S. US demand for food: A complete system of price and income effects. No. 1714. US Dept.
of Agriculture, Economic Research Service, 1985.
Jacquet, Jennifer L., and Daniel Pauly. "The rise of seafood awareness campaigns in an era of collapsing
fisheries." Marine Policy 31.3 (2007): 308-313.
Jaffry, Shabbar, et al. "Price interactions between salmon and wild caught fish species on the Spanish
market." Aquaculture Economics & Management 4.3-4 (2000): 157-167.
Johnston, Robert J., and Cathy A. Roheim. "A battle of taste and environmental convictions for
ecolabeled seafood: A contingent ranking experiment." Journal of Agricultural and Resource Economics
(2006): 283-300.
Kangun, Norman, Les Carlson, and Stephen J. Grove. "Environmental advertising claims: a preliminary
investigation." Journal of public policy & marketing 10.2 (1991): 47-58.
Kobayashi, Mimako, et al. "Fish to 2030: the role and opportunity for aquaculture." Aquaculture
economics & management 19.3 (2015): 282-300.
Leal, Miguel Costa, et al. "Seafood traceability: current needs, available tools, and biotechnological
challenges for origin certification." Trends in biotechnology 33.6 (2015): 331-336.
Leipämaa‐Leskinen, Hanna. "Contradi'ctions in food consumption." International Journal of Consumer
Studies 31.6 (2007): 597-602.
Lem, Audun, Trond Bjørndal, and Alena Lappo. Economic analysis of supply and demand for food up to
2030. Special focus on fish and fishery products. FAO, 2014.
35
Leonard, William R., and Marcia L. Robertson. "Nutritional requirements and human evolution: a
bioenergetics model." American Journal of Human Biology 4.2 (1992): 179-195.
Longo, Stefano B., et al. "Aquaculture and the displacement of fisheries captures." Conservation Biology
(2019).
Marette, Stéphan, Jutta Roosen, and Sandrine Blanchemanche. "Health information and substitution
between fish: lessons from laboratory and field experiments." Food Policy 33.3 (2008): 197-208.
Mason, Charles F. "The economics of eco-labeling: Theory and empirical implications." (2013): 1-32.
Mazur, Nicole A., and Allan L. Curtis. "Risk perceptions, aquaculture, and issues of trust: lessons from
Australia." Society and Natural Resources 19.9 (2006): 791-808.
McClanahan, Tim, and Juan Carlos Castilla, eds. Fisheries management: progress toward sustainability.
John Wiley & Sons, 2008.
Muhammad, Andrew, et al. "International evidence on food consumption patterns: an update using
2005 international comparison program data." (2011).
Naylor, Rosamond L., et al. "Effect of aquaculture on world fish supplies." Nature 405.6790 (2000): 1017.
OECD-FAO. 2011. OECD-FAO agricultural Outlook 2011-2020. OECD Publishing and FAO.
Olsen, Ragnar L., and Mohammad R. Hasan. "A limited supply of fishmeal: Impact on future increases in
global aquaculture production." Trends in Food Science & Technology 27.2 (2012): 120-128.
Owen, Oliver E., et al. "A reappraisal of caloric requirements in healthy women." The American journal
of clinical nutrition44.1 (1986): 1-19.
Pauly, Daniel, et al. "The future for fisheries." Science302.5649 (2003): 1359-1361.
Pauly, Daniel, et al. "Towards sustainability in world fisheries." Nature 418.6898 (2002): 689.
Peattie, Ken. "Golden goose or wild goose? The hunt for the green consumer." Business Strategy and the
Environment10.4 (2001): 187-199.
Pellet, P. L. "Protein requirements in humans." The American journal of clinical nutrition 51.5 (1990):
723-737.

36
Phillips, Bruce, Trevor Ward, and Chet Chaffee, eds. Eco-labelling in fisheries: what is it all about?. John
Wiley & Sons, 2008.
Pitcher, Tony J., and Daniel Pauly. "Rebuilding ecosystems, not sustainability, as the proper goal of
fishery management." Reinventing fisheries management. Springer, Dordrecht, 1998. 311-329.
Risius, Antje, Meike Janssen, and Ulrich Hamm. "Consumer preferences for sustainable aquaculture
products: Evidence from in-depth interviews, think aloud protocols and choice experiments." Appetite
113 (2017): 246-254.
Roheim, Cathy A., Frank Asche, and Julie Insignares Santos. "The elusive price premium for ecolabelled
products: evidence from seafood in the UK market." Journal of Agricultural Economics 62.3 (2011): 655-
668.
Rosegrant, Mark W., et al. 2020 global food outlook: trends, alternatives, and choices. Vol. 11. Intl Food
Policy Res Inst, 2001.
Röhr, A., et al. "Food quality and safety––consumer perception and public health concern." Food control
16.8 (2005): 649-655.\
Schmitt, Catherine V. "Adrift in a sea of information about sustainable seafood: The Maine consumer
perspective." Maine Policy Review 20.1 (2011): 96-104.
Shepherd, C. J., and A. J. Jackson. "Global fishmeal and fish‐oil supply: inputs, outputs and marketsa."
Journal of fish biology 83.4 (2013): 1046-1066.
Shepherd, J. "Aquaculture: are the criticisms justified? Feeding fish to fish." World Agriculture 3.2
(2012): 11-18.
Siddiqui, Abdul Q., Mohammad S. Howlader, and Ahmad A. Adam. "Effects of dietary protein levels on
growth, feed conversion and protein utilization in fry and young Nile tilapia, Oreochromis niloticus."
Aquaculture 70.1-2 (1988): 63-73.
Singh, Kehar, Madan M. Dey, and Prasanna Surathkal. "Analysis of a demand system for unbreaded
frozen seafood in the United States using store-level scanner data." Marine Resource Economics 27.4
(2012): 371-387.
37
Sogn-Grundvåg, Geir, Thomas A. Larsen, and James A. Young. "The value of line-caught and other
attributes: An exploration of price premiums for chilled fish in UK supermarkets." Marine Policy 38
(2013): 41-44.
Stratoudakis, Yorgos, et al. "Fisheries certification in the developing world: Locks and keys or square
pegs in round holes?." Fisheries Research 182 (2016): 39-49.
Tacon, Albert GJ, and Marc Metian. "Global overview on the use of fish meal and fish oil in industrially
compounded aquafeeds: Trends and future prospects." Aquaculture 285.1-4 (2008): 146-158.
Teisl, Mario F., Brian Roe, and Robert L. Hicks. "Can eco-labels tune a market? Evidence from dolphin-
safe labeling." Journal of Environmental Economics and Management 43.3 (2002): 339-359.
Timmer, C. Peter. "Is There" Curvature" in the Slutsky Matrix?." The Review of Economics and Statistics
(1981): 395-402.
Torstensen, B. E., et al. "Novel production of Atlantic salmon (Salmo salar) protein based on combined
replacement of fish meal and fish oil with plant meal and vegetable oil blends." Aquaculture 285.1-4
(2008): 193-200.
Trondsen, T., et al. "Health and seafood consumption patterns among women aged45–69 years. A
Norwegian seafood consumption study." Food quality and preference 15.2 (2004): 117-128.
Tyedmers, Peter H., Reg Watson, and Daniel Pauly. "Fueling global fishing fleets." AMBIO: a Journal of
the Human Environment 34.8 (2005): 635-638.
UN Food and Agriculture Organization. "The State of the World’s Fisheries and Aquaculture." Rome:
Food (2008).
Wessells, Cathy R., Robert J. Johnston, and Holger Donath. "Assessing consumer preferences for
ecolabeled seafood: the influence of species, certifier, and household attributes." American Journal of
Agricultural Economics 81.5 (1999): 1084-1089.
Wessells, Cathy Rohein, and James E. Wilen. "Seasonal patterns and regional preferences in Japanese
household demand for seafood." Canadian Journal of Agricultural Economics/Revue canadienne
d'agroeconomie 42.1 (1994): 87-103.
Wijkstrom, U. N. (2012). Is feeding fish with fish a viable practice? In Farming the Waters for People and
Food, Proceedings of the Global Conference on Aquaculture 2010, Phuket, Thailand (Subasinghe, R. P.,

38
Arthur, J. R., Bartley, D. M., De Silva, S. S., Halwart, M., Hishamunda, N., Mohan, C. V. & Sorgeloos, P.,
eds), pp. 33 – 35. Rome: FAO and Bangkok: NACA
World Bank. "Fish to 2030: Prospects for fisheries and aquaculture." In Agriculture and Environmental
Services Discussion Paper 3 (2013).
Youssef, Adel Ben, and Chema Abderrazak. "Multiplicity of eco-labels, competition, and the
environment." Journal of agricultural & food industrial organization 7.2 (2009).
“A Short History: Aquaculture.” The European Commission,
ec.europa.eu/fisheries/cfp/aquaculture/aquaculture_methods/history_en.