GLOBAL TRENDS IN SEAFOOD DEMAND, SUPPLY, TRADE AND …
54
GLOBAL TRENDS IN SEAFOOD DEMAND, SUPPLY, TRADE AND PRICES by Stefania Vannuccini Fishery Statistician (Commodities) FAO Fisheries and Aquaculture Statistics and Information Service Woods Hole, 24-25 May 2011
Transcript of GLOBAL TRENDS IN SEAFOOD DEMAND, SUPPLY, TRADE AND …
GLOBAL TRENDS IN SEAFOOD DEMAND, SUPPLY, TRADE AND PRICES
by Stefania VannucciniFishery Statistician (Commodities)
FAO Fisheries and Aquaculture Statistics and Information Service
Woods Hole, 24-25 May 2011
Outline
• Overview• Production• Utilization• Consumption• Trade• Prices• Outlook

Overview: last two decade
• Increase in global aquaculture production
• Rising demand for fish and fishery products
• Growth in world trade of fish and fishery products
• Global call for responsible management

World fishery production
0
30
60
90
120
150
1950 1960 1970 1980 1990 2000 2009
Aquaculture
Capture
million tonnes

World fishery productionmillion tonnes
0
30
60
90
120
150
1950 1960 1970 1980 1990 2000 2009
Aquaculture(marine waters)
Aquaculture(inland waters)
Capture (inlandwaters)
Capture (marinewaters)

World fishery productionmillion tonnes
2009 2010 e 2011f 2011/2010
Production 144.6 145.1 149.0 2.7%
Capture 88.9 87.0 88.5 1.8%
Aquaculture 55.7 58.1 60.4 4.0%
e: estimation; f: forecast
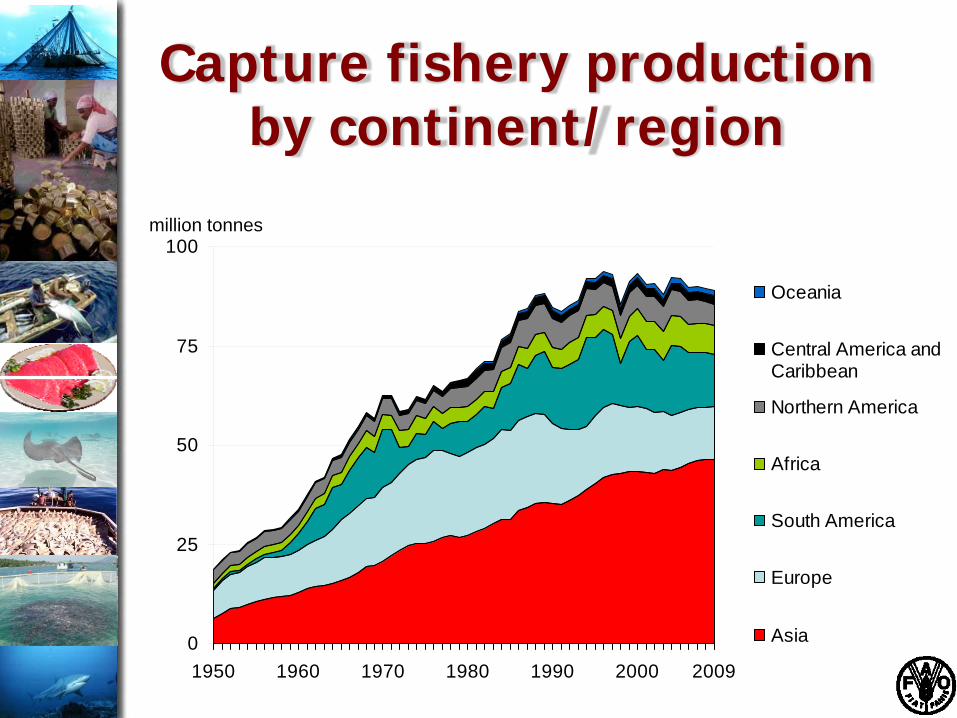
Capture fishery productionby continent/region
0
25
50
75
100
1950 1960 1970 1980 1990 2000 2009
Oceania
Central America andCaribbean
Northern America
Africa
South America
Europe
Asia
million tonnes

2009 Capture: top producers
China17%
Peru8%
USA5%
Russian Federation
Chile4%
Others47%
Japan4%
India5%
Indonesia6%

Capture fishery productionby ISSCAAP division
0
25
50
75
100
1950 1960 1970 1980 1990 2000 2009
Miscellaneousaquatic animals
Diadromous fishes
Crustaceans
Molluscs
Freshwater fishes
Marine fishes
million tonnes

2009 Capture by species groups
Tunas, bonitos, billfishes
7%
Salmons, trouts, smelts
1%Other diadromous
1%
Other pelagics35%
Other marine fishes32%
Shrimps, prawns4%
Miscellaneous aquatic animals
0.5%Other molluscs1%
Bivalves2%
Squids, cuttlefishes, octopuses
4%Other crustaceans3%
Freshwater fishes10%
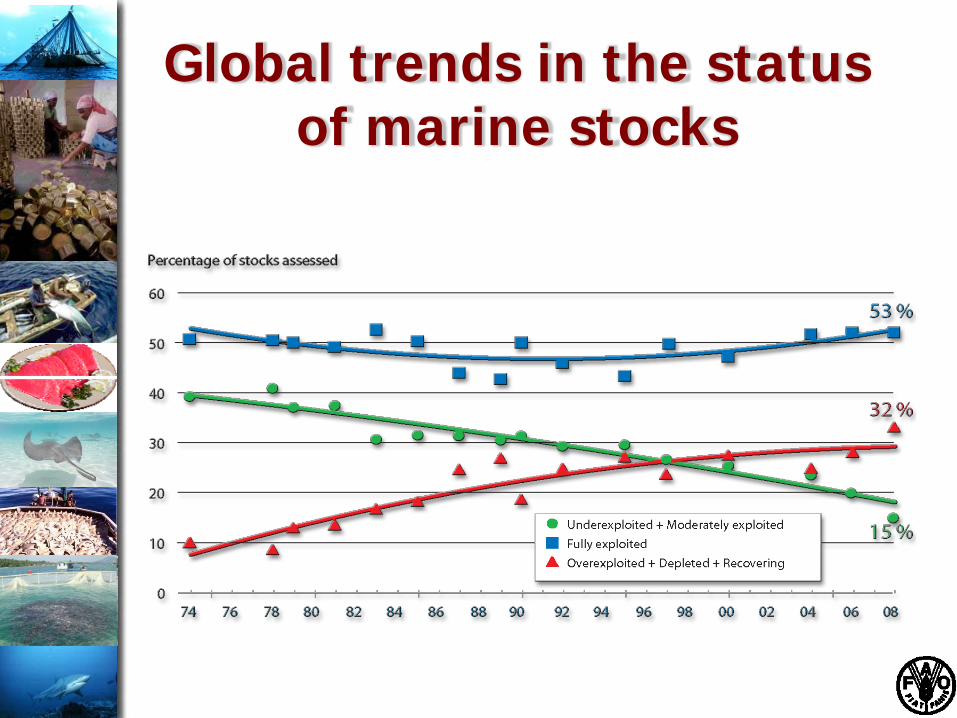
Global trends in the status of marine stocks

Aquaculture productionby continent/region
0
20
40
60
1950 1960 1970 1980 1990 2000 2009
Oceania
Central Americaand Caribbean
Northern America
Africa
South America
Europe
Asia
million tonnes

2009 Aquaculture: top producers
China62%
Viet Nam5% India
7%
Thailand3%
Indonesia3%
Bangladesh2%
Norway2%
Chile1%
Others15%

Aquaculture productionby ISSCAAP division
million tonnes
0
20
40
60
1950 1960 1970 1980 1990 2000 2009
Miscellaneousaquatic animals
Marine fishes
Diadromousfishes
Crustaceans
Molluscs
Freshwater fishes

2009 Aquaculture by species groups
Freshwater fishes56%
Bivalves22%
Other molluscs3%
Other crustaceans3%
Miscellaneous aquatic animals
1%
Tunas, bonitos, billfishes
0.0%
Other pelagics0.4%
Salmons, trouts, smelts
4%
Other marine fishes3%
Shrimps, prawns6%
Squids, cuttlefishes, octopuses
0.0%
Other diadromous2%

China
0
25
50
75
100
1950 1970 1990 2009
World excluding China China
0
20
40
60
1950 1970 1990 2009
Capture Aquaculture

Annual growth rate
-2
0
2
4
6
8
10
12
1960-1969 1970-1979 1980-1989 1990-1999 2000-2009
Capture
Aquaculture
%

Annual growth rate Aquaculture vs agriculture
0 2 4 6 8 10 12
1970-1979
1980-1989
1990-1999
2000-2009 Meat
Milk
Eggs
Cereals
Fruit
Vegetables
Aquaculture
%

Annual growth rate Aquaculture vs meat
0
2
4
6
8
10
12
1970-1979 1980-1989 1990-1999 2000-2009
Aquaculture
Poultry Meat
Meat, Total
Sheep and Goat Meat
Beef and Buffalo Meat
%

Utilization of fish productionand per capita fish supply
0
25
50
75
100
125
150
1950 1960 1970 1980 1990 2000 20100.0
3.0
6.0
9.0
12.0
15.0
18.0Fish for human consumption
Non-food uses
Per capita food fish supply
Fish production
(million tonnes)Per capita fish supply (kg)

Share of utilization of fish production
0%
20%
40%
60%
80%
100%
1950 1960 1970 1980 1990 2000 2010
Fish for humanconsumption
Non-food uses

Utilization of fish productionbreakdown by quantity
0 10 20 30 40 50 60
Marketing fresh
Freezing
Canning
Curing
Non-food uses
Million tonnes

Fish as food
• Important role in food security• Source of proteins, minerals,
micronutrients and essential fatty acids
• 118 million tonnes• 17.2 kg/capita• 47% from aquaculture

Per capita fish supply: contribution of capture and aquaculture
0%
25%
50%
75%
100%
1950 1960 1970 1980 1990 2000 2010
Capture
Aquaculture

Per capita fish supply

Per capita fish supply
9.1
16.3
10.3
24.3
28.7
25.5
9.6
24
22.1
18.8
8.4
17.2
0 5 10 15 20 25 30
LIFDCs
Other developing
Least Developed
Developed
Industrialized
Oceania
Latin America
North America
Europe
Asia
Africa
World
kg/capita
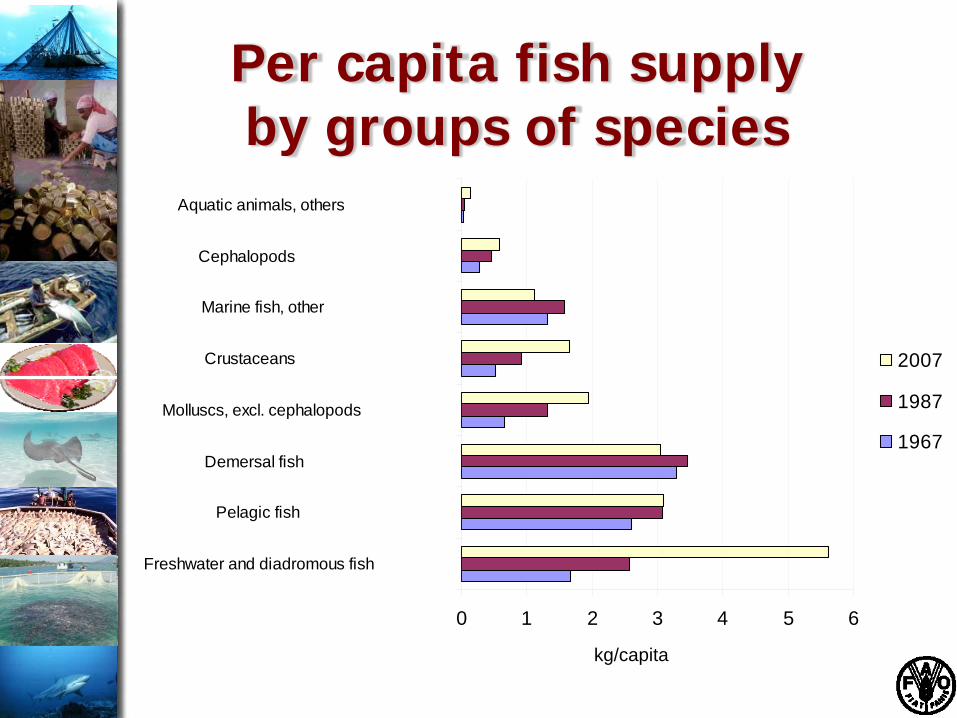
Per capita fish supplyby groups of species
0 1 2 3 4 5 6
Freshwater and diadromous fish
Pelagic fish
Demersal fish
Molluscs, excl. cephalopods
Crustaceans
Marine fish, other
Cephalopods
Aquatic animals, others
2007
1987
1967
kg/capita

Nutritional standards• Increase of the per capita food
consumption• Improvement of nutritional standards
since 1970• Change in global dietary patterns• Increase in the average global calorie
supply• Growth of the quantity of proteins, in
particular for emerging economies

Food consumption• Rising living standards• Population growth• Rapid urbanization• Increased trade• Transformation in food distribution,
transportation, marketing• Improvement in food science, technology• Value-added products• More developed economies less reactive to
income growth compared to low-income countries

Fish consumption in industrialized countries
• Diversification in the diets• Health and diet conscious• Value addition• Ready-to-cook, ready-to-eat• More fish in fresh form

Protein supply
g/capita
0
20
40
60
80
100
120
World Africa NorthAmerica
LatinAmericaand the
Caribbean
Asia Europe Oceania
Total proteins Vegetable proteins Animal proteinsMeat and offals Milk / dairy products FishEggs

Fish contribution to animal protein supply (2005-2007)

Share of production traded
0
30
60
90
120
150
1976 1981 1986 1991 1996 2001 2006 2009
Production
Exports
million tonnes

Trade by groups of species(value)
Shrimps, prawns15%
Salmons, trouts, smelts12%
Cods, hakes, haddocks
10%
Tuna9%Other pelagics
7%
Other finfish27%
Oils2%
Meals3%
Squids, cuttlefishes, octopuses
4%
Other molluscs aquatic invert
5%
Other crustaceans
6%
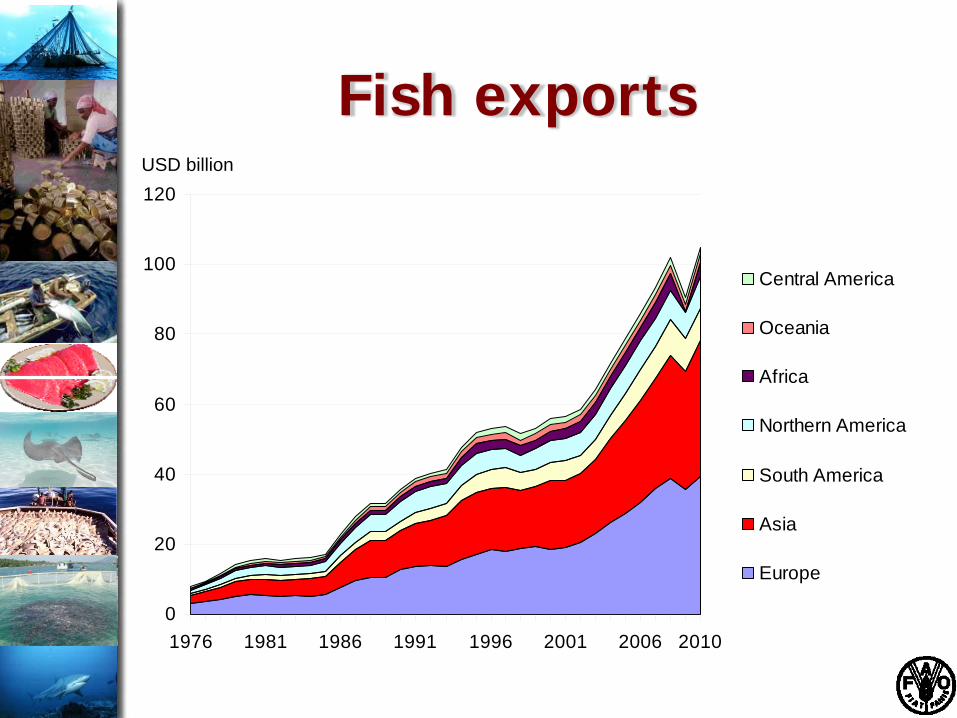
Fish exports
0
20
40
60
80
100
120
1976 1981 1986 1991 1996 2001 2006 2010
Central America
Oceania
Africa
Northern America
South America
Asia
Europe
USD billion

2009: Top exporters (value)
China 12% Norway
8%
Thailand 7%
USA 5%
Viet Nam 4%
Canada 4%
Chile 3%
Indonesia 3%
Peru 2%
Other52%

Net exports developing countries
-5
0
5
10
15
20
25
Fish Coffee Rubber Bananas Cocoa Meat Tea Sugar Tobacco Rice
1987 1997 2007
USD billion

Fish imports
0
20
40
60
80
100
120
1976 1981 1986 1991 1996 2001 2006 2010
CentralAmerica
Oceania
SouthAmerica
Africa
NorthernAmerica
Asia
Europe
USD billion

2009: Top importers (value)
UK 3.3%
China 5.7%
France5.4%
Russian Fed 2.1%
USA 14.1%
Japan 13.6%
Korea Rep 2.9%China,H.Kong
2.4%
Canada 2.1%
Other48.4%

Trends in trade• 7% decline in 2009, followed by
growth of 11% in 2010• 2010 imports estimated ad USD 110
billion and exports at USD 105 billion• Positive 2011• Wide range of product types and
participants• Increased fishery trade within regions• Growing imports among/from
developing countries

Africa
Imports in USD million

Asia
Imports in USD million

Oceania
Imports in USD million

Europe
Imports in USD million

South America
Imports in USD million

North and Central America
Imports in USD million
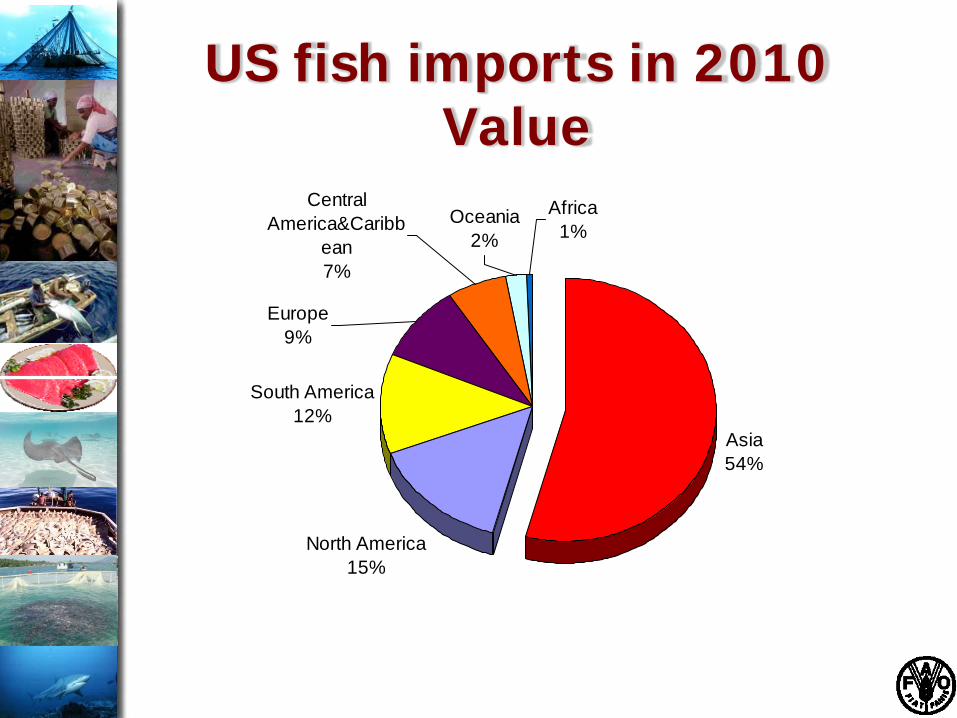
US fish imports in 2010Value
Asia54%
North America15%
South America12%
Oceania2%
Europe9%
Central America&Caribb
ean7%
Africa1%

US fish imports in 2010 Value
China14%
Thailand13%
Others34%
Canada13%
Viet Nam5%
Indonesia6%
Chile4%
Ecuador4%
Norway3%
Mexico2%
India2%

US fish exports in 2010 Value
Asia45%
Europe26%
Oceania1%
South America1%
North America24%
Africa0.4%
Central America&Carib
bean3%
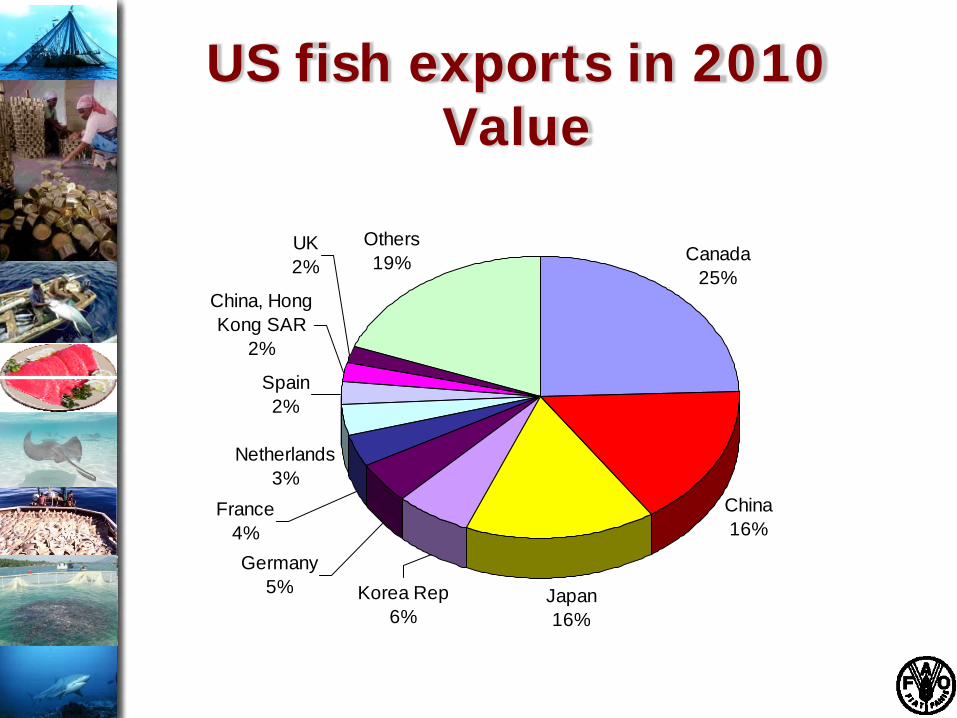
US fish exports in 2010 Value
Canada25%
China16%
Japan16%
Netherlands3%
Spain2%
China, Hong Kong SAR
2%
UK2%
Others19%
Korea Rep6%
Germany5%
France4%

Fish Price Index (2005=100)
Outlook supply• Major increases will depend on aquaculture. • Factors to influence future growth of
aquaculture: – costs/availability of feed for selected species;
access and availability of areas/water– environmental impacts– availability of technology and finance– effects on biodiversity– climate changes– governance– food safety and traceability issues
• Capture: importance of implement more cautious and effective fisheries management

Outlook demand• Retail concentration in developed and
developing which will affect demand• Product development, technological
innovation• Continuous increase of trade• Increased imports from developing
countries• Outsourcing of processing will continue• Slow growth in per capita consumption