Seaborn trade: cargo volumes and freight rates in the region
18
1 Seaborne trade cargo volumes Seaborne trade cargo volumes and freight rates in the region and freight rates in the region Nikos Marmatsouris, FICS Nikos Marmatsouris, FICS Senior Marketing Manager Senior Marketing Manager GAC Shipping S.A. GAC Shipping S.A.
Transcript of Seaborn trade: cargo volumes and freight rates in the region
1
Seaborne trade cargo volumes Seaborne trade cargo volumes and freight rates in the regionand freight rates in the region
Nikos Marmatsouris, FICSNikos Marmatsouris, FICSSenior Marketing ManagerSenior Marketing Manager
GAC Shipping S.A.GAC Shipping S.A.
Black Sea Ports Black Sea Ports
2
Black Sea PortsBlack Sea Ports
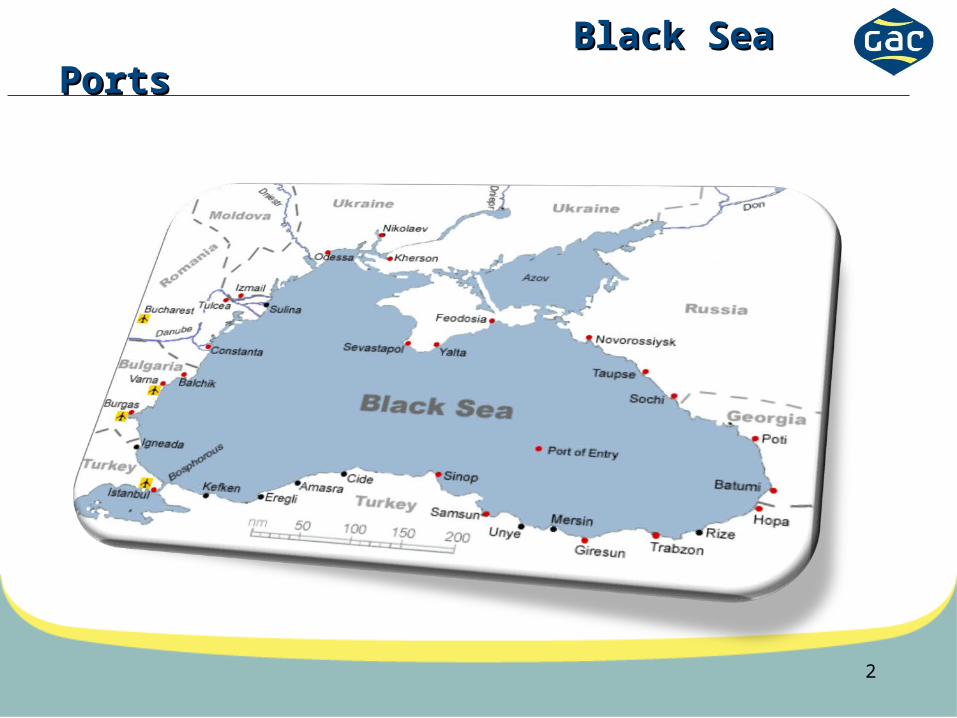
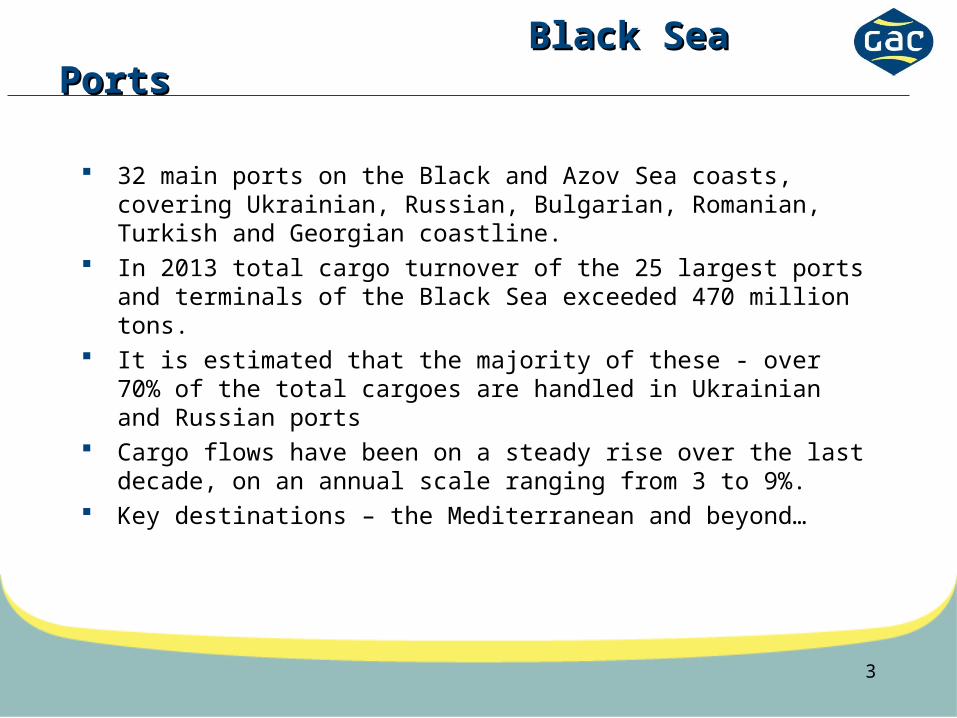
32 main ports on the Black and Azov Sea coasts, covering Ukrainian, Russian, Bulgarian, Romanian, Turkish and Georgian coastline.
In 2013 total cargo turnover of the 25 largest ports and terminals of the Black Sea exceeded 470 million tons.
It is estimated that the majority of these - over 70% of the total cargoes are handled in Ukrainian and Russian ports
Cargo flows have been on a steady rise over the last decade, on an annual scale ranging from 3 to 9%.
Key destinations – the Mediterranean and beyond…
3
Main Freight DriversMain Freight Drivers
Changes in Demand
Changes in Supply
4
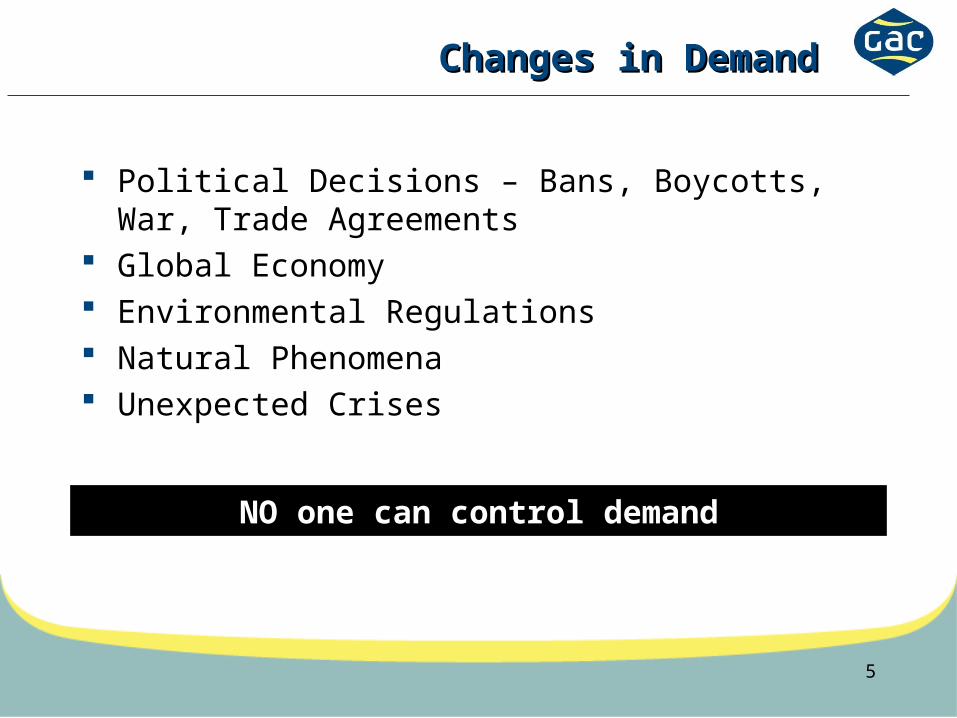
Changes in DemandChanges in Demand
Political Decisions – Bans, Boycotts, War, Trade Agreements
Global Economy Environmental Regulations Natural Phenomena Unexpected Crises
5
NO one can control demand
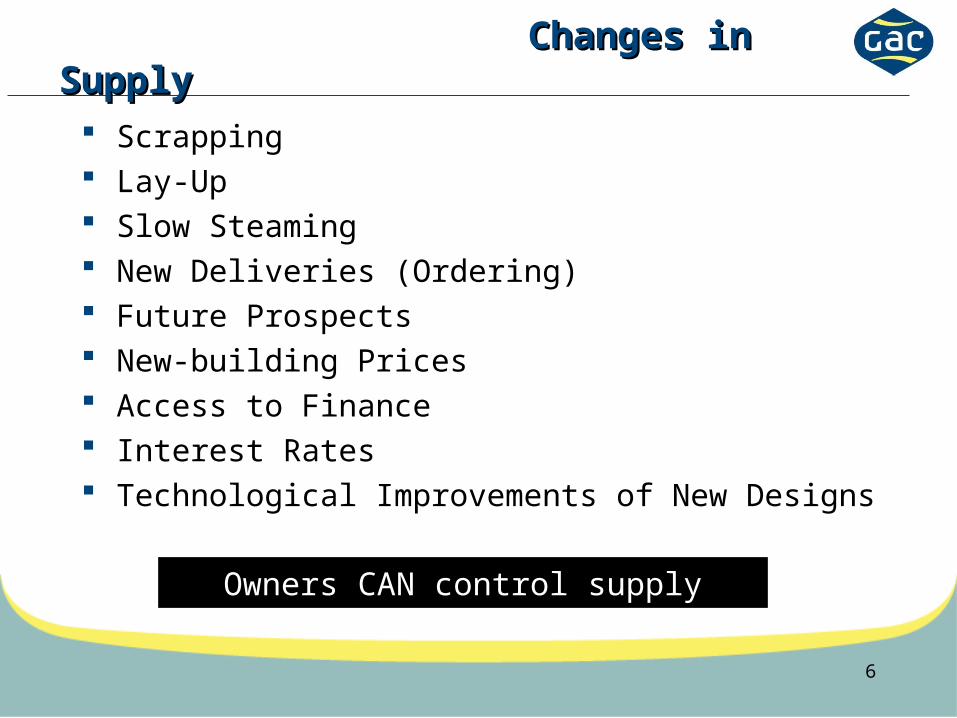
Changes in SupplyChanges in Supply
Scrapping Lay-Up Slow Steaming New Deliveries (Ordering) Future Prospects New-building Prices Access to Finance Interest Rates Technological Improvements of New Designs
6
Owners CAN control supply
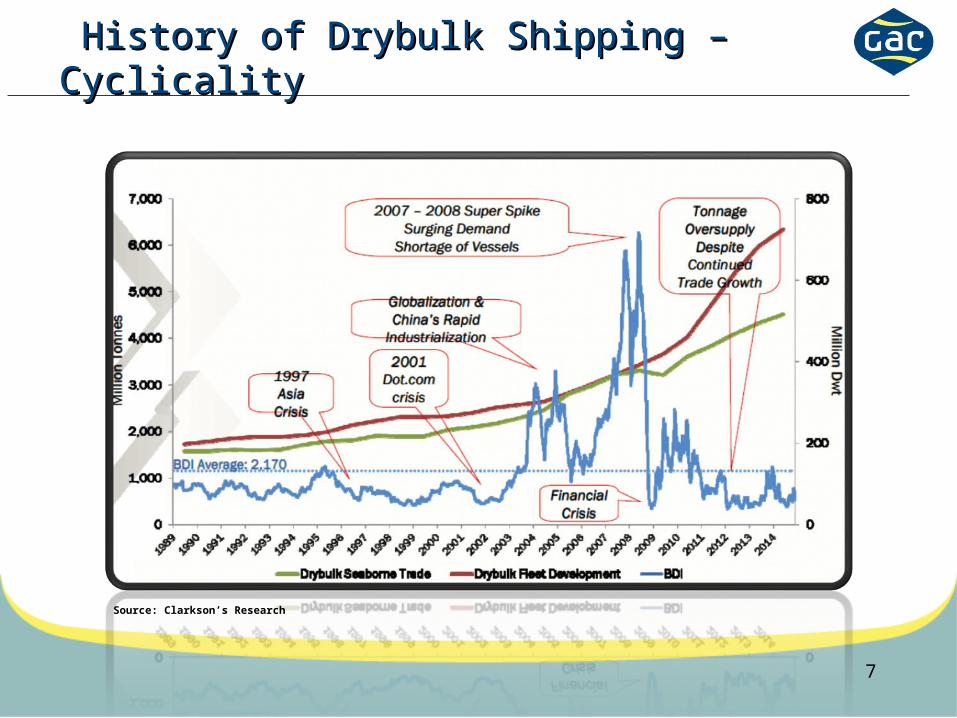
History of Drybulk Shipping – CyclicalityHistory of Drybulk Shipping – Cyclicality
7
Source: Clarkson’s Research
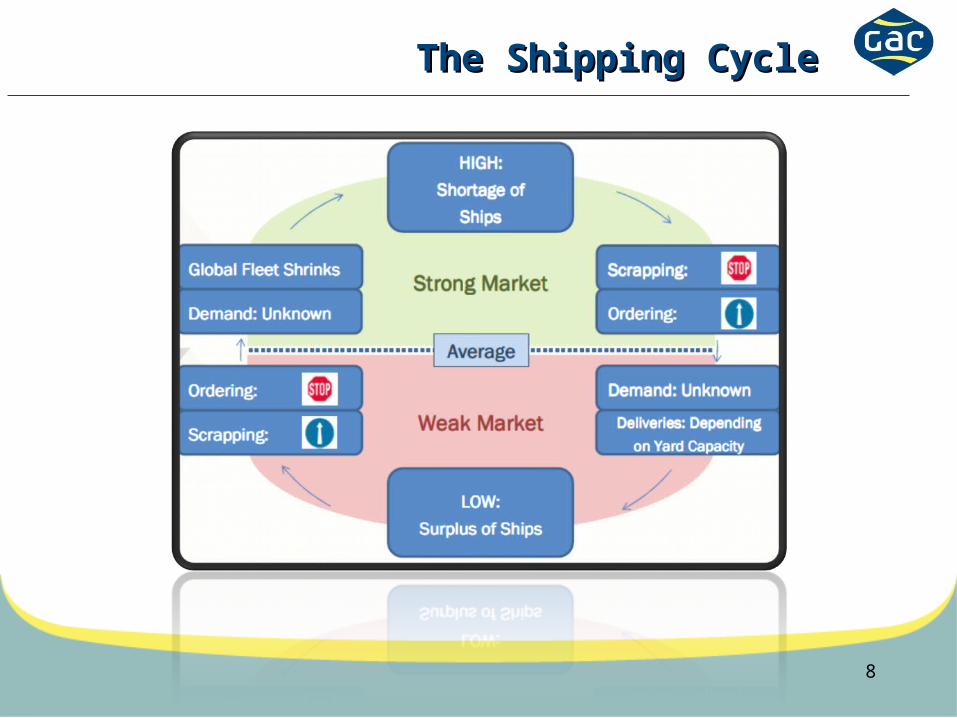
The Shipping CycleThe Shipping Cycle
8
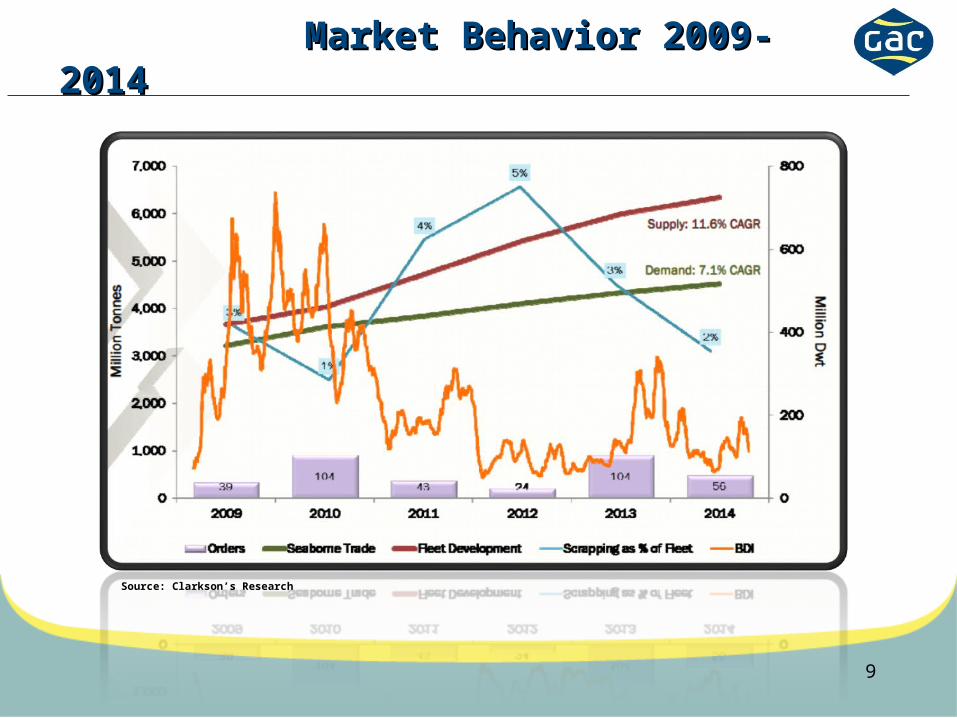
Market Behavior 2009-2014Market Behavior 2009-2014
9
Source: Clarkson’s Research
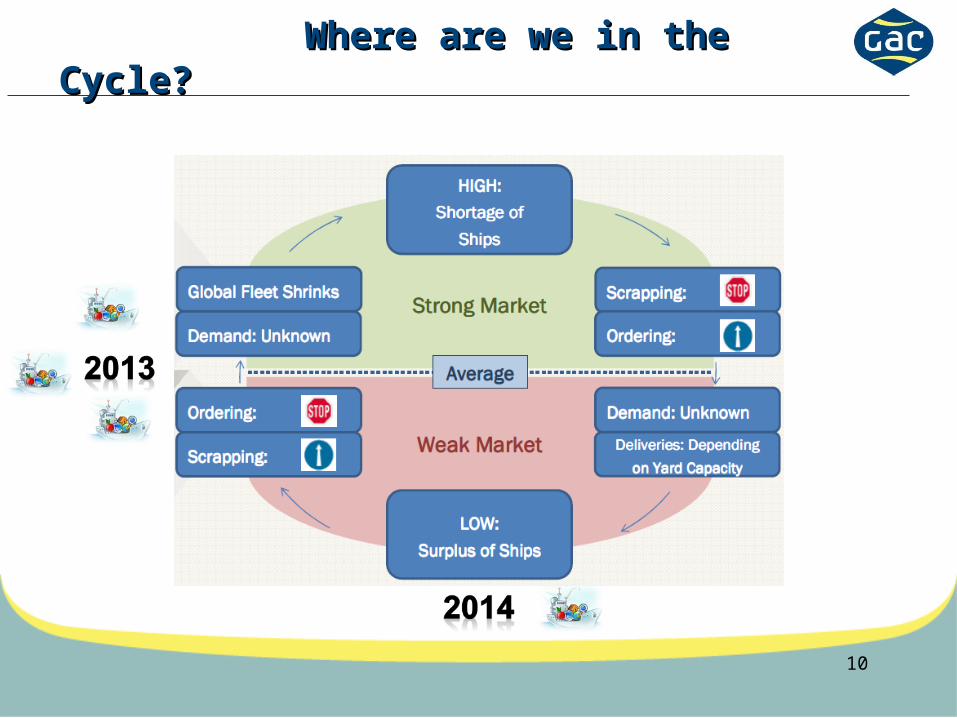
Where are we in the Cycle?Where are we in the Cycle?
10
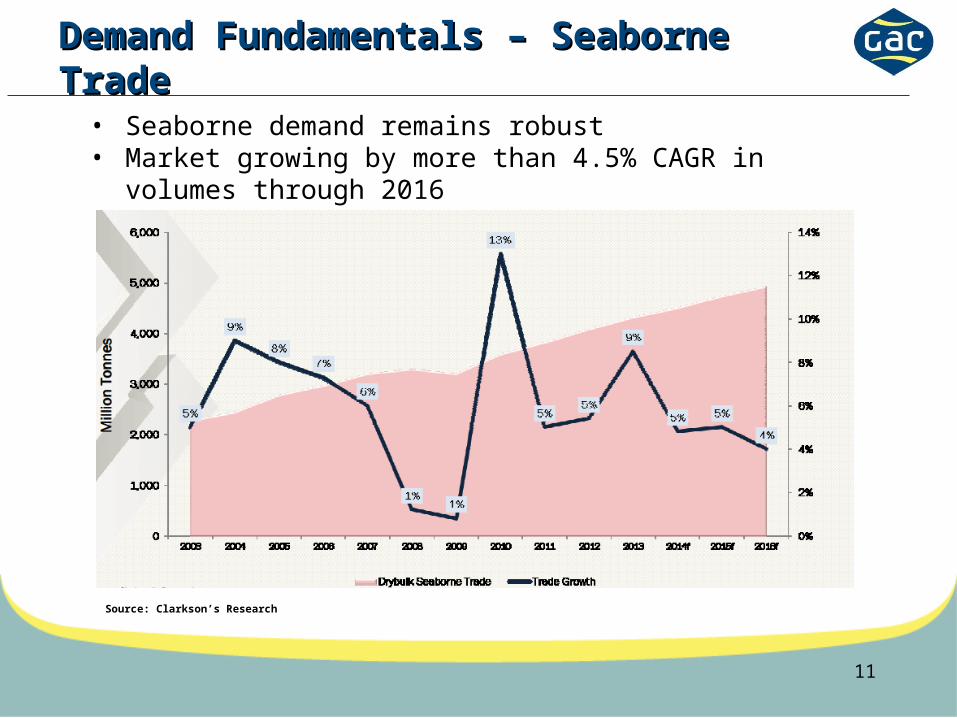
Demand Fundamentals – Seaborne Demand Fundamentals – Seaborne TradeTrade
11
• Seaborne demand remains robust• Market growing by more than 4.5% CAGR in volumes
through 2016
Source: Clarkson’s Research
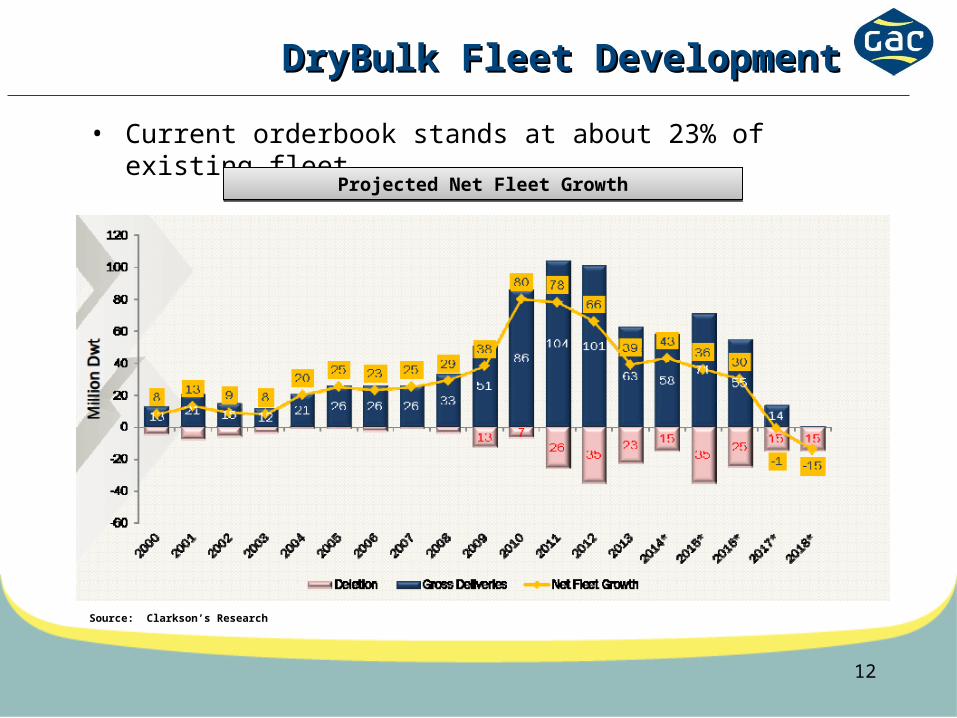
DryBulk Fleet DevelopmentDryBulk Fleet Development
12
• Current orderbook stands at about 23% of existing fleet
Projected Net Fleet GrowthProjected Net Fleet Growth
Source: Clarkson’s Research
Scrapping ActivityScrapping Activity
13
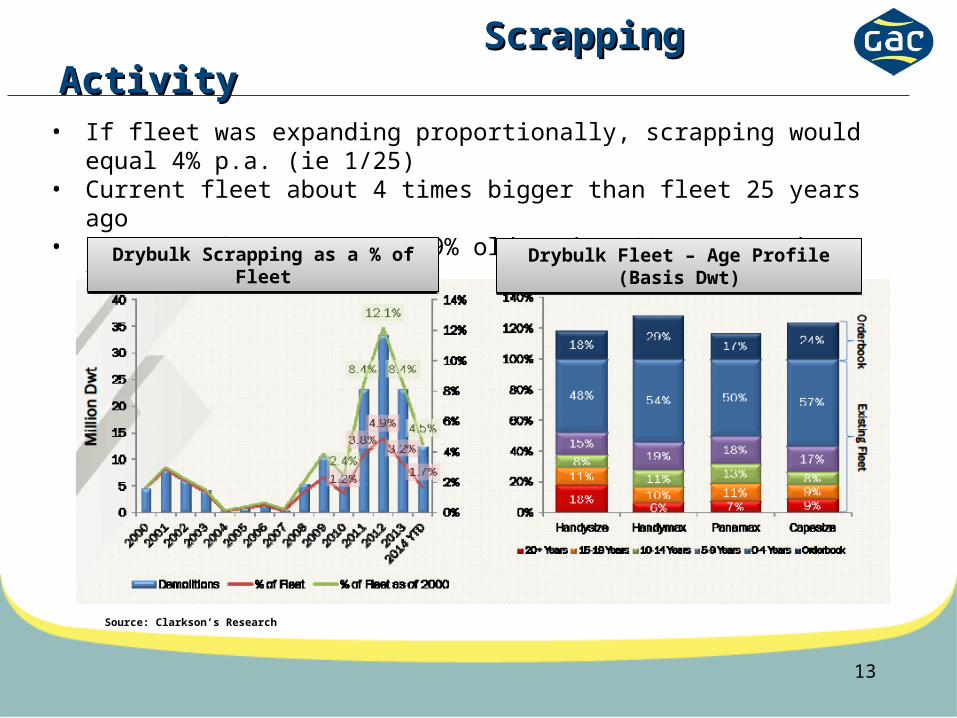
• If fleet was expanding proportionally, scrapping would equal 4% p.a. (ie 1/25)
• Current fleet about 4 times bigger than fleet 25 years ago• Existing fleet: 9% and 19% older than 20 years and 15 years,
respectively
Source: Clarkson’s Research
Drybulk Scrapping as a % of Fleet
Drybulk Scrapping as a % of Fleet
Drybulk Fleet – Age Profile (Basis Dwt)
Drybulk Fleet – Age Profile (Basis Dwt)
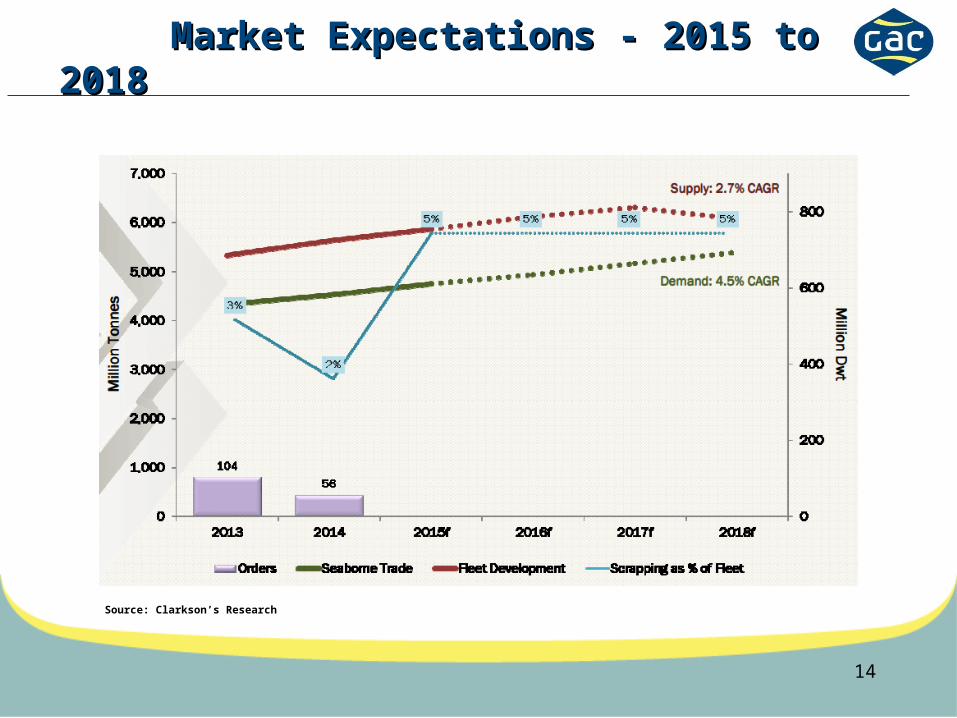
Market Expectations - 2015 to Market Expectations - 2015 to 20182018
14
Source: Clarkson’s Research
Oil business almost …booming!Oil business almost …booming!
Since early 2015 we have seen a steady freight rate rise in the oil tanker sector.
Last few weeks the freights are trending has been sharply upwards.
Freight rise is also being fueled by lot of (larger) tankers demand being used for storage. One out of three VLCCS are hired for storage!
Black Sea tanker rates are not as high as as in other regions but closely follow the trend.
Sharp fluctuations on oil prices will maintain high volatility in the shipping industry.
15
Global steel demand under Global steel demand under pressurepressure
Steel and raw material commodities remain under price pressure. The lower raw material prices make the Russian and Ukrainian steel mills less competitive and cannot predict any stunning freight boom in the Black Sea region other than the ‘peaks’ mostly associated to seasonal grain trade.
The Chinese factor of slowing economic growth and reduced steel production will have a great impact on world steel transportation, increasing freight volatility. China still accounts for almost 45% of goods carried by sea.
India surpassed US steel production in 2015 and this signals a new era in steel market trade. Shipping to / from India not greatlfy affected due to local demand.
No major changes expected in the short term ahead.
16
ConclusionConclusion
We can only expect another volatile year with unstable freight rates. There is steady cargo volumes increase despite the financial crisis however
Supply / demand seasonal factors to bring great fluctuations in the Black Sea freight market.
Young age Coasters to remain healthy in the long run as majority of fleet is over-age and there are no large replacement orders.
Be prepared for the unexpected!
17
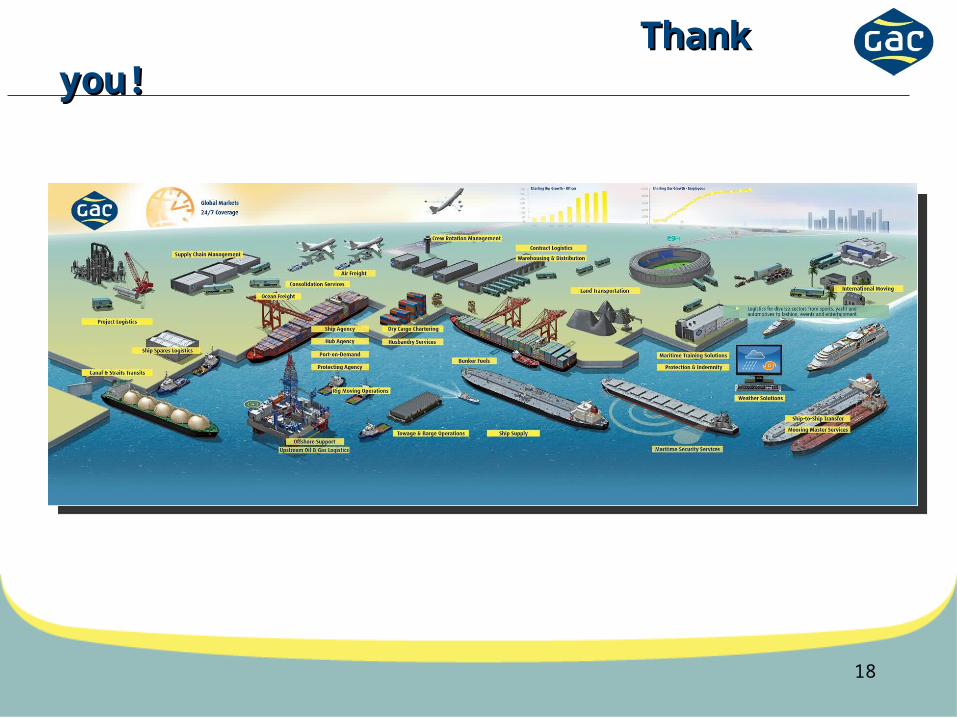
Thank you!Thank you!
18


![Exploiting Correcting Codes: On the Effectiveness of ECC ... · Rowhammer (RH) causes bits to flip Exploit to escalate privilege [Seaborn ’15] Exploit to escape sandboxes [Seaborn](https://static.fdocuments.in/doc/165x107/5f69e00b75b0d56dfa4ee3f8/exploiting-correcting-codes-on-the-effectiveness-of-ecc-rowhammer-rh-causes.jpg)