
Sea Levels according to temperature in Reykjaví (Iceland...
20
This project has been funded with support from the European Commission. This publication reflects the views only of the author, and the Commission cannot be held responsible for any use which may be made of the information contained therein. Sea Levels according to temperature in Reykjaví k (Iceland) and Gedser (Denmark) Menntaskó linn í Kó pavogi, Kó pavogur, Í sland MG Maribo Gymnasium, Maribo, Denmark Friday, April 16, 2010 Sea_level[1].nb Site: www.deltasoft.at M@th Desktop 1
Transcript of Sea Levels according to temperature in Reykjaví (Iceland...

This project has been funded with support from the European Commission. This publication reflects the views only of the author, and the Commission cannot be held
responsible for any use which may be made of the information contained therein.
Sea Levelsaccording totemperature inReykjaví
k
(Iceland) andGedser (Denmark)Menntaskó
linn
í Kó
pavogi,
Kó
pavogur,
Í
sland
MG Maribo Gymnasium, Maribo, Denmark
Friday, April 16, 2010 Sea_level[1].nb
Site: www.deltasoft.at M@th Desktop 1

Description of the Project (introduction)Open Close Print
The goal of this project is to show a connection between temperature and sea level inIceland and Denmark, respectively. To achieve this end, we shall plot two regressions ofthe collected data from 1986-2006 using Mathematica, analyse it, and then make acomparative analysis of the same two regressions.If we come to the conclusion that there is, in fact, a clear relationship between temperatureand sea level we shall make a "forecast": We could, for example examine how much thesea level will change if the temperature rises by two degrees Celsius, provided that therelationship between the two does not change.Finally, we will discuss our results and if they are valid.
TheoryOpen Close Print
HypothesisOpen Close
Should our project go smoothly, there should be some connection between thetemperature and the sea level in either country. Specifically, this means that we should beable to perform a regression of good accuracy on the data if there is a connection.We expect the change in sea level to be directly proportional to the change in temperature.Thus, we also expect the regression line to be linear and with a postive slope.
In other words, we think that when the Icelandic sea levels rise, the same would happenfor the Danish sea levels. In the same way, we think that the lower the temperature, thelower the sea level - this of course because that temperature has an immense affect on thesea levels, e.g. the melting of glaciers, the expansion of water at higher temperatures etc.
Friday, April 16, 2010 Sea_level[1].nb
Site: www.deltasoft.at M@th Desktop 2

Applied MathematicsOpen Close
Friday, April 16, 2010 Sea_level[1].nb
Site: www.deltasoft.at M@th Desktop 3

When analyzing these numbers of temperature and sea levels, we would of course like tobe able to have the best model possible - this we could use to predict possible changes inthe future. This "best" model is called a regression.A regression can be performed on any set of data as long as there are more than twopoints.The regression line is the graph of the function that best describes the progression of thedata. More specifically, this means the line which meets the requirement of the sum of thesquared values of the distances between the regression line and each point being smallerthan the same value of squared distances for any other possible line of the same type - beit linear, exponential or something else.The mean point, Pi, is always a point on the regression line.
1 2 3 4 5x
1
2
3
4
y
i2
Pi
Pi
i
The regression line is the line whose "boxes" cover the smallest surface possible.
r2yi y 2
yi y 2
This is the formula for calculating the value of r2. r2€]0;1]. The closer this value is to 1, thebetter the regression; 1 is perfect, and if r2>0.36, the regression is sufficiently accurate toprove a tendency.
Friday, April 16, 2010 Sea_level[1].nb
Site: www.deltasoft.at M@th Desktop 4

Developing ModelsOpen Close Print
Icelandic DataOpen Close
These are the data from Iceland 1986-2006.The x-values show the annual mean temperature in Reykjavik (degrees Celsius) while the y- values show the annual mean sea level in Reykjaví
k
(m). Each point is sorted according tothe year in which it has been recorded; the first point is from 1986, the second from 1987 etc.
Input
data 4.1, 2.16 , 5.4, 2.21 , 4.1, 2.17 , 3.8, 2.16 ,4.4, 2.25 , 5, 2.12 , 4.2, 2.15 , 4.4, 2.16 , 4.1, 2.17 ,3.8, 2.16 , 5, 2.21 , 5.1, 2.22 , 4.7, 2.21 , 4.5, 2.19 ,4.5, 2.19 , 5.2, 2.21 , 5.4, 2.23 , 6.1, 2.27 ,5.6, 2.25 , 5.1, 2.21 , 5.4, 2.24 ; Add ; data
4.1, 2.16 , 5.4, 2.21 , 4.1, 2.17 , 3.8, 2.16 ,4.4, 2.25 , 5, 2.12 , 4.2, 2.15 , 4.4, 2.16 ,4.1, 2.17 , 3.8, 2.16 , 5, 2.21 , 5.1, 2.22 , 4.7, 2.21 ,4.5, 2.19 , 4.5, 2.19 , 5.2, 2.21 , 5.4, 2.23 ,6.1, 2.27 , 5.6, 2.25 , 5.1, 2.21 , 5.4, 2.24
Now we will find the best linear regression line for these data by using the "Regr Line"-buttonfrom the "Linear Regression" palette.
Input
X y ;Clear x ;regrLineY x_ Fit data, 1, x , x1.98862 0.0438335 x
Now that we know the regression to be X[y]=1.98862+0.0438335 x, we are able to plot it toget a feeling for how it actually looks. For this purpose we use "Plot Regr Line" from the"Linear Regression" palette.
Input
Both Least Squares Lines ;Clear x ; regrLineY x_ Fit data, 1, x , x ;
MDSPlotDataRegressionLineY data, x, regrLineY x ,Epilog Red, PointSize 0.02 , Point data ,PlotStyle DarkGreen, Thickness 0.01
Friday, April 16, 2010 Sea_level[1].nb
Site: www.deltasoft.at M@th Desktop 5

4 4.5 5 5.5 6X Values
2.14
2.16
2.18
2.2
2.22
2.24
2.26
Yseula
V
Y x 1.98862 0.0438335 x
At first glance it seems that the regression line describes the location of the points well.However, we want to calculate r2to prove this. We find the value using the r r2Plot buttonfrom the Linear Correlation palette.
Input MDSPearsonCoeffReport dataPearson Coefficientr Report
Pearson r Determination x, y SeSSxy
SSxx SSyyyi y 2
yi y 2
x
in ,
y
in
yi yi 2
n 20.716553 51. %
explained4.75714, 2.19714 0.0279144
SSxy SSxx SSyy Data x range
x
i yi
x
i
y
in xi2
x
i 2n yi2
y
i 2n xmin, xmax
0.356429 8.13143 0.0304286 3.8, 6.1
From this data box we can see that r2equals 0.51. As previously mentioned, this means thatthe regression is good enough to prove a tendency (since r2 0.36). However, if we want amore accurate regression, we can try to investigate the tendency over the last 10 yearsinstead. The process above is repeated to do this.
Input
data 5.1, 2.22 , 4.7, 2.21 , 4.5, 2.19 ,4.5, 2.19 , 5.2, 2.21 , 5.4, 2.23 , 6.1, 2.27 ,5.6, 2.25 , 5.1, 2.21 , 5.4, 2.24 ; Add ; data
5.1, 2.22 , 4.7, 2.21 , 4.5, 2.19 , 4.5, 2.19 , 5.2, 2.21 ,5.4, 2.23 , 6.1, 2.27 , 5.6, 2.25 , 5.1, 2.21 , 5.4, 2.24
Friday, April 16, 2010 Sea_level[1].nb
Site: www.deltasoft.at M@th Desktop 6

Input
X y ;Clear x ;regrLineY x_ Fit data, 1, x , x1.96942 0.0489492 x
Input
Both Least Squares Lines ;Clear x ; regrLineY x_ Fit data, 1, x , x ;
MDSPlotDataRegressionLineY data, x, regrLineY x ,Epilog Red, PointSize 0.02 , Point data ,PlotStyle DarkGreen, Thickness 0.01
4.5 4.75 5 5.25 5.5 5.75 6X Values
2.2
2.22
2.24
2.26
YseulaV
Y x 1.96942 0.0489492 x
Input MDSPearsonCoeffReport dataPearson Coefficientr Report
Pearson r Determination x, y SeSSxy
SSxx SSyyyi y 2
yi y 2
x
in ,
y
in
yi yi 2
n 20.958232 92. %
explained5.16, 2.222 0.00780607
SSxy SSxx SSyy Data x range
x
i yi
x
i
y
in xi2
x
i 2n yi2
y
i 2n xmin, xmax
0.1118 2.284 0.00596 4.5, 6.1
Now we have an excellent regression line describing a very clear connection between sealevel and temperature in Reykjavik over the last ten years: Y[x] = 1.96942 + 0.0489492x
Friday, April 16, 2010 Sea_level[1].nb
Site: www.deltasoft.at M@th Desktop 7

Danish DataOpen Close
These are the Danish data, again from 1986-2006.
Input
data 10.6, 1.03 , 6.2, 1.05 , 8.4, 1.18 , 9.4, 1.68 ,9.5, 1.42 , 8.3, 0.71 , 9.2, 1.23 , 7.9, 0.85 , 8.9, 0.85 ,8.4, 1.59 , 7.1, 0.54 , 8.8, 1.18 , 8.7, 1.61 ,9.3, 1.12 , 9.6, 0.95 , 8.8, 1.31 , 9.5, 1.25 , 9.1, 1 ,9.0, 1.49 , 9.1, 1.12 , 9.9, 0.42 ; Add ; data
10.6, 1.03 , 6.2, 1.05 , 8.4, 1.18 , 9.4, 1.68 ,9.5, 1.42 , 8.3, 0.71 , 9.2, 1.23 , 7.9, 0.85 ,8.9, 0.85 , 8.4, 1.59 , 7.1, 0.54 , 8.8, 1.18 ,8.7, 1.61 , 9.3, 1.12 , 9.6, 0.95 , 8.8, 1.31 ,9.5, 1.25 , 9.1, 1 , 9., 1.49 , 9.1, 1.12 , 9.9, 0.42
Once again we perform a linear regression on the data as we did above.
Input
X y ;Clear x ;regrLineY x_ Fit data, 1, x , x0.645063 0.0540316x
This graph is then plotted as in the above section.
Input
Both Least Squares Lines ;Clear x ; regrLineY x_ Fit data, 1, x , x ;
MDSPlotDataRegressionLineY data, x, regrLineY x ,Epilog Red, PointSize 0.02 , Point data ,PlotStyle DarkGreen, Thickness 0.01
Friday, April 16, 2010 Sea_level[1].nb
Site: www.deltasoft.at M@th Desktop 8

7 8 9 10X Values
0.6
0.8
1
1.2
1.4
1.6
Yseula
V
Y x 0.645063 0.0540316 x
Input MDSPearsonCoeffReport dataPearson Coefficientr Report
Pearson r Determination x, y SeSSxy
SSxx SSyyyi y 2
yi y 2
x
in ,
y
in
yi yi 2
n 20.152444 2. %
explained8.84286, 1.12286 0.341627
SSxy SSxx SSyy Data x range
x
i yi
x
i
y
in xi2
x
i 2n yi2
y
i 2n xmin, xmax
0.976429 18.0714 2.27023 6.2, 10.6
Compared to the Icelandic graph, the accuracy of the Danish one is quite awful. Indeed,there is no clear relationship between sea level and temperature in Denmark during1986-2006 r2 < 0.36).
The Forecast (Iceland)Open Close
This is our forecast. We want to find out how high the sea level will be in 2020 (12years after the last recorded temperature/sea level data). To do so we shall first see ifthere is a clear tendency between the annual mean temperature and the number ofyears after 1986. Here, the x-values are the number of years after 1986 and the y-values are the annual mean temperature. NB: We are going to use the Icelandic data inthis section because of the poor quality of the Danish regression.
Friday, April 16, 2010 Sea_level[1].nb
Site: www.deltasoft.at M@th Desktop 9

Input
data 0, 4.1 , 1, 5.4 , 2, 4.1 , 3, 3.8 , 4, 4.4 , 5, 5 ,6, 4.2 , 7, 4.4 , 8, 4.1 , 9, 3.8 , 10, 5 , 11, 5.1 ,12, 4.7 , 13, 4.5 , 14, 4.5 , 15, 5.2 , 16, 5.4 ,17, 6.1 , 18, 5.6 , 19, 5.1 , 20, 5.4 ; Add ; data
0, 4.1 , 1, 5.4 , 2, 4.1 , 3, 3.8 , 4, 4.4 ,5, 5 , 6, 4.2 , 7, 4.4 , 8, 4.1 , 9, 3.8 , 10, 5 ,11, 5.1 , 12, 4.7 , 13, 4.5 , 14, 4.5 , 15, 5.2 ,16, 5.4 , 17, 6.1 , 18, 5.6 , 19, 5.1 , 20, 5.4
Now we peform linear regression on the data by using the "Regr Line"-button once again:
Input
X y ;Clear x ;regrLineY x_ Fit data, 1, x , x4.11558 0.0641558 x
This function is visualized in a graph:
Input
Both Least Squares Lines ;Clear x ; regrLineY x_ Fit data, 1, x , x ;
MDSPlotDataRegressionLineY data, x, regrLineY x ,Epilog Red, PointSize 0.02 , Point data ,PlotStyle DarkGreen, Thickness 0.01
0 5 10 15 20X Values
4
4.5
5
5.5
6
YseulaV
Y x 4.11558 0.0641558 x
A tendency is hardly present. We will see how r2 judge it by chossing "r r2 Box" from the"Linear Correlation"-palette.
Friday, April 16, 2010 Sea_level[1].nb
Site: www.deltasoft.at M@th Desktop 10
Input MDSPearsonCoeffReport dataPearson Coefficientr Report
Pearson r Determination x, y SeSSxy
SSxx SSyyyi y 2
yi y 2
x
in ,
y
in
yi yi 2
n 20.624307 39. %
explained10., 4.75714 0.511043
SSxy SSxx SSyy Data x range
x
i yi
x
i
y
in xi2
x
i 2n yi2
y
i 2n xmin, xmax
49.4 770. 8.13143 0., 20.
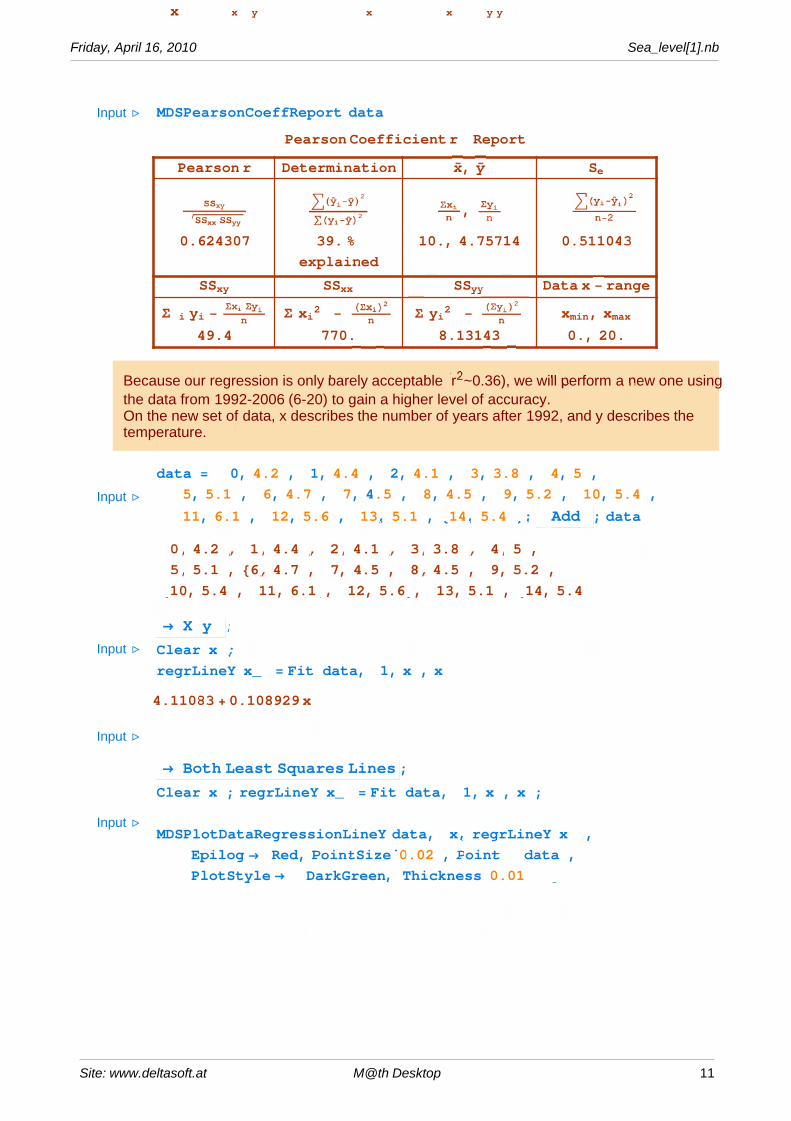
Because our regression is only barely acceptable r2~0.36), we will perform a new one usingthe data from 1992-2006 (6-20) to gain a higher level of accuracy.On the new set of data, x describes the number of years after 1992, and y describes thetemperature.
Input
data 0, 4.2 , 1, 4.4 , 2, 4.1 , 3, 3.8 , 4, 5 ,5, 5.1 , 6, 4.7 , 7, 4.5 , 8, 4.5 , 9, 5.2 , 10, 5.4 ,11, 6.1 , 12, 5.6 , 13, 5.1 , 14, 5.4 ; Add ; data
0, 4.2 , 1, 4.4 , 2, 4.1 , 3, 3.8 , 4, 5 ,5, 5.1 , 6, 4.7 , 7, 4.5 , 8, 4.5 , 9, 5.2 ,10, 5.4 , 11, 6.1 , 12, 5.6 , 13, 5.1 , 14, 5.4
Input
X y ;Clear x ;regrLineY x_ Fit data, 1, x , x4.11083 0.108929 x
Input
Input
Both Least Squares Lines ;Clear x ; regrLineY x_ Fit data, 1, x , x ;
MDSPlotDataRegressionLineY data, x, regrLineY x ,Epilog Red, PointSize 0.02 , Point data ,PlotStyle DarkGreen, Thickness 0.01
Friday, April 16, 2010 Sea_level[1].nb
Site: www.deltasoft.at M@th Desktop 11

0 2 4 6 8 10 12 14X Values
4
4.5
5
5.5
6
Yseula
V
Y x 4.11083 0.108929 x
Input MDSPearsonCoeffReport dataPearson Coefficientr Report
Pearson r Determination x, y SeSSxy
SSxx SSyyyi y 2
yi y 2
x
in ,
y
in
yi yi 2
n 20.77375 60. %
explained7., 4.87333 0.413894
SSxy SSxx SSyy Data x range
x
i yi
x
i
y
in xi2
x
i 2n yi2
y
i 2n xmin, xmax
30.5 280. 5.54933 0., 14.
This regression looks pretty good! r2is 0.60, which makes it significantly better than theprevious one and easily good enough to prove a tendency (thus, we have proved that it hasbeen getting warmer and warmer during 1992-2006).Now, we will use this model to predict how warm it will be in 2020 (x = 2020-1992 = 28)
Input
X y ;Clear x ;regrLineY x_ Fit data, 1, x , x ;regrLineY 28 x value MUST be in data x range7.16083
So, according to our model, the annual mean temperature in Reykjavik will be 7.16 degreesin 2020. Now we want to calculate the annual mean sea level for 2020 by using the finalmodel from the section "Icelandic Data" (Y[x] = 1.96942 + 0.0489492x) with the temperaturethat we have just found:
Input 1.96942 0.0489492 7.16083
Friday, April 16, 2010 Sea_level[1].nb
Site: www.deltasoft.at M@th Desktop 12

2.31994
This means that the sea level will have increased to 2.31994 m in 2020 according to thismodel.
Another way of making a model is to perform a regression with the time (years after e.g.1986) on the x-axis and the sea level (m) on the y-axis. The result of this forecast will becompared with the result of the original one (above) in the Result and Summary-section(green section 4).These are the data as mentioned above. x describes the number of years after 1986.
Input
data 0, 2.16 , 1, 2.21 , 2, 2.17 , 3, 2.16 ,4, 2.25 , 5, 2.12 , 6, 2.15 , 7, 2.16 , 8, 2.17 ,9, 2.16 , 10, 2.21 , 11, 2.22 , 12, 2.21 , 13, 2.19 ,14, 2.19 , 15, 2.21 , 16, 2.23 , 17, 2.27 ,18, 2.25 , 19, 2.21 , 20, 2.24 ; Add ; data
0, 2.16 , 1, 2.21 , 2, 2.17 , 3, 2.16 , 4, 2.25 , 5, 2.12 ,6, 2.15 , 7, 2.16 , 8, 2.17 , 9, 2.16 , 10, 2.21 ,11, 2.22 , 12, 2.21 , 13, 2.19 , 14, 2.19 , 15, 2.21 ,16, 2.23 , 17, 2.27 , 18, 2.25 , 19, 2.21 , 20, 2.24
The regression function is determined and the regression line is visualized:
Input
X y ;Clear x ;regrLineY x_ Fit data, 1, x , x2.15909 0.00380519x
Input
Both Least Squares Lines ;Clear x ; regrLineY x_ Fit data, 1, x , x ;
MDSPlotDataRegressionLineY data, x, regrLineY x ,Epilog Red, PointSize 0.02 , Point data ,PlotStyle DarkGreen, Thickness 0.01
Friday, April 16, 2010 Sea_level[1].nb
Site: www.deltasoft.at M@th Desktop 13

0 5 10 15 20X Values
2.14
2.16
2.18
2.2
2.22
2.24
2.26
Yseula
V
Y x 2.15909 0.00380519 x
We determine the accuracy of the regression by the means of r2:
Input MDSPearsonCoeffReport dataPearson Coefficientr Report
Pearson r Determination x, y SeSSxy
SSxx SSyyyi y 2
yi y 2
x
in ,
y
in
yi yi 2
n 20.605315 37. %
explained10., 2.19714 0.0318544
SSxy SSxx SSyy Data x range
x
i yi
x
i
y
in xi2
x
i 2n yi2
y
i 2n xmin, xmax
2.93 770. 0.0304286 0., 20.
r2= 0.37 is closer to 0.36 than to our liking. For this reason, a new regression is peformed,this time on the period of 1992-2006. This time, x is years after 1992 and y is still the sealevel in meters.
Input
data 0, 2.15 , 1, 2.16 , 2, 2.17 , 3, 2.16 , 4, 2.21 ,5, 2.22 , 6, 2.21 , 7, 2.19 , 8, 2.19 , 9, 2.21 , 10, 2.23 ,11, 2.27 , 12, 2.25 , 13, 2.21 , 14, 2.24 ; Add ; data
0, 2.15 , 1, 2.16 , 2, 2.17 , 3, 2.16 , 4, 2.21 ,5, 2.22 , 6, 2.21 , 7, 2.19 , 8, 2.19 , 9, 2.21 ,10, 2.23 , 11, 2.27 , 12, 2.25 , 13, 2.21 , 14, 2.24
We perform linear regression as usual:
Friday, April 16, 2010 Sea_level[1].nb
Site: www.deltasoft.at M@th Desktop 14

Input
X y ;Clear x ;regrLineY x_ Fit data, 1, x , x2.15992 0.00639286x
The regression is visualized:
Input
Both Least Squares Lines ;Clear x ; regrLineY x_ Fit data, 1, x , x ;
MDSPlotDataRegressionLineY data, x, regrLineY x ,Epilog Red, PointSize 0.02 , Point data ,PlotStyle DarkGreen, Thickness 0.01
0 2 4 6 8 10 12 14X Values
2.16
2.18
2.2
2.22
2.24
2.26
Yseula
V
Y x 2.15992 0.00639286 x
This regression seems reasonable. We will ask Mathematica to calculate r2for us:
Input MDSPearsonCoeffReport dataPearson Coefficientr Report
Pearson r Determination x, y SeSSxy
SSxx SSyyyi y 2
yi y 2
x
in ,
y
in
yi yi 2
n 20.816294 67. %
explained7., 2.20467 0.0209947
SSxy SSxx SSyy Data x range
x
i yi
x
i
y
in xi2
x
i 2n yi2
y
i 2n xmin, xmax
1.79 280. 0.0171733 0., 14.
Friday, April 16, 2010 Sea_level[1].nb
Site: www.deltasoft.at M@th Desktop 15

r2>>0.36, which means that Y[x] = 2.15992 + 0.00639286x is, in fact, a good regression. It iseven better than the regression on temperature/time ( |r2 =0.60).According to this model, the sea level in 2020 will be Y[(2020-1992)] = Y[28] =
Input
X y ;Clear x ;regrLineY x_ Fit data, 1, x , x ;regrLineY 28 x value MUST be in data x range2.33892
So we have two slightly different results from two different models:The sea level in 2020 will be 2.31994 or 2.33892. Of course, these numbers are not to betaken too seriously, as we shall now discuss.
Result and SummaryOpen Close Print
ResultsOpen Close
During our project we have found that: - The connection between the average annual sea level and the yearly mean temperature
in Reykjavik can approximately be described as a growing linear function. - The temperature over the period of 1986-2006 has a linearly growing tendency. In the
period of 1992-2006 there is an even more, very clear linear tendency. - The sea level has evolved similarly to the temperature during the period of 1986-2006.
Especially during 1992-2006 there is a clear, linear tendency. - According to the two models that we have constructed, the sea level in Reykjavik 2020
will be 2.31994 m or 2.33892 m, respectively.
Friday, April 16, 2010 Sea_level[1].nb
Site: www.deltasoft.at M@th Desktop 16

Discussion of ResultsOpen Close
It seems evident that there is, in reality, a general rise in temperature in Reykjavik which inturn will cause the sea level there to rise. These are the general tendencies which we haveobserved. These can, on a short term, probably be trusted. However, it is much tooambitious to make a forecast resulting in a 5-digit number; one should rather expect to beable to predict another tendency in turn.
In other words, the results we have come up with do not necessarily reflect reality - thefactors contributing to the increase in both temperature and sea levels are too great innumbers and complexity to have all been a part of our calculations, thus making it verydifficult to actually make an accurate forecast.
Some of the factors affecting the results are:
The water: The water from the melting of glaciers itself has an impact on the sea levels,making the sea levels higher. The reason for this is that the ice from the glacier is on land -this means that the ice from the glacier has not already been a part of the water masswhich on the other hand is the case with icebergs. When icebergs melt they do not makethe sea levels rise because the iceberg has already been a part of the water mass - thismeans that the water does not increase the height of the sea levels.
The melting: The glacier looses weight, resulting in rising of the landmasses, therebyhaving a "counter-impact" on the sea levels.
Salt: When the glaciers melt, the salt levels in the oceans will decrease, resulting in achange of the streams - salty water weighs more than pure water, thereby resulting in apossible dissolve of the Gulf Stream and many others. This could have multiple effects oncountries near the streams, in particular Iceland, whose mild climate is mainly caused bysame current.
Many other factors come in to play as well, but we shall let the geologists and meteoroligistkeep their jobs.
To sum it all up, we have come to the conclusion that we are able to observe and predictcertain tendencies, the most important and clear of these being that the temperature is infact increasing and that this will result in the sea levels rising.
Friday, April 16, 2010 Sea_level[1].nb
Site: www.deltasoft.at M@th Desktop 17

Our TeamOpen Close Print
ParticipantsOpen Close
The whole group, Icelandic and Danes, working with this project:
Students:
Hildur Rut Hermannsdó
ttir,
19 (ISL)Melkorka Ragnhildardó
ttir,
19 (ISL)Magnus Ingvi Kristjá
nsson,
18 (ISL)Sandra Dí
s
Jó
nsdóttir,
21 (ISL)Thomas Langemark Trojahn, 17 (DK)Helene Hummelmose, 18 (DK)
Morten Emmanuel Schiøler, 17 (DK)Karina Jensen, 18 (DK)
Teachers:
Wenche Melchiors (DK)Þ
óra
Þ
órðardóttir
(ISL)Guð
rún
Angantý
rsdóttir
(ISL)
Friday, April 16, 2010 Sea_level[1].nb
Site: www.deltasoft.at M@th Desktop 18

The whole group, Icelandic and Danes, working with this project:
Students:
Hildur Rut Hermannsdó
ttir,
19 (ISL)Melkorka Ragnhildardó
ttir,
19 (ISL)Magnus Ingvi Kristjá
nsson,
18 (ISL)Sandra Dí
s
Jó
nsdóttir,
21 (ISL)Thomas Langemark Trojahn, 17 (DK)Helene Hummelmose, 18 (DK)
Morten Emmanuel Schiøler, 17 (DK)Karina Jensen, 18 (DK)
Teachers:
Wenche Melchiors (DK)Þ
óra
Þ
órðardóttir
(ISL)Guðrún Angantýrsdóttir (ISL)
Impression of IcelandOpen Close
We, the Danish group, came to Iceland Saturday afternoon. Our impression of Iceland wasfantastic. The nature was more beautiful than the Danish nature in every aspect. Themountains, the wide landscapes with no signs of human interference and the fresh airwere all impressions that we will all remember for a long time.
The Icelandic people are very hosbitable, and we felt that from the first moment when weentered our hosts' homes - we simply felt at home right away.
When it comes to the educational part of Iceland, we were all impressed with the fineconditions of the school, which we think beats many Danish schools in terms of bothfacilities and educational aspects. The students seem focused and willing to learn, and thisis noticable almost instantly - and the students also show respect for the school, e.g. whenall the students take off their shoes - this would almost never be seen in Denmark.
When that is said, we think that the cultural differences between Danes and Icelandicpeople are not that great, if noticable at all. The students adress their teachers by firstname, a tendency not seen in many other European countries, e.g. Italy, Germany, and soon.
Friday, April 16, 2010 Sea_level[1].nb
Site: www.deltasoft.at M@th Desktop 19

Icelandic impression and overall view onthe projectOpen Close
Over the last two days (9th-10th of November) we have been working on a project thatinvolves the sea level rising and temperature changes around Iceland and Denmark. Wehad four Danish kids come visit us here in Iceland and we worked together usingMathematica 4, M@th desktop. Our experience working with the Danish kids was both funand also a little challenging. We started working on the project on Monday and finished onTuesday. We all had different ideas and options so it was fun mixing together twocountries and combining our answers.
New Chapter Cut Last Chapter
Friday, April 16, 2010 Sea_level[1].nb
Site: www.deltasoft.at M@th Desktop 20


![ParitoshChahal(991345820) Mathproject[FINAL]](https://static.fdocuments.in/doc/165x107/563db8c3550346aa9a96ba93/paritoshchahal991345820-mathprojectfinal.jpg)