Iceland in Figures 2017 - statice.is · Iceland in figures 2017 Volume 22 Published by Statistics...
36
2017 Iceland in figures
Transcript of Iceland in Figures 2017 - statice.is · Iceland in figures 2017 Volume 22 Published by Statistics...
2017Iceland in figures

Iceland in figures 2017Volume 22
Published byStatistics IcelandBorgartún 21aIS-105 ReykjavíkICELAND
Telephone (+354) 528 1000Facsimile (+354) 528 1098E-mail [email protected] www.statice.is
Edited by Svava Guðjónsdóttir
Cover design and layout Statistics Iceland/BÓPaper UPM Finesse Premium Silk 90gPrinted and bound by Oddi Printing Corp.
Sale and subscription Statistics IcelandTelephone (+354) 528 1100Facsimile (+354) 528 1098E-mail [email protected]
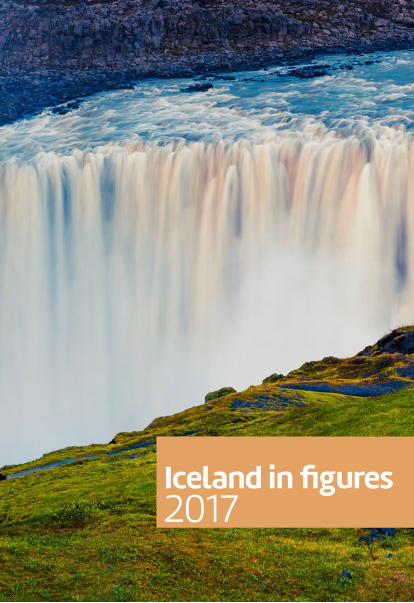
Cover photoTourist standing on the shore of the most powerful waterfall in Europe, Dettifoss. Colourful summer sunset in Jökulsárgljúfur National Park, Iceland.© Andrew Mayovskyy / Shutterstock
© Statistics Iceland 2017Reproduction and distribution, also of parts, are permitted provided that the source is mentioned.
ISBN 978-9979-770-57-2ISSN 1025-6903
CONTENTS
Map of Iceland 2Key figures 3Population 4Elections 7Labour market 8Wages and income 11Quality of life 12Health and social protection 13Education and culture 14Prices 16National accounts 18Public finance 20External trade 21Enterprises and turnover 23Fisheries 24Agriculture 26Tourism 27Transport and information technology 28Energy 29Geography and environment 31
Primary symbols and abbreviations
– nil0 less than half of the unit used· category not applicable… not available, thousand seperator. decimal seperatorISK Icelandic krónurn.e.s. not elsewhere specifiedEU European UnionEEA European Economic AreaBOP Balance of Payments@ notes; source
2
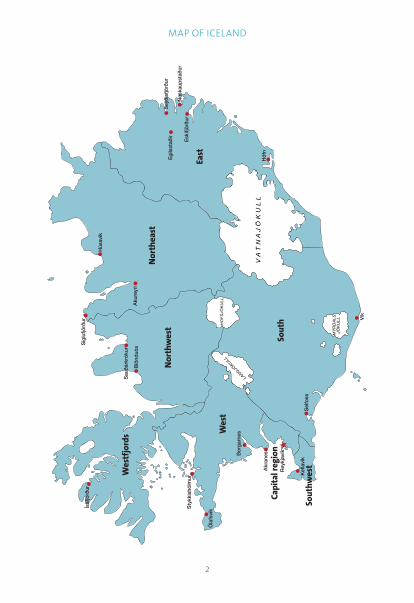
Map of Iceland
Nor
thw
est
Sout
hwes
t
Capi
tal r
egio
n
Wes
tfjo
rds
East
Sout
h
Nor
thea
st
Wes
t
Rey
kjav
ík
Akr
anesB
orga
rnes
Blö
nduó
s
Sau
ðárk
róku
r
Aku
reyr
i
Hús
avík
Sey
ðisf
jörð
ur
Nes
kaup
stað
ur
Egi
lsst
aðir
Esk
ifjör
ður
Höf
n
Vík
Sel
foss
Sig
lufjö
rður
Sty
kkis
hólm
ur
Ísaf
jörð
ur
Óla
fsví
k
Kef
laví
k
3
Key figures
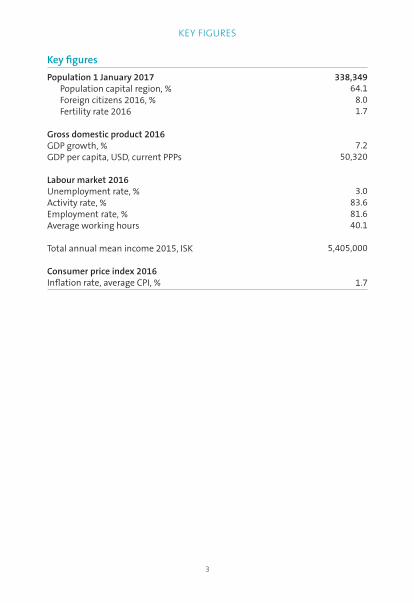
Key figures
Population 1 January 2017 338,349Population capital region, % 64.1Foreign citizens 2016, % 8.0Fertility rate 2016 1.7
Gross domestic product 2016GDP growth, % 7.2GDP per capita, USD, current PPPs 50,320
Labour market 2016Unemployment rate, % 3.0Activity rate, % 83.6Employment rate, % 81.6Average working hours 40.1
Total annual mean income 2015, ISK 5,405,000
Consumer price index 2016Inflation rate, average CPI, % 1.7
4
PoPulation
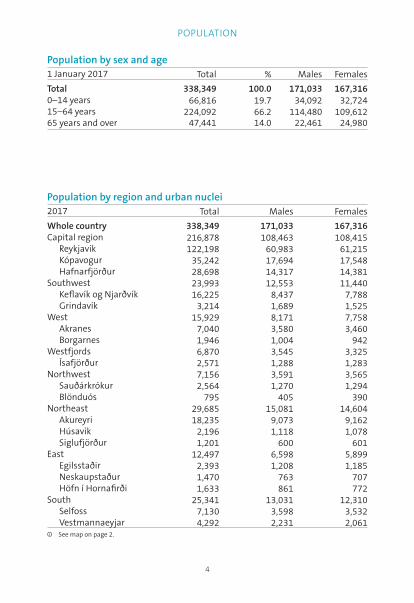
Population by sex and age1 January 2017 Total % Males Females
Total 338,349 100.0 171,033 167,3160–14 years 66,816 19.7 34,092 32,72415–64 years 224,092 66.2 114,480 109,61265 years and over 47,441 14.0 22,461 24,980
Population by region and urban nuclei2017 Total Males Females
Whole country 338,349 171,033 167,316Capital region 216,878 108,463 108,415
Reykjavík 122,198 60,983 61,215Kópavogur 35,242 17,694 17,548Hafnarfjörður 28,698 14,317 14,381
Southwest 23,993 12,553 11,440Keflavík og Njarðvík 16,225 8,437 7,788Grindavík 3,214 1,689 1,525
West 15,929 8,171 7,758Akranes 7,040 3,580 3,460Borgarnes 1,946 1,004 942
Westfjords 6,870 3,545 3,325Ísafjörður 2,571 1,288 1,283
Northwest 7,156 3,591 3,565Sauðárkrókur 2,564 1,270 1,294Blönduós 795 405 390
Northeast 29,685 15,081 14,604Akureyri 18,235 9,073 9,162Húsavík 2,196 1,118 1,078Siglufjörður 1,201 600 601
East 12,497 6,598 5,899Egilsstaðir 2,393 1,208 1,185Neskaupstaður 1,470 763 707Höfn í Hornafirði 1,633 861 772
South 25,341 13,031 12,310Selfoss 7,130 3,598 3,532Vestmannaeyjar 4,292 2,231 2,061
@ See map on page 2.
5
PoPulation
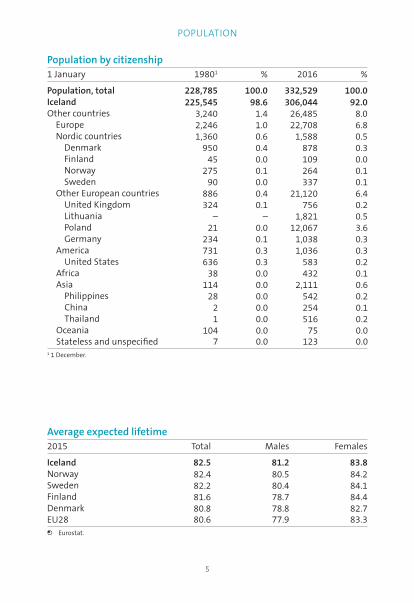
Population by citizenship1 January 19801 % 2016 %
Population, total 228,785 100.0 332,529 100.0Iceland 225,545 98.6 306,044 92.0Other countries 3,240 1.4 26,485 8.0
Europe 2,246 1.0 22,708 6.8Nordic countries 1,360 0.6 1,588 0.5
Denmark 950 0.4 878 0.3Finland 45 0.0 109 0.0Norway 275 0.1 264 0.1Sweden 90 0.0 337 0.1
Other European countries 886 0.4 21,120 6.4United Kingdom 324 0.1 756 0.2Lithuania – – 1,821 0.5Poland 21 0.0 12,067 3.6Germany 234 0.1 1,038 0.3
America 731 0.3 1,036 0.3United States 636 0.3 583 0.2
Africa 38 0.0 432 0.1Asia 114 0.0 2,111 0.6
Philippines 28 0.0 542 0.2China 2 0.0 254 0.1Thailand 1 0.0 516 0.2
Oceania 104 0.0 75 0.0Stateless and unspecified 7 0.0 123 0.0
1 1 December.
Average expected lifetime2015 Total Males Females
Iceland 82.5 81.2 83.8Norway 82.4 80.5 84.2Sweden 82.2 80.4 84.1Finland 81.6 78.7 84.4Denmark 80.8 78.8 82.7EU28 80.6 77.9 83.3
; Eurostat.
6
PoPulation
; Eurostat.
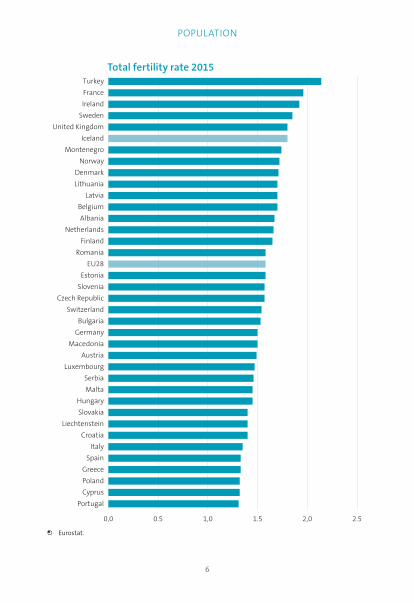
Total fertility rate 2015
0,0 0.5 1,0 1.5 2,0 2.5
Portugal
cyprus
Poland
greece
spain
italy
croatia
liechtenstein
slovakia
Hungary
malta
serbia
luxembourg
austria
macedonia
germany
bulgaria
switzerland
czech republic
slovenia
estonia
eu28
romania
finland
netherlands
albania
belgium
latvia
lithuania
denmark
norway
montenegro
iceland
united Kingdom
sweden
ireland
france
turkey
7
elections
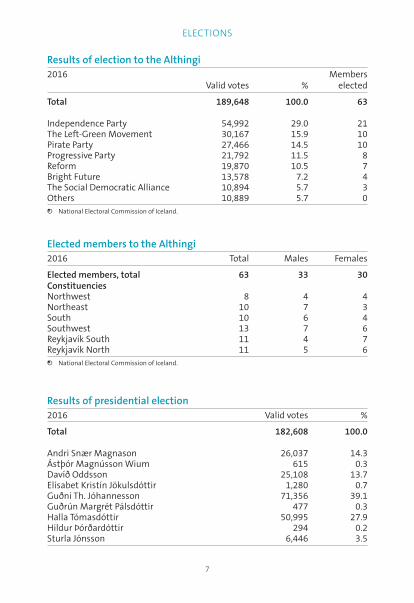
Results of election to the Althingi2016
Valid votes %Members
elected
Total 189,648 100.0 63
Independence Party 54,992 29.0 21The Left-Green Movement 30,167 15.9 10Pirate Party 27,466 14.5 10Progressive Party 21,792 11.5 8Reform 19,870 10.5 7Bright Future 13,578 7.2 4The Social Democratic Alliance 10,894 5.7 3Others 10,889 5.7 0
; National Electoral Commission of Iceland.
Elected members to the Althingi 2016 Total Males Females
Elected members, total 63 33 30ConstituenciesNorthwest 8 4 4Northeast 10 7 3South 10 6 4Southwest 13 7 6Reykjavík South 11 4 7Reykjavík North 11 5 6
; National Electoral Commission of Iceland.
Results of presidential election2016 Valid votes %
Total 182,608 100.0
Andri Snær Magnason 26,037 14.3Ástþór Magnússon Wium 615 0.3Davíð Oddsson 25,108 13.7Elísabet Kristín Jökulsdóttir 1,280 0.7Guðni Th. Jóhannesson 71,356 39.1Guðrún Margrét Pálsdóttir 477 0.3Halla Tómasdóttir 50,995 27.9Hildur Þórðardóttir 294 0.2Sturla Jónsson 6,446 3.5
8
labour marKet
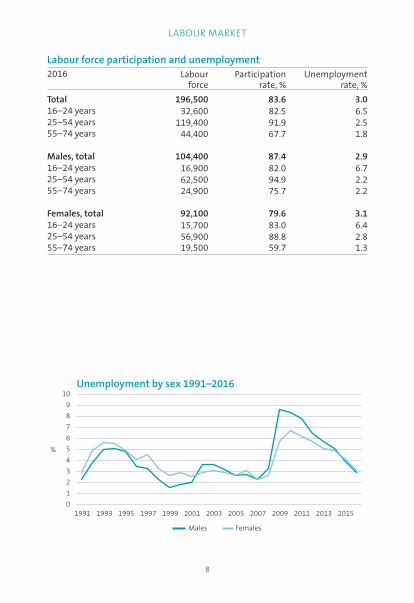
Unemployment by sex 1991–2016
males females
%
0
1
2
3
4
5
6
7
8
9
10
1991 1993 1995 1997 1999 2001 2003 2005 2007 2009 2011 2013 2015
Labour force participation and unemployment2016 Labour Participation Unemployment
force rate, % rate, %
Total 196,500 83.6 3.016–24 years 32,600 82.5 6.525–54 years 119,400 91.9 2.555–74 years 44,400 67.7 1.8
Males, total 104,400 87.4 2.916–24 years 16,900 82.0 6.725–54 years 62,500 94.9 2.255–74 years 24,900 75.7 2.2
Females, total 92,100 79.6 3.116–24 years 15,700 83.0 6.425–54 years 56,900 88.8 2.855–74 years 19,500 59.7 1.3
9
labour marKet
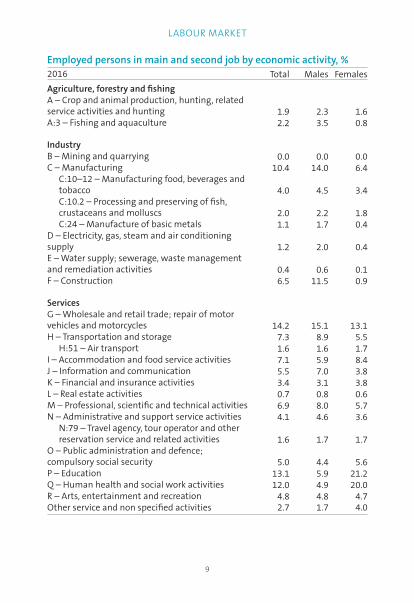
Employed persons in main and second job by economic activity, %2016 Total Males Females
Agriculture, forestry and fishingA – Crop and animal production, hunting, related service activities and hunting 1.9 2.3 1.6A:3 – Fishing and aquaculture 2.2 3.5 0.8
IndustryB – Mining and quarrying 0.0 0.0 0.0C – Manufacturing 10.4 14.0 6.4
C:10–12 – Manufacturing food, beverages and tobacco 4.0 4.5 3.4C:10.2 – Processing and preserving of fish, crustaceans and molluscs 2.0 2.2 1.8C:24 – Manufacture of basic metals 1.1 1.7 0.4
D – Electricity, gas, steam and air conditioning supply 1.2 2.0 0.4E – Water supply; sewerage, waste management and remediation activities 0.4 0.6 0.1F – Construction 6.5 11.5 0.9
ServicesG – Wholesale and retail trade; repair of motor vehicles and motorcycles 14.2 15.1 13.1H – Transportation and storage 7.3 8.9 5.5
H:51 – Air transport 1.6 1.6 1.7I – Accommodation and food service activities 7.1 5.9 8.4J – Information and communication 5.5 7.0 3.8K – Financial and insurance activities 3.4 3.1 3.8L – Real estate activities 0.7 0.8 0.6M – Professional, scientific and technical activities 6.9 8.0 5.7N – Administrative and support service activities 4.1 4.6 3.6
N:79 – Travel agency, tour operator and other reservation service and related activities 1.6 1.7 1.7
O – Public administration and defence; compulsory social security 5.0 4.4 5.6P – Education 13.1 5.9 21.2Q – Human health and social work activities 12.0 4.9 20.0R – Arts, entertainment and recreation 4.8 4.8 4.7Other service and non specified activities 2.7 1.7 4.0
10
labour marKet
; Eurostat.
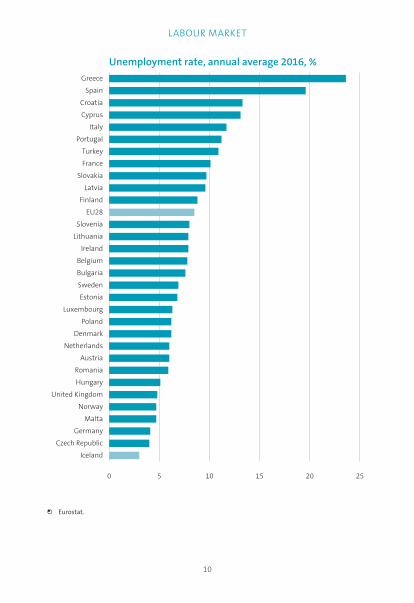
Unemployment rate, annual average 2016, %
0 5 10 15 20 25
iceland
czech republic
germany
malta
norway
united Kingdom
Hungary
romania
austria
netherlands
denmark
Poland
luxembourg
estonia
sweden
bulgaria
belgium
ireland
lithuania
slovenia
eu28
finland
latvia
slovakia
france
turkey
Portugal
italy
cyprus
croatia
spain
greece
11
Wages and income
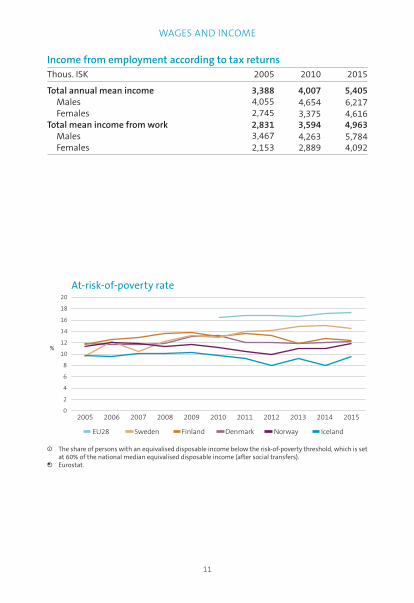
Income from employment according to tax returnsThous. ISK 2005 2010 2015
Total annual mean income 3,388 4,007 5,405Males 4,055 4,654 6,217Females 2,745 3,375 4,616
Total mean income from work 2,831 3,594 4,963Males 3,467 4,263 5,784Females 2,153 2,889 4,092
At-risk-of-poverty rate
0
2
4
6
8
10
12
14
16
18
20
2005 2006 2007 2008 2009 2010 2011 2012 2013 2014 2015
eu28 denmarkfinlandsweden icelandnorway
%
@ The share of persons with an equivalised disposable income below the risk-of-poverty threshold, which is set at 60% of the national median equivalised disposable income (after social transfers).
; Eurostat.
12
Quality of life
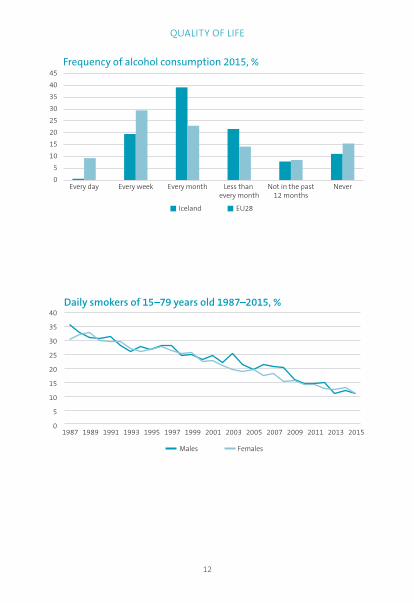
Frequency of alcohol consumption 2015, %
0
5
10
15
20
25
30
35
40
45
every day every week every month less than every month
not in the past12 months
never
iceland eu28
Daily smokers of 15–79 years old 1987–2015, %
femalesmales
0
5
10
15
20
25
30
35
40
1987 1989 1991 1993 1995 1997 1999 2001 2003 2005 2007 2009 2011 2013 2015
13
HealtH and social Protection
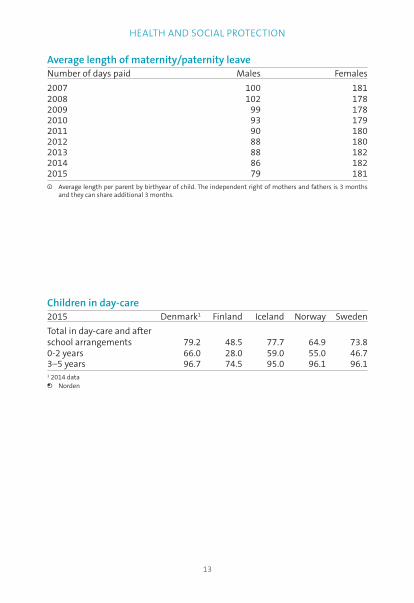
Average length of maternity/paternity leaveNumber of days paid Males Females
2007 100 1812008 102 1782009 99 1782010 93 1792011 90 1802012 88 1802013 88 1822014 86 1822015 79 181
@ Average length per parent by birthyear of child. The independent right of mothers and fathers is 3 months and they can share additional 3 months.
Children in day-care2015 Denmark1 Finland Iceland Norway Sweden
Total in day-care and after school arrangements 79.2 48.5 77.7 64.9 73.80-2 years 66.0 28.0 59.0 55.0 46.73–5 years 96.7 74.5 95.0 96.1 96.11 2014 data
; Norden
14
education and culture
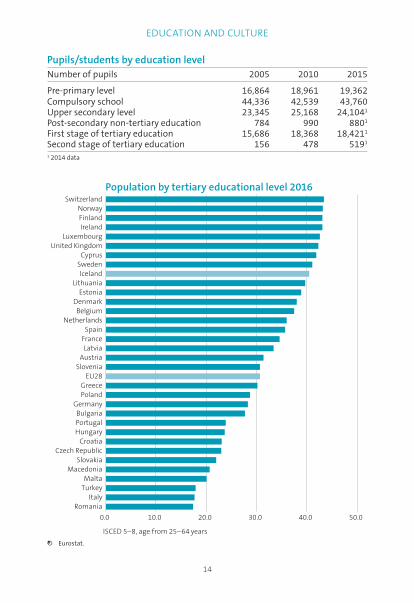
Pupils/students by education levelNumber of pupils 2005 2010 2015
Pre-primary level 16,864 18,961 19,362Compulsory school 44,336 42,539 43,760Upper secondary level 23,345 25,168 24,1041
Post-secondary non-tertiary education 784 990 8801
First stage of tertiary education 15,686 18,368 18,4211
Second stage of tertiary education 156 478 5191
1 2014 data
; Eurostat.
Population by tertiary educational level 2016
isced 5–8, age from 25–64 years
0.0 10.0 20.0 30.0 40.0 50.0
romaniaitaly
turkeymalta
macedoniaslovakia
czech republiccroatia
HungaryPortugalbulgaria
germanyPolandgreece
eu28slovenia
austrialatvia
francespain
netherlandsbelgium
denmarkestonia
lithuaniaiceland
swedencyprus
united Kingdomluxembourg
irelandfinlandnorway
switzerland
15
education and culture
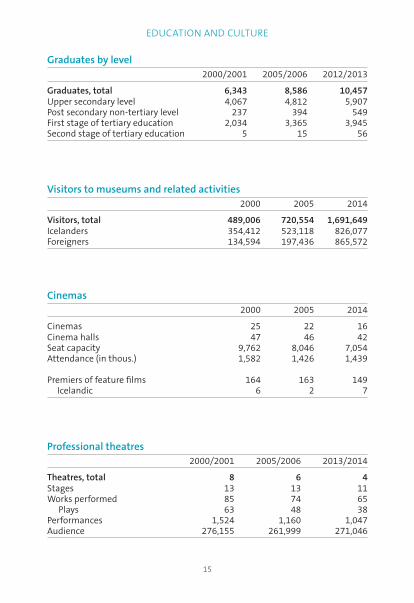
Graduates by level 2000/2001 2005/2006 2012/2013
Graduates, total 6,343 8,586 10,457Upper secondary level 4,067 4,812 5,907Post secondary non-tertiary level 237 394 549First stage of tertiary education 2,034 3,365 3,945Second stage of tertiary education 5 15 56
Visitors to museums and related activities2000 2005 2014
Visitors, total 489,006 720,554 1,691,649Icelanders 354,412 523,118 826,077Foreigners 134,594 197,436 865,572
Cinemas 2000 2005 2014
Cinemas 25 22 16Cinema halls 47 46 42Seat capacity 9,762 8,046 7,054Attendance (in thous.) 1,582 1,426 1,439
Premiers of feature films 164 163 149Icelandic 6 2 7
Professional theatres2000/2001 2005/2006 2013/2014
Theatres, total 8 6 4Stages 13 13 11Works performed 85 74 65
Plays 63 48 38Performances 1,524 1,160 1,047Audience 276,155 261,999 271,046
16
Prices
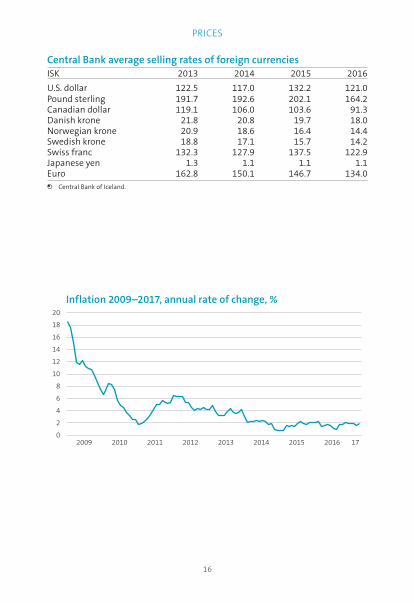
Inflation 2009–2017, annual rate of change, %
0
2
4
6
8
10
12
14
16
18
20
2009 2010 2011 2012 2013 2014 2015 2016 17
Central Bank average selling rates of foreign currenciesISK 2013 2014 2015 2016
U.S. dollar 122.5 117.0 132.2 121.0Pound sterling 191.7 192.6 202.1 164.2Canadian dollar 119.1 106.0 103.6 91.3Danish krone 21.8 20.8 19.7 18.0Norwegian krone 20.9 18.6 16.4 14.4Swedish krone 18.8 17.1 15.7 14.2Swiss franc 132.3 127.9 137.5 122.9Japanese yen 1.3 1.1 1.1 1.1Euro 162.8 150.1 146.7 134.0
; Central Bank of Iceland.
17
Prices
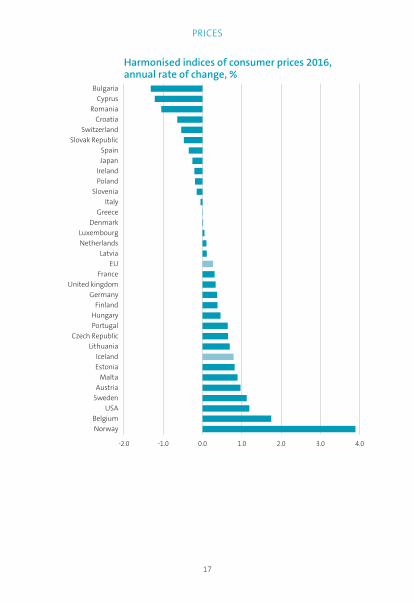
Harmonised indices of consumer prices 2016, annual rate of change, %
-2.0 -1.0 0.0 1.0 2.0 3.0 4.0
norwaybelgium
usaswedenaustria
maltaestoniaiceland
lithuaniaczech republic
PortugalHungary
finlandgermany
united kingdomfrance
eulatvia
netherlandsluxembourg
denmarkgreece
italyslovenia
Polandireland
Japanspain
slovak republicswitzerland
croatiaromania
cyprusbulgaria
18
national accounts
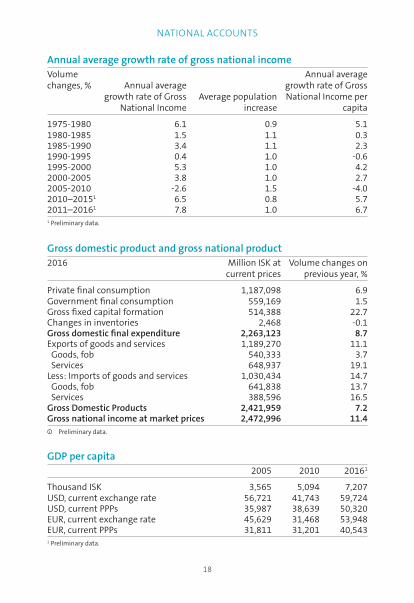
Annual average growth rate of gross national incomeVolume changes, % Annual average
growth rate of Gross National Income
Average population increase
Annual average growth rate of Gross National Income per
capita
1975-1980 6.1 0.9 5.11980-1985 1.5 1.1 0.31985-1990 3.4 1.1 2.31990-1995 0.4 1.0 -0.61995-2000 5.3 1.0 4.22000-2005 3.8 1.0 2.72005-2010 -2.6 1.5 -4.02010–20151 6.5 0.8 5.72011–20161 7.8 1.0 6.71 Preliminary data.
Gross domestic product and gross national product2016 Million ISK at
current pricesVolume changes on
previous year, %
Private final consumption 1,187,098 6.9Government final consumption 559,169 1.5Gross fixed capital formation 514,388 22.7Changes in inventories 2,468 -0.1Gross domestic final expenditure 2,263,123 8.7Exports of goods and services 1,189,270 11.1 Goods, fob 540,333 3.7 Services 648,937 19.1Less: Imports of goods and services 1,030,434 14.7 Goods, fob 641,838 13.7 Services 388,596 16.5Gross Domestic Products 2,421,959 7.2Gross national income at market prices 2,472,996 11.4
@ Preliminary data.
GDP per capita 2005 2010 20161
Thousand ISK 3,565 5,094 7,207USD, current exchange rate 56,721 41,743 59,724USD, current PPPs 35,987 38,639 50,320EUR, current exchange rate 45,629 31,468 53,948EUR, current PPPs 31,811 31,201 40,5431 Preliminary data.
19
national accounts
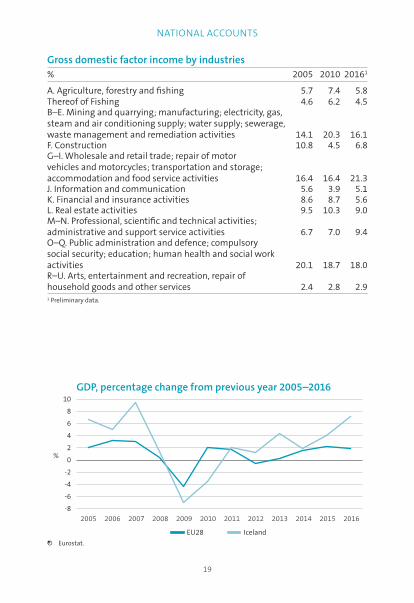
; Eurostat.
GDP, percentage change from previous year 2005–2016
%
EU28 Iceland
-6
-8
-4
-2
0
2
4
6
8
10
2005 2006 2007 2008 2009 2010 2011 2012 2013 2014 2015 2016
Gross domestic factor income by industries% 2005 2010 20161
A. Agriculture, forestry and fishing 5.7 7.4 5.8Thereof of Fishing 4.6 6.2 4.5B–E. Mining and quarrying; manufacturing; electricity, gas, steam and air conditioning supply; water supply; sewerage, waste management and remediation activities 14.1 20.3 16.1F. Construction 10.8 4.5 6.8G–I. Wholesale and retail trade; repair of motor vehicles and motorcycles; transportation and storage; accommodation and food service activities 16.4 16.4 21.3J. Information and communication 5.6 3.9 5.1K. Financial and insurance activities 8.6 8.7 5.6L. Real estate activities 9.5 10.3 9.0M–N. Professional, scientific and technical activities; administrative and support service activities 6.7 7.0 9.4O–Q. Public administration and defence; compulsory social security; education; human health and social work activities 20.1 18.7 18.0R–U. Arts, entertainment and recreation, repair of household goods and other services 2.4 2.8 2.91 Preliminary data.
20
Public finance
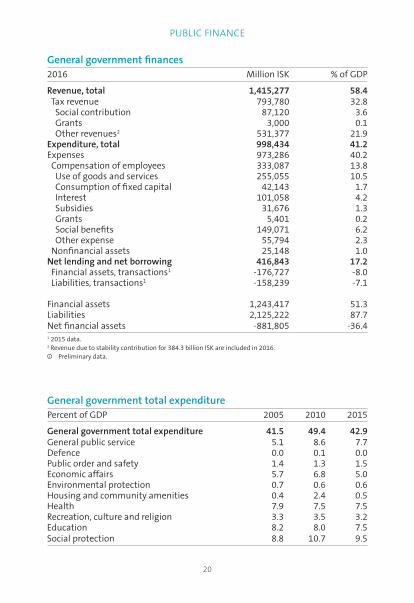
General government finances2016 Million ISK % of GDP
Revenue, total 1,415,277 58.4 Tax revenue 793,780 32.8 Social contribution 87,120 3.6 Grants 3,000 0.1 Other revenues2 531,377 21.9Expenditure, total 998,434 41.2Expenses 973,286 40.2 Compensation of employees 333,087 13.8 Use of goods and services 255,055 10.5 Consumption of fixed capital 42,143 1.7 Interest 101,058 4.2 Subsidies 31,676 1.3 Grants 5,401 0.2 Social benefits 149,071 6.2 Other expense 55,794 2.3 Nonfinancial assets 25,148 1.0Net lending and net borrowing 416,843 17.2 Financial assets, transactions1 -176,727 -8.0 Liabilities, transactions1 -158,239 -7.1
Financial assets 1,243,417 51.3Liabilities 2,125,222 87.7Net financial assets -881,805 -36.41 2015 data.2 Revenue due to stability contribution for 384.3 billion ISK are included in 2016.
@ Preliminary data.
General government total expenditure Percent of GDP 2005 2010 2015
General government total expenditure 41.5 49.4 42.9General public service 5.1 8.6 7.7Defence 0.0 0.1 0.0Public order and safety 1.4 1.3 1.5Economic affairs 5.7 6.8 5.0Environmental protection 0.7 0.6 0.6Housing and community amenities 0.4 2.4 0.5Health 7.9 7.5 7.5Recreation, culture and religion 3.3 3.5 3.2Education 8.2 8.0 7.5Social protection 8.8 10.7 9.5
21
external trade
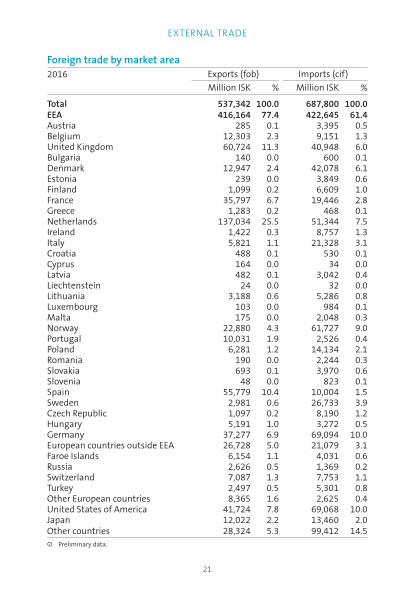
Foreign trade by market area2016 Exports (fob) Imports (cif)
Million ISK % Million ISK %
Total 537,342 100.0 687,800 100.0EEA 416,164 77.4 422,645 61.4Austria 285 0.1 3,395 0.5Belgium 12,303 2.3 9,151 1.3United Kingdom 60,724 11.3 40,948 6.0Bulgaria 140 0.0 600 0.1Denmark 12,947 2.4 42,078 6.1Estonia 239 0.0 3,849 0.6Finland 1,099 0.2 6,609 1.0France 35,797 6.7 19,446 2.8Greece 1,283 0.2 468 0.1Netherlands 137,034 25.5 51,344 7.5Ireland 1,422 0.3 8,757 1.3Italy 5,821 1.1 21,328 3.1Croatia 488 0.1 530 0.1Cyprus 164 0.0 34 0.0Latvia 482 0.1 3,042 0.4Liechtenstein 24 0.0 32 0.0Lithuania 3,188 0.6 5,286 0.8Luxembourg 103 0.0 984 0.1Malta 175 0.0 2,048 0.3Norway 22,880 4.3 61,727 9.0Portugal 10,031 1.9 2,526 0.4Poland 6,281 1.2 14,134 2.1Romania 190 0.0 2,244 0.3Slovakia 693 0.1 3,970 0.6Slovenia 48 0.0 823 0.1Spain 55,779 10.4 10,004 1.5Sweden 2,981 0.6 26,733 3.9Czech Republic 1,097 0.2 8,190 1.2Hungary 5,191 1.0 3,272 0.5Germany 37,277 6.9 69,094 10.0European countries outside EEA 26,728 5.0 21,079 3.1Faroe Islands 6,154 1.1 4,031 0.6Russia 2,626 0.5 1,369 0.2Switzerland 7,087 1.3 7,753 1.1Turkey 2,497 0.5 5,301 0.8Other European countries 8,365 1.6 2,625 0.4United States of America 41,724 7.8 69,068 10.0Japan 12,022 2.2 13,460 2.0Other countries 28,324 5.3 99,412 14.5
@ Preliminary data.
22
external trade
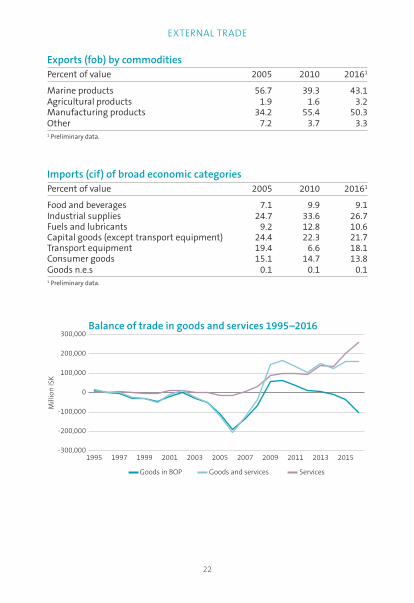
Balance of trade in goods and services 1995–2016
goods in boP servicesgoods and services
mill
ion
isK
-300,000
-200,000
-100,000
0
100,000
200,000
300,000
1995 1997 1999 2001 2003 2005 2007 2009 2011 2013 2015
Exports (fob) by commoditiesPercent of value 2005 2010 20161
Marine products 56.7 39.3 43.1Agricultural products 1.9 1.6 3.2Manufacturing products 34.2 55.4 50.3Other 7.2 3.7 3.31 Preliminary data.
Imports (cif) of broad economic categoriesPercent of value 2005 2010 20161
Food and beverages 7.1 9.9 9.1Industrial supplies 24.7 33.6 26.7Fuels and lubricants 9.2 12.8 10.6Capital goods (except transport equipment) 24.4 22.3 21.7Transport equipment 19.4 6.6 18.1Consumer goods 15.1 14.7 13.8Goods n.e.s 0.1 0.1 0.11 Preliminary data.

23
enterPrises and turnover
Completed dwellings 1992–2016
nu
mb
er
0
500
1,000
1,500
2,000
2,500
3,000
3,500
4,000
1992 1994 1996 1998 2000 2002 2004 2006 2008 2010 2012 2014 2016
Sold production% 2008 2015
Total value in million ISK 543,373 754,187
Manufacture of food products and beverages 42.9 49.8Manufacture of non-metallic mineral products 3.5 2.0Manufacture of basic metals 36.2 29.1Fabricated metal products 2.8 2.4Manufacture of machinery and equipment 2.5 3.0Other manufacturing 12.1 13.7
; Registers Iceland.

24
fisHeries
Value of catch 1994–2016
0
20,000
40,000
60,000
80,000
100,000
120,000
140,000
160,000
180,000
1,00
0,00
0 is
K
1994 1996 1998 2000 2002 2004 2006 2008 2010 2012 2014 2016
Fish catch by species2005 20161
Value ValueTonnes 1,000 ISK Tonnes 1,000 ISK
Total catch 1,668,927 67,920,065 1,067,357 133,021,225Cod 212,456 24,924,027 264,154 58,001,619Redfish 61,535 5,466,266 63,534 11,121,692Haddock 96,580 8,881,445 38,470 9,278,664Mackerel 363 9,236 169,860 10,896,711Capelin 594,632 5,030,553 90,254 2,708,585Saithe 67,736 3,086,148 49,615 8,476,521Greenland halibut 13,021 3,035,334 12,727 6,809,961Blue whiting 265,890 1,489,498 186,921 5,408,984Herring 102,967 1,988,124 67,490 3,758,601Shrimp 8,657 870,430 6,492 2,192,747Capelin roe 10,428 449,396 10,527 2,239,304Norwegian spring- spawning herring 161,693 5,161,064 49,855 2,825,135Ling 4,307 261,489 8,599 1,332,713Other 68,662 7,267,053 48,858 7,969,9881 Preliminary data.
25
fisHeries
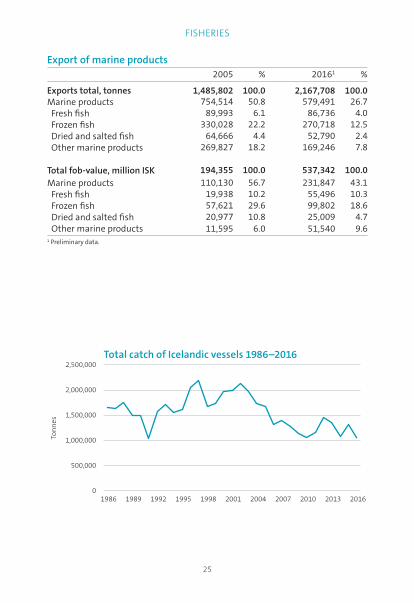
Total catch of Icelandic vessels 1986–2016
ton
nes
0
500,000
1,000,000
1,500,000
2,000,000
2,500,000
1986 1989 1992 1995 1998 2001 2004 2007 2010 2013 2016
Export of marine products2005 % 20161 %
Exports total, tonnes 1,485,802 100.0 2,167,708 100.0Marine products 754,514 50.8 579,491 26.7 Fresh fish 89,993 6.1 86,736 4.0 Frozen fish 330,028 22.2 270,718 12.5 Dried and salted fish 64,666 4.4 52,790 2.4 Other marine products 269,827 18.2 169,246 7.8
Total fob-value, million ISK 194,355 100.0 537,342 100.0Marine products 110,130 56.7 231,847 43.1 Fresh fish 19,938 10.2 55,496 10.3 Frozen fish 57,621 29.6 99,802 18.6 Dried and salted fish 20,977 10.8 25,009 4.7 Other marine products 11,595 6.0 51,540 9.61 Preliminary data.
26
agriculture
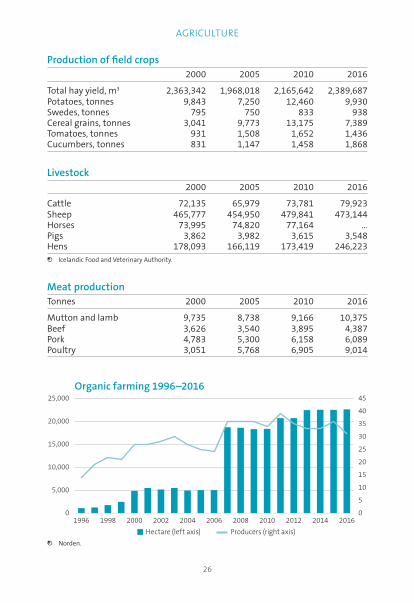
Production of field crops2000 2005 2010 2016
Total hay yield, m3 2,363,342 1,968,018 2,165,642 2,389,687Potatoes, tonnes 9,843 7,250 12,460 9,930Swedes, tonnes 795 750 833 938Cereal grains, tonnes 3,041 9,773 13,175 7,389Tomatoes, tonnes 931 1,508 1,652 1,436Cucumbers, tonnes 831 1,147 1,458 1,868
Livestock2000 2005 2010 2016
Cattle 72,135 65,979 73,781 79,923Sheep 465,777 454,950 479,841 473,144Horses 73,995 74,820 77,164 …Pigs 3,862 3,982 3,615 3,548Hens 178,093 166,119 173,419 246,223
; Icelandic Food and Veterinary Authority.
Meat productionTonnes 2000 2005 2010 2016
Mutton and lamb 9,735 8,738 9,166 10,375Beef 3,626 3,540 3,895 4,387Pork 4,783 5,300 6,158 6,089Poultry 3,051 5,768 6,905 9,014
Organic farming 1996–2016
Hectare (left axis) Producers (right axis)
0
5
10
15
20
25
30
35
40
45
0
5,000
10,000
15,000
20,000
25,000
1996 1998 2000 2002 2004 2006 2008 2010 2012 2014 2016
; Norden.
27
tourism
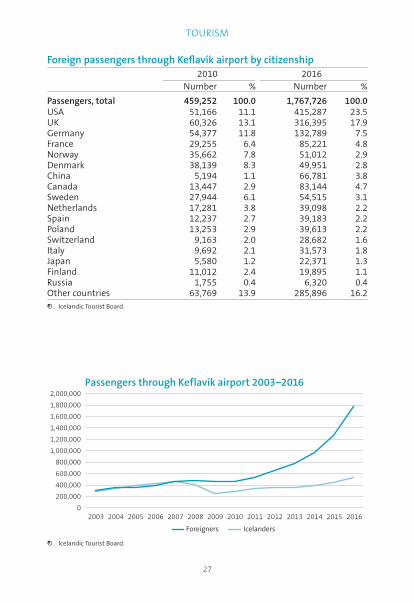
Passengers through Keflavík airport 2003–2016
IcelandersForeigners
0
200,000
400,000
600,000
800,000
1,000,000
1,200,000
1,400,000
1,600,000
1,800,000
2,000,000
2003 2004 2005 2006 2007 2008 2009 2010 2011 2012 2013 2014 2015 2016
; Icelandic Tourist Board.
Foreign passengers through Keflavík airport by citizenship2010 2016
Number % Number %
Passengers, total 459,252 100.0 1,767,726 100.0USA 51,166 11.1 415,287 23.5UK 60,326 13.1 316,395 17.9Germany 54,377 11.8 132,789 7.5France 29,255 6.4 85,221 4.8Norway 35,662 7.8 51,012 2.9Denmark 38,139 8.3 49,951 2.8China 5,194 1.1 66,781 3.8Canada 13,447 2.9 83,144 4.7Sweden 27,944 6.1 54,515 3.1Netherlands 17,281 3.8 39,098 2.2Spain 12,237 2.7 39,183 2.2Poland 13,253 2.9 39,613 2.2Switzerland 9,163 2.0 28,682 1.6Italy 9,692 2.1 31,573 1.8Japan 5,580 1.2 22,371 1.3Finland 11,012 2.4 19,895 1.1Russia 1,755 0.4 6,320 0.4Other countries 63,769 13.9 285,896 16.2
; Icelandic Tourist Board.
28
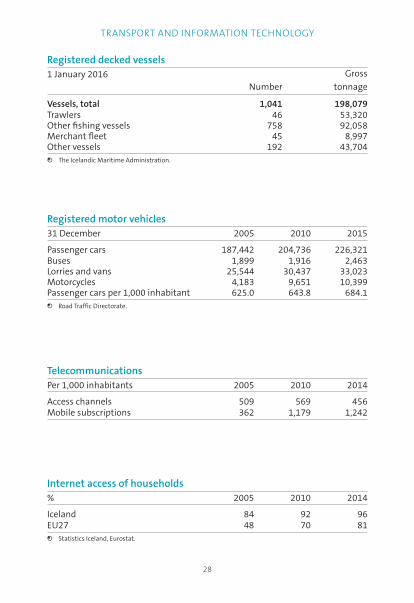
transPort and information tecHnology
Registered motor vehicles31 December 2005 2010 2015
Passenger cars 187,442 204,736 226,321Buses 1,899 1,916 2,463Lorries and vans 25,544 30,437 33,023Motorcycles 4,183 9,651 10,399Passenger cars per 1,000 inhabitant 625.0 643.8 684.1
; Road Traffic Directorate.
TelecommunicationsPer 1,000 inhabitants 2005 2010 2014
Access channels 509 569 456Mobile subscriptions 362 1,179 1,242
Internet access of households% 2005 2010 2014
Iceland 84 92 96EU27 48 70 81
; Statistics Iceland, Eurostat.
Registered decked vessels1 January 2016 Gross
Number tonnage
Vessels, total 1,041 198,079Trawlers 46 53,320Other fishing vessels 758 92,058Merchant fleet 45 8,997Other vessels 192 43,704
; The Icelandic Maritime Administration.
29
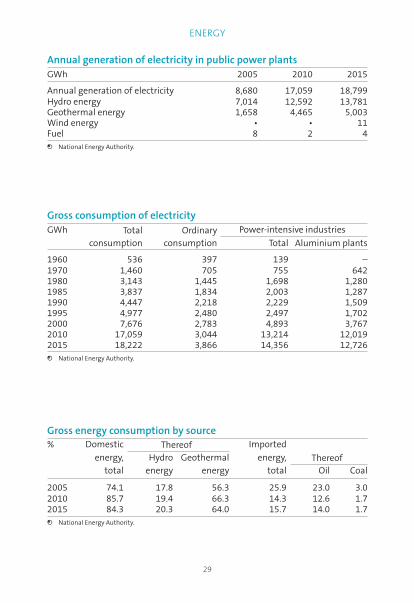
energy
Annual generation of electricity in public power plantsGWh 2005 2010 2015
Annual generation of electricity 8,680 17,059 18,799Hydro energy 7,014 12,592 13,781Geothermal energy 1,658 4,465 5,003Wind energy • • 11Fuel 8 2 4
; National Energy Authority.
Gross consumption of electricityGWh Total Ordinary Power-intensive industries
consumption consumption Total Aluminium plants
1960 536 397 139 –1970 1,460 705 755 6421980 3,143 1,445 1,698 1,2801985 3,837 1,834 2,003 1,2871990 4,447 2,218 2,229 1,5091995 4,977 2,480 2,497 1,7022000 7,676 2,783 4,893 3,7672010 17,059 3,044 13,214 12,0192015 18,222 3,866 14,356 12,726
; National Energy Authority.
Gross energy consumption by source% Domestic Thereof Imported
energy, Hydro Geothermal energy, Thereoftotal energy energy total Oil Coal
2005 74.1 17.8 56.3 25.9 23.0 3.02010 85.7 19.4 66.3 14.3 12.6 1.72015 84.3 20.3 64.0 15.7 14.0 1.7
; National Energy Authority.
30
energy
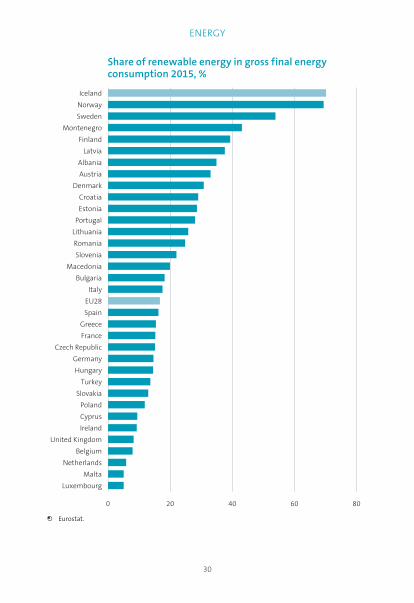
; Eurostat.
Share of renewable energy in gross final energy consumption 2015, %
0 20 40 60 80
luxembourg
malta
netherlands
belgium
united Kingdom
ireland
cyprus
Poland
slovakia
turkey
Hungary
germany
czech republic
france
greece
spain
eu28
italy
bulgaria
macedonia
slovenia
romania
lithuania
Portugal
estonia
croatia
denmark
austria
albania
latvia
finland
montenegro
sweden
norway
iceland
31
geograPHy and environment
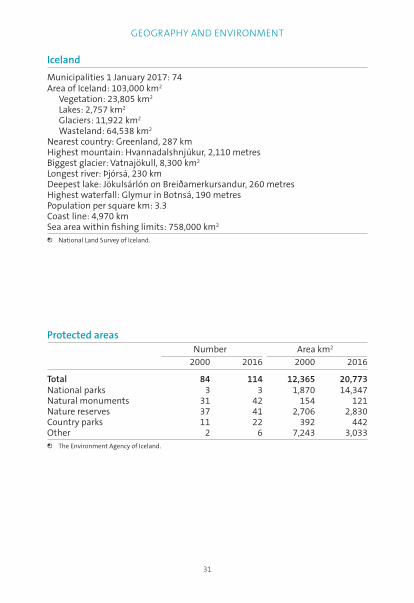
Iceland
Municipalities 1 January 2017: 74Area of Iceland: 103,000 km2
Vegetation: 23,805 km2
Lakes: 2,757 km2
Glaciers: 11,922 km2
Wasteland: 64,538 km2
Nearest country: Greenland, 287 kmHighest mountain: Hvannadalshnjúkur, 2,110 metresBiggest glacier: Vatnajökull, 8,300 km2
Longest river: Þjórsá, 230 kmDeepest lake: Jökulsárlón on Breiðamerkursandur, 260 metresHighest waterfall: Glymur in Botnsá, 190 metresPopulation per square km: 3.3Coast line: 4,970 kmSea area within fishing limits: 758,000 km2
; National Land Survey of Iceland.
Protected areasNumber Area km2
2000 2016 2000 2016
Total 84 114 12,365 20,773National parks 3 3 1,870 14,347Natural monuments 31 42 154 121Nature reserves 37 41 2,706 2,830Country parks 11 22 392 442Other 2 6 7,243 3,033
; The Environment Agency of Iceland.
32
geograPHy and environment
; The Environment Agency of Iceland.
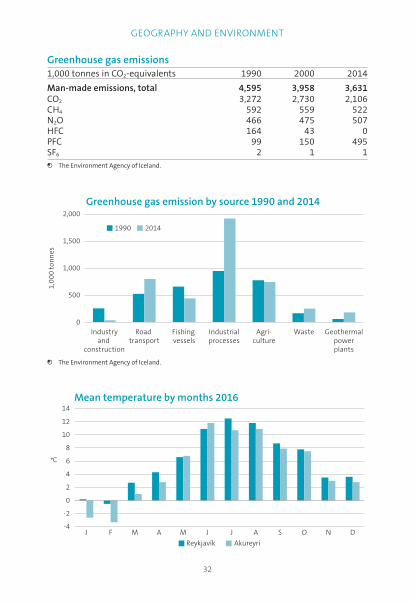
Greenhouse gas emissions1,000 tonnes in CO2-equivalents 1990 2000 2014
Man-made emissions, total 4,595 3,958 3,631CO2 3,272 2,730 2,106CH4 592 559 522N2O 466 475 507HFC 164 43 0PFC 99 150 495SF6 2 1 1
; The Environment Agency of Iceland.
Greenhouse gas emission by source 1990 and 2014
industryand
construction
road transport
fishing vessels
industrialprocesses
agri-culture
Waste geothermalpowerplants
1,0
00
ton
nes
1990 2014
0
500
1,000
1,500
2,000
Mean temperature by months 2016
-4
-2
0
2
4
6
8
10
12
14
J f m a m J J a s o n d
reykjavík akureyri
°c

9789979
770572
��������
����
����
����
��
Iceland in your pocketWhile enjoying the beautiful nature of Iceland, learn the basic statistical information on the Icelandic society, population, climate, environ-ment, labour market and industries, external trade, transport, tourism, prices, wage, private income, national accounts, health, social services, education, culture, elections, etc.
Iceland in figures 2017 is the 22nd volume of the popular pocket-size booklet edited and published annually by the national statistical office, Statistics Iceland.