Screen time and physical activity in children and ...
14
RESEARCH ARTICLE Screen time and physical activity in children and adolescents aged 10–15 years Anna Dahlgren 1☯ , Linnea Sjo ¨ blom 1☯ , Hele ´ n Eke 1 , Stephanie E. Bonn 1 , Ylva Trolle Lagerros ID 1,2 * 1 Clinical Epidemiology Division, Department of Medicine (Solna), Karolinska Institutet, Stockholm, Sweden, 2 Center for Obesity, Academic Specialist Center, Stockholm Health Services, Stockholm, Sweden ☯ These authors contributed equally to this work. * [email protected] Abstract Background Previous research studies have demonstrated a relationship between low levels of physical activity and high amounts of screen time in children and adolescents. However, this is usu- ally based on self-reported data. Therefore, the aim of this cross-sectional study was to investigate the association between objectively measured smartphone screen time and physical activity among children and adolescents aged 10–15 years. Methods During seven consecutive days, we objectively assessed smartphone screen time, using the SCRIIN smartphone application, and physical activity, using the SCRIIN activity tracker, in children and adolescents recruited from two schools in Stockholm County, Sweden. Moreover, the children/adolescents and their parents responded to a questionnaire, obtain- ing among other things: self-reported screen time, physical activity, sleep and health-related quality of life. Results A total of 121 children and adolescents (mean age: 12.1 ± 1.5) were included in the study. Objectively measured smartphone screen time was 161.2 ± 81.1 min/day. Mean physical activity, measured with the SCRIIN activity tracker, was 32.6 ± 16.5 active min/day. Minutes of screen time and physical activity did not differ between the children and adolescents from the two schools, despite located in different socioeconomic areas. Further, we found no association between smartphone screen time and physical activity. However, girls aged 14– 15 years, had more smartphone screen time (p<0.01) and were significantly more physically active (p<0.01) than girls aged 10–12 years. In addition, boys reported more than five times more time spent on computer and video games than girls did. PLOS ONE PLOS ONE | https://doi.org/10.1371/journal.pone.0254255 July 9, 2021 1 / 14 a1111111111 a1111111111 a1111111111 a1111111111 a1111111111 OPEN ACCESS Citation: Dahlgren A, Sjo ¨blom L, Eke H, Bonn SE, Trolle Lagerros Y (2021) Screen time and physical activity in children and adolescents aged 10–15 years. PLoS ONE 16(7): e0254255. https://doi.org/ 10.1371/journal.pone.0254255 Editor: Martin Senechal, University of New Brunswick, CANADA Received: September 20, 2020 Accepted: June 23, 2021 Published: July 9, 2021 Copyright: © 2021 Dahlgren et al. This is an open access article distributed under the terms of the Creative Commons Attribution License, which permits unrestricted use, distribution, and reproduction in any medium, provided the original author and source are credited. Data Availability Statement: Data cannot be shared publicly according to the regulations of the The Swedish Ethical Review Authority. Data are available upon request to Dr. Michel Fored (contact via [email protected]) of the Department of Medicine at the Karolinska Institutet for researchers who meet the criteria for access to confidential data. The codebook containing all the variable names, description/questionnaire questions, and value descriptions for the two questionnaires used is available as a Supporting information file.
Transcript of Screen time and physical activity in children and ...

RESEARCH ARTICLE
Screen time and physical activity in children
and adolescents aged 10–15 years
Anna Dahlgren1☯, Linnea Sjoblom1☯, Helen Eke1, Stephanie E. Bonn1, Ylva Trolle
LagerrosID1,2*
1 Clinical Epidemiology Division, Department of Medicine (Solna), Karolinska Institutet, Stockholm, Sweden,
2 Center for Obesity, Academic Specialist Center, Stockholm Health Services, Stockholm, Sweden
☯ These authors contributed equally to this work.
Abstract
Background
Previous research studies have demonstrated a relationship between low levels of physical
activity and high amounts of screen time in children and adolescents. However, this is usu-
ally based on self-reported data. Therefore, the aim of this cross-sectional study was to
investigate the association between objectively measured smartphone screen time and
physical activity among children and adolescents aged 10–15 years.
Methods
During seven consecutive days, we objectively assessed smartphone screen time, using
the SCRIIN smartphone application, and physical activity, using the SCRIIN activity tracker,
in children and adolescents recruited from two schools in Stockholm County, Sweden.
Moreover, the children/adolescents and their parents responded to a questionnaire, obtain-
ing among other things: self-reported screen time, physical activity, sleep and health-related
quality of life.
Results
A total of 121 children and adolescents (mean age: 12.1 ± 1.5) were included in the study.
Objectively measured smartphone screen time was 161.2 ± 81.1 min/day. Mean physical
activity, measured with the SCRIIN activity tracker, was 32.6 ± 16.5 active min/day. Minutes
of screen time and physical activity did not differ between the children and adolescents from
the two schools, despite located in different socioeconomic areas. Further, we found no
association between smartphone screen time and physical activity. However, girls aged 14–
15 years, had more smartphone screen time (p<0.01) and were significantly more physically
active (p<0.01) than girls aged 10–12 years. In addition, boys reported more than five times
more time spent on computer and video games than girls did.
PLOS ONE
PLOS ONE | https://doi.org/10.1371/journal.pone.0254255 July 9, 2021 1 / 14
a1111111111
a1111111111
a1111111111
a1111111111
a1111111111
OPEN ACCESS
Citation: Dahlgren A, Sjoblom L, Eke H, Bonn SE,
Trolle Lagerros Y (2021) Screen time and physical
activity in children and adolescents aged 10–15
years. PLoS ONE 16(7): e0254255. https://doi.org/
10.1371/journal.pone.0254255
Editor: Martin Senechal, University of New
Brunswick, CANADA
Received: September 20, 2020
Accepted: June 23, 2021
Published: July 9, 2021
Copyright: © 2021 Dahlgren et al. This is an open
access article distributed under the terms of the
Creative Commons Attribution License, which
permits unrestricted use, distribution, and
reproduction in any medium, provided the original
author and source are credited.
Data Availability Statement: Data cannot be
shared publicly according to the regulations of the
The Swedish Ethical Review Authority. Data are
available upon request to Dr. Michel Fored (contact
via [email protected]) of the Department of
Medicine at the Karolinska Institutet for
researchers who meet the criteria for access to
confidential data. The codebook containing all the
variable names, description/questionnaire
questions, and value descriptions for the two
questionnaires used is available as a Supporting
information file.

Conclusion
Smartphone screen time was not associated with physical activity level among children and
adolescents aged 10–15 years.
Introduction
Regular physical activity reduces the risk of childhood and adolescence overweight and obe-
sity, and future associated chronic diseases [1]. However, results from a recent report indicated
that children and adolescents in Sweden spend most of their time being inactive. Among 11
year-olds, only 14% of the girls and 23% of the boys reached the daily recommendation of at
least 60 minutes of moderate-to-vigorous physical activity (MVPA). Additionally, the time
spent being physically active seems to decrease with age. Only 9–15% of adolescents aged 13–
15 years reached the recommendation [2]. At the same time, the amount of screen time in this
population is high: 30% of 11-year-olds reported a screen time of more than 4 hours per day,
while the corresponding number for 15-year-olds was 51% [3]. Generally, screen time was
higher in boys than in girls.
High amounts of screen-based sedentary behaviours, along with insufficient physical activ-
ity, are associated with a large range of physical and psychological disorders, which may affect
health and wellbeing negatively [4]. These behaviours are considered increasing public health
concerns, especially in children, as prolonged screen time and low levels of physical activity
are suggested as unhealthy behaviours that may persist into adulthood [5]. Additionally, previ-
ous studies have reported significant associations between more screen time and lower levels
of physical activity [6,7] in children and adolescents, indicating that sedentary screen time is
likely spent at the expense of other healthy activities.
In order to measure physical activity and screen time, reliable assessments are needed. Both
accelerometers and questionnaires have been widely used to measure level of physical activity.
However, questionnaires commonly overestimate active time and underestimate sedentary
behaviours [8]. Methods for measuring screen time are limited, and studies using objective
measures capturing real-time use of screen devices are scarce. A previous study among univer-
sity students, objectively tracked daily minutes of screen time using a smartphone application
[9]. Similarly, a cross-sectional study in adults also measured smartphone screen time continu-
ously via an application [10]. Nevertheless, as far as we know, only questionnaires have been
used to assess amount of screen time among children and adolescents.
The extensive use of screen devices has led to an increased interest in using new technolo-
gies such as smartphone applications in research studies, for example to investigate different
behaviours. Therefore, in this study, we evaluated the association between smartphone screen
time, objectively measured with a smartphone application, and objectively measured physical
activity among children and adolescents aged 10–15 years. Our hypothesis was that children
and adolescents with lower smartphone screen time would be more physically active.
Materials and methods
Study design
The Swedish SCRIIN-study is a school based cross-sectional study. The recruitment to the
study took place in April 2019 in two schools in the Stockholm County of Sweden. The study
PLOS ONE Screen time and physical activity in children and adolescents
PLOS ONE | https://doi.org/10.1371/journal.pone.0254255 July 9, 2021 2 / 14
Funding: The non-profit Swedish organization
SCRIIN (www.scriin.com) provided the study with
the SCRIIN smartphone application and SCRIIN
activity tracker. The funders had no role in study
design, data collection and analysis, decision to
publish, or preparation of the manuscript.
Competing interests: I have read the journal’s
policy and the authors of this manuscript have the
following competing interests: funding of the
SCRIIN smartphone application and SCRIIN
activity tracker by the organization SCRIIN. This
does not alter our adherence to PLOS ONE policies
on sharing data and materials.

was approved by the Swedish Ethical Review Authority (Dnr: 2019–01336) and the research
was conducted at Karolinska Institutet.
Inclusion criteria
Inclusion criteria were: being a pupil in fifth (10–12 years) or eighth (14–15 years) grade in
one of the two participating schools, having access to a smartphone, giving informed consent
and having parents or caretakers both giving informed consent for their child/adolescent to
participate in the study and, if in fifth grade, to download the Swedish SCRIIN smartphone
application.
Exclusion criteria
No specific exclusion criteria applied.
Recruitment
Information about the study was disseminated via the Swedish Facebook group “Physical
activity for Health and Learning”. Teachers interested to take part with their classes were
encouraged to get in touch through email. We were contacted by several teachers, but chose to
collaborate with two physical education teachers from two schools situated in socioeconomi-
cally different areas of Stockholm. Demographic details of the municipalities for the schools
included in this study can be found in supporting information, S1 Table.
We invited the children and adolescents from their ten classes, four fifth grade and six
eighth grade classes, to participate in the study. Parents of children and adolescents in fifth and
eighth grade received oral and written information about the study, both through a meeting in
the school and through the ordinary weekly newsletters from the school. An email including a
link to a web-questionnaire was sent to the parents. After an introductory screen displaying
information about the study, parents’ consented to participate together with their child or ado-
lescent, either electronically or in writing, and were thereafter offered to respond to the paren-
tal questionnaire (see supporting information, S2 Table). Once both parents had provided
written informed consent, the child/adolescent was eligible to enter the study. The children
and adolescents got oral and written information about the study in school. They too gave
their written informed consent after reading information about the study, before responding
to their web-questionnaire (see supporting information, S3 Table). Children/adolescents and
parents were informed that participation in the study was voluntary and that they could with-
draw their consent at any time.
Study assessments
Participant characteristics were collected from the children/adolescents and parents with ques-
tions about their age and gender, and parents were in addition asked about their level of educa-
tion. The Kid- and Kiddo-KINDL–health-related quality of life questionnaire was used to
assess how the child/adolescent perceived physical- and emotional well-being, self-esteem,
family life, friends and everyday functioning in school [11]. The validated Sedentary Behaviour
Questionnaire (SBQ) was used to collect data about screen time and sedentary time among
both children/adolescents and parents [12]. Physical activity level, body weight and height
were also included in both questionnaires. Body weight and height were used to calculate Body
Mass Index (BMI, kg/m2). When classifying BMI in the children/adolescents, the international
classification system for childhood obesity (isoBMI) recommended by the International Obe-
sity Task Force was used [13].
PLOS ONE Screen time and physical activity in children and adolescents
PLOS ONE | https://doi.org/10.1371/journal.pone.0254255 July 9, 2021 3 / 14

The SCRIIN smartphone application automatically recorded screen time. Screen time was
defined as any time when the smartphone screen was on and unlocked. Therefore, the children
and adolescents were asked to ensure that the automatic screen lock was activated and set to
30 seconds to make the recorded data as accurate as possible.
The children and adolescents wore the SCRIIN activity tracker on the hip during waking
hours for seven consecutive days. The tracker used an accelerometer-based technology that
converted acceleration into steps and active minutes. An active minute was recorded when
MVPA was reached throughout the minute, which was defined as at least 80 steps per minute.
Minutes that were not classified as active were defined as light activity/inactive time.
In our initial validation tests of the SCRIIN activity tracker, we found that the commonly
used 100 steps per minute threshold underestimated MVPA. Therefore, we chose a lower
threshold, 80 steps per minute. Since this was an arbitrary number, we decided to conduct a
validation study of the SCRIIN activity tracker against an accelerometer, the ActiGraph
wGT3x-BT.
The information about smartphone screen time, active and light activity/inactive time was
not displayed in the application during the time of measurement. Furthermore, as the SCRIIN
activity tracker stored the physical activity data and automatically connected to the application
via Bluetooth when the smartphone was nearby, the smartphone did not have to be carried
around at all times. A minimum of three days using the SCRIIN application and/or SCRIIN
activity tracker was required to be included in the data analysis.
The SCRIIN activity tracker is publicly available (www.sportamore.com). The SCRIIN
smartphone application can be downloaded via AppStore or Google Play and is compatible
with both iOS (version 8 and higher) and Android (version 4.1 and higher).
Validation of the Swedish SCRIIN activity tracker against ActiGraph
wGT3x-BT
In order to validate the SCRIIN activity tracker, the triaxial accelerometer ActiGraph wGT3x-
BT (www.actigraphcorp.com), was given to a sub-sample of children in fifth grade. Partici-
pants carried both the accelerometer and the SCRIIN activity tracker for 5.5 hours (330 min-
utes) during a school day, either between 8:00 am to 1:30 pm or 9:00 am to 2:30 pm. The
accelerometer was worn on the hip, collecting data at the frequency of 80 Hz. The validation
included 35 participants, whom had data from both the accelerometer and the SCRIIN activity
tracker. Analysis of data was performed in ActiLife, version 6.13.3, where the three axes were
calculated to a vector magnitude and summarized as counts per minute (cpm). The cut-point
for MVPA was applied as suggested by Hanggi et al. [14], which is recommended for children/
adolescents in this age group in the review by Migueles et al. [15]. An epoch length of 60 sec-
onds and normal filter was used. Non-wear time was defined as 20 consecutive minutes with 0
cpm [16].
Statistical analysis of data
In total, data from 121 children/adolescents and 88 parents were included in the analyses.
Descriptive statistics were summarized to describe participant characteristics, and is presented
as mean and standard deviation (SD) for continuous variables and as number (n) and percent-
age (%) for categorical variables. Differences in characteristics when stratified by gender and
age, were examined using independent t-tests and chi-square tests for continuous and categor-
ical variables, respectively. Spearman’s rank correlation tests were conducted for evaluating
the association between physical activity and screen time among children and adolescents.
Objectively measured smartphone screen time from the SCRIIN application and self-reported
PLOS ONE Screen time and physical activity in children and adolescents
PLOS ONE | https://doi.org/10.1371/journal.pone.0254255 July 9, 2021 4 / 14

smartphone/tablet screen time from the questionnaire was compared using a paired t-test and
Bland-Altman analysis. When validating the SCRIIN activity tracker against the accelerometer,
a paired t-test, Spearman’s rank correlation test, and Bland-Altman analysis were used. All
reported p-values were two-sided and p-values <0.05 were considered statistically significant.
The statistical analyses of data were performed in STATA, version 15.1.
Results
Study characteristics of all children and adolescents included in the study are presented in
Table 1. The average isoBMI was 19.4 ± 3.9 kg/m2. The distribution in isoBMI categories dif-
fered between the two schools. The proportion of overweight and obesity was significantly
higher in the school located in the area with low socioeconomic status, where the rate of over-
weight and obesity was 31.0% compared to 6.0% in the school with high socioeconomic status.
In Table 2, parental characteristics are presented. The mean age of the parents was
45.4 ± 5.7 years and the mean BMI was 25.4 ± 3.6 kg/m2. In the school situated in the area with
low socioeconomic status, the percentage of overweight and obesity was also higher among the
parents. The frequency of overweight and obesity in parents was 45.9% and 22.6%, respec-
tively. Additionally, the level of education was significantly lower among parents in the area
with low socioeconomic status, where 15.0% had elementary school as the highest completed
education. The proportion of individuals born outside the Nordic countries or outside Europe
Table 1. Characteristics of the children and adolescents, all and stratified by grade and sex.
Fifth grade Eighth grade
All Boys Girls Boys Girls
(n = 121) (n = 40) (n = 38) (n = 27) (n = 16)
Mean ± SD Mean ± SD Mean ± SD Mean ± SD Mean ± SD
Age (years) 12.1 ± 1.5 11.0 ± 0.2 11.0 ± 0.2 14.0 ± 0.0 14.1 ± 0.3
isoBMI (kg/m2) 19.4 ± 3.9a 18.6 ± 3.8b 19.2 ± 4.3c 19.7 ± 3.6d 21.6 ± 3.0e
isoBMI category n (%) n (%) n (%) n (%) n (%)
Normal weight 76 (82.6) 25 (83.3) 22 (81.5) 19 (82.6) 10 (83.3)
Overweight 10 (10.9) 3 (10.0) 2 (7.4) 3 (13.0) 2 (16.7)
Obese 6 (6.5) 2 (6.7) 3 (11.1) 1 (4.4) 0 (0.0)
Kid- and Kiddo KINDL HRQoL Mean ± SD Mean ± SD Mean ± SD Mean ± SD Mean ± SD
Physical well-being 31.3 ± 10.9 30.9 ± 11.2 33.8 ± 11.5 26.7 ± 9.3 33.6 ± 9.4
Emotional well-being 32.6 ± 8.6 32.7 ± 7.5 34.5 ± 8.4 30.0 ± 10.3 32.0 ± 8.5
Self-esteem 62.2 ± 23.5 57.1 ± 24.3 59.5 ± 21.0 70.9 ± 24.0 66.4 ± 23.4
Family 47.5 ± 9.4 45.6 ± 11.9 47.1 ± 7.9 48.6 ± 7.4 51.2 ± 8.0
Friends 60.9 ± 14.2 56.3 ± 18.2 62.5 ± 11.1 63.7 ± 10.8 63.3 ± 13.5
Everyday functioning in school 42.9 ±13.2 37.3 ± 14.8 44.4 ± 9.5 48.1 ± 13.1 44.1 ± 13.2
Sleep
Wake up time (hh:mm) 06:36 ± 00:28 06:38 ± 00:31 06:27 ± 00:26 06:46 ± 00:28 06:34 ± 00:19
Bed time (hh:mm) 21:54 ± 00:47 21:43 ± 00:46 21:28 ± 00:32 22:25 ± 00:43 22:26 ± 00:41
Sleep time (h) 8.7 ± 0.81 8.9 ± 0.9 9.0 ± 0.6 8.3 ± 0.6 8.1 ± 0.8
BMI = Body Mass Index, HRQoL = Health-related quality of life.an = 92,bn = 30,cn = 19,dn = 23,en = 12.
https://doi.org/10.1371/journal.pone.0254255.t001
PLOS ONE Screen time and physical activity in children and adolescents
PLOS ONE | https://doi.org/10.1371/journal.pone.0254255 July 9, 2021 5 / 14
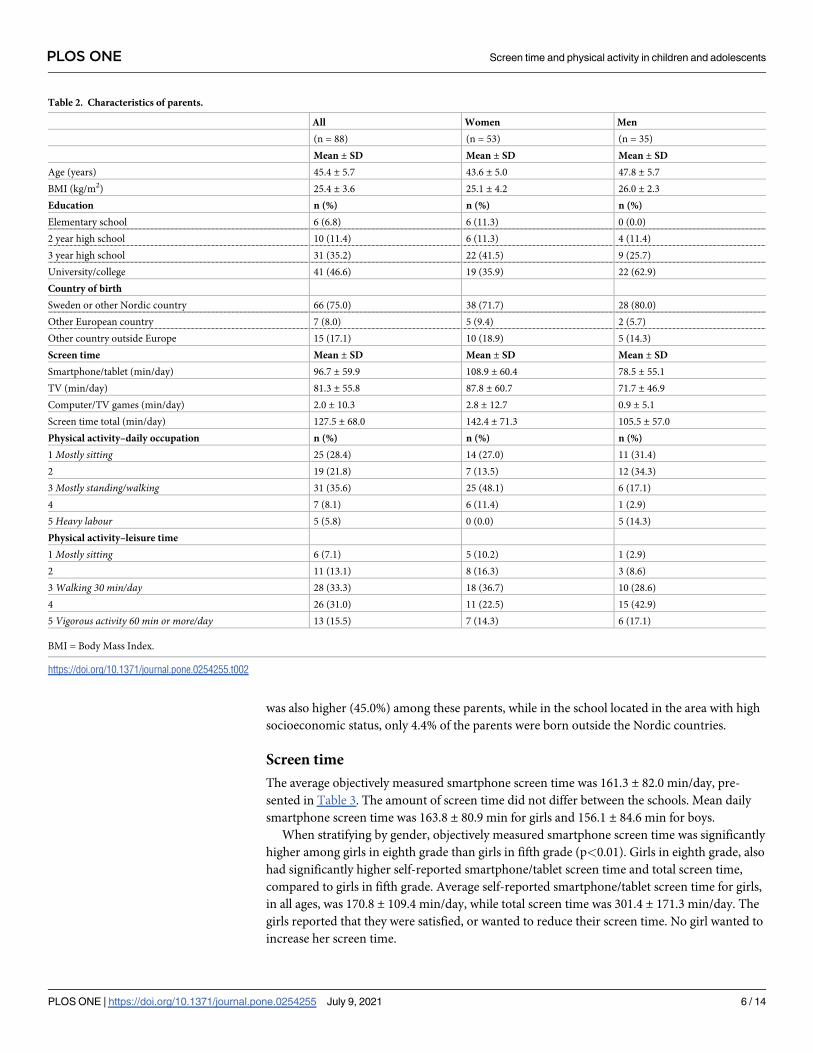
was also higher (45.0%) among these parents, while in the school located in the area with high
socioeconomic status, only 4.4% of the parents were born outside the Nordic countries.
Screen time
The average objectively measured smartphone screen time was 161.3 ± 82.0 min/day, pre-
sented in Table 3. The amount of screen time did not differ between the schools. Mean daily
smartphone screen time was 163.8 ± 80.9 min for girls and 156.1 ± 84.6 min for boys.
When stratifying by gender, objectively measured smartphone screen time was significantly
higher among girls in eighth grade than girls in fifth grade (p<0.01). Girls in eighth grade, also
had significantly higher self-reported smartphone/tablet screen time and total screen time,
compared to girls in fifth grade. Average self-reported smartphone/tablet screen time for girls,
in all ages, was 170.8 ± 109.4 min/day, while total screen time was 301.4 ± 171.3 min/day. The
girls reported that they were satisfied, or wanted to reduce their screen time. No girl wanted to
increase her screen time.
Table 2. Characteristics of parents.
All Women Men
(n = 88) (n = 53) (n = 35)
Mean ± SD Mean ± SD Mean ± SD
Age (years) 45.4 ± 5.7 43.6 ± 5.0 47.8 ± 5.7
BMI (kg/m2) 25.4 ± 3.6 25.1 ± 4.2 26.0 ± 2.3
Education n (%) n (%) n (%)
Elementary school 6 (6.8) 6 (11.3) 0 (0.0)
2 year high school 10 (11.4) 6 (11.3) 4 (11.4)
3 year high school 31 (35.2) 22 (41.5) 9 (25.7)
University/college 41 (46.6) 19 (35.9) 22 (62.9)
Country of birth
Sweden or other Nordic country 66 (75.0) 38 (71.7) 28 (80.0)
Other European country 7 (8.0) 5 (9.4) 2 (5.7)
Other country outside Europe 15 (17.1) 10 (18.9) 5 (14.3)
Screen time Mean ± SD Mean ± SD Mean ± SD
Smartphone/tablet (min/day) 96.7 ± 59.9 108.9 ± 60.4 78.5 ± 55.1
TV (min/day) 81.3 ± 55.8 87.8 ± 60.7 71.7 ± 46.9
Computer/TV games (min/day) 2.0 ± 10.3 2.8 ± 12.7 0.9 ± 5.1
Screen time total (min/day) 127.5 ± 68.0 142.4 ± 71.3 105.5 ± 57.0
Physical activity–daily occupation n (%) n (%) n (%)
1 Mostly sitting 25 (28.4) 14 (27.0) 11 (31.4)
2 19 (21.8) 7 (13.5) 12 (34.3)
3 Mostly standing/walking 31 (35.6) 25 (48.1) 6 (17.1)
4 7 (8.1) 6 (11.4) 1 (2.9)
5 Heavy labour 5 (5.8) 0 (0.0) 5 (14.3)
Physical activity–leisure time
1 Mostly sitting 6 (7.1) 5 (10.2) 1 (2.9)
2 11 (13.1) 8 (16.3) 3 (8.6)
3 Walking 30 min/day 28 (33.3) 18 (36.7) 10 (28.6)
4 26 (31.0) 11 (22.5) 15 (42.9)
5 Vigorous activity 60 min or more/day 13 (15.5) 7 (14.3) 6 (17.1)
BMI = Body Mass Index.
https://doi.org/10.1371/journal.pone.0254255.t002
PLOS ONE Screen time and physical activity in children and adolescents
PLOS ONE | https://doi.org/10.1371/journal.pone.0254255 July 9, 2021 6 / 14

The mean self-reported smartphone/tablet screen time for boys in all ages was 132.0 ± 94.9
min/day and total screen time was 398.0 ± 210.5 min/day. No statistical difference was shown
between boys in different ages regarding screen time. However, the amount of time spent on
computer and video games differed significantly between genders, where boys reported
148.3 ± 119.7 min/day and girls 27.8 ± 58.2 min/day. In contrast to the girls, boys reported
that they wanted more screen time.
Among parents, mean self-reported smartphone/tablet screen time was 96.7 ± 59.9 min/
day and total screen time was 127.5 ± 68.0 min/day. Both smartphone/tablet screen time and
total screen time differed significantly between the genders. For example, women reported
108.9 ± 60.4 min/day of smartphone/tablet screen time, while men reported 78.5 ± 55.1 min/
day. The amount of parental screen time was not correlated with the amount of screen time in
children and adolescents (r = 0.04, p = 0.70).
Objectively measured vs self-reported smartphone screen time
A Bland-Altman plot visualizes the comparison between objectively measured smartphone
screen time with SCRIIN application and self-reported smartphone/tablet screen time from
questionnaire (Fig 1). Even though the measurement methods do not differ significantly on
group level, there are large variations on individual level.
Physical activity
As outlined in Table 4, 77 children and adolescents had data from the SCRIIN activity tracker,
and 119 children and adolescents had self-reported questionnaire data. Average physical activ-
ity, measured with SCRIIN activity tracker, was 32.6 ± 16.5 active min/day. Mean physical
activity time was 33.2 ± 14.1 active min/day for girls and 31.9 ± 18.6 active min/day for boys.
The amount of physical activity was significantly higher in girls in eighth grade, compared to
girls in fifth grade (p<0.01). No difference was found regarding minutes of physical activity
between the schools.
According to self-reported data, mean total physical activity of MVPA was 112.5 ± 51.3
min/day for girls and 93.0 ± 46.9 min/day for boys. Total daily physical activity and physical
Table 3. Screen time from SCRIIN application and questionnaire, all and stratified by grade and sex.
All Fifth grade Eighth grade
Boys Girls Boys Girls
(n = 83) (n = 18) (n = 31) (n = 20) (n = 9)
SCRIIN application Mean ± SD Mean ± SD Mean ± SD p-value Mean ± SD Mean ± SD p-value
Smartphone (min/day) 161.3 ± 82.0 164.8 ± 66.1 146.3 ± 76.0 0.39 148.3 ± 99.4 224.3 ± 70.2 0.08
(n = 117) (n = 38) (n = 37) (n = 26) (n = 16)
Questionnaire Mean ± SD Mean ± SD Mean ± SD Mean ± SD Mean ± SD
Smartphone/tablet (min/day) 149.6 ± 103.1 130.1 ± 90.7 144.0 ± 101.1 0.53 134.6 ± 102.4 232.9 ± 105.2 <0.01
TV (min/day) 111.0 ± 79.6 110.5 ± 92.1 96.0 ± 70.8 0.45 128.8 ± 72.4 118.4 ± 78.4 0.68
Computer/video games (min/day) 93.7 ± 113.7 165.3 ± 126.4 31.8 ± 63.7 <0.0001 123.4 ± 106.7 18.5 ± 43.3 <0.001
Screen time total (min/day) 354 ± 198.9 406.0 ± 235.9 271.8 ± 177.2 <0.01 386.4 ± 170.6 369.8 ± 138.7 0.75
Opinions about screen time n (%) n (%) n (%) n (%) n (%)
Want to reduce my screen time 48 (44.0) 9 (25.7) 21 (58.3) <0.01 9 (37.5) 9 (64.3) 0.24
Satisfied with my screen time 55 (50.5) 21 (60.0) 15 (48.7) 14 (58.3) 5 (35.7)
Want more screen time 6 (5.5) 5 (14.3) 0 (0.0) 1 (4.2) 0 (0.0)
https://doi.org/10.1371/journal.pone.0254255.t003
PLOS ONE Screen time and physical activity in children and adolescents
PLOS ONE | https://doi.org/10.1371/journal.pone.0254255 July 9, 2021 7 / 14

activity levels during evenings and weekends were significantly higher among girls in fifth
grade, compared to boys of the same age. A high proportion of the children and adolescents
responded that they wanted to be more physically active, as many as 74.0% of the girls and
61.7% of the boys.
Fig 1. Bland-Altman plot. Comparing smartphone screen time measured with SCRIIN application and smartphone/tablet screen time from
questionnaire.
https://doi.org/10.1371/journal.pone.0254255.g001
Table 4. Physical activity from SCRIIN activity tracker and questionnaire, all and stratified by grade and sex.
Fifth grade Eighth grade
All Boys Girls Boys Girls
(n = 77) (n = 18) (n = 28) (n = 18) (n = 8)
SCRIIN activity tracker Mean ± SD Mean ± SD Mean ± SD p-value Mean ± SD Mean ± SD p-value
Physical activity (active min/day) 32.6 ± 16.5 35.1 ± 18.5 30.0 ± 10.8 0.24 28.7 ± 18.7 44.5 ± 18.9 0.06
(n = 119) (n = 39) (n = 37) (n = 27) (n = 16)
Questionnaire Mean ± SD Mean ± SD Mean ± SD Mean ± SD Mean ± SD
School sport lesson (min/day) 25.6 ± 4.1 26.5 ± 4.9 24.3 ± 2.0 0.02 26.7 ± 5.0 24.8 ± 3.0 0.18
Physical activity evening (min/day) 80.3 ± 54.5 60.4 ± 47.9 108.9 ± 50.5 <0.001 84.6 ± 55.6 57.0 ± 50.5 0.12
Physical activity weekend (min/day) 84.6 ± 58.7 78.2 ± 57.3 111.6 ± 56.3 0.02 73.8 ± 53.1 58.0 ± 58.3 0.38
Physical activity total (min/day) 101.6 ± 49.7 85.7 ± 45.2 129.5 ± 44.8 <0.001 104.3 ± 48.3 75.0 ± 46.2 0.07
Opinions about physical activity n (%) n (%) n (%) n (%) n (%)
Want more physical activity 74 (67.3) 24 (64.9) 24 (70.6) 0.76 13 (56.5) 13 (81.3) 0.07
Satisfied with my physical activity level 36 (32.7) 13 (35.1) 10 (29.4) 10 (43.5) 3 (18.8)
https://doi.org/10.1371/journal.pone.0254255.t004
PLOS ONE Screen time and physical activity in children and adolescents
PLOS ONE | https://doi.org/10.1371/journal.pone.0254255 July 9, 2021 8 / 14

Screen time vs physical activity
No correlation was observed between objectively measured smartphone screen time and
objectively measured physical activity for the entire study population of children and adoles-
cents (r = 0.15, p = 0.21), nor when stratified by gender and/or age. Likewise, no correlation
was shown between self-reported smartphone screen time and objectively measured physical
activity for the total study population (r = 0.04, p = 0.78), or for girls in fifth grade (r = -0.26,
p = 0.19) or girls in eighth grade (r = -0.65, p = 0.08). However, among boys in fifth grade, a
weak correlation was observed between self-reported smartphone screen time and objectively
measured physical activity (r = 0.51, p = 0.03). No such correlation was shown for boys in
eighth grade (r = 0.04, p = 0.88).
Validation of SCRIIN activity tracker against ActiGraph wGT3x-BT
The SCRIIN activity tracker measured on average 23.2 ± 15.3 active minutes compared to the
accelerometer ActiGraph wGT3x-BT, which on average measured 39.5 ± 22.3 minutes of
MVPA. Results from Spearman’s rank correlation demonstrated a significant correlation
(r = 0.72, p<0.001) between active minutes measured by the SCRIIN activity trackers and min-
utes of MVPA measured by the accelerometers. Thus, the SCRIIN activity tracker and the
accelerometer assessed the participants similarly in terms of physical activity level. However,
the absolute difference between the measurement tools was 16.2 minutes (p<0.001). The
Bland-Altman plot (Fig 2) shows wide limits of agreement between the ActiGraph wGT3x-BT
Fig 2. Bland-Altman plot. Comparing physical activity measured with ActiGraph wGT3x-BT in moderate-to-vigorous physical activity and the
Swedish SCRIIN activity tracker in active minutes.
https://doi.org/10.1371/journal.pone.0254255.g002
PLOS ONE Screen time and physical activity in children and adolescents
PLOS ONE | https://doi.org/10.1371/journal.pone.0254255 July 9, 2021 9 / 14

and the SCRIIN activity tracker. The outliers are placed above the limits of agreement with a
physical activity level over 40 minutes, i.e. the SCRIIN activity tracker tended to underestimate
physical activity compared to the accelerometer, especially when the level of activity was high.
Discussion
In this cohort of children and adolescents from two municipalities in Sweden, we found no
association between objectively measured smartphone screen time and objectively measured
physical activity, i.e. the time spent using their smartphone was not associated with the time
spent being physically active, in any of the age or gender groups. Girls aged 14–15 years, how-
ever, had both significantly more smartphone screen time and higher physical activity level,
compared to girls aged 10–12 years. Further, boys reported more than five times more time of
playing video and computer games than girls did. No association between parents´ and chil-
dren’s/adolescents´ amount of screen time was found.
Similar to our study, Auhuber et al. found no association between smartphone screen time
and total physical activity in children and adolescents of similar age [17]. The differences they
found between boys and girls were also consistent with the results of our study, where girls
reported a higher smartphone screen time, and boys spent more time playing computer or
video games. However, evidence from earlier studies demonstrates an inverse relationship
between physical activity and screen time [6,7]. For example, Sandercock et al. found a signifi-
cant negative association between screen time and physical activity in children and adolescents
aged 10–16 years [6]. Additionally, a study conducted among children, aged 7–12 years, dem-
onstrated a relationship between low physical activity level and high self-reported screen time
[7]. Another study indicated a modest, inverse association between screen time and MVPA
among children aged 9–15 years [18].
Differences in approaches for measuring screen time make comparison with earlier
research difficult. While previous studies exclusively have used questionnaires to measure
screen time, this study is, to our knowledge, the first to measure smartphone screen time
objectively in children and adolescents. Our results demonstrated large individual differences
between objectively measured and self-reported screen time, which indicates uncertainties
about self-reported data. However, it should be noted that we analysed smartphone screen
time separately, which differs from the majority of previous research studies where screen time
was not divided into different subcategories [6,7,18]. Thereby it is difficult to determine which
screen device that was used.
In contrast to previous research, we observed that girls aged 14–15 years had a higher objec-
tively measured physical activity level than girls aged 10–12 years. Girls aged 14–15 years also
seemed to be more physically active than both the younger boys and those in the same age
group, which likewise is inconsistent with earlier findings. It should be noted though, that our
sample of eighth grade girls is small. Girls 10–12 years, however, self-reported more physical
activity than both the boys in the same age and the older girls did.
Guthold et al., investigated the global prevalence of insufficient physical activity among
children and adolescents aged 11–17 and found, on the contrary, girls to be more physically
inactive than boys [19]. Moreover, Rosselli et al. assessed gender differences in physical activity
and discovered that girls less frequently reached the recommended level of physical activity
[20]. In another study, where patterns and determinants of MVPA among youths were ana-
lysed, results showed that boys were more active than girls were by the age of 15 years Addi-
tionally, physical activity decreased significantly with age [21]. This is consistent with another
study conducted by Trost et al., where a significant inverse relationship was found between
grade level and daily MVPA [22]. It is unclear to us why the girls in our study were more
PLOS ONE Screen time and physical activity in children and adolescents
PLOS ONE | https://doi.org/10.1371/journal.pone.0254255 July 9, 2021 10 / 14

physically active than the boys. Although, not confirmed in our study, it is more common that
Swedish boys are overweight and obese than the girls, and the risk of obesity is increasing with
age, especially in boys [23].
Our study includes various strengths and limitations that should be taken into account. The
ability to measure smartphone screen time objectively among children and adolescents is a
strength. The SCRIIN application provides detailed information on smartphone screen time
over the period of measurement. Although Swedish statistics from 2019 show that daily inter-
net connection most commonly is done from a smartphone [24], future studies should con-
sider assessing the amount of screen time from other devices as well. Another strength is the
high correlation between the SCRIIN activity tracker and the ActiGraph accelerometer in the
validation we conducted as a part of this study. The accelerometer ActiGraph wGT3x-BT is
widely used to capture and record continuous, high-resolution physical activity data in differ-
ent study populations [15]. The accelerometer cut-point we used was developed for children,
and has shown good agreement when validated [14].
The fact that we included schoolchildren and adolescents from both fifth and eighth grade
is an advantage in this study. This made it possible to identify age-related differences. To
increase generalizability, the recruitment of children and adolescents took place in schools
located in two socioeconomically different areas; our sample can be considered representative
of a larger population. In the municipality with low socioeconomic status, the parents were
less educated and more commonly born outside of Sweden. We also observed a higher propor-
tion of overweight and obesity in both children/adolescents and parents in the municipality
with low socioeconomic status, compared to the municipality with high socioeconomic status.
The latter is consistent with statistics from the Swedish Public Health Authority, reporting the
percentage of people with obesity to be 20% respectively 13% for the two municipalities where
the study was conducted [25]. Despite these demographic differences, there was no difference
in either screen time or physical activity between the children/adolescents in the different
schools.
Among the limitations is the possibility of both under- and overreporting of self-reported
data. This could for instance arise from social desirability [26]. For example, none of the partic-
ipating girls in our study wanted more screen time. This warrants more research, as we cannot
be sure if this is due to social desirability or other reasons. Another limitation is the missing or
incompleteness of data from the SCRIIN application and the SCRIIN activity tracker for some
of the children and adolescents. In order to download the application, they needed to have
access to a smartphone, and in addition, for fifth grade, have parents giving informed consent
for downloading the application. Thus, for some children and adolescents, we only have ques-
tionnaire data. The use of the activity tracker largely depended on memory and motivation of
the carrier. Some children and adolescents forgot to put the activity tracker on, or inadver-
tently left it on another piece of clothing. For this reason, we had a minimum of three mea-
sured days as a criterion to be included in the analysis.
A commonly used cut-point for MVPA is 100 steps per minute [27–29]. We used 80 steps
per minute as cut-point, which could have resulted in overestimation of active minutes. Never-
theless, our validation of the SCRIIN activity tracker against the ActiGraph wGT3x-BT showed
the contrary, i.e. the SCRIIN activity tracker underestimated MVPA. Consequently, an even
lower cut-point for the SCRIIN activity tracker may be more accurate. It should, however, be
kept in mind that accelerometers have been shown to be less accurate in correctly classifying
MVPA in children during free-living conditions when using a cut-point based on steps per
minute [30].
Another limitation is that we did not distinguish between light physical activity and inactive
time, which may have led to an overestimation of sedentary time. Furthermore, the time for
PLOS ONE Screen time and physical activity in children and adolescents
PLOS ONE | https://doi.org/10.1371/journal.pone.0254255 July 9, 2021 11 / 14

automatic screen lock was included in the total screen time. Although we do not believe that
this time is of significance for the study results, it is something that should be taken into con-
sideration in future studies involving smartphone screen time. Moreover, we cannot rule out
the possibility of a potential selection bias. It is possible that parents who had a specific interest
in physical activity and screen time were more willing to participate in the study than parents
with no interest in the subject were. Lastly, the relatively small sample size, when dividing the
children and adolescents into groups according to gender and age, is another limitation.
Our society is becoming more and more digitized. The body of research using new technol-
ogies, such as smartphones, to measure health in adults is increasing. Nevertheless, few studies
using smartphones have been conducted among children and adolescents. As unhealthy
behaviours have a tendency to persist into adulthood, it is of great importance to study these
behaviours in an early stage of life. Using smartphone applications as tools to identify and
measure behaviours in children and adolescents is relevant in both research and clinical care.
This study, measuring screen time objectively, is a first step in the direction of including new
technologies in research conducted among children and adolescents. Objectively measured
screen time may lead to better understanding of children and adolescents’ sedentary behav-
iour, which is needed to be able to promote and establish healthy activity patterns.
Conclusion
This study is likely the first to objectively measure smartphone screen time in children and
adolescents. The findings demonstrated no association between smartphone screen time and
physical activity among children and adolescents between 10–15 years old. However, girls
aged 14–15 years had both higher amount of screen time and were more physically active,
compared to girls aged 10–12 years. Furthermore, boys reported significantly more time spent
on computer and video games than girls did.
Supporting information
S1 Table. Demographic details of the municipalities for the schools included in this study.
(DOCX)
S2 Table. Parental questionnaire in English and Swedish.
(DOCX)
S3 Table. Child questionnaire in English and Swedish.
(DOCX)
S1 File.
(DOCX)
Acknowledgments
Foremost, we would like to express our gratitude to Tove Hogman, health educator and
research assistant, for recruiting participants and collecting data for the study. Moreover, we
would like to extend our gratefulness to Malin Sjostrand, founder of the Swedish SCRIIN
application, for making this study possible.
Author Contributions
Conceptualization: Stephanie E. Bonn, Ylva Trolle Lagerros.
Data curation: Helen Eke.
PLOS ONE Screen time and physical activity in children and adolescents
PLOS ONE | https://doi.org/10.1371/journal.pone.0254255 July 9, 2021 12 / 14

Formal analysis: Anna Dahlgren, Linnea Sjoblom, Helen Eke.
Methodology: Stephanie E. Bonn, Ylva Trolle Lagerros.
Project administration: Anna Dahlgren, Linnea Sjoblom, Stephanie E. Bonn, Ylva Trolle
Lagerros.
Resources: Ylva Trolle Lagerros.
Supervision: Helen Eke, Stephanie E. Bonn, Ylva Trolle Lagerros.
Writing – original draft: Anna Dahlgren, Linnea Sjoblom, Ylva Trolle Lagerros.
Writing – review & editing: Helen Eke, Stephanie E. Bonn, Ylva Trolle Lagerros.
References1. World Health Organization. Physical activity and young people [Internet]. Geneva: World Health Orga-
nization; [date unknown]. [cited 2020 Jun 22]. https://www.who.int/ncds/prevention/physical-activity/
factsheet_young_people/en/.
2. Public Health Agency of Sweden [In Swedish: Folkhalsomyndigheten]. School children’s health habits
in Sweden 2017/18 [In Swedish: Skolbarns halsovanor i Sverige 2017/18] [Internet]. Stockholm: Fol-
khalsomyndigheten; 2018. [cited 2020 May 30]. https://www.folkhalsomyndigheten.se/contentassets/
53d5282892014e0fbfb3144d25b49728/skolbarns-halsovanor-2017-18-18065.pdf.
3. Center for Sports Research [In Swedish: Centrum for idrottsforskning]. The active and the inactive [In
Swedish: De aktiva och De inaktiva] [Internet]. Stockholm: Centrum for idrottsforskning; 2017. [cited
2020 May 30]. https://centrumforidrottsforskning.se/wp-content/uploads/2017/06/De-aktiva-och-de-
inaktiva_komp.pdf.
4. Braig S, Genuneit J, Walter V, Brandt S, Wabitsch M, Goldbeck L, et al. Screen Time, Physical Activity
and Self-Esteem in Children: The Ulm Birth Cohort Study. Int J Environ Res Public Health. 2018; 15
(6):1275. https://doi.org/10.3390/ijerph15061275 PMID: 29914149
5. Motamed-Gorji N, Qorbani M, Nikkho F, Asadi M, Motlagh ME, Safari O, et al. Association of screen
time and physical activity with health-related quality of life in Iranian children and adolescents. Health
Qual Life Outcomes. 2019; 17(1):2. https://doi.org/10.1186/s12955-018-1071-z PMID: 30611271
6. Sandercock GRH, Ogunleye A, Voss C. Screen time and physical activity in youth: thief of time or life-
style choice? J Phys Act Health. 2012; 9(7):977–84. https://doi.org/10.1123/jpah.9.7.977 PMID:
21979868
7. de Araujo LGM, Turi BC, Locci B, Mesquita CAA, Fonsati NB, Monteiro HL. Patterns of Physical Activity
and Screen Time Among Brazilian Children. J Phys Act Health. 2018; 15(6):457–61. https://doi.org/10.
1123/jpah.2016-0676 PMID: 29569997
8. Leitzmann MF, Jochem C, Schmid D. Sedentary behaviour epidemiology. Cham: Springer Interna-
tional Publishing; 2018.
9. Rozgonjuk D, Levine JC, Hall BJ, Elhai JD. The association between problematic smartphone use,
depression and anxiety symptom severity, and objectively measured smartphone use over one week.
Comput Hum Behav. 2018; 87:10–7. https://doi.org/10.1016/j.chb.2018.05.019
10. Christensen MA, Bettencourt L, Kaye L, Moturu ST, Nguyen KT, Olgin JE, et al. Direct Measurements
of Smartphone Screen-Time: Relationships with Demographics and Sleep. PLoS One. 2016; 11(11):
e0165331. https://doi.org/10.1371/journal.pone.0165331 PMID: 27829040
11. Raven-Sieberer U, Bullinger M. KINDLR Questionnaire for Measuring Health-Related Quality of Life in
Children and Adolescents [Internet]. Hamburg: 2000. [cited 2020 Jun 8]. https://www.kindl.org/.
12. Rosenberg DE, Norman GJ, Wagner N, Patrick K, Calfas KJ, Sallis JF. Reliability and Validity of the
Sedentary Behavior Questionnaire (SBQ) for Adults. J Phys Act Health. 2010; 7(6):697–705. https://
doi.org/10.1123/jpah.7.6.697 PMID: 21088299
13. Cole TJ. Bellizzi MC, Flegal KM, Dietz WH. Establishing a standard definition for child overweight and
obesity worldwide: international survey. BMJ. 2000; 320(7244):1240–3. https://doi.org/10.1136/bmj.
320.7244.1240 PMID: 10797032
14. Ha JM, Phillips LRS, Rowlands AV. Validation of the GT3X ActiGraph in children and comparison with
the GT1M ActiGraph. J Sci Med Sport. 2013; 16(1):40–4. https://doi.org/10.1016/j.jsams.2012.05.012
PMID: 22749938
15. Migueles JH, Cadenas-Sanchez C, Ekelund U, Delisle Nystrom C, Mora-Gonzalez J, Lof M, et al. Accel-
erometer Data Collection and Processing Criteria to Assess Physical Activity and Other Outcomes: A
PLOS ONE Screen time and physical activity in children and adolescents
PLOS ONE | https://doi.org/10.1371/journal.pone.0254255 July 9, 2021 13 / 14

Systematic Review and Practical Considerations. Sports Med. 2017; 47(9):1821–45. https://doi.org/10.
1007/s40279-017-0716-0 PMID: 28303543
16. Yıldırım M, Verloigne M, de Bourdeaudhuij I, Androutsos O, Manios Y, Felső R, et al. Study protocol of
physical activity and sedentary behaviour measurement among schoolchildren by accelerometry–
cross-sectional survey as part of the ENERGY-project. BMC Public Health. 2011; 11:182. https://doi.
org/10.1186/1471-2458-11-182 PMID: 21439040
17. Auhuber L, Vogel M, Grafe N, Kiess W, Poulain T. Leisure Activities of Healthy Children and Adoles-
cents. Int J Environ Res Public Health. 2019; 16(12):2078. https://doi.org/10.3390/ijerph16122078
PMID: 31212786
18. Dalene KE, Anderssen SA, Andersen LB, Steene-Johannessen J, Ekelund U, Hansen BH, et al. Cross-
sectional and prospective associations between sleep, screen time, active school travel, sports/exer-
cise participation and physical activity in children and adolescents. BMC Public Health. 2018; 18
(1):705. https://doi.org/10.1186/s12889-018-5610-7 PMID: 29879929
19. Guthold R, Stevens GA, Riley LM, Bull FC. Global trends in insufficient physical activity among adoles-
cents: a pooled analysis of 298 population-based surveys with 1�6 million participants. 2020; 4(1):23–
35. https://doi.org/10.1016/S2352-4642(19)30323-2 PMID: 31761562
20. Rosselli M, Ermini E, Tosi B, Boddi M, Stefani L, Toncelli L, et al. Gender differences in barriers to physi-
cal activity among adolescents. Nutr Metab Cardiovas. 2020; 30(9):1582–9. https://doi.org/10.1016/j.
numecd.2020.05.005 PMID: 32605880
21. Nader PR, Bradley RH, Houts RM, McRitchie SL, O’Brien M. Moderate-to-Vigorous Physical Activity
From Ages 9 to 15 Years. JAMA. 2008; 300(3):295–305. https://doi.org/10.1001/jama.300.3.295 PMID:
18632544
22. Trost SG, Pate RR, Sallis JF, Freedson PS, Taylor WC, Dowda M, et al. Age and gender differences in
objectively measured physical activity in youth. Med Sci Sports Exerc. 2002; 34(2):350–5. https://doi.
org/10.1097/00005768-200202000-00025 PMID: 11828247
23. Public Health Agency of Sweden [In Swedish: Folkhalsomyndigheten]. Overweight and obesity [In
Swedish: Overvikt och fetma] [Internet]. Stockholm: Folkhalsomyndigheten; 2020 [cited 2021 Jan 25].
https://www.folkhalsomyndigheten.se/livsvillkor-levnadsvanor/fysisk-aktivitet-och-matvanor/overvikt-
och-fetma/.
24. The Swedish Internet Foundation [In Swedish: Internetstiftelsen]. The Swedes and the Internet 2019 [In
Swedish: Svenskarna och internet 2019] [Internet]. Stockholm: Internetstiftelsen i Sverige; 2019. [cited
2020 Jun 23]. https://svenskarnaochinternet.se/app/uploads/2019/10/svenskarna-och-internet-2019-
a4.pdf.
25. Public Health Agency of Sweden [In Swedish: Folkhalsomyndigheten]. Municipality datasheet [In Swed-
ish: Kommunfaktablad] [Internet]. Stockholm: Folkhalsomyndigheten; 2019. [cited 2020 Jun 10].
https://www.folkhalsomyndigheten.se/kommunfakta/.
26. Althubaiti A. Information bias in health research: definition, pitfalls, and adjustment methods. J Multidis-
cip Healthc. 2016; 9:211–7. https://doi.org/10.2147/JMDH.S104807 PMID: 27217764
27. Marshall SJ, Levy SS, Tudor-Locke CE, Kolkhorst F, Wooten KM, Ji M, et al. Translating physical activ-
ity recommendations into a pedometer-based step goal: 3000 steps in 30 minutes. Am J Prev Med.
2009; 36(5):410–5. https://doi.org/10.1016/j.amepre.2009.01.021 PMID: 19362695
28. Tudor-Locke C, Sisson SB, Collova T, Lee SM, Swan PD. Pedometer-determined step count guidelines
for classifying walking intensity in a young ostensibly healthy population. Can J Appl Physiol. 2005;
30:666–76. https://doi.org/10.1139/h05-147 PMID: 16485518
29. Beets MW, Agiovlasitis S, Fahs CA, Ranadive SM, Fernhall B. Adjusting step count recommendations
for anthropometric variations in leg length. J Sci Med Sport. 2010; 13(5):509–12. https://doi.org/10.
1016/j.jsams.2009.11.002 PMID: 20096631
30. Howe CA, Clevenger KA, Leslie RE, Ragan MA. Comparison of Accelerometer-Based Cut-Points for
Children’s Physical Activity: Counts vs. Steps. Children (Basel). 2018; 5(8):105. https://doi.org/10.3390/
children5080105 PMID: 30081457
PLOS ONE Screen time and physical activity in children and adolescents
PLOS ONE | https://doi.org/10.1371/journal.pone.0254255 July 9, 2021 14 / 14