Scott E. Bennett, P.E. Director · Compressed Natural Gas and Liquefied Natural Gas Liquefied...
49
Scott E. Bennett, P.E. Director Tuesday, February 20, 2018
Transcript of Scott E. Bennett, P.E. Director · Compressed Natural Gas and Liquefied Natural Gas Liquefied...

Scott E. Bennett, P.E.
Director
Tuesday, February 20, 2018

Statewide Transportation Improvement Program
o Statewide Transportation
Improvement Program (STIP)
o Federal Requirement
o Financial Constraint
o Development Supports:
Public Transparency
Consultation with Transportation Planning
Partners
Sound Financial Planning
Efficiency of Oversight

STIP Development Process
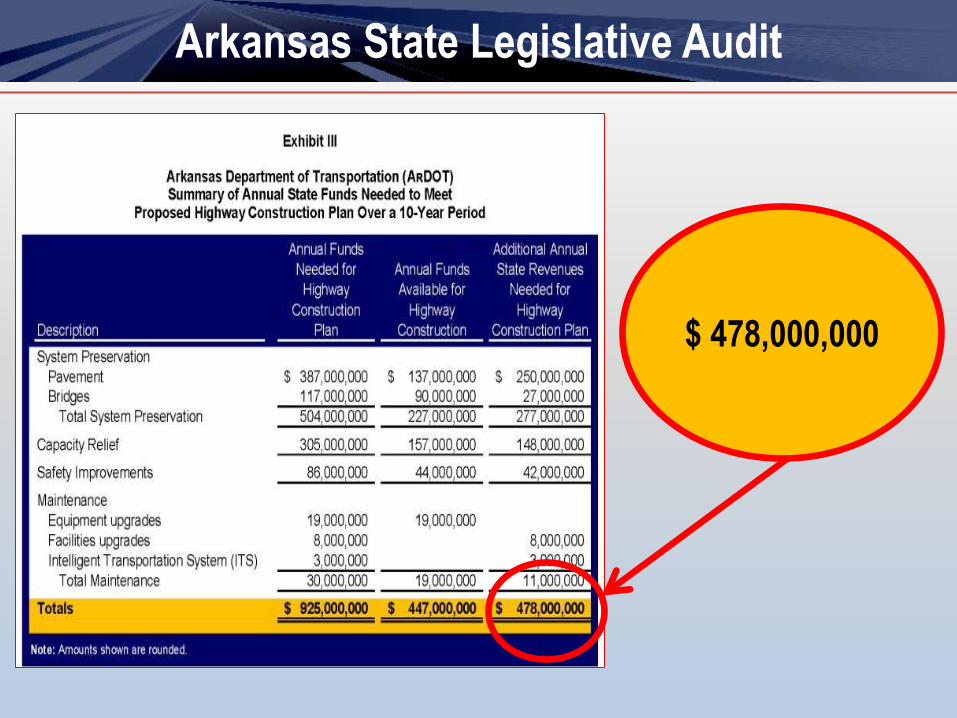
Annual Needs Next 10 Years Versus Annual Revenue Available Through 2020
System Preservation
Pavement $387,000,000
Bridges $117,000,000
Total System Preservation $504,000,000
Capacity Improvements for Congestion Relief $305,000,000
Safety Improvements $ 86,000,000
Maintenance
Equipment Upgrades $ 19,000,000
Facilities Upgrades $ 8,000,000
Intelligent Transportation Systems (ITS) $ 3,000,000
Total Maintenance $ 30,000,000
Total Annual Funds Needed for Highway Construction
Plan $925,000,000
Annual Funds Available for Highway Construction
through the FAST Act (does not include funds
committed to Interstate rehabilitation = $117,000,000
annually)
$447,000,000
Shortfall for Needs $478,000,000
Arkansas State
Highway Needs
Verified by
Arkansas
Legislative
Audit

STIP Development Process
Arkansas State Highway Capital Improvement Goals
Identified Capital Improvement Projects
Four Lane Grid System $ 12,697,000,000
New Location / New or Modified
Interchanges $ 921,000,000
Other Major Widening $ 258,000,000
Grand Total $ 13,876,000,000
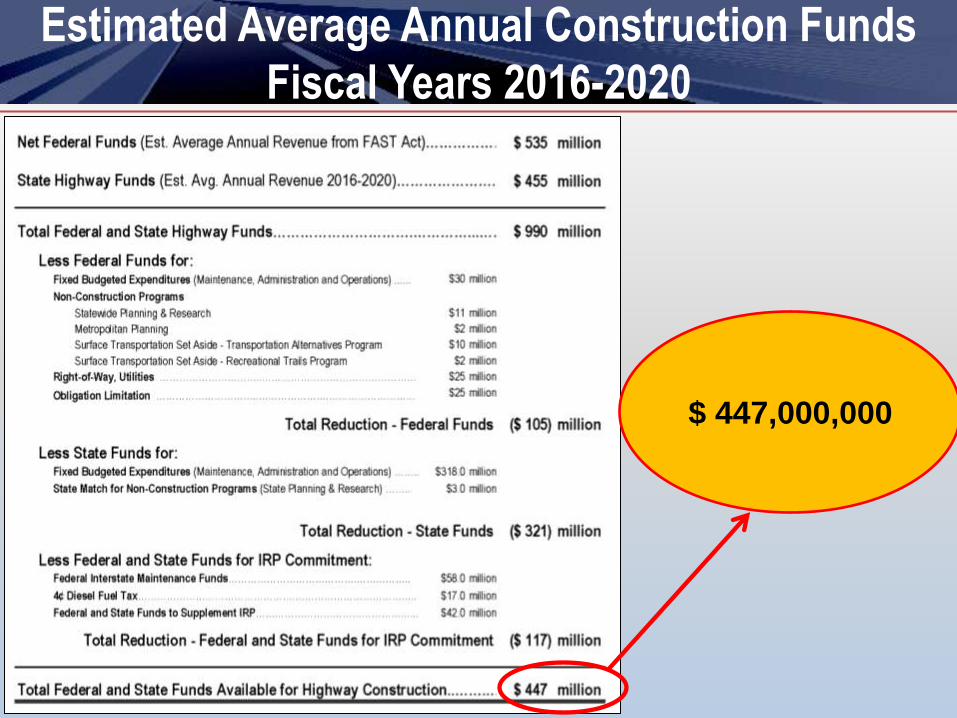
Estimated Average Annual Construction Funds
Fiscal Years 2016-2020
$ 447,000,000

Federal vs. State Funding

Report Released
August 31, 2017
Presented to
Legislative Joint
Audit Committee in
September
Arkansas Legislative Audit

Arkansas Legislative Audit
Does Not Include Capital Improvement
Projects
$ 925,000,000

Arkansas State Legislative Audit
$ 447,000,000
Arkansas State Legislative Audit
$ 478,000,000

STIP Development Process
Determination of Funding Distribution by Category
Investment Plan for Current STIP
System Preservation 80%
Capital Improvements 20%
Arkansas Primary Highway Network 90%

STIP Development Process
Decision Lens Software Ranking of Projects
Decision Lens Criteria
Safety
Infrastructure Condition
Mobility
Economic Consideration
Performance Measures

STIP Development Process
Project Selection Validation
Other Factors Considered
District Engineers
• Engineering Judgement
• Technical Expertise
Partnering
STIP Development Process
Final Project Selection
Highway Commission Approves Draft List of Recommended Projects
Publish for Public Comment (notification is sent to all elected public
officials)
Adjustments
Final Approval
• Federal Highway Administration
• Federal Transit Administration

0%
10%
20%
30%
40%
50%
60%
70%
80%
90%
100%
Poor
Fair
Good46%
2027
Condition Current
Condition
24% 28%
58%
18% 26%
All State Highways – Including Interstates

0%
20%
40%
60%
80%
100%
8% 16%
54% 41%
37% 43%
Poor
Fair
Good
All State Highways excluding Interstates
2027
Conditi
on
Current
Conditi
on
Other State Highways – Excluding Interstates

Overlay
$100,000
per lane mile
Pay a Whole Lot Later Pay a Little Now
Reconstruction $1,500,000
per lane mile

2017 Lettings
Type Work Amount
(x $1 M)
Widening / New Location $ 354
Pavement Preservation $ 327
Bridges $ 181
Safety $ 3
Other $ 5
Total $ 870

2018 Scheduled
Type Work Amount
(x $1 M)
Widening / New Location $ 630
Pavement Preservation $ 169
Bridges $ 431
Safety $ 65
Other $ 32
Total $1,327

2018 Pavement Preservation Projects
January – $19 Million
February – $30 Million
April – $64 Million
May – $28 Million
June – $28 Million

2019 Scheduled
Type Work Amount
(x $1 M)
Widening / New Location $ 297
Pavement Preservation $ 181
Bridges $ 191
Safety $ 37
Other $ 28
Total $ 734

2020 Scheduled
Type Work Amount
(x $1 M)
Widening / New Location $ 387
Pavement Preservation $ 80
Bridges $ 135
Safety $ 12
Other $ 10
Total $ 624

Status of State Funding

$0.0
$1.0
$2.0
$3.0
$4.0
$5.0
$6.0
$7.0
Billions
Fiscal Year
General Revenue
Highway Revenue
NET HIGHWAY REVENUE
14.4% $139M
8.7% $377M
9.4% $297M
11.3% $202M
7.6% $434M
6.6% $423M
Excludes County & City Aid funds | Excludes CAP funds
1985 Fuel Tax Increase
Percent of Highway vs. General Revenue
1991 Fuel Tax Increase
1999 Fuel Tax Increase

$0.0
$1.0
$2.0
$3.0
$4.0
$5.0
$6.0
$7.0
Billions
Fiscal Year
General Revenue
Highway Revenue
Highway Revenue at 14.4% of General Revenue
Excludes County & City Aid funds | Excludes CAP funds
NET HIGHWAY REVENUE
Highway Revenue at 14.4% of General Revenue
14.4% $455M 14.4%
$259M 14.4% $139M
14.4% $626M
14.4% $829M
14.4% $931M

$0.0
$1.0
$2.0
$3.0
$4.0
$5.0
$6.0
$7.0
Billions
Fiscal Year
General Revenue
Highway Revenue
NET HIGHWAY REVENUE
Excludes County & City Aid funds | Excludes CAP funds
4,070 3,965 3,842 3,807 3,571 3,689
30,000
32,000
43,000
49,725
49,725
58,651
Highway vs. General Revenue
Compared to Employment Levels

Governor’s Highway Funding Working Group
Funding Targets
Immediate: $ 50 Million
Short-term (0-3 years): $110 Million
Mid-term (3-5 years) (2018-2020): $250 Million
Long-term (6-9 years) (2021-2024): $400 Million All figures are annual
amounts for state highways.

Governor’s Plan – As Originally Proposed
FY16 FY17 FY18 FY19 FY20
(x $1 M)
2016 Special Session
Transfer Funds from the FY15 Unobligated Surplus 20.0
Provide Governor's Rainy Day Funds 20.0
Special Revenue from Sales Tax on New and Used Vehicles 1.5 8.0 15.0 20.0 25.0
Redirect the $4 Million of the Diesel Tax that goes to General Revenue to
Highways (70/30 split) 2.7 2.7 2.7 2.7
Eliminate the State Central Services Deduction from 1/2 Cent Sales Tax
(70/30 split) 5.4 5.4 5.4 5.4 5.4
Sub-Totals 2016 Special Session 46.9 16.1 23.1 28.1 33.1
Potential in Future Years
Allocate up to 25% of Future GIF to Highways
(Estimate Based on 10 Year Average) 48.0 48.0 48.0 48.0
Totals 2016 Special Session and Potential in Future Years 46.9 64.1 71.1 76.1 81.1

FFY16 FFY17 FFY18 FFY19 FFY20
(x $1 M)
2016 Special Session
Long Term Reserve Fund (formerly named Arkansas Rainy Day Fund) 40.0
Securities Reserve Fund 1.5 20.0 20.0 20.0 20.0
Redirect the $4 Million of the Diesel Tax that goes to General Revenue to Highways
(70/30 split) 2.7 2.7 2.7 2.7
Eliminate the State Central Services Deduction from 1/2 Cent Sales Tax (70/30 split) 5.4 5.4 5.4 5.4
Sub-Totals 2016 Special Session 41.5 28.1 28.1 28.1 28.1
Potential in Future Years
Allocate up to 25% of Future GIF to Highways (Estimate Based on 10 Year Average) 48.0 48.0 48.0 48.0
Total Projected 41.5 76.1 76.1 76.1 76.1
Act 1 - Arkansas Highway Improvement Plan of 2016
As Passed and Projected

FFY16 FFY17 FFY18 FFY19 FFY20
(x $1 M)
2016 Special Session
Long Term Reserve Fund (formerly named Arkansas Rainy Day Fund) 40.0 20.0
Securities Reserve Fund 1.5 1.7 ? 20.0 ? 20.0 ? 20.0
Redirect the $4 Million of the Diesel Tax that goes to General Revenue to Highways
(70/30 split) 0 2.7 2.7 2.7
Eliminate the State Central Services Deduction from 1/2 Cent Sales Tax (70/30 split) 5.4 5.4 5.4 5.4
Allocate up to 25% of Future GR Surplus to Highways 3.9 ? ? ?
Total Received 41.5 31.3 ? ? ?
Total Projected 41.5 76.1 76.1 76.1 76.1
Act 1 - Arkansas Highway Improvement Plan of 2016
Actual Compared to Projected
Difference 0 (44.8) ? ? ?

Potential New Program

Survey Results
Are you satisfied with the condition of the existing highway system?
Would you support a new highway program that would generate additional revenue?
Yes 24%
No 74%
No Answer
2%
Yes 75%
No 22%
No Answer
3%

Revenue Sources
Source Highway Revenue1
1 Cent Motor Fuel Tax Increase $ 14 M
Remove Sales Tax Exemption (Wholesale $1.70 per Gallon)2 $ 108 M
6.5% Sales Tax (Wholesale $1.70 per Gallon) $ 156 M
$10 Registration Fee Increase (Cars and Pickups) $ 19 M
Transfer Sales Tax on New and Used Vehicles2 $ 228 M
Transfer Sales Tax on Auto Repair Parts, Services, etc.2
$ 74 M
1% General Sales Tax $ 344 M
1 Amount shown is annual net to highways – after deduction for CFA/CSF and 30% to cities and counties. 2 Transfer of 4.5% (“general” portion of statewide sales tax)

Options for Generating Additional Revenue for Highways
Source $400 Million
for Highways(1)
Fuel Tax 28.4¢
Sales Tax on Fuel
(wholesale) 16.67%
Registration Fee $208
General Sales Tax(2) 1.16%
1 Amount shown is annual net to highways – after deduction for CFA/CSF and 30% to cities and counties. 2 Transfer of 4.5% (“general” portion of statewide sales tax)

Road User Related Tax Revenue (SFY 2016)
Total Road User Revenue
$1,076.5 Million
Distribution:
General Revenue
$460.7 Million (43%)
Highway Revenue
$615.9 Million (57%)

Survey Results
Which of the following sources do you recommend be utilized in obtaining additional funds?
1,029 (30%)
1,582 (47%)
865 (26%)
1,046 (31%)
628 (19%)
2,108 (62%)
0 500 1000 1500 2000 2500
Increase Gas Tax
Increase Diesel Tax
Increase Sales Tax
Increase Registrationfees
Add on w/s price ofmotor fuels
Transfer existing salesand use tax

Potential New Program

Potential New Program
Potential New Program
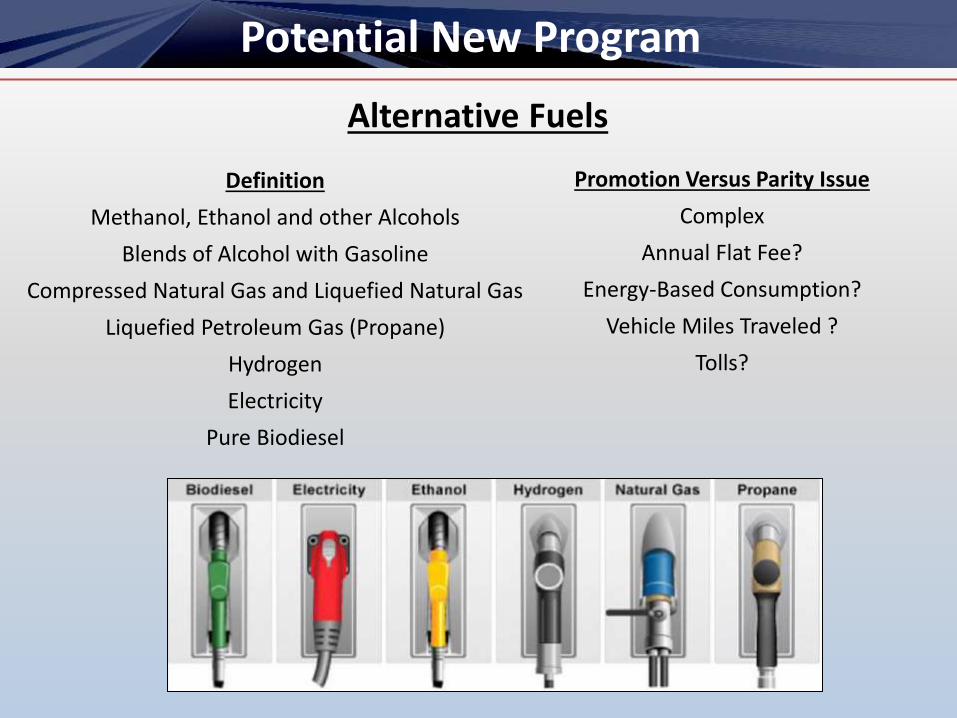
Definition
Methanol, Ethanol and other Alcohols
Blends of Alcohol with Gasoline
Compressed Natural Gas and Liquefied Natural Gas
Liquefied Petroleum Gas (Propane)
Hydrogen
Electricity
Pure Biodiesel
Promotion Versus Parity Issue
Complex
Annual Flat Fee?
Energy-Based Consumption?
Vehicle Miles Traveled ?
Tolls?
Alternative Fuels

Potential New Program
Indexing?
The Shrinking Highway Dollar Category 1997-2016
Percent Increase
Construction Cost Index 146 %
Overlays – Cost Per Lane Mile 145 %
Bridges Replacement – Cost Per Square Foot of Deck Area 131 %
Widening from 2 to 5 Lanes – Cost Per Mile 139 %
Blue Ribbon Committee Recommendation:
Indexing Current Per-Gallon Tax on Motor Fuels to Arkansas’ Highway Construction Cost Index
Governor’s Working Group on Highway Funding Recommendation:
Proposal #1 – Going forward, index the motor fuel tax. Limit any increase to 2 cents per gallon.
Proposal #3 – Adjust the existing motor fuel taxes to recoup the amount lost in recent years due to inflation and index to inflation in the future.


Electricity/Gas $160.00
TV/Internet Roads
Telephone
$161.00
$124.00 $46.00
Average Monthly Household Expenditures

Potential New Program
• Projecting 10 Years of Projects
• Annual Existing Funding Available for Highway Construction is
$447 Million
• Combined With Projected New Funding Totals $8.37 Billion
Over 10 Years

Recen
tly Co
mp
leted &
Un
der C
on
structio
n
LEGEND Job Type

Rem
ainin
g 2016-2020 S
TIP
Pro
jects
Recently Completed & Under Construction
Remaining 2016-2020 STIP Projects

Possible New Program
Summary
Interstate Improvements $1.00 Billion
Pavement Preservation $3.84 Billion
Bridge Replacement and Preservation $1.14 Billion
Capital Improvements $1.20 Billion
Capacity Improvements $0.72 Billion
Safety Improvements $0.47 Billion
Totals $8.37 Billion Over 10 Years

Bond Financing Pros • Funds immediately available
Bond Financing Cons • Interest costs erode your buying power
Total Spent Principal Interest
IRP $ 762.5 million $ 575.0 million $ 187.5 million
Interest as a percentage of total cost 24.60%
Total Spent Principal Interest
CAP $ 620.2 million $ 468.9 million $ 151.3 million
Interest as a percentage of total cost 24.39%
Bond Financing Costs
Questions?