SCORGTM – Tutorial for Thermodynamic modulerbbb265/SCORG_Thermodynamics_Tutorial_V5… · –...
39
SCORG TM V5.4, 2016 © PDM Analysis Ltd, 2016 Page | 1 TM SCORG TM – Tutorial for Thermodynamic module SCORG is a tool for the design and CFD pre-processing of rotary twin screw machines. It includes modules for grid generation; importing and editing rotor profiles; and multi-domain thermodynamic chamber module. For more information on the product please visit the website: www.pdmanalysis.co.uk or refer to documentation help. This tutorial lists the steps for setting up and performing Thermodynamic calculation which could be used for performance prediction of oil free and oil injected screw compressors as a preliminary setup of CFD simulation for Twin Screw Compressor. The user is expected to be familiar with screw machines. It is highly recommended that the users who attempt this tutorial study the books on the performance prediction methods for screw compressors 12 . This Tutorial should be studied alongside the SCORG TM V5.4 User Manual. The steps explained in this tutorial are demonstrated for Windows 7, x64 bit OS. Refer to SCORG TM Installation Guide V5.4 for the system and hardware requirements. Table of Contents 1 Introduction ........................................................................................................................ 2 2 Set Geometrical Clearances ............................................................................................... 9 3 Set and calculate Geometry.............................................................................................. 12 4 Set and calculate Thermodynamics .................................................................................. 20 4.1 Single thermodynamic calculation of Oil free air compressor .................................. 20 4.2 Changing compressor geometry and operating parameters ...................................... 25 4.3 Calculating oil free case for variety of operating conditions .................................... 29 4.4 Calculating Oil injected case ..................................................................................... 32 5 Thermodynamics in batch mode ...................................................................................... 36 6 Summary .......................................................................................................................... 38 7 Bibliography..................................................................................................................... 39 1 N. Stosic, I.K. Smith, A. Kovacevic Screw Compressor Mathematical Modelling and Performance Calculation, Springer, UK 2005, ISBN-10 3-540-24275-9 2 A. Kovacevic. N. Stosic, I.K. Smith, Screw Compressor Three Dimensional Computational Fluid Dynamics and Fluid Solid Interaction, Springer, 2006, ISBN 3-540-36302-5
Transcript of SCORGTM – Tutorial for Thermodynamic modulerbbb265/SCORG_Thermodynamics_Tutorial_V5… · –...

SCORGTM V5.4, 2016
© PDM Analysis Ltd, 2016 Page | 1
TM
SCORGTM – Tutorial for Thermodynamic module
SCORG is a tool for the design and CFD pre-processing of rotary twin screw machines. It includes modules for grid generation; importing and editing rotor profiles; and multi-domain thermodynamic chamber module. For more information on the product please visit the website: www.pdmanalysis.co.uk or refer to documentation help.
This tutorial lists the steps for setting up and performing Thermodynamic calculation which could be used for performance prediction of oil free and oil injected screw compressors as a preliminary setup of CFD simulation for Twin Screw Compressor. The user is expected to be familiar with screw machines. It is highly recommended that the users who attempt this tutorial study the books on the performance prediction methods for screw compressors1 2. This Tutorial should be studied alongside the SCORGTM V5.4 User Manual.
The steps explained in this tutorial are demonstrated for Windows 7, x64 bit OS. Refer to SCORGTM Installation Guide V5.4 for the system and hardware requirements.
Table of Contents 1 Introduction ........................................................................................................................ 2
2 Set Geometrical Clearances ............................................................................................... 9
3 Set and calculate Geometry.............................................................................................. 12
4 Set and calculate Thermodynamics.................................................................................. 20
4.1 Single thermodynamic calculation of Oil free air compressor.................................. 20
4.2 Changing compressor geometry and operating parameters ...................................... 25
4.3 Calculating oil free case for variety of operating conditions .................................... 29
4.4 Calculating Oil injected case ..................................................................................... 32
5 Thermodynamics in batch mode ...................................................................................... 36
6 Summary .......................................................................................................................... 38
7 Bibliography..................................................................................................................... 39
1 N. Stosic, I.K. Smith, A. Kovacevic Screw Compressor Mathematical Modelling and Performance Calculation, Springer, UK 2005, ISBN-10 3-540-24275-9 2 A. Kovacevic. N. Stosic, I.K. Smith, Screw Compressor Three Dimensional Computational Fluid Dynamics and Fluid Solid Interaction, Springer, 2006, ISBN 3-540-36302-5

SCORGTM V5.4, 2016
© PDM Analysis Ltd, 2016 Page | 2
TM
1 Introduction Screw Compressors are rotary positive displacement machines. They can be oil free or oil injected. Oil free compressors require rotors to be synchronised by additional timing gears on rotor shaft in order to maintain the contact free operation. In the oil injected compressor one rotor drives the other through direct contact, Figure 1.1.
The screw compressor rotors are helically lobed gears with special rotor profile. Together with the casing they form a closed interlobe space called the working chamber which changes the size and shape during the operation of the machine. The working chamber itself is periodically connected to the suction and discharge chambers through flow areas which vary with time both in shape and size. The schematic view of a screw machine (compressor, pump or a motor) is shown in Figure 1.3.
Figure 1.2 Configuration of a screw compressor
Figure 1.1 Oil injected twin screw compressor cross section

SCORGTM V5.4, 2016
© PDM Analysis Ltd, 2016 Page | 3
TM
In the chamber model it is assumed that all thermodynamic values, such as the pressure, temperature, density etc. are uniform within the respective control volume. Any of the control volumes can be considered as open thermodynamic systems, which exchange fluid mass and energy with the environment, as shown in Figure 1.3. The mass and energy flows, in and out of the control volume affect the quantity of mass and internal energy of the fluid inside the working chamber. The rate of change of the mass and energy within the working chamber are defined by the conservation laws of mass and energy respectively expressed in terms of differential equations. Other phenomena within the control volume and at its boundaries are modelled by a number of algebraic equations which describe leakage, inlet and outlet fluid velocities, oil injection and heat exchange with environment and oil. The model is closed by the equation of state of the working fluid which can be defined as ideal or real gas.
Figure 1.3 Schematic view of a screw machine chamber configuration
This Tutorial will provide a step by step guide to setup and execute thermodynamic simula t ion of a typical twin screw compressor. An example of a dry air compressor with 3/5 lobe combination, L/D ratio of 1.6 and wrap angle 285o is used in the tutorial. The effect of oil injection will also be demonstrated.

SCORGTM V5.4, 2016
© PDM Analysis Ltd, 2016 Page | 4
TM
Start SCORGTM Project
Launch SCORGTM on the Desktop. Select File New
Select N35_Template.spt Open
Save the project in a new folder named SCORG_Thermodynamics SCORG_Thermodynamics_Tutorial.spf

SCORGTM V5.4, 2016
© PDM Analysis Ltd, 2016 Page | 5
TM
The GUI of SCORGTM in the figure bellow shows the mains items of the front panel.
Go to Help Tutorials Folder opens Copy the compressor rotor profile files [ 35MaleProfile_P1.dat and
35FemaleProfile_P2.dat ] Paste these files in the working directory SCORG_Thermodynamics

SCORGTM V5.4, 2016
© PDM Analysis Ltd, 2016 Page | 6
TM
In profile setup adjust Axis Distance to 93 mm
Set Length Units to meters

SCORGTM V5.4, 2016
© PDM Analysis Ltd, 2016 Page | 7
TM
Go to User Profile Browse and Select the Male Rotor Profile from working directory.
35MaleProfile_P1.dat
Click ‘Yes’ to overwrite P1.dat.

SCORGTM V5.4, 2016
© PDM Analysis Ltd, 2016 Page | 8
TM
Similarly Select the Female Rotor Profile.
35FemaleProfile_P2.dat
Click Write To Default.
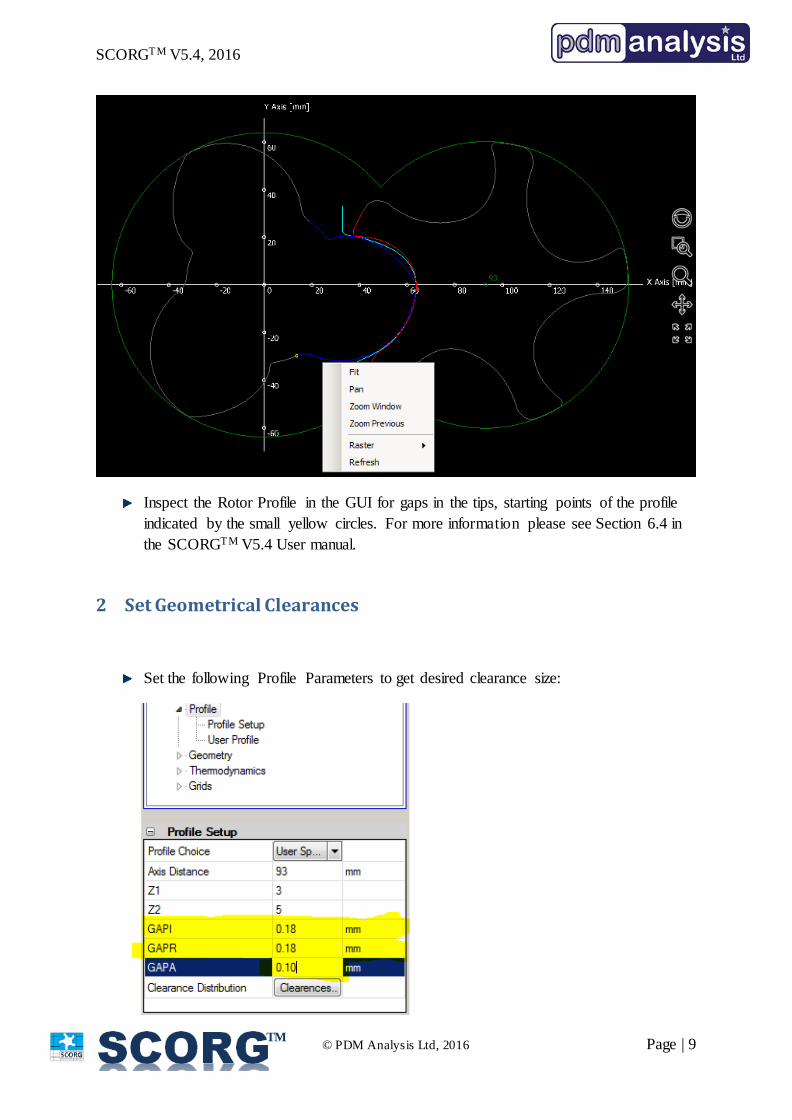
Click Right button and select Refresh to view new profiles.
SCORGTM V5.4, 2016
© PDM Analysis Ltd, 2016 Page | 9
TM
Inspect the Rotor Profile in the GUI for gaps in the tips, starting points of the profile indicated by the small yellow circles. For more information please see Section 6.4 in the SCORGTM V5.4 User manual.
2 Set Geometrical Clearances
Set the following Profile Parameters to get desired clearance size:

SCORGTM V5.4, 2016
© PDM Analysis Ltd, 2016 Page | 10
TM
Run Geometry calculation through the shortcut highlighted in the figure below
Run Rack generation procedure by clicking on Numerical rack shortcut button.
This is required to inspect the profile and make any required corrections of the imported rotor profiles. You will receive the following message
Click on Yes to accept correction of the profiles.
Now you can inspect the Interlobe clearances which the imported profile will have with the given axis distance. To do that, Click with the right mouse button on file Case->Thermodynamics->Output->GapI_dat.txt, select Graphical view and select columns 2 and 3 for X and Y axis respectively. The normal clearance distribution along the sealing line represented in the relative position from the beginning to the end of the profile is shown. In the diagram below it is visible that the normal clearance varies from 0.060mm to 0.1 mm in the given profile.

SCORGTM V5.4, 2016
© PDM Analysis Ltd, 2016 Page | 11
TM
If you want to use this clearance set in the profile for calculation of thermodynamic performance then no further action is required.
If you want to set Interlobe Clearance in thermodynamic through the Input value GAPI, then it is necessary to delete file Gapi.dat which was generated during the rack generation procedure.
Recalculate Geometry and refresh the diagram. You should see the diagram below.

SCORGTM V5.4, 2016
© PDM Analysis Ltd, 2016 Page | 12
TM
Save the Project.
3 Set and calculate Geometry In order to perform thermodynamic calculation and to obtain expected results, it is important to set up all geometry and operational inputs correctly. This will be adjusted through Input window for Geometry

SCORGTM V5.4, 2016
© PDM Analysis Ltd, 2016 Page | 13
TM
Set values for Rotor Configuration and Machine Configuration as indicated below
The next geometry setup is related to setting size of flow domains and passages shown in Figure 1.2 and Figure 1.3.
The volumes of these domains and flow areas between them are set through the menu shown in the figure on the left.
The domains in the Inputs are also shown in Figure 1.2 with following numbers:
Low pressure Pipe Domain 1 Low Pressure Reservoir Domain 2 High Pressure Reservoirs Domain 4 High Pressure Pipe Domain 5
All these volumes are set by the equivalent diameter and length of each of these domains.

SCORGTM V5.4, 2016
© PDM Analysis Ltd, 2016 Page | 14
TM
Figure 1.2 Configuration of a screw compressor
Flow areas between these domains in reference to Figure 1.2 are defined in following way:
– The Area 6 between the Low pressure pipe (1) and Low pressure Reservoir (2) is defined by the Diameter of the Low Pressure Pipe
– The Area 9 between the High Pressure Reservoir (4) and High Pressure Pipe (5) is defined by the Diameter of the High Pressure Pipe
– Area between the Low Pressure Reservoir (2) and the Working Chamber (3) is called Low pressure Port. It is calculated by the Geom program as described in the User Manual while in the Inputs it is only selected if the port is Axial, Radial or both. The size of the port is defined by the Compression Start Angle in Machine Configuration.
– Area between the Working Chamber (3) and the Low Pressure Reservoir (4) is called High Pressure Port. It is calculated by the Geom program as described in the User Manual. In Inputs it is only selected as the Axial, Radial port or both. The size of the port is defined by the Compression End Angle in Machine Configura t ion which directly depends on the Volume Index.
Set values of the flow domains as shown below

SCORGTM V5.4, 2016
© PDM Analysis Ltd, 2016 Page | 15
TM
Calculate Geometry by clicking on the shortcut button for geometry calculation
Inspect geometry diagrams

SCORGTM V5.4, 2016
© PDM Analysis Ltd, 2016 Page | 16
TM

SCORGTM V5.4, 2016
© PDM Analysis Ltd, 2016 Page | 17
TM
Port Areas – The diagram shows the area of the Suction and Discharge Ports as function of the rotation angle as well as any other ports if they exist, such as oil injection port or economiser port. The diagram also shows the Volume curve and two vertical lines demonstrate start and end of the compression process. Leakage Areas – The diagram shows the flow area through leakage paths as function of the main shaft angle. These include leakage areas of the inflow and outflow leakages. The inflow leakage paths are these through which fluid leaks in the working chamber: - Leading blow hole area, Leading male and female tip leakage area (radial leakage) and
leading axial gap area The outflow leakage paths through which fluid leaks from the working domain are: - Trailing blow hole area, Trailing male and female tip leakage area (radial leakage),
interlobe gap area and trailing axial gap area.
Sealing line – The diagram shows the sealing line in three coordinate planes, XY, YZ and ZX.
The influence of the change in clearances on the performance of the machine will be evaluated in the next Section.

SCORGTM V5.4, 2016
© PDM Analysis Ltd, 2016 Page | 18
TM
Inspect geometry report
The values shown in two columns relate to Male (left) and Female rotor (right)

SCORGTM V5.4, 2016
© PDM Analysis Ltd, 2016 Page | 19
TM
View the axial discharge port The shape and the size of the discharge port is defined by the Compression End angle which is in turn defined by the Volume Index Vi. In order to inspect the shape and size of the discharge port please calculate grid for the discharge port using highlighted shortcut button below and then display the port mesh using the shortcut button shown in the rectangle.
The shape and size of the port is displayed below. It will be later shown how it changes with the change in Vi.

SCORGTM V5.4, 2016
© PDM Analysis Ltd, 2016 Page | 20
TM
4 Set and calculate Thermodynamics Once the geometry of the compressor is correctly defined, it is possible to perform thermodynamic calculation. The objective of this calculation is to determine flow rate and power of the specified compressor operating at certain operating conditions and with the certain working fluid. The performance prediction will be obtained using multi domain chamber thermodynamic model. The basis of this model is explained in Stosic et al, 2005. More detail available through the SCORGTM user manual.
4.1 Single thermodynamic calculation of Oil free air compressor
The setup for Thermodynamic calculation is performed through the Input controls shown in the control window on the left.
The controls are divided in 5 categories:
- Thermodynamic controls - Working Fluid - Working conditions - Injection of liquid - Bearing and seal setup
Thermodynamic controls
For a single calculation of thermodynamic performance at one operating condition set the parameters in thermodynamic controls as listed below. Set as low as possible number of convergence loops to get fast but accurate calculation. Usually 3-4 loops are sufficient to achieve good accuracy. The method on how to check if it is sufficient will be explained through temperature diagrams. Please set values in your case to match the values in this window
Working Fluid The working fluid can be ideal or real gas. In this example ideal gas will be used. The values in the window on the left are values for air.

SCORGTM V5.4, 2016
© PDM Analysis Ltd, 2016 Page | 21
TM
Working Conditions
The rotational speed can be defined by the tip speed or by the Rotor speed. Whichever value is set, the other will automatically adjust according to the size of the rotor. The values required to be set for this calculation are P0 – Suction pressure (absolute) T0 – Suction Temperature Pr – Discharge Pressure. TAmbient – Ambient temperature used for calculation of conductive heat transfer from the compressor body.
Liquid injection For oil free screw compressor the Oil injection control button should be off. In such case it is irrelevant what are the other values in this input window as these are not used in calculation.
Bearings and seals Oil free air compressors usually have rolling element bearings and 4 mechanical seals to prevent mixing of air and oil in the working chamber. Seal Power losses are defined per 1000 rpm and are specified by manufacturers.
For this calculation, please set values as indicated in the input windows.
Calculate Thermodynamics by selecting thermodynamics shortcut

SCORGTM V5.4, 2016
© PDM Analysis Ltd, 2016 Page | 22
TM
Inspect thermodynamic diagrams

SCORGTM V5.4, 2016
© PDM Analysis Ltd, 2016 Page | 23
TM
The above two diagrams show Pressure change with the angle of rotation and the temperature change with the angle of rotation respectively. The green line marked with CW represents the main working chamber.
The blue (CW1) and green (CW2) lines are low pressure pipe and reservoir respectively.
The red (CW4) and orange (CW5) lines are high pressure reservoir and pipe respectively.
The pulsations in the main chamber and in the pipes and reservoirs are visible on the above charts.
The chart below show the integrates mass flows in and out of the chamber through compressor ports, blue and red line respectively, actual mass in the chamber, green line, and the integrated leakage flows in and out of the chamber. These are all shown as the function of rotational angle

SCORGTM V5.4, 2016
© PDM Analysis Ltd, 2016 Page | 24
TM
Results presented on screen show calculated integral parameters and breakdown of Indicated Power, Shaft Seal Power, Bearing Power and Oil Drag Power in case of oil injected compressor.
View Thermodynamic Report

SCORGTM V5.4, 2016
© PDM Analysis Ltd, 2016 Page | 25
TM
4.2 Changing compressor geometry and operating parameters
The thermodynamic multi-chamber model allows variation of parameters and evaluation of their influence on the performance of the compressor. As an example the following changes will be introduced:
- Radial clearance will be changed to 50 micrometers, - Volume Index will be increased to 2.2 - Discharge pressure will be reduced to 2.5 bar - Change the size of the discharge pipe (flange) to 70 mm
To introduce these changes please alter windows below:
Profile Geometry
Thermodynamics Domains

SCORGTM V5.4, 2016
© PDM Analysis Ltd, 2016 Page | 26
TM
Run Geometry calculation; Run Thermodynamics and Run Port Generation Inspect the results and compare with the results obtained previously
a) Geometry Diagrams - Note the difference in the size of the discharge port, Compression angle and the size of radial gaps

SCORGTM V5.4, 2016
© PDM Analysis Ltd, 2016 Page | 27
TM
b) Note the difference in the size and shape of the discharge port
c) Note the difference in the thermodynamic performance The compressor now over compresses but due to larger flow area behind the compressor introduces lower losses in the discharge reservoir and pipes and therefore lower pressure.
SCORGTM V5.4, 2016
© PDM Analysis Ltd, 2016 Page | 28
TM
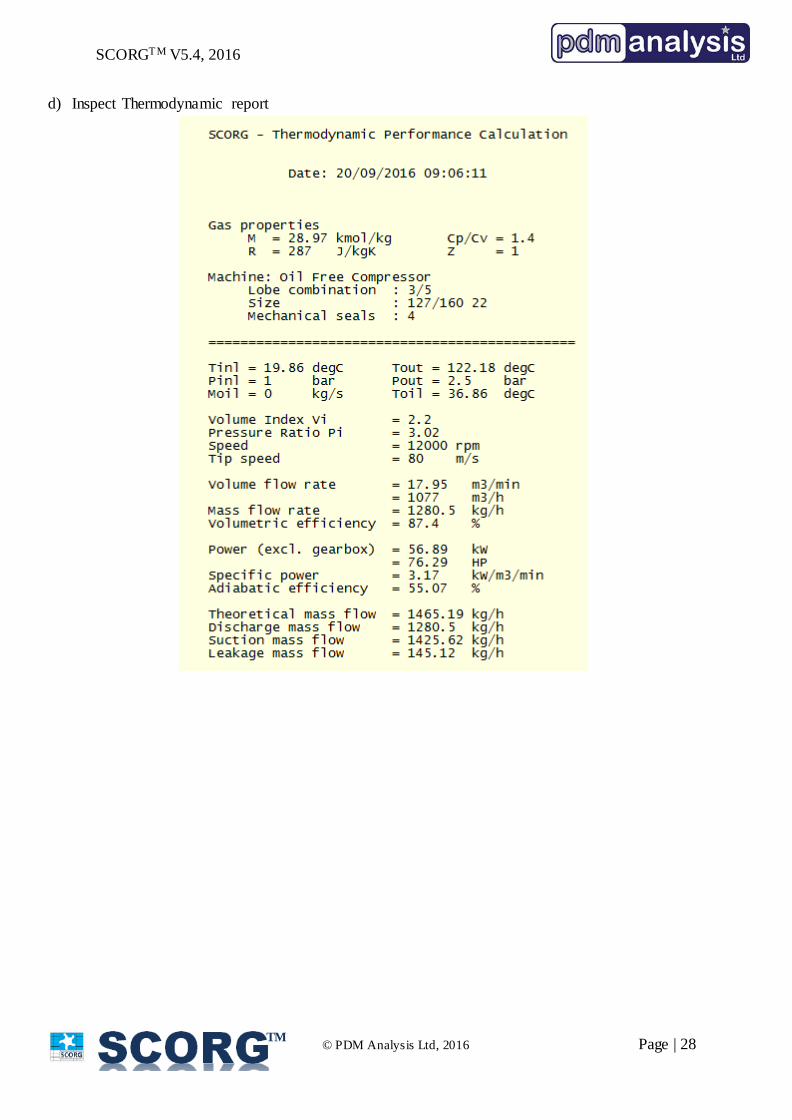
d) Inspect Thermodynamic report

SCORGTM V5.4, 2016
© PDM Analysis Ltd, 2016 Page | 29
TM
4.3 Calculating oil free case for variety of operating conditions
To calculate multiple parameters thermodynamic case, please set following parameters
The results will be obtained for speeds from 9000 to 15750 rpm and pressures from 1.5 to 2.5 bar.

SCORGTM V5.4, 2016
© PDM Analysis Ltd, 2016 Page | 30
TM
Once the results are calculated, these can be viewed in the report as presented before or exported to excel where these could be used for preparing diagrams etc. To export in excel select the Thermo_Short.txt report from the Case tree, click on the right mouse button and select ‘Export to excel’ as shown in the figure

SCORGTM V5.4, 2016
© PDM Analysis Ltd, 2016 Page | 31
TM
The results will be in the form shown below.
SCORG - Thermodynamic Performance Calculation Date: 20/09/2016 20:57:39
Gas properties Ideal Gas Cp/Cv = 1.4 R = 287 J/kgK Z = 1 Machine: Oil Free Compressor Lobe combination : 3/5 Size : 127/160 18 Mechanical seals : 4 =========================================WTP N Q Qn M ηv Power Psp ηad Tdis P1 P2m/s RPM m3/m nm3/m kg/min _ Kw _ _ K bar bar
60 9000 11.695 11.695 13.901 0.7594 28.978 2.478 0.2892 354.706 1 1.565 9750 12.859 12.859 15.284 0.7707 32.547 2.531 0.2831 358.248 1 1.570 10500 14.012 14.012 16.655 0.7798 36.298 2.59 0.2766 361.865 1 1.575 11250 15.169 15.169 18.029 0.7879 40.238 2.653 0.2701 365.588 1 1.580 12000 16.323 16.323 19.401 0.7949 44.368 2.718 0.2636 369.447 1 1.585 12750 17.473 17.473 20.768 0.8009 48.693 2.787 0.2571 373.338 1 1.590 13500 18.599 18.599 22.107 0.8051 53.192 2.86 0.2505 377.26 1 1.595 14250 19.711 19.711 23.428 0.8083 57.866 2.936 0.244 381.224 1 1.5
100 15000 20.806 20.806 24.729 0.8106 62.716 3.014 0.2377 385.231 1 1.5105 15750 21.878 21.878 26.004 0.8118 67.759 3.097 0.2313 389.365 1 1.5
60 9000 11.522 11.522 13.694 0.7481 35.773 3.105 0.4115 381.573 1 265 9750 12.698 12.698 15.092 0.761 39.643 3.122 0.4092 383.936 1 270 10500 13.863 13.863 16.478 0.7716 43.707 3.153 0.4052 386.598 1 275 11250 15.021 15.021 17.853 0.7802 47.965 3.193 0.4001 389.465 1 280 12000 16.168 16.168 19.217 0.7873 52.417 3.242 0.3941 392.485 1 285 12750 17.303 17.303 20.566 0.793 57.064 3.298 0.3874 395.63 1 290 13500 18.422 18.422 21.896 0.7974 61.902 3.36 0.3802 398.886 1 295 14250 19.522 19.522 23.204 0.8006 66.928 3.428 0.3727 402.293 1 2
100 15000 20.613 20.613 24.5 0.803 72.168 3.501 0.3649 405.816 1 2105 15750 21.709 21.709 25.803 0.8055 77.584 3.574 0.3575 409.365 1 2
60 9000 11.315 11.315 13.448 0.7347 42.819 3.784 0.4613 408.996 1 2.565 9750 12.493 12.493 14.849 0.7488 47.137 3.773 0.4627 410.308 1 2.570 10500 13.661 13.661 16.237 0.7603 51.636 3.78 0.4619 412.024 1 2.575 11250 14.819 14.819 17.614 0.7698 56.324 3.801 0.4593 414.066 1 2.580 12000 15.977 15.977 18.991 0.7781 61.207 3.831 0.4557 416.377 1 2.585 12750 17.128 17.128 20.358 0.785 66.29 3.87 0.4511 418.925 1 2.590 13500 18.269 18.269 21.714 0.7908 71.586 3.918 0.4455 421.765 1 2.595 14250 19.4 19.4 23.059 0.7956 77.101 3.974 0.4392 424.807 1 2.5
100 15000 20.517 20.517 24.386 0.7993 82.801 4.036 0.4326 427.929 1 2.5105 15750 21.625 21.625 25.703 0.8024 88.697 4.102 0.4256 431.133 1 2.5
SCORGTM V5.4, 2016
© PDM Analysis Ltd, 2016 Page | 32
TM
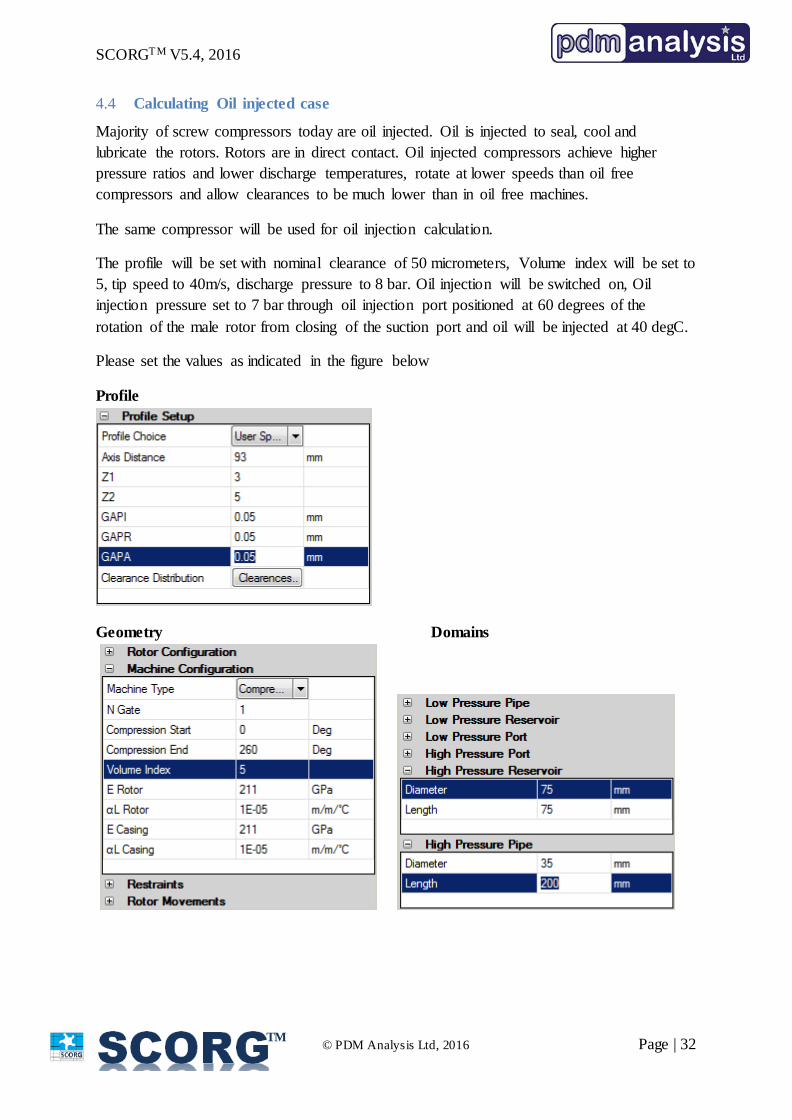
4.4 Calculating Oil injected case
Majority of screw compressors today are oil injected. Oil is injected to seal, cool and lubricate the rotors. Rotors are in direct contact. Oil injected compressors achieve higher pressure ratios and lower discharge temperatures, rotate at lower speeds than oil free compressors and allow clearances to be much lower than in oil free machines.
The same compressor will be used for oil injection calculation.
The profile will be set with nominal clearance of 50 micrometers, Volume index will be set to 5, tip speed to 40m/s, discharge pressure to 8 bar. Oil injection will be switched on, Oil injection pressure set to 7 bar through oil injection port positioned at 60 degrees of the rotation of the male rotor from closing of the suction port and oil will be injected at 40 degC.
Please set the values as indicated in the figure below
Profile
Geometry Domains

SCORGTM V5.4, 2016
© PDM Analysis Ltd, 2016 Page | 33
TM
Thermodynamics
Calculate thermodynamics

SCORGTM V5.4, 2016
© PDM Analysis Ltd, 2016 Page | 34
TM
View diagrams

SCORGTM V5.4, 2016
© PDM Analysis Ltd, 2016 Page | 35
TM
Notice the red line which represents the oil in the working chamber. Oil is injected at 60 deg and is used to cool the air. Despite the discharge pressure reaching almost 9 bar, the discharge temperature is around 80 deg C.
The results displayed in the results window:
The report

SCORGTM V5.4, 2016
© PDM Analysis Ltd, 2016 Page | 36
TM
5 Thermodynamics in batch mode Thermodynamic calculations can also be run in a batch mode. This means that calculations can be performed outside of SCORG Graphical User Interface for the convenience of automatic variation of parameters and in particular for optimization of screw compressors.
SCORG program operates in two folders, namely the Installation Folder and the Project Folder.
The Installation folder is the folder in which SCORG was originally installed. Usually that will be C:\SCORG or C:\Program Files\SCORG. The example of the SCORG Installation folder is shown in the figure below.
The files required to run thermodynamics in the batch mode from the Installation folder are:
• Thermo.exe • Geom.bat
The project files are stored in the Project Folder. To identify or modify the active Project folder, please open Scorg.ini file from the Installation folder in any text editor, for example Notepad as shown in the figure below. The project Folder is shown as Project Path.

SCORGTM V5.4, 2016
© PDM Analysis Ltd, 2016 Page | 37
TM
Open the Tutorial folder SCORG_Thermodynamics and identify file named: SCORG_Thermodynamics_Tutorial.spf. This file is textual file which contains all input parameters for the Project you are working on. Parameters are grouped in smaller set of parameters related to an activity, namely, profile definition, machine geometry, thermodynamics and grid.
It is always recommended that a Project case is set up using SCORG GUI as explained throughout this tutorial first so that all parameters in input files are set properly. Then the parameters in the .spf file can be changed as required. Please do not forget to save file before thermodynamics is run.
Also, similarly to the case run through GUI, every time some of geometric inputs is changed, I is necessary to run geometry calculation.
To run geometry calculation use Geom.bat file form the Install Folder. The results of calculation will be shown on the screen in window similar to the one shown in the figure below.

SCORGTM V5.4, 2016
© PDM Analysis Ltd, 2016 Page | 38
TM
The same results could be viewed any time by opening a report named Gemoetry.txt in the folder shown below.
Equally, thermodynamics is run using the file Thermo.exe. Reports are stored in the same report folder in the Project Folder where geometry.txt was also located.
NOTE: Using geometry and thermodynamic calculation in batch mode requires good knowledge on the possible combination of input parameters. The inadequate combination of input parameters will lead to incorrect results.
6 Summary This document describes the steps to setup and calculation of thermodynamic performance predictions using multi chamber thermodynamics. More detailed information on using SCORG can be found in user guide (SCORG, 2016). Thermodynamic calculations are used as the preliminary performance predictions which could be utilised for design of screw machines, initial conditions for CFD and FEM.

SCORGTM V5.4, 2016
© PDM Analysis Ltd, 2016 Page | 39
TM
7 Bibliography Kovacevic, A., Stosic, N. & Smith, I. K., 2007. Screw compressors - Three dimensional computational fluid dynamics and solid fluid interaction, ISBN 3-540-36302-5. 1 ed. New York: Springer-Verlag Berlin Heidelberg.
SCORG, 2016. SCORG, User Help Manual, London: City University.
Stosic, N., Smith, I. K. & Kovacevic, A., 2005. Screw compressors: Mathematical modeling and performance calculation, ISBN 3540242759. 1 ed. London: Springer.
Stosic, N, Kovacevic A, Mujic E, Smith I.K., Review of Mathematical Models in Performance Calculation of Screw Compressors, International Journal of Fluid Machinery and Systems, DOI: 10.5293/IJFMS.2011.4.2.200 Vol.4, No.2, April-June, 2011, ISSN (Online): 1882-9554
End of Document
PDM Analysis Ltd 8 Eccleston Close, Barnet, EN4 9EZ, United Kingdom +44 78 2781 8689; +44 20 3489 9018 [email protected] http://www.pdmanalysis.co.uk