SCMS JOURNAL OF INDIAN MANAGEMENT Contents Journal April-June... · SCMS JOURNAL OF INDIAN...
141
005- - 015 016- - 024 039- - 054 031- - 038 055- - 066 067- - 079 080- - 085 086- - 109 Title of the Article Author / Authors Page No . SCMS JOURNAL OF INDIAN MANAGEMENT Contents Volume 7 April - June 2010 Number 2 118- - 119 120- - 121 126- - 127 128- - 129 122- - 123 124- - 125 110- - 117 025- - 030 Case in Competency: : Anitha Thomas and Training need Assessment Anirudha Panchal SCM and Marketing Management: : Pankaj M. Madhani Mutual Integration Organizational Climate: : Avinash Kumar Srivastav BPO Industry Brand Awareness: : Keerthi Pandian and Baby Food Products Ramachandran K.K. Product Mix Strategies: : Mohankumar T.P. and FMCG in Indian Market : Shivaraj B. Small is Beautiful? : Prasenjit Maiti Corporate Social Responsibility Car Industry: : Dharmaraj C., Sivasubramanian M. SWOT Analysis : and Clement Sudhahar J. Ordering of Companies: : Dilip Roy and Anupama Tiwari Proposed-Profitability Scores Single and Multiple Expectations: : Ravinchandran K., Service Quality Retailing : Abdus Samad K. and : David Sam Jayakumar G.S. Ownership Structure in Iran: : Vahideh Hoseini Nodeh and Firms’ Responsibility : Aisha M. Sheriff Retail Franchising : Sreekumar Pillai Managerial Accounting : Makesh K.G. Marketing : Bindu K. Nambiar Strategic Management Text and Cases : Susan Abraham Fundamentals of Investment Management : Sudhakara Menon New Venture Creation : Paulose K.J.
-
Upload
nguyenkhue -
Category
Documents
-
view
225 -
download
0
Transcript of SCMS JOURNAL OF INDIAN MANAGEMENT Contents Journal April-June... · SCMS JOURNAL OF INDIAN...

005- - 015
016- - 024
039- - 054
031- - 038
055- - 066
067- - 079
080- - 085
086- - 109
Title of the Article Author / Authors Page No.
SCMS JOURNAL OF INDIAN MANAGEMENTC o n t e n t s
Volume 7 April - June 2010 Number 2
118- - 119
120- - 121
126- - 127
128- - 129
122- - 123
124- - 125
110- - 117
025- - 030
Case in Competency: : Anitha Thomas andTraining need Assessment Anirudha Panchal
SCM and Marketing Management: : Pankaj M. MadhaniMutual Integration
Organizational Climate: : Avinash Kumar SrivastavBPO Industry
Brand Awareness: : Keerthi Pandian andBaby Food Products Ramachandran K.K.
Product Mix Strategies: : Mohankumar T.P. andFMCG in Indian Market : Shivaraj B.
Small is Beautiful? : Prasenjit MaitiCorporate Social Responsibility
Car Industry: : Dharmaraj C., Sivasubramanian M.SWOT Analysis : and Clement Sudhahar J.
Ordering of Companies: : Dilip Roy and Anupama TiwariProposed-Profitability Scores
Single and Multiple Expectations: : Ravinchandran K.,Service Quality Retailing : Abdus Samad K. and
: David Sam Jayakumar G.S.
Ownership Structure in Iran: : Vahideh Hoseini Nodeh andFirms’ Responsibility : Aisha M. Sheriff
Retail Franchising : Sreekumar Pillai
Managerial Accounting : Makesh K.G.
Marketing : Bindu K. Nambiar
Strategic Management Text and Cases : Susan Abraham
Fundamentals of Investment Management : Sudhakara Menon
New Venture Creation : Paulose K.J.

SCMS Journal of Indian Management , April - June, 2010. 2
A Quarterly Journal
The Chairman speaks ...
In today's increasingly competitive and continuously changing business climate, survivaland progress of an organization depends very much on the regular upgradation andacquisition of the required competencies by the employees at all levels through training anddevelopment.
A training programme to be effective, it must be well planned. Designing a training programmeinvolves a sequence of steps starting with the training need assessment of the particularworkforce. Need assessment is a systematic attempt to diagnose the changing workrequirements. Developing appropriate training responses to the identified needs is the nextstep.
Even though accurate need assessment is widely accepted as a critical prerequisite forconducting a training programme, it is an often neglected step in practice.
The research paper on 'Training need assessment' brought to you as the lead article in thisissue, therefore, assumes topical importance to our readers.
Radical changes had occurred in the market place during the last few years. Strong brandloyalty is fast becoming a thing of the past because equally acceptable other choices areavailable to the consumer. Therefore, any failure in ensuring the ready availability of thepreferred brand at the retail shop is likely to persuade the consumer to shift his loyalty.Hence, our second lead article deals with mutual integration of supply chain managementand marketing management.
We are sure you will enjoy reading these lead articles and a variety of other articles broughtto you in this issue.
Dr.G.P.C.NAYARChairman, SCMS Group of Educational Institutions

SCMS Journal of Indian Management , Apr i l - June, 2010. 3
A Quarterly Journal
SCMS Journal of Indian ManagementA QuarA QuarA QuarA QuarA Quar ter ly Publ icat ion ofter ly Publ icat ion ofter ly Publ icat ion ofter ly Publ icat ion ofter ly Publ icat ion of
SCMS-COCHINSCMS-COCHINSCMS-COCHINSCMS-COCHINSCMS-COCHIN
Editor-in-Chief : Dr.G.P.C.NayarChairmanSCMS Group of Educational Institutions
Editor : Dr.D.Radhakrishnan NairProfessor, SCMS-COCHIN
Editorial Advisory BoardDr.Subramanian Swamy : Professor, Har vard Univers i ty, Cambridge, MA , US.
Formerly, Professor of Economics, IIT, Delhi.
Dr.V.Raman Nair : Director, SCMS-COCHIN.
Dr.Radha Thevannoor : Director, SCMS School of Technology and Management,Kochi.
Dr.Thomas Steger : Professor of European Management, Chemnitz Universityof Technology, Chemnitz, Germany.
Dr.Kishore G.Kulkarni : Professor, Metropolitan State College of Denver andEditor - Indian Journal of Economics and Business,Denver, US.
Dr.Naoyuki Yoshino : Professor of Economics, Keio University, Tokyo, Japan.
Dr.Mathew J.Manimala : Professor of Organ izat ion Behav iour and JamunaRaghavan Chair Professor of Entrepreneurship at theIndian Inst itute of Management, Bangalore.
Dr.Tapan K.Panda : Professor of Marketing, Indian Institute of Management,Indore.
Dr.Azhar Kazmi : Professor, Department of Management and Marketing, KingFahd University of Petroleum and Minerals, Dhahran, SaudiArabia.
Dr.Jose Maria Cubillo-Pinilla : P r o f e s s o r, I n t e r n a t i o n a l M a r ke t i n g , Po l y t e c h n i cUnivers i ty of Madr id, Spain.
Dr.I.M.Pandey : Director, Pearl School of Business, Gurgaon.
Dr.George Sleeba : Asst. Managing Director, V-Guard Industries.
Mr.Jiji Thomson IAS : Agr icultural Market ing Adviser, Government of India.
SCMS Journal of Indian Management , April - June, 2010. 4
A Quarterly Journal
Editorial
Management: Ontology and PedagogyNature has its own form. No rigid rules bind her Being: the gentle breeze, themovement of clouds, the lashing fury of storm, flower-laden trees, myriad of raindrops clinging-like crystal to the swaying blades of grass, and a spider's web,quivering like dewdrops in the morning sunlight. These beautiful moments inNature can never be captured and channeled into rules. 'Management' exists therewhere Nature exists in its various manifestations.Nature manages all things using different ways. Nature creates things and objects,
sustains them, destroys them, and continues this process. Once we observe Nature, it gives us manythings to learn. Nature is the greatest teacher, to poets. It is so with regard to us also when we search forthe best pedagogy. The best management classes will be those sliced from experiences from Nature.Growth and development are all well understood from our observation of the growth and developmentof a plant or similar other organisms.Over and above what we get from Nature as beauty and objects of beauty, we can create visual beautywith natural materials, following certain rules. Good design is universal and it demands a few basicprinciples. Many flower arrangers use mechanical rules to make their products pleasing and attractive,but, sans creativity and soul. A thorough understanding of the basic principles of combination offlowers: Focal Point, Build-up, Balance, Relationship of Parts and Simplicity, is necessary to provideunity and harmony.One flower in a container does not please. It has no design. Sight of two flowers, of the same height, doesnot please either. It is uninteresting and dull. Three flowers at different heights with the largest in thecentre make a design, with the centre flower as the focal point. The focal point is the mass, prominentthrough shape, size or colour. Build-up is achieved by repetition of culture, form, or texture, leading to oraway from the focal point. Form and colour are important factors of balance and are closely related.Relationship of parts or proportion or scale is necessary to obtain the best visual effect. Simplicity
means finding the essence of the design.Mass is the material, the flowers, the foliage, and the twigs usedin an arrangement. Texture is the feel of the mass, rough, smooth,or delicate, and finally colour, which plays an important role. Adesign is the product of the three above. Similarly from the simpleto the complex, lessons from Nature are many. Every objectaround is a provider of a lesson in pedagogy. Nature can teach ushow to solve a problem. All these can form the basis ofmanagement pedagogy.
Editorial Assistant: Mr. E.V. Johnson Assistant Editor: Dr. Poornima Narayan R.
Dr.D.Radhakrishnan Nair

SCMS Journal of Indian Management , Apr i l - June, 2010. 5
A Quarterly Journal
Competency assessment i s v i t a l i n ident i f icat ion of the des i red sk i l l s sets
for each ro le for meet ing organ izat iona l goa ls and object ives . I t he lps in
a s s e s s i n g t h e g a p w h i c h l a t e r c a n b e b r i d g e d t h r o u g h t r a i n i n g a n d
development or through employees ' se l f - in i t ia ted ef for ts . Th is fu r ther he lps in for mulat ing more accurate
te rms and p lan t r a i n i ng ac t i v i t i e s , t ha t l eaves l i t t l e m i sma tch be tween t r a i n i ng needed and t r a i n i ng
prov ided. Th is paper repor ts a case s tudy re la t ing to competency based t ra in ing need assessment for
H e a d P l a n n i n g a n d P r o d u c t i o n a t I n k M a n u f a c t u r i n g f i r m , t h r o u g h f o u r s t a g e p r o c e s s n a m e l y -
Conceptua l izat ion, Ins t rument Const ruct ion, D iagnos is and Ana lys i s and Unf reez ing.
Abstract
U
Case in Competency:Training need Assessment
Anitha Thomas and Anirudha Panchal
Bridging Gap
nlike other resources, human being is the only assetthat can appreciate with useful inputs. It is one suchasset that adds value to itself with respect to time.
And therefore it is consi-dered as a resource that canbe cultivated by the manureof training and develop-ment. But is this manureresu l t ing in h igher pro-ductivity? More value formoney? The struggle forevaluating this continues.The training and develop-ment managers of today aretoiling hard to convince themanagement that investmentin training yield results thatare not much different thatthe investment in variousprojects.
12345678901234567890123456789012123456789012345678901234567890121123456789012345678901234567890121234567890123456789012345678901211234567890123456789012345678901212345678901234567890123456789012112345678901234567890123456789012123456789012345678901234567890121123456789012345678901234567890121234567890123456789012345678901211234567890123456789012345678901212345678901234567890123456789012112345678901234567890123456789012123456789012345678901234567890121123456789012345678901234567890121234567890123456789012345678901211234567890123456789012345678901212345678901234567890123456789012112345678901234567890123456789012123456789012345678901234567890121123456789012345678901234567890121234567890123456789012345678901211234567890123456789012345678901212345678901234567890123456789012112345678901234567890123456789012123456789012345678901234567890121123456789012345678901234567890121234567890123456789012345678901211234567890123456789012345678901212345678901234567890123456789012112345678901234567890123456789012123456789012345678901234567890121123456789012345678901234567890121234567890123456789012345678901211234567890123456789012345678901212345678901234567890123456789012112345678901234567890123456789012123456789012345678901234567890121123456789012345678901234567890121234567890123456789012345678901211234567890123456789012345678901212345678901234567890123456789012112345678901234567890123456789012123456789012345678901234567890121123456789012345678901234567890121234567890123456789012345678901211234567890123456789012345678901212345678901234567890123456789012112345678901234567890123456789012123456789012345678901234567890121123456789012345678901234567890121234567890123456789012345678901211234567890123456789012345678901212345678901234567890123456789012112345678901234567890123456789012123456789012345678901234567890121123456789012345678901234567890121234567890123456789012345678901211234567890123456789012345678901212345678901234567890123456789012112345678901234567890123456789012123456789012345678901234567890121123456789012345678901234567890121234567890123456789012345678901211234567890123456789012345678901212345678901234567890123456789012112345678901234567890123456789012123456789012345678901234567890121123456789012345678901234567890121234567890123456789012345678901211234567890123456789012345678901212345678901234567890123456789012112345678901234567890123456789012123456789012345678901234567890121123456789012345678901234567890121234567890123456789012345678901211234567890123456789012345678901212345678901234567890123456789012112345678901234567890123456789012123456789012345678901234567890121123456789012345678901234567890121234567890123456789012345678901211234567890123456789012345678901212345678901234567890123456789012112345678901234567890123456789012123456789012345678901234567890121123456789012345678901234567890121234567890123456789012345678901211234567890123456789012345678901212345678901234567890123456789012112345678901234567890123456789012123456789012345678901234567890121123456789012345678901234567890121234567890123456789012345678901211234567890123456789012345678901212345678901234567890123456789012112345678901234567890123456789012123456789012345678901234567890121123456789012345678901234567890121234567890123456789012345678901211234567890123456789012345678901212345678901234567890123456789012112345678901234567890123456789012123456789012345678901234567890121
M s . A n i t h a T h o m a s , F a c u l t y , G I D C R o f e l I n s t i t u t e o fManagement S tud ies , P lo t No .14/5 , Cha rvada Road , G IDCVa p i , G u j a r a t - 3 9 1 6 9 5 , E m a i l : a n i t h a _ t o m @ r e d i f f
ma i l . com
Mr.Anir udha Panchal , D.G.M. - HR Micro-Inks Ltd. , Corporate
House , B i l a k h i a House , Muk t anand Road , Cha l a , Vap i ,Gu ja ra t -391691, Emai l : pancha l [email protected]
The aspect of training evaluation is getting more and morerelevant in the current times. Each and every activity of anorganization is being looked at in terms of being value added
or non value added. Variousmodels have been proposedby lea rned schola rs toevaluate training at variouslevels. The quest however isstil l on to identify variousmetrics so as to understandthe results of training. It hasbeen quite in fashion nowto look at training not as acost center but as a strategicinvestment. No wonder com-panies are talking of return oninvestment in training.
Business results offer directmetrics that show the effect

SCMS Journal of Indian Management , April - June, 2010. 6
A Quarterly Journal
of any such initiative, correlating with a particular training inputthough is still and challenge and is full of subjectivity. It is stillan open game for the training and development manager to beplayed to earn the favour of the management and similar forthe management to prove it otherwise.
In such a situation the question is what can best explain theresult of a training input; the answer seems to lie in using theconcept of competency. This concept offers an opportunityto the evaluator to observe the change in competency asmanifested in the behaviour of the individual at workplace.Competency as widely understood is the sum total ofknowledge, skills and attitudes that makes a person performsa task well. It means the behaviours necessary for the job to beperformed well. It therefore focuses on the process morethan the results. This fur ther indicates that sound processeswould lead to desired results. There are very few companiesthat feel it is important to understand the shared values of theorganization and whether that would lead them to theachievement of ultimate goal of the organization. Quite a fewof them have realized how important are the values to be ableto align the total workforce to a common goal. This is nothingbut a conscious effort to focus on the means towards theends!!
Organizations have gone through really unpleasant experienceswhen the focus is only on the results. An employee is not allalone in the organization. His role is not merely to achieve hisown objectives and targets but also needs to be a collaborativemember of the system that is together trying to achieve. Everyperson with his or her actions within the organizational systemdetermines how smooth and conducive the environment isfor everyone to achieve. As a matter of fact every individual’scollaborative behaviour acts as a lubricant in the machinethereby increasing the eff ic iency of the machine. Fororganizations to grow, they need to focus more on thecollective effort than on the individual effort. Competencyassessment and monitoring helps to identify the function andnot so functional behaviours. This subject has received littleattention in the business world. A conscious effor t totranscend the individuals from not so functional to functionalbehaviour could be a worthwhile path to be taken by thetraining and development function. Evaluation of these subtlechanges in behaviour that are the manifestations of theenhanced competencies is the subject matter of the topicCompetency Based Training Evaluation.
The Background
Company A is an Indian multi-national manufacturer of a rangeof products in printing inks. The company has been in operationfor over 20 years. Since its very beginning, Company A hasremained strongly committed to the printing industry. This isreflected in high levels of investments they made not only tomanufacture inks but also the key raw materials like pigments,resins, varnishes, additives etc. Today the company is amongstthe few ink companies in the world having such high degreeof backward integration.
Company A manufactures printing inks for publications,packaging and other general purpose applications. It wasestablished in 1987 and listed on India’s stock markets in 1991.By 1997, it was the number one player in domestic marketsand by 2004 it become the world’s top 15 ink companies witha presence in over 52 countries. In 2006, it entered into a jointventure with a German company, and the company is nowamong the world’s top five ink companies. Today, Company Ahas a sales turnover of Rs. 12292 million (FY2006). The totalmanufacturing plant is organized into: Resin Plant, Varnish Plant,Alkali Blue Pigment Plant, Seamless Ink Plant, R&D Plant and 3Ink Manufacturing Plant.
The Context
The ‘boundary ’ of this study for Company A was identified asencompassing the CBTA intervention that occurred for theHead Planning and Production. Company A had brought aboutchanges to its workforce in the early 2000’s, as it sought to beglobally competitive, and had under taken a process ofrestructuring the role of its employees specially Planning andProduction, and that’s why Head P&P who directly makes animpact in restructuring was studied as case. As part of the roleof Head P&P required having centralized control over all theplant functioning, and for the organization competitivenesshis role and the job are very critical.
The Work
Competency Based Training Model focuses on four stageprocess:
1. Conceptualization2. Instrument Construction3. Diagnosis and Analysis4. Unfreezing

SCMS Journal of Indian Management , Apr i l - June, 2010. 7
A Quarterly Journal
Figure 1: The CBTA Model
A systemat ic and thorough investment in a l l the fourApproaches leads to the ultimate objective of Training NeedIdentification. As per the survey findings for training needidentification, personal interviews are most widely adoptedoption (83 percent), direct interfacing with the workplace (80percent), and evaluation of performance/productivity measures(75 percent), questionnaire survey (66 per cent), andorganization analysis (64 percent). As per the study findings,among different methods of training need assessment such asdirect observation, interviews, surveys, group discussions, etc‘questionnaire based survey’ is by far most commonly followedtechnique (Sah, 1991) and very recently Competency BasedTraining Need Assessment has proved to be the best option.
This model lays heavy emphasis on strong ground work in thefollowing stages:
1. Job Description and analysis
2. Identification of competencies to perform this job well
3. Defining Competencies
4. Developing reliable and valid instruments to identify the
level at which and individual is operating.
Job Description and Analysis
Job descriptions are lists of the general tasks, or functions,and responsibil it ies of a position. Job descriptions areusually developed by conducting a job analysis, whichincludes examining the tasks and sequences of tasksnecessary to perform the job. The analysis looks at the areasof knowledge and skills needed by the job. Job descriptionand analysis becomes necessary when competency basedassessment conceptua l i za t ion i s to be drawn. Thebackground helps in assessing what in the job is to bestudied for, the purpose of the job, dimensions, majoractivities, and accountability.
Role of the Head Planning and Production
Purpose of the Job
The purpose of this job is to coordinate with variousdepartments, plan and direct production activities, analyzedata of operations in order to ensure costs within specifiedlimits, internal customer satisfaction, safe working practices,statutory compliance, competent and enthusiastic workforce.

SCMS Journal of Indian Management , April - June, 2010. 8
A Quarterly Journal
Dimensions
1. Total No. of Subordinates : 62. Annual Operating Budget : 35 crores3. Total number of employees : 1000
Major Activities
1. Convert sales forecast into a production plan2. Monitor plant level yield and cost parameters3. Drive quality, cost and yield improvement initiatives4. Ensure cross departmental harmony5. Set targets for plant in charges6. Carry out periodic performance reviews7. Finalise production budgets8. Suggest process improvement ideas9. Identify and develop competence
Accountability
1. Cost and quality targets achieved.2. Enhanced competence of the workforce3. Sound systems in place
4. Performance Oriented production activities.5. Compliance to Quality, Environment and OH&S
management systems.6. Efficient production processes
Identification of Competencies
To Conceptualize the competency identification, the jobanalysis result culminates in the knowledge, skills and attitude.It needed to be conceptualize around the people who arealready successful in similar jobs and identify how they dowhat they do and what has made them successful in theirfields has helped in defining the competencies required forhead P & P. An exploration for Second Approach: InstrumentConstruction starts with the stratification of key competenciesunder the major categories of Functional Knowledge, FunctionalSkills and Functional Attitude requirements.
Each Competency is then defined in terms of the majorelements of that par t icular competency. This lays thefoundation to identify various descriptors graduating froma base to higher levels of behaviour as manifestations ofthat competency.
Table-1: Job Competencies and Descriptors
J o b c o m p e t e n c i e s /J o b c o m p e t e n c i e s /J o b c o m p e t e n c i e s /J o b c o m p e t e n c i e s /J o b c o m p e t e n c i e s / F U N C T I O N A LF U N C T I O N A LF U N C T I O N A LF U N C T I O N A LF U N C T I O N A L F U N C T I O N A L S K I L LF U N C T I O N A L S K I L LF U N C T I O N A L S K I L LF U N C T I O N A L S K I L LF U N C T I O N A L S K I L L KEYKEYKEYKEYKEY Desc r ip t ionsDesc r ip t ionsDesc r ip t ionsDesc r ip t ionsDesc r ip t ions K N O W L E D G EK N O W L E D G EK N O W L E D G EK N O W L E D G EK N O W L E D G E R E Q U I R E M E N T SR E Q U I R E M E N T SR E Q U I R E M E N T SR E Q U I R E M E N T SR E Q U I R E M E N T S AAAAATTTTT T I T U D E S / T RT I T U D E S / T RT I T U D E S / T RT I T U D E S / T RT I T U D E S / T R A I T SA I T SA I T SA I T SA I T S
R E Q U I R E M E N T SR E Q U I R E M E N T SR E Q U I R E M E N T SR E Q U I R E M E N T SR E Q U I R E M E N T S
• Organization and • Interpersonal • Emotional Stabi l i ty
Business Awareness • Systems thinking • Asser t iveness
• Ink manufacturing and • Analyt ical Thinking • Persistence
trouble shooting • Planning and • Customer
• Pr int ing Inks and its organizing orientation
application • Team Leadership • Initiative
• Knowledge of
customer needs
• F inancial
Performance
Indicators

SCMS Journal of Indian Management , Apr i l - June, 2010. 9
A Quarterly Journal
Functional Knowledge Requirements
1. Organization and Business Awareness
The job needs:
a. Understanding of the economic drivers in industry andhow value is created at all levels in the organization.
b. Knowledge to pro-actively scan the market place forinformation on political, economic, and technological andother developments outside the normal boundaries ofthe business.
c. The understanding of how the organization is positionedfor the future relative to its environment.
2. Ink manufacturing and trouble shooting
a. The job calls for proficiency in the ink manufacturingtechnologies and the awareness of the problems and inkperformance issues.
b. It needs the knowledge of conditions required for optimalperformance, and all parameters related to various printingmachines.
3. Printing Inks and its applications
a. The job needs indepth knowledge of pr int ing inktechnology and applications of various categories of inks.
b. The incumbent should have the knowledge to be able torecommend a particular ink suiting the substrate and theoperating conditions.
4..... Knowledge of customer needs
a. The job needs the knowledge of critical business intereststo be able to negotiate with significant internal and externalstakeholders and builds par tnerships with them.
b. The person should be fully familiar with customer researchso that strategies meet customer needs.
c. He should have the knowledge of the manufacturing nichethe company has viz a viz competitors.
5. Financial Performance Indicators
a. The job needs awareness on various financial metrics thatproject the performance of the production and planning.
b. It also needs thorough information on various cost elementsand factors leading to those costs.
c. It needs the knowledge of available resources for optimalperformance.
Functional Skill Requirements
1. Interpersonal
It is the ability to act in a manner consistent with the values ofthe organization and influence others to adopt them. It involvescreating approachability at all times. It also involves the abilityto build effective relationships with others and present ideaspersuasively and confidently.
2. Systems thinking
It is the ability to analyze a systemic model in context ofcontrasting data, sense the trend and take appropriate actions.It is the ability to detect cause and effect relationships and theability to detect unintended consequences of a decision inany part of the system.
3. Analytical Thinking
It is the ability to carryout indepth analysis of a problem or asituation highlighting out the obvious and apparent causes. Itis the ability to effectively get to the root cause of a problemusing various data in a logical and rational manner.
4. Planning and organizing
It is the ability to organize activities and allocate resourcescost-effectively, and take into account the skills mix within thework group or team. It is the ability to plan effectively keepingthe best balance of resources including human, financial andtechnological resources to meet organizational goals.
It is the ability to identify and anticipate future oppor tunitiesand potential problems and incorporate contingency (“whatif ”) plans into the planning process.

SCMS Journal of Indian Management , April - June, 2010. 10
A Quarterly Journal
5. Team Leadership
It is the ability to foresee the conflicts and the ability to minimizethe same before it arises. It involves the disposition to givefreedom to work within the framework.
It also includes the ability to spot talent, utilize them effectivelyand coach them for enhanced performance.
It also involves communicating business opportunities andcreating a vision that excites and motivates others.
Key Attitudes/Traits
1..... Emotional Stability
It is displayed by the ability to withstand emotional pressuresand exercise composed approach in various situations withoutbeing upset or tensed.
2. Assertiveness
It is displayed by the ability to state clearly the expectationsand take relevant actions in the interest of the company withouthaving fear for loss of favour.
3. Persistence
It is displayed by the ability to take actions relentlessly improvingthe intensity of actions on every attempt to deal with allobstacles.
4. Customer Orientation
I t is displayed by the abil i ty to negotiate crit ical businessi n t e r e s t s w i t h s i g n i f i c a n t i n t e r n a l a n d e x t e r n a lstakeholders and bui lds par tnerships with them. I t a lsocan be a sce r t a i ned ba sed on t he f am i l i a r i t y w i t hcustomer research so that s t ra teg ies meet customerneeds.
5. Initiative
It is displayed when the people exceeds the bounds of onesformal authority and take actions in the interest of theorganization
Developing Instrument
Having developed the scales, the next activity was tochoose the tools among those identif ied to test eachcompetency and develop a matrix giving details of whattools shall be used to test a par ticular activity. Each toolwas constructed in detail so that it should gather evidencetowards what level of behaviour is demonstrated or l ikelyto be demonstrated by the person. These tools wereconstructed so that checking the group behaviour andindividual behaviour could be possible thus, the thirdapproach Diagnosing the KSA level and fur ther Analyzingthe gap could be initiated.
Table-2: Competencies- Tool Matrix
Sl. Competencies/Tools In Case Role Business Presen- PsychoNo. Basket Study Play Game tation metric test BEI1 Organisation and
Business Awareness2 Ink manufacturing and
trouble shooting3 Printing Inks and its
applications4 Knowledge of
customer needs5 Financial Performance
Indicators6 Interpersonal 7 Systems thinking

SCMS Journal of Indian Management , Apr i l - June, 2010. 11
A Quarterly Journal
8 Analytical thinking9 Planning and organizing10 Team leadership11 Emotional stabil ity12 Asser t iveness13 Persistence14 Customer orientation15. Init iat ive
The holistic understanding reflects how the 15 competenciesfor the job of Head Planning and Production can be assessed,through seven intrusments via, in basket exercise, case study,role play, business game, presentation, psychometric test andbehavioural event Interview
Competency Assessment: Diagnosis and Analysis
The Activities: 1 in Basket Exercise
The whole module is divided in 5 activities where the role ofHead Planning and Production is to be played, and this positionis newly created. It is to be assumed that early this unit wasmanaged by Director Operations and the role needs to reportdirectly to Director Operations. The department includes fourplants, headed each by a plant in charge. Each plant in chargereports to role.
The items are:
A) analyzing the performance of the plant in the last 15
years and later give recommendations,
B) handling customer complaints regarding the ink
property not being up to the mark
C) other customer complaint regarding ink light fastness
D) detailing the customer complaints report which need
to be pulled out from SAP
E) review of current system and put appropriate system in
process development
Table - 3: Itemwise Evaluation Matrix (In Basket Exercise)
Competency Item A Item B Item C Item D Item E
Organisation and
Business Awareness
Analytical thinking
Customer orientation
Systems thinking
Knowledge of
customer ’s needs

SCMS Journal of Indian Management , April - June, 2010. 12
A Quarterly Journal
For each item the role need to indicate the decision and actions,any plan/proposal, the rationale for the actions or any otherrelevant information sought and the justification thereof. Therole might mention assumptions if any unless specified in thecontent of the In-Basket and based on the exercise evaluationare marked.
The competencies assess through this exercise was judgedamong three levels namely:
Initial level - - - - - Indicating the person under observation showssigns of presence of this competency but not fully manifestedin action.
Developing levelDeveloping levelDeveloping levelDeveloping levelDeveloping level - - - - - Indicating the person under observationhas displayed this competency in a few areas through hisrecommendations and proposals.
Proficient- - - - - Indicating that the person under observation haswidely displayed this competency in various recommendationsand proposals.
The Activities: 2 Case Study
Case study was developed where a case company’s data wereprovided. It was sought that the company has been ailing offlate on various accounts. With a wide spectrum of products itwas finding it difficult to cope with the pressing productionrequirements. Datas of 5-year were provided on growth inmanufacturing capacities for various products, growth in actualproduction in various products, capacity utilization for variousproducts and customer complaints data for printing inks.
Looking into the data the trainee was asked to analyze thedetails and recommend appropriate measures and action planto the management to revive the case company.
The competencies were then assessed on three levels theInitial level where recommendations indicate limited presenceof competenc ies on the fou r competenc ies underobservation. Developing level where recommendationsindicate reasonable presence of competencies and last stageProficient level where recommendations indicate highpresence of competencies.
The Activities: 3 - Role Play
Case:Case:Case:Case:Case: Here the trainee had played the role of head ofmanufacturing at ABC Chemicals. Background of the study wasthat the management has taken serious steps to boost theperformance management efforts. Ramesh who is the plant incharge of the inks plant has of late have gone down onperformance. Ramesh is an extremely emotional person andfinds difficult to take harsh comments and at times gets abusivewhen challenged. Trainee was asked to counsel him on hisperformance issue and develop a performance improvementplan. One of the volunteers will play Ramesh.
Assessment – Role Play was rated on 10 point scale, andanalysis was done of the following parameters.
0 – Absence of the competency
5 – Competency displayed showed above average levels.
10 – Proficient display of the competency
Ta b l e - 4 ( A ) : Role Play Assessment
Competency Evidences that displayed the competency Rating (0 to 10)Interpersonal
Asser t iveness
Pers istence
Emotional Stabi l i ty
The Activities: 4 – Business Game
Trainee was given 5 volunteers. The game was to understandhow the trainee makes maximum resource utilization with dueconcern for the quality.
Case: Trainee heads a Boat manufacturing company and
it has got 50 boats order from the customer. The customer
has also sent a sample so that the end products match
the sample . Tra inee has to accompl i sh the task by

SCMS Journal of Indian Management , Apr i l - June, 2010. 13
A Quarterly Journal
estimating, organizing the team and delegating the teamfor making the boats in 60 minutes out of material givento him.
0 – Absence of the competency5 – Competency displayed showed above average levels.10 – Proficient display of the competency
Table-4 (B): Business Game Assessment
Competency Evidences that displayed the competency Rating (0 to 10)P lann ing and Organiz ing
Team Leadership
Customer Or ientat ion
The Activities: 5 – Presentation
Case: Trainee was asked to create a presentation for groupof customers, clarifying the following aspects:
1. Ink Manufacturing and trouble shooting
2. Printing Inks and its applications
3. Knowledge of customer needs
4. Financial performance indicators and their
implication in the production functions
The competencies assessment through this activity was:Initial level - Indicating the person under observation showssigns of presence of this competency but not fully manifestedin action.
Developing level - Indicating the person under observationhas displayed this competency in a few areas through hisrecommendations and proposals.
Proficient - - - - - Indicating that the person under observation haswidely displayed this competency in various recommendationsand proposals.
Presentation
The Activities: 6 – Psychometric Test 16 pf
16 PF is an abbreviation for the 16 Personality Factors multivariate-derived by psychologist Raymond Cattell. It is a test that drawsa profile in reference to the following personality factors.
Warmth, Reasoning, Emotional Stability, Dominance / Assertive,Liveliness, Rule-Consciousness, Social Boldness, Sensitivity,
Vigi lance, Abstractedness, Private-ness, Apprehension,Openness to Change, Self-Reliance, Perfectionism and Tension
• Each factor is measured on a scale of 1-10.
• Each factor has a ‘Right’ meaning (8-10) and a ‘Left’meaning (1-3).
• The factor name represents the ‘Right’ meaning.
• There is no ‘Good’ or ‘Bad’ orientation about anyfactor.
• The score is indicative of a certain level or type ofbehaviour.
• The appropriateness of the behaviour depends onthe context.
The test gives a profile in terms of how much is each factorpresent in the person and gives an idea in terms of how muchis the person likely to display that behaviour. No evaluationwas done as it was self explanatory.
The Activities: 7 Behaviour Event Interview
Finally, a behavioural interview was structured to collectinformation about past behaviour.
Case::::: Sample questions:
o Tell me about a time when you were on a team, andone of the members wasn’t doing his or her share.
o Tell me about a time when you felt a need to updateyour skills or knowledge in order to keep up withthe changes in technology. How did you approachthat?
SCMS Journal of Indian Management , April - June, 2010. 14
A Quarterly Journal
o Describe a time when a customer got angry with you.How did you react? How did you resolve thesituation?
o Please give me an example of a time when you tookthe initiative to improve a specific work process.
o Tell me about a time when a customer requestedspecial treatment that was out of the scope of normalprocedures. What was the situation and how didyou handle it?
o Describe a time when you had to use logic and goodjudgement to solve a problem.
o Tell me about a time when you had to cope with astressful situation.
o Give me an example of a time when you used yourfact-finding skills to solve a problem.
o Describe a time when you put your needs aside tohelp a co-worker understand a task. How did youassist them? What was the result?
The competencies Assessed were emotional stabi l i ty,assertiveness, persistence, initiative and analytical thinking. Italso had three levels, Initial level - Indicating the person underobservation shows signs of presence of this competency butnot fully manifested in action.
Developing level - Indicating the person under observationhas displayed this competency in a few areas through hisrecommendations and proposals.
Proficient level - - - - - Indicating that the person under observationhas wide ly d isp layed th i s competency in va r iousrecommendations and proposals.
Complete evaluation analysis had helped in identifying the gapswhich lead to the fourth approach ie the unfreezing stage.Unfreezing stage is necessary because before any change canoccur, people must believe the change is needed and thechange in competencies level can happen when the gap
agreement is there and to agree, counseling is a tool whichunfreezes the learning mind. The counselee is explained whythe responses he/she gave were superior or inferior withrespect to the expected results of the job. An agreement isreached as to the gaps visible in the manifested behaviour.This forms the very important unfreezing aspect of any learningprocess. Generally training needs are identified through varioussources but little effort is made in terms understanding theneeds of the person or the issues faced by the person. It isvery important that before the person is exposed to the traininginputs, he/she owns the reality.
Once the person owns the reality, the gap is considered to bean appropriate training and development need and it can befurther developed into:
• Designing the training input based on the gaps
• Sustaining the inputs over a period of time
• Reassess ing the ind iv idua l aga ins t the samecompetencies
• dent i fy ing i f the indiv idual has demonstratedbehaviour that is different from the ones pre training– Evaluation.
Conclusion
The purpose of the s tudy was to bui ld knowledge andt h e o r y i n r e l a t i o n t o t h e i m p l e m e n t a t i o n o fcompe tency - ba sed s y s t ems i n t he wor kp l ace byinvest igat ing Head P lann ing and Product ion ro le andjob. The s tudy sought to determine how through ane f f e c t i v e a C B TA s y s t e m ; o n e c a n i n c r e a s e i t senterpr ises ’ compet i t iveness and product iv i ty .
Th is case s tudy demonst ra tes the va lue of tak ing anenterpr i se focus in deve loping appropr ia te t ra in inga r r a n g e m e n t s . C o n s i d e r a b l e e f f o r t h a s g o n e i n t op roduc ing i ndus t r y -w i se s t anda rds i n competencya s se s smen t . T he cha l l e nge i s t o se t s t a nda rd s toachieve cons is tency but a lso to ensure that they areadapted to the needs of organ izat iona l e f fect iveness .Th i s case not on ly conf i r ms the impor tance of thecompany ’s v is ion but a lso the va lue that comes f roml ink ing recogn i t ion and t ra in ing a r rangements in to awider emerg ing set of indust ry sk i l l s .

SCMS Journal of Indian Management , Apr i l - June, 2010. 15
A Quarterly Journal
The case study demonstrates, how the approaches and stagesif properly weaved can lead to considerable change in thecompetency level, which in turn affects the potential of thejob-doer. The value addition by a competency-based approachdepends on a number of factors: (i) extent to which thecompetency study is based on the strategic needs of theorganization; (ii) clarity with which the role or job is defined inrelation to the strategy; (iii) rigour of the process used in definingthe competencies; and the accuracy in matching individualsvis-à-vis job needs.
The legacy of a company’s assessment center has made manydevelopments which has imitated change in workplaceactivities and has been successful in addressing the deficiencyareas with a change.
Keywords: Competency Assessment, Tra in ing NeedAnalysis, Job Competencies
Bibliography and Reference
K r i s h n a v e n i R . “ C o m p e t e n c y B a s e d Tr a i n i n g N e e dAssessment for a Compressor Manufactur ing
Unit.” Management and Change. Volume 9, Issue2, 2005.
R icha rd Cu r ta in and He len Or mond. “ Imp lement ingCompetency-Based Training in the Workplace: ACase Study in Workforce Par t ic ipat ion.” As iaPac i f ic Journa l of Human Resources. 32 (2) :(1993): 133-143.
Sah A.K “System Approach to Training Programmes.” InfinityBooks. New Delhi: 1991.
S a n g h i , S e e m a . “ T h e H a n d b o o k o f C o m p e t e n c yM a p p i n g : U n d e r s t a n d i n g , D e s i g n i n g a n dI m p l e m e n t i n g C o m p e t e n c y M o d e l s i nOrgan izat ions .” Response Books . New Delh i :2004.
S y l v i a C . M e l a n c o n a n d M a r t h a S . W i l l i a m s .“ C o m p e t e n c y - B a s e d A s s e s s m e n t C e n t e rD e s i g n : A C a s e S t u d y . ” A d v a n c e s i nDeve lop ing Human Resources . Vo l .8 , No .2 ,(2006): 283-314.
SCMS Journal of Indian Management , April - June, 2010. 16
A Quarterly Journal
12345671234567123456712345671234567123456712345671234567123456712345671234567123456712345671234567123456712345671234567123456712345671234567123456712345671234567123456712345671234567123456712345671234567123456712345671234567123456712345671234567123456712345671234567123456712345671234567123456712345671234567123456712345671234567123456712345671234567123456712345671234567123456712345671234567123456712345671234567123456712345671234567
1234567123456712345671234567123456712345671234567123456712345671234567123456712345671234567123456712345671234567123456712345671234567123456712345671234567123456712345671234567123456712345671234567123456712345671234567123456712345671234567123456712345671234567123456712345671234567123456712345671234567123456712345671234567123456712345671234567123456712345671234567123456712345671234567123456712345671234567
S1234567890123456789012345678901212345678901234567890123456789012345678901234567890121234567890123456789012345678901234567890123456789012123456789012345678901234567890123456789012345678901212345678901234567890123456789012345678901234567890121234567890123456789012345678901234567890123456789012123456789012345678901234567890123456789012345678901212345678901234567890123456789012345678901234567890121234567890123456789012345678901234567890123456789012123456789012345678901234567890123456789012345678901212345678901234567890123456789012345678901234567890121234567890123456789012345678901234567890123456789012123456789012345678901234567890123456789012345678901212345678901234567890123456789012345678901234567890121234567890123456789012345678901234567890123456789012123456789012345678901234567890123456789012345678901212345678901234567890123456789012345678901234567890121234567890123456789012345678901234567890123456789012123456789012345678901234567890123456789012345678901212345678901234567890123456789012345678901234567890121234567890123456789012345678901234567890123456789012123456789012345678901234567890123456789012345678901212345678901234567890123456789012345678901234567890121234567890123456789012345678901234567890123456789012123456789012345678901234567890123456789012345678901212345678901234567890123456789012345678901234567890121234567890123456789012345678901234567890123456789012123456789012345678901234567890123456789012345678901212345678901234567890123456789012345678901234567890121234567890123456789012345678901234567890123456789012123456789012345678901234567890123456789012345678901212345678901234567890123456789012345678901234567890121234567890123456789012345678901234567890123456789012123456789012345678901234567890123456789012345678901212345678901234567890123456789012345678901234567890121234567890123456789012345678901234567890123456789012123456789012345678901234567890123456789012345678901212345678901234567890123456789012345678901234567890121234567890123456789012345678901234567890123456789012123456789012345678901234567890123456789012345678901212345678901234567890123456789012345678901234567890121234567890123456789012345678901234567890123456789012123456789012345678901234567890123456789012345678901212345678901234567890
P r o f . Pa n k a j M . M a d h a n i , A s s i s t a n t P r o f e s s o r,I C FA I B u s i n e s s S c h o o l ( I B S ) , I B S H o u s e ,N e a r G N F C I n f o To w e r, S G Ro a d , B o d a k d e v,A h m e d a b a d - 3 8 0 0 5 4 , G u j a r a t , E m a i l :panka j .madhan i @gma i l . com
SCM and Marketing Management:Mutual Integration
Pankaj M.Madhani
W i t h o u t e f f e c t i v e s u p p l y c h a i n m a n a g e m e n t , f i r m s c a n n o t f u l f i l l t h e i r
p r o m i s e s a n d d e l i v e r o n t h e p r o m i s e s m a d e t o c u s t o m e r s . P o o r
s u p p l y c h a i n m a n a g e m e n t i s t h e c a u s e o f t h e f a i l u r e o f m a n y b r a n d i n g
s t r a t e g i e s . T h e p a p e r h i g h l i g h t s a d v a n t a g e s o f i n t e g r a t i o n b e t w e e n s u p p l y c h a i n a n d
m a r k e t i n g m i x s t r a t e g y . I t d e m o n s t r a t e s h o w s u p p l y c h a i n m a n a g e m e n t c a n l e v e r a g e t h e
s t r e n g t h s o f m a r k e t i n g m i x s t r a t e g y . I t s h o w s f r a m e w o r k o f m a r k e t i n g a n d s u p p l y c h a i n
m a n a g e m e n t i n t e r d e p e n d e n c e a n d i t s i m p l i c a t i o n s . T h e p a p e r p r o p o s e s S C - M M m a t r i x f o r
f u r t h e r r e s e a r c h i n t h i s a r e a .
Abstract
Logistics
upp ly Cha in Management (SCM) approach hasgrown significantly since the early 1990s, althoughthe init ial approach was introduced in early 1980
(Oliver and Webber, 1982). SCM can broadly be definedas “ the management o f ups t ream and downs t reamrelationships with suppliers andcustomers in order to createenhanced value in the final marketplace at less cost to the supplychain as a whole” (Christopher,1998). SCM systems coordinatea n d i n t e g r a t e t h e f l o w o fm a t e r i a l s , i n f o r m a t i o n , a n df i n a n c e s f r o m s u p p l i e r t omanufacturer to wholesaler toreta i ler to the end consumer.SCM has been conceptualizedas the total flow of a distributionchannel from the supplier to the
ultimate user (Ellram and Cooper, 1990; Cooper and Ellram,1993; Cooper et al., 1997).
SCM focuses on efficiency of supply (i.e. cost reduction)and also effectiveness of supply (i.e. customer service),
whi le market ing mix strategy ismore concerned on the demands i d e o f t h e f i r m . O b v i o u s l y ,toge the r, t hey de te r m ine thefirm’s profitabil ity and long termcompet i t i ve advan t ages . Thesyne rg i e s be tween SCM andma r ke t i n g h a ve been w ide l yacknowledged (e.g. Mar tin andGrbac , 2003 ; E l l i nge r, 2000 ;Soonhong Min and John Mentzer,2000; Svensson, 2002), leadingPiercy (2002) to conclude thattheir better coordination could

SCMS Journal of Indian Management , Apr i l - June, 2010. 17
A Quarterly Journal
define competit ive advantage in new ways. Within thesupply chain as well as the marketing l iterature, the needto link both sides has already been emphasized. Influenceof SCM in areas which were originally domain of marketing,is increasingly recognized. According to Fl int (2004),ef fect ive market ing strategy implementat ion demandssound supply cha in management , as i t in f luences a l lcomponents of a marketing mix strategy. The rational oft h i s p a p e r i s t o e m p h a s i z e t h a t c u s t o m e r v a l u eenhancement is done through the integration of supplychain with marketing mix strategy. Main purpose of thispaper is to fur ther explore convergence of SCM andmarketing mix strategy and propose a matrix for fur therresearch in this area
Marketing and Marketing Mix Strategy
The marketing mix of Product, Price, Promotion, and Place,also known as four P’s of marketing was introduced by E.Jerome McCar thy in 1960. Since then, there have beenmany advances in marketing thought and conceptualization,inc lud ing the broaden ing of the market ing concept(1970s), an emphasis on the exchange transaction (1980s),the development of Relationship Marketing and Total QualityManagement (1990s) , and most recent ly (2007) anemphasis on society at large. The American Marketing
Associat ion (AMA) has unvei led a new def in i t ion ofmarketing in October, 2007 to reflect its broader role inthe society. The new definit ion reads, “Marketing is theactivity, set of institutions, and processes for creating,communicating, delivering, and exchanging offerings thathave value for customers, clients, par tners, and society atlarge.”
In terms of the four P’s, marketers sought to produceproducts that were desired by consumers at a price thatwould be attract ive, using promotion to indicate thebenefits they offered over the competitors, and makingthem available at a place of the customers’ convenience.McCar thy ’s four P’s provided a suitable, effective andpowerful nomenclature for the study and analys is ofmarketing strategy. Over the years, a number of researchershave sought to enhance the four P’s by adding other itemsthat they believed were critical to marketing management.Addit ional var iables suggested for inclus ion into themarketing mix are Packaging (Patty, 1997) and People(Baker, 1997). It has also been suggested that the l ist beexpanded to include Personnel, Physical facil it ies, andProcess management (Magrath, 1986). Despite al l thechanges of the past 49 years, the basic structure of thefour P’s represents an essentially valid construct in currentsituation also.
Table 1: K-Mart Vs Wal-Mart
Year 2001 K-Mart Wal-MartNo. of reta i l out lets: 2199 2624
Sales: 3rd quar ter $8 B i l l ion $52.7 B i l l ion
% change - 2.2 % 15.5 %
Ful l year $36 B i l l ion $139 B i l l ion
Prof i t / (Loss): F i rst 3 quar ters ($344 Mil l ion) $4.4 Bi l l ion
Inventory Turnover Rat io 3.6 7.3
Relat ionship between
Supply Chain and Market ing Mix
Strategy: Divergence Convergence
Performance of retai ler F i led bankruptcy on Growth in
in 2001-02 January 22, 2002 margin and sales

SCMS Journal of Indian Management , April - June, 2010. 18
A Quarterly Journal
K-Mart Vs Wal-Mart : Impact of SCM andMarketing Mix Strategy
To study impact of supply chain management and marketingmix strategy on retailers’ performance, it’s imperative tocompare operations of K-Mar t and Wal-Mar t during year2001-02. Both K-Mar t and Wal-Mar t were founded in 1962as discount retailers in US. Comparison of key statistics forK-Mar t and Wal-Mar t is given below in Table - I.
K-Mart : Divergence of Supply Chain andMarketing Mix Strategy
For K-Mar t there seems to be a lack of synergy betweenSCM and marketing strategy. A central aspect of K-Mar t’smarketing communication strategy was to issue pamphletsand c i rcu la r s fo r promot ing sa le i tems . The ma i le r sincreased store traffic and invariably increased store sales.However, the marketing effor ts were not tied into supplychain operations. As a result, there were frequent shor tagesof promoted sale items. Customers came in to buy thesale item, were frustrated that it wasn’t there, and left theK-Mar t s tore wi th d issat i s fact ion. Af ter severa l suchrepeated experiences, customers began ignoring the K-Mar t’s promotional circulars altogether.
B rand image i s noth ing but cus tomers ’ exper ience .Customer experience comes through various aspects suchas p roduct , peop le , p rocesses and promises . Thecustomers also come with an expectation of enjoying allthe promises made by the brand. The primary promise forany customer will be product availability. When customersv i s i t t he re t a i l s hop , t hey gene ra l l y come w i t h anexpectation that the products are always available. Thenon-availability of the products leaves them disappointedand dissatisf ied. This problem is prominent, especial lydur ing the promot ion per iod. Lack of coord ina t ionbetween marketing and the supply chain generated a brandnightmare and failure of K-Mar t’s marketing mix strategy.Late delivery to K-Mar t stores by distribution centers was11 percent of the time or 1 in 10 deliveries. This was a bigsetback as most retailers are late only five percent of thetime (Muller, Joann, 2002). Even when the inventory wasbeing received by the K-Mar t stores on time, the supplychain on average was wrong on 15 percent of stores’orders received from distribution centers.
Fur thermore, af ter finding out that adver tising circulars andpamphlets did not work well, K-Mar t announced a newretail ing strategy in 2001. According to new marketingstrategy it decided to stop the weekly adver tising circularsand tried to lure customers by cutting prices on thousandsof items. But as customers were not informed of the pricecut, this resulted in sales drop for K-Mar t. (Saporito Bil l etal., 2002). K-Mar t’s repeated out of stock item noticeswere major cause of customers’ grievances. Its problemsgo back to its early days when it went on increasing thenumber of stores but failed to maintain pace in distributingthe merchandise to those stores. Also, its distr ibutions y s t e m w a s c o m p a r a t i v e l y s l o w c o m p a r e d t o i t scompetitors l ike Wal-Mar t.
K-Mart was pretty happy with its age-old distribution systemeven when Wa l -Mar t was s t reng then ing i t s ex i s t i ngdistribution systems and also opening new distributioncenters. K-Mar t’s supply chain became a serious brandliability, while Wal-Mar t turned its supply chain capabilitiesand strengths into a core element of its marketing mixstrategy. The exact causes of K-Mar t’s fai lure can beattributed to inventory related SCM problems. All thesehad a negative effect on K-Mar t performance and it incurredhuge losses even as i t s compet i to r s became moreprofitable. Finally K-Mar t fi led bankruptcy on January 22,2002.
Wal-Mart: Convergence of SCM and MarketingMix Strategy
During same time period i.e. in year 2001, Wal-Mar t alsoresponded to price cuts of K-Mar t by fur ther reducing priceand at the same time meticulously balanced its SCM andma r ke t i ng m i x s t r a tegy. K-Ma r t ’ s s upp l y cha i n andmerchandise management system was a weak point in itswhole process. By contrast, Wal-Mar t’s SCM is central toits marketing mix strategy. Wal-Mar t’s business model is touse automated SCM as a source of competitive advantage.Wal-Mar t has added inventory and distribution centers tobetter serve its customers and consistently deliver oncustomer value proposit ion by employing world-classsupply chains.
Every firm’s competitive position in market place dependson its abil ity to adapt to the changes in the customers’

SCMS Journal of Indian Management , Apr i l - June, 2010. 19
A Quarterly Journal
demands and respond suitably. For many firms, it is sti l l achallenge to link marketing strategy and process of supplychain management. The retail giant Wal-Mar t’s success l iesnot only in its low price strategy but also in the deep dislikeof the customers of its competitors to stock-outs. Wal-Mar t is the world champion in supply chain management.Wal-Mar t has capital ized its supply chain capabil i ty ineffective design and execution of its marketing strategy. Inthe case of Wal-Mar t, convergence of supply chain andmarketing mix strategy provided a strong basis for sustainedcompetit ive dif ferent iat ion and long-term competit iveadvantages.
T h e C o n v e r g e n c e o f S u p p l y C h a i n a n dMarketing Mix Strategy
The argument for combining SCM and marketing strengthsis strong and compell ing. According to Lee (2001), theinfluence of marketing activit ies on supply chain, and viceversa , have to be understood and coordinated, forexample, pricing, promotion, as well as product mix effor tsinfluence delivery times and supply chain costs. Similarly,supply chain costs strongly impact marketing success ofproduct and ultimately firm profitability. SCM and marketinghave not always been seen to be closely l inked in manyfirms Rainbird M. (2004). In many firms, the supply side stil lseems to be disconnected from the demand side andsupply chain managers have only a faint idea of the driversbehind customer demand. In a global survey among 249
Figure 1: The Convergence of SCM and Marketing Mix Strategy
Compet i t i veAdvan tages
M a r k e t i n g M i xE f f e c t i v e n e s s
Supp l y Cha i nCapab i l i t y
M a r k e t i n g M i xSupp ly Cha inManagement( SCM)
(Source: Model deve loped by author)
executives across 28 countries, Deloitte (2002) found thatonly a minority (17 percent) of al l f irms have effectivelyl inked the i r supply cha in and customer / market ingoperations. Not surprisingly, these integrated companieshave outperformed their competitors on a wide range ofperformance cr i ter ia v iz sa les growth, market share,customer service and ROI (return on assets). Figure 1 belowexplains convergence of SCM and marketing mix strategy.With the help of Venn diagram Figure 1 also shows howthis convergence creates competitive advantages.
Marketing’s strength lies in understanding the factors whichaffect the way in which customers perceive value (gainingmarket and customer knowledge), finding out the differingneeds of var ious customer groups (market/customersegmentation), translating them into product and servicebundles to meet those di f fer ing needs (customizedproduct/service development) and marketing the bundlesor packages through customer value propositions (pricing,branding, communication, promotion etc). If both sidesof supply and demand are separated, supply wil l viewdemand as exogenous and wil l fa i l to recognize thatdemand was inf luenced by the company ’s customerinterface. Also, if consistent and timely information doesnot flow from the customer interface, the firm wil l not beable to respond to differentiated needs of individualcustomers and customer segments. Differentiated demandfor products and services is a key input to SCM (Uta Jüttneret al., 2004). Consequences of such information gap are
▼
▼▼

SCMS Journal of Indian Management , April - June, 2010. 20
A Quarterly Journal
sub-opt ima l p roduc t and se r v i ce deve lopmen t o rdifferentiation and ineffective product and service delivery.Stock-outs caused by mismatch between the demand andsupply and high price of product due to the inefficientSCM process wil l definitely have a serious impact on thebrand image.
According to Piercy (2002), a SCM strength that is notl inked to market ing st rategy of di f ferent iat ion usual lyconfines the firm to competing on price and availabil ity; as t ra tegy fo l lowed, fo r example , by cheap gener icsproviders of commodity products. Piercy (2002) alsoemphasized that superior marketing strength combinedwith a lack of SCM strength leads to a high cost base andslow delivery of product or services. Competing onlythrough SCM excellence hence assumes that price is amajor determinant of competitive advantage in terms ofcost differentiation. Moreover, Lee (2001) emphasizes theproblems of SCM act ing independent ly of market ingmanagement.
However, there is strong evidence now emerging that theway marketing mix strategy is designed and the way in whichfirms suppor t it with their SCM capabil it ies can be a realsource of compet i t i ve advantage. Success of f i rm’smarketing mix strategy depends on fulfil l ing the promise ofdelivering the right product to the right place at the righttime. Firm’s SCM strengths and capabil it ies can make orbreak abil ity to fulf i l l that promise. As a result, SCM has apowerfu l impact, posi t ive or negat ive on success ofmarketing mix strategy of firm. After an industry-wide surveyof more than 800 companies, Aberdeen Group (2008)pub l i s hed t he r e sea rch r epo r t “ The Supp l y Cha i nExecutive’s Strategic Agenda 2008,” in which 56 percentof companies regard SCM as a market strategy differentiator,a customer service differentiator or as a profit center, asopposed to strictly a cost of doing business.
It’s not possible to build successful branding strategy bysolely focusing on branding in terms of logos, slogans oradver tisement campaigns while ignoring the role of supplychain management. Firms should use their supply chaincapabilities as a basis to suppor t and build product brandand ultimately strengthen marketing mix strategy. It canreveal hidden organizational assets and ensure that firm’sbrand is not undermined by fulf i l lment deficiencies of
supply cha in . SCM has the s t rong impact on f i rm’smarketing mix strategy as it greatly influence brand promise,customers’ buying experience and overall customers’ valueproposition. Firm’s brand promise must align with its SCMcapabil it ies. It is necessary for marketing managers to paymore at tent ion to thei r supply chains. They must beaccountable for aligning the product and brand promisewith firm’s SCM capabil ity, as it has a powerful impact oncustomer value proposition. Similarly supply chain managersshould have clear understanding of supply chain/marketinginterface and their role in effective execution of marketingmix strategy. In shor t, marketing managers should knowfirm’s supply chain’s capabi l i t ies and l imitat ions whi lesupply chain managers should know the brand promiseand their role in fulf i l l ing it.
The SC-MM Matrix: Relationship betweenSupply Chain Capability and Marketing MixEffectiveness
Relationship of Supply Chain Capabil ity and Marketing MixEffectiveness can be explained with help of the SC-MMmatrix as given below in Figure 2.
The SC-MM matrix is having four quadrants viz Supply ChainCapabi l i ty (Quadrant - 1), Competi t ive Disadvantages(Quadrant - 2), Marketing Mix Effectiveness (Quadrant - 3)and Competit ive Advantages (Quadrant - 4). Detai ledexplanation of each is given below:
Supply Chain Capability
In the scenario when Supply Chain Capabil ity is high andMarketing Mix Effectiveness is low as shown by quadrantQ-1 of the SC-MM Mat r i x ( F igure 2) , prov ides SCMadvantages to the f i rms. F irms in this quadrant have adistinctive capability in managing the SCM related functions.This enables firms to reduce time and costs in inventorymanagement and hence enhance asset turnover. Firms witha SCM capabi l i ty usual ly place a st rong emphasis onactivities such as strategic sourcing, collaborative planning,and inventory reduction e.g. JIT (Just-In-Time) inventory.However SCM focuses on the efficient matching of supplywith customer demand but does not provide answers tothe customer choice and preference, i.e. it does not helpthe f i rm to f ind out what the customer perceives as

SCMS Journal of Indian Management , Apr i l - June, 2010. 21
A Quarterly Journal
Figure 2: The SC-MM Matrix
(Source: Matr ix developed by author)
H i g h
Supply Chain
Capability
Low
Low H i g hMarketing Mix Effectiveness
Supply Chain Capability
Q - 1
Competitive Advantages
Q - 4
Competitive Disadvantages
Q - 2
Marketing Mix Effectiveness
Q - 3
(Market ing Mix Def ic iency) ( S C - M M C o n v e r g e n c e )
( S C - M M D i v e r g e n c e ) (Supp ly Cha in De f i c iency)
valuable, and how this customer-perceived value can betranslated into customer value propositions. In other words,supply chain efficiency by itself will not increase customervalue and satisfaction (Rainbird 2004).
Dell inc. is world’s second largest personal computer (PC)company and fits well in this quadrant. It is having veryefficient and lean supply chain. Dell inc. is having superiorSCM capabilities but its marketing and product mix strategyare not properly aligned to fulf i l l customers’ requirement.This has resulted in stagnant growth and lost market sharesince last many financial quar ters. Dell is losing market shareto its competitor viz Hewlett-Packard (HP) - World’s largestPC manufacturer - as it is struggling to balance notebookand desktop computer demand as its product mix andmarketing strategy is focused much on low price segmentof computers and not on high price, special ized anddifferentiated product category. Del l struggled to sel lcomputers in the high performance segment. High-endsystems offer stronger profit margins than the volumebusiness for which Dell is best known. The volume segmentis also facing f ierce competit ion from low cost Asianmanufacturers. With increase in input cost of components,Dell is struggling hard to maintain current market share andcost leadership. Dell’s stock price is currently trading at
multi year low and is reflection of its declining market shareand strained profit margin. To improve profit margin andregain market share, Dell inc. needs to design product andmarket ing mix st rategy to cater h igh end segment ofcomputer market.
Competitive Disadvantages
In the scenario when Supply Chain Capabil ity is low andMarket ing Mix Ef fect iveness is a lso low as shown byquadrant Q-2 of the SC-MM Matrix (Figure 2), creates overalldisadvantages for firms. Firms in this quadrant have neitherSCM nor marketing strengths and lacks overall competitiveadvantages. F irms need to bui ld SCM capabil i t ies andsynchronize it with effective marketing strategy to gain longterm competitive advantages.
Marketing Mix Effectiveness
In the scenario when Supply Chain Capabil ity is low andMarketing Mix Effectiveness is high as shown by quadrantQ-3 of the SC-MM Matrix (Figure 2), creates marketingsuperiority for firms. K-Mar t nicely represents this quadrant.

SCMS Journal of Indian Management , April - June, 2010. 22
A Quarterly Journal
K-Mar t’s spent heavily on adver tising strategy and usedadver tising circulars to lure customers. Even though thiss t r a tegy wor ked ve r y we l l , i t a l so pu t a s t r a i n onmerchandising and distribution systems because par ticulardemand for i tems came in suddenly. In reta i l s tores,avai labil i ty of supplies is one of the driving forces forcustomers going to any store. If the supplies are not readilyavailable, customers lose faith in their supplier and lookelsewhere for the merchandise. Promotions also increasedcost of K-Mar t’s suppliers, as they could not reliably predicttheir production output. Perhaps the biggest problem forK-Mar t was its inabil ity to keep stock on the shelves. K-Mar t was able to keep its goods fully stocked on shelvesonly 86 percent of the time. In the industry, anything lessthan 90 percent is considered unacceptable. Wal-Mar t,however, runs close to 100 percent. K-Mar t’s supply chainwas not suppor tive of its marketing mix strategy. AlthoughK-Mar t’s marketing strategy was effective, divergence ofSCM and marketing mix strategy was main reason for K-mar t’s fai lure.
Competitive Advantages
In the scenario when Supply Chain Capabil ity is high andMarket ing Mix Ef fect iveness is a lso high as shown byquadrant Q-4 of the SC-MM Matrix (Figure 2), generatesoveral l competit ive advantages for f i rms. F i rms in thisquadrant have superior SCM as well as effective marketingstrategy. In this case synchronization of SCM and marketingmix strategy creates sustainable competitive advantagesfor firm. Wal-Mar t per fectly matches this quadrant. Wal-Mar t is the power house today in SCM because of itsreadiness to share information with its suppliers. Wal-Mar tapproached its suppliers as if they were par tners and notadversaries, and by implementing such a collaborativeplanning, forecasting and replenishment programme, theyhave begun a JIT programme that reduced inventory carryingcosts for both the retailer and its supplier. Wal-Mar t hasemphasized EDLP (Every Day Low Price) sell ing, which ismore predictable for both customers and the distributionpipeline.
Wal-Mar t’s SCM practices have served as a model for othermajor retailers. Wal-Mar t was a pioneer of using informationtechnology in the distribution process and supply chain.Wal-Mar t invested in technological systems earlier than most
of i ts competitors, star t ing to use computers to trackinventory in 1969. In 1980 it was the first to adopt barcodes and in 1985 i t inst i tuted EDI (E lectronic DataInterchange) for better coordination with suppliers. In 1987a massive satell ite system linked all of the Wal-Mar t storesto company headquar ters, enabling Wal-Mar t’s centralizedIT depar tment to view real-time inventory data. Because ofthis system there was very less excess inventory in theWal-Mar t supply chain. Wal-Mar t mandated to all majorsupp l ie r s fo r R F ID ( Rad io F requency Iden t i f i ca t ion)implementation in supply chain. RFID enabled SCM enhancesvisibil ity in supply chain and helps in effective executionof market ing mix s t rategy. Al l these implementat ionsallowed Wal-Mar t to reduce its inventory and gain costsavings. This type of cost eff iciency is a key for Wal-Mar tin maintaining low price leadership and effective executionof marketing mix (Product: As desired by customers, Price:Every Day Low Price, Place: On shelf availability, Promotion:Effective promotion strategy synchronized with supplychain) strategy.
Conclusion
The g loba l izat ion of manufactur ing and dis t r ibut ion,increasingly demanding customers, and t ightening f irmmargins have raised the stakes for retai lers, consumerproducts, manufacturing, transpor tation and distributioncompanies. Main factors driving SCM transformation areglobalization of supply, increasing competitive pressures,and dwindling product l i fe cycles. Al l these have putgreater pressure on the SCM processes of firm. Even minordelays and blockages of supply can cause major problemsin front end customer operations, as well as for back endsuppliers and business par tners. Product quality, reliabledelivery schedule, shor t lead times, customer service,along with cost reduction, are the primary operationalsources advantage in today ’s competitive environment ofretail industry. These are the key drivers for the retail industryfor i ts compet i t iveness. An effect ive SCM is l ike ly torespond positively to most of these drivers. Effective andefficient SCM has become a much more impor tant strategicand competitive variable in current economy and plays vitalrole in firm’s survival and long term growth.
The success of Wal-Mar t is testimony to the power of SCMprocesses that are aligned with marketing strategies. It is

SCMS Journal of Indian Management , Apr i l - June, 2010. 23
A Quarterly Journal
critical for marketing and supply chain managers to jointlyrecognize where the supply chain can be leveraged toenhance competitive advantages of firm. With the help ofsuperior SCM and effective marketing mix strategy, f irmachieves differential advantages. The SCM and marketingmix functions are not separate rather they are inter twined.The SC-MM matrix establishes relationship between SCMcapabil ity and marketing mix effectiveness. The effectiveand efficient SCM processes facil itate task of marketingmix strategy by delivering the right product - in the rightquantity, at the right location, and at the right price. Thispaper suppor ts the emerging view that SCM strategy andmarketing strategy are highly connected.
Keywords: Supply Cha in Management ; Marke t ing ;Marketing Mix; Strategy.
References
Aberdeen Group. “The Supply Chain Executive’s StrategicAgenda 2008: Managing Global Supply ChainTr an s fo r ma t ion . ” Re sea rch Repo r t . <www.aberdeen.com> 2008.
Baker, Michael J. “People - the fif th P of Marketing.” WhitePaper. University of Strathclyde, Glasgow, UK:1997.
Christopher, M. Logistics and Supply Chain Management:S t ra teg ies for Reduc ing Cost and improv ingServ ice . (2nd ed) . London: F inanc ia l T imesPublishing, 1998.
Cooper, M.C. and Ellram, L.M. “Characteristics of SupplyCha in Management and the Imp l i ca t ion fo rP u r c h a s i n g a n d L o g i s t i c s S t r a t e g y . ” T h eInternational Journal of Logist ics Management.1993.
Cooper, M.C., Lamber t, D.M. and Pagh, J.D. “Supply ChainManagement more than a New Name for Logistics.”The International Journal of Logistics Management.1997.
Deloitte Research (2002), “Consumer Business Digital LoyaltyNetworks – Increasing Shareholder Value through
Cus tomer Loya l t y and Ne twork E f f i c i ency. ”Research Repor t. <www.deloitte.com>
E l l i nge r, A .E . “ Improv ing Ma r ke t i ng / Log i s t i c s C ross -Functional Collaboration in the Supply Chain.”Industrial Marketing Management. 2000.
Ellram, L.M. and Cooper, M.C. “Supply Chain Management,Pa r tne rsh ips , and the Sh ipper - Th i rd Pa r tyRelationship.” The International Journal of LogisticsManagement. 1990.
Flint, D. “Strategic Marketing in Global Supply Chains: FourChal lenges.” Industr ia l Marketing Management.2004.
Lee, H.L. “Demand-based Management.” White Paper forthe Stanford Global Supply Chain ManagementForum. 2001.
Magrath, A .J. “When Marketing Services, 4 Ps Are NotEnough.” Business Horizons. 1986.
Mar tin, J. and Grbac, B. “Using Supply Chain Managementto Leverage a Firm’s Market Orientation.” IndustrialMarketing Management. 2003.
Muller, Joann. “Attention Kmar t: Find a Niche.” BusinessWeek. 2002.
Oliver, R .K. and Webber, M.D. “Supply Chain Management:Logist ics catches up with Strategy.” Cited in:Chr i s topher, M. (ed. ) 1992. Log i s t ics – theStrategic Issues. London: Chapman and Hal l ,1982.
Patty, Tom. “Mastering the new five P’s of Marketing.” 1997.<ht tp: / /merz l i k in .com/ar t ic les /market ing/5p-marketing.html>
Piercy, N. Market- led strategic change (3rd edit ion).Oxford: Butterwor th-Heinemann, 2002.
Ra inbi rd, M. “Demand and Supply Cha ins : The Va lueCa t a l y s t . ” I n t e r na t i ona l Jou rna l o f Phy s i c a lDistribution and Logistics Management. 2004.

SCMS Journal of Indian Management , April - June, 2010. 24
A Quarterly Journal
Saporito Bil l , Baumohl Bernard and Szczesny, Joseph R.“ K M a r t ’ s B l u e Pe r i o d . ” T i m e , < h t tp : / /w w w . t i m e . c o m / t i m e / m a g a z i n e / a r t i c l e /0,9171,1001599,00.html> 2002.
Soonhong Min and John Mentzer. “The Role of Marketingin Supply Cha in Management . ” In te rna t iona lJourna l of Phys ica l D is t r ibut ion and Logist icsManagement. 2000.
Svensson , G . “Supp ly Cha in Management : The Re-Integrat ion of Market ing Issues and Logis t icsTheory and Practice.” European Business Review.2002.
Uta Jüttner, Susan Baker and Mar tin Christopher. “DemandChain Management – Integrating Marketing andSupply Chain Management.” White Paper. CranfieldUniversity, School of Management, England: 2004.

SCMS Journal of Indian Management , Apr i l - June, 2010. 25
A Quarterly Journal
Organizational Climate:BPO Industry
Avinash Kumar Srivastav
T h e s t u d y a i m s a t u n d e r s t a n d i n g h o w o r g a n i z a t i o n a l c l i m a t e o p e r a t e si n B P O i n d u s t r y . S i x m o t i v e s o f o r g a n i z a t i o n a l c l i m a t e w e r e m e a s u r e di n B P O c o m p a n i e s . E x p e r t I n f l u e n c e a n d E x t e n s i o n w e r e r e s p e c t i v e l yt h e d o m i n a n t a n d b a c k u p c l i m a t e s . A f f i l i a t i o n w a s t h e w e a k e s t
c l i m a t e . E x p l o r a t o r y f a c t o r a n a l y s i s o f c l i m a t e m o t i v e s r e v e a l e d t h r e e m e t a - c l i m a t e so p e r a t i n g i n B P O i n d u s t r y : ( 1 ) B r a z e n S h i r k i n g c o m b i n i n g h e i g h t e n e d D e p e n d e n c y a n d d e -e m p h a s i z e d A f f i l i a t i o n , ( 2 ) E m p o w e r e d C o l l a b o r a t i o n r e p r e s e n t i n g h e i g h t e n e d E x t e n s i o na n d d e - e m p h a s i z e d C o n t r o l , ( 3 ) O b s e s s i o n f o r E x p e r t i s e c o m b i n i n g h e i g h t e n e d E x p e r tI n f l u e n c e a n d d e - e m p h a s i z e d A c h i e v e m e n t . 7 0 . 3 0 % v a r i a n c e e x p l a i n s t h e s e m e t a - c l i m a t e st h a t r e f l e c t t h e r e a l i t i e s i n B P O i n d u s t r y .
Abstract
Dynamics
O1234567890123456789012345678901212345678901234567890123123456789012345678901234567890121234567890123456789012312345678901234567890123456789012123456789012345678901231234567890123456789012345678901212345678901234567890123123456789012345678901234567890121234567890123456789012312345678901234567890123456789012123456789012345678901231234567890123456789012345678901212345678901234567890123123456789012345678901234567890121234567890123456789012312345678901234567890123456789012123456789012345678901231234567890123456789012345678901212345678901234567890123123456789012345678901234567890121234567890123456789012312345678901234567890123456789012123456789012345678901231234567890123456789012345678901212345678901234567890123123456789012345678901234567890121234567890123456789012312345678901234567890123456789012123456789012345678901231234567890123456789012345678901212345678901234567890123123456789012345678901234567890121234567890123456789012312345678901234567890123456789012123456789012345678901231234567890123456789012345678901212345678901234567890123123456789012345678901234567890121234567890123456789012312345678901234567890123456789012123456789012345678901231234567890123456789012345678901212345678901234567890123123456789012345678901234567890121234567890123456789012312345678901234567890123456789012123456789012345678901231234567890123456789012345678901212345678901234567890123123456789012345678901234567890121234567890123456789012312345678901234567890123456789012123456789012345678901231234567890123456789012345678901212345678901234567890123123456789012345678901234567890121234567890123456789012312345678901234567890123456789012123456789012345678901231234567890123456789012345678901212345678901234567890123123456789012345678901234567890121234567890123456789012312345678901234567890123456789012123456789012345678901231234567890123456789012345678901212345678901234567890123123456789012345678901234567890121234567890123456789012312345678901234567890123456789012123456789012345678901231234567890123456789012345678901212345678901234567890123123456789012345678901234567890121234567890123456789012312345678901234567890123456789012123456789012345678901231234567890123456789012345678901212345678901234567890123
Dr.Av inash Kuma r S r i v a s t av, D i rec to r, DayanandaSaga r Co l l ege o f Managemen t and I n fo rma t ionTe c h n o l o g y, K u m a r a s w a m y L a y o u t , B a n g a l o r e –560078 , Ema i l : d r kuma r ioc@hotma i l . com
rganizational performance is delivered through an u m b e r o f w e l l - d e s i g n e d b u s i n e s s p r o -cesses (Tenner and DeToro, 1997). Business
process orientation (Skrinjar, Stemberger and Hernaus 2007)is necessary for successful organizations. According toMcCormack and Johnson (2000) , bus iness processor ientat ion in organ izat ionsemphasizes processes insteado f h i e r a rcha l o r f unc t iona lboundaries, focusing on thema in ou tcomes and t heresulting customer satisfaction.I t i nc rea ses i n te rna l coo r -dinat ion in the organisat ion,breaking down functional silos.Empirical study by McCormack,Johnson and Walker (2003) hasdemonstrated that bus inessprocess orientation results inenhanced connec tednes swithin the organizat ion. Eff i -
ciency of operations cannot be realized unless the businessprocesses are opt imized and a l igned with customerrequirements and business environment outside and withstructures, systems, roles and operating procedures withinthe organization. Outsourcing has been recognized as oneof the best business strategies for attaining higher operational
efficiency at lower operationalcos t fo r l a r ge compan ie s(Grossman and Helpman, 2005).The mos t common fo rm o fou t sou rc i ng , v i z Bu s i nes sP roces s Ou t sou rc i ng ( BPO)means transferring the opera-tional ownership of some of thebus i nes s p roces ses to anexternal provider for managingthe ou t sou rced bus i nes sprocesses according to per-formance metrics prescribed bythe parent company.

SCMS Journal of Indian Management , April - June, 2010. 26
A Quarterly Journal
Understanding Organizational Climate
Forehand and Glimer (1964) have described OrganizationalC l ima te a s t he pe r sona l i t y o f an o rgan i s a t ion t ha tdistinguishes one organization from others. According toPa reek , (1989) , i t r e su l t s f rom i n te r ac t ion amongorganizational components (structure, systems, culture,leader behaviour and employees’ psychological needs).Organizational climate depends on the perception held bythe organizational members about different dimensions oforganisation’s working. Organizational climate has significantinfluence on the motivation and behaviour of organizationalmembers. Sales, market share and profits generated by acompany are lagging indicators of its performance becausethey appear as a manifestation of company ’s performance.On the contrary, organizational climate is a leading indicatorof organizational performance (Litwin, Humphrey and Wilson,1978). Organizational climate can predict the trend fororganizational performance (being excellent or poor).
Rationale for the Study
BPO industry is full of controversies (Thite, 2008). Conflictbetween quality and quantity is prominent in BPO industry.The operators are expected to minimize the duration ofcalls but maximize client satisfaction through each call.Whereas, BPO industry has contributed for the growth ofIndian economy, it has also eroded the quality of life of itsemployees, causing imbalances in the society. BPO industryis ridden with problems (Mehta, et al., 2006). Compulsionto work in ‘graveyard shifts,’ results in social-disconnect forBPO employees. Srivastav (2008) has identified three meta-s t ressors ( represen t ing the mos t s i gn i f i can t i s sues /problems) encountered while performing in organizationalroles in BPO industry. These meta-stressors are Role Distance(role occupant distancing from his/her role and his/her roledistancing from connected roles), Work-Life Imbalance(difficulty in balancing between work requirements and liferequirements), and Role Inadequacy (non-availabil ity ofrequired competence and resources for role performance).Since, different types of organizational climate promotedifferent kinds of motivated employee behaviour, betterunderstanding about how organizational climate operatesin BPO indust ry would be helpfu l for enhancing thefunctionality of organizational climate to address its criticalproblems. This study attempts to reveal the dynamics of
organizational climate in BPO industry. The framework ofmotivational analysis of organizational climate developedby Pareek (1989) has been deployed in this study.
Motivational Analysis of Organizational Climate
Pareek (1989) has identified 12 impor tant dimensions ofo rgan i za t ions . These d imens ions a re : O r i en t a t ion ,I n te rpe r sona l Re l a t ionsh ips , Supe rv i s ion , P rob lemManagemen t , Managemen t o f M i s t a ke s , Con f l i c tManagement, Communicat ion, Decis ion Making, Tr ust,Management of Rewards, Risk Taking and Innovation andChange. Motivational Analysis of Organizational Climate(MAO-C) (Pareek, 1989) is based on the assessment ofthese dimensions. MAO-C defines the following six motivesof organizational climate.
Achievement: Achievement of goals and attaining qualityand excellence are emphasized in the organisation;
Exper t Influence: Use of exper tise for the benefit of theorganisation is emphasized;
Extension: Organizational members are focused on makingthemselves relevant and useful to others.
Control: Consol idat ion of personal power is the mainconcern of organizational members.
Dependency: Decisions/actions are deferred by seekingseniors’/others’ approval for everything.
Aff i l ia t ion: Bu i ld ing and mainta in ing f r iendly personalrelationships is most impor tant for the organisation, evenwhen it leads to impairment of organizational performance.
Objectives
The study aims at understanding how organizational climateoperates in BPO industry through the following:
(i) Identifying the dominant and backup climate motivesin BPO industry;
(ii) Determining the relationship between different climatemotives;
(iii) Identifying the meta-climate motives in BPO industry.
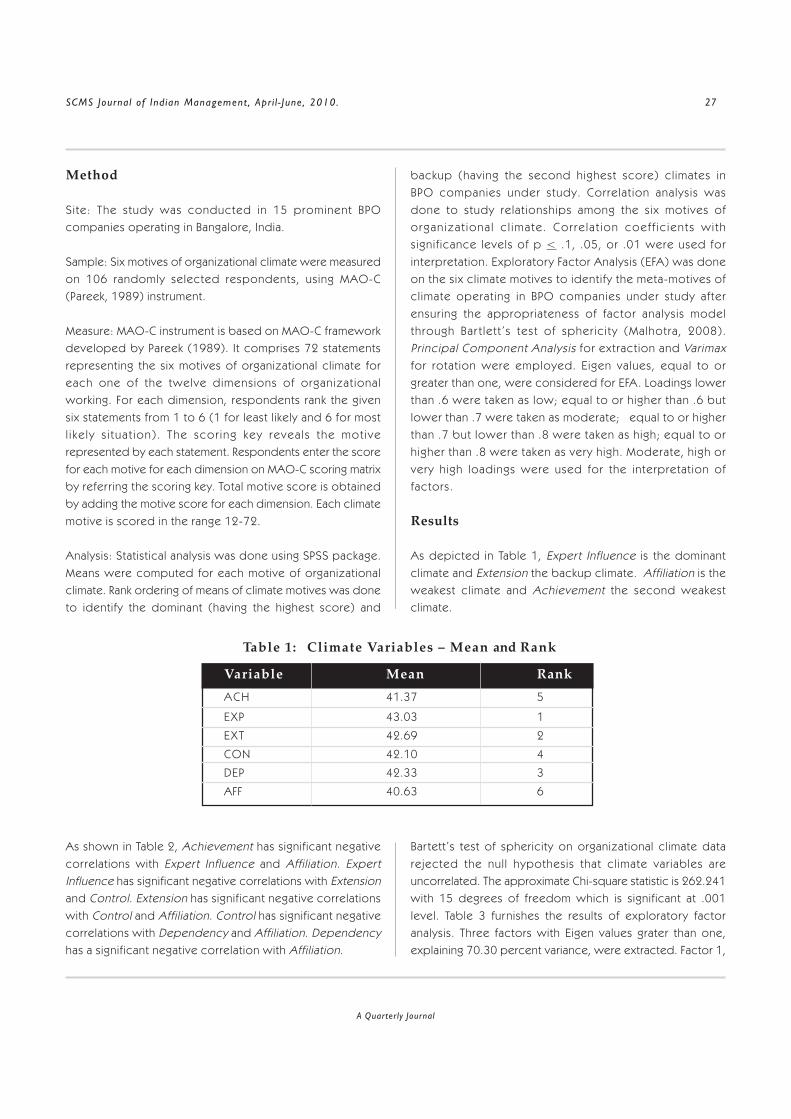
SCMS Journal of Indian Management , Apr i l - June, 2010. 27
A Quarterly Journal
Method
Site: The study was conducted in 15 prominent BPOcompanies operating in Bangalore, India.
Sample: Six motives of organizational climate were measuredon 106 randomly selected respondents, using MAO-C(Pareek, 1989) instrument.
Measure: MAO-C instrument is based on MAO-C frameworkdeveloped by Pareek (1989). It comprises 72 statementsrepresenting the six motives of organizational climate foreach one of the twelve dimensions of organizat ionalworking. For each dimension, respondents rank the givensix statements from 1 to 6 (1 for least likely and 6 for mostl i ke ly s i tua t ion) . The scor ing key revea ls the mot iverepresented by each statement. Respondents enter the scorefor each motive for each dimension on MAO-C scoring matrixby referring the scoring key. Total motive score is obtainedby adding the motive score for each dimension. Each climatemotive is scored in the range 12-72.
Analysis: Statistical analysis was done using SPSS package.Means were computed for each motive of organizationalclimate. Rank ordering of means of climate motives was doneto identify the dominant (having the highest score) and
backup (having the second highest score) cl imates inBPO companies under study. Correlat ion analysis wasdone to study relat ionships among the six motives oforgan iza t iona l c l imate . Cor re la t ion coef f ic ients wi thsignif icance levels of p < .1, .05, or .01 were used forinterpretation. Exploratory Factor Analysis (EFA) was doneon the six climate motives to identify the meta-motives ofcl imate operating in BPO companies under study afterensuring the appropriateness of factor analysis modelthrough Bar t lett ’s test of spher ic i ty (Malhotra, 2008).Pr incipal Component Analysis for extraction and Varimaxfor rotat ion were employed. Eigen values, equal to orgreater than one, were considered for EFA. Loadings lowerthan .6 were taken as low; equal to or higher than .6 butlower than .7 were taken as moderate; equal to or higherthan .7 but lower than .8 were taken as high; equal to orhigher than .8 were taken as very high. Moderate, high orvery high loadings were used for the interpretat ion offactors.
Results
As depicted in Table 1, Exper t Influence is the dominantclimate and Extension the backup climate. Affiliation is theweakest climate and Achievement the second weakestclimate.
Table 1: Climate Variables – Mean and Rank
Variable Mean Rank
ACH 41.37 5
EXP 43.03 1
EXT 42.69 2
CON 42.10 4
DEP 42.33 3
AFF 40.63 6
As shown in Table 2, Achievement has significant negativecorrelations with Exper t Influence and Affiliation. Exper tInfluence has significant negative correlations with Extensionand Control. Extension has significant negative correlationswith Control and Affiliation. Control has significant negativecorrelations with Dependency and Affiliation. Dependencyhas a significant negative correlation with Affiliation.
Bar tett’s test of sphericity on organizational climate datarejected the nul l hypothesis that cl imate variables areuncorrelated. The approximate Chi-square statistic is 262.241with 15 degrees of freedom which is significant at .001level. Table 3 furnishes the results of exploratory factoranalysis. Three factors with Eigen values grater than one,explaining 70.30 percent variance, were extracted. Factor 1,

SCMS Journal of Indian Management , April - June, 2010. 28
A Quarterly Journal
Table 2: Intercorrelation of Climate Variables
ACH EXP EXT CON DEP
E X P - .29*** xx xx xx xx
E X T - .05 - .20** xx xx xx
C O N - .06 - .22** - .36*** xx xx
DEP - .08 - .01 - .11 - .35*** xx
AFF - .36*** - .11 - .14* - .18** - .32***
N o t e : * p < . 1 ; * * p < . 0 5 ; * * * p < . 0 0 1
Table 3: Factor Loadings of Climate Variables
Variable Factor 1 Factor 2 Factor 3
ACH .47 - .06 - .63
EXP .10 - .05 .78
EXT - .09 .76 - .38
CON -.11 - .86 - .28
DEP .67 .27 .37
AFF - .85 .11 .18
E igen Va lue 1.42 1.40 1.39
Percentage Var iance 23.72 23.38 23.20
Cumulat ive Var iance 23.72 47.10 70.30
N o t e : Ve r y h i g h , h i g h , a n d m o d e r a t e l o a d i n g s a r e h i g h l i g h t e d
explaining 23.72 percent variance, has a moderate positiveloading on Dependency and a very high negative loadingon Affiliation. Factor 2, explaining 23.38 percent variance,has a high positive loading on Extension and a very highnegative loading on Control. Factor 3, explaining 23.20percent variance, has a high positive loading on Exper tInfluence and a moderate negative loading on Achievement.
Discussions
BPO companies are in existence because of their capabilityto handle the outsourced process (Thite, 2008). They focuson recruiting the manpower with the requisite background,and training them for delivering the required exper tise.Maintaining the required exper tise at the company level,however, is a daunting task because of constant attrition oftrained employees (Gupta and Gupta, 2008). Continuous
focus on building and maintaining the required exper tise atthe company level is necessary for ensuring the survival ofBPO companies. This explains why Exper t Influence is thedominant climate (Table 1) in BPO companies under study.BPO industries have to focus on the business process(es).Business process orientation leads to enhancing internalcoo rd ina t ion and connec tedness i n BPO i ndus t r y(McCormack, Johnson and Walker, 2003). This explains whyExtension is the backup climate (Table 1) in BPO companiesunder study.
Factor 1 indicates that employees are not taking responsibilityfor a decision or an action; they are invariably seeking others’approval before taking action. While passing the buck,employees do not care about maintaining friendly personalrelationships, ending in offending others. In reality, BPOemployees generally work in a narrow area of responsibility;

SCMS Journal of Indian Management , Apr i l - June, 2010. 29
A Quarterly Journal
they have a strong tendency for seeking approval of theirseniors before acting on anything that is perceived to bebeyond their narrow area of responsibi l i ty. Continuedpassing on the buck as explained above is annoying forclients and seniors in the organisation but the employeesdo not bother. Factor 1 can therefore be named as BrazenShirking. . . . . BPO employees generally suffer from high stressand even burnout. They also have to work for extendedhours and in night shifts (Mehta, et al., 2006; Gupta andGupta, 2008; Srivastav, 2008). Under the circumstances theemployees have the tendency to disengage themselves onthe smallest pretext as soon as possible, even when itcauses annoyance to cl ients, peers or superiors. Thisexplains the existence of meta-climate represented bybrazen shirking. Negative correlation between dependencyand affil iation climates found in this study has also beenrepor ted by Srivastav (2006).
Factor 2 indicates that employees emphasize relating toothers in the team, group, and organisation; promotingcollaboration and teamwork. While promoting collaborationand teamwork, employees do not indulge in consolidatingtheir personal power. Actually, within their nar row area ofresponsibility, BPO employees generally have freedom toact. They also need to work as a team for reasonable successof handling the outsourced process. Factor 2 can thereforebe named as Empowered Collaboration. . . . . Business processorientation of BPO industry (McCormack, Johnson andWalker, 2003) discourages individualism (deemphasizingcontrol climate) in favour of teamwork (extension climate)and could be the reason for the existence of empoweredcol laborat ion as a meta-cl imate. Negat ive correlat ionbetween extension and control climates found in this studyhas also been repor ted by Srivastav (2006).
Factor 3 indicates that employees emphasize the use ofexper tise in the organization. Thite (2008) has emphasizedthe impor tance of process exper tise for the survival of BPOindust ry . Whi le emphas iz ing on acqui r ing, us ing andmaintaining exper tise in the organization, attainment ofoveral l organizational goals are getting neglected. Thisexplains unusual negative cor relat ion between exper tinfluence and achievement climates found in this study.Pos i t i ve cor re l a t ion be tween exper t i n f l uence andachievement climates has been repor ted (Srivastav, 2006).For survival in a highly competit ive environment, BPO
industries need to constantly maintain and demonstrate theirhigh level of exper tise for the outsourced process beinghandled or to be handled. Persistently high levels of attritionin the BPO industries, however, significantly hamper theirexper tise. They have no option but to put in their highestleve l of ef for ts on a cont inuous bas is for recr u i t ingemployees with the required expertise and impar ting regulartra in ing to them for mainta in ing the required level ofexpertise in the company. Maintaining the required expertisein face of high rate of attrition is a formidable task. Intensiverecruitment and training on a continuous basis in BPOindustries drains their resources to such an extent that theycannot give proper attention to any other aspect of workingfor achievement of overall organizational goals. Factor 3 cantherefore be named as Obsession for Exper tise.
Conclusions
The study conf i rms the real i t ies of BPO industry. BPOcompanies cannot survive unless they have the requiredprocess exper tise. They are so much overwhelmed withcreat ion, development and maintenance of processexper tise that they cannot focus on anything else. BPOemployees have very narrow areas of responsibilities, withinwhich there is empowerment and teamwork. Outside theirsubstantially narrow areas of responsibilities, BPO employeesavoid taking responsibi l i ty, not being bothered aboutdispleasing seniors and customers.
Keywords: BPO Industry, Organizational Climate, Meta-Climate Motives.
References
Forehand, G.A . and Glimer, B. Von H. “EnvironmentalVariations in Studies of Organizational Behaviour.”Psychological Bulletin. Vol.62, No.6, (1964): 361-382.
Grossman, G.M. and Helpman, E. “Outsourcing in a GlobalEconomy.” Review of Economic Studies. 72 (1),(2005): 135-159.
Gupta, S.S. and Gupta, A . “Vicious Circle of Attrition in theBPO Industry.” The Icfai Journal of OrganizationalBehaviour. Vol.7, No.2. (2008): 57-66.
SCMS Journal of Indian Management , April - June, 2010. 30
A Quarterly Journal
Litwin, G.H., Humphrey, J.W., and Wilson, T.B. “Organi-zational Cl imate: A Proven Tool for ImprovingPer formance.” in W.W. Burke (Ed.), The CuttingEdge: Current Theory and Practice in OrganizationDevelopment. (1978): 187-205, La Jolla, California:University Associate.
Malhotra, N.K. Marketing Research – An Applied Orientation.5th ed., Prentice-Hall of India, Private Limited, NewDelhi, (2008): 612-615.
McCor mack , K . and Johnson , W. Bus iness P rocessOrientation: Gaining the E-Business CompetitiveAdvantage, St Lucie Press, Delray Beach, Florida,USA: 2000.
McCormack, K.P., Johnson, W.C., and Walker, W.T. SupplyChain Networks and Business Process Orientation.St Lucie Press, Delray Beach, Florida, USA: 2003.
Mehta, A ., Armenakis, A ., Mehta, N., and Irani, F. “Challengesand Oppor tun i t i e s o f Bu s i nes s P roces sOutsourcing in India.” Journal of Labour Research.Vol.27, No.3, (2006): 323-338.
Pareek, U. “Motivational Analysis of Organizations - Climate(MAO-C).” in J.W. Pfeiffer (Ed.), The 1989 Annual:Deve lop ing Human Resou rces Un i ve r s i t yAssociates, San Diego, California, USA , (1989):161-180.
Sen, F., and Shiel, M. “From Business Process Outsourcing(BPO) to Knowledge Process Outsourcing (KPO):Some Issues.” Human Systems Management. Vol.25, (2006): 145-155.
Skrinjar, R ., Stemberger, M.I., and Hernaus, T. “The Impactof Business Process Orientation on OrganizationalPerformance.” Proceedings of the 2007 InformingScience and IT Educat ion Jo int Conference,Avai lable at <http:/ /proceedings. in formings c i e n c e . o r g / I n S I T E 2 0 0 7 / I n S I T E 0 7 p 1 7 1 -185Skri357.pdf.> Last accessed on April 5, 2009.
Srivastav. “Organizational Climate in Public Sector – AnEmpir ical Study.” Management and Change.Vol.10, No.2, (2006): 65 -75.
Srivastav. “Dynamics of Role Stress in BPO Industry.” IcfaianJournal of Management Research. Vol.7, No.12,(2008): 7-16.
Tenner, A .R . and DeToro, I. J. (1997), Process Redesign,The Implementation Guide for Mangers, Addison-Wesley, Reading, MA, USA .
Thite, M. “Business Process Outsourcing Issues.” in Wankel,C. (Ed.), 21st Century Management: A ReferenceHandbook, Sage Publications Inc., 2008.

SCMS Journal of Indian Management , Apr i l - June, 2010. 31
A Quarterly Journal
Brand Awareness:Baby Food Products
Keerthi Pandian and Ramachandran K.K.
A h e a l t h y g e n e r a t i o n o f c h i l d r e n l e a d s t o a h e a l t h y g e n e r a t i o n
o f y o u t h r e p l e t e w i t h v i g o u r a n d v i t a l i t y . I t ' s t h e s e f u t u r e
c i t i z e n s w h o d e t e r m i n e t h e s o c i a l a n d e c o n o m i c d e v e l o p m e n t
o f t h e c o u n t r y . T h e p a p e r f o c u s e s o n b r a n d a w a r e n e s s , p r e f e r e n c e a n d s a t i s f a c t i o n
i n t h e b a b y f o o d p r o d u c t s . F i v e h y p o t h e s e s w e r e f r a m e d o n t h e g i v e n o b j e c t i v e s
a n d h a v e b e e n t e s t e d a t f i v e p e r c e n t l e v e l o f s i g n i f i c a n c e . T h e a n a l y s i s c o n c l u d e s
t h a t t h e l e v e l o f s a t i s f a c t i o n o f t h e b u y e r s i s m o r e i n c e r e l a c a m o n g t h e b r a n d s
c o n s i d e r e d f o r t h e s t u d y .
123456789012345678901234567890121234567890123456789012345678901212345123456789012345678901234567890121234567890123456789012345678901212345123456789012345678901234567890121234567890123456789012345678901212345123456789012345678901234567890121234567890123456789012345678901212345123456789012345678901234567890121234567890123456789012345678901212345123456789012345678901234567890121234567890123456789012345678901212345123456789012345678901234567890121234567890123456789012345678901212345123456789012345678901234567890121234567890123456789012345678901212345123456789012345678901234567890121234567890123456789012345678901212345123456789012345678901234567890121234567890123456789012345678901212345123456789012345678901234567890121234567890123456789012345678901212345123456789012345678901234567890121234567890123456789012345678901212345123456789012345678901234567890121234567890123456789012345678901212345123456789012345678901234567890121234567890123456789012345678901212345123456789012345678901234567890121234567890123456789012345678901212345123456789012345678901234567890121234567890123456789012345678901212345123456789012345678901234567890121234567890123456789012345678901212345123456789012345678901234567890121234567890123456789012345678901212345123456789012345678901234567890121234567890123456789012345678901212345123456789012345678901234567890121234567890123456789012345678901212345123456789012345678901234567890121234567890123456789012345678901212345123456789012345678901234567890121234567890123456789012345678901212345123456789012345678901234567890121234567890123456789012345678901212345123456789012345678901234567890121234567890123456789012345678901212345123456789012345678901234567890121234567890123456789012345678901212345123456789012345678901234567890121234567890123456789012345678901212345123456789012345678901234567890121234567890123456789012345678901212345123456789012345678901234567890121234567890123456789012345678901212345123456789012345678901234567890121234567890123456789012345678901212345123456789012345678901234567890121234567890123456789012345678901212345123456789012345678901234567890121234567890123456789012345678901212345123456789012345678901234567890121234567890123456789012345678901212345123456789012345678901234567890121234567890123456789012345678901212345123456789012345678901234567890121234567890123456789012345678901212345123456789012345678901234567890121234567890123456789012345678901212345123456789012345678901234567890121234567890123456789012345678901212345123456789012345678901234567890121234567890123456789012345678901212345123456789012345678901234567890121234567890123456789012345678901212345123456789012345678901234567890121234567890123456789012345678901212345123456789012345678901234567890121234567890123456789012345678901212345123456789012345678901234567890121234567890123456789012345678901212345123456789012345678901234567890121234567890123456789012345678901212345123456789012345678901234567890121234567890123456789012345678901212345123456789012345678901234567890121234567890123456789012345678901212345123456789012345678901234567890121234567890123456789012345678901212345123456789012345678901234567890121234567890123456789012345678901212345123456789012345678901234567890121234567890123456789012345678901212345123456789012345678901234567890121234567890123456789012345678901212345123456789012345678901234567890121234567890123456789012345678901212345123456789012345678901234567890121234567890123456789012345678901212345123456789012345678901234567890121234567890123456789012345678901212345123456789012345678901234567890121234567890123456789012345678901212345123456789012345678901234567890121234567890123456789012345678901212345123456789012345678901234567890121234567890123456789012345678901212345123456789012345678901234567890121234567890123456789012345678901212345123456789012345678901234567890121234567890123456789012345678901212345123456789012345678901234567890121234567890123456789012345678901212345
M s . K e e r t h i P a n d i a n , A s s i s t a n t P r o f e s s o r , S c h o o l o fC o m m e r c e a n d I n t e r n a t i o n a l B u s i n e s s , D r . G R D C o l l e g eo f S c i e n c e , C i v i l A e r o d r o m e P o s t , A v i n a s h i R o a d ,C o i m b a t o r e – 6 4 1 0 1 4 , T a m i l n a d u , E - m a i l : p a k i r t h i@ g m a i l . c o m
D r. R a m a c h a n d r a n K . K . , D i r e c t o r, S c h o o l o f C o m m e r c ea n d I n t e r n a t i o n a l B u s i n e s s , D r. G R D C o l l e g e o f S c i e n c e ,C i v i l A e r o d r o m e P o s t , A v i n a s h i R o a d , C o i m b a t o r e –6 4 1 0 1 4 , Ta m i l n a d u , E - m a i l : d r k k r o f f i c e @ g m a i l . c o m
C
Child-HealthAbstract
hildren are the most crucial resources in any countryfor they contribute to the overal l development ofthe nation. A healthy generation of children leads to
a healthy generation ofyoung people with ful lv igour and v i ta l i ty andthese f u t u re c i t i zenscontribute to the socialand economic develop-men t o f t he coun t r y .Hence, i t i s necessa rythat, more care, attentionand daily supplementarynutr i t ious food are re-quired for the develop-ment/growth of childrenspecially those under sixyears of age. Because,these are the crucial yearswere a ch i ld requ i resattention on both physicaland psychological deve-
lopment. To star t with, a highly nutritional food is essentialfor the children below three years of age, who are generallytermed as babies. Throughout the first year of l ife, the
principal food should bemothe r ’ s m i l k and o fcou r se t he re i s nosubstitute for it in everydimension of a chi ld’sg rowth and deve lop -ment. Baby food shouldbe given as a supplementto mothe r ’ s m i l k o rfo rmu l a and no t a s asubstitute. It is a food,which is given specificallyto i n f an t s , who a reroughly between the ageso f s i x months to twoyears. Sometimes, it mayeven extent to three tofour years of age basedon the individual child’s
SCMS Journal of Indian Management , April - June, 2010. 32
A Quarterly Journal
development, their daily requirement and its likeness towardsthe taste, food, etc. These baby foods come in multiplevarieties and are produced by different manufacturers whichare designed for ease of eating as soft liquid paste. It is theonly food industry that holds parents’ captive for a fewshort years and it never theless holds a sizeable and growingmarket a t mass 1. Based on the above reason, thesemanufacturers have diversified in all the ways from taste,flavour to organic and halal food stuffs and even with DHA(docosahexaenoic acid) and ARA (arachidonic acid) thetwo fatty acids that are naturally found in mother ’s milk thatpromotes child’s mental and visual development.
The manufacturers are at their pace innovating variations inthese products for it to encompass various strata of thesociety and there exists social and ethical issues againstthese baby food products. The government of India hasregu l a ted t he ma r ke t i ng p r ac t i ces o f baby foodmanufacturers, by enacting the Infant Milk Substitutes,Feeding Bottles and Infant Foods (Regulation of Production,Supply and Distr ibut ion) act in 1992 and was fur theramended in June 2003. This act is solely oriented towards,regulating the production, supply and distribution of infantmilk substitutes with a view to protect and promote breastfeeding. It prohibits the adver tising and promotion of theproduct to the general publ ic, any hospita l , medicalpractitioner, pharmacy, and to any pregnant woman. Withthese prevai l ing environments there exist a number ofmanufactu rers such as Nes t le , H . J . He inz Company,Wochardt Ltd., Amul, etc and these manufacturers haveestablished brands that cater to basic needs.
Statement of the Problem
In today ’s fast paced digitized environment, most babiesare weaned on the food prepared by the manufacturers.Many manufacturers have introduced a convenient-oriented-baby food product for the busy young mothers2. The growthof baby food products may be attributed by the factors likethe change in the life style associated with the increasednumber of working women, star ting a family at later age andthe need of financial prioritising for having children. Indeed,the preference and purchasing decisions on baby food areshaped by many factors such as the parents’ l ikes anddislikes, the baby ’s taste, the views of grandparents, friends,peer groups, current fashion and health advice, brand name,
quality, cost, availability and convenience3. By consideringthe above factors, a survey was conducted to know thebuyer ’s brand awareness, preference and satisfaction onbaby food products in Coimbatore city of Tamilnadu.
Objectives of the Study
Ø To ascer tain the brand awareness.Ø To determine the reasons to prefer a brand.Ø To elicit the level of satisfaction on various aspects
in the brand.
Hypothesis
The study is based on the following hypotheses:
♦ There exists no significant association between thedifferent brands of baby food products consumedand (a) the source of awareness, (b) the numberof infants in the family, (c) the age group of infants,(d) the number of years of using the product and(e) the purchase decision.
♦ There is no signif icant difference between thedemographic variables of the respondents and thefactors that forms the reasons for choosing apar ticular brand.
♦ There is no significant difference between variousbrands and the factors that forms the reasons forchoosing a par ticular brand.
♦ There is no signif icant difference between thebrands and the factors considered for satisfaction.
♦ There is no significant relationship between thebrands consumed and the level of satisfaction.
Methodology
The area of the study is Coimbatore city. Period of the studyis Sep. 2007- Sep. 2008. Parents are sample respondents.Primary data is collected from two hundred buyers by usinga structured questionnaire. Convenient sampling method isadministered in this study. The following statistical tools areused: a) Percentage analysis b) Chi-square analysis, and c)

SCMS Journal of Indian Management , Apr i l - June, 2010. 33
A Quarterly Journal
ANOVA. All the tests are car ried at five percent level ofsignificance. A pilot study on a sample of sixty respondentswere conducted to identify the most consumed brand amongthe various brands such as Amul, Amul Spray, Amulya, Nan,Lactodex, Lactogen, Pedia sure, Farex, Dexolac, Cerelac andNestum. Of these Lactogen, Pedia sure, Farex, Cerelac andNestum were consumed most and hence considered forthe study, while determining the age group, children whoare four and below four years of age were considered.
Limitations of the Study
The survey was conducted only in Coimbatore city. Thefindings of the study depend purely on the responses givenby the sample respondents.
Findings of the Study
Majority, 70 percent (140) of the respondents/buyers arefemale. 57 percent (114) of the total (200) respondents fallunder the age group of 20-30 yrs. While considering theeducational qualifications of the respondents 34 percent(70) are post graduates. 30 percent (61) are governmentemployees and 36 percent (71) of those monthly incomeranges between Rs.10,000-Rs.15,000. The numbers ofchildren who are below four years of age in the family of the
respondents are as follows: only one child -59 percent(117), two children – 41 percent (81) and more than two –1 percent (2). The age of the children who are below oneyear are 40 percent (80), and 34 percent (68) of childrenfall under the age group of 1-2 yrs. Fur ther more, 18 percent(36) and 8 percent (16) of the respondents children areclassified between 2-3 yrs and 3-4 yrs of age respectively.The most preferred brand by the buyers for their childrenwas Lactogen which counted for 40 percent (80), followedby Cerelac 24 percent (48), Farex 16 percent (32), Nestum14 percent (28) and Pediasure six percent (12). A maximumof 62 percent (124) of the respondents are purchasing thebrand, nearly for two yrs, and 42 percent (84) of them areaware of the product through their friends and relatives andthe buyers purchase decision, 30 percent (60), dependsfairly on the suggestions offered by spouse/relatives.
Buyer’s Brand Awareness on Baby Food Product
Brand awareness is the extent and the degree by which abuyer recognizes a par t icular brand under prevai l ingdifferent conditions. In general, buyers are aware of thebaby food product in the market through their friends,relatives, doctors and through medias. These sources andvarious other personal factors of the respondents also haveimpact on the awareness of these brands.
Table 1: Chi-square: Relationship between Different Brands and Source of Awareness,Number of children, Age group of Children, Number of years of
using, Purchase Decision.
Factors Chi-square value df Sig value S /NSSource of awareness 15.041 16 0.522 Not s ig
Number of chi ldren 11.137 8 0.194 Not s ig
Age group of chi ldren 99.504 12 0.000 s ig
Number of years of us ing 84.345 8 0.000 s ig
Purchase decis ion 11.673 16 0.766 Not s ig
Table 1 indicates that the hypothesis is accepted (NotSignificant) on the study factors like source of awareness(0.522), number of children in the family (0.194) and thepurchase decisions (0.766) of the buyers. It describes thatthese factors does not create any sense of awareness against
these brands. Whereas, in the case of age group of thechildren (0.000) and number of years in using (0.000) thebrand the hypothes i s i s re jec ted (S ign i f i can t ) . Th i sconcludes that there exists a significant association betweenthe above factors and brand awareness.
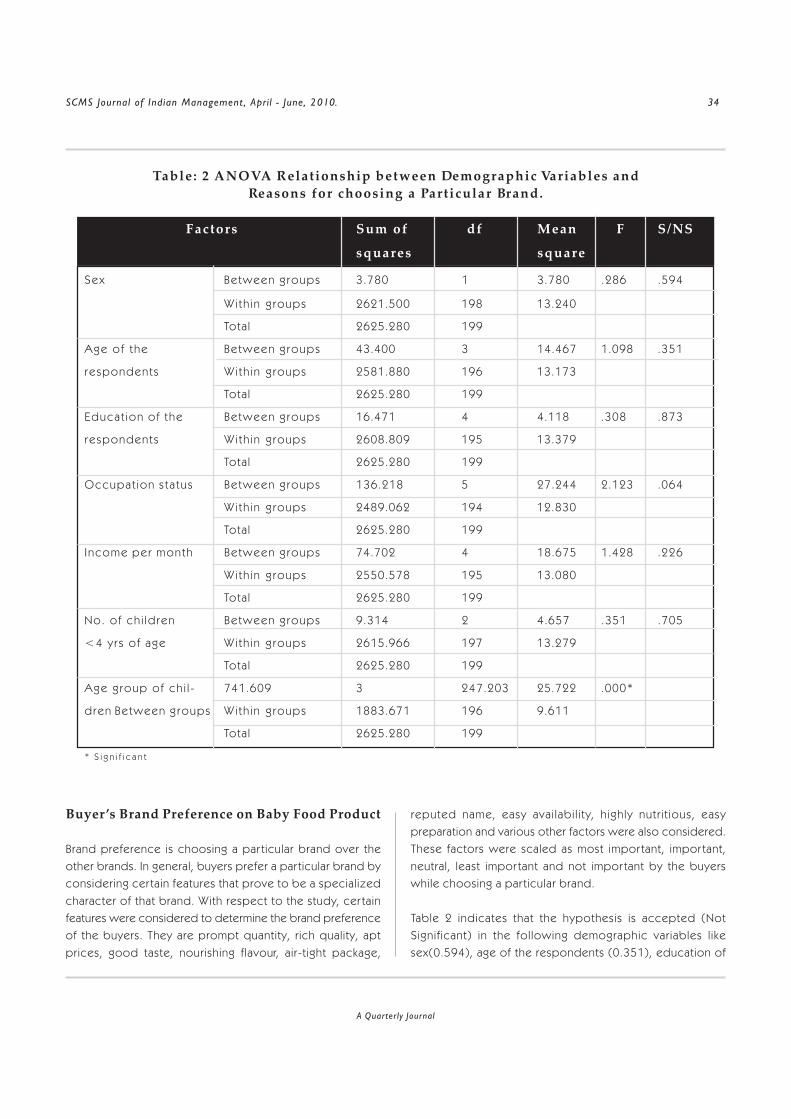
SCMS Journal of Indian Management , April - June, 2010. 34
A Quarterly Journal
Table: 2 ANOVA Relationship between Demographic Variables andReasons for choosing a Particular Brand.
Factors Sum of df Mean F S/NS
squares square
Sex Between g roups 3.780 1 3.780 .286 .594
Wi th in g roups 2621.500 198 13.240
Total 2625.280 199
Age of the Between g roups 43.400 3 14.467 1.098 .351
respondents Wi th in g roups 2581.880 196 13.173
Total 2625.280 199
Educat ion of the Between g roups 16.471 4 4.118 .308 .873
respondents Wi th in g roups 2608.809 195 13.379
Total 2625.280 199
Occupat ion s ta tus Between g roups 136.218 5 27.244 2.123 .064
Wi th in g roups 2489.062 194 12.830
Total 2625.280 199
Income per month Between g roups 74.702 4 18.675 1.428 .226
Wi th in g roups 2550.578 195 13.080
Total 2625.280 199
No. o f ch i ld ren Between g roups 9.314 2 4.657 .351 .705
<4 y rs o f age Wi th in g roups 2615.966 197 13.279
Total 2625.280 199
Age group of ch i l - 741.609 3 247.203 25.722 .000*
dren Between g roups Wi th in g roups 1883.671 196 9.611
Total 2625.280 199
* S i g n i f i c a n t
Buyer’s Brand Preference on Baby Food Product
Brand preference is choosing a par ticular brand over theother brands. In general, buyers prefer a par ticular brand byconsidering cer tain features that prove to be a specializedcharacter of that brand. With respect to the study, cer tainfeatures were considered to determine the brand preferenceof the buyers. They are prompt quantity, rich quality, aptprices, good taste, nourishing flavour, air-tight package,
reputed name, easy avai labi l i ty, highly nutr i t ious, easypreparation and various other factors were also considered.These factors were scaled as most impor tant, impor tant,neutral, least impor tant and not impor tant by the buyerswhile choosing a par ticular brand.
Table 2 indicates that the hypothesis is accepted (NotSignif icant) in the following demographic variables l ikesex(0.594), age of the respondents (0.351), education of

SCMS Journal of Indian Management , Apr i l - June, 2010. 35
A Quarterly Journal
Table 3: ANOVA: Relationship between Brands andReasons for choosing a Particular Brand
the respondents(0.873), occupat ion(0.064), monthlyincome(0.226) and number of children in the family(0.705).This explains that these demographic factors of the buyers(parents) do not form the reasons to prefer a par ticular
brand. Whereas the hypothesis is rejected (Significant) incase of ‘age group of the children’ (0.000), and hence it isthe only factor which forms the reason for choosing apar ticular brand.
Sum of MeanSquares df Square F S/NS
Prompt Quantity Between Groups 50.00 4 12.500 15.943 0.000*
Within Groups 152.88 195 0.784 Total 202.88 199
Rich Quality Between Groups 40.90 4 10.224 12.022 0.000*Within Groups 165.82 195 0.850 Total 206.72 199
Apt prices Between Groups 32.32 4 8.080 4.546 0.002*Within Groups 346.56 195 1.777 Total 378.88 199
Good taste Between Groups 25.94 4 6.485 7.614 0.000*Within Groups 166.06 195 0.852 Total 192.00 199
Nourishing flavour Between Groups 35.33 4 8.832 7.966 0.000*Within Groups 216.19 195 1.109 Total 251.52 199
Air-tight package Between Groups 43.37 4 10.843 16.097 0.000*Within Groups 131.35 195 0.674 Total 174.72 199
Reputed name Between Groups 41.25 4 10.313 8.192 0.000*Within Groups 245.47 195 1.259 Total 286.72 199
Easy availability Between Groups 37.32 4 9.331 12.653 0.000*Within Groups 143.80 195 0.737 Total 181.12 199
Highly nutrit ious Between Groups 24.11 4 6.027 11.313 0.000*Within Groups 103.89 195 0.533 Total 128.00 199
Easy preparation Between Groups 3.98 4 0.995 1.473 0.212Within Groups 131.70 195 0.675 Total 135.68 199
Others Between Groups 13.11 4 3.277 2.197 0.071Within Groups 290.89 195 1.492 Total 304.00 199
* S i g n i f i c a n t
Factors

SCMS Journal of Indian Management , April - June, 2010. 36
A Quarterly Journal
Table 3 indicates that the hypothesis is accepted (NotSignificant) for the factors like easy preparation (0.212) andfor those factors (0.071) that are not considered for thestudy. In all other factors such as prompt quantity (0.000),rich quality (0.000), good taste (0.000), nourishing flavour(0.000), air-tight package (0.000), reputed name (0.000),easy avai labi l i ty (0.000), h ighly nutr i t ious (0.000) thehypothesis is rejected (Significant), which concludes thatthere exist a significant difference in these factors of the
brands and hence the buyers prefer different brands anddoes not confine to a par ticular brand.
Buyer’s Brand Satisfaction on Baby Food Product
Brand satisfaction is the level of contentment that a buyergets from the assor ted promising factors of the brand af terusing it. Those promising factors that were taken for thestudy were price, quantity, taste, flavour, package, brand
Table: 4 ANOVA: Relationship between Brands and Factors considered for Satisfaction
Sum of df Mean F S/NS
Squares Squares
Price Between groups 7.124 4 1.781 1.407 .233
Within groups 246.876 195 1.266
Total 254.000 199
Quantity Between groups 10.858 4 2.714 1.731 .145
Within groups 305.737 195 1.568
Total 316.595 199
Taste Between groups 10.059 4 2.515 1.880 .115
Within groups 260.816 195 1.338
Total 270.875 199
Flavour Between groups 7.168 4 1.792 1.289 .276
Within groups 271.027 195 1.390
Total 278.195 199
Package Between groups 13.308 4 3.327 1.980 .099
Within groups 327.712 195 1.681
Total 341.020 199
Brand name Between groups 5.328 4 1.332 .781 .539
Within groups 332.752 195 1.706
Total 338.080 199
Availability Between groups 15.439 4 3.860 3.370 .011*
Within groups 223.316 195 1.145
Total 238.755 199
Durability Between groups 12.928 4 3.232 2.088 .084
Within groups 301.852 195 1.548
Total 314.780 199
*S ign i f i can t
Factors

SCMS Journal of Indian Management , Apr i l - June, 2010. 37
A Quarterly Journal
name, availability and durability. These factors were scaledas highly satisfied, satisfied, undecided, dissatisfied andhighly dissatisfied.
Table 4 indicates that the hypothesis is accepted (NotSignificant) in the following factors namely, price (0.233),quantity (0.145), taste (0.115), f lavour (0.276), package(0.099), brand name (0.539) and durabil i ty (0.084). Thisexplains that there is no difference in sat isfaction of thebuyers w i th respect to these fac to rs , whereas thehypothesis is rejected (Significant) in the factor availability
(0.011). To conclude the buyers are sat isf ied with thefactors such as price, quantity, taste, f lavour, package,brand name and durabi l i ty for the brands that theyconsume. Table 5 depicts the mean value and standarddeviat ion of different baby products consumed by thebuyers. With the highest mean value of 21.37 it is foundthat the level of sat isfaction is greater in Cerelac amongthe other brands. With the signif icant value of 0.032 inTable 6, the hypothesis is rejected (signif icant) and thereexists a relat ionship between the brands consumed andlevel of sat isfaction.
Table 5: Descriptive Statistics
Baby food Mean N Std. Deviation
products consumed
Pediasure 19.0000 12 4.95434
Lactogen 19.0375 80 4.66455
Nestum 19.7857 28 4.21072
Cerelac 21.3750 48 4.04035
Farex 18.6563 32 4.20145
Total 19.6400 200 4.47892
Table: 6 ANOVA Significance of Overall Satisfaction
Sum of MeanSquares df Square F Sig.
Between Groups 210.009 4 52.502 2.707 .032
Within Groups 3782.071 195 19.395
Total 3992.080 199
Conclusion
The study revealed that there exists a common trait amongthe buyers that weaning the child with these foods wouldenhance the health of the child and as such it gives apsychological satisfaction to the parents. Moreover, the ageof the child is the determining factor for the parents to
determine a par ticular brand. The future implications forthese products include a change in packing strategy withvariations in shape, innovations in flavour and taste and cantake the sachet route with minimum price. Assurance of theingredients used in the baby food product will be a strongselling point for the manufacturers of a par ticular brand. As,this baby food market is static, it holds the buyers only for

SCMS Journal of Indian Management , April - June, 2010. 38
A Quarterly Journal
a shor t period, the manufacturers can go for an innovativeformula of products and rejuvenation of brand image in orderto capture the new born market. As the world is becomingflattened with the IT revolution and with more women in theworking arena, there is more potential market for these babyfood products in the for thcoming years. Indeed, this babyfood product has taken its impor tance in the early and initialgrowth of a child and helps every woman in this digitizedera.
Journal References
Debbie, Howell. “Oh Baby! Mass Consumer ga-ga overChannel’s Infant Offerings.” DSN Retailing Today.Vol.41, Iss.11, (2002): 59.
For Busy Mothers. Market Watch, Food Engineering andIngredients. (2004): 25.
Liz Tuley. The Baby Food Bonanza, Food Manufacture.Vol.74. Iss., 5. (1999): 18.
Jane, Bainbridge. “Quality Supersedes Quantity, SectorInsight–Baby Food And Milk.” Marketing. (2008):28-29.
Michael, J. Harr is. “Consumers Pay a Premium for Organic
Baby Foods.” Food Review. Vol.20, Iss.2, (1997):13.
BPNI Bulletin. October 2003.
Books Reference
David, L. Loudon and J. Della Bitta. “Consumer Behaviour.”Tata Mcgraw Hill Publishers. 2000.
Gandhi, J.C. “Marketing a Managerial Introduction.” TataMcgraw hill Publishers. 1998.
Gupta, S.P. “Statistical Methods.” 26th Edition Sultan Chandand Sons Publishers.1999.
Kothari, C.R. “Research Methodology.” New Age InternationalPrivate Ltd. Publishers. 1999.
Leon, G. Schiffman and Lesh, Lazar Kanak. “ConsumerBehaviour.” 5th Edition. Ashok K. Ghosh Publisher.2002.
Philip, Kotler. “Marketing Management.” 9th Edition. PracticeHall of India Publishers. 2003.

SCMS Journal of Indian Management , Apr i l - June, 2010. 39
A Quarterly Journal
Product Mix Strategies:FMCG in Indian Market
Mohankumar T.P. and Shivaraj B.
T h i s r e s e a r c h p a p e r e x p o s e s t h e a t t i t u d i n a l e f f e c t s o n t h e d e c i s i o n -
m a k i n g p r o c e s s o f c o n s u m e r s i n p u r c h a s i n g F M C G p r o d u c t s i n a m a s s
m a r k e t c o n f i n e d t o H U L a n d P & G C o m p a n i e s s o a p s a n d d e t e r g e n t s . T h i s
a r t i c l e i n t r o d u c e s t h e e x i s t i n g a n d d e s i r e d p r o d u c t m i x s t r a t e g i e s i n F M C G c a t e g o r i e s b r i d g i n g
t h e g a p b e t w e e n c o m p a n i e s a n d t h e c u s t o m e r s . T h e a r t i c l e s t a r t s w i t h t h e p r o b l e m s t a t e m e n t
f o l l o w e d b y s i g n i f i c a n c e , o b j e c t i v e s , s c o p e , m e t h o d o l o g y , l i m i t a t i o n s o f t h e s t u d y , s u m m a r y o f
f i n d i n g s a n d s u g g e s t i o n s a n d r e c o m m e n d a t i o n s .
G
Abstract
Gap-Filling
123456789012345678901234567890121234567890123456789012345678901123456789012345678901234567890121234567890123456789012345678901123456789012345678901234567890121234567890123456789012345678901123456789012345678901234567890121234567890123456789012345678901123456789012345678901234567890121234567890123456789012345678901123456789012345678901234567890121234567890123456789012345678901123456789012345678901234567890121234567890123456789012345678901123456789012345678901234567890121234567890123456789012345678901123456789012345678901234567890121234567890123456789012345678901123456789012345678901234567890121234567890123456789012345678901123456789012345678901234567890121234567890123456789012345678901123456789012345678901234567890121234567890123456789012345678901123456789012345678901234567890121234567890123456789012345678901123456789012345678901234567890121234567890123456789012345678901123456789012345678901234567890121234567890123456789012345678901123456789012345678901234567890121234567890123456789012345678901123456789012345678901234567890121234567890123456789012345678901123456789012345678901234567890121234567890123456789012345678901123456789012345678901234567890121234567890123456789012345678901123456789012345678901234567890121234567890123456789012345678901123456789012345678901234567890121234567890123456789012345678901123456789012345678901234567890121234567890123456789012345678901123456789012345678901234567890121234567890123456789012345678901123456789012345678901234567890121234567890123456789012345678901123456789012345678901234567890121234567890123456789012345678901123456789012345678901234567890121234567890123456789012345678901123456789012345678901234567890121234567890123456789012345678901123456789012345678901234567890121234567890123456789012345678901123456789012345678901234567890121234567890123456789012345678901123456789012345678901234567890121234567890123456789012345678901123456789012345678901234567890121234567890123456789012345678901123456789012345678901234567890121234567890123456789012345678901123456789012345678901234567890121234567890123456789012345678901123456789012345678901234567890121234567890123456789012345678901123456789012345678901234567890121234567890123456789012345678901123456789012345678901234567890121234567890123456789012345678901123456789012345678901234567890121234567890123456789012345678901123456789012345678901234567890121234567890123456789012345678901123456789012345678901234567890121234567890123456789012345678901123456789012345678901234567890121234567890123456789012345678901123456789012345678901234567890121234567890123456789012345678901123456789012345678901234567890121234567890123456789012345678901123456789012345678901234567890121234567890123456789012345678901123456789012345678901234567890121234567890123456789012345678901123456789012345678901234567890121234567890123456789012345678901123456789012345678901234567890121234567890123456789012345678901123456789012345678901234567890121234567890123456789012345678901123456789012345678901234567890121234567890123456789012345678901123456789012345678901234567890121234567890123456789012345678901
M r. M o h a n K u m a r T. P. , C o m m e r c e a n d M a n a g e m e n tF a c u l t y , M a h a r a n i ’ s Wo m e n ’ s A r t s a n d C o m m e r c eC o l l e g e , M y s o r e , E m a i l : m b a m o h a n @ r e d i f f m a i l . c o m
P r o f . S h i v a r a j B . , B a h a d u r I n s t i t u t e o f M a n a g e m e n tS c i e n c e s , U n i v e r s i t y o f M y s o r e , M a n a s a g a n g o t h r i ,M y s o r e - 0 6 , E m a i l : b s h i v a r a j @ h o t m a i l . c o m
ood research depends on a good problem. Awell-defined problem is pre-requisite for goodresearch. In this context, the research problem
considered is “Product MixStrategies of Leading FMCG inIndian Market,” with specialre fe rence to Soaps andDetergents. FMCG market inIndia is one of the fastestgrowing markets in India. Theproduct categories which aremarketed under this, consistsof variety of product lines anditems. In India, there aregood number of companiesmanufacturing and marketingFMCG. Among all, HUL andP&G are in the forefront. Inspite of the wide range of
soaps and detergents marketed in India, there seems to bea gap in the existing product mix offered by the companiesand the customer requirements. The diverse segments in
Indian market are yet to becompletely taped by theexisting players. The currents tudy has a t tempted toknow the ex i s t i ng anddes i r ed p roduc t m i xstrategy in FMCG categorieswith special emphasis onSoaps and Detergents inIndian Market. This researchis going to bridge the gapbetween companies and thecustomers in terms of thecustomer expectation andcompanies understandingof the customers ’ expe-ctation.
SCMS Journal of Indian Management , April - June, 2010. 40
A Quarterly Journal
Significance of the Study
Though, the wide range of soaps and detergents is beingmarketed by the companies, consumers belonging to differentsegments are not effectively delivered with the right productsin right price. The studies, so far conducted on product mixstrategies, are not adequately focusing on bridging the gapbetween marketer and the prospects. Therefore, current studyis designed to address those issues, which are very essentialin designing customer oriented marketing mix strategy. Thisstudy is impor tant because of the type of information itgenerates to assist in developing effective product mix in soapsand detergents. Since, product mix decision is critical decision,it involves huge investment, efforts, and right information savescompanies from the disaster.
Objectives of the Study
The research aims at identifying sal ient features of theProduct Mix Strategies adopted by two FMCG companies inrespect of some of their offerings. The following are someof the specific objectives of the study.
1. To assess the product mix strategy used in consumermarket.
2. To evaluate the Product mix strategy of HUL and P&Gin Indian Market.
3. To determine the customer perception and opinionon product lines offered by the select companies.
4. To assess the existing and desired product mix inFMCG categories in India.
5. To evolve new possible oppor tunities for FMCG inIndian market.
Scope of the Study
The scope of the study deals with the area that has beenconsidered in the research. The area considered in theresearch is product mix strategies of Hindustan Uni-Leverand Proctor & Gamble, in Indian Market. Consumer opinionon the product mix strategy of the HUL and P&G is collectedwith the a id of des igned quest ionna i re . The sample
respondents are selected from the various segments inBangalore and Mysore. The collected data is analyzed tomeet the research objectives.
Methodology of the Study
Research Design
This research is descriptive as well as exploratory in design;it is used when the study is not conversant with the problemenvironment. Such type of investigation is concerned mainlyto determine the general nature of problems and variablesrelated to it. This mainly relies on secondary source ofinformation. Pr imary data has been col lected throughintensive fieldwork from the sample respondent with theaid of structured questionnaire.
Data Analysis Techniques
Statistical tools like tests, cluster analysis etc., and othermethods of presentation like diagrams, char ts, and graphshave been used to draw a precise conclusion.
Sources of Dataa) Primary Data
Sample survey through questionnaire has been administeredto the target respondents at various locations in Mysoreand Bangalore city for comparative study of consumerbehaviour and perception.
b) Secondary Data
Gathered in format ion f rom the assoc ia t ion of FMCGIndustries consumer protection organizations, FICCI, CII andindustry archives. Other required information has beencollected from published journals, books, and concernedresearch repor t s , annua l repor t s o f the company ’ speriodicals, seminar papers, business magazines, dailies,and internet.
Limitation of the Research
The study is mainly based on survey method of research.Therefore, the limitations of survey method are expected toinfluence the out come of the research. Product mix is an

SCMS Journal of Indian Management , Apr i l - June, 2010. 41
A Quarterly Journal
Table No.1: Showing the Soaps and Detergent Brands usage of the Sample Respondents
Sl.No. Brand Name No. of Respondents No. of Respondents Presently using Used in the past
1. Lux 59 271. L i r i l 30 252. Breeze 15 053. Jai 07 034. O.K 00 175. L i febuoy 34 266. Fa i r & Lovely Soap 04 007. Hamam 19 108. Pears 33 159. Rexona 40 1010. Dove 08 0311. Camay 02 0012. Salvo 04 0513. Ivory Soap 06 0314. Joy 00 0015. Sur f 65 2016. T ide 58 2517. Wheel 62 2718. Henko 28 0519. Ar ie l 64 2020. Zes t 00 0021. Rin 48 26
area of competitive advantage; companies were hesitant toreveal the information on product mix strategy they followed.The information provided by the companies is assumed tobe factual and its validity is not questioned.
The above Tab le No.1 ind ica tes the cur rent l y usedbrands and the brand used in the past . I t a l so showsthat the customers are not loyal to any brand for a longerper iod. In case of Lux 59 percent of the respondents
are cur rent ly us ing and 27 percent used in the pastswi tched over to other brands. F rom th is i t i s in fer redthat bui ld ing a brand loya l ty i s a cha l leng ing task insoaps and detergent market . The s tudy indicates thatthe respondent present ly us ing a par t icu la r brand ofto i le t soap and detergents and a lso was used in thepast . As the indiv idua l tas tes and preferences keepchanging, major i ty of the respondents are swi tch ingover f rom one brand to another.
Table 2: Monthly spending on Bathing Soaps
Spending Soaps PercentageBelow Rs.50 4 0 4 050-100 30 30100-200 15 15Above200 15 15

SCMS Journal of Indian Management , April - June, 2010. 42
A Quarterly Journal
The below Table No.2 shows that spending on soaps by therespondents per month varies from one another. Majority ofthe respondents i.e. 40 percent who spends Below Rs.50per month followed by 30 percent Rs.50-100, 15 percentRs.100-200 and 15 percent spend above 200 Rs. per month.
The below Table No.3 shows that the surveyed respondentshow much money spends on detergent per month. The
study shows that even on detergent major i ty of the
respondents i.e. (45 percent) spend below Rs.50 followed
by Rs.50-100 of 30 percent, Rs.100-200 of 15 percent and
above Rs.200 of 10 percent. The study revealed that the
percentage of the money which the respondents are
spending on soaps and detergent is very minimal of their
income.
Table 3: Monthly spending on Detergent Cake
Spending Detergents PercentageBelow 50 45 45
50-100 30 30100-200 15 15Above 200 10 10
The above Table No.4 shows that the surveyed respondentshow much money spends on detergent powder per month.The study shows that the h ighest percentage of therespondents i.e. 45 percent spends below Rs.50 followedby Rs.50-100 of 30 percent, Rs.100-200 of 15 percent andabove Rs.200 of 10 percent. The study revealed that the
percentage of the money which the respondents arespending on soaps and detergent is very minimal of theirincome. According to the respondents, the money spenton detergent cake and detergent powder are inter related.If they use more powder, they will use less cake and viceversa.
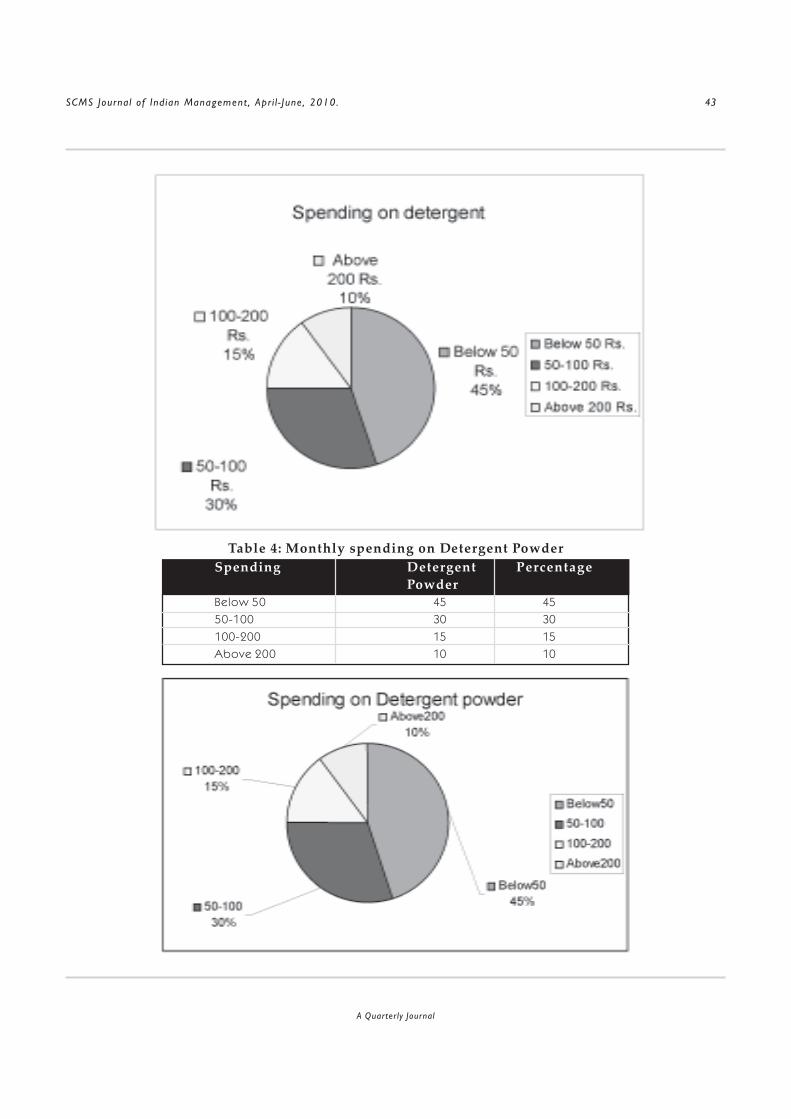
SCMS Journal of Indian Management , Apr i l - June, 2010. 43
A Quarterly Journal
Table 4: Monthly spending on Detergent PowderSpending Detergent Percentage
PowderBelow 50 45 4550-100 30 30100-200 15 15Above 200 10 10

SCMS Journal of Indian Management , April - June, 2010. 44
A Quarterly Journal
Table: 5 Purchased Quantit ies of Detergent Cake per Month
Quantities Detergents Percentage 1 - 3 25 25
3 - 6 60 60
Above6 15 15
No. of Soaps used per month
The above Table No.5 g ives the picture of d i f ferentquant i t ies of soaps the respondents use per month.40 percent o f the respondents use 3-6 soaps permonth, fol lowed by 30 percent they use 1-3 soaps and
the rema in ing 30 percent use above s ix soaps perm o n t h . This g i v e s t h e i n f o r m a t i o n a b o u t t h e t o t a lconsumpt ion of the se lected respondents and i t a l sog ives the market potent ia l for the soap.
Table 6 : Consumer Awareness of Different Soaps of HLL Soaps
No. of Respondent
Premium Popular Economy
Awareness 25 60 55
Unaware 75 40 45
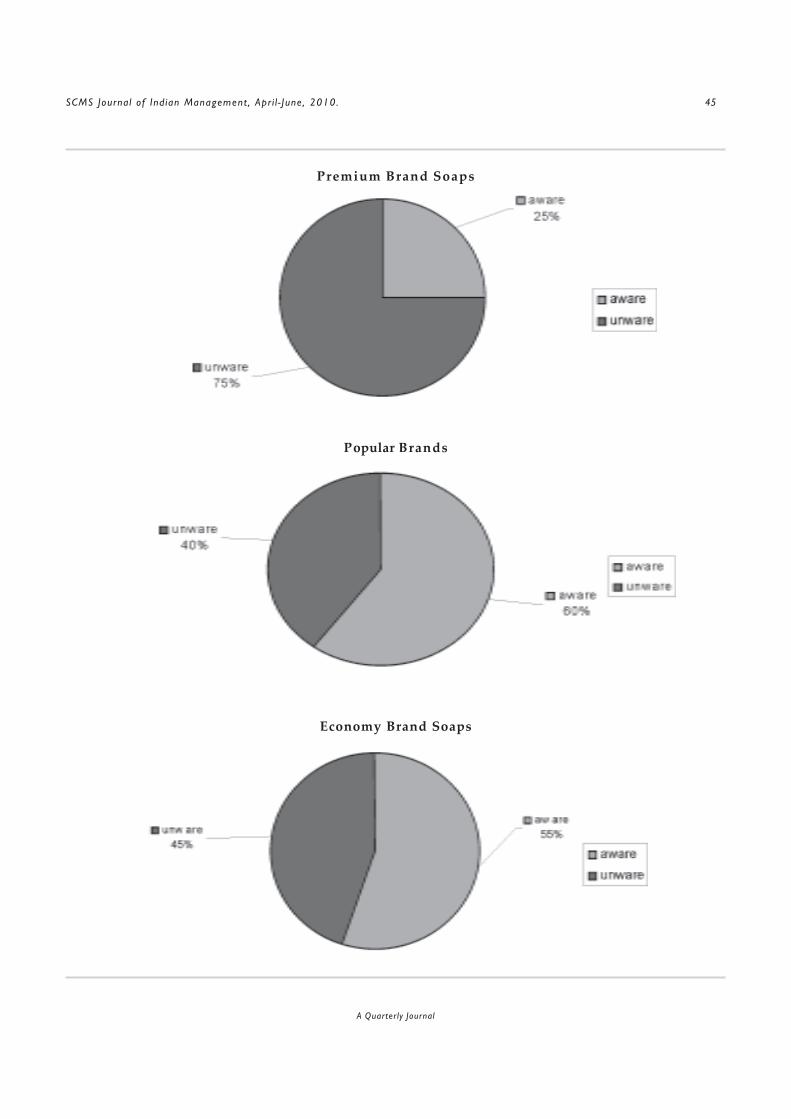
SCMS Journal of Indian Management , Apr i l - June, 2010. 45
A Quarterly Journal
Premium Brand Soaps
Economy Brand Soaps
Popular Brands

SCMS Journal of Indian Management , April - June, 2010. 46
A Quarterly Journal
The above table No.6 reveals about the awareness status ofdifferent soap segments i.e. Premium brand, Popular brandand Economy brand which are available in the market. HerePremium brands are comparatively of higher price, targetedto the higher end market. Popular brands prices are lesswhen compared to premium soap. Company spends moreon promotional activities like advertisement, brand celebrityand on other promotional schemes. It is targeted to midsegment in the market. Economy brands are lesser in price,targeted to lower end of the market.
Among the respondents 75 percent are not aware of thePremium brand soaps. It inferred that the availability of theproduct is not equally distributed. It is restricted only to
urban market and the price of the product is not affordableto all the segments.
In Popular brand, though the name itself is popular it is sorryto reveal that only 60 percent of the respondents are awareand exposed to this brand. In fact, company should putserious effort to reach all the segments in the market throughtheir aggressive marketing.
In Economy brand the study reveals that 55 percent of therespondents are aware of and exposed to this Economy brandand 45 percent of the respondents are not aware of this brand. Itmeans that all soaps which are marketed by different companiesin the market are not aware of 100 percent.
Table 7: Consumer Awareness of P&G Detergent Cake and Powder
No. of Respondent Premium Popular Economy
Awareness 35 70 40
Unaware 65 30 60
Premium Brands

SCMS Journal of Indian Management , Apr i l - June, 2010. 47
A Quarterly Journal
The above Table No.7 shows the awareness status of the
different detergent segments, as we studied above as in
soap segments. i.e. Premium brand, Popular brand and
Economy brand in detergent.
In premium detergent brands 35 percent of the respondents
are aware of and exposed to this detergent, the remaining
65 percent are not aware of the brands.
In popular detergent brands 70 percent of the respondents
are aware of and exposed to the brands. And 30 percent of
the respondents are not aware of the brands.
In economy detergent brands only 40 percent of therespondents are aware of and exposed to the detergentsand remaining 60 percent of the respondents are not awareof the brands. This study reveals that different segmentedbrands are targeting to different market segments. Marketingstrategies used by the companies are restricted to thatpar ticular segment only. For e.g. premium brands soaps anddetergents are targeting to higher end, so all the promotionalactivities used by the company will reach to that par ticularmarket only. Like that, to other economy brands also. Onlythe popular brands may use both mid segment andeconomy segment, some times by higher end people mayalso be exposed to have this product.
Popular Brands
Economy Brands

SCMS Journal of Indian Management , April - June, 2010. 48
A Quarterly Journal
Ta b l e 8 : Th e Fa c t o r s c o n s i d e r e d t h e m o s t b y t h eCo n s u m e r w h i l e p u r c h a s i n g So a p s
F a c t o r s N o o f R e s p o n d e n t s P e r c e n t a g e
Pr ice 55 55
S i ze o f t he soap 12 12Qua l i t y 80 80La the r 42 42Fragrance 28 28Sk i nca re 64 64Durab i l i t y 05 05P romot iona l scheme 06 06
The above Table No.8 directs that what percentage ofthe respondents preferred the most whi le purchasingsoaps. Because human wants and tastes are di f ferentfrom person to person, place to place and t ime to t ime.According to the survey 80 percent of the respondents
preferred the most because of the qual i ty of the soapswhi le purchasing, fol lowed by 64 percent because ofsk in care, 55 percent are because of pr ice, 28 percentare because of lather in the soap, then size, promotionalscheme and durabi l i ty .

SCMS Journal of Indian Management , Apr i l - June, 2010. 49
A Quarterly Journal
Table 9: The Consumer consider theFactors the most while purchasing Detergents
Factors No of Respondents Percentage
Price 43 43
Size of the soap 14 14Quality 72 72Lather 37 37Fragrance 23 23Skincare 72 72Durabil i ty 47 47Promotional scheme 35 35
The above Tab le No.9 shows tha t what percentage ofthe respondents prefer red the most whi le purchas ingthe detergent . Accord ing to the survey 72 percent ofthe respondents pre fe r red the par t icu la r detergentbecause of the qua l i t y and sk in ca re , fo l lowed by 47
percent durabi l i ty, 43 percent pr ice, 37 percent lather,35 percent promot iona l scheme, f rag rance and s izeo f t h e s o a p . T h e s t u d y a l s o r e v e a l e d t h a t s a m ecustomer used d i f fe rent detergent brand for d i f fe rentfabr ics .
Ta b l e 1 0 : T h e Cu s t o m e r r a n k i n g o f Va r i o u s Br a n d s o f H U L a n d P & G
Ranks/ Palmolive Salvo Pears Lux Lifebuoy Dove Camay IvoryI s t Rank 10 0 35 15 10 21 0 9
II 9 2 20 19 20 15 0 15I I I 20 16 14 20 15 5 4 6IV 15 30 5 6 9 0 30 5V 10 22 0 10 15 7 31 5

SCMS Journal of Indian Management , April - June, 2010. 50
A Quarterly Journal

SCMS Journal of Indian Management , Apr i l - June, 2010. 51
A Quarterly Journal
The above Table No.10 shows the ranking status of differentsoap brands of Hindustan Unilever Limited and Proctor andGamble in the minds of surveyed respondents. 35 percentof the respondents have given I rank to Pears, followed by21 percent have given I rank to Dove.
II rank has been given to Pears and Lifebuoy by 20 percent ofthe respondents each, followed by Lux by19 percent, Doveand Life buoy by 15 percent each.
Palmolive and Lux have been given III rank by 20 percent ofthe respondents each followed by Lifebuoy by 15 percent,pears 14 percent.
Salvo and Camay have been given the IV rank by 30 percent
of the respondents each, followed by Palmolive by 15
percent, Lifebuoy by nine percent.
Camay was given V rank by 31 percent of the respondents,
followed by Salvo by 22 percent, Lifebuoy by 15 percent.
Summary of Findings
The analysis made in the foregone chapter is presented in
this section as summary of findings. The impor tant findings
are as follows:

SCMS Journal of Indian Management , April - June, 2010. 52
A Quarterly Journal
1. Hindustan Unilever soaps and detergent line are muchwider than Proctor and Gamble brands in Indian market.
2. Hindustan Unilever soaps and detergents brand areavailable in all levels of the market i.e. upper end, midsegment and lower end of the market, where as Proctorand Gamble brands are mainly focusing on higher endof the market.
3. There is a wide gap in the perception about differentbrands of soaps and detergents among urban and ruralconsumers.
4. Quality is the major purchase determinant of soapsand detergent among the h igher income grouprespondents, where as price is the most impor tantfactor in the lower end of the market.
5. Among the Premium, Popular and Economy brands ofbathing soap segments, Popular brands are exposedto 70 percent of the e respondents followed byeconomy 40 percent and premium brands 35 percent.
6. Pears of Hindustan Unilever Limited is ranked as numberone brand by about 35 percent of the respondent.Dove of Proctor and Gamble by 21 percent of therespondents, followed by Lux by 15 percent of therespondents.
7. The factors influence in purchasing detergent includesprice, size of the soap, quality, lather, fragrance, skincare, durability, promotional scheme. Among themskin care as more impor tant factor for more than 72percent of the respondents followed by quality 72percent, durability 47 percent, price 43 percent, lather37 percent, promotional scheme 35 percent, fragrance23 percent and size of the soap 14 percent of therespondents.
8. The factors influencing in purchasing bathing soap areprice, size of the soap, quality, lather, fragrance, skincare, durability and promotional scheme. Quality isthe most impor tant factor for 80 percent of therespondent, skin care 64 percent, price 55 percent,la ther 42 percent fo l lowed by f ragrance, s ize ,promotional scheme and durabil ity. Therefore the
factors influences on bathing soaps are different fromthe factors influencing the detergents purchase.
9. Monthly spending on soaps and detergents varies fromincome to income. In the research it is found that 40percent of the respondent spends less than Rs.50 permonth on bath ing soap and 30 percent of therespondents spend Rs.50–Rs.100 per month andremaining 30 percent of the respondents spend morethan Rs.100 per month. It shows that higher incomegroup purchase premium brands of bathing soap.Therefore spending on bathing soap is more thanRs.100 per month.
11. Quantity of soaps and detergents purchase and familysize is highly correlated. In the study it is found thatthe families with more members are using more thanone bathing brands. Therefore this gives an input indesigning a family pack consisting of multi brands of acompany.
12. Among the HUL top of the mind awareness companyin soaps and detergent category followed by Godrej,Proctor & Gamble, Wipro etc.
13. Among the studied brands Lux is currently being usedby as many as 59 percent of the respondent, followedby 34 percent Lifebuoy, 30 percent Liril and otherbrands. In detergent Surf is being used by 65 percentfollowed by 62 percent Wheel, 58 percent Tide andother brands.
14. Product mix strategy adopted by HUL, as per the studyis full market coverage with multi brands and strongdistribution net work in both rural and urban markets,whereas Proctor and Gamble follows quality leaderstrategy with select brands in soaps and detergents.
Conclusion
Soaps and detergents market are the fastest growing in thewor ld among the consumer product . The growth i spropor tionate to the growth of population. Among theconsumer goods manufacturer and marketer, Unilever andProctor and Gamble are in the fore front. In India tooHindustan Unilever and Proctor and Gamble created a new

SCMS Journal of Indian Management , Apr i l - June, 2010. 53
A Quarterly Journal
dimension in consumer goods marketing. The soaps anddetergents offered by these two giants are available in flexiblemarket offer to accommodate diverse segments in consumermarket.
Hindustan Unilever, being a subsidiary of Unilever U.S. islocalized in its presence in Indian market. The company hasmany land mark products which are popular and having topof the mind awareness among Indian consumers. Proctorand Gamble, though entered Indian market off late hasregistered in the mind of the customer as a quality leader.
Soaps and Detergents offered by these companies areclosely competed one another. According to this study,HUL stand out as a most admired company in terms of therange of products and services. The wide range and widthof the product mix is the strength of the company. Soapsand Detergents among the other product lines offered byHUL are the drivers of the sales revenue. The driving brandsamong the soaps and detergents are Lux, Dove, Palmolive,Rexona, Liril, Surf excel, Wheel etc.
Proctor and Gamble is known for its quality products inconsumer market, focusing largely on the upper end of themarket. Some of the popular brands in soaps and detergentsare Pears, Camay, Ariel, Tide etc.
In conclusion, it is obvious that both HUL and P&G are placedin a very advantageous position in Indian market. Indianmarket i s d iverse in te rms of income, geograph ica ldispersion, regional differences and tradition. In the study itis found that there are still some untapped market segmentsin both upper and lower end of the market. This is evidencedby the brand switching in soaps and detergent market, fore.g. percentage of the respondents currently using Lux isabout 59 percent about 27 percent of the respondents haveswitched to other brand from Lux. During the interactionwith the respondent it was known that customers are notcompletely satisfied with the brands currently available inthe market. Therefore the companies need to spend timeand money on market study to determine and devicesuitable market offers.
Being well known brands in Indian market, HUL and P&G cancapital ize the market potential , provided a systematicmarketing mix in terms of product, price, promotion and
physical distribution is effectively blended to adapt to themarket requirement.
Suggestion and Recommendation
Based on the analysis made in the foregone chapter and thegeneral observation made on soaps and detergents market,the following few suggestions are made.
Effective Product-based Market Segmentation
In the study it is found that, soaps and detergents are in themarket, as if they are catering to the needs of the mass in themarket, as if they are catering to the needs of the massmarket. Therefore in the study it is suggested to make a finetune market segments through product differentiation, fore.g. Lux or Hamam soap offered by HUL are targeted on thesame customer segments, competing each other. One isdoing well at the cost of other. Company, either by addingsome different ingredients or by effective positioning thedifference in each brand and creating a separate segmentfor each of the brands, then the existence of the brandscan be managed.
Reaching all ends of the Market
The analysis of the study reveals that, P&G is focusing onthe h igher end of the market . The company being aconsumer goods manufacturer and compete with otherplayers in the market, in the study it is recommended todesign soaps and detergents for lower and mid marketsegments also. Indian market is made up of strong middleclass customer followed by lower income group. P&G isignoring the impor tant market segments. As it is evidencedby many companies, the bottom line of the firms rests onthe sales revenue generated in low and mid market, companycan develop products for the same.
Focusing more on creating Brand Awareness
The analysis in the study shows that brand awareness is thekey for success in consumer market. In India there is a hugegap among the customers in terms of literacy, income, urbanand rural composition, and also media exposure. Fur ther itis known by the study that the P&G’s soaps and detergentbrands are unaware with most of the consumers. Therefore

SCMS Journal of Indian Management , April - June, 2010. 54
A Quarterly Journal
it is suggested in the study P&G should pay more importancefor promotional offers and adver tisements to target Indianmarket to cover all the segments.
Penetrating in to New Segments
In the study it is found that HUL and P&G soaps are currentlyavailable in adult segment only. Since baby segment is oneof the important segments and presently there are only fewmanufacturer and marketer catering to this segment, HULand P&G also can think of entering the segment with superiorproduct formulation and designing baby soap for all incomesegments.
Marketing Strategy for Rural Market
The study reveals that soaps and detergent brands of HULand P&G are more popular in urban markets. Since realIndia lives in rural areas and it is potential market for all typesof soaps and detergents. In the study it is advised to thecompany develop a tailor made marketing mix with moreemphasis on product mix should be designed by thecompanies. Rural sales promotional activities should bestrengthened especially Proctor and Gamble to take theadvantage of rural market potential.
Reference
Bar tos, Rena. “Over 49: The Invisible Consumer Market.”Harvard Business Review. 58 January-Februar y(1980): 140-48.
Beer, William R . “Househusbands: Men and Housework inAmerican Families.” South Hadley, Mass: J.F. BerginPublishers, 1983.
Belch George E., Michael A . Belch, and Gayle Ceresino.“Parental and Teenage Child Influences in FamilyDecision Making.” Journal of Business Research.13April: (1985): 163-76.
Belk, Russell W. “Materialism: Trait Aspects of Living in theMaterial World.” Journal of Consumer Research. 12(December): (1985):265-80.
Belk, Russell W. and Richard W. Pollay. “Images of Ourselves:The Good Life in Twentieth Century Adver tising.”Journal of Consumer Research. 11 March (1985):187-97.
Bennet t , Peter C. and Rober t , G. Cooper. “The Misuseof Market ing: An Amer ican Tragedy.” Bus inessHor izons . 24 November -December (1981) :51-61.
B l a c k b u r n , M c K i n l e y L . , a n d D a v i d E . B l o o m .“ W h a t ’ s H a p p e n i n g t o t h e M i d d l e C l a s s . ”A m e r i c a n D e m o g r a p h i c s . J u n e : ( 1 9 8 5 ) :19 -25 .
Bloom Paul. “Marketing Professional Services.” EnglewoodCliffs. N.J.: Prentice-Hall, 1984.
Brayton, James A. “Motivation, Cognition, Learning: BasicFac to r s i n Consumer Behav iou r. ” Jou r na l o fMarketing. 22 January (1958): 282-89.
Burnett, John and Alan Bush. “Profiling the Yuppies.” Journalof Adver tising Research. 26 April-May (1986): 27-35.
Dr.B.Nagaraja. “Consumer Behaviour in Rural Areas: AMicro level study on Buying Behavior of RuralConsumers in Kavali Mandal.” Indian Journal ofMarketing. 30-36.
“Issues and advances in segmentation Research – Yoramwind.” Journal of Marketing Research. Vol.XV, Aug.,(1978): 317-37.
Ni rmalya, Kumar. “Market ing as St rategy.” New Delh i :Thomson Press. 2000.
Pradeep, Kashyap Sidartha Raut. “The Rural Marketing.” NewDelhi: Himal Impressions, 2006.
Terry Grapentine and Randy Boomgaarden, “Maladies ofMa r ke t Segmen ta t ion Resea rch . ” Ma r ke t i ngResearch. Spring 2003.
SCMS Journal of Indian Management , Apr i l - June, 2010. 55
A Quarterly Journal
Small is Beautiful?Corporate Social Responsibility
Prasenjit Maiti
T h i s p a p e r a t t e m p t s a t e x p l o r i n g f u t u r e r o a d m a p s o f r e s e a r c h i n t h eh a p p e n i n g a r e a s o f c o m m u n i t y d e v e l o p m e n t s t r a t e g i e s f a c i l i t a t e db y t h e f o r m a t i o n o f a n e n a b l i n g e n v i r o n m e n t o f s o c i a l c a p i t a l a n d
u n d e r p i n n e d b y b o t h c o r p o r a t e c i t i z e n s h i p a n d s o c i a l e n t r e p r e n e u r i a l e n d e a v o ur s o n t h ep a r t o f t h i r d s e c t o r i . e . c i v i l s o c i e t a l a c t o r s . H o w c a n t h e b o d y c i v i l e m e r g e f r o m o u r p u b l i cs p h e r e i n o r d e r t o c r i t i c a l l y n e g o t i a t e w i t h t h e s t a t e ( b o d y p o l i t i c ) a n d t h e m a r k e t ( b o d ye c o n o m i c ) i s a p r i n c i p a l c o n c e r n o f t h i s p a p e r . O u r c e n t r a l a r g u m e n t h i n g e s u p o n t h ea s s u m p t i o n t h a t g r e a t e r c o o p e r a t i o n a n d i n f o r m e d c o n s e n t c a n o n l y w o r k t o w a r d s a l a r g e rc o n s e n s u s o f i n t e r e s t s , t h a t i s a g a i n a m a c r o c o s m o f i n d i v i d u a l w o r l d v i e w s a n d o r g a n i c a l l ym o t i v a t e d p r o f i t e e r i n g v e n t u r e s . F r o m t h e b e a u t i f u l s m a l l t o t h e e v e n m o r e f a s c i n a t i n g l a r g e rs o c i a l e n t i t y o f t h e c o l l e c t i v e s o c i a l a r r a n g e m e n t i s a n o n g o i n g j o u r n e y t h a t c a n b e f u r t h e rc a t a l y z e d b y a n o p t i m u m m i x o f t h e s e l f a n d t h e o t h e r ?
T123456789012345678901234567890121234567890123456789012345671234567890123456789012345678901212345678901234567890123456712345678901234567890123456789012123456789012345678901234567123456789012345678901234567890121234567890123456789012345671234567890123456789012345678901212345678901234567890123456712345678901234567890123456789012123456789012345678901234567123456789012345678901234567890121234567890123456789012345671234567890123456789012345678901212345678901234567890123456712345678901234567890123456789012123456789012345678901234567123456789012345678901234567890121234567890123456789012345671234567890123456789012345678901212345678901234567890123456712345678901234567890123456789012123456789012345678901234567123456789012345678901234567890121234567890123456789012345671234567890123456789012345678901212345678901234567890123456712345678901234567890123456789012123456789012345678901234567123456789012345678901234567890121234567890123456789012345671234567890123456789012345678901212345678901234567890123456712345678901234567890123456789012123456789012345678901234567123456789012345678901234567890121234567890123456789012345671234567890123456789012345678901212345678901234567890123456712345678901234567890123456789012123456789012345678901234567123456789012345678901234567890121234567890123456789012345671234567890123456789012345678901212345678901234567890123456712345678901234567890123456789012123456789012345678901234567123456789012345678901234567890121234567890123456789012345671234567890123456789012345678901212345678901234567890123456712345678901234567890123456789012123456789012345678901234567123456789012345678901234567890121234567890123456789012345671234567890123456789012345678901212345678901234567890123456712345678901234567890123456789012123456789012345678901234567123456789012345678901234567890121234567890123456789012345671234567890123456789012345678901212345678901234567890123456712345678901234567890123456789012123456789012345678901234567123456789012345678901234567890121234567890123456789012345671234567890123456789012345678901212345678901234567890123456712345678901234567890123456789012123456789012345678901234567123456789012345678901234567890121234567890123456789012345671234567890123456789012345678901212345678901234567890123456712345678901234567890123456789012123456789012345678901234567123456789012345678901234567890121234567890123456789012345671234567890123456789012345678901212345678901234567890123456712345678901234567890123456789012123456789012345678901234567
D r .P r a s e n j i t M a i t i , A s s i s t a n t P r o f e s s o r, P G D B MD e p a r t m e n t , I n d i a n I n s t i t u t e o f S o c i a l We l f a r e a n dB u s i n e s s M a n a g e m e n t ( I I S W B M ) , M a n a g e m e n tH o u s e , C o l l e g e S q u a r e We s t , K o l k a t a - 7 0 0 0 7 3 ,E - M a i l : p r a s e n j i t . m a i t i @ g m a i l . c o m
Abstract
Roadmapping
h i s pape r makes an a t tempt to i n te r roga te t heunderly ing connect ions between urban and rura lcommunity development and Corporate Socia l
Responsibility (CSR) underpinned by the dynamics of socialcapital. We argue that embe-ddedness and connectivitieswithin the social psyche canwork towards contributing tothe overarching policy framework of community develop-ment while this entire processcan be extended an impetus byvir tue of CSR-led initiatives.
The community as a whole cannever be left alone to itself as atheoretical category or even aconst ruct of post-postmo-dernist ideology that tends to
approach the whole as a multicultural imbroglio of politics thatis without any sense of direction or honesty of purpose. It isto be appreciated that the individual actors play a greater rolein community dynamics that we shal l ever be able to
understand. And this itself lendsa plethora of analytical pers-pectives to the politics of CSRunderpinned by the dynamicsof Social Capital.1
For Social Capital is a convenientarrangement (an altogether toosimplistic heuristic concern) oflearnt values and ethical choicesthat is context-specif ic androoted in what we addressnowadays as culture root para-digms. The discourses of trustand cooperation tend to lead
SCMS Journal of Indian Management , April - June, 2010. 56
A Quarterly Journal
us to an understanding where we star t to believe that even istrust has to be inculcated by a process of critical political
socialization. Such an approach may be self-deprecatory inthe long run.2
The Polemic
The relationship between Social Capital, Corporate Social
Responsibility and Urban Development Policies hinges on adebate that is informed by both a symbiotic as well as a
semiotic discourse. It is apparent that CSR and Social Capitalare mutually dependent while Urban / Rural (Community)
Development Debates are constructs of the social well-beingideology that are influenced prominently by civil societal
dynamics. So the disturbing questions that are obvious at thisjuncture are as follows:
1. Is Social Capital only an altruistic arrangement of trust and
cooperation that should never be bothered about the
everyday politics of life that happens to determine the
way corporate players tend to invest in what we address
as social profits?
2. Are social profits so far removed from the reality of CSR
that these are disengaged (so to day) from pressing
economic, cultural, political, environmental and ethical
concerns?
3. Should a multi-verse of liberal and competitive democracy
at all be allowed to encroach upon the domain of practical
reason of what essentially constitutes the core of social
consent?
4. If CSR is not sustained by the bindings of a community-
level incipient contract then what other motivational
strategies should be deployed to ensure that Social Capital
is present and alive and kicking (so to say) in order to
broad-base community development initiatives?
5. Why should corporate biggies invest financial profits in
CSR if not at all inspired by Social Capital as a new value
and a worldview that also suggests that what you put in
ultimately you draw out if not in terms of money but at
least in terms of enhancement of your public image?
Pretty disturbing questions but there is always the opportunityto recline on the postmodern couch and spin high theories inorder to collate theory and praxes in a more or less acceptableformat. The issues of power, hegemony, legitimacy and conflictemerge as serious contentions at this point when weincreasingly tend to address the WE rather than the I and theUS / OUR rather than the MINE/ MYSELF.3
For CSR is all about a deepening sense of commitment towardsthe whole rather than the part where we are all entirely de-schooled in order to be tutored in the pedagogic of theunderprivileged. And Social Capital simply happens to be aconvenient tool that is more often than not deployed by CSRpractitioners in order to create a few visible benefits i.e. abasket of utilities, so to say.4
The real challenge follows subsequently when the questionsof what to give to whom and why and where and how emerge.This is the classical dilemma of the authoritative allocation ofvalues that simply illustrates that whatever you do and howhard you try you shall never be able to give universal and uniformsatisfaction to your clientele as their service provider. So youhave to walk precariously across the tightrope of priorities thatare decided rather upon the basis of situational exigenciesrather than the perspective of visionary thinking!
The Counter-Polemic
Corporate Social Responsibility as an analytical tool can beused in the field of Business Management to facilitate differentbusiness practices from both an ethical angle and a utilitarianperspective. Business managers should try to entrench networksof trust, loyalty and cooperation within and without theirorganizations. This also makes good business sense in termsof rational choice theory.
Good business is also about establishing customer-friendlyimages in a manner that highlights values such as reliability,trustworthiness, quality, economy and durability. These valuesevolve over t ime and are underpinned by a sustainedrelationship of confidence. So specific products more oftendo not become identified with brand names either for niche orfor broad-based markets. Brand equity and positioning sogenerally depend upon the successful merchandizing ofproducts and their images.

SCMS Journal of Indian Management , Apr i l - June, 2010. 57
A Quarterly Journal
The changes induced by development in a liberal democraticcountry like India can be reasonably managed if urbanization isbased on multi-stakeholder dialogues based on trust andnetworks of cooperation (what we tend to increasingly addressnowadays as Social Capital). Non-inclusion of all the concernedstakeholders may lead to discontent and even violence.
The political scenario of West Bengal after the Union ParliamentElections 2009 demonstrates the importance of Social capitalin our civil society. In the run up to the General Elections amajor electioneering campaign of the Opposition was focusedon the role of the State Government in forcible land acquisitionsby exercising Eminent Domain (acquiring private land andproperty for a public cause by citing the Land Acquisition Act1894).
The Opposition maintained that private entrepreneurs shouldeither purchase land directly from the owners (cultivators) orelse build their factories on land owned by the StateGovernment. But the industrialists wanted to purchase plotsof land near Kolkata to utilize the available infrastructural facilities.The State Government sided with the industrialists by forciblyacquiring fer tile agricultural land.
The result of the elections was a traumatic defeat for the rulingLeft Front, its worst electoral defeat since they first came topower in West Bengal in 1977. The defeat was preceded andfollowed by skirmishes and political violence that snowballedinto a twelve-hour General Strike called by the Opposition on17 July 2009.
The West Bengal Government has now declared that no landwill be taken forcibly from unwilling owners. India, along withrest of the world, is currently trying to combat the globalrecession. The recession has made infrastructure developmenteven more critical both in the rural and urban sectors to generatenew employment and to stimulate the economy. Suchpressures may create urgency, but these processes, like thedynamics of liberal economic reforms, cannot be rushed.
These processes can never ever afford to ignore the corevalues of participatory development and Social Capital if weare to avoid the violent repercussions recently seen in India.Sustainable Development and inclusive growth reflect theprinciples of good governance (accountability, participation,predictability and transparency). All the stakeholders of
development projects should be able to exchange ideas andopinions on the basis of mutual trust and cooperation.
The puzzles and polemics of development tend to raise morequestions than provide customised answers. We have tounderstand that each problem has its own unique context andthat the solution needs to be located within the organiccomplexities and institutional realities of the problem itself. ASocia l Capita l approach has the potent ia l to resolvedisagreements and act as a platform to explore strategicsolutions.
The Discourse
The problematique of this paper is structured around thepolemic of c iv i l soc ie ta l ins t i tu t ions (networks andembeddedness) and democratic governance (inclusive growthand participatory development) among other critical areas ofsocial scientific research. This line of theoretical research isexpected to contr ibute new knowledge and faci l i tateinnovative research to better understand the interactions andinterplay between actors and their institutions.5
The politics of everyday life and human development aregenerally informed by the dynamics of choice and the strategiesof cooperation. This tension can be somewhat resolved byadopting the Corporate Social Responsibility approach, asinclusive growth can more often than not be ensured byempowered choices and delegated actions.
This highlights the importance of Corporate Social Responsibilityin all our grand as well as small narratives today in a worldwhere economic signifiers and their signified meanings aremore or less in a state of constant flux provoked by themarketplace of politics and the social as well as cultural rhetoricof glocalization.
It may appear to be rather far-fetched to deploy a highlyspecialized social scientific theoretical category like CorporateSocial Responsibility in the area of Business Management andIndustrial Relations. The latter is a network of relationships thatenter into professional dynamics with one another in the highlycharged world of business informed by factors such as theprofit motive, ethical applications, conflict resolution and asense of accountability vis-à-vis the environment, sustainabledevelopment and inclusive growth.
SCMS Journal of Indian Management , April - June, 2010. 58
A Quarterly Journal
So innovative ideas supported by creative images are requiredto streamline Industrial Relations in the post-globalized scenariothat predicates upon both a breakdown of barriers as well asestablishment of new and difficult barriers in the cyber worldof netizens, their perceived expectations and their ever-increas ing sense of ach ievements and complex ro leperformances.
So we have to understand the problematique of the increasinghiatus between business managers and their employees in thecontext of relative deprivation that may be either incrementalor else decremental in nature. The critical ploy that has to bestrategized in this connection is the network of inter-dependence that depends upon the fluctuating degrees oftrust and cooperation and overall organizational health of anygiven industry.
A perspective analysis of the dynamics of trust in any businessorganization happens to be a most problematic exercise thathas to be carried out over a period of time and that involvesmultiple stakeholders as well. Why should one trust his / herpeers, superiors and subordinates? Is trust a construct ofculture specifics? Can trust be equated with the given socio-politico-economic realities of any spatio-temporal context?Can trust be learnt or emulated? Can trust be analyzed in termsof cost-benefit calculations?
These are rather disquieting questions with no unilinearanswers. Business leaders have to realize that the pedagogicof trust and resilience of professional relationships can onlybe tested against either hypothetical or real life situations wherethe actual motivations, aspirations, perceptions, preferencesand culture root paradigms of individuals or groups areexplicitly exposed in the given context of their informed self-interest.
Trust happens to be a matter of choices that is not altogetherdifferent from the various other choices we make during thecourse of an ordinary day. But choices are also inspired andconditioned by values that are established standards of socialinteractions and constantly re-learnt during the l i fe oforganizat ions and the professionals who sustain suchorganizations.6
But trust is also a societal resource that is limited by its verynature, as individuals more often than not put their own self-
interest f irst rather than the interest of their respective
organizations. The core challenge is to translate these small
narratives of power into a grand narrative of preference that
would ultimately facilitate a transition of business culture of
given organizations.
So the game that is to be played by the different parties
concerned would be to transcend the actors and institutionsmodel to the actors in institutions prototype. This would be a
game that requires a multiplicity of stakeholders and a plethora
of their interests that would finally be integrated in an
overarching design of motivations, aspirations and role
performance.
When disjointed players start to commence upon the game
upon a somewhat level play field then emerges the ever-critical
issues of entitlements and capabilities. Each and every player
has got entitlements to improve upon his / her own material
conditions of life, status of empowerment, value systems and
catalyze the politics of everyday life. These entitlements have
then to be qualitatively upgraded to the level of capabilities.
So from professionals to stakeholders is a long journey of
accomplishments that would institutionalize a culture of trust
and cooperation in organizations for the mutual benefit of all
the concerned stakeholders.
Trust and cooperation happen to be dynamic aspects of human
behaviour that are both acquired as well as achieved during
the course of everyday interactive exercises. One has to
appreciate that trust as an interface is perhaps more potentially
real and tangible rather than trust as a construct, as the former
is an arrangement of convenience, connivance and knowledge
while the former is a living entity that comes across our daily
social interactions as a concept that works in real time. In
essence, therefore, reciprocation sustains trust while trust
facilitates cooperation.
Why should one cooperate with another? Is it a learnt reflex or
is it based on enlightened self-knowledge and self-interest?
Would cooperation lead to intense creativity, new images,
different ideas and better emotional and stress management?
These questions and their answers have to be delved into and
dwelled upon before we even try to garner an entire array of
new knowledge on this subject.

SCMS Journal of Indian Management , Apr i l - June, 2010. 59
A Quarterly Journal
Relationships can be built upon cooperation, competitionand conflict. Each such mode will explore new models ofinterface and would finally lead to an inchoate world of newpossibilities where men and women in the industry wouldsteadily learn how best to unlearn past lessons and deschoolthemselves from the cultural baggage handed down thegenerations.
For one lesson is almost clear at this juncture of empirical findingsi.e. actors will only cooperate if there are elements ofconfidence and potentialities of profit to be found in suchbilateral or even multi-modal discourses. The architecture ofsocial knowledge that fosters industrial relations and themicrophysics of power that acts as a conducive ensemble inthe background of labour welfare are, after all, situation-drivenand culture-specific realities that need to be continuously re-examined against the context of changing polit ics andeconomics of the body social.
But what about the body corporate as a whole? This is anentity that can neither be enticed nor be allured into rashdecisions and myopic strategies. If cost-cutting is the order ofthe day and free rider expenditures are on their way out, thenit is also the duty of business managers to adequately sensitizetheir industrial work forces and integrate them in a culture ofconsensus without which the entire complicated domain oftrust management would be severely disempowered.
From the management of human values to the management ofcorporate trust is a long, arduous and unenviable journey thatrequires out of the box thinking matched with the capacity torelate to the empathy of individuals. So rapport-building wouldappear to be a crucial requirement in this context of trustmanagement when business leaders should be able toovercome the tedium of Human Resource Development overkillin order to efficaciously enter into revolutionary dialogues withboth blue as well as white collar workers to make them chantthe mantra of their respective organizations underpinned bytheir rational choices.7
It is somewhat difficult to estimate the rationality of a choiceuntil the outcome of that choice is perceived either inmaterial or else in psychological terms. Exactly how rationala choice is would have to be decided subsequently whenthe question how utilitarian that choice was would emergein the future.
The issue of Industrial Relations is all about the management ofchoices in the workplace. Why should workers obey themanagement? What are the concerns of the management thatare reflected in its style of leadership? Is loyalty related tomotivation? Or is loyalty a function of the chain of command?What are the effective outputs of hierarchy?
The management and the workers have to mutually entrenchan ethos of cooperation that would both create and sustainthe values of Ownership/Trusteeship in their given organizations.One has to belong to and long for one’s organization simplybecause organizations are the institutions of collectivebehaviour where people associate and interact to pursuecertain set goals. The very fact that these targets have to beachieved and new targets innovated point to the fact that theorganizational health of any given industry is sound. The pointof saturation has to be ably and creatively transformed into anarena of new possibilities that lead to new challenges andinnovative gestures.
But achievement of targets is critically dependent on teamperformance, and so the team players have to share differentdegrees of responsibilities and have to be burdened withdifferent measures of fai lures and successes. The mostimportant consideration at this point is to determine who canshoulder what amount of burden. So the question ofauthoritative allocation of values has also to be pondered uponactively by the management concerned.
The issue of Ownership / Trusteeship is also almost organicallyrelated to the issue of institutions. Each business organization,in sociological terms, is an institution replete with a history ofevolution, work culture, Trade Union ethics and typicalmanagement practices. So the study of business organizationsas dynamic institutions of power, authority, repression,obedience, reward and punishment may lead to an ulteriorunderstanding of Industrial Relations.8
Actors and their interventions become criticalities that have tobe objectively factored into the discourse of polemics thatcenter on issues / concerns of Industrial Relations. The credoof loyalty is also another ponderable that may be studied orelse addressed in order to appreciate the different dynamicsof Corporate Social Responsibility, Rational Choice and ValueManagement.

SCMS Journal of Indian Management , April - June, 2010. 60
A Quarterly Journal
Environmental Ethics
The present paper lays emphasis on several theoretical andempirical aspects of environmental politics, CSR and Socialcapital so that the critical dependencies between human andphysical environmental settings are suitably focused anddiscoursed in the process. The social issues and concerns ofenvironment have become more prominent and relevantespecially since the Second World War, when the impact ofweapons of mass destruction and nuclear holocaust made uspainful ly aware about the polit ics and economics andsociology of environment.
The alternative to sustainable environmental developmentat the beginning of the new mi l lennium appears to bemutual ly assured destruct ion. So new discipl ines suchas human and polit ical ecology have developed in orderto interrogate the pol i t ics of development that is moreo f t en t h an no t i n t e rp l a y be tween t he cho i ce s o fp o l i c y m a k e r s a n d v o i c e s o f s t a k e h o l d e r s c a u g h tdesperately between the currents of so-cal led humanprogress.
Sustainable environmentalism is a critical concern of the newmillennium at the policy and praxes levels, as this issuepredicates new and exciting disciplines such as politicalecology, environmental ethics, human ecology, eco-feminism,environmental law, moral ecosophy and development ethics.Sustainable environmental development has of late emergedas a serious problematique that requires to be negotiated interms of workable strategies. Environmental Management Plansgenerally constitute the formulation of quantifiable benchmarkssupported by Monitoring and Evaluation exercises to assessthe benefits accruing from implementation of EMPs. Monitoringis the scientific collation and compilation of primary as well assecondary data to gain insights into the process, project andprogress indicators while Evaluation is the systematic analysisof environmental projects, including aspects like design,implementation and results.
Eva luat ion leads to increas ing ly in formed decis ions ,al lowing those involved in this process to learn fromexperience and to be accountable to the dynamics of theproject. Monitoring and Evaluation should be uti l ized toestablish accountabil ity and understand the dynamics ofenvironmental projects.
Information, Education and Communication strategies involvedifferent concerns of environmentalism related to awareness-generation, advocacy/activism and sensitization that are attunedto culture and gender specifics. In order to scientificallyimplement project-related tasks it is rather imperative to developa time-frame of IEC activit ies to be carried out duringenvironmental project cycles. Any given Environmental ActionPlan must elaborate and schedule the tasks to be undertakenin accordance with the aims and objectives of IEC as mandatedby the scope of different environmental projects.
Benefit Monitoring and Evaluation (BME) of environmentalprojects in terms of new physical resources created is anexercise related to measurement of technical interventions anddesigns at the levels of planning and implementation. It isimpor tant to unders tand that Impact Assessment ofenvironmental projects should also include the ethos and bestpractices of participatory development.
Par ticipatory environmentalism can be sustained by a basketof methodological tools such as Focus Group Discussions,Gender Interviews, Community Meetings, Logical FrameworkAnalyses and Risks Assessment. Resource Mapping, forinstance, is an imperative requirement for Joint ForestManagement and Natural Resource Management initiatives.Needs assessment of physical resources as perceived bythe community must be based on such par t ic ipator ymethods. This is especially true in the case of rainwaterharvesting and arsenic-free drinking water projects. Micro-planning at the grassroots should inform the choices andvoices of the concerned stakeholders. It remains a fact thatsustainable environmental management is nearly alwaysintrinsic to local-level realities. So it is critical to be attunedto the local for environmental movements to succeed at theglobal level.
Env i ronmenta l management i nd ica to rs can be bothquantitative and qualitative in nature in order to providepr imary inputs to monitor di f ferent projects evaluateprogress o f p ro jec t imp lementa t ion and gu ide thestakeholders to sustain the benefits of the projects. Suchindicators may also evaluate the impacts of the projectson the quality of l ife of the stakeholders before and afterimplementation and also examine the increased level ofcommunity par ticipation and awareness-generation vis-à-vis project interventions.

SCMS Journal of Indian Management , Apr i l - June, 2010. 61
A Quarterly Journal
Under different Initial Environmental Examination scenarios theState of Environment may be studied in the context of varyingPressure State Response Models. Environmental Action Plansmust also lay down strategies for both qualitative andquantitative methods in order to freeze the ground realitiesand design physical interventions under different environmentalprojects. Such interventions should generally be participatoryi.e. underpinned by the Stakeholders’ Consultative Process(SCP). SCP is central to the methodology of environmentalprojects. SCP moves away from the conventional top-downapproaches that involve measurement of project performanceagainst pre-set indicators by using standardized proceduresand tools. The new strategy of participatory development laysits primary emphasis on Public Information and Consultationendeavours.
Environmental projects underpinned by the rationale ofpar ticipatory development should define statements ofmeasurable objectives in terms of physical interventions, designa structured set of indicators covering outputs and likelyenvironmental impacts and include provisions for data analysesand periodic reporting to the project stakeholders.
Process indicators are benchmarks that are concerned withthe dynamics of environmental change i.e. how change is tobe effected at the grassroots, how the process of change isto be managed with the help of external interventions andinternal facilitation, how best change can be reconciled withconventions?
Environmental projects cannot always follow predeterminedapproaches. Best practices of environmentalism more oftenthan not emerge from chaos but subsequently lead to cohesionby resolving the tension between priorities and utilities. BMEindicators may be designed keeping in view the fact thatenvironmental projects aim to facilitate need-based awareness-generation programmes.
Participatory environmentalism can be defined as an interactiveprocess dur ing the passage of which the concernedstakeholders gain access to the decision-making process eitherdirectly or via institutionalized representation. This helps toidentify the needs and perceptions of primary stakeholders,sustains civic amenities after withdrawal of implementingagencies, monitors progress of physical works, streamlinescommunity-level institutional mechanisms and develops
ownership among community members vis-à-vis collectiveassets and Common Property Resources.
Environmental participatory strategies operate at two levels:[1] the communitarian level where the community is broughtback into environmental focus in order to build and sustain aproprietary sense among primary stakeholders and [2] the neo-institutional level where “actors and institutions” are transformedinto “actors in institutions” i.e. end-users of environmentalresources are mobilized suitably to identify their communityagenda with environmental interests.
These are strategic measures utilitarian tools to motivate thecommunity to become proactive and safeguard collectiveconcerns at the level of the environment. Environmentalawareness programmes serve to bui ld empathy at thecommunity-level and facilitate dialogic rather than pedagogicterms of discourse at the project implementation, monitoringand evaluation levels.
Community Mobilization and Participation (CMP) activities arenot an end but a means to secure rapport-building that mayensure acceptance of environmental initiatives. Environmentalinterventions must be scientifically implemented and informedby a definitive plan of action. This is despite the fact thatenvironmental monitoring and management generally emergefrom flux and can seldom be planned in a structured manner.
Environmental problems may be identified and cause-effectrelationships determined in this process. This may also help toidentify benchmarks of solution impacts (facilities proposedto be provided under environmental projects). The problemsidentified should be converted into need-based statements.This exercise requires discussion and prior i t izat ion ofenvironmental needs. The achievements of environmentalprojects generally depend on how project beneficiaries reactto the resources created or sustained by the project initiatives.
For participatory approaches to Monitoring and Evaluation(M&E) to be effective, these need to be integrated withenvironmental projects and adopted on a continuous basis.These results can be utilized to re-strategize the key issuesand generate new questions during subsequent M&E.Environmental projects may simultaneously develop newactivities and encounter new problems that which may affectthe stakeholders’ perceptions of project-related activities.

SCMS Journal of Indian Management , April - June, 2010. 62
A Quarterly Journal
Communities may also experience changes from other sourcesthat may have an impact on the progress of environmentalprojects.
Environmental Impact Assessment (EIA) serves as a benchmarkagainst which project progress in terms of environmentalinterventions may be quantified. Such periodic exercisesprovide insights on the part of primary as well as secondarystakeholders in the sense that strategies may be revised, goalsredefined and praxes reformulated in the light of field-levellessons learnt during implementation of project objectives.Such a critical and heuristic manner of learning from pastmistakes and making necessary amendments during the projectcycle to aim at moving targets more often than not inform EIAstud ies tha t focus on the core i ssues of sus ta inedenvironmentalism.
Environmental development is more often than not value-specific i.e. progress indicates changes at the level of valuesystems, broad-based worldviews, evolution of new managingagencies at the level of the mode of production and dynamicinterfaces cohered among the stakeholders who happen tomanage environmental affairs and the agenda of institutionalizedjoint participation mechanisms.
Environmental management so emerges as a continuousexercise that should be able to reconcile contending roledefinitions between stakeholders and beneficiaries as well asresolve the tension of priorities between the notions ofsustainability and environmental best practices. This paper hastried to conceptualize the lessons learnt and identify the goodpractices of sustainable environmentalism and CSR so that futureroadmaps for action research, advocacy and activism can besuitably cohered in the process.
A range of notions underpinned by contemporary models ofanalyses has been examined from plural socio-economic aswell as politico-cultural backgrounds that adequately reflectthe state of environment and assess the quality of man-madeand natural resources in the context of sustainable systemsand multicultural societies. An understanding that repeatedlycomes across during the perusal of the different schools ofthought is the notion that social and physical environmentsimpact upon one another and share an entire array ofsymbioses that have to be continuously investigated in orderto explore indigenous solutions and establish convergence
for the sake of ecological equi l ibrium and sustainablecommunity development suppor ted by CSR and SocialCapital.9
Environment has both physical and human aspects, and thelatter more often than not influence the former in terms ofmultiple strategies and image-building exercise. Environment -like any other limited resource in human society - has steadilyemerged since the Industrial Revolution as an issue that assumesownership of all the concerned stakeholders and - as anunfortunate result - is really nobody’s ethical responsibility.
So the North can afford to pollute mindlessly and then holdthe South responsible for this sorry state of results while it is afact that the patterns of consumption, industrialization andurbanization (development?) in the rich countries add moreviciously to environmental degradation, global warming andclimate change than elsewhere in the world. Not for nothinghave we heard the doomsday conspiracy that the Third WorldWar would soon be fought on the issue of drinking water.
Moral Ecosophy has to be conscientiously practised if we areto save Planet Earth from the apparently irreconcilable axes ofpower that have fractured the Global Economic Order andexposed the pretensions of the so-cal led process ofGlobalization that has only further deepened divides acrossour International Moral Order. But this is perhaps a nobleaspiration without any conformation from our everyday politicsof life and endangered realities.
Corporate Citizenship
The problemat ique of corporate ci t izenship is rathercomplicated, as it entails different types of choices in differentspace, time, culture, knowledge and power discourses. Thechoices before corporates may not always be uniform, andmay be influenced by considerations like a global economicmeltdown, local political tension, national emergency, socialproblems, regional discrepancies in development, badeconomy of scale, retrenchment, cost-cutting etc.
But the critical central issue still remains the anatomy of choice:why do corporates ordinarily behave in one manner whileconforming to the basic tenets of corporate citizenship andwhy do they tend to behave otherwise under duress andespecially during adverse market situations? This in itself

SCMS Journal of Indian Management , Apr i l - June, 2010. 63
A Quarterly Journal
constitutes an interesting universe of research where variousfactors such as values, bel iefs, att i tudes, incl inat ions,orientations, opinions etc come into play in the wider area ofchoice influenced by an inchoate regime of deterministic /indeterministic chaos. The question of moral values andbusiness values may occasionally come across as a dichotomy,especial ly when the role of corporate values such ascompetit ion, optimization (profiteering?) and loyalty isconcerned. The recent economic recession worldwide hasprompted Big Business worldwide to retrench, cut costs,economize on operations, production, marketing and otherstrategic areas of their daily activities. But there also have beeninstances in India where probationers given the pink slip wereagain brought back home, so to say.
This is perhaps a truly Indian phenomenon that has been alsosomewhat motivated by external political pressures. But thisevent is not to be identified with the somewhat out-of-vogueconcept of Asian Values. The issue of corporate citizenship assustained (hypothetically) by the arrangement of trust andcooperation in business is also perhaps a function of traditional(Indian) family values that happen to rely much more on loyaltyand feudal ascriptions rather than the rational-legal structure oflegitimacy and authority.
Culture is what we use while civilization is what we are. If weare to understand conflicts, stress and negotiations in businessin a somewhat new light then we also have to appreciate therole of corporate citizenship in the politics of everyday life oforganizations where individuals engage themselves in pursuingdifferent forms of economic activities. Culture as capital cancontribute effectively to the body corporate by defining thevarious role performances of the multiple stakeholdersconcerned in industry. Both the management and the workerscan experiment successfully with different types of culturalmodes relevant to their industry.10
Senior business leaders in India occasionally make it a point toorganize brainstorming sessions where even junior managers,worker representatives and Trade Union leaders can voice theirown ideas about better productivity, new R&D, innovativemarketing, revolutionary designs and improved economy ofscale.
So it appears that both choices and voices have to beentrenched in the domain of better business sense boosted
by motivation, inspiration, trust and cooperation. The morebroad-based this industrial dialogue happens to be, the betterwould be the chances to experiment in a more creative mannerwith the changes that lead to overall better management ofcorporate citizenship.
Organizational change can be perceived as an inherentcorporate resource that can be ut i l ized by di f ferentstakeholders to add value to their concerned industries. It isnot always quite easy to address change in organizations, asmultiple players find it more often than not difficult to copewi th t rans format ions and t rans i t ions . Organ izat iona ldevelopment, evolution and health depend upon targetingmoving goals that are continuously in a state of flux. But howcan we use change as an organizational resource? Changescan take place in terms of qualities of output, levels ofproduct ion , modern iz ing technolog ies , innovat ivemethodologies, deschooled pedagogics and radically differentmarketing strategies. Such changes vis-à-vis organizations caneven be studied in the context of the Guest-Host discoursewhere changes are not perceived as ghosts of spatio-temporalrealities but rather as guests in the context of host organizations.
So change can also be sustained as a resource in the contextof organizational change and corporate citizenship. Wheneverchanges occur, there are sweeping as well as drastic effectson the levels of motivation, business strategies, styles ofleadership performance, marketing techniques, economies ofscale, interpersonal relationships, priority areas and preferentialvalues. It is imperative that this phenomenon of change shouldbe managed by professionals to yield better results and addenhanced value to the concerned organizations.
The management of change is a critical discourse. It takes placeat the levels of perception, motivation, attitude and leadership.How best to motivate both the management and the workersto coordinate business activities under a different regime ofchange is often a fascinating study that can lead to excitingnew insights related to the organic realities of organizations.11
How people try to cope with stress and strain, conquer theiranxieties and worries, battle with their learnt values againstnew values and finally emerge as either winners or else losersis a crucial exercise that impinges upon the working ofprocesses, products and arrangement of realities both withinand outside organizations.

SCMS Journal of Indian Management , April - June, 2010. 64
A Quarterly Journal
Corporate citizenship is basically a function of strategizedcultures pitted against fractured realities. The ways in whichthe owners, managers and workers perceive reality / realitiesmay be radically different from one another. Their perceptionsare conditioned by their Culture Root Paradigms that constitutethe overarching rhetoric of change of their organizations.Change can both create and destroy.
So corporate c i t izensh ip as a dynamic of Bus inessOrganizations can also serve as a metaphor of change againstthe overall backdrop of ethical applications in business. Howobjectively to wield any given technology, how to cohere andconjoin angularities in attitudes, how to add to the existingstock of Social Capital by sustaining working relationships inbusiness etc can arguably constitute the first steps towardsbuilding what social scientists and field practitioners engagedin the Development Sector tend to address as Multi-StakeholderDialogues.
Such a dialogic mode of interaction involving multiple actors(and their roles) as well as different stakeholders (with theirown typical interest/s in the organization concerned) is notalways easy to institutionalize as a new credo of organizationalreality. Tripartite talks between the Government, Managementand Labour may be cited here as a rudimentary example ofsuch multi-level, multi-faceted and multi-functional dialogues.But Labour Laws and social welfare legislation apart, thesedialogues are essential to understand in consensus the aims,aspirations and both long- and short-term business strategiesof organizations.
One of the basic objectives of multi-sectoral stakeholderdialogues is to move away from the merely welfarist, altruisticand pluralistic orientations of organizations to a given mode ofcorporate citizenship that has to be learnt, lived with andassiduously practised in order to transcend everyday realitiesto an aura of a changed way of business life. Post-postmodernsocieties have to desperately try and learn the post-globalmanner of existence where almost nothing is permanent, so tosay. Markets change and cl ientele change while entireeconomies go through phases of radicalization that tend toimpar t new meanings to business strategies and ethicalapplications.
So the entire gamut of signifiers and signifieds also changeand cater to further transitions in business organizations stylized
and dictated by the polyphony of voices. These voices aresupported by choices of change, regime of discourse andstrategies of organizational development. The plethora of voicesis an indicator of change in terms of both process and progress,although these are rather value-loaded expressions. So themore vibrant dialogues become the more adequate is theirscope to include. Because if modern business today happensto stress increasingly upon Sustainable Development andInclusive Growth, then it also becomes a necessary commitmentto emphasize more on the broad-based nature of quality andmultiple dialogues that encompass the small narratives of powerand authority and corporate citizenship.
So it would appear that good or bad business sense impingesmore upon the multiplicity of dialogues rather than decisionstaken in isolation. So the analyses with regard to processesand progress necessarily indicate whether business decisionsand / or solutions would be sustainable in the long or shortrun. An examination of perspective is important to both assessand understand the criticality of business sense in the contextof improved Industrial Relations. So how does one ensurebetter relations in business while at the same moment trying tomake higher profits?
This decision can only be made after a Knowledge AttitudePerception study is undertaken to evaluate the comparativebenefits / estimates between better business relations andhigher profits. Ethical applications in business activities shouldalso be actively considered in this context of corporatecitizenship.
The combination of business sense with ethical sense is autilitarian, altruistic as well profiteering strategy that is difficultto follow conscientiously in the real world. Individuals are notalways driven by ethical aspirations. It is a given fact of life thatwe generally follow the predatory instincts of our personalprofit motives. The challenge is to inculcate the best possiblefit between profits and ethics, immediate gains and strategicalliances, present temptations and future goodwill. A modicumof balance has to be struck in this context so that the differenttypes of extraneous and internal variables that tend to influencesuch a process of decision / policy-making can be balancedin an almost rational manner.
Our ethical selves may not always be our instinctive beings. Itis a metaphysical question of existence versus sustenance,

SCMS Journal of Indian Management , Apr i l - June, 2010. 65
A Quarterly Journal
learnt values versus inherent proclivities and cost-benefitanalyses between the self-satisfying self and the socialsatisfying other. When such conflicts between the othernessof the other and the openness of the self tend to be reconciledin the context of specific industry and general society, thenthe other uncomfor table questions regarding globalizeddichotomies, the Digital Divide and the inchoateness of theself versus the nascent sense of otherness emerge.
Conclusion
So finally we are led to the direction of the sociability of businessi.e. how social is business and how widespread and traumatic/ therapeutic are the remedial effects of value applications toany given industry. Are workers now being consulted, are theirpriorities and preferences being listened to, are they moreconfident in the management, bolstered by the thought thatretrenchment and lay-off would not be enforced until absolutelyimperative?
Power plays become operational at this juncture of corporatecitizenship when not only the social and cultural aspects ofbusiness but also the political and economic facets of theindustry have to be accounted for to study the art of resolutionof conflicts at the workplace. Conflicts of interest that arisefrom clash of values, attitudes, perceptions, orientations andvalues are occasionally constructs of different cultures. Themanner in which actors engage in conflicts and lock hornswith each other over issues of preferences and priorities oftenemerge from skewed realities where the concerned partiesare located at different levels and on different levels of culturalensemble and trappings of power.
Because conflicts primarily begin at the level of knowledgewhere the mind is constantly busy weighing different options.The manner in which individuals approach conflicts is alsorather culture specific. The issue of corporate citizenship canbe better understood if the fragmented concerns of conflictare better appreciated. Conflicts at the higher echelons ofpower are more about abstract / intangible realities such aspower, authority, prestige, esteem, influence and access tothe repository of high-end corporate values.
The more intricate and intrinsic happens to be the question ofcorporate citizenship, the more complicated becomes theentire debate of Social Capital. Because the specifics of trust,
value and cooperation predicated by the realities of corporatenetwork ing and socia l embeddedness are inherent lyhighlighted in the context of better performance, enhancedinteractions and complex commitments of the industry to themarket, clientele, quality, pricing and corporate citizenship.
Keywords : : : : : E th ica l Bus iness , Respons ib le Bus inessApplications, Par ticipatory Development, Inclusive Growth,Sustainability, Civil Society, Social Capital, Choices.
Footnotes:
1. The author wishes to thank Bert-Ola Bergstrand and Per-Eric Ullberg-Ornell of the Dynamic Growth Capital projectfor their initial ideas about this paper that was originallyconceived during panel discussions and special lecturesat the 2009 Sweden Conference on Urban Policies andSocial Capital in Lidköping. The usual disclaimer applies.
2. See, Gilber t Jr., D.R . “Corporate strategy and ethics.”Journal of Business Ethics. Vol.5, No.2, (1986): 137-150,in this connection. See also Gray, R., Bebbington, J. andCollison, D. “NGOs, Civil Society and Accountability:Making the people accountable to capital.” Accounting,Audit ing and Accountabil i ty Journal . Vol.19, No.3,(2006): 319-348.
3. Cf. Harmon, J. “Introducing John Rawls: A review of TheCambridge Companion to Rawls.” Philosophy and SocialCriticism, Vol.30, No.5-6, (2004): 643-663; and Hill R.P.“Do the Poor deserve less than surfers? An essay on thespecial issue on Vulnerable Consumers.” Journal ofMacromarketing. Vol.25, No.2, (2005): 215-218.
4. See Manor, James (1996). “Recent Trends in the Studyof State-Society Relations” Mette Halskov Hansen andAr i ld Enge lsen Ruud (eds) , Weak? St rong? C iv i l ?Embedded? New Perspect ives on Sta te-Soc ie tyRelations in the Non-Western World. Oslo: Centre forDevelopment and the Environment, University of Oslo;March, James G. and Johan P. Olsen (1995). DemocraticGovernance. New York / London: The Free Press; Marjit,Sugata et al (May 1999). “Harassment, Corruption andEconomic Pol icy.” Munich: CES i fo Work ing PaperNo.189, in this context.

SCMS Journal of Indian Management , April - June, 2010. 66
A Quarterly Journal
5. Cf. Putnam, Robert, D. et al (1993). Making DemocracyWork: Civic Traditions in Modern Italy. Princeton, NewJersey: Princeton University Press; and Scholte, Jan Aart(1996). “Beyond the Buzzword: Towards a Critical Theoryof Globalization.” Elenore Kofman and Gillian Youngs (eds).Globalization: Theory and Practice. London: Pinter.
6. See Loury, Glenn (1987). “Why Should We Care aboutGroup Inequality?” Social Philosophy and Policy (5); Waters,Malcolm (1995). Globalization. London / New York:Routledge; Bourdieu, P. (1986), “The forms of capital.” inJ.G. Richardson (ed.) Handbook of Theory and Researchfor the Sociology of Education, New York, Westport, CTand London: Greenwood Press, 241–58, in this regard.
7. Cf. Burt, R.S. (2000). “The Network Structure of SocialCapital.” Research in Organisational Behaviour, Vol 22, 1-83; Chloupkova, J., G.L.H. Svendsen and G.T. Svendsen(2003), ‘Building and destroying social capital: The caseof cooperative movements in Denmark and Poland’,Agriculture and Human Values, 20 (3), 241-252; andColeman, J.S. (1984) “Introducing social structure intoeconomic analysis.” The American Economic Review. 74(2), 84-88.
8. See Coleman, J.S. (1988a), “Social Capital in the Creationof Human Capital.” American Journal of Sociology. 94,95–121; Coleman, J.S. (1988b), “The Creation andDestruction of Social Capital: Implications for the Law.”Journal of Law. Ethics and Public Policy, 3, 375–404; andColeman, J.S. (1990), Foundations of Social Theory,Cambridge, MA: Harvard University Press, in this context.
9. Cf. Toenjes, R. H. (2002), “Why be moral in business? ARawlsian approach to moral motivation.” Business Ethics
Quar terly. Vol.12, No.1, 57-72; Craig Calhoun (ed),Habermas and the Public Sphere. Columbia: ColumbiaUniversity Press; and Helleiner, Eric (1994). “From BrettonWoods to Global Finance: A World Turned Upside Down.”R ichard Stubbs and G.R. Underhi l l (eds), Pol i t ica lEconomy and the Changing Global Order. London:Macmillan.
10. See Hill, R .P., Felice, W.F. and Ainscough, T. (2007),“International human rights and consumer quality of life:An ethical perspective.” Journal of Macromarketing.Vol .27, No.4, 370-379; Hsieh, N-H. (2004), “TheObligations of Transnational Corporations: RawlsianJustice and the Duty of Assistance.” Business EthicsQuar terly. Vol.14, No.4, 643-661; and Jackson, K. T.(1993), “Global distributive justice and the corporateduty to aid.” Journal of Business Ethics. Vol.12, No.7,547-551, in this connection.
11. Cf. Lehman, G. (2001), “Reclaiming the public sphere:Problems and prospects for corporate social andenvironmental accounting.” Crit ical Perspectives onAccounting. Vol.12, No.6, 713-733; McClintock, B. (1999),“The mult inat ional corporat ion and socia l just ice:Experiments in supranational governance.” Review ofSocial Economy. Vol.57, No.4, 507-522; and Moriar ty, J.(2005), “On the Relevance of Political Philosophy toBusiness Ethics.” Business Ethics Quarterly.Vol.15, No.3,455-473.
12. See Preston, P.W. (1996), Development Theory: AnIntroduction. Blackwell Publishing, Cambridge, MA; Spivak,G.C. (1988), “Can the subaltern speak?” Nelson, C. andGrossberg, L. (Eds.), Marxism and the Interpretation ofCulture. University of Illinois Press, Urbana, IL, 271-313;and Huntington, Samuel P. (1968). Political Order inChanging Societies. New Haven / London: Yale UniversityPress, in this regard.

SCMS Journal of Indian Management , Apr i l - June, 2010. 67
A Quarterly Journal
A c o n s u m e r ' s d e c i s i o n d e p e n d s o n t h e i n t e r p l a y o f m a n yf o r c e s o r s t i m u l i . P r o d u c t o f f e r i n g t h r o u g h s o m e p r o m o t i o n a lm e t h o d s i s t h e i n i t i a l s t i m u l i . T h e m a r k e t i n g a n d e n v i r o n m e n t a ls t i m u l i e m e r g e f r o m c u l t u r a l , s o c i a l , p e r s o n a l a n d
p s y c h o l o g i c a l f a c t o r s . T h e c u s t o m e r s j u d g e t h e d e a l s i n s e v e r a l w a y s . T h e r e p u t a t i o n a n dt e c h n i c a l e x p e r t i s e o f t h e m a n u f a c t u r e r, t h e q u a l i t y o f s e r v i c e a n d t e c h n i c a l a d v a n c e m e n t o ft h e s e r v i c e p r o v i d e r f o r m t h e c r i t e r i a t o e v a l u a t e t h e m a n u f a c t u r e r s a n d t h e d e a l e r s . T h i ss t u d y , i n t h e f o r m o f S W O T a n a l y s e s p e r f o r m e d t h r o u g h F r i e d m a n ' s t e s t , c o v e r s t h e c o n s u m e r s 'g e n e r a l o p i n i o n t o w a r d s t h e p a s s e n g e r c a r s a n d a l s o p r o v i d e s u s e f u l i n f o r m a t i o n t o t h e g e n e r a lp u b l i c , c a r o w n e r s , d e a l e r s a n d c a r m a n u f a c t u r i n g c o m p a n i e s i n m a n y w a y s .
I
Consumer StimuliAbstract
Car Industry:SWOT Analysis
Dharmaraj C., Sivasubramanian M. and Clement Sudhahar J.
123456789012345678901234567890121234567890123456789012345678901212345678901234567891234567890123456789012345678901212345678901234567890123456789012123456789012345678912345678901234567890123456789012123456789012345678901234567890121234567890123456789123456789012345678901234567890121234567890123456789012345678901212345678901234567891234567890123456789012345678901212345678901234567890123456789012123456789012345678912345678901234567890123456789012123456789012345678901234567890121234567890123456789123456789012345678901234567890121234567890123456789012345678901212345678901234567891234567890123456789012345678901212345678901234567890123456789012123456789012345678912345678901234567890123456789012123456789012345678901234567890121234567890123456789123456789012345678901234567890121234567890123456789012345678901212345678901234567891234567890123456789012345678901212345678901234567890123456789012123456789012345678912345678901234567890123456789012123456789012345678901234567890121234567890123456789123456789012345678901234567890121234567890123456789012345678901212345678901234567891234567890123456789012345678901212345678901234567890123456789012123456789012345678912345678901234567890123456789012123456789012345678901234567890121234567890123456789123456789012345678901234567890121234567890123456789012345678901212345678901234567891234567890123456789012345678901212345678901234567890123456789012123456789012345678912345678901234567890123456789012123456789012345678901234567890121234567890123456789123456789012345678901234567890121234567890123456789012345678901212345678901234567891234567890123456789012345678901212345678901234567890123456789012123456789012345678912345678901234567890123456789012123456789012345678901234567890121234567890123456789123456789012345678901234567890121234567890123456789012345678901212345678901234567891234567890123456789012345678901212345678901234567890123456789012123456789012345678912345678901234567890123456789012123456789012345678901234567890121234567890123456789123456789012345678901234567890121234567890123456789012345678901212345678901234567891234567890123456789012345678901212345678901234567890123456789012123456789012345678912345678901234567890123456789012123456789012345678901234567890121234567890123456789123456789012345678901234567890121234567890123456789012345678901212345678901234567891234567890123456789012345678901212345678901234567890123456789012123456789012345678912345678901234567890123456789012123456789012345678901234567890121234567890123456789123456789012345678901234567890121234567890123456789012345678901212345678901234567891234567890123456789012345678901212345678901234567890123456789012123456789012345678912345678901234567890123456789012123456789012345678901234567890121234567890123456789123456789012345678901234567890121234567890123456789012345678901212345678901234567891234567890123456789012345678901212345678901234567890123456789012123456789012345678912345678901234567890123456789012123456789012345678901234567890121234567890123456789123456789012345678901234567890121234567890123456789012345678901212345678901234567891234567890123456789012345678901212345678901234567890123456789012123456789012345678912345678901234567890123456789012123456789012345678901234567890121234567890123456789123456789012345678901234567890121234567890123456789012345678901212345678901234567891234567890123456789012345678901212345678901234567890123456789012123456789012345678912345678901234567890123456789012123456789012345678901234567890121234567890123456789123456789012345678901234567890121234567890123456789012345678901212345678901234567891234567890123456789012345678901212345678901234567890123456789012123456789012345678912345678901234567890123456789012123456789012345678901234567890121234567890123456789123456789012345678901234567890121234567890123456789012345678901212345678901234567891234567890123456789012345678901212345678901234567890123456789012123456789012345678912345678901234567890123456789012123456789012345678901234567890121234567890123456789123456789012345678901234567890121234567890123456789012345678901212345678901234567891234567890123456789012345678901212345678901234567890123456789012123456789012345678912345678901234567890123456789012123456789012345678901234567890121234567890123456789123456789012345678901234567890121234567890123456789012345678901212345678901234567891234567890123456789012345678901212345678901234567890123456789012123456789012345678912345678901234567890123456789012123456789012345678901234567890121234567890123456789123456789012345678901234567890121234567890123456789012345678901212345678901234567891234567890123456789012345678901212345678901234567890123456789012123456789012345678912345678901234567890123456789012123456789012345678901234567890121234567890123456789
M r. D h a r m a r a j C . , A s s i s t a n t P r o f e s s o r , S c h o o l o f M a n a g e m e n t ,K a r u n y a U n i v e r s i t y , C o i m b a t o r e - 6 4 1 1 1 4 , T a m i l n a d u , E - M a i l :D h a r m a r a j b u s i n e s s @ gm a i l . co m
D r . S i v a s u b r a m a n i a n M . , R e a d e r i n C o m m e r c e , G o v e r n m e n tA r t s C o l l e g e , C o i m b a t o r e - 6 4 1 0 1 8 , E . M a i l : D r m s i v a s u b r am a n i a n @ gm a i l . co m
D r . C l e m e n t S u d h a h a r J . , A s s o c i a t e P r o f e s s o r , S c h o o l o fM a n a g e m e n t , K a r u n y a U n i v e r s i t y , C o i m b a t o r e - 6 4 1 1 1 4 , Ta m i l n a d u ,E - M a i l : C l e m n s @ re d i f f m a i l . co m
n India, after independence, industrialization has pavedthe way for people to possess luxury i tems such astelevision, refrigerators, home appliances, cars, etc.
Motor–car is oneof the commonlyused conveyancesby the upper andm i d d l e - c l a s speople. Before twodecades , on l y afew indust r ia l i s t sand r ich peop leowned cars. Therewas a t ime whenone had to wait forweeks, months oreven years to buya car in India. Theopt ion of Ind iandrivers was limitedto a few models.Bu t , a f te r l ibera-
lization, the earning capacity of the middle-class peoplehas also increased. Now-a-days, motor car is not onlybought for social status, but as a necessary one. Taking into
the considerationof the above, manyautomobi le com-panies turned toAs i an coun t r i e s ,par t icu la r ly Ind iaand Ch i na . Theautomobi le indu-stry in India is theeleventh largest inthe world with anannual productionof approximate lytwo mil l ion units.India is expected toover take China asthe world’s fastestgrowing car marketi n t e rms o f t he

SCMS Journal of Indian Management , April - June, 2010. 68
A Quarterly Journal
number of units sold, and the automotive industry is one ofthe fastest growing manufacturing sectors in India. Becauseof its large market (India has a population of 1.1 billion; thesecond largest in the world), a low base of car ownership(12 per 1,000 people) and a surging economy, India hasbecome a huge attraction for car manufacturers around theworld. Until the early 1980s, in India owning a car wasconsidered to be a luxury possession. During those daysthere were only four producers of passenger cars, namely,Hindustan Motors (HM), Premier Automobiles Ltd. (PAL),and Standard Motors Private Ltd (SMPL), and Mahindra andMahindra (M and M) used to make utility vehicles (jeeps).Initially these producers had obtained licensed technologiesfrom the UK, Italy, and USA then each had a very small outputlevel. During that era car manufactur ing was l icensed,expansion was restricted; there were quantitative restrictions(QR) on impor ts.
Since the liberalization era, much water had flown throughand currently, though several major foreign automakers likeFord, GM and Honda have their manufacturing bases in India;Indian automobi le market is dominated by domest iccompanies. Maruti Suzuki is the largest passenger vehiclecompany and Tata Motors is the largest commercial vehiclecompany while Hero Honda is the largest motorcyclecompany i n I nd i a . O the r ma jo r I nd i an au tomob i l emanufacturers include Mahindra and Mahindra, AshokLeyland and Bajaj Auto. This study makes a maiden attempttoward evaluation of the maker of the cars and the serviceprovided by dealers in the customers’ perspective in orderto determine the factors that contribute to their perception.
Objectives of the Study
1. To s tudy the SWOT f ac to r s fo r ca r manu fac tu re r ;
2. To study the SWOT factors for service provided by thedealer;
3. To d e t e r m i n e t h e c o n t r i b u t i n g f a c t o r s t o w a r dperceptual ranking.
Method
The study was conducted from April, 2005 to April, 2008 inCoimbatore city of the State of Tamil Nadu, India. This studyis based on primary data. The primary data were collected
through Questionnaire from 712 respondents, using simplerandom technique.
Analytical Tool Used
Friedman’s non-parametric test is used for SWOT analysesto f ind the more inf luencing factors towards the carmanufacturers and service provided by the dealers todetermine the perceptual ranking. The Friedman test is anonparametric alternative to the repeated measures analysisof variance. It is equivalent of a one-sample repeatedmeasures design or a two-way analysis of variance with oneobservation per cell. Friedman tests the null hypothesis thatk related variables come from the same population. For eachcase, the k variables are ranked from 1 to k. The test statisticis based on these ranks. The Friedman test ranks the scoresin each row of the data file independently of every otherrow. Moreover the test statistic for the Friedman’s test is aChi-square with a-1 degrees of freedom, where a is thenumber of repeated measures. When the p-value for thistest is small (usually <0.05) we have evidence to reject thenull hypothesis.
This study covers the impor tant pre-purchase and post-purchase behaviour of the respondents relating to the carbuying decisions. SWOT Analysis is a strategic planningmethod used to evaluate the Strengths, Weaknesses,Opportunities, and Threats involved in a project or in abusiness venture. It involves specifying the objective of thebusiness venture or project and identifying the internal andexternal factors that are favourable and unfavourable toachieving that objective.
Strategic Uses of SWOT
SWOT analysis may be incorporated into the strategicplanning model, that is to find and evaluate the attributes ofthe person or company that are helpful / harmful / externalconditions that are helpful / external conditions which coulddo damage to the business’s performance to achieving theobjective.
The SWOT analysis is often used in academia to highlightand identify strengths, weaknesses, oppor tunit ies andthreats. It is par ticularly helpful in identifying areas fordevelopment. SWOTs are used as inputs to the creativegeneration of possible strategies, by asking and answeringeach of the following four questions, many times:
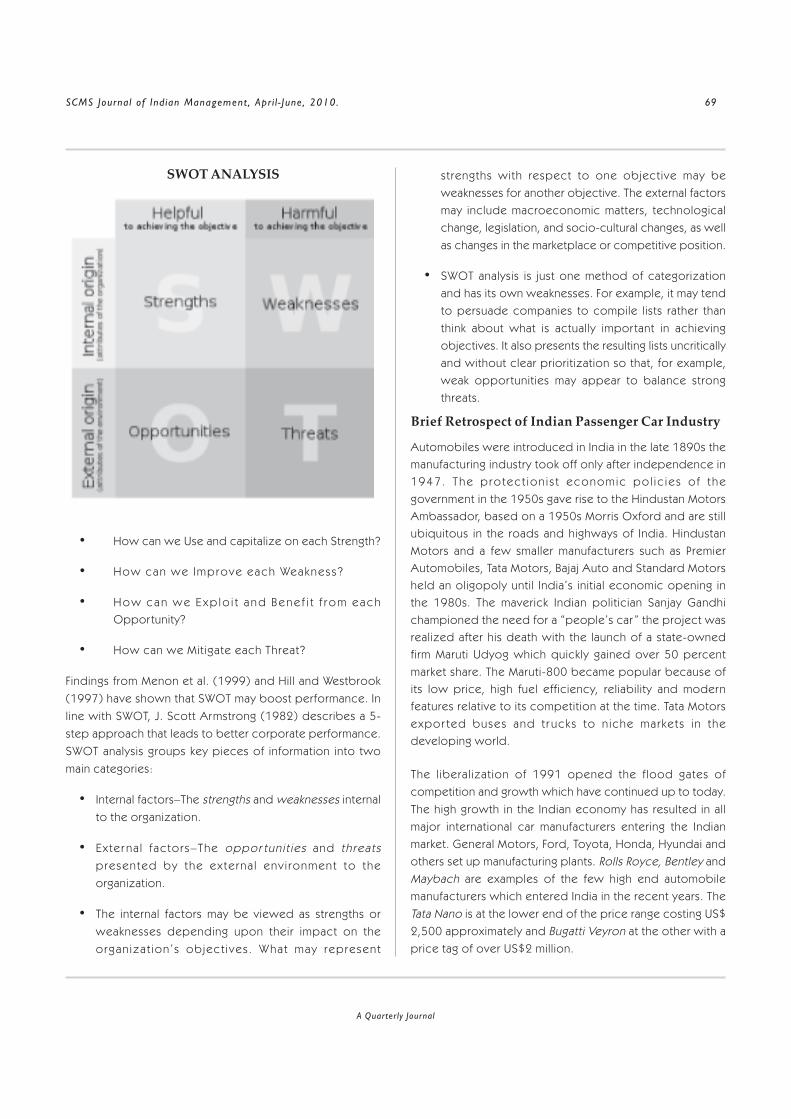
SCMS Journal of Indian Management , Apr i l - June, 2010. 69
A Quarterly Journal
• How can we Use and capitalize on each Strength?
• How can we Improve each Weakness?
• H o w c a n w e E x p l o i t a n d B e n e f i t f r o m e a c hOppor tunity?
• How can we Mit igate each Threat?
Findings from Menon et al. (1999) and Hill and Westbrook(1997) have shown that SWOT may boost performance. Inline with SWOT, J. Scott Armstrong (1982) describes a 5-step approach that leads to better corporate performance.SWOT analysis groups key pieces of information into twomain categories:
• Internal factors–The strengths and weaknesses internalto the organization.
• Exter na l fac tors–The oppor tun i t ies and th rea tspresented by the ex te rna l env i ronment to theorganization.
• The internal factors may be viewed as strengths orweaknesses depending upon their impact on theorgan iza t ion ’ s ob ject i ves . What may represent
strengths with respect to one object ive may beweaknesses for another objective. The external factorsmay include macroeconomic matters, technologicalchange, legislation, and socio-cultural changes, as wellas changes in the marketplace or competitive position.
• SWOT analysis is just one method of categorizationand has its own weaknesses. For example, it may tendto persuade companies to compile lists rather thanthink about what is actually impor tant in achievingobjectives. It also presents the resulting lists uncriticallyand without clear prioritization so that, for example,weak oppor tunities may appear to balance strongthreats.
Brief Retrospect of Indian Passenger Car Industry
Automobiles were introduced in India in the late 1890s themanufacturing industry took off only after independence in1947 . The p ro tec t ion i s t economic po l i c i e s o f t hegovernment in the 1950s gave rise to the Hindustan MotorsAmbassador, based on a 1950s Morris Oxford and are stillubiquitous in the roads and highways of India. HindustanMotors and a few smaller manufacturers such as PremierAutomobiles, Tata Motors, Bajaj Auto and Standard Motorsheld an oligopoly until India’s initial economic opening inthe 1980s. The maverick Indian politician Sanjay Gandhichampioned the need for a “people’s car ” the project wasrealized after his death with the launch of a state-ownedfirm Maruti Udyog which quickly gained over 50 percentmarket share. The Maruti-800 became popular because ofits low price, high fuel efficiency, reliability and modernfeatures relative to its competition at the time. Tata Motorsexpor ted buses and t r ucks to n iche markets in thedeveloping world.
The l iberal izat ion of 1991 opened the f lood gates ofcompetition and growth which have continued up to today.The high growth in the Indian economy has resulted in allmajor international car manufacturers entering the Indianmarket. General Motors, Ford, Toyota, Honda, Hyundai andothers set up manufacturing plants. Rolls Royce, Bentley andMaybach are examples of the few high end automobilemanufacturers which entered India in the recent years. TheTata Nano is at the lower end of the price range costing US$2,500 approximately and Bugatti Veyron at the other with aprice tag of over US$2 million.
SWOT ANALYSIS
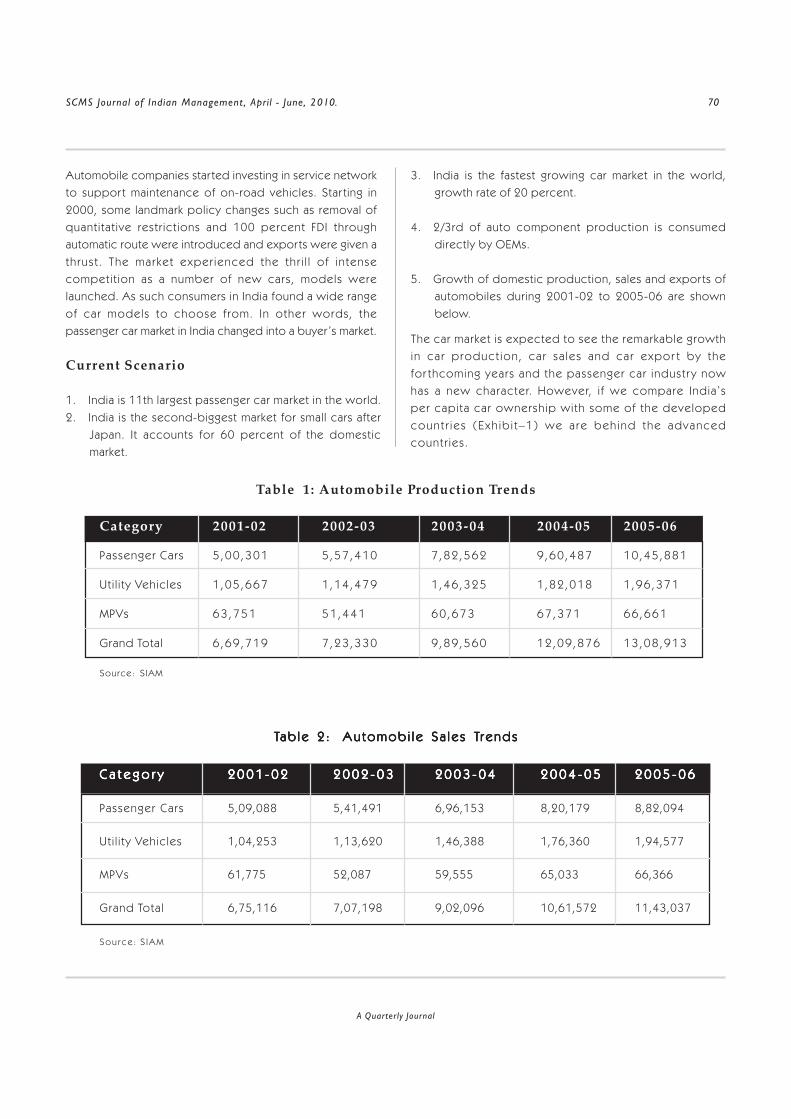
SCMS Journal of Indian Management , April - June, 2010. 70
A Quarterly Journal
Automobile companies star ted investing in service networkto suppor t maintenance of on-road vehicles. Star ting in2000, some landmark policy changes such as removal ofquantitat ive restr ict ions and 100 percent FDI throughautomatic route were introduced and expor ts were given athrust . The market exper ienced the thr i l l of in tensecompetit ion as a number of new cars, models werelaunched. As such consumers in India found a wide rangeof car models to choose f rom. In other words, thepassenger car market in India changed into a buyer ’s market.
Current Scenario
1. India is 11th largest passenger car market in the world.2. India is the second-biggest market for small cars after
Japan. It accounts for 60 percent of the domesticmarket.
3. India is the fastest growing car market in the world,growth rate of 20 percent.
4. 2/3rd of auto component production is consumeddirectly by OEMs.
5. Growth of domestic production, sales and expor ts ofautomobiles during 2001-02 to 2005-06 are shownbelow.
The car market is expected to see the remarkable growthin car product ion , car sa les and car expor t by thefor thcoming years and the passenger car industr y nowhas a new character. However, i f we compare India’sper capita car ownership with some of the developedcount r ies (Exh ib i t–1) we a re beh ind the advancedcountr ies .
Table 1: Automobile Production Trends
Category 2001-02 2002-03 2003-04 2004-05 2005-06
Passenger Cars 5 ,00 ,301 5 ,57 ,410 7 ,82 ,562 9 ,60 ,487 10 ,45 ,881
Uti l i ty Vehicles 1 ,05 ,667 1 ,14 ,479 1 ,46 ,325 1 ,82 ,018 1 ,96 ,371
MPVs 63 ,751 51 ,441 60 ,673 67 ,371 66 ,661
Grand Total 6 ,69 ,719 7 ,23 ,330 9 ,89 ,560 12 ,09 ,876 13 ,08 ,913
Source: S IAM
TTTTTab l e 2 :ab l e 2 :ab l e 2 :ab l e 2 :ab l e 2 : AAAAA u tomob i l e S a l e s Tu tomob i l e S a l e s Tu tomob i l e S a l e s Tu tomob i l e S a l e s Tu tomob i l e S a l e s Tr endsrendsrendsrendsrends
C a t e g o r yC a t e g o r yC a t e g o r yC a t e g o r yC a t e g o r y 2 0 0 1 - 0 22 0 0 1 - 0 22 0 0 1 - 0 22 0 0 1 - 0 22 0 0 1 - 0 2 2 0 0 2 - 0 32 0 0 2 - 0 32 0 0 2 - 0 32 0 0 2 - 0 32 0 0 2 - 0 3 2 0 0 3 - 0 42 0 0 3 - 0 42 0 0 3 - 0 42 0 0 3 - 0 42 0 0 3 - 0 4 2 0 0 4 - 0 52 0 0 4 - 0 52 0 0 4 - 0 52 0 0 4 - 0 52 0 0 4 - 0 5 2 0 0 5 - 0 62 0 0 5 - 0 62 0 0 5 - 0 62 0 0 5 - 0 62 0 0 5 - 0 6
Passenger Cars 5,09,088 5,41,491 6,96,153 8,20,179 8,82,094
Uti l i ty Vehicles 1,04,253 1,13,620 1,46,388 1,76,360 1,94,577
MPVs 61,775 52,087 59,555 65,033 66,366
Grand Total 6,75,116 7,07,198 9,02,096 10,61,572 11,43,037
Sou rce : S IAM

SCMS Journal of Indian Management , Apr i l - June, 2010. 71
A Quarterly Journal
Table 3: Automobile Export Trend
Category 2001-02 2002-03 2003-04 2004-05 2005-06
Passenger Cars 49,273 70,263 1,25,320 1,60,670 1,70,193
Ut i l i ty Vehic les 3,077 1,177 3,049 4,505 4,486
MPVs 815 565 922 1,227 1,093
Grand tota l 53,165 72,005 1,29,291 1,66,402 1,75,772
Source : S IAM
Exhibit 1: Car usage in India and Leading World Market
Cars for Thousand People

SCMS Journal of Indian Management , April - June, 2010. 72
A Quarterly Journal
Analysis and Discussion
SWOT Factors for car Manufacturers –Strengths
To identify the strength factors for car manufacturer, theFriedman’s test is used and the result of the test is given inthe Table 4.
The Friedman chi-square tests the null hypothesis that theranks of the variables do not differ from their expected value.For a constant sample size, the higher the value of this chi-square statistic, the larger the difference between eachvariables rank sum and its expected value. For these rankings,the chi-square value is 821.199; Degrees of freedom areequal to the number of variables minus one. The asymptoticsignificance is the approximate probability of obtaining achi-square statistic as extreme as 821.199 with nine degreesof freedom in repeated samples if the rankings of each factorsare not truly different. Because a chi-square of 821.199 withnine degrees of freedom is unlikely to have arisen by chance,it has to be concluded that the 712 respondents do nothave equal preference for all factors. The above Table 4por trays that among the ten factors, suppor t from carfinanciers (6.96) was ranked first. It is followed by Product
diversif ication (6.71), Strong dealer and service network
(6.39), large volume of production (6.37) and Established
base (5.81) which was ranked second, third, four th, f i f th
and sixth respectively.
Therefore, it can be concluded that Suppor t from car
financiers, Product diversification, Strong dealer and service
network and Large volume of production are identified as
major strength factors for car manufacturer.
SWOT Factors for car manufacturer –Weakness
To identify the weakness factors of the car manufacturer,
the Friedman’s test is used and the results are given in
Table-5.
It could be noted from Table 5 below that among the six
factors, Low level of safety features (3.78) was ranked first.
It is followed by Low number of dealers (3.75), Lack of new
technology (3.45) High maintenance (3.14) and Costly spares
(3 .11) were ranked second, th i rd , four th , and f i f th
respectively.
Ta b l e 4 : S W O T F a c t o r s f o r Ca r Ma n u f a c t u r e r – S T R E N G T H
F a c t o r s M e a n S D M e a n C h i - D f P
R a n k S q u a r e
Adve r t i s emen t 4 .28 3 .214 4.29
D u r a b i l i t y / R u g g e d n e s s 5 .35 2 .734 5.37
E s t a b l i s h e d b a s e 5 .79 2 .677 5.81
L a t e s t e n g i n e t e c h n o l o g y 4 .30 2 .610 4.32
H i g h f u e l e f f i c i e n c y 4 .25 2 .732 4.26
L a r g e v o l u m e o f p r o d u c t i o n 6 .35 2 .459 6.37
P roduc t d i ve r s i f i c a t i on 6 .68 2 .400 6.71
S t rong b r and l o ya l t y 4 .51 2 .718 4.53
Strong dealer and service network 6 .37 2 .559 6.39
S u p p o r t f r o m c a r f i n a n c i e r s 6 .94 2 .667 6.96
821.199 9 0 .00**

SCMS Journal of Indian Management , Apr i l - June, 2010. 73
A Quarterly Journal
Table 5: SWOT Factors for Car Manufacturer –WEAKNESS
Factors Mean SD Mean Chi- df PRank Square
Costly spares 3.11 1.692 3.11
High maintenance 3.14 1.585 3.14
Low price of cars 3.78 1.734 3.08
Lack of new technology 3.45 1.633 3.45
Low level of safety features 3.78 1.631 3.78
Low number of dealers 3.75 1.806 3.75
Table 6: SWOT Factors for Car Manufacturer–OPPORTUNITY
Factors Mean SD Mean Chi- Df PRank Square
Growing demands 2.96 1.422 2.97
Introduction of diesel product 3.09 1.447 3.09
Improvement in existing product 2.63 1.356 2.63
Introduction of safety features 3.14 1.305 3.16
Launch of new product 3.14 1.463 3.15
It is concluded that Low level of safety features, Low numberof dealers, Lack of new technology, High maintenance andCostly spares are identified as significant weakness factorsof the car manufacturers which will not suppor t them toincrease the sales or influence the people negatively towardsbrand preference.
SWOT Factors for Car Manufacturer –Opportunity
To know the oppor tunity factors for car manufacturer, theFriedman’s test is used and the results are given in Table-6.
It is understood from the above Table 6 that among the fivefactors, Introduction of safety features (3.16) was ranked first.It is followed by Launch of new product (3.15), Introduction
of diesel product (3.09), Growing demands (2.97) andImprovement in existing product (2.63) which was rankedsecond, third, fourth and fif th respectively.
Thus, it is concluded that Introduction of safety features,Launch of a new product, and Introduction of dieselproduct are ident i f ied an oppor tuni ty factor for carmanufacturer and these factors are to be considered bythe manufacturer.
SWOT Factors for car manufacturer –Threat
To identify the impor tant threat factors for car manufacturer,the Friedman’s test is used and result of the test is given inTable 7.
102.487 5 0 .00**
55.171 4 0 .00**
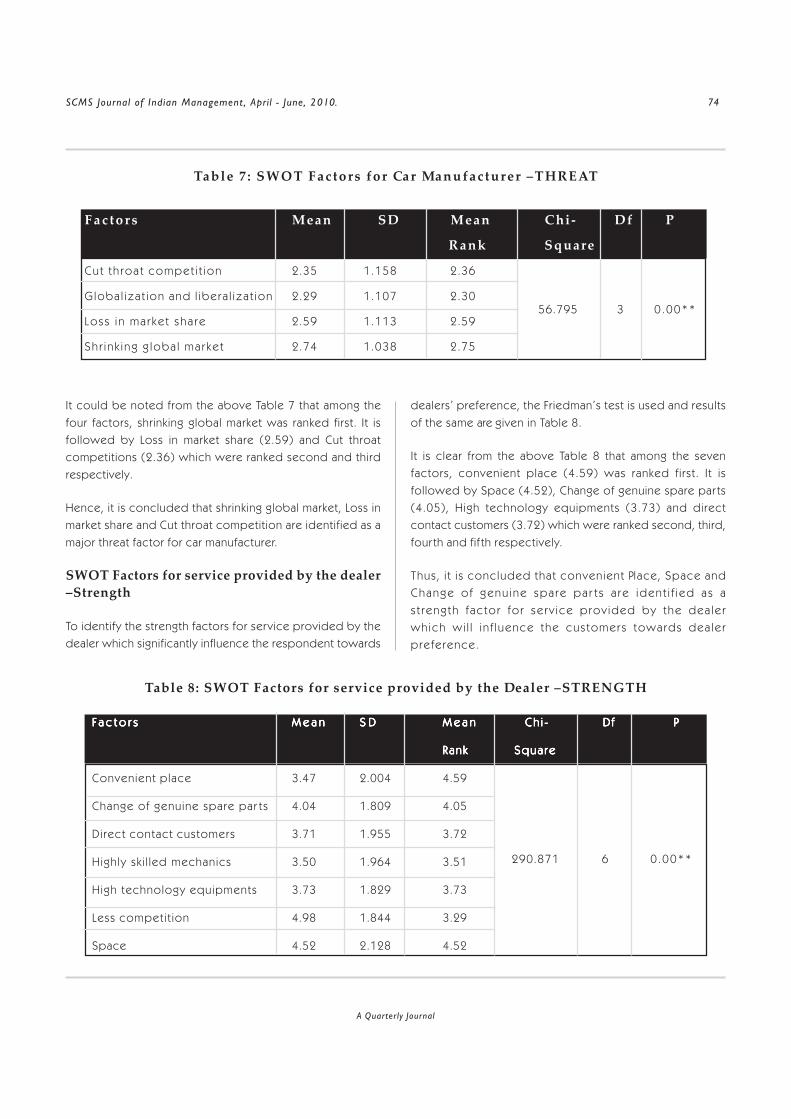
SCMS Journal of Indian Management , April - June, 2010. 74
A Quarterly Journal
Table 7 : SWOT Factors for Car Manufacturer –THREAT
Factors Mean SD Mean Chi- Df P
Rank Square
Cut th roa t compet i t ion 2.35 1.158 2.36
Globa l iza t ion and l ibe ra l i za t ion 2.29 1.107 2.30
Loss i n ma r ke t sha re 2.59 1.113 2.59
Sh r i n k i ng g loba l ma r ke t 2.74 1.038 2.75
It could be noted from the above Table 7 that among thefour factors, shrinking global market was ranked first. It isfollowed by Loss in market share (2.59) and Cut throatcompetitions (2.36) which were ranked second and thirdrespectively.
Hence, it is concluded that shrinking global market, Loss inmarket share and Cut throat competition are identified as amajor threat factor for car manufacturer.
SWOT Factors for service provided by the dealer–Strength
To identify the strength factors for service provided by thedealer which significantly influence the respondent towards
dealers’ preference, the Friedman’s test is used and resultsof the same are given in Table 8.
It is clear from the above Table 8 that among the sevenfactors, convenient place (4.59) was ranked first. It isfollowed by Space (4.52), Change of genuine spare par ts(4.05), High technology equipments (3.73) and directcontact customers (3.72) which were ranked second, third,four th and fif th respectively.
Thus, i t i s concluded that convenient Place, Space andChange o f genu ine spa re pa r t s a re iden t i f i ed as as t reng th fac tor fo r se rv ice prov ided by the dea le rwh ich wi l l i n f l uence the cus tomers towards dea le rpreference.
Table 8: SWOT Factors for service provided by the Dealer –STRENGTH
F a c t o r sF a c t o r sF a c t o r sF a c t o r sF a c t o r s M e a nM e a nM e a nM e a nM e a n S DS DS DS DS D M e a nM e a nM e a nM e a nM e a n Ch i -Ch i -Ch i -Ch i -Ch i - DfDfDfDfDf PPPPP
RankRankRankRankRank Squa reSqua reSqua reSqua reSqua re
Convenient place 3.47 2.004 4.59
Change of genuine spare par ts 4.04 1.809 4.05
Direct contact customers 3.71 1.955 3.72
Highly sk i l led mechanics 3.50 1.964 3.51
High technology equipments 3.73 1.829 3.73
Less competi t ion 4.98 1.844 3.29
Space 4.52 2.128 4.52
56.795 3 0 .00**
290.871 6 0 .00**
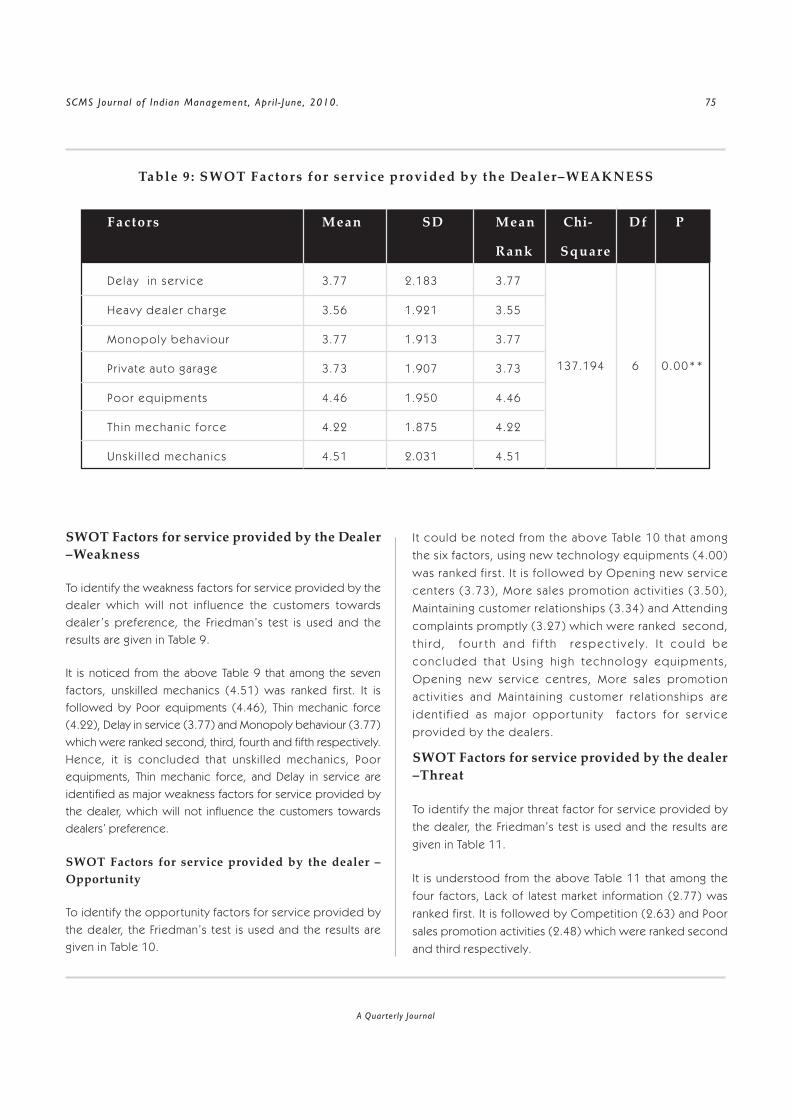
SCMS Journal of Indian Management , Apr i l - June, 2010. 75
A Quarterly Journal
Table 9 : SWOT Factors for service provided by the Dealer–WEAKNESS
Factors Mean SD Mean Chi- Df P
Rank Square
Delay in se rv ice 3.77 2.183 3.77
Heavy dea ler charge 3.56 1.921 3.55
Monopoly behav iour 3.77 1.913 3.77
Pr ivate auto garage 3.73 1.907 3.73
Poor equ ipments 4.46 1.950 4.46
Th in mechan ic fo rce 4.22 1.875 4.22
Unsk i l led mechan ics 4.51 2.031 4.51
SWOT Factors for service provided by the Dealer–Weakness
To identify the weakness factors for service provided by thedealer which wil l not influence the customers towardsdealer ’s preference, the Friedman’s test is used and theresults are given in Table 9.
It is noticed from the above Table 9 that among the sevenfactors, unskilled mechanics (4.51) was ranked first. It isfollowed by Poor equipments (4.46), Thin mechanic force(4.22), Delay in service (3.77) and Monopoly behaviour (3.77)which were ranked second, third, fourth and fifth respectively.Hence, it is concluded that unski l led mechanics, Poorequipments, Thin mechanic force, and Delay in service areidentified as major weakness factors for service provided bythe dealer, which will not influence the customers towardsdealers’ preference.
SWOT Factors for service provided by the dealer –Opportunity
To identify the oppor tunity factors for service provided bythe dealer, the Friedman’s test is used and the results aregiven in Table 10.
I t could be noted from the above Table 10 that amongthe six factors, using new technology equipments (4.00)was ranked f i rst . I t is fol lowed by Opening new serv icecenters (3.73), More sa les promotion act iv i t ies (3.50),Maintaining customer relat ionships (3.34) and Attendingcomplaints promptly (3.27) which were ranked second,t h i rd , fou r t h and f i f t h r e spec t i ve l y . I t cou ld beconc luded tha t Us ing h igh techno logy equ ipments ,Opening new serv ice centres, More sa les promotionact iv i t ies and Mainta in ing customer re la t ionsh ips areident i f ied as ma jor oppor tun i ty factors for ser v iceprovided by the dealers.
SWOT Factors for service provided by the dealer–Threat
To identify the major threat factor for service provided bythe dealer, the Friedman’s test is used and the results aregiven in Table 11.
It is understood from the above Table 11 that among thefour factors, Lack of latest market information (2.77) wasranked first. It is followed by Competition (2.63) and Poorsales promotion activities (2.48) which were ranked secondand third respectively.
137.194 6 0 .00**

SCMS Journal of Indian Management , April - June, 2010. 76
A Quarterly Journal
Table 10: SWOT Factors for service provided by the Dealer–OPPORTUNITY
F a c t o r sF a c t o r sF a c t o r sF a c t o r sF a c t o r s M e a nM e a nM e a nM e a nM e a n SDSDSDSDSD M e a nM e a nM e a nM e a nM e a n Ch i -Ch i -Ch i -Ch i -Ch i - DfDfDfDfDf PPPPP
RankRankRankRankRank SquareSquareSquareSquareSquare
Attending complaints promptly 3.26 1.803 3.27
Maintaining customer relationship 3.32 1.613 3.34
More sales promotion activities 3.49 1.657 3.50
Opening new service centres 3.72 1.750 3.73
Quality service every time 3.14 1.649 3.15
Using new technology equipments 4.00 1.617 4.00
Table 11: SWOT Factors for service provided by the Dealer–THREAT
Factors Mean SD Mean Chi- Df PRank Square
Competition 2.12 1.141 2.63
Lack of business harmony 2.64 1.066 2.11
Poor sales promotion activities 2.49 1.087 2.48
Lack of latest market information 2.77 1.077 2.77
Thus, it is concluded that Lack of latest market problems,Competition and Poor sales promotion activities are identifiedas major threat factors for service provided by the dealers.
Implications of the Study
This study in its endeavour to carry out a comprehensivestudy on SWOT factors of automobile industry in India inthe perspective of customers has unear thed umpteennumbers of intr iguing implications for the manufacturersand dealers and also provides means which would equipthem with effective marketing strategies to improve theirperformance and retain the customers. A few paramountimplications of the study are outl ined here.
1. Findings of this study indicate that i t is wor thwhilefor the dealers of automobiles to take note of theresu l t s o f th i s s tudy and fo rmu la te compet i t i ve
operation strategy, so as to reinforce the customers’t r u s t and expec ta t ion and consequen t l y a t t a i npersonal, professional and profitable relationship withcustomers.
2 . Manu f ac tu re r, e spec i a l l y a l l t he dea le r s o f t hem a n u f a c t u r e r, n e e d t o d e v e l o p a s y s t e m o finvolvement, trust and commitment as they play a vitalrole in value creation for customers, dealers andmanufacturers.
3. The primary implications for the dealers are:
(a) Increase the practice of awareness training,service workshops, complaint managementsystems and customer satisfaction surveys;
103.751 5 0 .00**
101.939 3 0 .00**

SCMS Journal of Indian Management , Apr i l - June, 2010. 77
A Quarterly Journal
(b) Have appraisal on the basis of customers’feedback on the sa le s pe r sonne l andmechan ic s ’ ab i l i t y to ma in t a i n p rope rrelat ionship with customers;
(c) Put in place ‘Assessment incentives’ on thebasis of customer rat ing as it happens ineducat ional inst i tut ions where students’r a t i n g o f t e a c h e r s i s o f p a r a m o u n timpor tance in assessing the per formanceof the teachers;
(d) Dealers have to focus on their employees’i n t e r p e r s o n a l a n d s e l l i n g s k i l l s a n dconcentrate on the serv ice ‘extras’ thatallow them to differentiate themselves fromcompetitors;
(e) Focus on creating new customers for theb u s i n e s s , t h r o u g h m a i n t a i n i n g g o o da p p e a r a n c e a n d c l e a n l i n e s s o f t h eshowroom, explanation for enquiries by theemployees and mechanics, prompt deliveryof the vehicle and integrity of the dealer;and
(f) Apar t from creating new customers for thebusiness, the dealers have to concentrateon retaining the exist ing customers. Thiscan be achieved by the dealer by satisfyingthe customers through bui lding customerrelat ions, good behaviour of mechanics,using qual ity service equipments and newtechnology, change of genuine spare par ts,spac iou s and conven i en t l oca t i on o fservice stat ion and del ivering the vehicleon t ime.
Conclusion
When customers decided to buy / avai l the par t icularproduct or service, before that they may have bundle ofquestions in their mind regarding that product and itsservices. Based on the literature available on SWOT factorsrelat ing to car manufacturer and service provided by thedealers, this study covers the consumers’ general opiniontowards the passenger cars and also provides useful
information to the general public, car owners, dealers
and car manufacturing companies in many ways. It is very
evident from the study that, manufacturer or dealer, in
order to be successful, should refrain from treating al l
customers’ requirements equally. The findings of the study
are expected to help the dealers and manufacturers of
the automobile industry in understanding the elements of
preference at market level. F indings also suggest that the
dealers can generate more customers by adapting proper
c u s t o m e r r e l a t i o n s h i p m a n a g e m e n t m e t h o d s . T h e
propensity to offer experiential and intangible rewards to
the customers that are relevant and perceived as high
value in form of special recognition or special experience
as opposed to standard discount offer or gift type wil l
be more rewarding in the long run.
Keywords: SWOT Analysis, car manufacturer, dealers’
service, Friedman’s test.
References
Auto India Vol. No.16, Issue II, April 2009.
Conover. W.J. Pract ical Nonparametr ic Stat ist ics. Third
Edition, Wiley, (1999): 367-373.
Hill, T. and R. Westbrook. “SWOT Analysis: It’s Time for a
Product Recal l .” Long Range Planning. 30 (1):
(1997): 46–52.
Menon, A . et a l . “Antecedents and Consequences of
Marketing Strategy Making.” Journal of Marketing.63: (1999): 18–40.
Ramanuj Majumdar. “Product Management in India.” Prentice-Hall of India (P) Limited. New Delhi, 3rd Edition, 15th
print. 2007.
J.Scott Armstrong. “The Value of Formal Planning for Strategic
Decis ions.” Strategic Management Journal . 3:
(1982):197–211.
Sooraj Bhat and Puneet Dhamija, “The Indian passenger car
market: Outlook for Maruti.” Management Review.
December 1999.

SCMS Journal of Indian Management , April - June, 2010. 78
A Quarterly Journal
Websources
<http: / /www.autocar.com>, <ht tp: / /www.auto ind iama r t . com>,<h t tp : / /www.au tomob i l e i nd i a .com><http: / /w w w. B u s i n e s s b a l l s . c o m > ,<http://www.cipd.co.uk>, <http://www.motori n d i a . c o m > ,< h t t p : / / w w w. t e x a s o f t . c o m /winkfrie.html>
ANNEXURE
SWOT Factor Scale
T h e S t r e n g t h , We a k n e s s , O p p o r t u n i t y a n d T h r e a t
( S W O T ) f a c t o r s s c a l e r e l a t i n g t o c a r m a n u f a c t u r e r
a n d S e r v i c e p r o v i d e d b y t h e d e a l e r a r e g i v e n
b e l o w.
SWOT Factors for Car Manufacturer
STRENGTH
a. Adver t i sement ( )
b. Durabi l i ty /Ruggedness ( )
c . Establ i shed base ( )
d. Latest eng ine technology ( )
e . H igh fue l ef f ic iency ( )
f . Large volume of product ion ( )
g . Product divers i f icat ion ( )
h . St rong brand loya l ty ( )
i . S t rong dea ler and serv ice network ( )
j . Suppor t f rom car f inanciers ( )
WEAKNESS
a. Cost ly spares ( )
b. H igh maintenance ( )
c . Low pr ice of cars ( )
d. Lack of new technology ( )
e . Low leve l of sa fety features ( )
f . Low number of dea lers ( )
OPPORTUNITY
a. Growing demands ( )
b. In t roduct ion of d iese l models ( )
c . Improvement in ex is t ing product ( )
d. In t roduct ion of sa fety features ( )
e . Launch of new product ( )
THREAT
a. Cut throat competit ion ( )
b. Global ization and l iberal izat ion ( )
c. Loss in market share ( )
d. Shrinking global market ( )
SWOT Factors for Service provided by the Dealer
STRENGTHa. Convenient p lace ( )
b. Change of genuine spares par t s ( )
c . D i rect contact customers ( )
d. H igh ly sk i l led mechanics ( )
e . H igh technology equipments ( )
f . Less compet i t ion ( )
g . Space ( )
WEAKNESSa. Delayed serv ice ( )
b. Heavy dea ler charge ( )
c . Monopoly behav iour ( )
d. Pr ivate auto garage ( )
e . Poor equipments ( )
f . Th in mechanic force ( )
g . Unsk i l led mechanics ( )

SCMS Journal of Indian Management , Apr i l - June, 2010. 79
A Quarterly Journal
OPPORTUNITY a. Attending complaints promptly ( )
b. Maintaining customer relat ionship ( )
c. More sales promotion activit ies ( )
d. Opening new service centres ( )
e. Qual ity service every t ime ( )
f . Using high technology equipments ( )
THREAT
a. Competition ( )
b. Lack of business harmony ( )
c. Poor sales promotion activities ( )
d. Lack of latest market information ( )

SCMS Journal of Indian Management , April - June, 2010. 80
A Quarterly Journal
Ordering of Companies:Proposed - Profitability Scores
Dilip Roy and Anupama Tiwari
T h i s p a p e r e m p l o y s d i s c r i m i n a n t a n a l y s i s , a w e l l k n o w nm u l t i v a r i a t e s t a t i s t i c a l t o o l , t o f i n d t h e s u i t a b i l i t y o f d e v e l o p i n gd i s c r i m i n a n t s c o r e . T h e u n d e r l y i n g m u l t i v a r i a t e m e a s u r ei n c l u d e s f o u r k e y f i n a n c i a l r a t i o s n a m e l y d e b t e q u i t y r a t i o ,
c u r r e n t r a t i o , i n v e n t o r y t u r n o v e r r a t i o a n d i n t e r e s t c o v e r a g e r a t i o s o a s t o p r e d i c t t h e f u t u r eo r g a n i z a t i o n a l p e r f o r m a n c e u s i n g t h e s e f i n a n c i a l r a t i o s o n l y . T h e d i s c r i m i n a n t s c o r e , w h i c h w eh a v e d e v e l o p e d i n t h i s p r o c e s s , i s i n l i n e w i t h F i s h e r ' s l i n e a r d i s c r i m i n a t i n g f u n c t i o n . T h i ss c o r e h a s b e e n a d j u s t e d f o r t h r e s h o l d v a l u e . T h e u s e f u l n e s s o f t h i s s c o r e h a s b e e n e s t a b l i s h e db y c a l c u l a t i n g t h e r a n k c o r r e l a t i o n b e t w e e n t h e p r o p o s e d s c o r e a n d t h e p r o f i t a b i l i t y m e a s u r e .
T
Abstract
Discriminant Score
123456789012345678901234567890121234567890123456789012345671234567890123456789012345678901212345678901234567890123456712345678901234567890123456789012123456789012345678901234567123456789012345678901234567890121234567890123456789012345671234567890123456789012345678901212345678901234567890123456712345678901234567890123456789012123456789012345678901234567123456789012345678901234567890121234567890123456789012345671234567890123456789012345678901212345678901234567890123456712345678901234567890123456789012123456789012345678901234567123456789012345678901234567890121234567890123456789012345671234567890123456789012345678901212345678901234567890123456712345678901234567890123456789012123456789012345678901234567123456789012345678901234567890121234567890123456789012345671234567890123456789012345678901212345678901234567890123456712345678901234567890123456789012123456789012345678901234567123456789012345678901234567890121234567890123456789012345671234567890123456789012345678901212345678901234567890123456712345678901234567890123456789012123456789012345678901234567123456789012345678901234567890121234567890123456789012345671234567890123456789012345678901212345678901234567890123456712345678901234567890123456789012123456789012345678901234567123456789012345678901234567890121234567890123456789012345671234567890123456789012345678901212345678901234567890123456712345678901234567890123456789012123456789012345678901234567123456789012345678901234567890121234567890123456789012345671234567890123456789012345678901212345678901234567890123456712345678901234567890123456789012123456789012345678901234567123456789012345678901234567890121234567890123456789012345671234567890123456789012345678901212345678901234567890123456712345678901234567890123456789012123456789012345678901234567123456789012345678901234567890121234567890123456789012345671234567890123456789012345678901212345678901234567890123456712345678901234567890123456789012123456789012345678901234567123456789012345678901234567890121234567890123456789012345671234567890123456789012345678901212345678901234567890123456712345678901234567890123456789012123456789012345678901234567123456789012345678901234567890121234567890123456789012345671234567890123456789012345678901212345678901234567890123456712345678901234567890123456789012123456789012345678901234567123456789012345678901234567890121234567890123456789012345671234567890123456789012345678901212345678901234567890123456712345678901234567890123456789012123456789012345678901234567123456789012345678901234567890121234567890123456789012345671234567890123456789012345678901212345678901234567890123456712345678901234567890123456789012123456789012345678901234567123456789012345678901234567890121234567890123456789012345671234567890123456789012345678901212345678901234567890123456712345678901234567890123456789012123456789012345678901234567123456789012345678901234567890121234567890123456789012345671234567890123456789012345678901212345678901234567890123456712345678901234567890123456789012123456789012345678901234567
D r. D i l i p R o y , D i r e c t o r, C e n t e r f o r M a n a g e m e n tS tud ies , Un i ve r s i t y of Bu rdwan , Go l apbag , Bu rdwan–713104 , Ema i l : d r.d i l i p roy@gma i l . com
P r o f . A n u p a m a T i w a r i , Senior L e c t u r e r, Fa c u l t y o fM a n a g e m e n t S t u d i e s , D r . B . C . R o y E n g i n e e r i n gCo l l ege , Jemua Road , Fu l j ho re , Du rgapu r -713206 ,E m a i l : a n u p a m a t i w a r i 0 7 @ g m a i l . c o m
he predict ion of future prospect of bus iness i sbecoming increasingly impor tant (Neophytou andMolinero, 2004) due to the growing upheaval in the
world economy. Firms, irrespective of their sizes and volumesof operation, seem to loosecontrol over thei r f inancia lstability. As a result, financialstatement analysis (Lev, 1974)has regained focus. The focusis also due to its abi l i ty toprov ide ana lys ts wi th theopportunity to examine how acompany is performing whencompared with previous years(Wi l l i ams and E l l i s , 1993) .Numerous studies have beencontributed in this regard fromdifferent specialized area likef inance, economics andaccount ing ( Johnsen andMelicher, 1994).
It is well known in the literature that financial ratios are importanttools, which can be used to significantly discriminate MarketOut-performers, Market Performers and Market Under-performers. Beaver (1966) was the first one to point out that
the financial ratio composition ofthe weak companies dif ferssignificantly from the financialratio composition of the healthyone. But mostly these groupingsare subjective in nature andobject ive procedures l i kediscriminant analysis, clusteranalysis need to be employedfor such purposes.
D iscr im inant ana lys i s i s astatistical approach generallyused in social science researchto discriminate two or moregroups. The same has beenused in financial performance

SCMS Journal of Indian Management , Apr i l - June, 2010. 81
A Quarterly Journal
analysis to discriminate the companies into better and worseperformers based on stock market indices to enable theinvestors to invest wisely to maximize their returns. One of themost renowned studies in finance is by Altman (1968, p589),where he used discriminant analysis to predict the corporatebankruptcy based on liquidity ratio, profitability ratio, leverageratio, solvency ratio and activity ratio. Charabji, Hamdi, Mrrash(1993) examined the applicability of discriminant analysis forrescheduling external debt of less developed countries withthe help of variables like debt burden, foreign exchangebalance and GDP growth. Earlier Deakin (1972) had useddiscriminant analysis for predicting business failures. Mohantyand Sahoo (2002) had applied discriminant analysis for creditrating and Raj (1999) had used the same for lending decisionmaking. If we consider the financial ratios as a vector measureof f inancial performance of an organizat ion the l ineardiscriminant function can be used to classify different firms.
Purpose of this Research
In the recent past researchers have established that the financialratios are no more capable of discriminating between the goodand the worse performers. Academicians now seem toeliminate the usage of ratio analysis as a quantitative tool forestimating the financial picture of an organization. Accordingto them, investors have to be sentinel for some other modelsto master their investment decisions making process.
However, one may put up a differing hypothesis that financialratios may be a bad indicator for performance analysis if thechoice of the ratios is not an appropriate one and may becomegood indicators if appropriately chosen. In this paper, wepropose to use the concept of discriminant analysis formaintaining close compatibility with profitability measure. Inthis process we can arrive at a composite financial measure, tobe referred as discriminant score, as an alternative measure forstudying business efficiency.
Methodology
To install the discriminant analysis, we propose to select aproduct field and within the product field we propose toselect some companies of varying performance and study theirfinancial statements over a period of years. Our primary concernis to identify the best and the worst performers among thesecompanies in terms of net profit margin ratio. Simultaneously
we propose to consider four financial ratios debt equity ratio,current ratio, inventory turnover ratio and interest coverageratio. These ratios are selected to enable the investors inpredicting which companies are most steady in their growthrate and hence to invest in. Fur ther such investigation wouldhelp the investors to hedge a portfolio in order to choosedifferent companies from different clusters to maximise theirportfolio’s diversity and flexibility to the changes in the market.Debt equity ratio enables us to know the propor tion ofinvestment of creditors and owners into the firm, whereascurrent ratio expresses how much current assets are there withthe firm to meet the current liabilities. The inventory turnoverratio gives the number of times the inventory is replaced duringa given period; usually a year and interest coverage ratio showsthe number of times the interest charges are covered by fundsthat are ordinarily available for payment. In this process weobtain the vector measure of financial performance for all thecompanies for a particular year. Based on the selected financialratios of the extreme companies, so obtained, we constructthe linear discriminant function following Fisher ’s approach.This linear discriminant function, adjusted for the thresholdvalue, may be considered as a composite measure for businessefficiency provided it is compatible with some standardefficiency measure. Profitability being a widely used parameterof business performance we have decided to examine thecompatibility of discriminant score with those based onprofitability measure. The compatibility between the two setsof ranks as obtained from discriminant score and profitabilityscore will be examined in terms of Spearman’s rank correlation.In case the compatibility is reasonable, the discriminant scorecan be considered as a composite measure of businessefficiency based on financial ratios.
Discriminating Function
Following Fisher ’s approach the linear discriminant functioncan be calculated as
where: is the mean vector of the financial ratios of the best
company as per profitability measure
is the mean vector of the financial ratios of the worst
company as per profitability measure

SCMS Journal of Indian Management , April - June, 2010. 82
A Quarterly Journal
them. Similar exercise of ranking of the companies can beunder taken based on profitability measure. If id is thedifference in the two sets of ranks for the thi company andthere are n companies, then the Spearman’s Rank correlation,r, as a measure of compatibility, can be expressed as
In case r is on the higher side we can consider the discriminantscore to be a good measure of organizational performance.
Empirical Study
For our empirical study we have selected cement industryas the product field of our choice and have chosen eightcement companies namely Birla Corporation Ltd, JapeeCements Ltd., Mangalam Cement Ltd., Chettinad CementCorporation Ltd., J.K. Cement Ltd., Madras Cements Ltd.,Ultra Tech Cement Ltd. and Burnpur Cements Ltd. havingvarying performances. Data about the financial statementsof these companies have been collected from Capitalinecorporate database software. We have used net profit marginratio of the year 2008 to rank these companies according totheir performances so as to identify the best and the worstperformers.
is the inverse of the common dispersion matrix formedwith four financial ratios and
is the vector measure for f inancial performance
The inbetween point of performance being we
can make use of the same in the discriminant function to arriveat the threshold value. Thus, the threshold value can becalculated as
and by shifting the origin to the threshold value we can get thediscriminant score as
If the discriminant score of a company is positive we mayconsider that company to be a good performer. Reverse willbe conclusion when the discriminant score will be negative.For a given set of companies based on which we need toexamine the suitability of this score, we first propose tocalculate the company -wise discriminant scores and rank
Ta b l e 1: S h o w i n g Co m p a n y -w i s e Ne t Pr o f i t Ma r g i n Ra t i o
N a m e of t h e C o m p a n i e s N e t P r o f i t M a r g i n R a t i o f o r 2 0 0 8
B i r l a C o r p o r a t i o n L t d . 0 .229
J a i p r a k a s h A s s o c i a t e s L t d 0 .153
M a n g a l a m C e m e n t L t d 0 .223
Che t t i n ad Cemen t . Co rpo r a t i on L td 0 .176
J K C e m e n t s L t d 0 .182
M a d r a s C e m e n t s L t d 0 .203
U l t r a Te c h C e m e n t L t d 0 .183
B u r n p u r C e m e n t L t d 0 .053
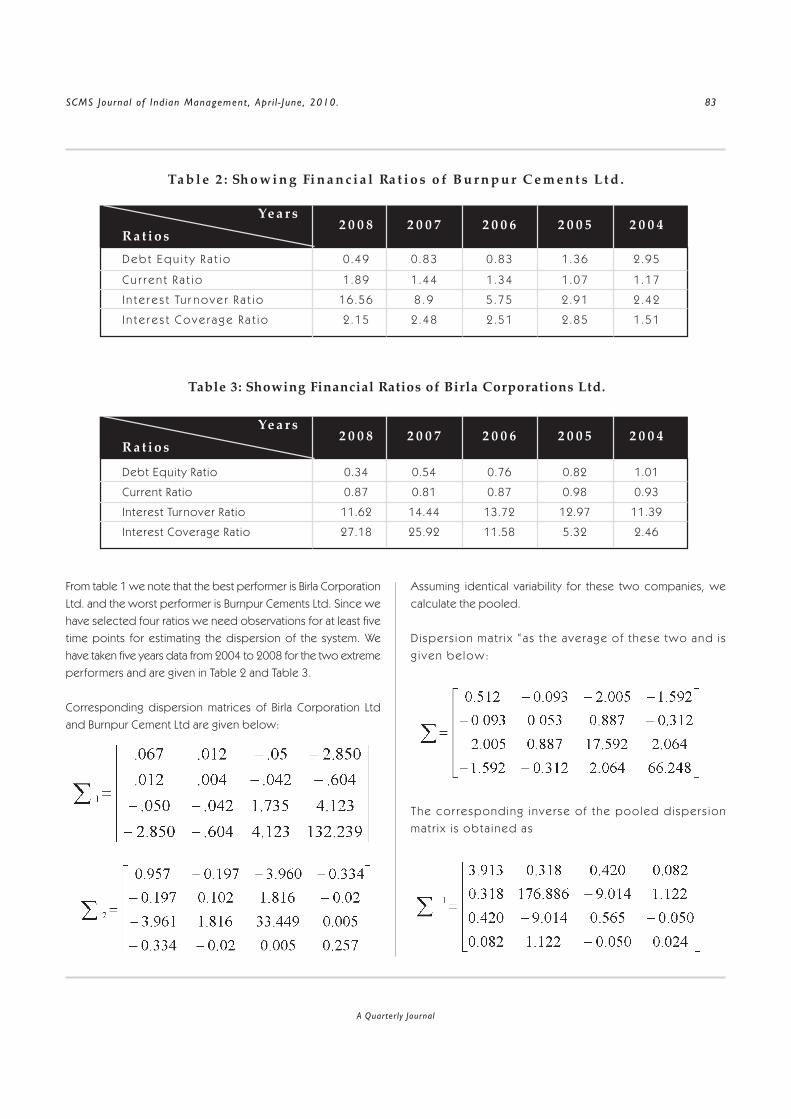
SCMS Journal of Indian Management , Apr i l - June, 2010. 83
A Quarterly Journal
Assuming identical variability for these two companies, wecalculate the pooled.
D i spers ion mat r i x “as the average of these two and i sg i ven be low:
The cor responding inverse of the pooled d ispers ionmat r i x i s obta ined as
Ta b l e 2 : Sh o w i n g Fi n a n c i a l Ra t i o s o f B u r n p u r C e m e n t s L t d .
Ye a r s2 0 0 8 2 0 0 7 2 0 0 6 2 0 0 5 2 0 0 4
R a t i o s
D e b t E q u i t y R a t i o 0 .49 0.83 0.83 1.36 2.95
C u r r e n t R a t i o 1 .89 1.44 1.34 1.07 1.17
I n t e r e s t Tu r n o v e r R a t i o 16 .56 8 . 9 5 .75 2.91 2.42
I n t e r e s t C o v e r a g e R a t i o 2 .15 2.48 2.51 2.85 1.51
Table 3: Showing Financial Ratios of Birla Corporations Ltd.
From table 1 we note that the best performer is Birla CorporationLtd. and the worst performer is Burnpur Cements Ltd. Since wehave selected four ratios we need observations for at least fivetime points for estimating the dispersion of the system. Wehave taken five years data from 2004 to 2008 for the two extremeperformers and are given in Table 2 and Table 3.
Corresponding dispersion matrices of Birla Corporation Ltdand Burnpur Cement Ltd are given below:
Ye a r s2 0 0 8 2 0 0 7 2 0 0 6 2 0 0 5 2 0 0 4
R a t i o s
Debt Equity Ratio 0.34 0.54 0.76 0.82 1.01
Current Ratio 0.87 0.81 0.87 0.98 0.93
Interest Turnover Ratio 11.62 14.44 13.72 12.97 11.39
Interest Coverage Ratio 27.18 25.92 11.58 5.32 2.46

SCMS Journal of Indian Management , April - June, 2010. 84
A Quarterly Journal
The threshold value can be obtained as
The corresponding discriminating equation is given by
Where:
:1x is the Debt Equity Ratio
:2x is the Current Ratio:3x is the Interest Turnover Ratio
:4x is the Interest Coverage Ratio
Fur ther, i s the
mean vector of the financial ratios of the best company as perprofitability measure.
i s the mean
vector of the financial ratios of the worst company as perprofitability measureHence
and
Table 4: Showing Discriminant Scores of all the 8 Ccompanies under Study
Name of the Data for the year 2008Companies Debt Current Interest Interest Threshold Discriminant
Equity Ratio Turnover Coverage Value ScoreRatio Ratio Ratio
Bir la Corporat ion Ltd. 0.34 0.87 11.62 27.18 - 44.94 31.71
Jaiprakash Associates Ltd 2.14 1.21 3.31 3.21 - 126.78 - 50.13
Mangalam Cement Ltd 0.41 1.24 9.30 48.40 - 118.21 - 41.56
Chettinad Cement Corpn. Ltd 1.02 0.55 9.06 13.58 - 14.21 62.44
J K Cements Ltd 0.84 1.85 12.99 7.77 - 144.57 - 67.92
Madras Cements Ltd 1.43 0.67 12.62 12.76 - 4.38 72.27
Ultra Tech Cement Ltd 0.74 0.65 12.05 20.91 - 11.04 65.61
Burnpur Cement Ltd 0.49 1.89 16.56 2.06 - 122.62 - 45.97
Table 5: Showing Rank Correlation based on Profitability Measure and Discriminant Score
Name of the Companies Rank (R1) based on Rank(2) based onprofitability measure discriminant score
Bir la Corporation Ltd. 1 4Jaiprakash Associates Ltd 7 7Mangalam Cement Ltd 2 5Chettinad CementCorporation Ltd 6 3J K Cements Ltd 5 8Madras Cements Ltd 3 1Ultra Tech Cement Ltd 4 2Burnpur Cement Ltd 8 6

SCMS Journal of Indian Management , Apr i l - June, 2010. 85
A Quarterly Journal
We have calculated Fisher ’s linear discriminating function usingmean vector and pooled dispersion matrix of Birla Corporation
Ltd. and Burpur Cements Ltd. Thereafter, using this thresholdvalue we have evaluated the discriminant scores and are given
in Table 4.
On the basis of these discriminant scores we have rankedthese eight companies and the related information is given in
Table 5.
Now given the two sets of ranks we have examined theircompatibility by taking course of Spearman’s rank co-relation.
The correlation we have obtained is 0.6 which is on the higherside. Thus we can claim that the composite financial measure
proposed herein can be used to describe the organizationalperformance and help the investors in making judicial investment
decisions.
Key words: Discriminant analysis, Debt equity ratio, Inventoryturnover ratio, Current ratio, Interest coverage ratio, and Rank
correlation.
References
Altman, Edward. “Financial Ratios, Discriminant Analysis andthe Prediction of Corporate Bankruptcy.” The Journalof Finance. September, (1968): 589-609.
Beaver, W. “Financial Ratios As Prediction Of Failure. EmpiricalResearch in Accounting: Selected Studies.” Journalof Accounting Research. 4(3), (1966): 71-111.
Charabji, Hamdi., Mrrash. “Predicting the Government’s Decisionto seek Rescheduling of External Debt.” The ICFAIJournal of Applied Research. ICFAI Press. 1993.
Deakin, E.B. “Discriminant Analysis of Predictors of BusinessFa i lu res . ” Journa l o f Account ing Research .(Spring).1972.
Johnsen, T. , and Mel icher, R .W. “Predict ing CorporateBankruptcy and Financial Distress: Information ValueAdded By Multinomial Logit Models.” Journal ofEconomics and Business. 46(4), (1994): 269-286.
Lev, B. F inancial Statement Analysis A New Approach.Englewood Cliffs, Printice Hall.1974.
Mohanty, Sahoo. “An Alternative to Crisil Credit Rating: UsingDiscriminant Analysis.” The ICFAI Journal of AppliedResearch. ICFAI Press. 2002.
Neophyton, E., and, Molinero, C.M. “Predicting CorporateFa i lure in the UK: A Mul t id iment iona l Sca l ingApproach.” Journa l of Bus iness F inance andAccounting. 31(5/6), (2004). 677-710.
Raj, G.C. “Discriminant Analysis for Lending, “ICFAI: ResearchPapers in Applied Finance.” ICFAI Press. 1999.
Williams, D., Ellis, J. “Comparative Financial Analysis.” CorporateSt ra tegy and F inanc ia l Ana lys i s : Manager ia l ,Accounting and Stock Market Perspectives. FinancialTimes/Pitman Publishing, London, (1993): 203-47.

SCMS Journal of Indian Management , April - June, 2010. 86
A Quarterly Journal
Single and Multiple Expectations:Service Quality Retailing
Ravichandran K., Abdus Samad K., and David Sam Jayakumar G.S.
T h i s a r t i c l e a t t e m p t s t o c o d i f y t h e s e r v i c e q u a l i t y d i m e n s i o n sw i t h i n t h e s c o p e o f t h e O r g a n i z e d R e t a i l i n g S e c t o r i n I n d i a . I t i s ak n o w n f a c t t h a t o r g a n i s e d r e t a i l i n g i s m a k i n g a s t r o n g i m p a c t i nm a n y p a r t s o f I n d i a ' s g r o w i n g e c o n o m y . W i t h r a p i d c h a n g e a n d
e x p a n s i o n i n t h e r e t a i l e n v i r o n m e n t , i t h a s b e c o m e a l l t h e m o r e n e c e s s a r y t o i d e n t i f y a n ds t r e a m l i n e t h e d i f f e r e n t p a r a m e t e r s . T h i s r e s e a r c h a r t i c l e t a k e s u p d i m e n s i o n s l i k e P h y s i c a lA s p e c t s , R e l i a b i l i t y , P e r s o n a l I n t e r a c t i o n , P r o b l e m S o l v i n g a n d P o l i c y w h i c h a c c e s s t h e r e t a i ls e r v i c e e f f e c t i v e u s e r s o f e s p e c i a l l y t h e f o o d r e t a i l e r s . I t a t t e m p t s t o s t u d y t h e G a p s i n t h eS e r v i c e Q u a l i t y a n d p r o p o s e c e r t a i n s o l u t i o n s f o r t h e s a m e . Tw o m o d e l s w e r e p r o p o s e dm a i n l y S i n g l e E x p e c t a t i o n M o d e l a n d M u l t i p l e E x p e c t a t i o n M o d e l a n d t h e s e m o d e l s w e r ef u r t h e r u s e d t o s t u d y t h e G A P s i n t h e S e r v i c e Q u a l i t y o f Fo o d R e t a i l e r s .
I
Abstract
Modelling Gaps
123456789012345678901234567890121234567890123456789012345678901212345678901231234567890123456789012345678901212345678901234567890123456789012123456789012312345678901234567890123456789012123456789012345678901234567890121234567890123123456789012345678901234567890121234567890123456789012345678901212345678901231234567890123456789012345678901212345678901234567890123456789012123456789012312345678901234567890123456789012123456789012345678901234567890121234567890123123456789012345678901234567890121234567890123456789012345678901212345678901231234567890123456789012345678901212345678901234567890123456789012123456789012312345678901234567890123456789012123456789012345678901234567890121234567890123123456789012345678901234567890121234567890123456789012345678901212345678901231234567890123456789012345678901212345678901234567890123456789012123456789012312345678901234567890123456789012123456789012345678901234567890121234567890123123456789012345678901234567890121234567890123456789012345678901212345678901231234567890123456789012345678901212345678901234567890123456789012123456789012312345678901234567890123456789012123456789012345678901234567890121234567890123123456789012345678901234567890121234567890123456789012345678901212345678901231234567890123456789012345678901212345678901234567890123456789012123456789012312345678901234567890123456789012123456789012345678901234567890121234567890123123456789012345678901234567890121234567890123456789012345678901212345678901231234567890123456789012345678901212345678901234567890123456789012123456789012312345678901234567890123456789012123456789012345678901234567890121234567890123123456789012345678901234567890121234567890123456789012345678901212345678901231234567890123456789012345678901212345678901234567890123456789012123456789012312345678901234567890123456789012123456789012345678901234567890121234567890123123456789012345678901234567890121234567890123456789012345678901212345678901231234567890123456789012345678901212345678901234567890123456789012123456789012312345678901234567890123456789012123456789012345678901234567890121234567890123123456789012345678901234567890121234567890123456789012345678901212345678901231234567890123456789012345678901212345678901234567890123456789012123456789012312345678901234567890123456789012123456789012345678901234567890121234567890123123456789012345678901234567890121234567890123456789012345678901212345678901231234567890123456789012345678901212345678901234567890123456789012123456789012312345678901234567890123456789012123456789012345678901234567890121234567890123123456789012345678901234567890121234567890123456789012345678901212345678901231234567890123456789012345678901212345678901234567890123456789012123456789012312345678901234567890123456789012123456789012345678901234567890121234567890123123456789012345678901234567890121234567890123456789012345678901212345678901231234567890123456789012345678901212345678901234567890123456789012123456789012312345678901234567890123456789012123456789012345678901234567890121234567890123123456789012345678901234567890121234567890123456789012345678901212345678901231234567890123456789012345678901212345678901234567890123456789012123456789012312345678901234567890123456789012123456789012345678901234567890121234567890123123456789012345678901234567890121234567890123456789012345678901212345678901231234567890123456789012345678901212345678901234567890123456789012123456789012312345678901234567890123456789012123456789012345678901234567890121234567890123123456789012345678901234567890121234567890123456789012345678901212345678901231234567890123456789012345678901212345678901234567890123456789012123456789012312345678901234567890123456789012123456789012345678901234567890121234567890123123456789012345678901234567890121234567890123456789012345678901212345678901231234567890123456789012345678901212345678901234567890123456789012123456789012312345678901234567890123456789012123456789012345678901234567890121234567890123123456789012345678901234567890121234567890123456789012345678901212345678901231234567890123456789012345678901212345678901234567890123456789012123456789012312345678901234567890123456789012123456789012345678901234567890121234567890123123456789012345678901234567890121234567890123456789012345678901212345678901231234567890123456789012345678901212345678901234567890123456789012123456789012312345678901234567890123456789012123456789012345678901234567890121234567890123
D r. R a v i c h a n d r a n K . , P r o f e s s o r, D e p a r t m e n t o f M a n a g e m e n t S t u d i e s ,M a d u r a i K a m a r a j U n i v e r s i t y , M a d u r a i -6 2 5 0 2 1, E m a i l :r a v i m b a _ m k u @ y a h o o . c o . i n
D r. A b d u s S a m a d K . , P r o f e s s o r and P l a c e m e n t C o - o r d i n a t o r, J a m a lI n s t i t u t e o f M a n a g e m e n t ( J I M ) , J a m a l M o h a m e d C o l l e g e , Tr i c h y –6 2 0 0 2 0 , Ta m i l n a d u , E m a i l : s a m a d _ 7 4 a @ y a h o o . c o m
D r. D a v i d S a m J a y a k u m a r G . S . , A s s t . P r o f e s s o r, J a m a l I n s t i t u t e o fM a n a g e m e n t ( J I M ) , J a m a l M o h a m e d C o l l e g e , T r i c h y – 6 2 0 0 2 0 ,Ta m i l n a d u , E m a i l : g s d s j k 7 7 @ y a h o o . c o . i n
ndia has been rather slow in joining the Organized RetailRevolution that has rapidly transformed the economies inthe other Asian
Countries. Though witha population of a billionand a middle classpopulation of over 400Mi l l ions organizedretailing in the form offood retail chains is stillin its beginning in theCountry. This is largelydue to the excellentfood retailing systemthat was established bythe neighbourhoodKi rana stores thatcontinue to meet withall the requirements ofdaily needs withoutthe convenience ofthe shopping as provi-
ded by the retail chains; and also due to the highly fragmentedfood supply chain that is cloaked with several inter-mediaries
(from farm-processor-dis t r ibutor- reta i ler)resulting in huge valueloss and high costs.Th is supplementedwith lack of developedfood processing indus-try kept the organizedchains out of themarket place. Thecorrection process isnow underway. Bigdaddies of Indiancorporate sectors arenow jumping to esta-bl ish reta i l cha insacross the country. Thesystems are beingestablished for effe-ct ive Bus iness-to-

SCMS Journal of Indian Management , Apr i l - June, 2010. 87
A Quarterly Journal
Business (farmer-processor, processor-retailer) solutions therebyleveraging the core competence of each player in the supplychain.
Spread of Organized Retailing in India
Organized retailing is spreading and making its presence felt indifferent parts of the country. With the entry of very largecorporate houses like Reliance Fresh, Vishal, AV Birla Group,Bharti Walmart Joint Venture and the existing Big Bazaar and RPGSpencer in large scale expansions across the country, the spreadof the organized retail is going to reach soon the smallpopulations towns of one lac to five lacs after covering all big,medium and small cities. The trend in grocery retailing, however,has stated with a growth concentration in the South. Thoughthere were family owned retail chains in South India such asNilgiri’s as early as 1904, the retail revolution happened withvarious major business houses foraying into the starting of chainsof food retail outlets in South India with focus on Chennai,Hyderabad and Bangalore markets, preliminarily. In the Indiancontext, a countrywide chain in food retailing has beenpioneered by Big Bazaar and Reliance Fresh only.
Services Quality Dimensions
The retail environment is changing more rapidly than ever before.It is characterized by intensifying competition from both domesticand foreign companies, a spate of mergers and acquisitionsand more sophisticated and demanding retail shoppers whohave greater expectations related to their consumptionexperiences. Consequently food and grocery retailers todaymust differentiate themselves by meeting the needs of their retailshoppers better than the competition. There is general agreementthat a basic retailing strategy for creating competitive advantageis the delivery of high service quality.
Based on the various sources, this model proposes that retailshoppers to evaluate the food retail service quality the researcherhas identified five different dimensions as follows:
• Physical Aspects• Reliability• Personal Interaction• Problem Solving• Policy
The f ive powerful dimensions assess the retai l service
effectiveness of the food retailers. The above said dimensions
are central to the services quality. At this juncture, the core facts
of the food retail service quality dimensions are discussed below.
Physical Aspects
Physical aspects refer to the appearance of the food retail store;
Physical aspects mean external bodily appearance of the retail
outlet. They also encompass the store ambience to its retail
shoppers. In this hi-tech organized food retail scenario stiff
competition plays a very imperative role in this regard. Physical
aspects have various sub features which contribute to the food
retail services quality. These sub features add to the attire and
appeal of the retail store.
Modern Equipment and Fixtures
Modern equipment and fixtures encompass the usage and
application of the standard devices and softwares which have
to be utilised by the food retailers.
Physical Facilities
Physical facilities explain how the products are visually appealing
to their customers. The store decor is in such a way that it
aesthetically captivates the customers’ attention and lures them
again and again.
Good Looking Shopping Material
It refers to the materials such as shopping bags, trolleys and
other purchase materials that have a good personality.
Attractive and Convenient Public Areas
In this modernised world, the customers expect very clean and
posh public areas. Only then the customers will have store
patronage and regular visits would be carried out.
Easy Accessibility
Easy accessibility justifies the ease to access of the food retail
store. The stores should be a stone’s throw away from the
residential areas and should be easily accessed from any
landmark.
SCMS Journal of Indian Management , April - June, 2010. 88
A Quarterly Journal
Easy Internal Mobility
It refers to the movement of customers within the store. Thefood retail should not be congested, and it should have an easycustomer traffic flow within its retail outlet.
Personal Interaction
Personal interaction is about the employee rapport with thecustomers. The food retail store employees must have an affinitytowards their end-users. They should be more understandingon what is being preferred by the customers. They should knowthe needs of the customers instinctively.
Employees’ Knowledge
This feature exercises the human resource potential. Theemployees must have the know-how and the capacity to answercustomer queries. The employee should give quick andconvincing answers in a pleasing manner.
Employees Confidential Behaviour
Employees play a core role in a food retailer store. The serviceemployees have to instill confidence on the customers throughtheir personal attitude and behaviour. This feature attracts morenumber of customers to the retail corporate.
Security in Transactions
The food retailers must provide safe keeping for the buyerswho use their food retail brands. They must provide safety tothe dealings of the customers and this will improve theconfidence on the retail store.
Performing Prompt Services
Performing prompt services refer to the punctuality of theemployees in what they deal with. The employees should notcause any delay in the transactions. Time is the essence ofmodern day shopping.
Performing Exact Services
Exact services render to the accuracy of the retail store. Theyare literal in their transactions what they provide is in tune with
the requirement of the customer. This is vital to customersatisfaction.
Immediate Response to Customer Request
Responsiveness is the strength of the employees. They giveright responses to the queries and doubts posed by thecustomers. This results in a positive outcome as the customerunderstands the professionalism and competency of the store.
Individual Caretaking
The food retail store has to provide specific attention to thepatrons who are loyal to it. Customer loyalty helps the store togrow and the more customers who are loyal to it; the more isthe store’s growth.
Courteousness of Employees
The human capital should have considerations towards thecustomers of the food and grocery retail entity.
Courteous Communication
Courteous communication identified the chivalrous mannerismsof the employees in the food retail chains. This feature is one ofthe most important communicative tools when they speakthrough telephone to customers communicating is at its bestthrough the usage of the polite sounds and the tone of thevoice which is soft and pleasing. Courteousness comes to thefore in this.
Reliability
Reliability focuses on the trustworthiness of the food retailersfrom customers’ point of view. Reliability can be said to be thedependability of the buyers towards the retail store. This factoremphasises on the customers’ consistency, because they areasset of the retail organisation.
Promising Services
When the store promises to do something it has to be carriedout. This is called as promising services. Commitment is thecore of retail services and it can be neglected only at the cost oflosing customer confidence.

SCMS Journal of Indian Management , Apr i l - June, 2010. 89
A Quarterly Journal
Time Promising Services
Time promising services refer to the accuracy of the particularservices which must be executed at the right time. There mustnot be any flaws in the time promising services.
Doing it Right
The retail store performs the services at the first and foremosttime. Here, they should very careful in executing the transactionswhich must be done first. A coherent and consistent executionplan is the backbone to this feature.
Supply of Right Products
This sub feature submits the quality variables of availability ofmerchandise. The food retailers have to supply the preciseproducts to the customer which he/she likes. This service qualityelement educates the retailer in retaining the customer. Thiselement protects the switching tendency of the end-user.
Error Free Transactions
This sub feature applies the stress on the commitment of blunderfree sales transactions. The sales of the produce should becarried out very smoothly without any chaos in it. The recordsof the product sales should be maintained with due care inorder to avoid the future problems.
Problem Solving
The next factor in the measuring retail service quality is theproblem solving factor. Problem solving refers to how thecustomer tribulations have been taken with specific interest infinding out the possible retail solutions. This factor has moreweightage when compared with the other factors. If harm hasbeen identified in a retail store, it has to be instantly rectified bythe store management. This factor strengthens the retail storeeffectiveness and put it forth in a premier status. The customerof the food retail store perceives the nature of problem solvingas good and poor.
Returns and Exchanges
Returns and exchanges pass on the quality components ofhandling the exchange of products and replacements. If there is
any damage in the food products variety, the replacement ofthe product items must be carried out in a right manner.
Sincerity in Problem Solving
It is a must to maintain specific interest in solving the issues ofthe customers which they have. Buyer’s problems are recognisedand immediate action is taken.
Handling Customer Compliance
Whenever a customer faces problems, the human resource reactsdirectly to the situation concerned. The employee has to attendto the buyer’s grievances without any delay and postponement.This leads to customer loyalty as he/she perceives the stores’professional attitude and appreciates the commitment of theemployees.
Policy
The fifth dimension in evaluating the retail service quality of thefood retailers is policy. Policy applies a stress on the superiormerchandise which has to be dealt by a retail store. Excellencein quality of the products is the core theme for a food andgrocery retailer. The food retailers have to take initiative in sellingcommodities which are of the branded nature. On the otherhand, the retailers can sell the goods in their own name itself.This is termed as private brands or private labels. The nature ofpolicy is perceived as good or poor from the customers’predictions.
The forthcoming are the sub-elements of the policy dimension:
Offering Quality Products
Offering quality products indicates the high quality merchandiseof the retail store in action. The product which is branded in thestore name has more welcome from feature as it reinforces thename and image of food retail store.
Convenient Parking Facilities
The element reveals the spacious parking facilities provided bythe retail store, in order to draw larger number of customers.This feature also elaborates the customer centric philosophy.As parking spaces get more cramped in cities, it is the duty of

SCMS Journal of Indian Management , April - June, 2010. 90
A Quarterly Journal
the retail store to provide adequate parking facilities that canlead to customer delight.
Convenient Operating Hours
This element includes the operating hours according to thebuyers’ preferences. The time should be made convenient to allbuyers respectively.
Acceptance of Credit Cards and OfferingMembership Cards
Acceptance of all the banking and financial companies’ creditsaves the valuable time of the end-users at large.
To end with, this hierarchical factor structure paves the right wayfor the retail service quality of the food retailers and it also takesoff the branded nature of the store brands in a superior manner.The sub-elements also contribute to the organised retail spaceat the maximum extent.
Review of Literature
Dinesh Kumar Gauri, (2008), two powerful, highly effectivestrategic tools that retailers possess dealing with involves pricingand store format decisions. From the several strategic choicesavai lable for each decision, a retai ler can choose anycombination. We focus on two gaps in the literature. First, bothdecisions are specific to the consumers to whom the storescater and the environments within which they operate, yet littleacademic research study is noted in them. Thus, it is importantto determine the joint effects of considering pricing and formatdecisions in a single framework. Second, do retailers, privy tofindings from rich prior literature pertaining to consumer storechoices related to their pricing and format preferences; actuallytake such information into account when making strategicchoices. Lun Hou (2008), studied to construct a gap model fordual customer values. A basic description of customer values isgiven, and then the gaps between products and services indifferent periods for the customers and companies are analyzedbased on the product or service life-cycle. The main factors thatinfluence the perceived customer value were analyzed to definethe “recognized value gap” and a gap model for the dualcustomer values was constructed to supply companies with atool to analyze existing customer value gaps and improvecustomer relationship management. Ann Marie Fiore (2007) –
empirically studied that shopping experience was expanded.Reflecting the integrative (experiential and utilitarian) nature ofshopping experience, he aims to propose an overarchingstimulus-organism-response based shopping experienceframework. He offers a framework that integrates componentsof both the hedonic experience related consciousness-emotion-value model and the utilitarian experience-related cognition-affect-behaviour model. Tomas Palaima, et. al. (2006) recognisedthe value of close relationships with their customers becausecustomer retention in intensifying competition is more and moreimportant. He analyses services quality in the new relationshipmarketing paradigm. The article focused on Anglo-Australianapproach to relationship marketing. This research approachesthe integration of quality management, services marketingconcepts and customer relationship economics are emphasized.The different services quality models are analyzed in order todetermine how these models are adequate to changingrelationship marketing paradigm. The Adequacy of service qualityGAP model, the perceived service quality model and theGummeson 4Q model of offering quality is analyzed. The analysisreveals that service quality models and instruments are limited toevaluation of a service episode and are static while relationshipmarketing paradigm requires dynamic approach which couldhelp to assess service quality in long-term perspective alongwith other relationship quality dimensions. Michel Laroche (2005)indicated that consumers’ evaluations of service quality in ashopping environment mediate their pleasure and purchaseintention. Consumer mall shopping decision-making process isinvariant across English and French Canadian consumers. Practicalimplications for researchers who are interested in understandingconsumer mall shopping behaviour cross-culturally, this researchprovides a model that can be tested in cross-cultural contexts.For mall operators and store managers attempting to improvethe mall environment, product quality, and offer better service,the study provides interesting solutions. Originality/value – Byincorporating service quality into consumer mall shoppingdecision making, this research has demonstrated that consumers’moods evoked by their perceptions of shopping mallenvironment and of product quality influence their purchaseintentions through their perceptions of service quality. The mallshopping decision-making process of English and FrenchCanadian consumers is universal, regardless of their culturalorientations. Dirk Morschett, et.al., (2005), developed aframework for competitive strategies in food retailing. Managersof food retail channels were surveyed in order to derive thebasic dimensions of competitive advantages that companies
SCMS Journal of Indian Management , Apr i l - June, 2010. 91
A Quarterly Journal
attempt to achieve in this industry sector. In a second studybased on consumers, the central dimensions of retail storeperception were investigated. Both studies reveal that three basictypes of competitive advantage seem to prevail in food retailing:(1) price, (2) quality (with a comprehensive set of quality-orientated instruments, including customer service), (3)convenience. We find quality leadership and price leadership tobe independent factors which can be achieved withoutconflicting with one another. Prem Vrat, et. al., (2005), criticallyappraised various service quality models and identifies issuesfor future research based on the critical analysis of literature. Thearticle critically examines 19 different service quality modelsreported in the literature. The critical review of the different servicequality models is intended to derive linkage between them, andhighlight the area for fur ther research. The review of variousservice quality model revealed that the service quality outcomeand measurement is dependent on type of service setting,situation, time, need etc. In addition to this even the customer’sexpectations towards particular services are also changing withrespect to factors like time, increase in the number of encounterswith a particular service, competitive environment, etc. This articleprovides a rich agenda for future research in the subject. GordonFullerton (2005) has produced two schools of thought on thecause of customer loyalty in services industries. The servicequality perspective puts forward that service quality evaluationssubstantially drive customer loyalty in services industries. Therelationship marketing perspective puts forward that customercommitment to the service provider substantially drives customerloyalty in services industries. In addition, commitment is acomplex construct with at least two forms, one based in likingand identification (affective commitment) and one based independence and switching costs (continuance commitment).These positions were examined in an integrated model of retail–service relationships. Nor Khalidah Abu (2004), identified theslow growth of grocery products in Malaysia since the Asianfinancial crisis and the influx of multinational and large scaleretailers since early 1990s that allowed Malaysian consumers tobe more selective of their choice of grocery stores. Despitethe extensive research on the measures used by consumersto measure service quality in the service sector, there is lackof empirical studies on it in the retail sector. A need to look intoservice quality dimensions for each country is called for, as eachcountry is believed to have its own unique set of qualitydimensions. This conceptual study identified the service qualitydimensions critical to urban grocery shoppers for small, medium,and large-sized grocery stores. It identified the critical quality
dimension of Malaysia urban grocery shoppers based on theRetail Service Quality Scale by Dabholkar et al., (1996) that takesinto account the retail setting. The instrument was modifiedbased on literature review. Sanjay K. Jain (2004), recognizedquality as a strategic tool for attaining operational efficiency andimproved business performance. This is true for both the goodsand services sectors. However, the problem with managementof service quality in service firms is that quality is not easilyidentifiable and measurable due to inherent characteristics ofservices which make them different from goods. Variousdefinitions of the term ‘service quality’ have been proposed inthe past and, based on different definitions; different scales formeasuring service quality have been put forward. SERVQUALand SERVPERF constitute two major service quality measurementscales. Empirical studies evaluating validity, reliability, andmethodological soundness of service quality scales clearly pointto the superiority of the SERVPERF scale. The psychometricsoundness and greater instrument parsimoniousness shouldemploy the SERVPERF scale for assessing overall service qualityof a firm. The SERVPERF scale should also be the preferredresearch instrument when one is interested in undertaking servicequality comparisons across service industries. On the other hand,when the research objective is to identify areas relating to servicequality shortfalls for possible intervention by the managers, theSERVQUAL scale needs to be preferred because of its superiordiagnostic power. Anne Magi (2002), perceived the servicequality and labour productivity are assumed to be positivelyrelated to profitability, but a possible trade-off effect betweenthese two phenomena could distort these relationships. In anexploratory study, measures of perceived service quality,customer satisfaction and patronage behaviour were collectedfrom customers in four Swedish grocery stores, representingfour combinations of profitability and productivity. Richard A.Spreng (2002), perceived service quality and satisfaction havegenerally been conceptualized to be distinct constructs, butthere isn’t a good understanding of their relationship. While thetwo constructs are very similar, little research has empiricallyexamined the distinction. This study discusses the conceptualarguments for the distinction, and examines the empiricaldistinction by testing a recently proposed model of servicequality and satisfaction. Results indicate that the two constructsare, in the present case, distinct, and there is some support forthe model, with several modifications. Michael K. Brady, et. al.(2002), described in this study replicates and extends the Croninand Taylor study suggestion that service quality be measuredusing a performance-only index (SERVPERF) as opposed to the

SCMS Journal of Indian Management , April - June, 2010. 92
A Quarterly Journal
gap-based SERVQUAL scale. The intent of the research was toexamine the ability of the performance-only measurementapproach to capture the variance in consumers’ overallperceptions of service quality across three studies. The originalCronin and Taylor data were obtained and a replication of theirstudy was undertaken using a recursive form of their non-recursive model in an effort to avoid the abnormal parameterestimates they reported. The replication successfully duplicatedtheir finding as to the superiority of the performance-onlymeasurement of service quality. Frederick A. Frost (2000),Explored the extent to which the construct service quality playsin an internal marketing setting. A conceptual model known asthe “Internal Service Quality Model” was designed based on theoriginal “GAP Model” developed by Parasuraman. The modelevaluated the dimensions, and their relationships, that determineservice quality among internal customers (front-line staff) andinternal suppliers (suppor t staff) within a large serviceorganisation, namely, Singapore Airlines. The dependent variablein this study was internal service quality (ISQ), while theindependent variables were tangibility, reliability, responsiveness,assurance, and empathy. The results suggest that the perceptionsand expectations of internal customers and internal suppliersplay a major role in recognising the level of internal service qualityperceived. Niren Sirohi, et.al. (2000), slow growth and intensecompetition in retail markets in recent years increases the needfor retailers to use strategies focused on retaining and attractingthe right customers. However, a strategy that is effective inacquiring new customers may not be the most effective inretaining current customers. In order to understand theeffectiveness of activities designed to retain customers, we studythe store loyalty intentions of current customers for a multi-storegrocery retailer. Using Partial Least Squares, on data averagedacross at least 100 customers per store for each of about 160stores, we find that service quality is by far the most criticaldeterminant of merchandise quality perception. Perceived valuefor money depends on perceived relative price and salespromotion perceptions and to a lesser extent on service qualityand merchandise quality perceptions. Rodolfo Vazquez, et. al.(2000), attempted to clarify and extend the conceptualizationand measurement of service quality in the retail environment.The review of the retail and service quality literatures and thefindings from a qualitative study conducted by the authors revealthat service quality in retail companies adopting the commercialformat of supermarkets has a four factor structure (physicalaspects, reliability, personal interaction and policies). Various
models are tested by means of confirmatory factor analysis and
a measurement scale is proposed. . . . . Olivier Furrer, et. al., (2000),
The authors argue that perceptions of service quality vary across
cultural groups, as defined by each culture’s position on
Hofstede’s dimensions. They explicitly map the relationship
between service quality perceptions and cultural dimension
positions and draw the implications for international service
market segmentation. They also test the hypotheses constituting
their theoretical analysis. They show that the importance of
SERVQUAL dimensions is correlated with Hofstede’s cultural
dimensions. They also used the correlation coefficients to
compute a Cultural Service Quality Index that could be used to
segment international service markets and allocate resources
across segments. Pratibha A. Dabholkar (2000), studied the
factors relevant to service quality are better conceived as its
antecedents rather than its components and that customer
satisfaction strongly mediates the effect of service quality on
behavioural intentions. The ar ticle discusses the application of
this chronological framework in understanding and predicting
service quality and its consequences. The study also finds that
perceptions and measured disconfirmation offer several
advantages over computed disconfirmation (i.e., difference
scores), and that a cross-sectional measurement design for
service quality is preferred to a longitudinal design. The ar ticle
discusses the implications of these findings for practitioners
and for future research on service quality. Josee Bloemer (1999),
argued that the relationship between perceived service quality
and service loyalty is an issue which requires conceptual and
empirical elaboration through replication and extension of
current knowledge. The study focuses on the refinement of a
scale for measuring service loyalty dimensions and the
relationships between dimensions of service quality and these
service loyalty dimensions. The results of an empirical study of a
large sample of customers from four different service industries
suggest that four dimensions of service loyalty can be identified:
purchase intentions, word-of-mouth communication; price
sensitivity; and complaining behaviour. Donald J. Shemwell
(1998), studied and empirically tested a model of relationships
among service quality, satisfaction and selected behavioural
outcomes. Par ticular attention was paid to delineating the
cognitive aspects of the service provider-consumer relationship
from the affective, emotive factors. Using doctor-patient
relationships in Turkey as the study setting, results of a LISREL
analysis suggest that the affective aspects of satisfaction have

SCMS Journal of Indian Management , Apr i l - June, 2010. 93
A Quarterly Journal
more impact than cognitive factors on patients’ propensity tocontinue the relationship. The most critical managerial implicationof the study findings is that doctors need to place more emphasison the functional (how it is done) aspects of care giving thanthe technical (what is done) ones. Robert F. Hurley (1998),Customer satisfaction and service quality measures obtainedthrough consumer surveys invariably have skewed distributions.As such, researchers have questioned the appropriateness ofthe popular approach of using the mean rating to summarizesuch data. The relative validity of the various indexes that can beused to summarize consumers’ service quality ratin is examined.Jillian C. Sweeney, (1997), examined the way in which servicequality at the point of purchase influences consumers’perceptions of value and willingness to buy. Two alternativetheoretically justifiable models were compared. Consumerperceptions of a specific service encounter were collected fromtwo samples of shoppers who were actively searching for anelectrical appliance. The results obtained indicated that asalesperson’s knowledge influenced consumer perceptions ofproduct quality, while the manner of the salesperson, althoughinfluencing willingness to buy indirectly through productknowledge also had a direct effect, independent of productevaluation, on willingness to buy. Fur ther, it was found thatperceptions of service quality during a service encounterinfluenced consumers’ willingness to buy more than didperceptions of product quality. Bell J et. al. (1997) used thecritical incident technique to identify and explore dimensionsof service quality in food retail operations. Personal interviewsgenerated 792 positive and negative incidents which were thencategorized into six groups as follows: physical environment,mechandise-related, non-core services, interpersonal, processand price. The key findings confirm that recent emphasis byoperators on improving customer service has been effective toa degree. This is apparent in the high level of positive incidentsin the interpersonal group. However, the findings also indicate arelative neglect of the shopping process. This category generatesby far the greatest number of negative incidents. Nick Johns(1996) described the development and evaluation of aquestionnaire analogous to the SERVQUAL instrument ofParasuraman, Zeithaml and Berry in order to assess theperformance of a contract catering service in relation to itscompetitors. Although reliability criteria for the instrument wereencouraging, the factor structure identified by previousresearchers was found not to be present in the catering industry.Other considerations such as food and the attitudes of staffplayed a more important part in the meal experience. The nine
study sites were evaluated on the basis of mean item scores,by Discriminant and factor analysis and by multi-dimensionalscaling.
Objectives
1. To Study the Gaps in the services quality of foodretailers.
2. To scrutinize the impact of independent expectationvariables on the dependent perception variables.
3. To propose and model the Gaps of food retailers.
Hypothesis (H0)
1. Single expectation need not influence the singleperception of customers.
2. Multiple expectations need not influence the singleperception of customers.
Data Analysis and Modeling
To study the GAPs in the service quality of the food retailers theresearcher prepared a questionnaire based on Dabholkar (1996)et.al, where he has included 28 SERVQUAL items classified underthe five dimensions of service quality. These items were includedto understand the expectations as well as the experiences ofrespondents anchored at the Five Point Liker t’s Scale. Theresearcher had selected at convenience 80 respondents fromfour food retail stores and distributed the questionnaires to 20respondents in each retail outlet.
Reliability of Items
In order to find out the internal consistency of the 28 servicequality items, the measure of Cronbac’s Alpha was utilised. Theresult of the Cronbac’s Alpha suggested that the overall reliabilityco-efficient of the service quality of the expectation andexperience scale was 92.9 percent and 95.3 percent respectively.This shows that the service quality items were highly reliable(greater than recommended level of 0.6) and achieved theinternal consistency. Similarly, the researcher has also verifiedthe reliability of the service quality under five different factors forthe expectations and the experience scale. The following tableshows the factor-wise reliability of the service quality items:

SCMS Journal of Indian Management , April - June, 2010. 94
A Quarterly Journal
Result of Cronbac’s Alpha
Dimensions No. of Items Expectations Experience
Physical Aspects 6 0.891 0.922
Personal Interact ion 9 0.629 0.841
Rel iabi l i ty 5 0.889 0.813
Problem Solv ing 3 0.824 0.622
Policy 5 0.791 0.548
Overall 28 0.929 0.953
Result of Hotell ing’s T 2 Test
Dimensions No. of I tems Expectations Experience
Phys ica l Aspects 6 32.066* 22.649
Persona l In teract ion 9 14.701 34.794*Rel iabi l i ty 5 5.714 10.414**Problem Solv ing 3 1.004 5.098Pol icy 5 8.041 10.872**Overa l l 28 107.290* 130.867* * S ign i f icant a t 1% leve l , **S ign i f icant a t 5% leve l
Equivalence
Hotelling’s, T2 test was utilised to find the difference in themeans among the service quality items for the expectation andexperience scale. The result of the Hotelling’s T2 Test confirmsthat there is a significant difference among the means of variousservice quality items for expectation and experience scalestatistically at one percent and five percent level. This showsthat the service quality items differed among each other andthey conveyed difference in their meaning. Similarly the researcherhas also verified the Equivalence of Service Quality items underfive different factors and the results are as follows:
For the purpose of modeling the Gaps in the food retail servicesquality the researcher utilized simple and multiple step-wiseregression analysis by using SPSS 17.0. At the first stage theresearcher assumed all the variables in the retail service qualitydimensions followed the multivariate normal distribution. Basedon this in the second stage, the gap modeling was proposed.
Gap Modeling
Parasuraman (1983), et.al proposed the famous traditional Gap
equation as the difference between perception and expectation.
Mathematically it can be written as
G = P – EG = P – EG = P – EG = P – EG = P – E ————— (1)————— (1)————— (1)————— (1)————— (1)
G G G G G – Gap PPPPP – Perception EEEEE – Expectation
Equation (1) for the ith sample of observation as
GGGGGi i i i i = P= P= P= P= Piiiii – E – E – E – E – Eiiiii ————— (2) ————— (2) ————— (2) ————— (2) ————— (2) Where i = 1 to n
In equation (2), the researcher assumed the perception (Pi) ~
n and expectation (Ei) ~ n also they are
independent random var iables, then Gap (G i) ~ n
. This is proved by the mathematical
expectation for the sample of observations.

SCMS Journal of Indian Management , Apr i l - June, 2010. 95
A Quarterly Journal
Taking mathematical expectation on both side to equation (2)
we get
E(Gi) = E(Pi) - E(Ei) —— (3)
Where E(Gi) = G E(Pi) = P E(Ei) = E
G P E are the mean of the Gap, Perception and Expectation
respectively.
Take equation (2) and (3), subtract equation and taking
mathematical expectation on both sides we get.
Gi - E(Gi) = (Pi - E(Pi)) – (Ei – E(Ei))
[Gi - E(Gi)]2 = [Pi - E(Pi)]
2 + (Ei – E(Ei))2 - 2 (Pi - E(Pi) (Ei – E(Ei)
E(Gi - E(Gi))2 = E[Pi - E(Pi)]
2 + E(Ei – E(Ei))2 - 2 E(Pi - E(Pi)) (Ei –
E(Ei))
If Pi and Ei are independent, (r = 0), then
If Pi and Ei are correlated ( r ‘“0) then the variance of Gap score
is equal to
This is the co-variance (or) correlated model of Gap.
Single Expectation Model
From equation (1), the Gap is denoted as
Gi= Pi – Ei , i = 1 to n.
Pi = Ei + Gi ——————(5)
Equation (5) is a modified version of famous linear equation of
a straight line
Pi = + Ei + Gi ——————(6)
From (6), when = 0 and = 1, then the equation is reducedto traditional gap equation. Here in (6) Gi is not just the differencebetween the perception and expectation; it is an unobserved
random variable followed a normal distribution, Gi ~ n .
Gi is a random error term, unobserved and it is uncorrelated withEi, E(EiGi) = 0. Equation (6) clearly explains, there exist afunctional relationship between the expectation and perceptionof customers. Expectation of customer is truly influenced theirperception and Gap is formed when their expectation fails tounexplain the variation in the perception. The theory ismathematically denoted by
p = f(E) +G
perception = f(Expectation) + Gap
E (P) = + E(E), where E(G)=0
V(P) = 2 V(E) +V(G)
V(G) = V(P) – 2 V(E)
Double Expectation Model
PY = f(EX1, EX2) + G
PYi = + 1 EX1i + 2 EX2i + Gi
E(PY) = = + 1 E(EX1) + 2 E(EX2)
V(PY) = 1V(EX1) + 2V(EX2)+ 2 1 2 cov(EX1, EX2)+ V(G)
V(G) = V(PY) - ( 1V(EX1) + 2V(EX2)+ 2 1 2 cov(EX1, EX2) ))
Multiple Expectation ModelPY = f(EX1, EX2, EX3,……...... EX n-1, EXn) +G
PYi = + i EX1i + G
P(PY))))) = i V(EXi) + 2 i j Cov (EXi, EXj) +V (G),
V(G) = V(PY) - ) - ) - ) - ) - i V(EXi) + 2 i j Cov (EXi, EXj).
Results of Single Expectation Model
The table shows the influence of independent expectationvariables under the dimension Physical Aspects on theirrespective perception variables. The results of the analysis pointout, if the expectation about the modern equipment and fixturesin the retail stores change by one unit then their perceptiongoes up by 0.833 units. On the other hand if their expectation
—— (4)
2 2
2 2
i =1
n
i =1
n2
i =1
n
j =1
n
i =1
n 2
i =1
n
j =1
n

SCMS Journal of Indian Management , April - June, 2010. 96
A Quarterly Journal
about the modern equipment and fixtures is nil then theirperception score is equal to 0.562 units. Moreover, theregression coefficients 0.562 and 0.833 are statistically significantby the t-ratio at one percent level. The R Square is greater than0.75 which shows the expectation regarding the modern
Results of Single Expectation Model
Impact of Expectation Variables on Perception Variables in Physical Aspects
Dependent Perception / Independent Expectation Variable V(P) 2 V(E) V(G)Modern Equ ipment and F i x tu res a 0.562* 0.833* 1.179 0.936 0.243Phys ica l Fac i l i t ies 0.473* 0.842 1.729 0.866 0.862Good Look ing Shopping Mater i a l s 0.465** 0.780* 1.455 0.939 0.516At t ract i ve and Conven ient Pub l ic Areas 1.482* 0.517* 1.138 0.414 0.724Easy Access ib i l i t y 0.653** 0.710* 1.107 0.465 0.643Easy In te rna l Mobi l i t y 1.136* 0.652* 1.147 0.560 0.588 * t – r a t i o s i g n i f i c a n t a t 1 % l e v e l a R S q u a r e > 0 . 7 5
* * t – r a t i o s i g n i f i c a n t a t 5 % l e v e l
equipment and fixtures explained a variation of more than 75percent in the perception of customers. Moreover, the V (G)(0.936) is less than 2V (E) (0.243) which shows the expectationof customers explained maximum variation in their perception.The interpretation is vice versa for the remaining variables.
The ta b l e s h o w s t h e i n f l u e n c e o f i n d e p e n d e n texpectat ion var iables under the dimension Rel iabi l i ty ontheir respect ive percept ion var iables. The resul t of theanalys is cal l at tent ion to, i f the expectat ion about thepromis ing serv ices in the reta i l stores changes by oneunit then their percept ion goes up by 0.731 units . Onthe other hand, i f their expectat ion about the promisingserv ices is n i l then their percept ion score is equal to0.874 units. Moreover, the regression coeff icients 0.874
and 0.731 are stat ist ica l ly s igni f icant by the t-rat io at 1percent level . The R Square is greater than 0.75 whichshows the expectat ion regarding the promising servicesexpla ined a var iat ion of more than 75 percent in theperception of retai l buyers. Moreover, the V (G) (0.387)is less than 2V (E) (1.087) which shows the expectationof cus tomers exp la ined max imum va r i a t ion in the i rpercept ion. The in terpreta t ion i s v ice versa for theremaining var iables.
Impact of Expectation Variables on Perception Variables in Reliability
Dependent Perception / IndependentExpectation Variable V(P) 2 V(E) V(G)Promis ing Serv ices a 0.874* 0.731* 1.474 1.087 0.387
Time Promis ing Serv ices 1.186* 0.560* 1.081 0.407 0.674
Doing i t R ight 1.380* 0.623* 1.305 0.455 0.850
Supply of R ight Products 2.185* 0.334** 2.057 0.151 1.906
Er ror Free Transact ions 0.767** 0.733* 1.368 0.547 0.820
* t – r a t i o s i g n i f i c a n t a t 1 % l e v e l a R S q u a r e > 0 . 7 5
* * t – r a t i o s i g n i f i c a n t a t 5 % l e v e l

SCMS Journal of Indian Management , Apr i l - June, 2010. 97
A Quarterly Journal
The table illustrates the influence of independent expectationvariables under the dimension Personal Interaction on theirrespective perception variables. The result of the analysisindicates, if the expectation about the employees’ knowledgein the retail stores changes by one unit then their perceptiongoes up by 0.579 units. On the other hand if their expectationabout the modern equipment and fixtures is nil then theirperception score is equal to 1.088 units. Moreover, the regression
coefficients 0.579 and 1.088 are statistically significant by thet-ratio at one percent level. The R Square is less than 0.75 whichshows the expectation regarding the employees’ knowledgeexplained a variation of less than 75 percent in the perceptionof customers. Moreover, the V (G) (1.067) is greater than 2V(E) (0.387) which shows the expectation of customersexplained minimum var iat ion in their perception. Theinterpretation is vice versa for the remaining variables.
I m p a c t o f E x p e c t a t i o n Va r i a b l e s o n P e r c e p t i o n Va r i a b l e s i n P e r s o n a l I n t e r a c t i o n
D e p e n d e n t P e r c e p t i o n / I n d e p e n d e n tE x p e c t a t i o n Va r i a b l e V(P) 2 V ( E ) V(G)E m p l o y e e s K n o w l e d g e 1.088* 0.579* 1.454 0.387 1.067
E m p l o y e e s C o n f i d e n t i a l B e h a v i o u r 1 .537* 0 .452* 1.390 0.357 1.033
S e c u r i t y i n Tr a n s a c t i o n s 3 .123* 0.107 2 .960 0 .023 2 .937
P e r f o r m i n g P r o m p t S e r v i c e s a 0 .327 0.924* 1 .062 0 .824 0 .238
P e r f o r m i n g E x a c t S e r v i c e s 0 .840* 0 .710* 1.525 0.648 0.876
I m m e d i a t e R e s p o n s e t o C u s t o m e r R e q u e s t 0 .794* 0 .691* 1.387 0.678 0.709
I n d i v i d u a l C a r e Ta k i n g 3 .120* 0.007 1 .043 0 .001 1 .042
C o u r t e o u s n e s s o f E m p l o y e e s 1 .027* 0 .601* 1.033 0.328 0.705
C o u r t e o u s C o m m u n i c a t i o n 1 .466* 0 .568* 1.178 0.381 0.797
* t – r a t i o s i g n i f i c a n t a t 1 % l e v e l a R S q u a r e > 0 . 7 5
* * t – r a t i o s i g n i f i c a n t a t 5 % l e v e l
The table visualises the influence of independent expectationvariables under the dimension Problem Solving on their respectiveperception variables. The result of the analysis indicates, if theexpectation about the returns and exchanges in the retail storeschanges by one unit then their perception goes up by 0.701units. On the other hand if their expectation about the returnsand exchanges is nil then their perception score is equal to0.846 units. Moreover, the regression coefficients 0.846 and
0.701 are statistically significant by the t-ratio at one percentlevel. The R Square is less than 0.75 which shows the expectationregarding the returns and exchanges explained a variation ofless than 75 percent in the perception of customers. Moreover,the V (G) (0.420) is greater than 2V (E) (0.849) which showsthe expectation of customers explained maximum variation intheir perception. The interpretation is vice versa for the remainingvariables.
Impact of Expectat ion Variables on Perception Variables in Problem Solving
D e p e n d e n t P e r c e p t i o n / I n d e p e n d e n tD e p e n d e n t P e r c e p t i o n / I n d e p e n d e n tD e p e n d e n t P e r c e p t i o n / I n d e p e n d e n tD e p e n d e n t P e r c e p t i o n / I n d e p e n d e n tD e p e n d e n t P e r c e p t i o n / I n d e p e n d e n tExpec ta t ion VExpec ta t ion VExpec ta t ion VExpec ta t ion VExpec ta t ion Va r i ab lea r i ab lea r i ab lea r i ab lea r i ab le V ( P )V ( P )V ( P )V ( P )V ( P ) 22222 V (E ) V (E ) V (E ) V (E ) V (E ) V (G)V(G)V(G)V(G)V(G)Re tu rns and Exchanges 0.846* 0.701* 1.268 0.849 0.420
S ince r i t y i n P rob lem So lv i ng 1.764* 0.423* 0.903 0.205 0.698
Hand l i ng Cus tomer Compl i ance 1.816* 0.495* 1.079 0.245 0.834
* t – r a t i o s i g n i f i c a n t a t 1 % l e v e l a R S q u a r e > 0 . 7 5
* * t – r a t i o s i g n i f i c a n t a t 5 % l e v e l

SCMS Journal of Indian Management , April - June, 2010. 98
A Quarterly Journal
The table exhibits the influence of independent expectationvariables under the dimension Policy on their respectiveperception variables. The result of the analysis signifies, if theexpectation about the offering quality products in the retail storeschanges by one unit then their perception goes up by 0.145units. On the other hand if their expectation about the offeringquality products is nil then their perception score is equal to2.883 units. Moreover, the regression coefficients 2.883 and
0.145 are statistically significant by the t-ratio at one percentlevel. The R Square is less than 0.75 which shows the expectationregarding the offering quality products explained a variation ofless than 75 percent in the perception of customers. Moreover,the V (G) (0.987) is greater than 2V (E) (0.025) which showsthe expectation of customers explained maximum variation intheir perception. The interpretation is vice versa for the remainingvariables.
Impact of Expectation Variables on Perception Variables in Policy
Dependent Perception / IndependentExpectation Variable V(P) 2 V(E) V(G)Offer ing Qua l i ty P roducts 2.883* 0.145 1.012 0.025 0.987
Conven ient Pa rk ing Fac i l i t ies 1.160* 0.632* 1.094 0.435 0.660
Conven ient Opera t ing Hours 1.076* 0.609* 1.568 0.433 1.135
Acceptance of Cred i t Cards 1.673* 0.416* 1.235 0.244 0.991
Of fe r ing Membersh ip Cards 3.724* -0.052 2.711 0.005 2.706
* t – r a t i o s i g n i f i c a n t a t 1 % l e v e l a R S q u a r e > 0 . 7 5
* * t – r a t i o s i g n i f i c a n t a t 5 % l e v e l
Above table envisages the dimension-wise results of the multipleexpectation models under the physical aspects. It is inferredthat the expectation of customers about the modern equipmentand fixtures changes by one unit there will be an increase of0.62 units in the perception of customers when other expectationvariables in physical aspects and personal interaction were keptconstant. Moreover, the t-ratio was significant for the regressioncoefficients of the expectation variables such as modernequipment and fixtures (0.62), physical facilities (-0.22),
performing exact services (0.32) and performing prompt services(0.22) are statistically significant at one percent and five percentlevel. Like-wise, the expectation variables under the fivedimensions explained more than 75 percent of variation in thedependent perception variables such as modern equipmentand fixtures, good looking shopping materials and easy internalmobility respectively. The inferences are vice versa for theremaining dependent perception variables under dimension ofphysical aspects.
Results of Multiple Expectation Model
Contribution of Independent Expectation Variables toPerception Variables- Physical Aspects
Dependent Best Set of Independent Expectation Variables – Dimension WisePerceptionVariables Physical Aspects Reliability Personal Interaction Problem Solving PolicyModern Modern Equipment - Performing Exact - -
Equipment and and Fixtures(0.62)* Services(0.32)*
Fixturesa
Physical Facil it ies Performing Prompt
(-0.22)** Services(0.22)**

SCMS Journal of Indian Management , Apr i l - June, 2010. 99
A Quarterly Journal
Variance Components of Perception, Expectation and Gap – Physical Aspect
Physical Time Promising Performing Exact
Facilities - Services(0.58)* Services(0.24)* - -
Promising Cour teous Commu-
Services(0.28)** nication (-0.21)**
Good Looking Modern Equipment
Shopping and Fixtures(0.24)** - - - Offering
Mate r i a l s a Quality
Easy Accessibil ity Products
(0.21)** (0.22)**
Easy Internal
Mobility(0.23)*
Good Looking
Shopping Materials
(0.21)**
Attractive and Attractive and Convenient
Convenient Public Convenient Public Operating
Areas Areas(0.30)* - - - Hours
Easy Internal (0.24)*
Mobility(0.45)*
Easy Easy Employees - Offering
Accessibil ity Accessibil ity(0.38)* - Knowledge Membership
(0.34)* Cards(0.18)*
Easy Attractive and Time Promising Performing Prompt Offering
Internal Convenient Public Services(0.16) Services(0.29)* Membership
Mobilitya Areas(0.22)* - Cards(0.11)
Easy Internal
Mobility (0.24)*
* t - r a t io s ign i f ican t a t 1% leve l a R -Square >0.75
** t - ra t io s ign i f icant a t 5% leve l
Dependent Perception V(P) Explained Variance by best set V(G)Variables of Independent Expectation
VariablesModern Equipment and Fixtures 1.179 1.007 0.172
Physical Facilities 1.729 1.287 0.442
Good Looking Shopping Materials 1.455 1.183 0.272
Attractive & Public convenient Public Areas 1.138 0.746 0.393
Easy Accessibility 1.107 0.668 0.440
Easy Internal Mobility 1.147 0.896 0.251

SCMS Journal of Indian Management , April - June, 2010. 100
A Quarterly Journal
The table shows the variance of the variables in physicalaspects, expla ined var iance of best set independentexpectation variables and variance of GAP. It is worth notedthat the tota l var iance of the dependent percept ionvariables was divided into two additive components whichexplained variance and unexplained variance of (G). Theresearcher found that the explained variance by the finest
se t o f i ndependent except ion va r i ab les under f i vedimensions were greater than the variance of GAP, thisshows the expectation variables under the five dimensionelaborates maximum variance in the dependent perceptionvariables. So, the researcher concludes the superlative setof independent expectation variables keenly predicted theperception variables in physical aspects.
Results of Multiple Expectation Model
Contribution of Independent Expectation Variables toPerception Variables-Reliability
Dependent Best Set of Independent Expectation Variables – Dimension WisePerceptionVariables
Physical Aspects Reliability Personal Interaction Problem PolicySolving
Promising Modern Equipment Time Promising - - ConvenientServicesa and Fixtures services(0.41)* Parking
(0.18)** Supply of Right FacilitiesEasy Internal Products(0.26)* (0.14)**Mobility(0.19)*
Time Error Free Employeespromising Transactions Confidentialservices - (0.53)* Behaviour(0.28)* - -
Doing it right Modern Equipment Doing it Cour teousnessand Fixtures(0.53)* Right(0.45)* of Employees
(-0.30)** - -Supply of EmployeesRight Products - - Confidential
Behaviour(0.50)* - -Individual Caretaking(0.07)*
Error free Modern EmployeesTransactions Equipment and Knowledge(0.50)*
Fixtures(0.29)* -Security in - -Transactions(0.19)*
* t - r a t io s i gn i f i can t a t 1% leve l a R -Squa re >0 .75** t - r a t io s ign i f i can t a t 5% leve l
The table exhibits the dimension-wise results of the multipleexpectation models under the reliability. It is inferred that theexpectation of customers about the promising services changesby one unit there will be an increase of 0.53 units in the perceptionof customers when other expectation variables in physical aspects,reliability and policy were kept constant. Moreover, the t-ratiowas significant for the regression coefficients of the expectationvariables such as modern equipment and fixtures (0.18), easy
internal mobility (0.19), time promising services (0.41), supply ofright products (0.26) and convenient parking facilities (0.14) arestatistically significant at one percent and five percent level. Like-wise, the expectation variables under the five dimension explainedmore than 75 percent of variation in the dependent perceptionvariables such as promising services. The inferences are vice versafor the remaining dependent perception variables underdimension of reliability.

SCMS Journal of Indian Management , Apr i l - June, 2010. 101
A Quarterly Journal
Variance Components of Perception, Expectation and Gap – Reliability
Dependent Perception Explained Variance byVariables V(P) best set of Independent V(G)
Expectation VariablesPromising Services 1.474 1.294 0.180
Time Promising Services 1.081 0.606 0.476
Doing it Right 1.305 0.678 0.626
Supply of Right Products 2.057 0.654 1.403
Error Free Transactions 1.368 0.968 0.399
Above table explains the variance of the variables in Reliability,explained variance of best set independent expectationvariables and variance of GAP. It is worth noted that the totalvariance of the dependent perception variables was dividedinto two additive components they are explained varianceand unexplained variance of (G). The researcher found thatthe explained variance by the finest set of independent
exception variables under five dimensions were greater thanthe variance of GAP, this shows the expectation variablesunder the five dimension elaborates maximum variance inthe dependent perception variables. So, the researcherconcludes the superlative set of independent expectationvariables keenly predicted the perception variables inReliability.
Results of Multiple Expectation Model
Contribution of Independent Expectation Variables toPerception Variables- Personal Interaction
Dependent Best Set of Independent Expectation Variables – Dimension WisePerception Physical Personal Problem PolicyVariables Aspects Reliability Interaction SolvingEmployees Time Promis ing Performing PromptKnowledge a - Services(0.35)* Services(0.37)*
Doing i t Returns andRight(0.25)* Exchanges(0.27)* -Cour teousCommunicat ion(-0.21)**
Employees Modern Equipment Time Promis ing Employees ConvenientConf ident ia l and Fixtures(0.42)* Services(0.36)* Knowledge(0.43)* - Operatingbehaviour a Hours
(-0.25)**Secur i ty in Attract ive and Promising EmployeesTransact ions Convenient Services Conf ident ia l
Publ ic Areas (-1.09)* Behaviour(0.43)* (0.38)* - -Physical T ime Promis ing PerformingFaci l i t ies(0.65)* Services(0.72)** Exact Serv ices
(-0.82)*

SCMS Journal of Indian Management , April - June, 2010. 102
A Quarterly Journal
Performing - - PerformingPrompt Prompt ServicesServicesa (0.92)* - -Performing Good Looking Promising ImmediateExact Shopping Materials Services(0.55)* Response toServices (-0.63)* Customer
Request(0.84)* - -Immediate Modern Cour teousnessResponse to Equipment of Employees OfferingCustomer and F ixtures (0.33)* qualityRequest (0.37)* - - products
(0.31)*Individual Care Attract ive andTaking Convenient Publ ic
Areas(0.42)* - Employees ConvenientKnowledge Operating(-0.22)** - Hours(0.46)*
Easy InternalMobil i ty(0.43)* Convenient
ParkingFaci l i t ies(-0.17)**
Cour teousness Convenientof Employees Operat ing Hours
(0.28)* Supply of R ight Cour teousProducts Communicat ion(-0.20)** (0.33)* - -
Attract ive andConvenient Publ icAreas(0.19)**EasyAccessibi l i ty(0.34)*
Cour teous Promising Secur i ty in Returns and AcceptanceCommunicat ion - Services Transact ions Exchanges of Credit
(-0.43)* (0.23)* (0.87)* Cards(0.15)**
* t - r a t i o s i g n i f i c a n t a t 1 % l e v e l a R - S q u a r e > 0 . 7 5
* * t - r a t i o s i g n i f i c a n t a t 5 % l e v e l
The table visualizes the dimension-wise results of the multipleexpectation models under the Personal Interaction. It is inferredthat the expectation of patrons about the employees’ knowledgechanges by one unit there will be an increase of 0.37 units inthe perception of customers when other expectation variablesin reliability, personal interaction and problem solving were keptconstant. Moreover, the t-ratio was significant for the regressioncoefficients of the expectation variables such as time promisingservices (0.35), performing prompt services (0.37) doing it right
(0.25), courteous communication (-0.21) and returns andexchanges (0.27) are statistically significant at one percent andfive percent level. Moreover, the expectation variables underthe five dimensions explained more than 75 percent of variationin the dependent perception variables such as EmployeesKnowledge, Employees Confidential Behaviour and PerformingPrompt Services respectively. The inferences are vice versa forthe remaining dependent perception variables under elementof Personal Interaction.

SCMS Journal of Indian Management , Apr i l - June, 2010. 103
A Quarterly Journal
Variance Components of Perception, Expectation and Gap – Personal Interaction
Dependent Perception Variables V(P) Explained Variance by best V(G) set of Independent
Expectation VariablesEmployees Knowledge 1.454 1.119 0.335
Employees Confidential Behaviour 1.390 1.065 0.326
Security in Transactions 2.960 1.457 1.503
Performing Prompt Services 1.062 0.824 0.238
Performing Exact Services 1.525 0.986 0.538
Immediate Response to Customer Request 1.387 0.930 0.457
Individual Care Taking 1.043 0.736 0.307
Cour teousness of Employees 1.033 0.605 0.428
Cour teous Communication 1.178 0.874 0.304
The table explains the variance of the variables in PersonalInteraction, explained variance of best set independentexpectation variables and variance of GAP. It is worth notedthat the total variance of the dependent perception variableswas divided into two additive components they are explainedvariance and unexplained variance of (G). The researcherfound that the explained variance by the f inest set of
independent exception variables under five dimensions weregreater than the variance of GAP, this shows the expectationvariables under the five dimension elaborates maximumvariance in the dependent perception variables. So, theresearcher concludes the superlative set of independentexpectation variables keenly predicted the perceptionvariables in Personal Interaction.
Results of Multiple Expectation Model
Contr ibut ion of Independent Expecta t ion Var iables toPercept ion Var iables - Problem Solving
Dependent Best Set of Independent Expectation Variables – Dimension-wisePerceptionVariables
Physical Reliability Personal ProblemAspects Interaction Solving Policy
Returns and Modern Equip- - Cour teousness Sincerity -Exchanges ment and Fixtures of Employees in Problema (0.25)* (0.20)* Solving(0.29)*
Immediate Returns andResponse to ExchangesCustomer Request (0.16)**(0.15)**
Sincerity - Promising Employees Sincer i ty in Convenientin Problem Services Conf ident ia l Problem Solv ing Park ing Faci l i-Solving (-0.35)* Behaviour(0.18)** (0.59)* t ies(0.26)*
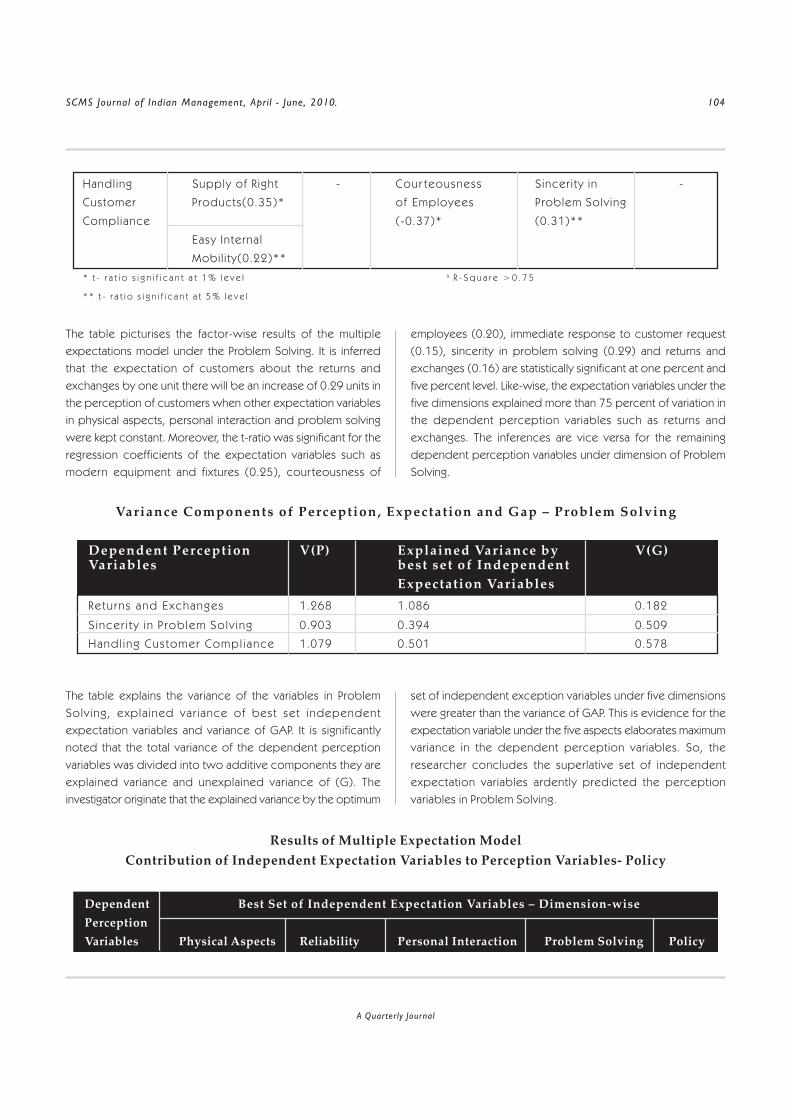
SCMS Journal of Indian Management , April - June, 2010. 104
A Quarterly Journal
Handl ing Supply of R ight - Cour teousness Sincer i ty in -
Customer Products(0.35)* of Employees Problem Solv ing
Compl iance (-0.37)* (0.31)**
Easy Internal
Mobil i ty(0.22)**
* t - r a t i o s i g n i f i c a n t a t 1 % l e v e l a R - S q u a r e > 0 . 7 5
* * t - r a t i o s i g n i f i c a n t a t 5 % l e v e l
The table picturises the factor-wise results of the multipleexpectations model under the Problem Solving. It is inferredthat the expectation of customers about the returns andexchanges by one unit there will be an increase of 0.29 units inthe perception of customers when other expectation variablesin physical aspects, personal interaction and problem solvingwere kept constant. Moreover, the t-ratio was significant for theregression coefficients of the expectation variables such asmodern equipment and fixtures (0.25), cour teousness of
employees (0.20), immediate response to customer request(0.15), sincerity in problem solving (0.29) and returns andexchanges (0.16) are statistically significant at one percent andfive percent level. Like-wise, the expectation variables under thefive dimensions explained more than 75 percent of variation inthe dependent perception variables such as returns andexchanges. The inferences are vice versa for the remainingdependent perception variables under dimension of ProblemSolving.
Variance Components of Perception, Expectation and Gap – Problem Solving
Dependent Perception V(P) Explained Variance by V(G)Variables best set of Independent
Expectation VariablesRetu rns and Exchanges 1.268 1.086 0.182
S incer i t y in P rob lem So lv ing 0.903 0.394 0.509
Handl ing Cus tomer Compl iance 1.079 0.501 0.578
The table explains the variance of the variables in ProblemSolv ing, expla ined var iance of best set independentexpectation variables and variance of GAP. It is significantlynoted that the total variance of the dependent perceptionvariables was divided into two additive components they areexplained variance and unexplained variance of (G). Theinvestigator originate that the explained variance by the optimum
set of independent exception variables under five dimensionswere greater than the variance of GAP. This is evidence for theexpectation variable under the five aspects elaborates maximumvariance in the dependent perception variables. So, theresearcher concludes the superlative set of independentexpectation variables ardently predicted the perceptionvariables in Problem Solving.
Results of Multiple Expectation ModelContribution of Independent Expectation Variables to Perception Variables- Policy
Dependent Best Set of Independent Expectation Variables – Dimension-wisePerceptionVariables Physical Aspects Reliability Personal Interaction Problem Solving Policy

SCMS Journal of Indian Management , Apr i l - June, 2010. 105
A Quarterly Journal
Offering - - - - Acceptance
Quality of Credit
Products Cards(0.36)**
Convenient - - - Handling Convenient
Parking Customer Operating
Facilities Compliance (0.27)* Hours(0.31)*
Offering
Membership
Cards
(0.17)**
Convenient
Parking
Facilities(0.27)*
Convenient Modern Returns and
Operating Equipment Exchanges(0.30)* -
Hours and Fixtures(0.42)* - -
Easy Accessibility
(0.30)**
Acceptance Physical Facilities Time Promising Cour teous - Convenient
of Credit Cards (0.30)* Services(0.35)* Communication Parking
(0.17)** Facilities(0.17)**
Offering Attractive and Promising - Handling Offering
Membership Convenient Services Customer Quality
Cards Public Areas (-1.00)* Compliance Products
(0.58)* (0.56)* (-0.62)*
Time Promising
Services(0.77)*
* t - ra t io s ign i f icant a t 1% leve l a R -Square >0.75
** t- rat io s ign i f icant at 5% level
The table put on view the factor-wise results of the multipleexpectation models under the Policy. It is inferred that theexpectation of customers about the offering quality productschanges by one unit there will be an increase of 0.36 units inthe perception of customers when other expectation variable inpolicy were kept constant. Moreover, the t-ratio was significantfor the regression coefficients of the expectation variables suchas acceptance of credit cards (0.36) is statistically significant atfive percent level. Like-wise, the expectation variables under thefive dimensions explained less than 75 percent of variation inthe dependent perception variables such as offering qualityproducts, convenient operating hours, acceptance of credit
cards and offering membership cards. The inferences are viceversa for the remaining dependent perception variables underdimension of Policy.
The table explains the variance of the variables in Policy, explainedvariance of best set independent expectation variables andvariance of GAP. It is worth noted that the total variance of thedependent perception variables was divided into two additivecomponents they are explained variance and unexplainedvariance of (G). The researcher found that the explained varianceby the finest set of independent exception variables under fivedimensions were greater than the variance of GAP. This illustrates

SCMS Journal of Indian Management , April - June, 2010. 106
A Quarterly Journal
Variance Components of Perception, Expectation and Gap – Policy
Dependent Perception V(P) Explained Variance V(G) Variables by best set of
Independent ExpectationVariables
Offer ing Qua l i ty P roducts 1.012 0.193 0.819
Conven ient Pa rk ing Fac i l i t ies 1.094 0.708 0.387
Conven ient Opera t ing Hours 1.568 1.083 0.485
Acceptance of Cred i t Cards 1.235 0.833 0.402
Of fe r ing Membersh ip Cards 2.711 1.250 1.461
the expectation variables under the five facet elaborates maximumvariance in the dependent perception variables. So, theresearcher concludes the superlative set of independentexpectation variables intensely predicted the perceptionvariables in Policy.
Discussion
In this research ar ticle we analysed the five dimensions of theretail services quality of retail stores namely Physical Aspects,Reliability, Personal Interaction and Policy. We found theperception of shoppers in retail formats was not only influencedby single expectations in their minds but the perception wastrigged by multiple expectations about different aspects ofthe retail stores. Let we enter into the discussion dimensions-wise.
Physical Aspects
Physical Aspects is the most important dimension of the retailstores in attracting the existing shoppers as well as the newshoppers. Under this dimension the shoppers expected moreabout the modern equipment and fixtures, exact servicesand prompt services. Their expectations purely influencedthe modern equipment and fixtures. The managers of theretail stores should concentrate to enhance the modernequipment and fixtures. While enhancing the managersshould also give importance to trigger the exact service andprompt services. The retail authorities must concentrate onthe other services in order to augment the retail serviceeffectiveness.
Reliability
Reliability is the most vital dimension of the retail stores inattracting the customers. Based on this facet the customers
expected more about the easy internal mobility, supply of rightproducts, convenient parking facilities, error free transactions,
employee confidential behaviour etc. The prospects anticipationmotivated the time promising services. The authorities of the
retail formats should concentrate to improve the time promisingservices offered by the retail stores. While improving the retail
authorities should also give importance to target on the errorfree transactions and employee confidential behaviour. The
managers must also focus on the other services in order toaugment the effectiveness of the retail stores.
Personal Interaction
Personal Interaction is the most essential dimension of the retailstores in attracting the customers. According to this dimensionthe customers expected more about the time promising services,returns and exchanges, prompt serv ices, employee’sknowledge, attractive and convenient public areas, physicalfacilities. The customer’s keenness motivated the employee’sknowledge and other services. The powers that be of the retailformats should concentrate to improve the time promisingservices and attractive convenient public areas offered by theretail stores. While improving the retailers should also give valueto target on the physical facilities and employee confidentialbehaviour. They must also focus on the other services in orderto supplement the efficacy of the retail stores.

SCMS Journal of Indian Management , Apr i l - June, 2010. 107
A Quarterly Journal
Problem Solving
Problem Solving is the most imperative aspect of the retail storesin attracting the retail shoppers. Based on this element thecustomers expected more about the cour teousness ofemployees, immediate response to customer request, sincerityin problem solving, returns and exchanges, convenient parkingfacilities. The customers hope motivated the courteousness ofemployees. The powers that be of the retail formats shouldconcentrate to improve the employee’s confidential behaviouroffered by the retail stores. While improving the retail authoritiesshould also give value to target on the modern equipment andfixtures. The retail managers must also spotlight on the otherservices in order to complement the effectiveness of the retailstores.
Policy
Policy is one of the service quality dimensions of the retailstores in order to magnetize the existing shoppers as well asthe new shoppers. Under this facet the shoppers expectedmore about the acceptance of credit cards, handling customercompliance, offering membership cards, convenient parkingfacil it ies, returns and exchanges. Their potential purelyinfluenced the handling customer compliance. The humanresources of the retail stores should contemplate to enhancethe acceptance of credit cards. While improving the servicesquality the managers should also give importance to elicit thehandling customer compliance. The retail manpower mustconcentrate on the other dimensions in order to augmentthe retail service effectiveness.
Keywords::::: Gap Modeling, Food Retailing, Single Expectation,Multiple Expectation Model and Retail Service Quality.
References
Ann, Marie Fiore and Jihyun, Kim. “An Integrative FrameworkCapturing Experiential and Uti l i tarian ShoppingExperience.” International Journal of Retail andDistribution Management. Vol.35, (2007): 421-442.
Anne, Mägi and Claes-Robert Julander. “Perceived Service Qualityand Customer Satisfaction in a Store PerformanceFramework an Empirical Study of Swedish GroceryRetailers.” Journal of Retailing and Consumer Services.Vol.3, (2002): 33-41.
Bell, J. Gilbert D. and Lockwood A. “Service Quality in FoodRetailing Operations: A Critical Incident Analysis.” TheInternational Review of Retai l , Distr ibution andConsumer Research. Vol.7, (1997): 405-423.
Donald, J. Shemwell, Ugur Yavas, and Zeynep Bilgin. “Customer-Service Provider Relationships: An Empirical Test of AModel of Service Quality, Satisfaction and Relationship-Oriented Outcomes.” International Journal of ServiceIndustry Management. Vol.9, (1998): 155-168.
Dirk Morschett, Bernhard Swoboda and Hanna Schramm-Klein“Competitive Strategies in Retailing—an Investigationof the Applicability of Porter ’s Framework for FoodRetailers.” Journal of Retailing and Consumer Services.Volume 13, Issue 4, July 2006, (2005): 275-287.
Dinesh, Kumar Gauri, “Understanding the Determinants ofRetail Strategy: An Empirical Analysis.” Journal ofReta i l ing. Vol .84, Issue 3, September 2008,(2008): 256-267.
Frederick A. Frost, Mukesh Kumar. “INTSERVQUAL – An InternalAdaptation of the GAP Model in a Large ServiceOrganisation.” Journal of Services Marketing. Vol.14,(2000): 358-377.
Gordon Fullerton. “The Service Quality-Loyalty Relationship inRetail Services: Does Commitment Matter?” Journal ofRetailing and Consumer Services. Vol.12, Page (2005):99-111.
Josee Bloemer, Ko de Ruyter, Martin Wetzels. “Linking PerceivedService Quality and Service Loyalty: A Multi-DimensionalPerspective.” European Journal of Marketing. Vol.33,Issue: 11/12, (1999): 1082-1106.
Jillian C. Sweeney, Geoffrey N. Soutar and Lester W. Johnson,“Retai l Ser vice Qual i ty and Perceived Value AComparison of Two Models.” Journal of Retailing andConsumer Services. Vol.4, (1997): 39-48.
Lun Hou and Xiaowo Tang. “Gap Model for Dual CustomerValues.” Tsinghua Science and Technology. Vol.13,(2008): 395-399.
Michael K. Brady, J. Joseph Cronin and Richard R. Brand.“Performance-Only Measurement of Service Quality:

SCMS Journal of Indian Management , April - June, 2010. 108
A Quarterly Journal
A Replication and Extension.” Journal of BusinessResearch. (2002): 55, 17-31.
Michel Laroche, Lefa Teng, Richard Michon and Jean-CharlesChebat, “Incorporating Service Quality Into ConsumerMall Shopping Decision Making: A ComparisonBetween English and French Canadian Consumers.”Journal of Services Marketing. Vol.19, (2005): 153-163.
Niren Sirohi, Edward W. McLaughlin and Dick R. Wittink. “A Modelof Consumer Perception and Store Loyalty Intentionsfor a Supermarket Retailer.” Journal of Retailing. Vol.74,(2000): 223-245.
Nick Johns and Phil Tyas. “Use of Service Quality Gap Theory toDifferentiate between Foodservice Outlets.” TheService Industries Journal. Volume 16, Issue 3 July(1996): 321–346.
Nor Khalidah Abu, Universiti Tun Abdul Razak, Malaysia. “ServiceQuality Dimensions: A Study on Various Sizes ofGrocery Retailers.” A Conceptual Paper. 2004.
Olivier Furrer, Ben Shaw-Ching Liu and D. Dudharshan. “TheRelationships between Culture and Service QualityPerception.” Journal of Service Research. Vol.2, No.4,(2000): 355-371.
Parasuraman. A., Valarie A. Zeithaml, And Leonard L. Berry.“SERVQUAL: A Multiple Item Scale for MeasuringConsumer Perceptions of Service Quality.” Journal ofRetailing. 64 (Spring) (1988): 12-40.
Parasuraman, Zeithaml and Berry. “A Conceptual Model of ServiceQuality and Its Implications for Future Research.” Journalof Marketing. Fall (1985): 41-50.
Pratibha A. Dabholkar, C. David Shepherd and Dayle I. Thorpe.“A Comprehensive Framework for Service Quality: AnInvestigation of Critical Conceptual and MeasurementIssues through a Longitudinal Study.” Journal ofRetailing. Vol.76, (2000): 139-173.
Pratibha A. Dabholkar, Dayle I. Thorpe, Joseph O. Rentz, “AMeasure of Service Quality for Retail Stores: ScaleDevelopment and Validation.” Journal of the Academyof Marketing Science. Winter 1996; 24, No.1, (1996):3-16.
Prem Vrat, S.G. Deshmukh and Nitin Seth. “Service Quality Models:a Review.” International Journal of Quality of ReliabilityManagement. Vol.22, (2005): 913-949.
Richard A. Spreng and Rober t D. Mackoy. “An Empirical
Examination of a Model of Perceived Service Qualityand Satisfaction.” Journal of Retailing. Vol.72, (1996):
201-214.
Rodolfo Vázquez, Ignacio A. Rodríguez-Del Bosque, Ana MaDíaz and Agust ín V. Ruiz. “Serv ice Qual i ty in
Supermarket Retailing: Identifying Critical ServiceExperiences.” Journal of Retailing and ConsumerServices. Vol.8, (2001): 1-14.
Robert F. Hurley and Hooman Estelami. “Alternative Indeses froMonitoring Customer Perceptions of Service Quality:
Acomparative Evaluation in a Retail Context.” Journalof the Academy of Marketing Science. Vol. 26, (1998):
209-221.
Sanjay K.Jain and Garima, Gupta. “Measuring Service Quality:SERVQUAL vs. SERVPERF Scales.” Vikalpa. Vol.29.
(2004): No.2.
Tomas Palaima, Banytë, Jûratë; (2006), “Marketing ServiceRelationships: the Relative Role of Service Quality,”
Engineering Economics, (1 (46)/2006).
Instrument
Physical Aspects
1. This store has modern looking equipment and fixtures.
2. The physical facilities at this store are visually appealing3. Materials associated with this store’s service (such as
shopping bags, catalogs, Or statements) are visuallyappealing.
4. This store is clean attractive, and convenient public areas(rest rooms, fitting Rooms.)
5. The store layout at this store makes is easy for customersto find what they need.
6. The store layout at this store makes it easy for customersto move around in the store.

SCMS Journal of Indian Management , Apr i l - June, 2010. 109
A Quarterly Journal
Reliability
7. When this store promises to do something by a certaintime, it will do so.
8. This store provides its services at the time it promisesto do so
9. This store performs the service right the first time10. This store has merchandise available when the customers
want it.11. This store insists on error-free sales transactions and
records.
Personal Interaction
12. Employees in this store have the knowledge to answercustomer ’s questions.
13. The behaviour of employees in this store instil lsconfidence in customers.
14. Customers feel safe in their transactions with this store.15. Employees in this store give prompt service to
customers.16. Employees in this store tell customers exactly when
services will be performed.17. Employees in this store are never too busy to respond
to customer’s requests.
18. This store gives customers individual attention.
19. Employees in this store are consistently courteous with
customers
20. Employees of this store treat customers courteously
on the telephone.
Problem Solving
21. This store willingly handles returns and exchanges.
22. When a customer has a problem, this store shows a
sincere interest in solving it.
23. Employees of this store are able to handle customer
complaints directly and immediately.
Policy
24. This store offers high quality merchandise.
25. This store provides plenty of convenient parking for
customers
26. This store has operating hours convenient to all their
customers.
27. This store accepts most major credit cards.
28. Offering membership cards.
SCMS Journal of Indian Management , April - June, 2010. 110
A Quarterly Journal
Ownership Structure in Iran:Firms’ Responsibility
Vahideh Hoseini Nodeh and Aisha M.Sheriff
T h i s s t u d y e x a m i n e s t h e e f f e c t s o f o w n e r s h i p s t r u c t u r e o n c o r p o r a t ep r o f i t a b i l i t y o f A u t o m o b i l e f i r m s i n I r a n t h r o u g h t h e p e r i o d 2 0 0 5 t o 2 0 0 7 .T h e o w n e r s h i p s t r u c t u r e i s c o n s i d e r e d i n t e r m s o f ( i ) c o n t r o l l i n go w n e r s h i p , ( i i ) m a n a g e r i a l o w n e r s h i p , i n c l u d i n g m a n a g e r i a l f i n a n c i a l f i r m
o w n e r s h i p a n d m a n a g e r i a l - n o n - f i n a n c i a l f i r m o w n e r s h i p . U s i n g a c c o u n t i n g p r o f i t a b i l i t y : R e t u r no n A s s e t s ( R O A ) a n d S a l e s t o A s s e t s ( S \ A ) a s m e a s u r e o f p r o f i t a b i l i t y , t h e o v e r a l l f i n d i n g sc o n f i r m t h a t t h e r e i s a p o s i t i v e a s s o c i a t i o n b e t w e e n c o n t r o l l i n g o w n e r s h i p a n d f i r m s 'p r o f i t a b i l i t y . T h e f i r m s w i t h c o n t r o l l i n g o w n e r s h i p a r e m o r e p r o f i t a b l e t h a n t h o s e w i t h n o n -c o n t r o l l i n g o w n e r s h i p i n A u t o m o b i l e f i r m s i n I r a n . T h e r e i s a p o s i t i v e r e l a t i o n s h i p b e t w e e nm a n a g e r i a l o w n e r s h i p a n d f i r m s ' p r o f i t a b i l i t y , a n d f i r m s w i t h m a n a g e r i a l - f i n a n c i a l f i r m o w n e r s h i pa r e m o r e p r o f i t a b l e t h a n t h o s e w i t h m a n a g e r i a l - n o n - f i n a n c i a l f i r m o w n e r s h i p .
M
Abstract
Structuring
123456789012345678901234567890121234567890123456789012345678901211234567890123456789012345678901212345678901234567890123456789012112345678901234567890123456789012123456789012345678901234567890121123456789012345678901234567890121234567890123456789012345678901211234567890123456789012345678901212345678901234567890123456789012112345678901234567890123456789012123456789012345678901234567890121123456789012345678901234567890121234567890123456789012345678901211234567890123456789012345678901212345678901234567890123456789012112345678901234567890123456789012123456789012345678901234567890121123456789012345678901234567890121234567890123456789012345678901211234567890123456789012345678901212345678901234567890123456789012112345678901234567890123456789012123456789012345678901234567890121123456789012345678901234567890121234567890123456789012345678901211234567890123456789012345678901212345678901234567890123456789012112345678901234567890123456789012123456789012345678901234567890121123456789012345678901234567890121234567890123456789012345678901211234567890123456789012345678901212345678901234567890123456789012112345678901234567890123456789012123456789012345678901234567890121123456789012345678901234567890121234567890123456789012345678901211234567890123456789012345678901212345678901234567890123456789012112345678901234567890123456789012123456789012345678901234567890121123456789012345678901234567890121234567890123456789012345678901211234567890123456789012345678901212345678901234567890123456789012112345678901234567890123456789012123456789012345678901234567890121123456789012345678901234567890121234567890123456789012345678901211234567890123456789012345678901212345678901234567890123456789012112345678901234567890123456789012123456789012345678901234567890121123456789012345678901234567890121234567890123456789012345678901211234567890123456789012345678901212345678901234567890123456789012112345678901234567890123456789012123456789012345678901234567890121123456789012345678901234567890121234567890123456789012345678901211234567890123456789012345678901212345678901234567890123456789012112345678901234567890123456789012123456789012345678901234567890121123456789012345678901234567890121234567890123456789012345678901211234567890123456789012345678901212345678901234567890123456789012112345678901234567890123456789012123456789012345678901234567890121123456789012345678901234567890121234567890123456789012345678901211234567890123456789012345678901212345678901234567890123456789012112345678901234567890123456789012123456789012345678901234567890121123456789012345678901234567890121234567890123456789012345678901211234567890123456789012345678901212345678901234567890123456789012112345678901234567890123456789012123456789012345678901234567890121123456789012345678901234567890121234567890123456789012345678901211234567890123456789012345678901212345678901234567890123456789012112345678901234567890123456789012123456789012345678901234567890121123456789012345678901234567890121234567890123456789012345678901211234567890123456789012345678901212345678901234567890123456789012112345678901234567890123456789012123456789012345678901234567890121
Ms.Vah ideh Hose in i Nodeh, Research Schola r, Un ivers i ty ofMysore, Mysore, Email: [email protected]
D r. A i s h a M . S h e r i f f , P r o f e s s o r, D e p a r t m e n t o f B u s i n e s sA d m i n i s t r a t i o n , U n i v e r s i t y o f M y s o r e , M y s o r e , E m a i l :a ishasheri f f@hotmai l .com
onday, December 28, 2009 Berle and Means (1932)in their path-breaking study expected an inversecorrelation between the diffuseness of share-
holdings and corporate performance. Th is ana lyt ica lframework is based uponthe view that shareholderdiffusion makes it difficultfor them to act collectivelyand hence to in f luencemanagement to any greatextent. Can the Board ofDirectors help rescue thissituat ion? In some casesthey might not have muchin f luence and they a lsosu f fe r f rom the sameinformation problems thatshareholders have that is,management typically hasmuch more in fo rmat ion
about the company than e i the r board members o fshareholders. And as in any principle-agent problem,managers can use their superior information to extract rents,to the detrimental effect of shareholder value. Moreover, large
compensation for boardservice may have actuallyacted as a disincentive foractive management moni-toring, given managementcontrol over the directorappointment and retentionprocess. Numerous legalreforms have been pro-posed for the developmentof strengthened board fidu-ciary duties or the stimu-lation of effective institut-ional shareholder activism.This is the theoretical underp inn ing under l y ing the

SCMS Journal of Indian Management , Apr i l - June, 2010. 111
A Quarterly Journal
current move towards equity-based compensation forcorporate directors so as to provide them with a powerfulpersonal incentive to exercise effective oversight (Bhagat etal. 1999).
Demsetz (1983) and Demsetz and Lehn (1985), among others,have documented that, when examining the effect thatownership structure has on firm profitability, the endogeneityof ownership structure should be accounted for. The workby Demsetz and Villalonga (2001) is motivated by the needto re-examine the relationship between ownership structureand firm performance taking into account corporate valueand insiders’ ownership. However, their sample includesrelatively few firms and they do not take into account theposs ib le endogenei ty of both ownersh ip as wel l asperformance.
The most diffused firms are financial services companies (49.9percent), construction companies (48.3 percent) and healthservices companies (39.1 percent). The less diffused firmsare the media sector (14.5 percent) and public sectorcompanies (19.2 percent). Dispersion is measured as thepercentage of shares owned by shareholders that hold stakesless than one and at least five percent respectively.
In par ticular, they propose the fraction of shares owned byouts ide shareholders and by management should bemeasured separately because they reflect different groups ofpersons who may have different interests.
As there is little empirical evidence as yet to be found on thesignificance of the relationship between ownership structureand firm’s profitability in the Automobile industry in Iran, thisstudy attempts to fill this gap and therefore examines theeffects of controlling ownership and managerial ownershipon firm’s profitability.
Literature Review
Berle and Means (1932) are among the first to consider therelationship between a firm’s ownership structure and itsperformance. They assert that as the diffuseness of ownershipincreases, shareholders become powerless to controlprofessional managers. Fur ther, they argue that, given theinterests of management and shareholders are not generallyaligned, corporate resources are not used efficiently in
maximizing corporate profit. Therefore, Berle and Means(1932) suggest that the relationship between ownershipconcentration and performance should be a negative one.
Chen (2001) examines the relationship between ownershipstructure and firm value in the case of China. The results showthat there i s a s t rong pos i t ive re la t ionsh ip betweenconcentrated ownership and corporate value (Tobin’s Q). Apositive relationship between corporate value and domesticinstitutional shareholders is also repor ted. Moreover, hementions that managerial share holders are positively and stateshareholders are negatively related to firm value respectively(Chen, 2001).
In addition, Wiwattanakantung (2001) tests the impact ofownership structure on firm performance of Thai non -financialfirms. The study argues that there is no evidence to suppor tthat controlling shareholders extract corporate assets awayfrom the firm for their own benefits. That is, firms withcontrolling shareholders have higher profitability (as measuredby the return on assets and sales-to-asset) than those withnon-controlling shareholders. The results also report that firmswith family and foreign-controlling shareholders, as well asfirms with more than one controlling shareholder, have higherprofitability than do firms with non -controlling shareholders.
McConnell and Servaes (1990) investigate the effects ofmanagerial ownership on the firm’s value. In their study, insteadof fixing the level of managerial ownership they adoptmanagerial shareholding and managerial shareholding squareas ownership variables. The results repor t that a positiverelationship exists between managerial ownership holding at0 percent to approximately 50 percent of shareholding andfirm performance. Beyond 50 percent, a negative relationshipbetween them is found. McConnell and Servaes thereforesuggest that the impact of managerial ownership on the firm’svalue is non-linear. Short and Keasy (1999) also investigatewhether there is a non-linear relationship between managerialownership and f irm performance, based on return onshareholders’ equity and market value, in the case of UK.Shor t and Keasy also suggest that the per formance (asmeasured by return on shareholders’ equity) is positivelyrelated to managerial shareholding in the 0 percent to 15.58percent range, negatively related in the 15.58 percent to41.84 percent range, and becoming positively related againbeyond 41.48 percent . In the market return (as measured by

SCMS Journal of Indian Management , April - June, 2010. 112
A Quarterly Journal
Tobin’ s Q) regression, they suggest that Tobin’ s Q ispositively related to managerial shareholding in the 0 percentto 12.99 percent range, negatively related in the 12.99 percentto 41.99 percent range, and turning positive again whenmanagerial shareholding exceeds 41.99 percent .
Demsetz and V i l l a longa (2001) cons ide r both theendogeneity problem and the different dimensions ofownership structures. By estimating an equation model forthe US firms, they find that ownership is negatively related todebt ratio, unsystematic risk and performance. However,performance (defined as Tobin’s Q or the accounting profitrate) is not found to be influenced by ownership [defined asmanager ia l ownership (CEO, board of di rectors , topmanagement) or ownership by the five largest shareholders].Welch (2003) applies the Demsetz and Villalonga (2001)model to Australian listed firms. Using a single equation model,she a l so cons iders a genera l i zed non- l i nea r mode lspecification for the equation of firm performance similar tothat used by Morck et al. (1988). She finds limited evidenceof a non-l inear relat ionship between managerial shareownership and firm performance. Villalonga and Amit (2004)examine the impact of fami ly ownership, control andmanagement on f i rm value. They conclude that fami lyownership creates value only when it is combined withcer tain forms of control and management. Finally, in a studyof Taiwan’s electronics industry, Sheu and Yang (2005) findthat insider ownership (executives, board members and largeshareholders) has no influence on total factor productivity.
Data and Methodology
Data Sample
The data set for this study is determined by analyzingAutomobile firms in Iran through the period 2005 to 2007.The sample size compromises all of automobile firms listedon the Tehran Stock Exchange (TSE) which includes 28 firms.The main source of data used in this study is derived fromannual financial statements that are obtained from the TehranStock Exchange.
Profitability Variables Measure
Regarding the profitability measures, this study obtains thereturn on assets (ROA) and the sales-asset (S/A) from the
sample firms’ financial repor ts. A simple reason of choosingthe ROA is because it is well known that the ROA is one ofthe most useful measures of the f i rm’s eff ic iency andprofitability. In terms of the S/A ratio it could probably reflectthe effectiveness of management in utilizing the assets of thefirm to the sales revenues and sales also are less affectedfrom manipulation by management. The return on assets ratio(ROA) is calculated by dividing earnings before interests andincome taxes (EBIT) by average total assets. The sales-assetratio is measured from the total sales divided by average totalassets.
Ownership Variables Measures
Ownership structure in this study will be categorized as (1)controlling ownership, (2) managerial ownership, includingmanagerial-financial firm ownership and managerial-non-financial firm ownership.
Controlling Ownership Variable
The variable of controlling ownership (Ctlown) is defined asthe percentage of Shares, at least 25 percent, held by thelargest shareholder. The dummy variable of Ctlown is set tobe one for firm controlled by controlling shareholders, andzero for those controlled by non-controlling shareholders.
Managerial Ownership Variables
The variable of managerial ownership (MOWN) is defined asthe percentage of shares held by members of the board ofdirectors. The dummy variable of MOWN is set to be onefor firms with managerial ownership, and zero for firms withnon-managerial ownership. This study aims to differentiatethe firm profitability that may be influenced by managerial-f inancia l f i rm ownership and manager ia l -non-f inancia lownership. The variable of managerial-financial ownership(MOWN*FINANCIAL) is defined as the percentage of sharesheld by managerial shareholder(s) that have financial firmsha reho lders i nvo lved . The dummy va r i ab le o fMOWN*FINANCIAL is set to be one for the f irms withmanagerial-financial firm ownership, and zero for the firmswith non-managerial ownership. The variable of managerial-non-financial ownership (MOWN*NONFINANCIAL) is definedas the percentage of shares held by managerial shareholder(s)that do not have financial firm shareholders involved. The
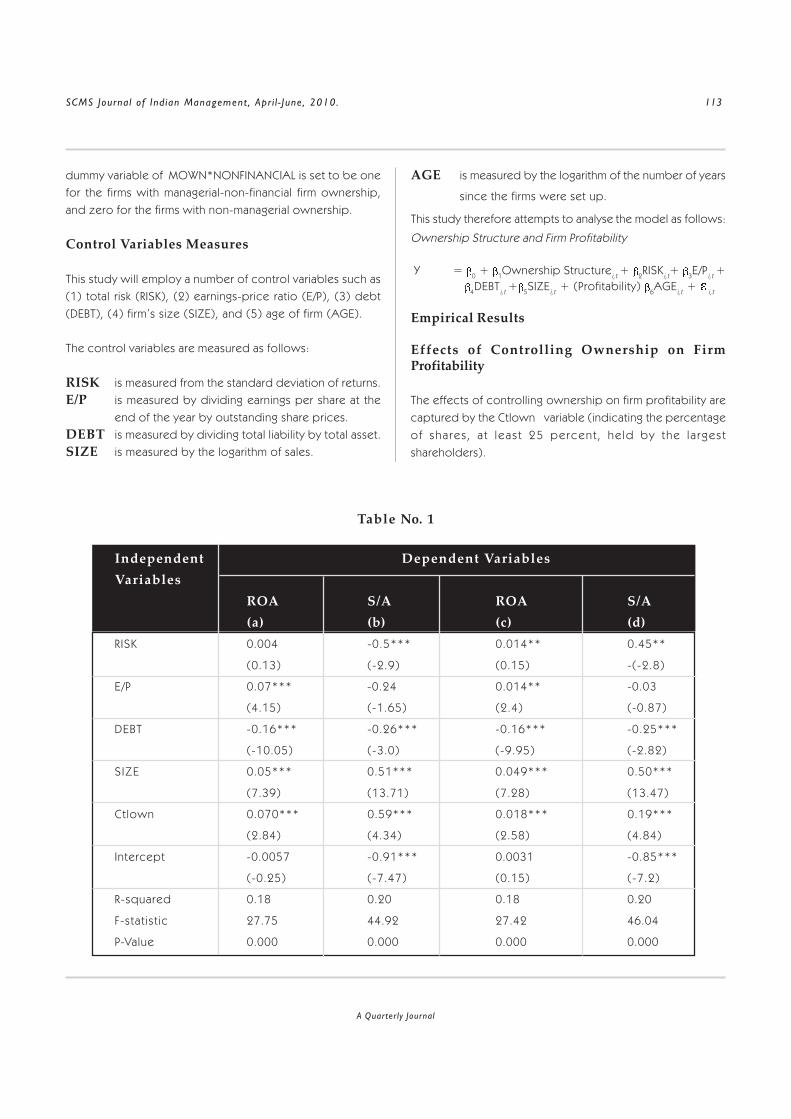
SCMS Journal of Indian Management , Apr i l - June, 2010. 113
A Quarterly Journal
dummy variable of MOWN*NONFINANCIAL is set to be onefor the firms with managerial-non-financial firm ownership,and zero for the firms with non-managerial ownership.
Control Variables Measures
This study will employ a number of control variables such as(1) total risk (RISK), (2) earnings-price ratio (E/P), (3) debt(DEBT), (4) firm’s size (SIZE), and (5) age of firm (AGE).
The control variables are measured as follows:
RISK is measured from the standard deviation of returns.E/P is measured by dividing earnings per share at the
end of the year by outstanding share prices.DEBT is measured by dividing total liability by total asset.SIZE is measured by the logarithm of sales.
AGE is measured by the logarithm of the number of years
since the firms were set up.
This study therefore attempts to analyse the model as follows:
Ownership Structure and Firm Profitability
Y = 0 + 1Ownership Structurei,t + 2RISKi,t+ 3E/Pi,t + 4DEBTi,t + 5SIZEi,t + (Profitability) 6AGEi,t + i,t
Empirical Results
Effects of Controlling Ownership on FirmProfitability
The effects of controlling ownership on firm profitability arecaptured by the Ctlown variable (indicating the percentageof sha res , a t leas t 25 percent , he ld by the l a rges tshareholders).
Table No. 1
Independent Dependent VariablesVariables
ROA S/A ROA S/A(a) (b) (c) (d)
RISK 0.004 -0.5*** 0.014** 0.45**
(0.13) (-2.9) (0.15) -(-2.8)
E/P 0.07*** -0.24 0.014** -0.03
(4.15) (-1.65) (2.4) (-0.87)
DEBT -0.16*** -0.26*** -0.16*** -0.25***
(-10.05) (-3.0) (-9.95) (-2.82)
S IZE 0.05*** 0.51*** 0.049*** 0.50***
(7.39) (13.71) (7.28) (13.47)
Ctlown 0.070*** 0.59*** 0.018*** 0.19***
(2.84) (4.34) (2.58) (4.84)
Intercept -0.0057 -0.91*** 0.0031 -0.85***
(-0.25) (-7.47) (0.15) (-7.2)
R-squared 0.18 0.20 0.18 0.20
F-stat ist ic 27.75 44.92 27.42 46.04
P-Value 0.000 0.000 0.000 0.000
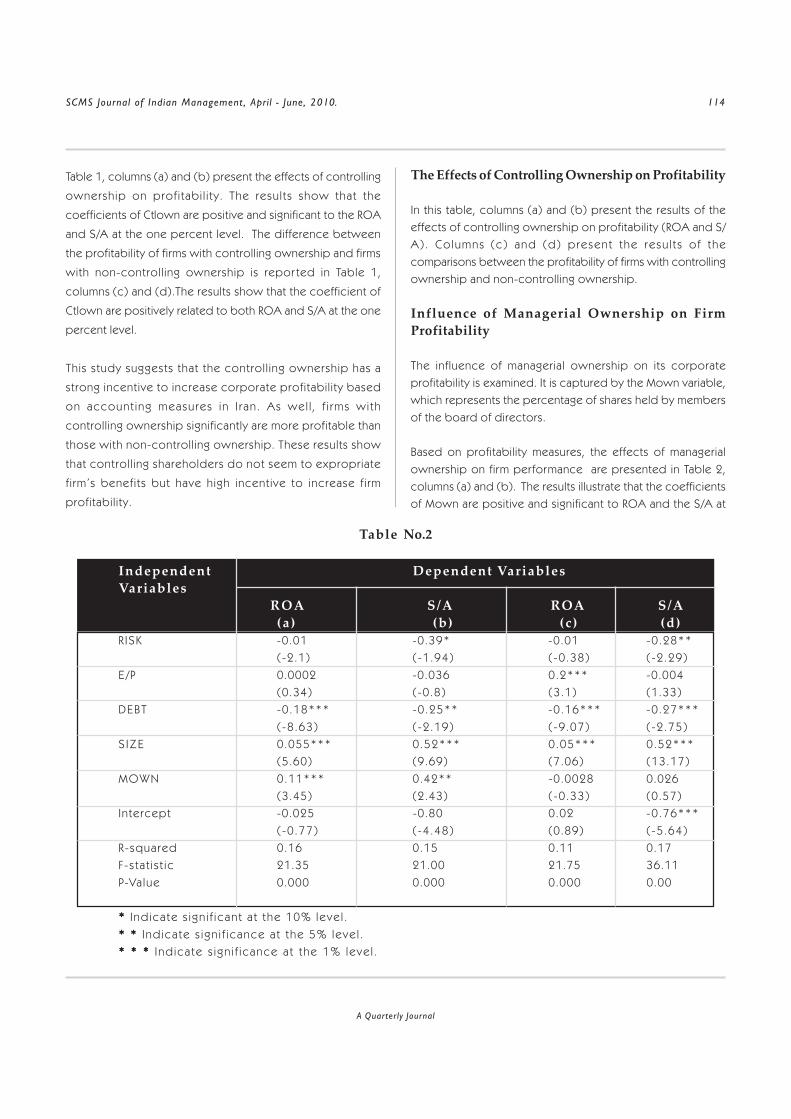
SCMS Journal of Indian Management , April - June, 2010. 114
A Quarterly Journal
Table 1, columns (a) and (b) present the effects of controlling
ownership on prof i tabi l i ty . The resul ts show that the
coefficients of Ctlown are positive and significant to the ROA
and S/A at the one percent level. The difference between
the profitability of firms with controlling ownership and firms
with non-controll ing ownership is repor ted in Table 1,
columns (c) and (d).The results show that the coefficient of
Ctlown are positively related to both ROA and S/A at the one
percent level.
This study suggests that the control l ing ownership has a
strong incentive to increase corporate profitabil ity based
on account ing measures in I ran . As wel l , f i rms wi th
controlling ownership significantly are more profitable than
those with non-controll ing ownership. These results show
that controll ing shareholders do not seem to expropriate
f irm’s benefits but have high incentive to increase f i rm
profitabil ity.
The Effects of Controlling Ownership on Profitability
In this table, columns (a) and (b) present the results of theeffects of controlling ownership on profitability (ROA and S/A) . Co lumns (c) and (d) present the resu l t s o f thecomparisons between the profitability of firms with controllingownership and non-controlling ownership.
Influence of Managerial Ownership on FirmProfitability
The influence of managerial ownership on its corporateprofitability is examined. It is captured by the Mown variable,which represents the percentage of shares held by membersof the board of directors.
Based on profitability measures, the effects of managerialownership on firm performance are presented in Table 2,columns (a) and (b). The results illustrate that the coefficientsof Mown are positive and significant to ROA and the S/A at
Table No.2
Independent Dependent VariablesVariables ROA S/A ROA S/A (a) (b) (c) (d)R ISK -0.01 -0.39* -0.01 -0.28**
(-2.1) (-1.94) (-0.38) (-2.29)E /P 0.0002 -0.036 0.2*** -0.004
(0.34) (-0.8) (3.1) (1.33)DEBT -0.18*** -0.25** -0.16*** -0.27***
(-8.63) (-2.19) (-9.07) (-2.75)S IZE 0.055*** 0.52*** 0.05*** 0.52***
(5.60) (9.69) (7.06) (13.17)MOWN 0.11*** 0.42** -0.0028 0.026
(3.45) (2.43) (-0.33) (0.57)Intercept -0.025 -0.80 0.02 -0.76***
(-0.77) (-4.48) (0.89) (-5.64)R-squared 0.16 0.15 0.11 0.17F-s ta t i s t ic 21.35 21.00 21.75 36.11P-Va lue 0.000 0.000 0.000 0.00
* * * * * Ind ica te s ign i f icant a t the 10% leve l .* * * * * * * * * * Ind ica te s ign i f icance a t the 5% leve l .* * * * * * * * * * * * * * * Ind ica te s ign i f icance a t the 1% leve l .

SCMS Journal of Indian Management , Apr i l - June, 2010. 115
A Quarterly Journal
the one percent and five percent levels respectively. Thedifferentiated between the profitability of firms with managerialownership and non-managerial ownership is showed in Table2, column (c) and (d). It is found that the coefficient ofMown are significant to the ROA and S/A respectively.
The Effects of Managerial Ownership on Profitability
In this table, column (a) and (b), present the results of theeffects of managerial ownership on profitability (ROA and S/A). Column (c) and (d) present the results of the comparisonsbetween the profitability of firms with managerial ownershipand non-managerial ownership. The t statistic is repor ted inparentheses.
Table 3, column (a) and (b), present the effects of managerial-financial ownership and managerial-non-financial ownership
on the profitabil ity. It is found that the coefficients ofMOWN*FINANCIAL are positive and significant to the ROAand the S/A at the five percent level. The results in column (c)and (d) , however, show tha t the coe f f i c ien t s o fMOWN*NONFINANCIAL are positive, but not significant tothe profitability measures. Comparing the profitability of firmswith these two ownership categories and firms with non-managerial ownership, Table 3, columns (e), and (f), showthat the coefficient of MOWN*NONFINANCIAL is negativeand significant at the 10 percent level to the ROA, while thoseof MOWN*FINANCIAL are insignificant to the profitability.
The Effects of Managerial-Financial Ownership,Managerial-Non-Financial Ownership on Profitability
In this table, column (a) to (d), present the results of theeffects of managerial-financial ownership, managerial-non-
Table No.3
Independent Variables Dependent VariablesROA S/A ROA S/A ROA S/A (a) (b) (c) (d) (e) (f)
RISK -0.05** 0.4* -0.017 -0.09 -0.01 -0.28**
(-2.1) -(-2.01) (-0.18) (-0.35) (-0.48) (-2.33)
E/P 0.001 -0.031 0.1*** 0.1 0.021*** -0.005
(0.34) (-1.07) (2.62) (0.88) (3.29) (-0.2)
DEBT -0.24*** -0.5*** -0.062 -0.13 -0.14*** -0.27***
(-11.4) (-2.5) (-0.75) (0.57) (-7.5) (-2.67)
SIZE 0.06*** 0.61*** 0.048 0.4*** 0.043*** 0.52***
(6.62) (7.69) (1.5) (4.26) (6.06) (13.03)
MOWN*FINANCIAL 0.072** 0.51** 0.0086 0.06
(2.31) (1.80) (1.02) (1.16)
MOWN*NONFINANCIAL 0.13 0.83 -0.018* -0.022
(0.58) (1.08) (-1.85) (-1.13)
Intercept 0.012 -1.1*** -0.12 -0.71** 0.020 -0.76***
(0.91) (-3.5) (-1.12) (-2.28) (0.93) (-5.62)
R-squared 0.37 0.15 0.1 0.12 0.13 0.18
F-statistic 26.3 10.56 5.31 6.88 18.53 26.94
P-Value 0.000 0.000 0.000 0.000 0.000 0.000
* * * * * Indicate significant at the 10% level.* * * * * * * * * * Indicate significance at the 5% level.* * * * * * * * * * * * * * * Indicate significance at the 1% level.
SCMS Journal of Indian Management , April - June, 2010. 116
A Quarterly Journal
f inanc ia l ownersh ip, on prof i tab i l i ty (ROA and S/A) .Columns (e) and (f) present the results of the comparisonsbetween the profitabil ity of firms with managerial financialownership, managerial-non-financial ownership and non-manager ia l ownersh ip. The t-s tat i s t ic i s repor ted inparentheses.
Summary and Conclusion
This study examines the effects of ownership structure onfirm’s profitability based on the data sample from IranianAutomobile listed firms during the period 2005-2007. Thepaper is primarily motivated by a lack of evidence regardingthe relationship between the ownership structure and firmprofitability in Iranian firms. The ownership structure is classifiedas ( i) control l ing ownership,( i i) managerial ownership,including managerial financial firm ownership and managerial-non-financial firm ownership.
Firm’s profitability measures are represented by Return onAssets and Sales to Assets. Based on the analysis, the resultsof the relationship between ownership structure and firmprofitability in the case of Iranian Automobile firms revealsthat: Controlling ownership has a strong positive relationshipto the profitability and firms with controlling ownership havehigher profitability than those with non-controlling ownershipThe results suggest that the greater the degree to which sharesare concent ra ted in the hands of outs ide or ins ideshareholders, the more effectively management behaviour ismonitored and disciplined, thus resulting in better profitability.
Secondly, there is a positive relationship between managerialownership and firm’s profitability. In comparison, firms withmanagerial ownership are more profitable than those withnon-managerial ownership.
This study suggests that the different types of managerialownership effect firm’s profitability in different ways, but firmswith managerial–financial firm ownership are more profitablethan those with managerial–non–financial firm ownership.
References
Berle, A. and G. Means. “The Modern Corporation and PrivateProper ty.” Macmillan Publishing. New York: 1932.
Bhagat, S., Carey, D. and C. Elson. “Director Ownership,
Corporate Performance and Management Turnover.”The Business Lawyer. 54, (1999): 885-919.
Chen, J. “Ownership Structure as Corporate GovernanceMechan i sm: Ev idence f rom Ch inese L i s tedCompanies.” Economics of Planning. 34, (2001):53-72.
Craswell, A .T., S.L. Taylor and R .A. Saywell. “OwnershipStructure and Corporate Performance: AustralianEvidence.” Pacific-Basin Finance Journal. 5 (3),(1997): 301-323.
DeAngelo, H. and L. DeAngelo. “Managerial Ownership ofVoting Rights: A Study of Public Corporations withDual Classes of Common Stock.” Journal of FinancialEconomics. 14, (1985): 33-69.
Demsetz, H. and K. Lehn. “The Structure of CorporateOwnership: Cause and Consequences.” Journal ofPolitical Economy. 93 (No.6), (1985): 1155-1177.
Demsetz, H. and B. Villalonga. “Ownership Structure andCorporate Performance.” Journal of CorporateFinance. 7, (2001): 209-233
Fama, E.F. and M.C. Jensen. “Separation of Ownership andControl.” Journal of Law and Economics. XXVI,(1983b): 301-325.
Han, C.K. and D.Y. Suk. “The Effect of Ownership Structureon Firm Performance: Additional Evidence.” Reviewof Financial Economics. 7, No. 2, (1998): 143-155.
Holdernes, C. G. and D. Sheehan. “The Role of MajorityShareholders in Publicly Held Corporations: AnExp lo ra to ry Ana l ys i s . ” Jou rna l o f F i nanc ia lEconomics. 20, (1988): 317-346.
Jensen, M.H. “Agency Costs of Free Cash Flow, CorporateFinance, and Takeovers.” American Economic Review.76 (2), (1986): 323-329.
Jensen, M.C. “A Theory of the Firm: Governance, ResidualClaims, and Organizational Forms.” Harvard UniversityPress. Cambridge: 2000.
SCMS Journal of Indian Management , Apr i l - June, 2010. 117
A Quarterly Journal
Jensen, M.C. and W.H. Meckling. “Theory of the Firm:Managerial Behaviour, Agency Cost, and OwnershipStructure.” Journal of Financial Economics. 3, (1976):305-360.
Kesner, I. “Directors’ Stock Ownership and OrganizationalPer formance: An Invest igat ion of For tune 500Companies.” Journal of Management. 13 (3), (1987):499-507.
McConnell, J. and H. Servaes. “Additional Evidence on EquityOwnership and Corporate Value.” Journal of FinancialEconomics. 27, (1990): 595-612.
Monsen, R.S. Chiu and C. David. “The Effect of Separation ofOwnership and Control on the Performance of theLarge Firm.” Quar terly Journal of Economics. 82 (3)June, (1968): 435-451.
Morck, R., A. Shleifer and R. Vishny. “Management Ownershipand Market Valuation: An Empirical Analysis.” Journalof Financial Economics. 20, (1988): 293-315.
Murali , R . and J. B. Welch. “Agent, Owner, Control andPerformance.” Journal of Business Finance andAccounting. 16 (3) Summer, (1989): 385-398.
Oswald, S.L. and J.S. Jahera. “The Influence of Ownership onPer formance: An Empi r ica l S tudy.” S t ra teg icManagement Journal. 12, (1991): 321-326.
Sheu, H.J. and C.Y. Yang, “Insider Ownership Structure andFirm Performance: A Productivity Perspective Studyin Ta iwan’s E lect ron ics Indust r y. ” Corpora teGovernance. 13, (2005): 326-337.
Shleifer, A. and R. Vishny. “A Survey of Corporate Governance.”
The Journal of Finance. LII, No.2, (1997): 737-782.
Shor t , H. and K. Keasey. “Manager ia l Ownersh ip and
the Per formance of F i rm: Ev idence f rom the
UK.” Journa l of Corporate F inance. 5, (1999):
79-101.
Smith, B.F. and B. Amoako-Adu. “Management Succession
and Financial Per formance of Family Controlled
Firms.” Journal of Corporate Finance. 5, (1999): 341-
368.
Stulz, R. “Managerial Control of Voting Tights: Financing Policies
and the Market for Corporate Control.” Journal of
Financial Economics. 20 (January/March), (1988):
25-54.
Tehran Stock Exchange. (2005-2007).” Annual Repor ts .
Vil lalonga, B. and R . Amit. “How Do Family Ownership,
Control and Management Affect F i rm Value?”
Journal of F inancial Economics (for thcoming).
2004.
Welch, E. “The Relationship between Ownership Structure
and Performance in Listed Australian Companies.”
Australian Journal of Management. 28, (2003): 287-
305.
W iwat tanakantung , Y. “Cont ro l l i ng Shareho lders and
Corpora te Va lue : Ev idence f rom Tha i l and . ”
Pac i f ic-Bas in F inance Journa l . 9 (4) , (2001):
323-362.

SCMS Journal of Indian Management , April - June, 2010. 118
A Quarterly Journal
Book Title : Retail FranchisingAuthor : Manish V. Sidhpuria
Edition : 2009
ISBN-13 : 978-0-07-014503-0
Pages : 180
Publisher : Tata McGraw-Hills Publg. Co. Ltd., New Delhi.
R
12345678901234567890123456789012123456789012345678901234567890121234567890123451234567890123456789012345678901212345678901234567890123456789012123456789012345123456789012345678901234567890121234567890123456789012345678901212345678901234512345678901234567890123456789012123456789012345678901234567890121234567890123451234567890123456789012345678901212345678901234567890123456789012123456789012345123456789012345678901234567890121234567890123456789012345678901212345678901234512345678901234567890123456789012123456789012345678901234567890121234567890123451234567890123456789012345678901212345678901234567890123456789012123456789012345123456789012345678901234567890121234567890123456789012345678901212345678901234512345678901234567890123456789012123456789012345678901234567890121234567890123451234567890123456789012345678901212345678901234567890123456789012123456789012345123456789012345678901234567890121234567890123456789012345678901212345678901234512345678901234567890123456789012123456789012345678901234567890121234567890123451234567890123456789012345678901212345678901234567890123456789012123456789012345123456789012345678901234567890121234567890123456789012345678901212345678901234512345678901234567890123456789012123456789012345678901234567890121234567890123451234567890123456789012345678901212345678901234567890123456789012123456789012345123456789012345678901234567890121234567890123456789012345678901212345678901234512345678901234567890123456789012123456789012345678901234567890121234567890123451234567890123456789012345678901212345678901234567890123456789012123456789012345
Scanningand
Skimming
123456789012345678901234567890121234567890123456789123456789012345678901234567890121234567890123456789123456789012345678901234567890121234567890123456789123456789012345678901234567890121234567890123456789123456789012345678901234567890121234567890123456789123456789012345678901234567890121234567890123456789123456789012345678901234567890121234567890123456789123456789012345678901234567890121234567890123456789123456789012345678901234567890121234567890123456789123456789012345678901234567890121234567890123456789123456789012345678901234567890121234567890123456789123456789012345678901234567890121234567890123456789123456789012345678901234567890121234567890123456789123456789012345678901234567890121234567890123456789123456789012345678901234567890121234567890123456789123456789012345678901234567890121234567890123456789123456789012345678901234567890121234567890123456789123456789012345678901234567890121234567890123456789123456789012345678901234567890121234567890123456789123456789012345678901234567890121234567890123456789123456789012345678901234567890121234567890123456789123456789012345678901234567890121234567890123456789123456789012345678901234567890121234567890123456789123456789012345678901234567890121234567890123456789123456789012345678901234567890121234567890123456789123456789012345678901234567890121234567890123456789123456789012345678901234567890121234567890123456789123456789012345678901234567890121234567890123456789123456789012345678901234567890121234567890123456789123456789012345678901234567890121234567890123456789123456789012345678901234567890121234567890123456789123456789012345678901234567890121234567890123456789123456789012345678901234567890121234567890123456789123456789012345678901234567890121234567890123456789123456789012345678901234567890121234567890123456789123456789012345678901234567890121234567890123456789123456789012345678901234567890121234567890123456789123456789012345678901234567890121234567890123456789123456789012345678901234567890121234567890123456789123456789012345678901234567890121234567890123456789123456789012345678901234567890121234567890123456789123456789012345678901234567890121234567890123456789123456789012345678901234567890121234567890123456789123456789012345678901234567890121234567890123456789123456789012345678901234567890121234567890123456789
Rev i ewed by P ro f . S r ee kuma r P i l l a i , Head o fD e p a r t m e n t o f R e t a i l M a r k e t i n g a n dM e r c h a n d i s i n g , S C M S - C O C H I N , P r a t a pN a g a r , M u t t o m , A l u v a - 6 8 3 1 0 6 , C o c h i n ,Ema i l : s r ee kuma r@scmsg roup .org
e ta i l F r anch i s i ng has been the mos t success fu lmodel in the Indian reta i l indust ry s ince the mid80’s. In addition to providing low cost entry into
high ambience international levels of retailing, franchisinghas also encouraged more and more entrepreneurs to tryout the franchising model in various ver ticals from retailingsugar cane juice and dahi–vadato exclusive watches and fashionaccessories.
This book is an ideal referencebook for the student and teacherof retail management as well asfo r any person in te res ted inf ranch is ing as a reta i l format .Manish Sidhpuria has taken extrae f fo r t s to p rov ide su f f i c i en tmarket information on the currentIndian retail industry following thefranchising format. From “Jumboking” to “McDonalds” and from
“Titan” to “Levis,” the author has provided enough examplesin the form of interesting snippets to keep the readerengrossed as well as informed.
Personally I found the Par t 1 of the book most useful for myc l a s s . The sec t ions on “ F r anch i s i ng i n I nd i a ” and
“Internationalisation of Franchiseoperat ions by US Franchisors”were extremely useful for gettinga better understanding of thecurrent Indian franchising scenewhich is dominated by Americanplayers such as McDonalds, KFC,Nike and Levis, among others.
The second par t of the bookdea l s w i t h “deve lop ing andevaluating a franchise system” andunderstandingly has lesser Indianexamples but I would still rate thesection as useful and informative.

SCMS Journal of Indian Management , Apr i l - June, 2010. 119
A Quarterly Journal
The author has chosen to tread the familiar and much usedpath of retail theory which is in fact useful in a text book onfranchising for a student of retail management, since it savestime and the effor t of referring a couple of text booksnormally used.
I would rate the Par t 3 of the book closely behind the firstpar t in terms of utility. The par t has been well researchedand presented. The sections on “Preparing for franchising”and “Investigating and evaluating a Franchise” have beendone with care and conviction. Information provided asexamples in tabular form has made the section interestingas well as self-explanatory.
As a teacher of retail management I have been trying toIndianise my core retail classes and it has given me immensejoy and satisfaction to see five cases in the Indian contextout of the total of six cases presented in the last par t of this
book. All the Indian cases have been based on topics ofvalue and current interest. I am determined to use a coupleof these cases for the coming trimester when we will beteaching Retail Franchising to the students entering retailspecialization courses. The summary provided at the endof each section along with the questions, makes life easierfor the facilitator who is in a hurry.
So how would I rate th is book as a faci l i tator of Reta i lmanagement classes? I have always been happy to pickup any book on Reta i l ing but I have not been alwaysfor tuna te to put i t down wi th the same sent iment .However in this case I am happy to say that what ManishV. S idhpur ia has provided in th is book has createdsuff ic ient enthusiasm and trust in th is publ icat ion and Iam pleased to express here my appreciat ion of th isbook and the fact that I wi l l be recommending thesame for my students.

SCMS Journal of Indian Management , April - June, 2010. 120
A Quarterly Journal
123456789012345678901234567890121234567890123456789012345678901234567890123456789012123456789012345678901234567890123456789012345678901212345678901234567890123456789012345678901234567890121234567890123456789012345678901234567890123456789012123456789012345678901234567890123456789012345678901212345678901234567890123456789012345678901234567890121234567890123456789012345678901234567890123456789012123456789012345678901234567890123456789012345678901212345678901234567890123456789012345678901234567890121234567890123456789012345678901234567890123456789012123456789012345678901234567890123456789012345678901212345678901234567890123456789012345678901234567890121234567890123456789012345678901234567890123456789012123456789012345678901234567890123456789012345678901212345678901234567890123456789012345678901234567890121234567890123456789012345678901234567890123456789012123456789012345678901234567890123456789012345678901212345678901234567890123456789012345678901234567890121234567890123456789012345678901234567890123456789012123456789012345678901234567890123456789012345678901212345678901234567890123456789012345678901234567890121234567890123456789012345678901234567890123456789012123456789012345678901234567890123456789012345678901212345678901234567890123456789012345678901234567890121234567890123456789012345678901234567890123456789012123456789012345678901234567890123456789012345678901212345678901234567890123456789012345678901234567890121234567890123456789012345678901234567890123456789012123456789012345678901234567890123456789012345678901212345678901234567890123456789012345678901234567890121234567890123456789012345678901234567890123456789012123456789012345678901234567890123456789012345678901212345678901234567890123456789012345678901234567890121234567890123456789012345678901234567890123456789012123456789012345678901234567890123456789012345678901212345678901234567890123456789012345678901234567890121234567890123456789012345678901234567890123456789012123456789012345678901234567890123456789012345678901212345678901234567890123456789012345678901234567890121234567890123456789012345678901234567890123456789012123456789012345678901234567890123456789012345678901212345678901234567890
12345678901234567890123456789012123456789012345678901234567890121234567890123451234567890123456789012345678901212345678901234567890123456789012123456789012345123456789012345678901234567890121234567890123456789012345678901212345678901234512345678901234567890123456789012123456789012345678901234567890121234567890123451234567890123456789012345678901212345678901234567890123456789012123456789012345123456789012345678901234567890121234567890123456789012345678901212345678901234512345678901234567890123456789012123456789012345678901234567890121234567890123451234567890123456789012345678901212345678901234567890123456789012123456789012345123456789012345678901234567890121234567890123456789012345678901212345678901234512345678901234567890123456789012123456789012345678901234567890121234567890123451234567890123456789012345678901212345678901234567890123456789012123456789012345123456789012345678901234567890121234567890123456789012345678901212345678901234512345678901234567890123456789012123456789012345678901234567890121234567890123451234567890123456789012345678901212345678901234567890123456789012123456789012345123456789012345678901234567890121234567890123456789012345678901212345678901234512345678901234567890123456789012123456789012345678901234567890121234567890123451234567890123456789012345678901212345678901234567890123456789012123456789012345123456789012345678901234567890121234567890123456789012345678901212345678901234512345678901234567890123456789012123456789012345678901234567890121234567890123451234567890123456789012345678901212345678901234567890123456789012123456789012345
Scanningand
Skimming
Book Title : Managerial AccountingAuthors : Ray H. Garrison, Eric W. Noreen and
Peter C. Brewer
Edition : Eleventh
ISBN 13 : 978-0-07-070040-6
Pages : 863
Publisher : Tata McGraw – Hill Education Pvt. Ltd., New Delhi.
E
R e v i e w e d b y D r. M a k e s h K . G . , A s s i s t a n tProfessor, SSTM, Pra tap Nagar, Mut tom, Aluva -6 8 3 1 0 6 , C o c h i n , E - m a i l : m a k e s h @ s c m sgroup.org
very business organization, irrespective of its size andnature of operations, has to have managers – peopleresponsible of doing things right. They carry out three
very basic activities: planning, directing and controlling.There are managers who engagethemselves in the corporate facetsof human resource, market ing,sales, operations etc.; and then,there are managers who engagein accounts and finance. The endresult of managers’ activities willbe evidenced in many details thatmark the difference between ave r y succes s f u l and a ve r yunviable business.
All activities of managers involveeither decision-making or aidingdecision-making. Accounting and
Financial Managers deal with the actual and probablefinancial environment of business, requiring such financialinformation that is profoundly deep and innately relevant.Managerial Accounting, which is a very vital sphere in
management, is concerned withproviding financial information tomanagers to plan and controlactivities. Not only would it revealhow the business has performed,but a l so wou ld i t revea l thecomparative performance againstbenchmarks. Cost concepts andcos t i ng t echn iques , p ro f i tplanning and budgeting, f inan-cing pattern and capita l bud-geting, financial statement analysisand performance repor ting etc.are a few within the very perva-s ive scope of the subject of
SCMS Journal of Indian Management , Apr i l - June, 2010. 121
A Quarterly Journal
managerial accounting. Since it is manager-oriented, anycontent on managerial accounting should preferably discusswhat managers do, what information managers require, whattools managers use, and the meaning and relevance of theresults of analysis, ideally set against a real life-like corporatesetting. And that is what Garrison, Noreen and Brewer deliverthrough the Eleventh Edit ion of their book ManagerialAccounting.
No doubt, the outer look of the volume is quite impressive.It is even more so, in the inner side. The book star ts with avery informative Student Supplement, talking about topictackler, homework manager, online learning centre, studyguide, student lecture aid, excel templates etc. The contentpage details chapter-wise, the coverage of topics, with eachchapter sub-titled into major and minor sub-topics. Thebook is divided into seventeen chapters, ending withappendices dealing with finance-related topics relating to awider perspective. Preliminary chapters exhaustively deal withvery minute detail ing of cost concepts, behaviour andclassif icat ions l ike job-order costing, process costing,activity-based costing, variable costing and standard costing.These contents provide a perfect setting to the introductionof the concepts of Cost-Volume Profit Analysis, Break-EvenAnalys is , Ba lanced Score Card, Budget ing, OverheadAnalys is , Prof i t P lanning and Segment Repor t ing. Themainstay follows, with avid discussion on Capital BudgetingDecisions. Cash Flow Analysis and Financial StatementAnalysis are the topics with which the book concludes.Appendices deal with concepts relating to price elasticity,and profitability analysis in a broader perspective of businessdecision-making.
Laudable is the format in which each chapter is constructed.Chapter star ts with learning objectives being listed out. Asnippet follows, taken from real-life corporate background,ser v ing as a Point-to-Ponder, which real ly sweeps an
overview into what the chapter deals with. Margins areextens ive ly made use of for two purposes: One, toint roduce references to technology-ass is ted studentsupp lemen t s , whe re s t uden t s can acces s qu ic kreinforcements through slide shows, video presentations,interactive numerical exercises and links to other informationon the World Wide Web; Two, to l ist out the learningobjectives attached to its relevant content. Exhibits andnumerical explanations are in plenty, its visibil ity beingpositively added by grey-coloured background. Mini-Casesare inter-twined into the theoretical discussions, withseparate sub-titles. Limited use of photographs to addwealth to appearance and visibility is remarkably decisive.Each chapter ends with a summary, review numerical,glossary, questions, exercises, cases and group and internetexercises.
The delivery of content is coherent and logical. Each termis defined and introduced, with the chapter flowing todeeper topics, gathering momentum with appropriatelysequenced sub-headings. Theoret ical discussions arefor thwith followed by exhibits and numerical examples,allowing better and easier comprehension. In most chapters,the theoretical deliberations include a sequel under a minortitle Managerial Accounting in Action, where the theory isput under a corporate context, with personal discussionsexploring fur ther avenues in a ver y simple and dilutedcontext.
The book Managerial Accounting is perfect nourishment forser ious management graduates aspir ing for careers infinance. It cer tainly is not for the novice and the desultory.Beginners might feel let off by its very erudite and scholarlystyle. For those with iron-mettle, this book delivers whatthey aspire for from a finance text book. For those without,there are others in plenty. But management – financial, inpar ticular - is not meant for the feeble.
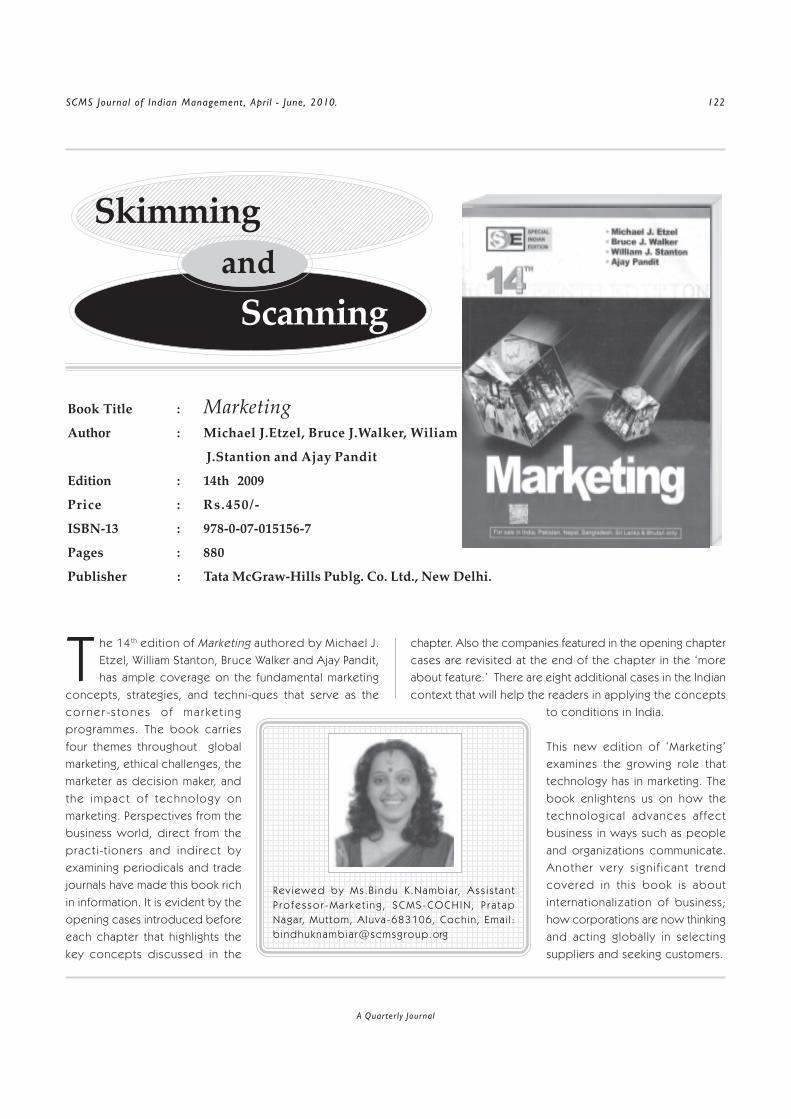
SCMS Journal of Indian Management , April - June, 2010. 122
A Quarterly Journal
12345678901234567890123456789012123456789012345678901234567890121234567890123451234567890123456789012345678901212345678901234567890123456789012123456789012345123456789012345678901234567890121234567890123456789012345678901212345678901234512345678901234567890123456789012123456789012345678901234567890121234567890123451234567890123456789012345678901212345678901234567890123456789012123456789012345123456789012345678901234567890121234567890123456789012345678901212345678901234512345678901234567890123456789012123456789012345678901234567890121234567890123451234567890123456789012345678901212345678901234567890123456789012123456789012345123456789012345678901234567890121234567890123456789012345678901212345678901234512345678901234567890123456789012123456789012345678901234567890121234567890123451234567890123456789012345678901212345678901234567890123456789012123456789012345123456789012345678901234567890121234567890123456789012345678901212345678901234512345678901234567890123456789012123456789012345678901234567890121234567890123451234567890123456789012345678901212345678901234567890123456789012123456789012345123456789012345678901234567890121234567890123456789012345678901212345678901234512345678901234567890123456789012123456789012345678901234567890121234567890123451234567890123456789012345678901212345678901234567890123456789012123456789012345123456789012345678901234567890121234567890123456789012345678901212345678901234512345678901234567890123456789012123456789012345678901234567890121234567890123451234567890123456789012345678901212345678901234567890123456789012123456789012345
Scanningand
Skimming
T
Book Title : MarketingAuthor : Michael J.Etzel, Bruce J.Walker, Wiliam
J.Stantion and Ajay Pandit
Edition : 14th 2009
Price : Rs.450/-
ISBN-13 : 978-0-07-015156-7
Pages : 880
Publisher : Tata McGraw-Hills Publg. Co. Ltd., New Delhi.
12345678901234567890123456789012123456789012345678901234567890123456789012345678901212345678901234567890123456789012345678901234567890121234567890123456789012345678901234567890123456789012123456789012345678901234567890123456789012345678901212345678901234567890123456789012345678901234567890121234567890123456789012345678901234567890123456789012123456789012345678901234567890123456789012345678901212345678901234567890123456789012345678901234567890121234567890123456789012345678901234567890123456789012123456789012345678901234567890123456789012345678901212345678901234567890123456789012345678901234567890121234567890123456789012345678901234567890123456789012123456789012345678901234567890123456789012345678901212345678901234567890123456789012345678901234567890121234567890123456789012345678901234567890123456789012123456789012345678901234567890123456789012345678901212345678901234567890123456789012345678901234567890121234567890123456789012345678901234567890123456789012123456789012345678901234567890123456789012345678901212345678901234567890123456789012345678901234567890121234567890123456789012345678901234567890123456789012123456789012345678901234567890123456789012345678901212345678901234567890123456789012345678901234567890121234567890123456789012345678901234567890123456789012123456789012345678901234567890123456789012345678901212345678901234567890123456789012345678901234567890121234567890123456789012345678901234567890123456789012123456789012345678901234567890123456789012345678901212345678901234567890123456789012345678901234567890121234567890123456789012345678901234567890123456789012123456789012345678901234567890123456789012345678901212345678901234567890123456789012345678901234567890121234567890123456789012345678901234567890123456789012123456789012345678901234567890123456789012345678901212345678901234567890123456789012345678901234567890121234567890123456789012345678901234567890123456789012123456789012345678901234567890123456789012345678901212345678901234567890123456789012345678901234567890121234567890123456789012345678901234567890123456789012123456789012345678901234567890123456789012345678901212345678901234567890123456789012345678901234567890121234567890123456789012345678901234567890123456789012123456789012345678901234567890123456789012345678901212345678901234567890
Rev iewed by Ms .B i ndu K .Namb ia r, As s i s t an tP ro f e s so r -Ma r ke t i n g , SCMS -COCH IN , P r a t apNagar, Mut tom, A luva-683106, Coch in , Ema i l :b indhuknamb ia r@scmsg roup .org
he 14th edition of Marketing authored by Michael J.Etzel, William Stanton, Bruce Walker and Ajay Pandit,has ample coverage on the fundamental marketing
concepts, strategies, and techni-ques that serve as theco rne r -s tones o f ma r ke t i ngprogrammes. The book carr iesfour themes throughout globalmarketing, ethical challenges, themarketer as decision maker, andthe impact of technology onmarketing. Perspectives from thebusiness world, direct from thepract i -t ioners and indirect byexamining periodicals and tradejournals have made this book richin information. It is evident by theopening cases introduced beforeeach chapter that highlights thekey concepts discussed in the
chapter. Also the companies featured in the opening chaptercases are revisited at the end of the chapter in the ‘moreabout feature.’ There are eight additional cases in the Indiancontext that will help the readers in applying the concepts
to conditions in India.
This new edit ion of ‘Marketing’examines the growing role thattechnology has in marketing. Thebook enlightens us on how thetechnologica l advances af fectbusiness in ways such as peopleand organizations communicate.Another very s ign i f icant t rendcovered in th is book is aboutinternationalization of business;how corporations are now thinkingand acting globally in selectingsuppliers and seeking customers.

SCMS Journal of Indian Management , Apr i l - June, 2010. 123
A Quarterly Journal
The topics are organized around seven themes that arelogically built from the fundamental concepts, strategies andtechniques through the major tasks associated with marketingto the strategic role of marketing in an organization. Thethemes are nature and scope of marketing, identifying andselecting markets, product, price, distribution, promotionand managing the marketing effor t.
In the book there two perspectives that need specialmention there is physical environment reflected in topicssuch as global warming, air and water qual ity, and wastedisposal, and influence marketing with regards to the useof natural resources, prol i ferat ion of products and theeff iciency of how products are distr ibuted. There is alsoa greater interest in eth ica l and socia l ly respons ib lebehaviour by exhibiting concerns on health and nutrit ion,product safety, adver tis ing claims, brand protection andunderstandable pricing. These ideas fur ther concrete the
belief that marketing can and should be applied to everysituation.
Other notewor thy features of this book include the aptref lect ion of the internet’s role us ing examples, webaddresses and vignettes. The chapter opening and par tending cases , wi th in chapter boxes and in teract ivemarketing exercises at the end of each chapter are usefulinstruments for stimulating active learning through project,classroom discussions and debates. When compared withthe previous editions this text has been shor tened withoutreducing the number of topics covered.
Finally, this book has come as a package that wil l not onlyhelp the students to prepare themselves for a challenging,dynamic and exc i t ing fu tu re but a l so prov id ing theinstructors with practical material that can be integratedinto the course.

SCMS Journal of Indian Management , April - June, 2010. 124
A Quarterly Journal
12345678901234567890123456789012123456789012345678901234567890121234567890123451234567890123456789012345678901212345678901234567890123456789012123456789012345123456789012345678901234567890121234567890123456789012345678901212345678901234512345678901234567890123456789012123456789012345678901234567890121234567890123451234567890123456789012345678901212345678901234567890123456789012123456789012345123456789012345678901234567890121234567890123456789012345678901212345678901234512345678901234567890123456789012123456789012345678901234567890121234567890123451234567890123456789012345678901212345678901234567890123456789012123456789012345123456789012345678901234567890121234567890123456789012345678901212345678901234512345678901234567890123456789012123456789012345678901234567890121234567890123451234567890123456789012345678901212345678901234567890123456789012123456789012345123456789012345678901234567890121234567890123456789012345678901212345678901234512345678901234567890123456789012123456789012345678901234567890121234567890123451234567890123456789012345678901212345678901234567890123456789012123456789012345123456789012345678901234567890121234567890123456789012345678901212345678901234512345678901234567890123456789012123456789012345678901234567890121234567890123451234567890123456789012345678901212345678901234567890123456789012123456789012345123456789012345678901234567890121234567890123456789012345678901212345678901234512345678901234567890123456789012123456789012345678901234567890121234567890123451234567890123456789012345678901212345678901234567890123456789012123456789012345
Scanningand
Skimming
Book Title : Strategic ManagementText and Cases
Author : Gregory G. Dess, G.T. Lumpkin, and
Alan B. Eisner
Edition : Third - 2009
ISBN-13 : 978-0-07-067740-1
Pages : 984Publisher : Tata McGraw-Hill Hill Education Pvt. Ltd., New Delhi.
A123456789012345678901234567890121234567890123456789012345678901234567890123456789012123456789012345678901234567890123456789012345678901212345678901234567890123456789012345678901234567890121234567890123456789012345678901234567890123456789012123456789012345678901234567890123456789012345678901212345678901234567890123456789012345678901234567890121234567890123456789012345678901234567890123456789012123456789012345678901234567890123456789012345678901212345678901234567890123456789012345678901234567890121234567890123456789012345678901234567890123456789012123456789012345678901234567890123456789012345678901212345678901234567890123456789012345678901234567890121234567890123456789012345678901234567890123456789012123456789012345678901234567890123456789012345678901212345678901234567890123456789012345678901234567890121234567890123456789012345678901234567890123456789012123456789012345678901234567890123456789012345678901212345678901234567890123456789012345678901234567890121234567890123456789012345678901234567890123456789012123456789012345678901234567890123456789012345678901212345678901234567890123456789012345678901234567890121234567890123456789012345678901234567890123456789012123456789012345678901234567890123456789012345678901212345678901234567890123456789012345678901234567890121234567890123456789012345678901234567890123456789012123456789012345678901234567890123456789012345678901212345678901234567890123456789012345678901234567890121234567890123456789012345678901234567890123456789012123456789012345678901234567890123456789012345678901212345678901234567890123456789012345678901234567890121234567890123456789012345678901234567890123456789012123456789012345678901234567890123456789012345678901212345678901234567890123456789012345678901234567890121234567890123456789012345678901234567890123456789012123456789012345678901234567890123456789012345678901212345678901234567890123456789012345678901234567890121234567890123456789012345678901234567890123456789012123456789012345678901234567890123456789012345678901212345678901234567890123456789012345678901234567890121234567890123456789012345678901234567890123456789012123456789012345678901234567890123456789012345678901212345678901234567890123456789012345678901234567890121234567890123456789012345678901234567890123456789012123456789012345678901234567890123456789012345678901212345678901234567890
R e v i e w e d b y D r. S u s a n A b r a h a m , A s s i s t a n tP r o f e s s o r, S C M S S c h o o l o f Te c h n o l o g y a n dM a n a g e m e n t ( S S T M ) , P r a t a p N a g a r, M u t t o m ,A l u v a - 6 8 3 1 0 6 , C o c h i n , E - m a i l : s u s a na b r a h a m @ s c m s g r o u p . org
study of strategic management is an interest ingone as i t can make a struggl ing f i rm become ahighflying one. Given the many oppor tunities and
challenges faced by organisation in the global environment,‘incremental’ decision making hasg iven way to manag ing orga-nisations ‘strategically.’ This hasensured long term success toorganisations.
The book Strategic ManagementTex t and Cases au thored byGregory G. Dess, G.T. Lumpkin andAlan B. Eisner, is the third editionby the same authors. The presentedition carries many new featuresalong with the existing ones fromthe earlier edition. The book hasfour par ts.
Par t 1 involves Strategic Analysis. Chapter one has the baseso f s t r a teg ic management a long w i th d i scuss ion onstakeholder analysis and chapter two discusses the dynamicnature of industries building on the work of Anita McGahan
dealing with evolutionary traje-ctories of industries based on twothreats of obsolescence. Thechapter three on internal analysisincludes a discussion on balancedscorecard and preparat ion ofstrategy map. Chapter four is onana lys i s o f i n te l lec tua l asse tsincorporates a discussion on e-teams, diverse workforce and theimpor tance of both human capitaland social capital.
Par t two examines Strategic Formu-lation which discusses business-level strategy in chapter five with

SCMS Journal of Indian Management , Apr i l - June, 2010. 125
A Quarterly Journal
focus on developing competitive strategies. Corporate levelstrategy formulation is discussed in chapter six with a focuson consolidation effor ts. The role of managerial conceit isdiscussed in real options analysis. The potential benefits andpitfalls of off-shoring as part of formulation of internationalstrategy are covered in chapter seven. The disruptive impactand also the opportunities created by internet and digitaltechnologies are described in chapter eight.
Par t 3 discusses Strategic Implementation. This part has fivechapters with focus mainly on corporate governance in aninternational perspective (chapter nine), the dilemma betweenoppor tunities and structure leading to the formation of‘ambidextrous’ organisations (chapter ten), the role ofEmotional Intelligence of leaders in today ’s organisations,ethics and learning organisations (chapter eleven), theapplication of blue ocean strategy in fostering a viableinnovation strategy (chapter twelve) and the role of strategicalliances of young and small firms (chapter thirteen).
Par t 4 involves Case Analysis. This par t has an outstandingcollection of 41 case studies dealing with various industrysegments. There are short, medium length and long casestudies that deal with the success stories and failures of thesecompanies. These cases also provide an understandingregarding the pitfalls in not using a strategic framework inmanaging these enterprises to the readers.
There are certain additional features in the third edition ascompared to the earlier editions. First, chapters are arrangedfrom traditional concepts to the most modern strategic
activities of a firm. Second, 10 of the 13 opening mini casesare new. These cases are meant to lay a firm foundation of theneed to understand to be discussed in the chapter in theminds of the reader. Third, each chapter is laid out to addvalue and create an enhanced learning experience. Eachchapter begins with an overview and learning objectivesfollowed by an opening case, questions / exercises at theend of the chapter. Four th, short examples from businesspractice to i l lustrate every concept and more detailedexamples to explain key points. Fifth, inclusion of 110 StrategySpotl ights i l lustrates key points of the concept. Sixth,application of each concept to star t-up firms and smallerbusinesses is justified. Seventh, inclusion of cases from TheHarvard Business School and The Harvard Business Reviewreinforces the text. Overall, the third edition of StrategicManagement Text and Cases is written in a simple and readablemanner illustrated by exhibits, mini cases, examples andapplication exercises.
The book is a va luable one for s tudents of Bus inessAdministration at the Post Graduate level. For the instructors,this book provides immense help through supplementarymaterials for class preparation and delivery.
Among the authors, Gregory G. Dess is a Chair Professor atUniversity of Texas at Dal las. G.T. Lumpkin is AssociateProfessor of Management and Entrepreneurship at theUniversity of Ill inois at Chicago. Alan B. Eisner is AssociateProfessor of Management and Graduate ManagementProgramme Chair at the Lubin School of Business, PaceUniversity.

SCMS Journal of Indian Management , April - June, 2010. 126
A Quarterly Journal
1234567890123456789012345678901212345678901234567890123456789012123456789012345123456789012345678901234567890121234567890123456789012345678901212345678901234512345678901234567890123456789012123456789012345678901234567890121234567890123451234567890123456789012345678901212345678901234567890123456789012123456789012345123456789012345678901234567890121234567890123456789012345678901212345678901234512345678901234567890123456789012123456789012345678901234567890121234567890123451234567890123456789012345678901212345678901234567890123456789012123456789012345123456789012345678901234567890121234567890123456789012345678901212345678901234512345678901234567890123456789012123456789012345678901234567890121234567890123451234567890123456789012345678901212345678901234567890123456789012123456789012345123456789012345678901234567890121234567890123456789012345678901212345678901234512345678901234567890123456789012123456789012345678901234567890121234567890123451234567890123456789012345678901212345678901234567890123456789012123456789012345123456789012345678901234567890121234567890123456789012345678901212345678901234512345678901234567890123456789012123456789012345678901234567890121234567890123451234567890123456789012345678901212345678901234567890123456789012123456789012345123456789012345678901234567890121234567890123456789012345678901212345678901234512345678901234567890123456789012123456789012345678901234567890121234567890123451234567890123456789012345678901212345678901234567890123456789012123456789012345
Scanningand
Skimming
Book Title : Fundamentals of InvestmentManagement
Author : Geoffrey A. Hirt and Stanley B.Block
Edition : Eighth - 2009
ISBN-13 : 978-0-07-067739-5
Pages : 710
Publisher : Tata McGraw-Hills Publishing-
Co. Ltd., New Delhi.
I123456789012345678901234567890121234567890123456789012345678901234567890123456789012123456789012345678901234567890123456789012345678901212345678901234567890123456789012345678901234567890121234567890123456789012345678901234567890123456789012123456789012345678901234567890123456789012345678901212345678901234567890123456789012345678901234567890121234567890123456789012345678901234567890123456789012123456789012345678901234567890123456789012345678901212345678901234567890123456789012345678901234567890121234567890123456789012345678901234567890123456789012123456789012345678901234567890123456789012345678901212345678901234567890123456789012345678901234567890121234567890123456789012345678901234567890123456789012123456789012345678901234567890123456789012345678901212345678901234567890123456789012345678901234567890121234567890123456789012345678901234567890123456789012123456789012345678901234567890123456789012345678901212345678901234567890123456789012345678901234567890121234567890123456789012345678901234567890123456789012123456789012345678901234567890123456789012345678901212345678901234567890123456789012345678901234567890121234567890123456789012345678901234567890123456789012123456789012345678901234567890123456789012345678901212345678901234567890123456789012345678901234567890121234567890123456789012345678901234567890123456789012123456789012345678901234567890123456789012345678901212345678901234567890123456789012345678901234567890121234567890123456789012345678901234567890123456789012123456789012345678901234567890123456789012345678901212345678901234567890123456789012345678901234567890121234567890123456789012345678901234567890123456789012123456789012345678901234567890123456789012345678901212345678901234567890123456789012345678901234567890121234567890123456789012345678901234567890123456789012123456789012345678901234567890123456789012345678901212345678901234567890123456789012345678901234567890121234567890123456789012345678901234567890123456789012123456789012345678901234567890123456789012345678901212345678901234567890123456789012345678901234567890121234567890123456789012345678901234567890123456789012123456789012345678901234567890123456789012345678901212345678901234567890123456789012345678901234567890121234567890123456789012345678901234567890123456789012123456789012345678901234567890123456789012345678901212345678901234567890
Th i s book was rev i ewed by Mr.P. Sudhaka r aMenon, a Char te red Accountant hav ing longi n d u s t r i a l e x p e r i e n c e . H e r e t i r e d f r o m t h ese r v i ce s o f FACT L td . , a s Gene r a l Manage r(Market ing). He has a lso worked in TCC Ltd.as Di rector (F inance), Emai l : s .menon@vsnl .net
Investment management is the professional managementof various financial instruments like securities, assets etc.to meet specified investment goals for the benefit of the
investor/s . I t i s a la rge g lobalindustry responsible for managingof billions of dollars and many ofthe world’s large companies are atleast in part investment managersand employ millions of staff andcreate billions in revenue.
As a corol lar y to today ’s fastchanging technology driven world,f i nanc ia l ma rke t s a l so haveundergone unprecedented changes.To be successful an investmentmanager, be it for oneself or as aprofess iona l , need to have areasonably good knowledge of the
nuances of the current financial markets, instruments in placeand tools available for the evaluation.
The book attempts to provide abroad spectrum of investmentmanagement concepts andprinciples, divided into 22 chapterscovering inter alia security markets,der ivat ive products , por t fo l iomanagement and financial state-ment analysis. The added attractionof the book i s i nc lus ion o fexamples to facilitate easy under-standing of the concepts and todrive home key factors.
The book deals with the financialmarket in USA as the authors arepro fess iona l s f rom USA . The

SCMS Journal of Indian Management , Apr i l - June, 2010. 127
A Quarterly Journal
economic policy and activity seen discussed in this bookare those of the Federal Govt. However, barring a fewexamples & data, regulatory provisions and statutory codes,most of the principles and concepts discussed are havinguniversal application par ticularly in the contemporary globalmarket.
The d iscuss ion quest ions g iven a t the end of eachchapter enable an av id learner to ensure adequateas s im i l a t ion o f t he t echn iques d i scus sed i n eachchapter. The glossar y and idex presented in the lastpages would serve as a quick reference guide. Howeverthe authors do not seem to have thought of char t ingcompar ison of the mer i ts , demeri ts and r isks of eachinstrument avai lable for investment, which would haveserved to highl ight the points to be focussed beforetak ing investment decis ions.
Chapter 22 is on ‘measuring risks and returns of por tfoliomanagers.’ No detailed discussion is seen on the techniquesavailable for risk audit and analysis and also on how to usethem before each investment decision. Any investmentdecision can be catastrophic unless sound risk analysis toolsare applied and risk assessed before the investment. Thischapter could have been made more serious by includingsome real life examples also, which may be in plenty in therecent past.
Despite the above, th is book would be useful for thoseprospect ive investors or s tudents to understand thebas ics of investment management . Th is book woulda l so ser ve to know the oppor tun i t ies and f inanc ia lp r o d u c t s a v a i l a b l e i n t h e f i n a n c i a l l a n d s c a p e , t ounderstand the f inancia l s ta tements of an organ isat iona n d a s s e s s i t s f i n a n c i a l h e a l t h b e f o r e t a k i n g a ninvestment decis ion.

SCMS Journal of Indian Management , April - June, 2010. 128
A Quarterly Journal
12345678901234567890123456789012123456789012345678901234567890121234567890123456123456789012345678901234567890121234567890123456789012345678901212345678901234561234567890123456789012345678901212345678901234567890123456789012123456789012345612345678901234567890123456789012123456789012345678901234567890121234567890123456123456789012345678901234567890121234567890123456789012345678901212345678901234561234567890123456789012345678901212345678901234567890123456789012123456789012345612345678901234567890123456789012123456789012345678901234567890121234567890123456123456789012345678901234567890121234567890123456789012345678901212345678901234561234567890123456789012345678901212345678901234567890123456789012123456789012345612345678901234567890123456789012123456789012345678901234567890121234567890123456123456789012345678901234567890121234567890123456789012345678901212345678901234561234567890123456789012345678901212345678901234567890123456789012123456789012345612345678901234567890123456789012123456789012345678901234567890121234567890123456123456789012345678901234567890121234567890123456789012345678901212345678901234561234567890123456789012345678901212345678901234567890123456789012123456789012345612345678901234567890123456789012123456789012345678901234567890121234567890123456123456789012345678901234567890121234567890123456789012345678901212345678901234561234567890123456789012345678901212345678901234567890123456789012123456789012345612345678901234567890123456789012123456789012345678901234567890121234567890123456
Scanningand
Skimming
Book Title : New Venture CreationAuthor : Jeffry A.Timmons and Stephen Spinelli
Edition : Seventh - 2009
ISBN-13 : 978-0-07-067738-8
Pages : 658
Publisher : Tata McGraw-Hills Publishing-
Co. Ltd., New Delhi.
123456789012345678901234567890121234567890123456789012345678901234567890123456789012123456789012345678901234567890123456789012345678901212345678901234567890123456789012345678901234567890121234567890123456789012345678901234567890123456789012123456789012345678901234567890123456789012345678901212345678901234567890123456789012345678901234567890121234567890123456789012345678901234567890123456789012123456789012345678901234567890123456789012345678901212345678901234567890123456789012345678901234567890121234567890123456789012345678901234567890123456789012123456789012345678901234567890123456789012345678901212345678901234567890123456789012345678901234567890121234567890123456789012345678901234567890123456789012123456789012345678901234567890123456789012345678901212345678901234567890123456789012345678901234567890121234567890123456789012345678901234567890123456789012123456789012345678901234567890123456789012345678901212345678901234567890123456789012345678901234567890121234567890123456789012345678901234567890123456789012123456789012345678901234567890123456789012345678901212345678901234567890123456789012345678901234567890121234567890123456789012345678901234567890123456789012123456789012345678901234567890123456789012345678901212345678901234567890123456789012345678901234567890121234567890123456789012345678901234567890123456789012123456789012345678901234567890123456789012345678901212345678901234567890123456789012345678901234567890121234567890123456789012345678901234567890123456789012123456789012345678901234567890123456789012345678901212345678901234567890123456789012345678901234567890121234567890123456789012345678901234567890123456789012123456789012345678901234567890123456789012345678901212345678901234567890123456789012345678901234567890121234567890123456789012345678901234567890123456789012123456789012345678901234567890123456789012345678901212345678901234567890123456789012345678901234567890121234567890123456789012345678901234567890123456789012123456789012345678901234567890123456789012345678901212345678901234567890123456789012345678901234567890121234567890123456789012345678901234567890123456789012123456789012345678901234567890123456789012345678901212345678901234567890
R e v i e w e d b y P r o f . K . J . P a u l o s e , D e a n ,Managemen t S tud ies , SCMS-COCHIN , P r a t apN a g a r , M u t t o m , A l u v a - 6 8 3 1 0 6 , C o c h i n ,Ema i l : k jpau lo se@scmsg roup .org
ew Venture Creation is an apt title for a book onEntrepreneurship, that too, for one authored bytwo eminent personalities, each with his own
proven track record in the field of Entrepreneurship Education.(This is what of the former students of Dr. Timmons has to sayabout the latter ’s lectures on Entrepreneurship: “When goingto his classes, I couldn’t wait to getthere; and when I got there, I didn’tever want to leave!” Dr.Spinelli hasbeen defined as a “Pracademic” inEnt repreneursh ip: a bus inesspractitioner turned academic).
As the authors rightly claim the bookforms a basis for curriculum for acourse on Entrepreneurship at theMBA leve l . I t addresses thechallenges of uncer tainties andopportunities thrown up by thenew millennium. It is a product if
N “experience in the field, rooted in the real world applicationand refined in the classroom.”
The book is divided into five parts: Par t I deals with theEntrepreneurial Mind and the Entrepreneurial Society, in thecontext of globalization. It touches upon aspects such as
leadership, Entrepreneurial traits andstrategy formulation. At the end ofChapter I, there is a detailed exercisewhich will enable a prospectiveent re-preneur to formula te apersonal strategy. Chapter II touchesupon venture capital, philanthropyand ‘women and youth’ in business.
Part II deals with the EntrepreneurialProcess, star ting with identifying/creating/seizing/screening oppor-tun i t ies and ending wi th thepreparation of a Business Plan. The

SCMS Journal of Indian Management , Apr i l - June, 2010. 129
A Quarterly Journal
‘B.P.guide’ given at the end of this section can be of immensehelp to any budding entrepreneur. Issues related to the creationof an Entrepreneurial team are dealt with in Part III. The topicscovered include Culture, Decis ion Making, Manager ia lCompetencies, Team work, Conflict Management and role ofIT & Systems Management.
In Par t IV, the Financing aspects are dealt with. Issues such asEst imation of Resource Requirements, Venture Capital ,Franchising, Valuation and Debt Capital are covered in greatdetail. Star t-up and growth strategies are covered in Par t V.Best pract ices of high growth companies, Fami ly andEntrepreneurship, Gestation Period Crisis and OrganizationalDecline are the main themes covered under this section. Thelast chapter, “Harvest and Beyond” deals with exit strategies,such as divestment, mergers/acquisition/strategic alliances, andconcludes with “The Seven Secrets of Success.”
The most impressive aspect of the book is that almost all thechapters are supplemented by case studies quite relevant tothe topics covered. Internet links have been provided for eachchapter. Another interesting feature is the inclusion of ‘MindStretchers’ and Exercises under each chapter, which challengesthe readers / students to think well beyond themes coveredby the text. The 7th edition which is under review containsseveral new data, chapters’ cases, and revisions as comparedto the previous ones.
The book can be classified as a ‘must-read’ for Teachers,Students, Consultants and Researchers in the f ie ld ofEntrepreneurship as well as for aspiring Entrepreneurs. The qualityof presentation does full justice to the richness of the contents,although the ‘photocopied look’ leaves a jarring note in themind of the reader, especially with regard to charts, graphs anddiagrams.

CERTIFICATE OF REGISTRATION
Title of Newspaper : SCMS JOURNAL OF INDIAN MANAGEMENT
Language : English(in which it is to be published)
Registration Number of the Newspaper :
Periodicity of the publication and the : Quarterlyday on which it is published 1 January, 1 April, 1 July, and 1 October
Retailing Selling price of the : Rs.1000/- (One Year Subscription)Newspaper
Publisher’s Name : Dr.D.Radhakrishnan Nair
Nationality : Indian
Address : 25/74, Ambady,Kothamangalam-686 691, Ernakulam.
Place of publication : Prathap Nagar, Muttom,(with complete Postal address) Aluva-683 106, Ernakulam District, Kerala.
Printer’s Name : Dr.D.Radhakrishnan Nair
Nationality : Indian
Address : 25/74, Ambady,Kothamangalam-686 691, Ernakulam.
Name of the Printing Press(with complete address where printing : Maptho Printings, Kalamassery, Cochin-683104is to be conducted)
Editor’s Name : Dr.D.Radhakrishnan Nair
Nationality : Indian
Address : 25/74, Ambady,Kothamangalam-686 691, Ernakulam.
Owner’s Name : SCMS-COCHIN
Place : Prathap Nagar, Muttom.

SCMS Journal of Indian Managementa quarterly publication
ofSCMS-COCHIN
Dates of Release: -
Number I – January-March on 1 April
Number II – A p r i l - J u n e o n 1 J u l y
Number III – July-September on 1 October
Number IV – October-December on 1 January
© SCMS Journal of Indian Management, SCMS New Campus, Prathap Nagar, Muttom, Aluva-683106, Kochi, Kerala, IndiaPh: 91-484-262 3803 / 262 3804 / 262 3885 / 262 3887 Fax: 91-484-262 3855, Website: www.scmsgroup.orgE-mail: [email protected] / [email protected]
Al l r ights reser ved. No par t of th is publ icat ion may be reproduced in any form without the wr i t ten consent of thepubl i sher. School o f Commun ica t ion and Management S tud ies and SCMS Jour na l o f Ind ian Management assumeno respons ib i l i t y fo r the v iews expressed or in format ion fu rn i shed by the authors . Ed i ted and publ i shed by theEd i tor fo r and on beha l f o f SCMS and pr in ted a t Maptho P r in t ings , Coch in-683104.
SCMS Journal of Indian ManagementSCMS-COCHIN
SCMS New Campus, Prathap NagarMuttom, Aluva-683 106, Kochi, Kerala, India
Ph: 91-484-262 3803 / 262 3804 / 262 3885 / 262 3887 Fax: 91-484-262 3855E-mail: ed i to [email protected] / scmsed i to rcoch [email protected]
Website: www.scmsgroup.org

SCMS JOURNAL OF INDIAN MANAGEMENT12345678901234567890123456789012123456789012345678901234567890121234567890123456789012345678901212345678901234567890123456789012123456789012345678901234567890123456789012345678901212345678901234567890123456789012123456789012345678901234567890121234567890123456789012345678901212345678901234567890
Aims and ScopeThe SCMS Journal of Indian Management is a blind peer-reviewed Journal. The Journal deems it its mission to submitto the readers fresh fruit of management thoughts and rich cream of current innovative research. The format of the Journalis designed reader-friendly. The academia and the corporates have an easy access to the Journal.
The Journal looks for ar ticles conceptually sound, at once methodologically rigorous. The Journal loves to deal knowl-edge in management theory and practice individually and in unison. We wish our effor t would bear fruit. We hope theJournal wil l have a long l ife in the shelves catering to the needs of b-students and b-faculty.
§ Proposals for ar ticles that demonstrate clear and bold thinking, fresh and useful ideas, accessible and jargon-free expression, and unambiguous authority are invited. The following may be noted while ar ticles are prepared.
§ What is the central message of the ar ticle you propose to write? Moreover, what is new, useful, counterintuitive,or impor tant about your idea?
§ What are the real-world implications of the proposed ar ticle? Can the central message be applied in businessestoday, and if so, how?
§ Who is the audience for your ar ticle? Why should a busy manager stop and read it?
§ What kind of research have you conducted to support the argument or logic in your article?
§ What academic, professional, or personal experience wil l you draw on to make the argument convincing? Inother words, what is the source of your authority?
§ The manuscript of reasonable length shall be sent to the Editor—SCMS Journal of India Management (Both forpostal and electronic submission details are given here under).
The manuscript should accompany the following separately:§ An abst ract (about 100 words) , a br ie f b iographica l sketch of above 100 words for authors descr ib ing
des ignat ion, a f f i l i a t ion, specia l izat ion, number of books and ar t ic les publ i shed in the referee jour na ls ,membersh ip on edi tor ia l boards and companies etc.
§ The declaration to the effect that the work is original and it has not been published earlier shall be sent.
§ Tables, charts and graphs should be typed in separate sheets. They should be numbered as Table 1, Graph 1 etc.
§ References used should be listed at the end of the text.
§ Editors reserve the right to modify and improve the manuscripts to meet the Journal’s standards of presentation and style.
§ Editors have full right to accept or reject an ar ticle for publication. Editorial decisions will be communicated within a period of four weeks of the receipt of the manuscripts.
§ All footnotes will be appended at the end of the article as a separate page. The typo script should use smaller size fonts.1234567890123456789012345678901212345678901234567890123456789012123456789012345678901234567890121234567890123456789012345678901212345678901234567890112345678901234567890123456789012123456789012345678901234567890121234567890123456789012345678901212345678901234567890123456789012123456789012345678901
Address for SubmissionElectronic Submission: E-mail: ed i to [email protected] /
scmsedi [email protected] electronic submission must be in the form of an attachment with a coveringlet ter to be sent as e-mai l
Post Submission : The Edi torSCMS Journal of Indian Management,SCMS New Campus, Prathap Nagar, Muttom,Aluva – 683106, Kochi, Kerala, IndiaPh : +91 484 2623803, 2623804, 2623885, 2623887Fax : +91 484 2623855
1234567890123456789012345678901212345678901234567890123456789012123456789012345678901234567890121234567890123456789012345678901212345678901234567890112345678901234567890123456789012123456789012345678901234567890121234567890123456789012345678901212345678901234567890123456789012123456789012345678901


SCMS Journal of Indian Management
Subscription / Advertisement Form
Name :Address :
City :Zip Code :Country :E-mail :Phone :Draft Number :
(in favour of “SCMS Journal of Indian Management, Cochin”)
Companies/Academic Institutes : 1000 ($60) 1800 ($100) 250 ($15)
Individual : 800 1500 200
Advertisement Rate
Outside back cover : Rs.30,000 in color, Rs.15,000 in black and white
Inside front cover : Rs.17,500 in color, Rs.10,000 in black and white
Inside back cover : Rs.15,000 in color, Rs.6,000 in black and white
Inner full-page : Rs.7500 in color, Rs.4,000 in black and white
Inner half-page : Rs.5000 in color, Rs.3,000 in black and white
For all communications contact:Editor, SCMS Journal of Indian Management, SCMS New Campus, Prathap Nagar, Muttom,Aluva - 683106, Kochi, Kerala, India.Phone: 91-484-262 3803 / 262 3804 / 262 3885 / 262 3887 Fax: 91-484-262 3855Website: www.scmsgroup.org E-mail: [email protected]
1 year 2 years Per issueSubscription Rates


Case in Competency: Training need AssessmentA n i t h a Th o m a s a n d A n i r u d h a P a n c h a l
SCM and Marketing Management: Mutual IntegrationP a n k a j M . M a d h a n i
Organizational Climate: BPO IndustryAv i n a s h K u m a r S r i v a s t a v
Brand Awareness: Baby Food ProductsK e e r t h i P a n d i a n a n d R a m a c h a n d r a n K . K .
Product Mix Strategies: FMCG in Indian MarketM o h a n k u m a r T. P. a n d S h i v a r a j B .
Small is Beautiful? Corporate Social ResponsibilityP r a s e n j i t M a i t i
Car Industry: SWOT AnalysisD h a r m a r a j C . , S i v a s u b r a m a n i a n M . , a n d C l e m e n t S u d h a h a r J .
Ordering of Companies: Proposed - Profitability ScoresDilip Roy and Anupama Tiwari
Single and Multiple Expectations: Service Quality RetailingRavichandran K., Abdus Samad K. and David Sam Jayakumar G.S.
Ownership Structure in Iran: Firms' ResponsibilityVa h i d e h H o s e i n i N o d e h a n d A i s h a M . S h e r i f f
Retail FranchisingS r e e k u m a r P i l l a i
Managerial AccountingMakesh K.G.
MarketingBindu K.Nambiar
Strategic Management Text and CasesSusan Abraham
Fundamentals of Investment ManagementSudhakara Menon
New Venture CreationP a u l o s e K . J .
0 0
0 0
0 0
0 0
0 0
0 0
0 0
0 0
SCMSJOURNAL OF
INDIAN MANAGEMENTListed in Cabell’s Directory I S S N 0 9 7 3 - 3 1 6 7
L O G I S T I C S
C H I L D - H E A LT H
R O A D M A P P I N G
D I S C R I M I N A N T S C O R E
B R I D G I N G G A P
D Y N A M I C S
G A P - F I L L I N G
C O N S U M E R S T I M U L I
MODELLING GAPS
VOLUME VII, NUMBER IIAPRIL-JUNE 2010
S T R U C T U R I N G
SKIMMING
S
K
I
M
M
I
N
G
&
S
C
A
N
N
I
N
G
123456789012345678901234567890121234567890123456789012345678901212345678901234567890123456789012123456789012345123456789012345678901234567890121234567890123456789012345678901212345678901234567890123456789012123456789012345123456789012345678901234567890121234567890123456789012345678901212345678901234567890123456789012123456789012345123456789012345678901234567890121234567890123456789012345678901212345678901234567890123456789012123456789012345123456789012345678901234567890121234567890123456789012345678901212345678901234567890123456789012123456789012345123456789012345678901234567890121234567890123456789012345678901212345678901234567890123456789012123456789012345123456789012345678901234567890121234567890123456789012345678901212345678901234567890123456789012123456789012345123456789012345678901234567890121234567890123456789012345678901212345678901234567890123456789012123456789012345123456789012345678901234567890121234567890123456789012345678901212345678901234567890123456789012123456789012345123456789012345678901234567890121234567890123456789012345678901212345678901234567890123456789012123456789012345123456789012345678901234567890121234567890123456789012345678901212345678901234567890123456789012123456789012345123456789012345678901234567890121234567890123456789012345678901212345678901234567890123456789012123456789012345123456789012345678901234567890121234567890123456789012345678901212345678901234567890123456789012123456789012345123456789012345678901234567890121234567890123456789012345678901212345678901234567890123456789012123456789012345123456789012345678901234567890121234567890123456789012345678901212345678901234567890123456789012123456789012345123456789012345678901234567890121234567890123456789012345678901212345678901234567890123456789012123456789012345123456789012345678901234567890121234567890123456789012345678901212345678901234567890123456789012123456789012345123456789012345678901234567890121234567890123456789012345678901212345678901234567890123456789012123456789012345123456789012345678901234567890121234567890123456789012345678901212345678901234567890123456789012123456789012345123456789012345678901234567890121234567890123456789012345678901212345678901234567890123456789012123456789012345123456789012345678901234567890121234567890123456789012345678901212345678901234567890123456789012123456789012345123456789012345678901234567890121234567890123456789012345678901212345678901234567890123456789012123456789012345123456789012345678901234567890121234567890123456789012345678901212345678901234567890123456789012123456789012345123456789012345678901234567890121234567890123456789012345678901212345678901234567890123456789012123456789012345123456789012345678901234567890121234567890123456789012345678901212345678901234567890123456789012123456789012345123456789012345678901234567890121234567890123456789012345678901212345678901234567890123456789012123456789012345123456789012345678901234567890121234567890123456789012345678901212345678901234567890123456789012123456789012345123456789012345678901234567890121234567890123456789012345678901212345678901234567890123456789012123456789012345123456789012345678901234567890121234567890123456789012345678901212345678901234567890123456789012123456789012345123456789012345678901234567890121234567890123456789012345678901212345678901234567890123456789012123456789012345123456789012345678901234567890121234567890123456789012345678901212345678901234567890123456789012123456789012345123456789012345678901234567890121234567890123456789012345678901212345678901234567890123456789012123456789012345123456789012345678901234567890121234567890123456789012345678901212345678901234567890123456789012123456789012345123456789012345678901234567890121234567890123456789012345678901212345678901234567890123456789012123456789012345123456789012345678901234567890121234567890123456789012345678901212345678901234567890123456789012123456789012345123456789012345678901234567890121234567890123456789012345678901212345678901234567890123456789012123456789012345123456789012345678901234567890121234567890123456789012345678901212345678901234567890123456789012123456789012345123456789012345678901234567890121234567890123456789012345678901212345678901234567890123456789012123456789012345123456789012345678901234567890121234567890123456789012345678901212345678901234567890123456789012123456789012345123456789012345678901234567890121234567890123456789012345678901212345678901234567890123456789012123456789012345123456789012345678901234567890121234567890123456789012345678901212345678901234567890123456789012123456789012345123456789012345678901234567890121234567890123456789012345678901212345678901234567890123456789012123456789012345123456789012345678901234567890121234567890123456789012345678901212345678901234567890123456789012123456789012345123456789012345678901234567890121234567890123456789012345678901212345678901234567890123456789012123456789012345123456789012345678901234567890121234567890123456789012345678901212345678901234567890123456789012123456789012345123456789012345678901234567890121234567890123456789012345678901212345678901234567890123456789012123456789012345123456789012345678901234567890121234567890123456789012345678901212345678901234567890123456789012123456789012345123456789012345678901234567890121234567890123456789012345678901212345678901234567890123456789012123456789012345123456789012345678901234567890121234567890123456789012345678901212345678901234567890123456789012123456789012345123456789012345678901234567890121234567890123456789012345678901212345678901234567890123456789012123456789012345123456789012345678901234567890121234567890123456789012345678901212345678901234567890123456789012123456789012345123456789012345678901234567890121234567890123456789012345678901212345678901234567890123456789012123456789012345123456789012345678901234567890121234567890123456789012345678901212345678901234567890123456789012123456789012345123456789012345678901234567890121234567890123456789012345678901212345678901234567890123456789012123456789012345123456789012345678901234567890121234567890123456789012345678901212345678901234567890123456789012123456789012345123456789012345678901234567890121234567890123456789012345678901212345678901234567890123456789012123456789012345123456789012345678901234567890121234567890123456789012345678901212345678901234567890123456789012123456789012345123456789012345678901234567890121234567890123456789012345678901212345678901234567890123456789012123456789012345123456789012345678901234567890121234567890123456789012345678901212345678901234567890123456789012123456789012345123456789012345678901234567890121234567890123456789012345678901212345678901234567890123456789012123456789012345123456789012345678901234567890121234567890123456789012345678901212345678901234567890123456789012123456789012345123456789012345678901234567890121234567890123456789012345678901212345678901234567890123456789012123456789012345123456789012345678901234567890121234567890123456789012345678901212345678901234567890123456789012123456789012345123456789012345678901234567890121234567890123456789012345678901212345678901234567890123456789012123456789012345123456789012345678901234567890121234567890123456789012345678901212345678901234567890123456789012123456789012345123456789012345678901234567890121234567890123456789012345678901212345678901234567890123456789012123456789012345123456789012345678901234567890121234567890123456789012345678901212345678901234567890123456789012123456789012345123456789012345678901234567890121234567890123456789012345678901212345678901234567890123456789012123456789012345123456789012345678901234567890121234567890123456789012345678901212345678901234567890123456789012123456789012345123456789012345678901234567890121234567890123456789012345678901212345678901234567890123456789012123456789012345123456789012345678901234567890121234567890123456789012345678901212345678901234567890123456789012123456789012345123456789012345678901234567890121234567890123456789012345678901212345678901234567890123456789012123456789012345123456789012345678901234567890121234567890123456789012345678901212345678901234567890123456789012123456789012345123456789012345678901234567890121234567890123456789012345678901212345678901234567890123456789012123456789012345123456789012345678901234567890121234567890123456789012345678901212345678901234567890123456789012123456789012345123456789012345678901234567890121234567890123456789012345678901212345678901234567890123456789012123456789012345123456789012345678901234567890121234567890123456789012345678901212345678901234567890123456789012123456789012345123456789012345678901234567890121234567890123456789012345678901212345678901234567890123456789012123456789012345123456789012345678901234567890121234567890123456789012345678901212345678901234567890123456789012123456789012345123456789012345678901234567890121234567890123456789012345678901212345678901234567890123456789012123456789012345123456789012345678901234567890121234567890123456789012345678901212345678901234567890123456789012123456789012345123456789012345678901234567890121234567890123456789012345678901212345678901234567890123456789012123456789012345123456789012345678901234567890121234567890123456789012345678901212345678901234567890123456789012123456789012345123456789012345678901234567890121234567890123456789012345678901212345678901234567890123456789012123456789012345123456789012345678901234567890121234567890123456789012345678901212345678901234567890123456789012123456789012345123456789012345678901234567890121234567890123456789012345678901212345678901234567890123456789012123456789012345123456789012345678901234567890121234567890123456789012345678901212345678901234567890123456789012123456789012345123456789012345678901234567890121234567890123456789012345678901212345678901234567890123456789012123456789012345123456789012345678901234567890121234567890123456789012345678901212345678901234567890123456789012123456789012345123456789012345678901234567890121234567890123456789012345678901212345678901234567890123456789012123456789012345123456789012345678901234567890121234567890123456789012345678901212345678901234567890123456789012123456789012345123456789012345678901234567890121234567890123456789012345678901212345678901234567890123456789012123456789012345123456789012345678901234567890121234567890123456789012345678901212345678901234567890123456789012123456789012345123456789012345678901234567890121234567890123456789012345678901212345678901234567890123456789012123456789012345123456789012345678901234567890121234567890123456789012345678901212345678901234567890123456789012123456789012345123456789012345678901234567890121234567890123456789012345678901212345678901234567890123456789012123456789012345123456789012345678901234567890121234567890123456789012345678901212345678901234567890123456789012123456789012345123456789012345678901234567890121234567890123456789012345678901212345678901234567890123456789012123456789012345123456789012345678901234567890121234567890123456789012345678901212345678901234567890123456789012123456789012345123456789012345678901234567890121234567890123456789012345678901212345678901234567890123456789012123456789012345123456789012345678901234567890121234567890123456789012345678901212345678901234567890123456789012123456789012345123456789012345678901234567890121234567890123456789012345678901212345678901234567890123456789012123456789012345123456789012345678901234567890121234567890123456789012345678901212345678901234567890123456789012123456789012345123456789012345678901234567890121234567890123456789012345678901212345678901234567890123456789012123456789012345123456789012345678901234567890121234567890123456789012345678901212345678901234567890123456789012123456789012345123456789012345678901234567890121234567890123456789012345678901212345678901234567890123456789012123456789012345123456789012345678901234567890121234567890123456789012345678901212345678901234567890123456789012123456789012345123456789012345678901234567890121234567890123456789012345678901212345678901234567890123456789012123456789012345123456789012345678901234567890121234567890123456789012345678901212345678901234567890123456789012123456789012345123456789012345678901234567890121234567890123456789012345678901212345678901234567890123456789012123456789012345123456789012345678901234567890121234567890123456789012345678901212345678901234567890123456789012123456789012345123456789012345678901234567890121234567890123456789012345678901212345678901234567890123456789012123456789012345123456789012345678901234567890121234567890123456789012345678901212345678901234567890123456789012123456789012345123456789012345678901234567890121234567890123456789012345678901212345678901234567890123456789012123456789012345123456789012345678901234567890121234567890123456789012345678901212345678901234567890123456789012123456789012345123456789012345678901234567890121234567890123456789012345678901212345678901234567890123456789012123456789012345123456789012345678901234567890121234567890123456789012345678901212345678901234567890123456789012123456789012345123456789012345678901234567890121234567890123456789012345678901212345678901234567890123456789012123456789012345123456789012345678901234567890121234567890123456789012345678901212345678901234567890123456789012123456789012345123456789012345678901234567890121234567890123456789012345678901212345678901234567890123456789012123456789012345123456789012345678901234567890121234567890123456789012345678901212345678901234567890123456789012123456789012345123456789012345678901234567890121234567890123456789012345678901212345678901234567890123456789012123456789012345123456789012345678901234567890121234567890123456789012345678901212345678901234567890123456789012123456789012345123456789012345678901234567890121234567890123456789012345678901212345678901234567890123456789012123456789012345123456789012345678901234567890121234567890123456789012345678901212345678901234567890123456789012123456789012345123456789012345678901234567890121234567890123456789012345678901212345678901234567890123456789012123456789012345123456789012345678901234567890121234567890123456789012345678901212345678901234567890123456789012123456789012345123456789012345678901234567890121234567890123456789012345678901212345678901234567890123456789012123456789012345123456789012345678901234567890121234567890123456789012345678901212345678901234567890123456789012123456789012345123456789012345678901234567890121234567890123456789012345678901212345678901234567890123456789012123456789012345123456789012345678901234567890121234567890123456789012345678901212345678901234567890123456789012123456789012345123456789012345678901234567890121234567890123456789012345678901212345678901234567890123456789012123456789012345123456789012345678901234567890121234567890123456789012345678901212345678901234567890123456789012123456789012345123456789012345678901234567890121234567890123456789012345678901212345678901234567890123456789012123456789012345123456789012345678901234567890121234567890123456789012345678901212345678901234567890123456789012123456789012345123456789012345678901234567890121234567890123456789012345678901212345678901234567890123456789012123456789012345123456789012345678901234567890121234567890123456789012345678901212345678901234567890123456789012123456789012345123456789012345678901234567890121234567890123456789012345678901212345678901234567890123456789012123456789012345123456789012345678901234567890121234567890123456789012345678901212345678901234567890123456789012123456789012345123456789012345678901234567890121234567890123456789012345678901212345678901234567890123456789012123456789012345123456789012345678901234567890121234567890123456789012345678901212345678901234567890123456789012123456789012345123456789012345678901234567890121234567890123456789012345678901212345678901234567890123456789012123456789012345123456789012345678901234567890121234567890123456789012345678901212345678901234567890123456789012123456789012345123456789012345678901234567890121234567890123456789012345678901212345678901234567890123456789012123456789012345123456789012345678901234567890121234567890123456789012345678901212345678901234567890123456789012123456789012345123456789012345678901234567890121234567890123456789012345678901212345678901234567890123456789012123456789012345123456789012345678901234567890121234567890123456789012345678901212345678901234567890123456789012123456789012345123456789012345678901234567890121234567890123456789012345678901212345678901234567890123456789012123456789012345123456789012345678901234567890121234567890123456789012345678901212345678901234567890123456789012123456789012345
AnEntrepreneur’s trials and
tribulations in building upinstitutions, narrated in a highly
readable, fictional style. This is thefirst time a real life story is told
as fiction.
Copy avai lable at the Publ icat ion Department, SCMS Group of Educational Inst itut ions,
Cochin-683106

123456789012345678901234567890121234567890123456789012345678901212345678901234567890123456789012123456789012345123456789012345678901234567890121234567890123456789012345678901212345678901234567890123456789012123456789012345123456789012345678901234567890121234567890123456789012345678901212345678901234567890123456789012123456789012345123456789012345678901234567890121234567890123456789012345678901212345678901234567890123456789012123456789012345123456789012345678901234567890121234567890123456789012345678901212345678901234567890123456789012123456789012345123456789012345678901234567890121234567890123456789012345678901212345678901234567890123456789012123456789012345123456789012345678901234567890121234567890123456789012345678901212345678901234567890123456789012123456789012345123456789012345678901234567890121234567890123456789012345678901212345678901234567890123456789012123456789012345123456789012345678901234567890121234567890123456789012345678901212345678901234567890123456789012123456789012345123456789012345678901234567890121234567890123456789012345678901212345678901234567890123456789012123456789012345123456789012345678901234567890121234567890123456789012345678901212345678901234567890123456789012123456789012345123456789012345678901234567890121234567890123456789012345678901212345678901234567890123456789012123456789012345123456789012345678901234567890121234567890123456789012345678901212345678901234567890123456789012123456789012345123456789012345678901234567890121234567890123456789012345678901212345678901234567890123456789012123456789012345123456789012345678901234567890121234567890123456789012345678901212345678901234567890123456789012123456789012345123456789012345678901234567890121234567890123456789012345678901212345678901234567890123456789012123456789012345123456789012345678901234567890121234567890123456789012345678901212345678901234567890123456789012123456789012345123456789012345678901234567890121234567890123456789012345678901212345678901234567890123456789012123456789012345123456789012345678901234567890121234567890123456789012345678901212345678901234567890123456789012123456789012345123456789012345678901234567890121234567890123456789012345678901212345678901234567890123456789012123456789012345123456789012345678901234567890121234567890123456789012345678901212345678901234567890123456789012123456789012345123456789012345678901234567890121234567890123456789012345678901212345678901234567890123456789012123456789012345123456789012345678901234567890121234567890123456789012345678901212345678901234567890123456789012123456789012345123456789012345678901234567890121234567890123456789012345678901212345678901234567890123456789012123456789012345123456789012345678901234567890121234567890123456789012345678901212345678901234567890123456789012123456789012345123456789012345678901234567890121234567890123456789012345678901212345678901234567890123456789012123456789012345123456789012345678901234567890121234567890123456789012345678901212345678901234567890123456789012123456789012345123456789012345678901234567890121234567890123456789012345678901212345678901234567890123456789012123456789012345123456789012345678901234567890121234567890123456789012345678901212345678901234567890123456789012123456789012345123456789012345678901234567890121234567890123456789012345678901212345678901234567890123456789012123456789012345123456789012345678901234567890121234567890123456789012345678901212345678901234567890123456789012123456789012345123456789012345678901234567890121234567890123456789012345678901212345678901234567890123456789012123456789012345123456789012345678901234567890121234567890123456789012345678901212345678901234567890123456789012123456789012345123456789012345678901234567890121234567890123456789012345678901212345678901234567890123456789012123456789012345123456789012345678901234567890121234567890123456789012345678901212345678901234567890123456789012123456789012345123456789012345678901234567890121234567890123456789012345678901212345678901234567890123456789012123456789012345123456789012345678901234567890121234567890123456789012345678901212345678901234567890123456789012123456789012345123456789012345678901234567890121234567890123456789012345678901212345678901234567890123456789012123456789012345123456789012345678901234567890121234567890123456789012345678901212345678901234567890123456789012123456789012345123456789012345678901234567890121234567890123456789012345678901212345678901234567890123456789012123456789012345123456789012345678901234567890121234567890123456789012345678901212345678901234567890123456789012123456789012345123456789012345678901234567890121234567890123456789012345678901212345678901234567890123456789012123456789012345123456789012345678901234567890121234567890123456789012345678901212345678901234567890123456789012123456789012345123456789012345678901234567890121234567890123456789012345678901212345678901234567890123456789012123456789012345123456789012345678901234567890121234567890123456789012345678901212345678901234567890123456789012123456789012345123456789012345678901234567890121234567890123456789012345678901212345678901234567890123456789012123456789012345123456789012345678901234567890121234567890123456789012345678901212345678901234567890123456789012123456789012345123456789012345678901234567890121234567890123456789012345678901212345678901234567890123456789012123456789012345123456789012345678901234567890121234567890123456789012345678901212345678901234567890123456789012123456789012345123456789012345678901234567890121234567890123456789012345678901212345678901234567890123456789012123456789012345123456789012345678901234567890121234567890123456789012345678901212345678901234567890123456789012123456789012345123456789012345678901234567890121234567890123456789012345678901212345678901234567890123456789012123456789012345123456789012345678901234567890121234567890123456789012345678901212345678901234567890123456789012123456789012345123456789012345678901234567890121234567890123456789012345678901212345678901234567890123456789012123456789012345123456789012345678901234567890121234567890123456789012345678901212345678901234567890123456789012123456789012345123456789012345678901234567890121234567890123456789012345678901212345678901234567890123456789012123456789012345123456789012345678901234567890121234567890123456789012345678901212345678901234567890123456789012123456789012345123456789012345678901234567890121234567890123456789012345678901212345678901234567890123456789012123456789012345123456789012345678901234567890121234567890123456789012345678901212345678901234567890123456789012123456789012345123456789012345678901234567890121234567890123456789012345678901212345678901234567890123456789012123456789012345123456789012345678901234567890121234567890123456789012345678901212345678901234567890123456789012123456789012345123456789012345678901234567890121234567890123456789012345678901212345678901234567890123456789012123456789012345123456789012345678901234567890121234567890123456789012345678901212345678901234567890123456789012123456789012345123456789012345678901234567890121234567890123456789012345678901212345678901234567890123456789012123456789012345123456789012345678901234567890121234567890123456789012345678901212345678901234567890123456789012123456789012345123456789012345678901234567890121234567890123456789012345678901212345678901234567890123456789012123456789012345123456789012345678901234567890121234567890123456789012345678901212345678901234567890123456789012123456789012345123456789012345678901234567890121234567890123456789012345678901212345678901234567890123456789012123456789012345123456789012345678901234567890121234567890123456789012345678901212345678901234567890123456789012123456789012345123456789012345678901234567890121234567890123456789012345678901212345678901234567890123456789012123456789012345123456789012345678901234567890121234567890123456789012345678901212345678901234567890123456789012123456789012345123456789012345678901234567890121234567890123456789012345678901212345678901234567890123456789012123456789012345123456789012345678901234567890121234567890123456789012345678901212345678901234567890123456789012123456789012345123456789012345678901234567890121234567890123456789012345678901212345678901234567890123456789012123456789012345123456789012345678901234567890121234567890123456789012345678901212345678901234567890123456789012123456789012345123456789012345678901234567890121234567890123456789012345678901212345678901234567890123456789012123456789012345123456789012345678901234567890121234567890123456789012345678901212345678901234567890123456789012123456789012345123456789012345678901234567890121234567890123456789012345678901212345678901234567890123456789012123456789012345123456789012345678901234567890121234567890123456789012345678901212345678901234567890123456789012123456789012345123456789012345678901234567890121234567890123456789012345678901212345678901234567890123456789012123456789012345123456789012345678901234567890121234567890123456789012345678901212345678901234567890123456789012123456789012345123456789012345678901234567890121234567890123456789012345678901212345678901234567890123456789012123456789012345123456789012345678901234567890121234567890123456789012345678901212345678901234567890123456789012123456789012345123456789012345678901234567890121234567890123456789012345678901212345678901234567890123456789012123456789012345123456789012345678901234567890121234567890123456789012345678901212345678901234567890123456789012123456789012345123456789012345678901234567890121234567890123456789012345678901212345678901234567890123456789012123456789012345123456789012345678901234567890121234567890123456789012345678901212345678901234567890123456789012123456789012345123456789012345678901234567890121234567890123456789012345678901212345678901234567890123456789012123456789012345123456789012345678901234567890121234567890123456789012345678901212345678901234567890123456789012123456789012345123456789012345678901234567890121234567890123456789012345678901212345678901234567890123456789012123456789012345123456789012345678901234567890121234567890123456789012345678901212345678901234567890123456789012123456789012345123456789012345678901234567890121234567890123456789012345678901212345678901234567890123456789012123456789012345123456789012345678901234567890121234567890123456789012345678901212345678901234567890123456789012123456789012345123456789012345678901234567890121234567890123456789012345678901212345678901234567890123456789012123456789012345123456789012345678901234567890121234567890123456789012345678901212345678901234567890123456789012123456789012345123456789012345678901234567890121234567890123456789012345678901212345678901234567890123456789012123456789012345123456789012345678901234567890121234567890123456789012345678901212345678901234567890123456789012123456789012345123456789012345678901234567890121234567890123456789012345678901212345678901234567890123456789012123456789012345123456789012345678901234567890121234567890123456789012345678901212345678901234567890123456789012123456789012345123456789012345678901234567890121234567890123456789012345678901212345678901234567890123456789012123456789012345123456789012345678901234567890121234567890123456789012345678901212345678901234567890123456789012123456789012345123456789012345678901234567890121234567890123456789012345678901212345678901234567890123456789012123456789012345123456789012345678901234567890121234567890123456789012345678901212345678901234567890123456789012123456789012345123456789012345678901234567890121234567890123456789012345678901212345678901234567890123456789012123456789012345123456789012345678901234567890121234567890123456789012345678901212345678901234567890123456789012123456789012345123456789012345678901234567890121234567890123456789012345678901212345678901234567890123456789012123456789012345123456789012345678901234567890121234567890123456789012345678901212345678901234567890123456789012123456789012345123456789012345678901234567890121234567890123456789012345678901212345678901234567890123456789012123456789012345123456789012345678901234567890121234567890123456789012345678901212345678901234567890123456789012123456789012345123456789012345678901234567890121234567890123456789012345678901212345678901234567890123456789012123456789012345123456789012345678901234567890121234567890123456789012345678901212345678901234567890123456789012123456789012345123456789012345678901234567890121234567890123456789012345678901212345678901234567890123456789012123456789012345123456789012345678901234567890121234567890123456789012345678901212345678901234567890123456789012123456789012345123456789012345678901234567890121234567890123456789012345678901212345678901234567890123456789012123456789012345123456789012345678901234567890121234567890123456789012345678901212345678901234567890123456789012123456789012345123456789012345678901234567890121234567890123456789012345678901212345678901234567890123456789012123456789012345123456789012345678901234567890121234567890123456789012345678901212345678901234567890123456789012123456789012345123456789012345678901234567890121234567890123456789012345678901212345678901234567890123456789012123456789012345123456789012345678901234567890121234567890123456789012345678901212345678901234567890123456789012123456789012345123456789012345678901234567890121234567890123456789012345678901212345678901234567890123456789012123456789012345123456789012345678901234567890121234567890123456789012345678901212345678901234567890123456789012123456789012345123456789012345678901234567890121234567890123456789012345678901212345678901234567890123456789012123456789012345123456789012345678901234567890121234567890123456789012345678901212345678901234567890123456789012123456789012345123456789012345678901234567890121234567890123456789012345678901212345678901234567890123456789012123456789012345123456789012345678901234567890121234567890123456789012345678901212345678901234567890123456789012123456789012345123456789012345678901234567890121234567890123456789012345678901212345678901234567890123456789012123456789012345123456789012345678901234567890121234567890123456789012345678901212345678901234567890123456789012123456789012345123456789012345678901234567890121234567890123456789012345678901212345678901234567890123456789012123456789012345123456789012345678901234567890121234567890123456789012345678901212345678901234567890123456789012123456789012345123456789012345678901234567890121234567890123456789012345678901212345678901234567890123456789012123456789012345123456789012345678901234567890121234567890123456789012345678901212345678901234567890123456789012123456789012345123456789012345678901234567890121234567890123456789012345678901212345678901234567890123456789012123456789012345123456789012345678901234567890121234567890123456789012345678901212345678901234567890123456789012123456789012345123456789012345678901234567890121234567890123456789012345678901212345678901234567890123456789012123456789012345123456789012345678901234567890121234567890123456789012345678901212345678901234567890123456789012123456789012345123456789012345678901234567890121234567890123456789012345678901212345678901234567890123456789012123456789012345123456789012345678901234567890121234567890123456789012345678901212345678901234567890123456789012123456789012345123456789012345678901234567890121234567890123456789012345678901212345678901234567890123456789012123456789012345123456789012345678901234567890121234567890123456789012345678901212345678901234567890123456789012123456789012345123456789012345678901234567890121234567890123456789012345678901212345678901234567890123456789012123456789012345123456789012345678901234567890121234567890123456789012345678901212345678901234567890123456789012123456789012345123456789012345678901234567890121234567890123456789012345678901212345678901234567890123456789012123456789012345123456789012345678901234567890121234567890123456789012345678901212345678901234567890123456789012123456789012345123456789012345678901234567890121234567890123456789012345678901212345678901234567890123456789012123456789012345123456789012345678901234567890121234567890123456789012345678901212345678901234567890123456789012123456789012345123456789012345678901234567890121234567890123456789012345678901212345678901234567890123456789012123456789012345123456789012345678901234567890121234567890123456789012345678901212345678901234567890123456789012123456789012345123456789012345678901234567890121234567890123456789012345678901212345678901234567890123456789012123456789012345123456789012345678901234567890121234567890123456789012345678901212345678901234567890123456789012123456789012345
By Prof.N.C.George
Price Rs.895/-
Copies can be had from the Publ icat ion Department, SCMS Group ofEducational Inst itut ions, Cochin-683106
Story of anentrepreneur who builtup a set of high qualityacademic institutionsin a totally hostile and
challengingenvironment. A modelfor entrepreneurship in
any situation.

SCMS Journal of Indian Management is included
in EBSCO Database
Printed by Dr.D.Radhakrishnan Nair, published by Dr.D.Radhakrishnan Nair on behalf of SCMS-COCHIN [School of Communication and Management Studies]
and printed at Maptho Printings, Kalamassery, Cochin-683104and published at Muttom, Aluva-683106, Cochin,
Editor-Dr.D.Radhakrishnan Nair.
ISSN-0973-3167

SCM
S Journal of Indian Managem
ent, Volum
e VII, N
umber II, A
pril - June 2010, Pages 1-136