Scintillator Replacement Option for BaBar - slac.stanford.edu filedifferent configurations with a...
27
Work supported by Department of Energy contract DE-AC02-76SF00515 Scintillator Replacement Option for BaBar Michael Lometti ERULF San Francisco State University Stanford Linear Accelerator Center Menlo Pak, California Aug 13, 2002 Prepared in partial fulfillment of the requirement of the Office of Science, DOE Energy Research Undergraduate Laboratory Fellowship under the direction of Peter Kim and Bill Wisniewski in Experimental Group E at Stanford Linear Accelerator Center. SLAC-PUB-9398 SLAC, Stanford University, Stanford, CA 94309
Transcript of Scintillator Replacement Option for BaBar - slac.stanford.edu filedifferent configurations with a...
Work supported by Department of Energy contract DE-AC02-76SF00515
Scintillator Replacement Option for BaBar
Michael Lometti
ERULF
San Francisco State University
Stanford Linear Accelerator Center
Menlo Pak, California
Aug 13, 2002
Prepared in partial fulfillment of the requirement of the Office of Science, DOE Energy
Research Undergraduate Laboratory Fellowship under the direction of Peter Kim and
Bill Wisniewski in Experimental Group E at Stanford Linear Accelerator Center.
SLAC-PUB-9398
SLAC, Stanford University, Stanford, CA 94309

Table of Contents
Abstract
Introduction
Methods and Materials
Results
Discussion and Conclusions
Acknowledgements
References
Figures
3
5
7
11
12
16
16
18
2

Abstract
Scintillator Replacement Option for BaBar. Michael Lometti (San Francisco State University,
San Francisco, C.A., 94132) Peter Kim (Stanford Linear Accelerator Center, Menlo Park, C.A.,
94025)
A replacement technology for the muon detection system in BaBar using scintillator bars
with Wavelength Shifting (WLS) fibers and Avalanche Photo Diodes (APDs). APDs must be
used in BaBar due to the high magnetic fields that disrupt the electron multiplying effects of
Photo Multiplier Tubes (PMTs). Muons passing through scintillator cause fluors in the
scintillator to emit photons, which are captured by WLS fibers and then re-emitted at the ends of
the fibers to awaiting APDs. The detector configuration that will produce the largest Light Yield
(LY) and produce a clear APD signal that will be larger than background noise is the main goal
of the study. Bar dimensions, number of WLS fibers, and placement of fibers are parameters
that may be adjusted to produce the largest LY. Additionally, good timing resolution is needed
to determine where a muon passed through the detector along the long direction of the bar. A
scintillator bar 2cm x 4cm in x-y with four round lmm fibers produced the largest LY out of four
different configurations with a timing resolution of 25cm. A Monte Carlo simulation confirmed
the relative LY compared to other detectors. This detector was able to produce a 40mV pulse
from the APD that was easily discernable above the 2-SmV background noise. Refinement of
the fabrication process could produced higher LYs and better timing resolutions, while a re-
design of the electronics may increase the signal to noise ratio.
3

Introduction
The Instrumented Flux Return (IFR) uses Resistive Plate Chambers (RPCs) as the
subsystem of BaBar to identify muons. Since they were installed in 1999, the efficiency of the
RPC’s has been declining steadily for a mix of reasons, many of which are unknown (Ferroni,
2002).
A replacement technology for RPCs has been considered and is being explored. This
technology consists of an extruded polystyrene scintillating material infused with the fluors PPO
(1%) and POPOP (0.030%) and connected to a Photo-Detector (PD). A scintillation material is
one that converts the kinetic energy of charged particles into detectable light (Knoll, 1989).
Avalanche photodiodes (APDs) are silicon semiconductor devices, which convert optical
photons to electron-hole pairs. The term “avalanche” means that, through the use of high electric
fields, they incorporate internal gain in order to increase the number of charge carriers collected
(Knoll, 1989) and thus increase the size of the signal collected.
At the heart of this study is the question of whether using an APD connected to a
scintillator material is a viable option as a replacement. A key issue is the amount of light that is
needed for the APD to register a signal above the background noise. R&D focused on what
configuration of scintillator produced the highest Light Yield (LY). A Monte Carlo study was
done for comparison of experiment and theory.
The R&D phase consisted of fabrication of detector prototypes and optimization of those
prototypes for maximization of LY. An important concern was to avoid re-inventing the wheel
by using existing technology (Schindler, 2002). Several projects including MINOS and the D 0
detector at Fermilab, and CMS at CERN currently use scintillator material and PMTs in ways
similar to the replacement option for BaBar. The energy spent by an ionizing particle, a muon,
5
passing through a scintillation material goes into excitation on molecular levels and a large
fraction of the excitation energy is then transformed into light, photons. (Rossi, 1952). The
combination of APDs plus their readout electronics has a threshold or a minimum number of
photons needed to distinguish signal from noise, so it is important to find out how many are
reaching the PD. For initial testing, Photo Multiplier Tubes (PMTs) are used instead of the
APDs as they have a higher gain, are (in this particular case) more durable and are on the shelf in
the lab. Additionally, the PMTs have sufficient gain and low enough noise that single photons
can be resolved (Caltech, 1996). Initial use of PMTs is needed to determine the signal size of a
single photon, which can then be used to infer how many photons are recorded. A major
problem for PMTs is that high magnetic fields in BaBar interfere with their electron multiplying
capabilities. The APDs do not have this problem as they are much smaller and unwanted effects
on their electric fields used to multiply the charge carriers is negligible (Knoll, 1989). A
problem for affordable scintillator material is short attenuation length, that is the rate at which
photons get reabsorbed by the scintillator material as a function of the length of material
traversed. Additionally, the wavelength of light emitted by the scintillation material is generally
not the wavelength of light that the APD is most sensitive to. These problems are overcome by
the use of Wavelength Shifter (WLS) fibers epoxied into grooves milled into the scintillator.
These fibers use total internal reflection to trap photons emitted by the scintillator, and having
longer attenuation lengths, transmit photons to the ends of the fibers. Light produced by the
passage of charged particles is multiply reflected inside the scintillator bar by an outer diffuse
reflective coating and eventually is absorbed inside the WLS fiber; the fiber re-emits light
isotropically and at a wavelength easily detectable by the APD. This light is then transmitted to
the PDs (MINOS, 1998). Scintillator dimensions, number of WLS fibers, and placement of
6
fibers are factors that can influence the number of photons gathered. The size of the signal
received from the PMT is used to determine if a particular scintillator configuration can produce
enough photons for a robust APD signal. Also of concern is the timing resolution of each
scintillator: time differences can be used to determine the location at which a muon passed
through the detector. Measurement of the time delay between the signal from the PMT and that
of a “trigger” signal for various distances from the PMT can answer that question.
In conjunction with the R&D is Monte Carlo study. The simulation tracks a muon as it
passes through a scintillator and creates photons, which are then captured by a WLS fiber. The
number of photons that make it to the end of the fiber is counted. For different configurations,
one can set the attenuation lengths of the scintillator and WLS fiber, the dimensions of the
scintillator, and the placement and number of fibers. Running the simulation and analysis of the
results provides a valuable comparison to experimental data.
The long-term goal of this project is to show that the scintillator option is a viable
replacement for the RPCs in the IFR of BaBar. The short-term goal is to show that enough
photons are produced to firstly, detect using an APD that a muon has passed, and secondly to
determine with what accuracy the position may be known .
Materials and Methods
MINOS (Main Injector Neutrino Oscillation Search) use extruded plastic scintillator
which is read out by wavelength-shifting (WLS) fibers (MINOS, 1998). This study uses the
MINOS project as a jumping off point as they have similar scintillator requirements, and have
studied many of the aspects of minimum cost scintillation material technology. The scintillator
bars that are used in this study are the bars used in MINOS, extruded polystyrene scintillator
7

strips, lcm thick and 4.1cm wide with a titanium oxide outer layer for reflectivity and a groove
for a lmm WLS (Bicron BCF-92) fiber (MINOS, 1998).
The first step in the fabrication of the scintillator bar is to mill additional grooves for the
WLS fibers using an end-mill attachment. A smooth rounded groove approximately 2mm deep is
milled out of the scintillator. A cold gun or vortex gun, which blows cold air, is needed for all
milling and cutting as the heat generated in machining melts the scintillator and makes an uneven
surface. If the scintillator bars are to be sandwiched together and an optically smooth connection
is desired then the bars must be planed before the grooves are cut. The planing is accomplished
using a fly cutter on the milling machine and produces a smooth surface.
Surfaces that have been cut need some degree of polishing. An optically smooth surface
is obtained by the use of a sanding grit less than 5pm. For surfaces that need to reflect light an
aluminum oxide paint (Bicron BS-620) is used to reflect light diffusely rather than specularly.
The epoxy used to attach the fibers (Epon 81% resin and Epi-Cure 3274) is a special
blend developed to be a good match with the polystyrene in terms of index of refraction
(Caltech, 1998). Air-bubbles must be removed from the epoxy as they will act as small mirrors
inside the scintillator and reflect the photons trying to get into the fibers. The epoxy is laid into
the grooves in the scintillator and the fibers are placed in the grooves and smoothed over with the
excess epoxy. The fibers must be held down with tape, as they will try to float to the surface of
the epoxy while it is still liquid. A strip of aluminized Mylar is placed along the fiber to reflect
any photons back into the scintillator. Approximately 15-25cm of extra fiber is left sticking out
of each end to allow the attachment of the PMT/APD. The epoxy is left to harden overnight. If
two bars are to be sandwiched together this is done after the epoxy holding the fibers in place has
hardened using epoxy or optical grease (Bicron BC 630) to optically connect the two bars. In
8

both cases, each bar is coated with a thick layer of epoxy/grease and sandwiched together using
c-clamps to hold them together until the epoxy hardens or the tape is wrapped around them at
various points ensuring a solid connection. Any excess epoxy/grease must be wiped away.
For the use of a PMT, the ends of the fibers are epoxied into a hole that has been drilled
into a piece of plastic approximately 5x5cm. Once the epoxy has hardened completely the fibers
are sanded down level to the surface of the plastic and polished smooth. This surface is optically
connected to the PMT through the use of optical grease. For the case of the APD the fibers are
epoxied into a molded plastic holder that holds the APD. Once together, the fibers are connected
to the APD via optical grease.
The detector box consists of an aluminum box approximately 15x20x300cm used to
protect the scintillator and the APDPMTs from excess light. Above and below the detector on
the outside of the box are smaller “trigger” detectors. The top trigger sits on a 0.5cm thick lead
plate to remove low energy soft muons. The source of the muons is the upper atmosphere, where
cosmic rays interacting with earth’s atmosphere and produce muons. Muons readily pass
through most materials so that the setup may be kept in the lab. The only downside to cosmic
muons is that the flux of them through the test setup is about 800-1000 per hour for a 16cm
square area and so measurements can sometimes take a while. The triggers are made with a
small scintillator bar (lx4x12cm) that is optically connected to a 2cm diameter PMT using an
epoxy glue. Protecting the device from outside light is accomplished by wrapping it in black
electrical tape. The triggers are connected to High Voltage (HV) sources at 1885V and 1900V.
The scintillator is placed inside the box and optically connected to a PMT (Phillips XP 2262B) or
an APD (RMD S0223). The PMT is connected to a HV source at 1850V and a Dual Mode
Discriminator (DMD). The APD is connected to a HV source at 18OOV and a DMD.
9

The first part of the research is measurement of the amount of light reaching the
PMT/APD from different positions along the scintillator bar. At predetermined positions the
trigger counters are placed so that one trigger counter is parallel to the scintillator bar while the
other is perpendicular to it and a 4x4cm square detection area is created. When a muon passes
through the top trigger a pulse is generated from the PMT and sent to a DMD that checks to see
if the signal is larger than a single threshold value. If the pulse is large enough the discriminator
will produce a NIM gate, that is a -0.8V square pulse. If the incoming cosmic muon passes also
through the bottom trigger counter a second NIM gate is produced. Both gates now enter a
Coincidence Logical Unit (CLU) that determines if both gates are produced by the same muon
by comparing the arrival times of the two gates. The gate from the top trigger has a width of
20ns, while the bottom gate has a width of 100ns. Any overlapping of NIM gates in the logic
unit will produce a single 6011s wide NIM gate signaling that a muon has passed through both
trigger counters. When this occurs the NIM gate from the CLU goes to an Analog to Digital
Converter (ADC) and causes the ADC to integrate any charge that it receives from the
scintillator during the time that the NIM gate is open. Thus a signal received from the scintillator
is known to have come from a muon passing through the particular detection area defined by
where the triggers are placed. The value that the ADC produces is proportional to the number of
photons reaching the PMT/APD. Also being recorded is the time difference between the NIM
gate from the CLU and the signal from the scintillator bar. The signal from the bar also goes to a
DMD, which checks to see if the pulse is larger than two threshold values and tries to accurately
determine the arrival time of the pulse (when using the ADC the accuracy of the arrival time of
the pulse is not important as only the size of the pulse is being analyzed). Both gates, from the
CLU and from the scintillator go to a Time to Digital Converter (TDC), with the gate from the
10

triggers being the start time and the gate from the scintillator being the stop time. A linux PC
records the TDC and ADC values and uses them to generate a distribution of the time a signal
took to reach the APD/PMT from that position and of the magnitude of signal that was received
from that position.
Results
Figure 1 shows the mean ADC value for each of five detector setups at 25cm from the
end of the bar. Figure 2 shows a diagram of each of the five setups in the x-y plane.
Figure 3 is a plot of the mean ADC values at 25cm intervals for detector # 4 with an
exponential curve fitted to the data. Figure 4 is a plot of mean ADC for several positions along
the bar for detector #l.
Figure 5 is a plot of the mean TDC values for detector #4 at 25cm intervals.
Figure 6 is a spreadsheet of the results from the Monte Carlo simulations. The five
setups are reproduced and values for the mean number of photons produced and photons
captured in the PD and the values for the mean percentage of photons transmitted and photons
captured in the photo-detector are displayed at 25 cm intervals using 1000 muon interactions.
Figure 6a is a plot of the mean number of photons captured in the PD at 25cm intervals for each
of the five configurations.
A photograph of the oscilloscope with the trigger gate on channel 1 and the APD signal
on channel 2 is shown in figure 7. The vertical scale is 200mV for channel 1 and 20 mV for
channel 2 with the horizontal scale at 500ns.
Figure 8 is a histogram of the ADC counts for Detector # 4 at a position of 25cm with a
Gaussian curve fitted to the data. Figure 9 is a histogram of TDC count values for positions
11

25cm and 175cm with Gaussian curves fitted to both sets of data. Figure 10 is a histogram of
ADC counts for the 40cm version of Detector #4 at a position of 25cm.
Discussion and Conclusion
Detector #1 is the configuration used in MINOS, and so was the first setup tested. To try
to gather more light, first one and then three extra fibers were epoxied into a lcm thick
scintillator bar resulting in detectors #2 and #3. It is known that a Minimum Ionizing Particle
passing through a polystyrene material will produce approximately 600 photonskm and so a
logical next step to achieve a higher LY is to increase the average path length of a muon through
the material. Detector #4 is where two scintillator bars have been sandwiched together and
optically connected via optical grease with a total of four WLS fiber going to the PMT and a
total thickness of 2cm. The maximum space available in the IFR for a scintillator bar is 2.2cm.
Detector #5 is an intermediate stage between detectors #3 and #4, it is two bars sandwiched
together but not optically connected with four WLS fibers going to the PMT. Each bar has two
WLS fibers epoxied into it. Figure 2 is a diagram of each of the five setups. From figure 1 it can
be seen that detector #4 delivers the most photons of all setups from a distance of 25cm from the
end of the bar. Data was not taken at distances less than 25cm from the end of the bars to avoid
signal variations due to differing treatments of the bar ends. A curious result is the relative
closeness of the mean ADC value for detectors #4 and #5. It can be seen from figure 6 and 6a
that the Monte Carlo simulation suggests that the mean ADC value for detector #4 should be
approximately 20% higher than that of detector #5. However, from figure 1 it is seen that it is
only 2% higher. This seems to be due to the bars in detector #4 not being totally optically
connected to each other. The method of planing off the layer of reflective paint and then
polishing smooth the surfaces to be connected may not be the best way of creating a 2 cm x 4 cm
12

bar with four WLS fibers in the center of the detector. More research needs to be carried out to
determine the optimum method for fabrication of this configuration.
Detector #4 was then placed back into the box and ADC/TDC measurements were taken
at 25cm intervals to determine the Effective Attenuation Length (EAL) and the timing resolution.
The EAL may be found by looking at figure 3. A histogram of ADC counts for detector # 4 is
provided in figure # 8 with a Gaussian curve fitted to the data. An exponential curve has been
fitted to the data and from the reciprocal of the exponent, the EAL may be calculated. The EAL
has been found to be 217cm. The advertised attenuation length (350cm) is based of the photon
traveling in a straight line down the length of the WLS fiber. The EAL is due to the photon
bouncing off the sides of the fiber as it propagates down the fiber and thus has a longer path
length. The final size of the scintillator bars that go into BaBar will be 400 cm long; with an EAL
of 21Scm almost 75% of the light produced from a muon passing through the detector at one end
will be lost traveling to the other end. Figure 4 is a similar graph showing that the EAL for
detector #l. The value is approximately equal to detector # 4 due to the large uncertainties in
fabrication. This means that the EAL should not change as new configurations are tried out in
the future, as long as the same materials are used.
In figure 7 it is seen that as the triggers are moved 2Scm further away from the photo-
detector the mean TDC value increases by approximately 25 counts. This seems to indicate that
the timing of the signals as the interaction point moves further from the PD is linear. Figure 9
shows histograms of TDC counts for 25cm and 175cm with gaussian distributions fitted to each
set of data. The sigma of each gaussian can be used to find the resolution in time of the
scintillator. The time value of a single TDC count has been found to be 0.069ns, this value
13
multiplied by sigma is the resolution in time. The position resolution may be calculated by
multiplying sigma by the position separation of the sets of data and then dividing by the change
in mean TDC count. Thus the near position resolution is 26cm and the far position resolution is
24cm, an 8% decrease.
Figure 10 shows the histogram of ADC counts for the 40cm version of detector # 4. The
amount of light reaching the PMT has been reduced through the use of an air gap and diffusing
material. A single photon peak can be seen at an ADC count value of 20 with three other peaks
at 10 count intervals. This indicates that the ADC count value for a single photon is 10 counts.
The mean ADC count value of 680 for detector # 4 at 25cm would then translate to
approximately 70 photons being collected by the PMT.
Figure 8 is a photograph of an oscilloscope showing a signal from the APD triggering off
the external scintillator triggers. The detector being used is a 40cm version of detector #4.
Indeed a signal approximately 40mV high, about 3-5 times larger than the background noise, can
be seen in Figure 7. The large width seems to be due to the electronics and specifically from the
pre-amp, and may be reduced with further refinement of the electronics.
In conclusion, it has been shown that a 2cm thick scintillator bar with four fibers results
in a larger signal being read at the PD than lcm thick with one fiber, with a position resolution of
approximately 25cm throughout the bar. Additionally, the use of a shorter version of detector #4
resulted in the successful detection of a muon using the APD. An optimized version of this
detector is likely to meet BaBar’s needs.
14

Figures
15

Acknowledgements
I would like to thank the United States Department of Energy-Office of Science for
giving me the opportunity to be a part of the ERULF program at the Stanford Linear Accelerator
Center.
Many thanks go to my two mentors, Peter Kim and Bill Wisniewski. I would also like to
thank Joerg Stelzer, Rafe Schindler, Howard Rogers, Molly Uhl and Ken Newbury for all their
help and advice, Sekazi Mtingwa for putting together all the lectures and tours, and a huge thank
you to Helen Quinn for getting me into such a great summer program.
Lastly, I would like to thank Stanford Linear Accelerator Center for hosting such a
wonderful experience.
References
Rossi, Bruno. (1952). High - Energy -. Particles. Prentice Hall lnc.
Knoll, Glenn. (1989). Radiation Detection and Measurement, 2nd Edition. John Wiley and Sons.
Ferroni, Fernando. (2002). IFR Barrel: why RPC's (again?). -
Caltech Senior Physics Laboratory. (1996). Plastic Scintillators and Fast Pulse Techniques.
Retrieved Aug. 5 , 2002 from http://macamsI .bo.infn.it/scint/scintillators.html
16

Schindler, Rafe. (2002). A Scintillator Option to Replace the Barrel Muon System of BaBar.
BaBar Collaboration Meeting. July 2002.
MINOS (1998). The MINOS Detectors Technical Design Report Version 1.0. The MINOS
Collaboration. Octorber 1998.
17
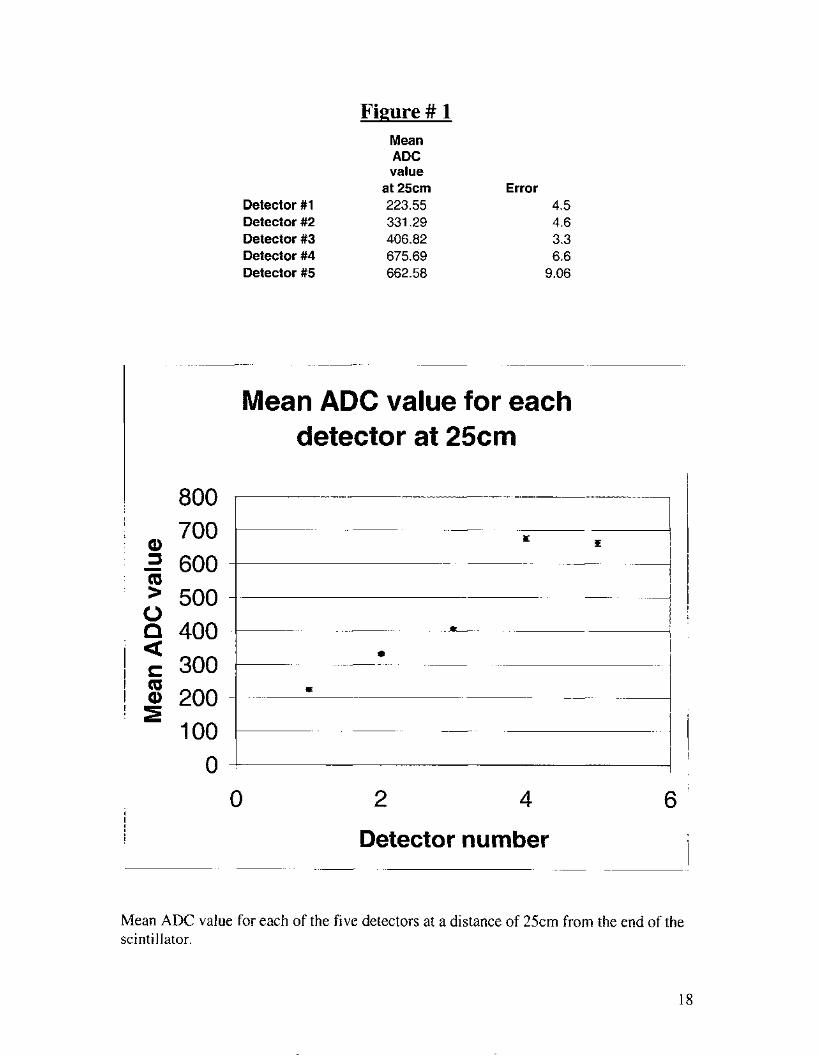
Figure # 1
Detector #1 Detector #2 Detector #3 Detector #4 Detector #5
Mean ADC value
at 25cm 223.55 331.29 406.82 675.69 662.58
Error 4.5 4.6 3.3 6.6
9.06
800 700 600 500 400 300 200 100
0 0
Mean ADC value for each detector at 25cm
1 f E I
L
I
* i
2 4
Detector number
6
Mean ADC value for each of the five detectors at a distance of 25cm from the end of the scinti 11 ator.
18

Figure # 2
Detector #1 w/ 1 fiber at the surface.
1 cm
4 cm
Detector # 3 wi 4 fibers at the surface.
1 cm
4 cm
Detector # 2 wi 2 fibers at the surface.
1 cm
4 cm
Detector # 4 w/ four fibers in the center
2 cm
4 cm
Detector # 5 w/ 4 fibers at the center. The two scintillators are optically sepai-tated.
2 c m
4 cm
19

Figure # 3
Position
25 50 75 100 125 150 175
- Mean - ADC
Count 675.69 61 7.66 51 1.66 490.95 430.24 382.84 335.1
Errror
6.579 10.3
9.448 5.71 2 7.472 6.57
2.644
I Position vs. mean A D C count
Q) 800 3 (II > c 3
- cI 600
8 400
4 200 8
E o c (II
0 50 100 150 200
~ Position (cm)
Mean ADC values for Detector #4 at 25cm intervals with an exponetial curve fitted to the data. The reciprocal of the exponent gives the Effective Attenuation Length of Detector
#4.
1/.0046=2 17.39 13
20

Figure # 4
Mean
Count Position ADC Error
25 223.55 4.5 50 187.89 2.6
100 168.75 2.2 150 108.32 2.6
250
200
a 8 150
U
c S
x 6 100
E 50
Position vs. mean ADC count
I I 0 1 I , I i
0 50 100 150 200
Position (cm)
Mean ADC value for Detector #I at 25cm intervals with an exponential curve fitted to the data. The reciprocal of the exponent gives the Effective Attenuation Length for
Detector #l.
1/.0054=185.1852
21

Figure #5
Position
25 50 75 100 125 150 175
Mean TDC Error
values 278.65 0.87 301.82 1.81 326.08 1.74 351.41 1.33 377.01 0.91 399.98 1.41 420.55 0.88
Position vs. Mean TDC values for detector # 4 at 25cm intervals
500
400 a 3
> 300
F 100
0 50 100 150
Position (cm)
200
Mean TDC count values for Detector #4 at 25cm intervals. Note that the data is nearly linear.
22

Figure # 6
Detector # 1 lcm x 4cm w/ 1 fiber at 90% of height (surface) mean # of mean # of mean # of mean % of mean YO of photons photons photons photons photons
length produced transmitted captured in PD transmitted captured in PD 25 609.961 8.407 6.737 1.35601 1.08491 50 608.139 7.744 6.107 1.25844 0.9921 54 75 609.582 7.531 5.962 1.22032 0.964094 100 614.665 7.46 5.876 1.19672 0.941 31 2 125 611.343 7.116 5.61 4 1.14333 0.901 962 150 607.419 6.926 5.43 1.12929 0.886353 175 606.27 6.502 5.1 59 1.05505 0.8341 36
Detector # 2 lcm x 4cm w/ 2 fibers at 90% of height (surface) mean # of mean # of mean # of mean % of mean YO of photons photons photons photons photons
length produced transmitted captured in PD transmitted captured in PD 25 613.167 14.886 11.825 2.40206 1 .go651 50 610.005 13.949 11.11 2.25097 1.7971 5 75 606.697 13.137 10.463 2.1 3837 1.70429 100 607.828 12.907 10.224 2.1 0673 1.671 63 125 606.466 12.308 9.81 3 2.01 147 1.60386 150 606.7 12.1 6 9.642 1.97796 1 5701 6 175 613.462 11.956 9.495 1.93255 1.53636
Detector # 3 lcm x 4cm w/ 4 fibers at 90% of height (surface) mean # of mean # of mean # of mean % of mean % of photons photons photons photons photons
length produced transmitted captured in PD transmitted captured in PD 25 598.088 21.951 17.583 3.3232 2.901 91 50 607.35 21.298 17.1 3 3.47034 2.791 87 75 607.617 20.596 16.377 3.3501 2 2.66878 100 598.012 19.41 2 15.462 3.21 805 2.55724 125 609.745 19.51 4 15.478 3.1 7336 2.51 361 150 606.817 18.698 14.926 3.03941 2.42831 175 608.202 17.633 14.063 2.85586 2.27979
23

Detector # 4 2cm x 4cm w/ 4 fibers at 50% of height (center) mean # of mean # of mean # of mean % of mean % of photons photons photons photons photons
length produced transmitted captured in PD transmitted captured in PD 25 1176.64 36.453 29.01 7 3.03359 2.41 375 50 1165.16 34.172 27.209 2.8809 2.28685 75 1171.67 33.025 26.331 2.76806 2.20499 100 1168.65 31.987 25.41 4 2.69246 2.1 3924 125 1184.98 31.69 25.226 2.62404 2.08577 150 1175.4 29.89 23.689 2.49881 1.98246 175 1180.7 29.275 23.277 2.43793 1.93374
Detector # 5 [lcm x 4 cm w/ 2 fibers at 90% of height (surface)]x2 mean # of mean # of mean # of mean YO of mean YO of photons photons photons photons photons
length produced transmitted captured in PD transmitted captured in PD 25 1226.334 29.772 23.65 2.40206 1 .go651 50 1220.01 27.898 22.22 2.25097 1.7971 5 75 1213.394 26.274 20.926 2.13837 1.70429 100 1215.656 25.814 20.448 2.10673 1.671 63 125 1212.932 24.616 19.626 2.01 147 1.60386 150 1213.4 24.32 19.284 1.97796 1.5701 6 175 1226.924 23.912 18.99 1.93255 1.53636
Fiqure ## 6a
Position vs. Mean Number of Photons Captured in PD [Monte Carlo]
I 1 fiber w/ l c m scint.
m 2 fibers w/ l c m thick
A 4 fibers w/ l c m thick
4 fibers w/ 2cm thick
scint
scint
scint
scint 04 fibers w/ 2 l c m thick
0 50 100 150
Position (cm)
24

Figure # 7
Photograph of oscilloscope showing the trigger gate on channel #1 and the signal from the APD on channel #2.
25
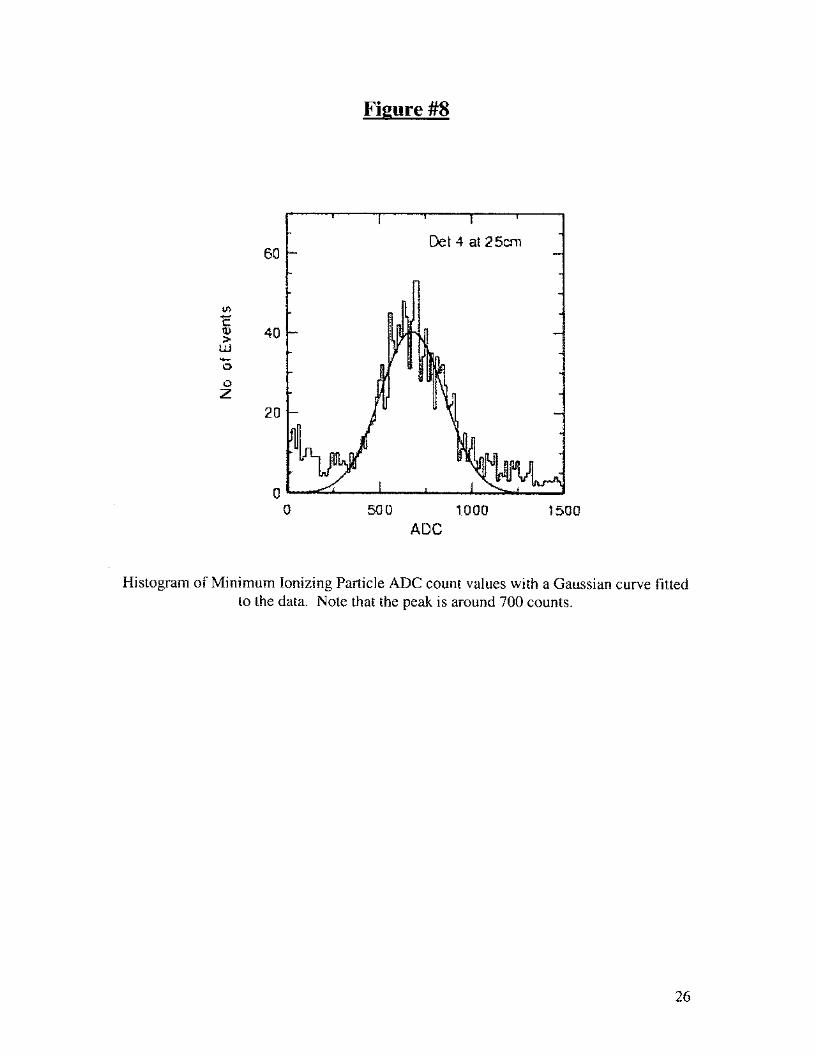
Figure #8
Histogram of Minimum Ionizing Particle ADC count values with a Gaussian curve fitted to the data. Note that the peak is around 700 counts.
26

Figure # 9
Histograms of Minimum Ionizing Particle TDC count values for Detector # 4 with Gaussian curves fitted to the data. The left histogram is for a position of 25cm and the
right histogram is for a position of 175cm.
27

Figure ## 10
23 40 ADC
Histogram of Minimum Ionizing Particle ADC count values for 40cm version of Detector # 4. Note the four distinct peaks starting at an ADC value of 20 with 10 count spacing.
28