Scientific analysis on the designation of Natura 2000 ...dce2.au.dk/pub/TR117.pdf · Year of...
44
AARHUS UNIVERSITY DCE – DANISH CENTRE FOR ENVIRONMENT AND ENERGY AU Technical Report from DCE – Danish Centre for Environment and Energy No. 117 2018 SCIENTIFIC ANALYSIS ON THE DESIGNATION OF NATURA 2000 SITES AND THE STATUS OF NATURE AND EFFORT The Schleswig-Holstein situation
Transcript of Scientific analysis on the designation of Natura 2000 ...dce2.au.dk/pub/TR117.pdf · Year of...
AARHUS UNIVERSITYDCE – DANISH CENTRE FOR ENVIRONMENT AND ENERGY
AU
Technical Report from DCE – Danish Centre for Environment and Energy No. 117 2018
SCIENTIFIC ANALYSIS ON THE DESIGNATION OF NATURA 2000 SITES AND THE STATUS OF NATURE AND EFFORTThe Schleswig-Holstein situation

[Blank page]
Technical Report from DCE – Danish Centre for Environment and Energy
AARHUS UNIVERSITYDCE – DANISH CENTRE FOR ENVIRONMENT AND ENERGY
AU
2018
SCIENTIFIC ANALYSIS ON THE DESIGNATION OF NATURA 2000 SITES AND THE STATUS OF NATURE AND EFFORTThe Schleswig-Holstein situation
Jesper Fredshavn1
Jesper L. Bak2
Kathrin Erbe3
1 Aarhus Universitet, DCE - Danish Centre for Environment and Energy2 Aarhus Universitet, Department of Bioscience3 Gesellschaft für Freilandökologie und Naturschutzplanung, mbH, Kiel
No. 117
Data sheet
Series title and no.: Technical Report from DCE – Danish Centre for Environment and Energy No. 117
Title: Scientific analysis on the designation of Natura 2000 sites and the status of nature and effort
Subtitle: The Schleswig-Holstein situation
Authors: Jesper Fredshavn1, Jesper L. Bak2 and Kathrin Erbe3 Institutions: Aarhus Universitet, 1DCE - Danish Centre for Environment and Energy, 2 Department of
Bioscience and 3Gesellschaft für Freilandökologie und Naturschutzplanung, mbH, Kiel Publisher: Aarhus University, DCE – Danish Centre for Environment and Energy © URL: http://dce.au.dk/en
Year of publication: March 2018 Editing completed: March 2018 Referee: Flemming Skov Quality assurance, DCE: Poul Nordemann Jensen
Financial support: Environmental Protection Agency, Denmark
Please cite as: Fredshavn, J., Bak, J.L. and Erbe, K 2018. Scientific analysis on the designation of Natura 2000 sites and the status of nature and effort. The Schleswig-Holstein situation. Aarhus University, DCE – Danish Centre for Environment and Energy, 42 pp. Technical Report from DCE – Danish Centre for Environment and Energy No. 117 http://dce2.au.dk/pub/TR117.pdf
Reproduction permitted provided the source is explicitly acknowledged
Abstract: The purpose of the project is to compare the ammonia regulations in relation to the designated Natura 2000 sites and the EU Habitats Directive. This report represents the scientific analysis in Schleswig-Holstein. The scientific analysis focuses on the state of the designated Natura 2000 areas and the need to protect the ammonia-sensitive nature. The analysis describes the designation process and the location of the ammonia-sensitive areas in relation to agricultural activity and ammonia deposition, the monitoring and assessments of the natural habitats and the national objectives in ammonia regulations particularly in the Natura 2000 areas.
Keywords: Ammonia regulations, Natura 2000 areas, Habitat directive
Layout: Graphic Group, AU Silkeborg Front page photo: Jesper Fredshavn
ISBN: 978-87-7156-327-6 ISSN (electronic): 2245-019X
Number of pages: 42
Internet version: The report is available in electronic format (pdf) at http://dce2.au.dk/pub/TR117.pdf
Contents
Preface 5
1 The designation of Schleswig-Holstein Natura 2000 sites 6
2 The state of nature and effort 11
3 References 16
Appendix 1 19
Appendix 2 25
Appendix 3 27
Appendix 4 28
Appendix 5 35
[Blank page]
5
Preface
This report is part of a comparative project initiated by the Danish Environ-mental Protection Agency, the Ministry of Environment and Food. The pur-pose of the project is to compare the ammonia regulations in relation to the designated Natura 2000 sites and the EU Habitats Directive. The project con-sists of three parts analysing the situation in Denmark, Schleswig-Holstein and the Netherlands from a legal perspective, an economic perspective and a natural science perspective. Department of Food and Resource Economics (IFRO), Copenhagen University is responsible for the economic and legal analysis, and Danish Center for Environment and Energy (DCE), Aarhus Uni-versity is responsible for the scientific analysis.
This report represents the scientific analysis in Schleswig-Holstein. The report is based on available reports on the Schleswig-Holstein and German situation. The scientific analysis focuses on the state of the designated Natura 2000 areas and the need to protect the ammonia-sensitive nature. The analysis describes the designation process and the location of the ammonia-sensitive areas in relation to agricultural activity and ammonia deposition, the monitoring and assessments of the natural habitats and the national objectives in ammonia regulations particularly in the Natura 2000 areas.
6
1 The designation of Schleswig-Holstein Natura 2000 sites
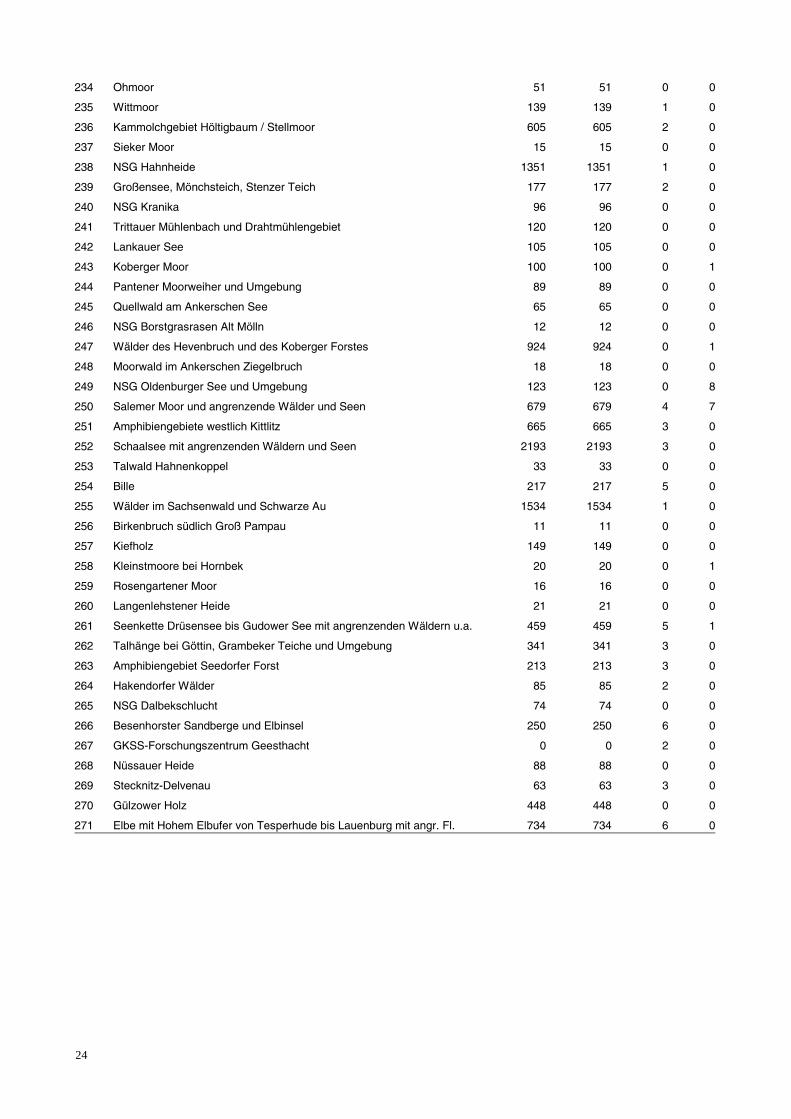
a) Number of SAC’s (land and sea) and the variation in sizes and number of habitat types in the sites Schleswig-Holstein has designated 271 Special Areas of Conservation (SAC) and 46 sites designated as Special Protection Areas (SPA).
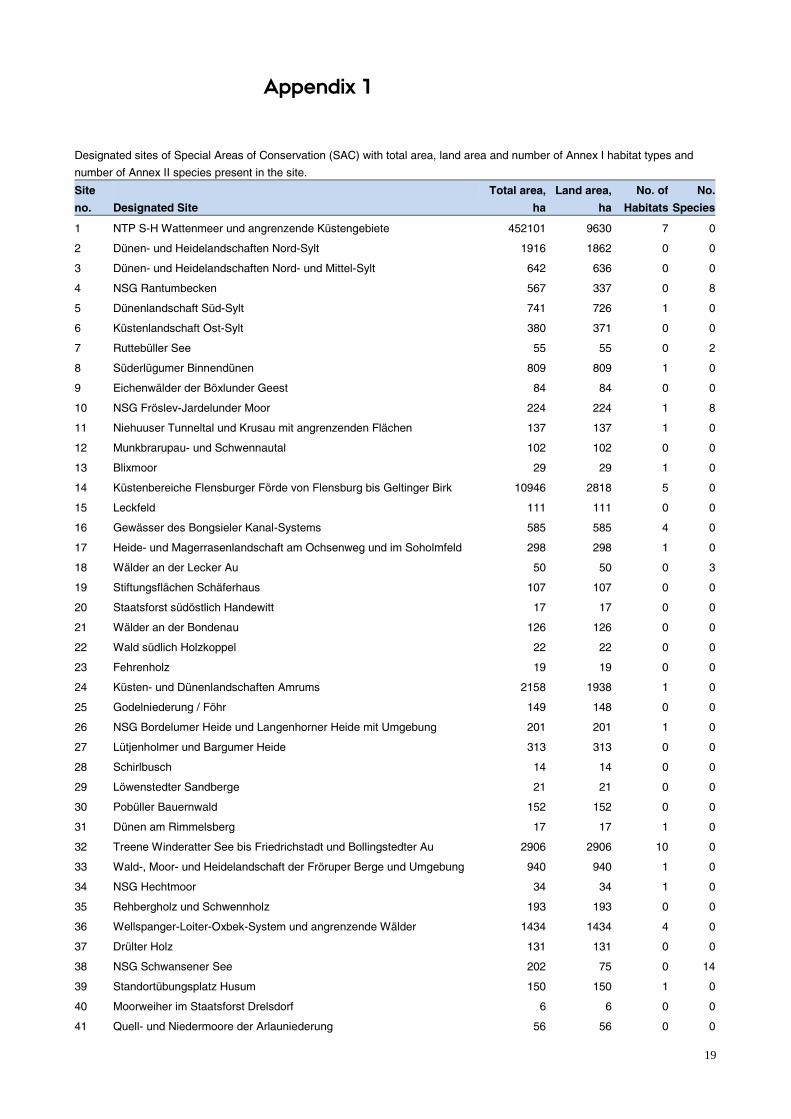
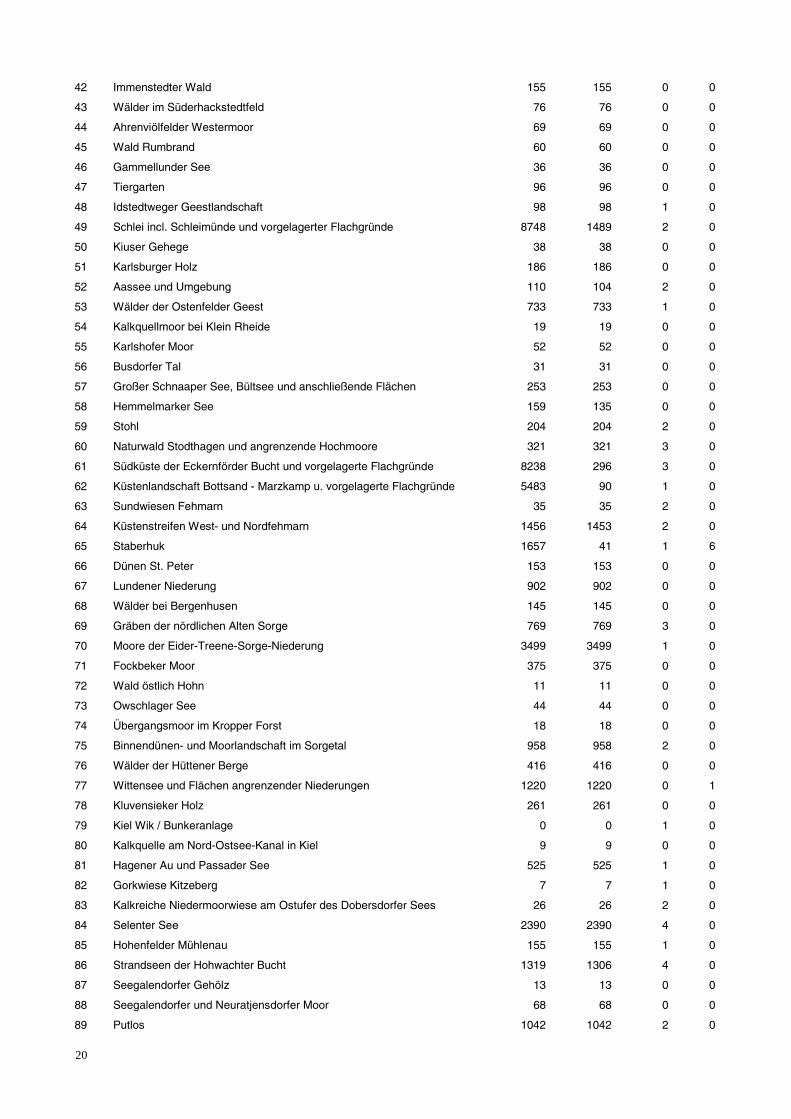
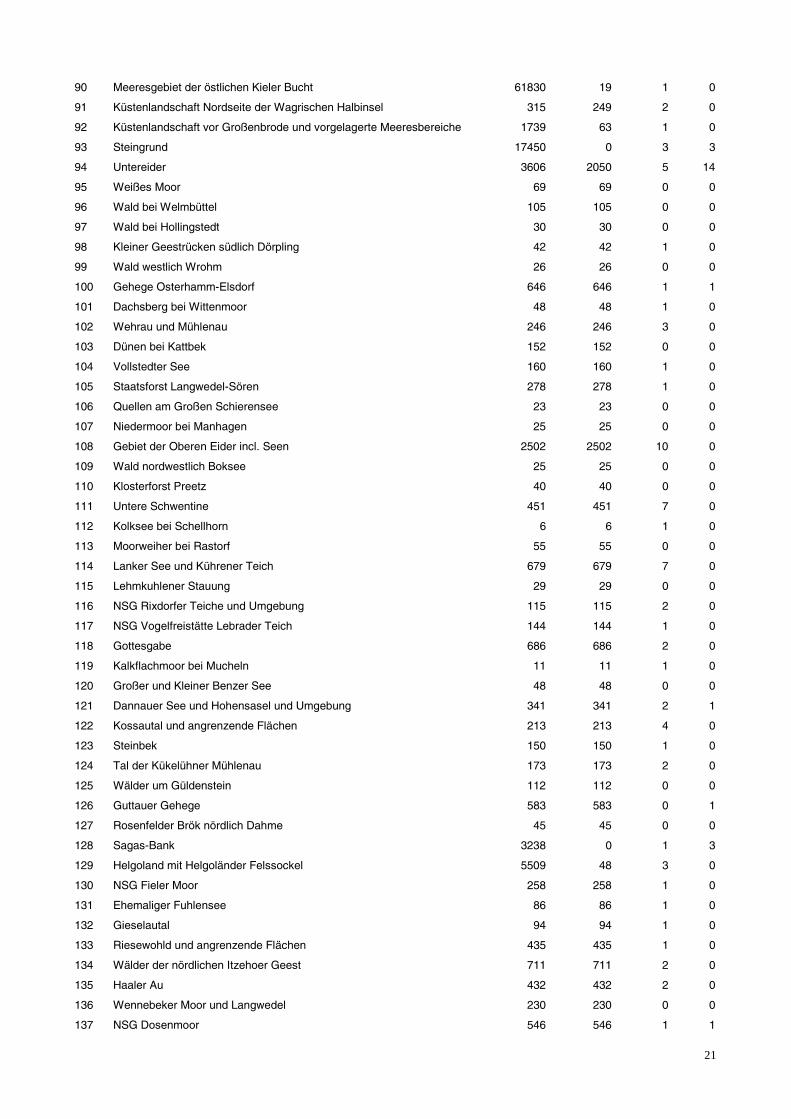
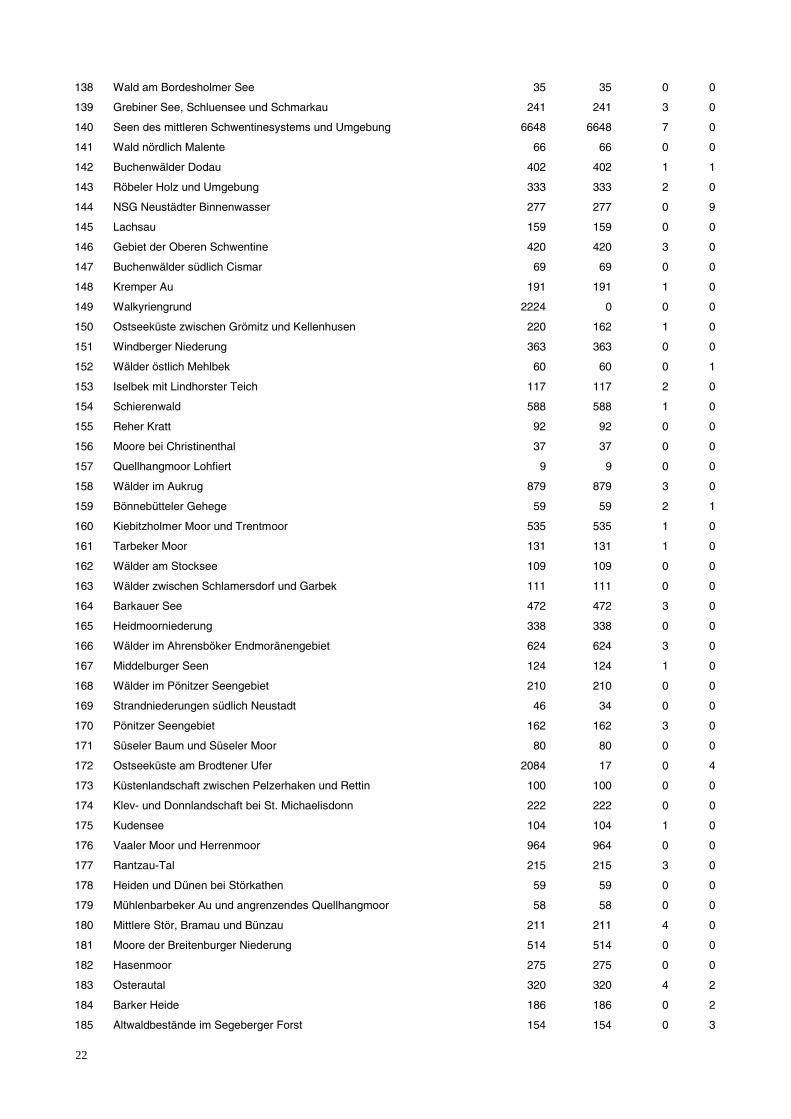
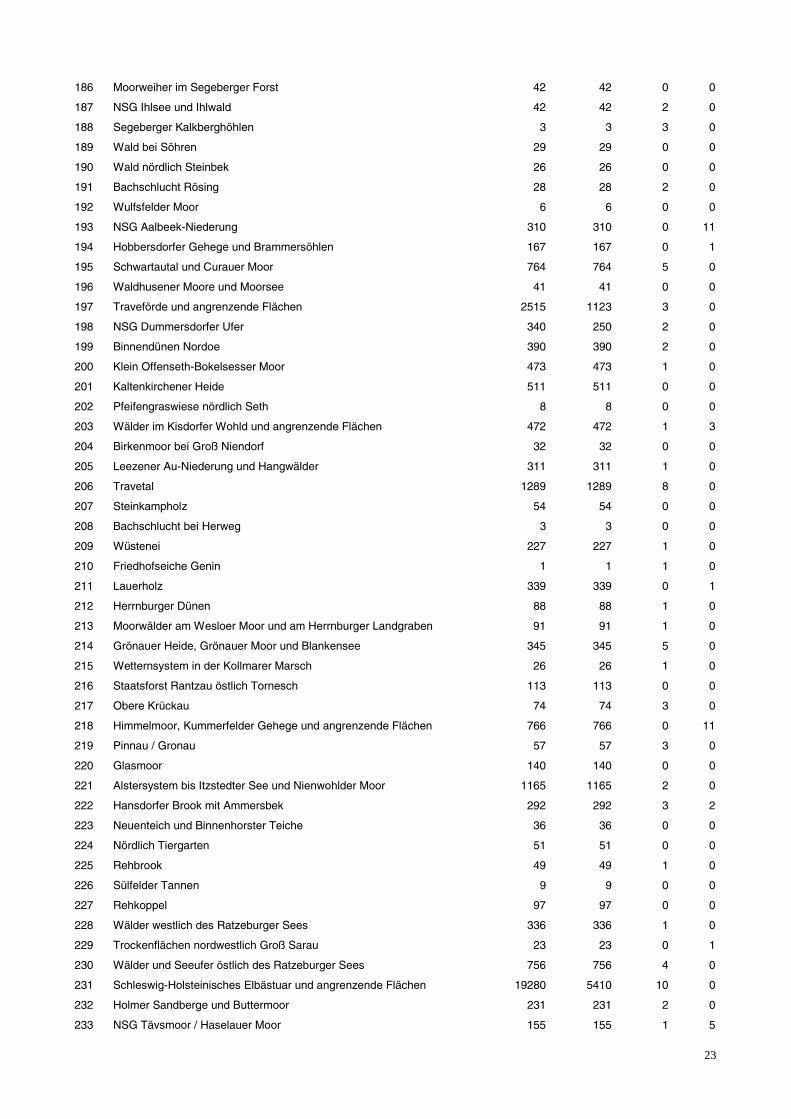
The variation in size and number of habitat types of the 271 SAC’s are shown in Appendix 1. The variation in size varies between 1 ha up to 9,630 ha in land area and the number of habitat types in the sites varies between 1 and 10 (Source: Standard Data Form, DE 2016).
b) The total habitat area distributed in biogeographical regions There are two biographical regions in Schleswig-Holstein, the Atlantic and the Continental region. The total land area in the Habitat sites are distributed with 50.5 percent in the Atlantic region and 49.5 percent in the Continental biogeographical region (Source: Standard Data Form, DE 2016).
c) The percentage of land area covered by Natura 2000 sites 271 Natura 2000 sites are designated as SAC, with a total land area of 1,136 km2 and 46 sites are designated as Special Protection Areas (SPA) under the Bird Protection Directive with a total land area of 1,050 km2. There is a large overlap between SAC and SPA of 680 km2 giving a total of 311 Natura 2000 sites. The total land area of Natura 2000 sites is 1,560 km2 equivalent to 9.9 % percent of the Schleswig-Holstein land area (15,800 km2) covered by Natura 2000 sites (Source: Standard Data Form, DE 2016 and SH Ministerium für En-ergiewende, Landwirtschaft, Umwelt, Natur und Digitalisierung (MELUND 2017a)).
d) The percentage of the land area covered by SAC’s The 271 SAC’s cover a total of 1,136 km2 equivalent to 7.2 percent of the Schles-wig-Holstein land area (15,800 km2) (Source: Standard Data Form, DE 2016; MELUND 2017a).
e) The percentage of the land area covered by Special protection areas (SPA) The 46 SPA’s cover a total of 1,050 km2 equivalent to 6.7 percent of the Schles-wig-Holstein land area (15,800 km2) (Source: Standard Data Form, DE 2016; MELUND 2017a).
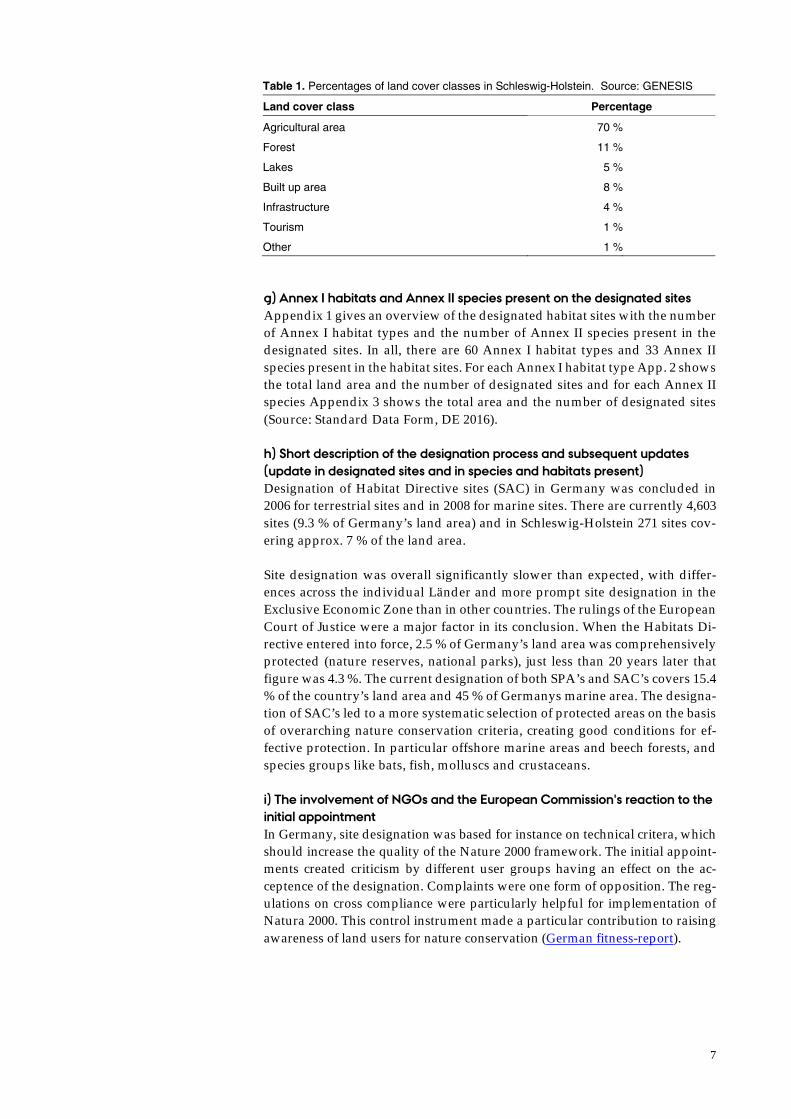
f) The percentage of Schleswig-Holstein land area covered by natural, non-cultivated areas The GENESIS land cover update of Schleswig-Holstein shows that 70 % of the Schleswig-Holstein land area is agricultural land. 33 % of the agricultural land is permanent pasture. Natural areas is not a specific land cover class. The for-est area, comprising both natural areas and forested areas, is 11 percent, much lower than the percentage of forest in the entire Germany (31 %).
The SH countryside is characterized by a relatively high share of structural elements such as lakes, ponds, hedgerows, solitary trees, etc. Most of these elements can be counted as Ecological Focus Area under the Common Agri-cultural Policy. This may explain the relatively small share of set-aside (1%).
7
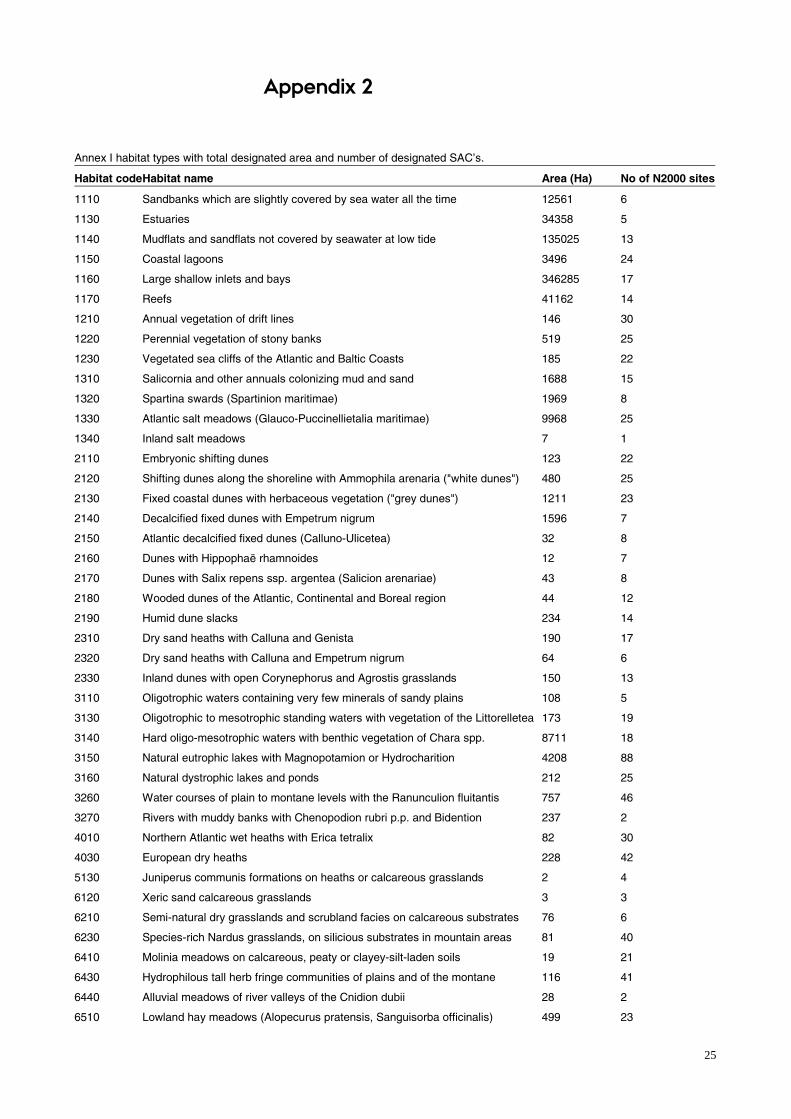
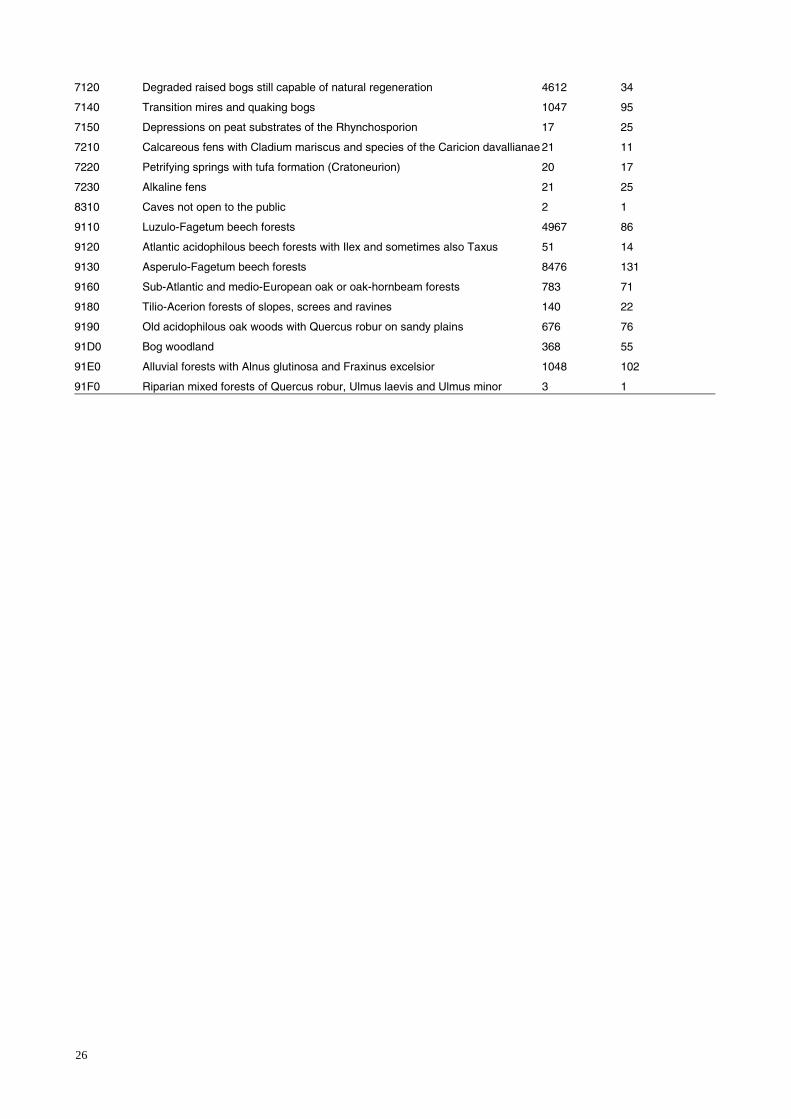
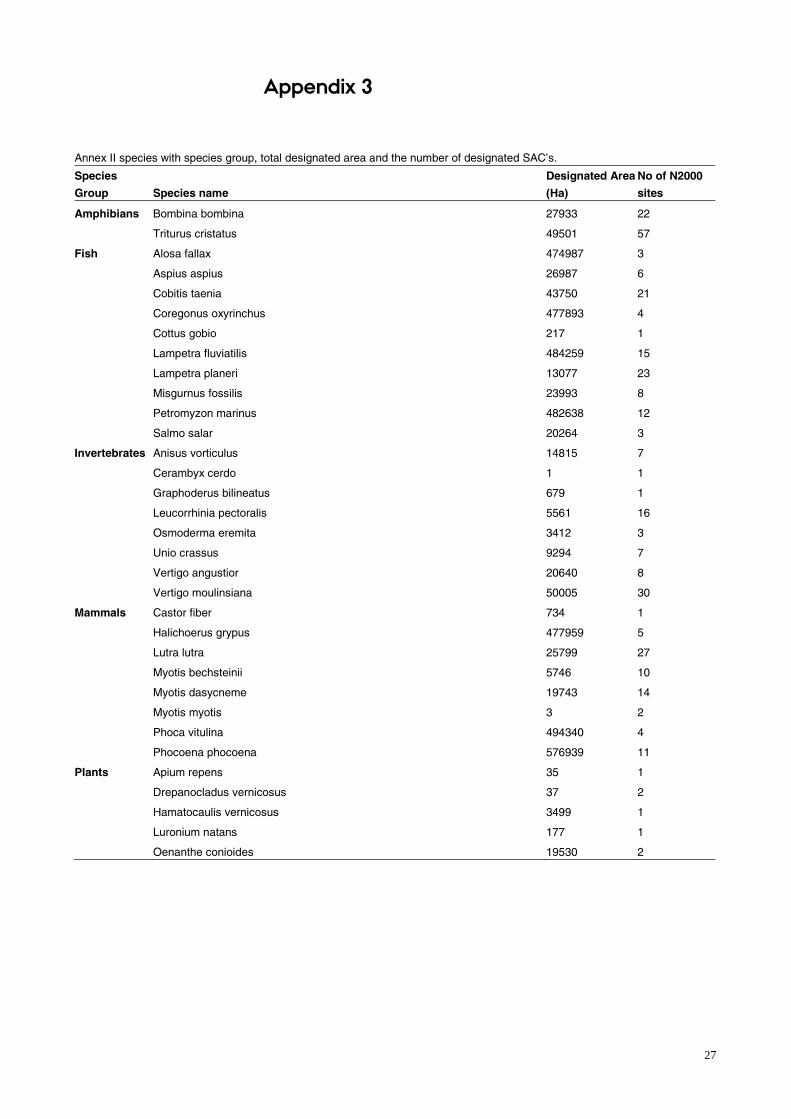
g) Annex I habitats and Annex II species present on the designated sites Appendix 1 gives an overview of the designated habitat sites with the number of Annex I habitat types and the number of Annex II species present in the designated sites. In all, there are 60 Annex I habitat types and 33 Annex II species present in the habitat sites. For each Annex I habitat type App. 2 shows the total land area and the number of designated sites and for each Annex II species Appendix 3 shows the total area and the number of designated sites (Source: Standard Data Form, DE 2016).
h) Short description of the designation process and subsequent updates (update in designated sites and in species and habitats present) Designation of Habitat Directive sites (SAC) in Germany was concluded in 2006 for terrestrial sites and in 2008 for marine sites. There are currently 4,603 sites (9.3 % of Germany’s land area) and in Schleswig-Holstein 271 sites cov-ering approx. 7 % of the land area.
Site designation was overall significantly slower than expected, with differ-ences across the individual Länder and more prompt site designation in the Exclusive Economic Zone than in other countries. The rulings of the European Court of Justice were a major factor in its conclusion. When the Habitats Di-rective entered into force, 2.5 % of Germany’s land area was comprehensively protected (nature reserves, national parks), just less than 20 years later that figure was 4.3 %. The current designation of both SPA’s and SAC’s covers 15.4 % of the country’s land area and 45 % of Germanys marine area. The designa-tion of SAC’s led to a more systematic selection of protected areas on the basis of overarching nature conservation criteria, creating good conditions for ef-fective protection. In particular offshore marine areas and beech forests, and species groups like bats, fish, molluscs and crustaceans.
i) The involvement of NGOs and the European Commission's reaction to the initial appointment In Germany, site designation was based for instance on technical critera, which should increase the quality of the Nature 2000 framework. The initial appoint-ments created criticism by different user groups having an effect on the ac-ceptence of the designation. Complaints were one form of opposition. The reg-ulations on cross compliance were particularly helpful for implementation of Natura 2000. This control instrument made a particular contribution to raising awareness of land users for nature conservation (German fitness-report).
Table 1. Percentages of land cover classes in Schleswig-Holstein. Source: GENESIS
Land cover class Percentage
Agricultural area 70 %
Forest 11 %
Lakes 5 %
Built up area 8 %
Infrastructure 4 %
Tourism 1 %
Other 1 %
8
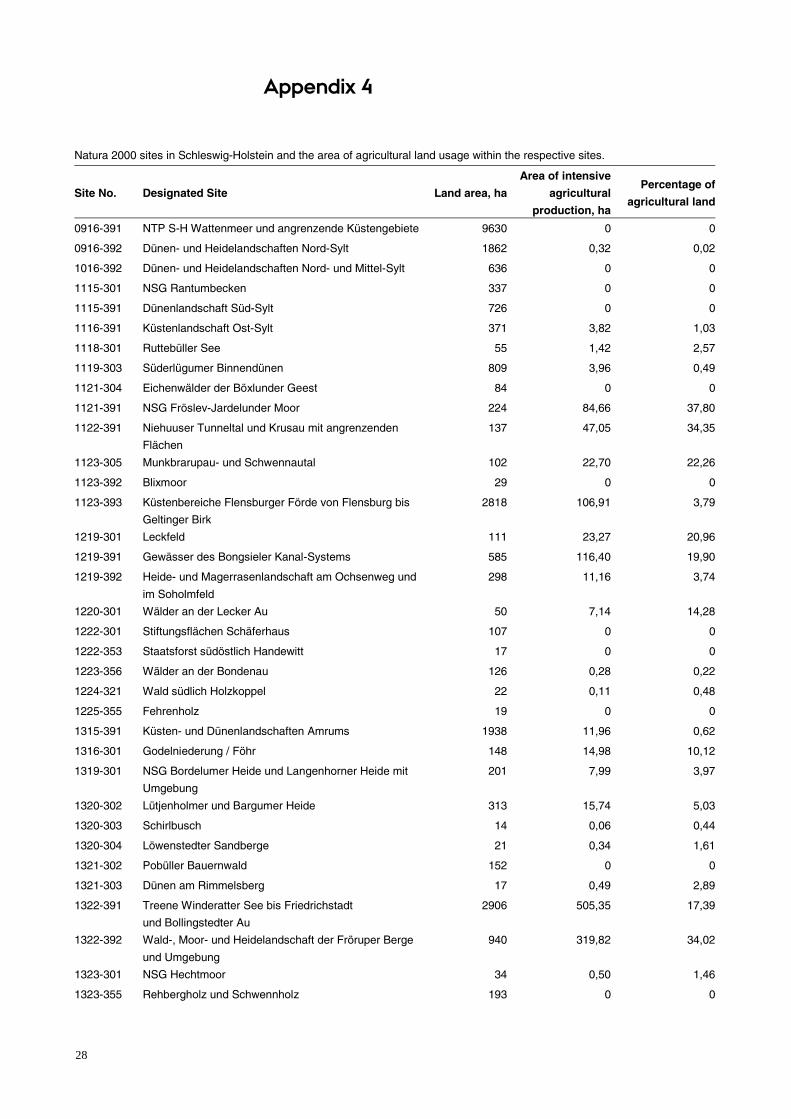
j) Total area with intensive agricultural production in each Natura 2000 site and in percentage of all Natura 2000 sites Based on the Federal Biotope-Mapping Data of Schleswig-Holstein recorded in the period of 2007-2012 (MELUND), the intensive agricultural production area was defined as area cultivated with crops (Code “AA”) and intensive grassland (Code “GI”). Accordingly, the intensive agricultural production within Natura 2000 sites comprises in total approximately 109.8 km2. This is equivalent to 10.5 % of the land area of the 271 reviewed Natura 2000 sites.
The individual distribution of area in hectares as well as the shares of the re-spective sites can be found in in Appendix 4. 71 of the 271 Natura 2000 sites do not comprise any area with intensive agricultural production, whereof four do not depict any land area. The total intensive agricultural production area of the remaining sites ranges between 0.01 and 1,800 ha. 113 sites show 10 or less percent of agricultural production; 80 sites depict between 11 and 50 percent and 7 sites have more than 50 percent agricultural production area within the boundaries of the Natura 2000 sites.
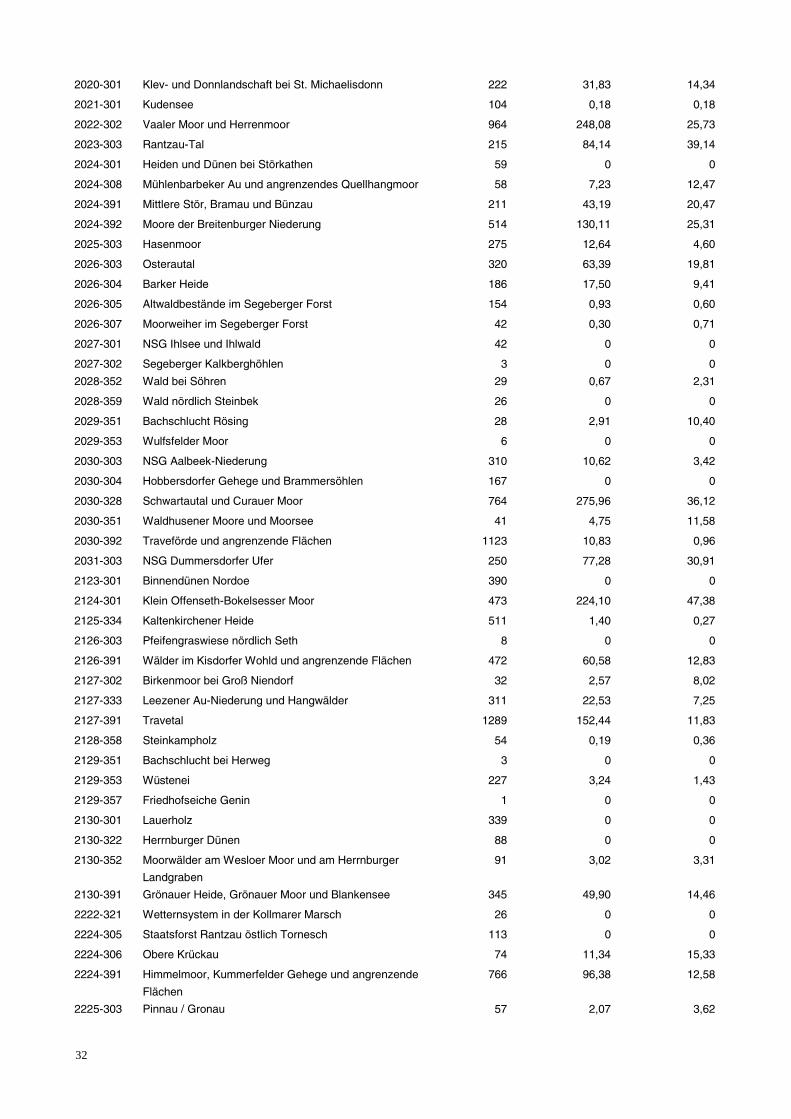
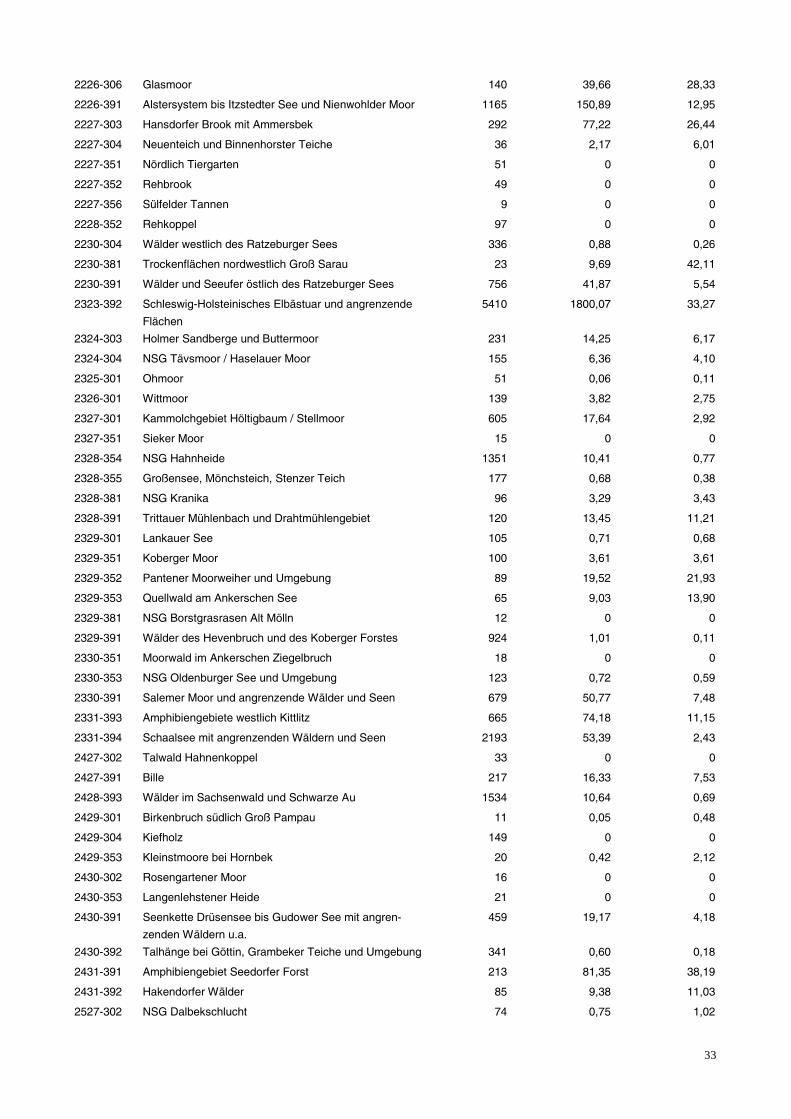
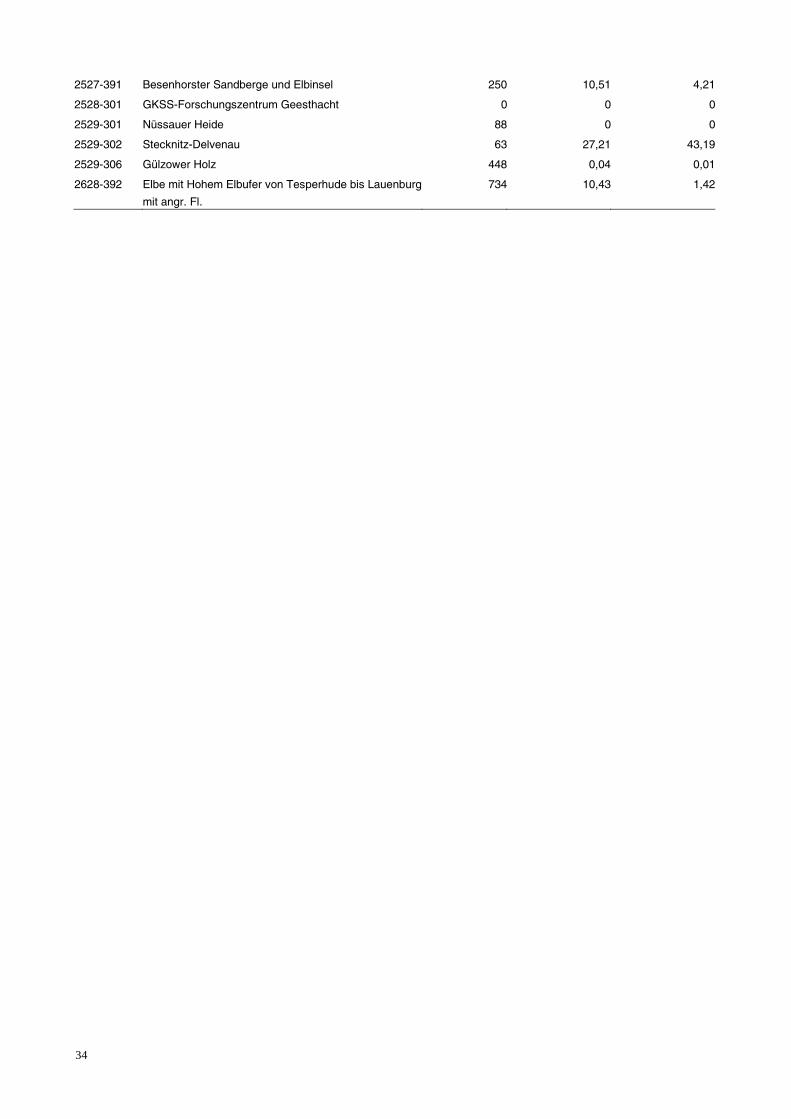
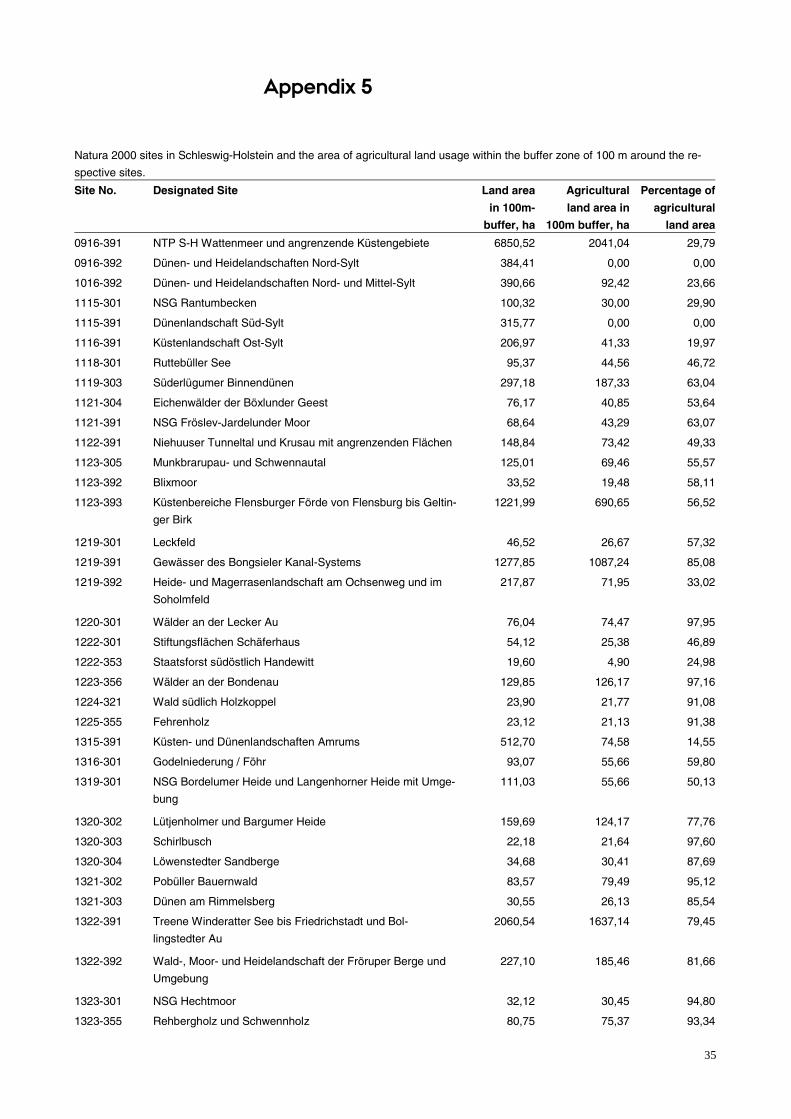
k) The percentage of area in a 100 meter buffer outside the Natura 2000 sites with intensive agricultural production For assessing the 100m-buffer areas of the Natura 2000 sites in Schleswig-Hol-stein, the CORINE land cover data (CLC) from year 2012 (BKG,2012) has been used. The categories “Non-irrigated arable land (211)”, “Complex cultivation patterns (242)”, “Land principally occupied by agriculture, with significant areas of natural vegetation (243)” as well as the category “Pasture, meadows and other permanent grasslands under agricultural use (231)” have been se-lected for evaluating the share of agricultural production in those buffer areas. The land area of the buffers has been calculated by substracting the coverage of the CLC categories “Sea and ocean (523)”, “Estuaries (522)”, “Coastal la-goons (521)”, “Water bodies (512)” as well as “Water courses (511)” from the total buffer areas.
Accordingly, in the 100 m buffer outside the Natura 2000 sites the total land area is approx. 61,200 ha. About 62 percent of this area (ca. 38,100 ha) is cov-ered with area of agricultural production. The respective distribution accord-ing to the different Natura 2000 sites can be found in Appendix 5. All in all, it can be said that for 200 out of the reviewed 271 sites, the share of agricultural production is over 50 percent of the total 100m-buffer area. Hereof, 52 buffers show a share of over 90 percent. Only 14 sites do not depict any agricultural production in their 100 m buffer surrounding.
l) Number and total area of livestock farms in the Natura 2000 sites and in a buffer of 1000 and 2000 meters outside the N2000 sites In course of the present project, data on the explicit location of the farms within the Federal State of Schleswig-Holstein could not be generated. Thus, the following calculations were based on the number of farms per community provided by the Statistics Agency Schleswig-Holstein (Statistisches Amt Schleswig-Holstein, SASH, 2016). The number of farms per community adds up all farms, which are registered in the respective community with a land area over five hectare. After the average numbers of farms per hectare of the community were calculated, those numbers were transferred to the propor-tional share of the community area of the Natura 2000 sites. Therefore, the numbers of farms and livestock units (GV) per Natura 2000 site are only ap-proximate numbers. As already mentioned, this is due to the lack of data and
9
the missing information on the exact location and facilities of the farms. More-over, the results refer to the evaluation of 268 Natura 2000 sites and their buff-ers owing to the fact that three sites and their buffers only comprise sea-area.
Consequently, in 2016 there are about 3,057 husbandry farms registered in the vicinity of a 1000 m-buffer of the Natura 2000 sites. The total agricultural pro-duction area within this buffer (calculated with the CLC data like in 1 k) ac-counts for about in total 3,907 km2, which is approx. 67 percent of the total land area (5863 km2) of the 1000 m-buffer zone.
In the 2000 m-buffer there are about 6,634 husbandry farms. There, the area with agricultural production depicts approx. 8,570 km2, reflecting about 68 percent of the total land area within the buffer (ca. 12,585 km2).
The number of farms within the Natura 2000 sites cannot be stated due to a lack of accurate data. Still, an estimation is transferred from the existence of biotops with the category “Agricultural production facility (SDp)” and “Rural housing (SDl)” within the boundaries of the protection sites (LLUR, 2012). Therefore, it can be stated that 60 sites show signs of farm buildings. However, the exact number of farms, their recent usage and their assignment as actual commercial units or housing units of the farm cannot be answered.
m) Number, size, type and total area of husbandry farms in the Natura 2000 sites and in a buffer of 1000 and 2000 meters outside the N2000 sites today and for the past 10 years to show the development in locations of hus-bandry farms As already described in 1 l), there was no explicite data on the location of the husbandry farms and their livestock available in course of the present project. Thus, the data provided by the Statistics Agency Schleswig-Holstein (Statis-tisches Amt Schleswig-Holstein) for the husbandry farms and the livestock units per community for the years 2010 (SASH, 2010) and 2016 (SASH, 2016) was used. The information on the agricultural production area within the Natura 2000 sites and their buffers is only available for the year 2012.
For 2010, the 1000m-buffer accounts for approx. 3,618 husbandry farms and an amount of 313,525 livestock units. In the 2000m-buffer area there have been registered about 7,851 farms and approximate livestock units of 686,379.
For 2016, the 1000m-buffer accounts for approx. 3,057 husbandry farms and an amount of 295,814 livestock units. In the 2000m-buffer area there have been registered about 6,635 farms and approximate livestock units of 650,773.
When comparing the two years, it can be seen that for the 1000m as well as the 2000m buffer there have been on average declines in the number of farms as well as the livestock units.
For the 1000 m-buffer of 20 Natura 2000 sites the approximate amount of farms remained unchanged or increased. For the remaining 248 sites, there has been a decline within the assessed time span of 6 years. 27 of these sites show a reduction of about five to 45 farms. For the livestock units an increase of up to 800 livestock units can be recorded for the 1000m-buffers around 77 sites. Two sites do not depict any livestock. The other 189 buffers show a de-cline up to 2,642 livestock units. When calculating the difference of livestock unit per ha of the 1000m-buffers, 177 buffers show a decline, 20 remain un-changed and 69 buffer zones show an increase.
10
For the 2000m-buffers around 11 Natura 2000 sites there has been a relative increase of the number of farms. Two buffers do not show a change. The re-maining 255 buffer zones show a decline ranging from a decline between 0.05 and 75 husbandry farms. Addressing the livestock units, an increase of up to 1,441 units for 81 buffer zones and a decline for 185 buffers can be depicted. Two buffers do not have any livestock. Regarding the difference of livestock unit per ha of the 2000m-buffers, marginal declines can be pointed out for 178 buffers, 18 buffer remain unchanged and 70 buffers show a positive trend.
11
2 The state of nature and effort
a) To what extend is the assessment of the state of the Natura 2000 sites based on data from the Schleswig-Holstein monitoring programme According to the Article 17 in the Habitats Directive the member states are responsible for reporting the conservation status of habitats and species on the annexes to the European Commission. The first report in 2000 focused on implementation of the Directive, while the reporting in 2007 (covering the pe-riod 2001-2006) and in 2013 (2007-2012) were focused on the conservation sta-tus of the species and habitat types listed in the Directive.
A system to monitor habitat types has been implemented since 2008, and formed the basis for the 2013 Article 17 reporting. An overview of the methods used in the German Art. 17 reporting is shown in Table 2.
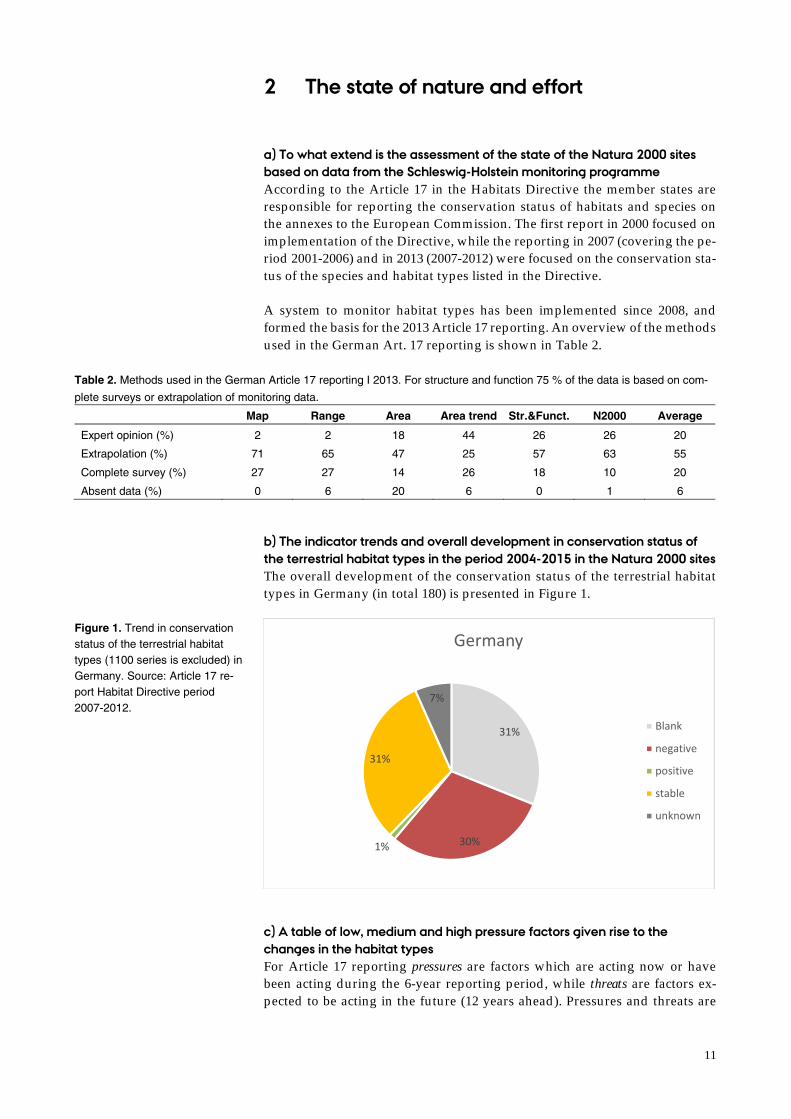
b) The indicator trends and overall development in conservation status of the terrestrial habitat types in the period 2004-2015 in the Natura 2000 sites The overall development of the conservation status of the terrestrial habitat types in Germany (in total 180) is presented in Figure 1.
c) A table of low, medium and high pressure factors given rise to the changes in the habitat types For Article 17 reporting pressures are factors which are acting now or have been acting during the 6-year reporting period, while threats are factors ex-pected to be acting in the future (12 years ahead). Pressures and threats are
Table 2. Methods used in the German Article 17 reporting I 2013. For structure and function 75 % of the data is based on com-
plete surveys or extrapolation of monitoring data.
Map Range Area Area trend Str.&Funct. N2000 Average
Expert opinion (%) 2 2 18 44 26 26 20
Extrapolation (%) 71 65 47 25 57 63 55
Complete survey (%) 27 27 14 26 18 10 20
Absent data (%) 0 6 20 6 0 1 6
Figure 1. Trend in conservation status of the terrestrial habitat types (1100 series is excluded) in Germany. Source: Article 17 re-port Habitat Directive period 2007-2012.
31%
30%1%
31%
7%
Germany
Blank
negative
positive
stable
unknown
12
reported separately. The total list of pressures and threats used for the assess-ment can be found on the Article 17 Reference Portal (See http://bd.eio-net.europa.eu/activities/Reporting/Article_17/reference_portal.).
The relative importance of a threat or pressure are ranked in one of three cat-egories:
• High importance/ impact (H): Important direct or immediate influence and/or acting over large areas.
• Medium importance/ impact (M): Medium direct or immediate influence, mainly indirect influence and/or acting over moderate part of the area/acting only regionally.
• Low importance/ impact (L): Low direct or immediate influence, indirect influence and/or acting over small part of the area/ acting only regionally.
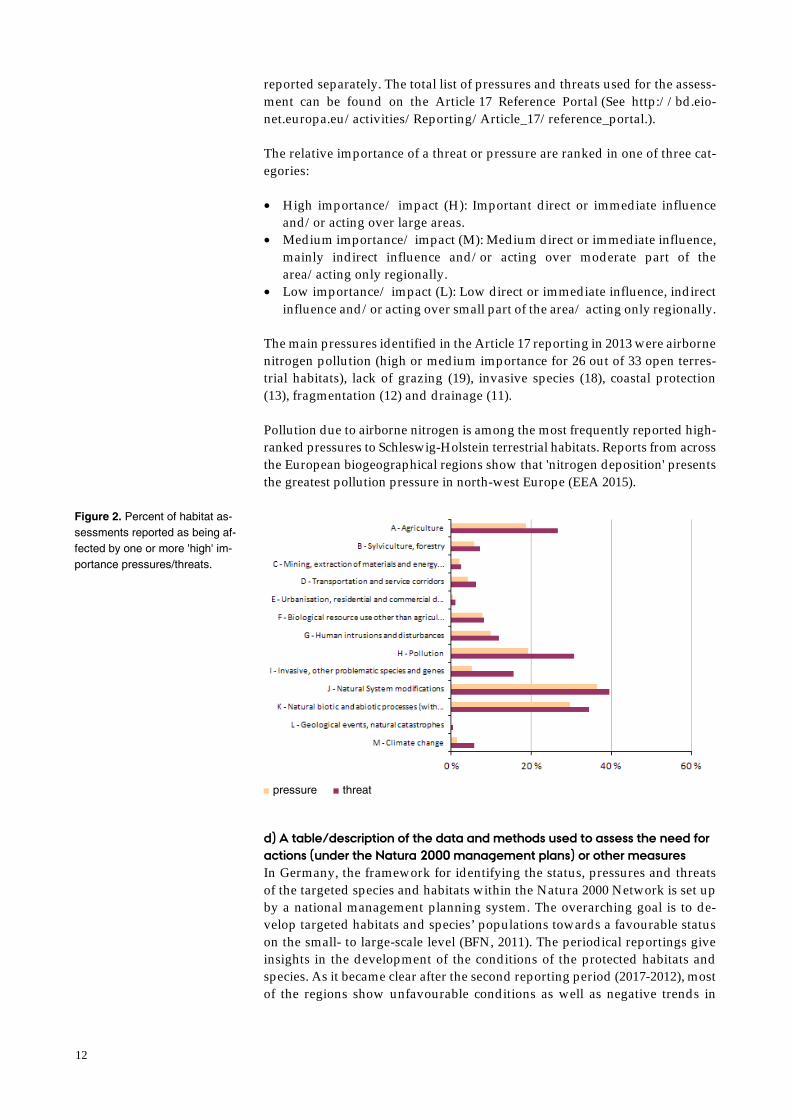
The main pressures identified in the Article 17 reporting in 2013 were airborne nitrogen pollution (high or medium importance for 26 out of 33 open terres-trial habitats), lack of grazing (19), invasive species (18), coastal protection (13), fragmentation (12) and drainage (11).
Pollution due to airborne nitrogen is among the most frequently reported high-ranked pressures to Schleswig-Holstein terrestrial habitats. Reports from across the European biogeographical regions show that 'nitrogen deposition' presents the greatest pollution pressure in north-west Europe (EEA 2015).
d) A table/description of the data and methods used to assess the need for actions (under the Natura 2000 management plans) or other measures In Germany, the framework for identifying the status, pressures and threats of the targeted species and habitats within the Natura 2000 Network is set up by a national management planning system. The overarching goal is to de-velop targeted habitats and species’ populations towards a favourable status on the small- to large-scale level (BFN, 2011). The periodical reportings give insights in the development of the conditions of the protected habitats and species. As it became clear after the second reporting period (2017-2012), most of the regions show unfavourable conditions as well as negative trends in
Figure 2. Percent of habitat as-sessments reported as being af-fected by one or more 'high' im-portance pressures/threats.
■ pressure ■ threat
13
Schleswig-Holstein and across Germany, mainly due to the pressures and threats described in 2 c) (LLUR, 2015).
By setting uniform guidelines for the data acquisition and the evaluation schemes of habitats and species, a mechanism has been established by the Federal Environmental Agencies to ensure a comparable monitoring across all Federal States (BFN, 2015).
Basis for the assessment of specific needs for actions are the standardized mappings and vegetation surveys of Natura 2000 habitats. A working group of experts and members of the environmental agencies developed a unified mapping and evaluation scheme for every specific habitat type and species. In a standardized format, the conditions of the habitats are rated and appro-priate measures for improving these conditions are reported. These are also part of the Natura 2000 management plans. The actions can be allocated to a collection of measures for maintenance and development by the Federal Agency for Nature Conservation (BFN, 2015). Thus, a unified reporting across Germany shall be ensured and the focus for an enlarged need for actions can be set.
Additionally, in 2016 a report on recommendations for the management of 38 selected habitat types of Annex I and 21 species listed in Annex II, IV, V of the atlantic biogeographic region has been published by the Federal Agency for Nature Conservation (Ackermann et al., 2016). In this report, the habiats’ and species’ recent national status is portrayed, the need for action described and recommendations for improvements given. The document can support the es-tablishment or further development of Natura 2000 management plans.
The assessment and the actual implementation of the targeted actions are mostly conducted by local nature conservation authorities, planning agencies, voluntary and other nature associations.
e) Nitrogen / ammonia sensitivity in relationship to ammonia regulation: i) Which nature classification systems are used categorizing ammonia sensitive nature types: Habitat Directive Annex 1, EUNIS, national systems?
Nitrogen regulation in Germany has two main elements: nitrogen balancing in the production sphere (e.g. farm level balances), and protection of sensitive nature areas from eutrophication and acidification (CS-Bericht 2017). Nitro-gen sensitivity is assessed on the basis of critical loads. The following CORINE land-cover types are considered nitrogen sensitive: deciduous-, coniferous- and mixed forests (311, 312, and 313), Natural grassland (321), heath and moor (322), swamps (411), and peatlands (412). The total area of nitrogen sensitive nature is thus 10.904.150ha. Special protected areas consist of Natura 2000 ar-eas (SAC and SPA), Biosphere Reserves, Nature Parks, National Parks, Pro-tected Landscape Areas, and Nature Reserves. All of these are considered po-tential nitrogen sensitive (Umwelt Bundesamt 2014).
Germany participates actively in the scientific work under the UNECE, Air Convention, and in the development of the three main methodologies to as-sess critical loads: Mass balance calculation, the empirical approach, and dy-namic modelling. For certain habitat types, the empirical critical load ranges have been found to be too broad and inadequate in Germany.
14
ii) Which nitrogen sensitivity assessments (e.g. critical loads) are used for the different nature types or areas? A project was commissioned by the Bundesanstalt für Straßenwesen (BASt) to define critical loads for habitats in Germany. This work was car-ried out in three steps:
• Approximately 2,000 habitat sub-types were carefully defined. • Critical loads were modelled for each sub-type, using a simple mass
balance model combined with the BERN model (a plant community da-tabase with critical limits).
• Critical loads were validated by expert judgement and cross-compari-son with empirical critical loads.
As part of this work an automated tool was developed to provide critical load ranges for selected habitats (and sub-types) based upon climatic, soil and plant community variables. The methodology provides critical loads for nutrient nitrogen and acidification at any selected site. Critical limits can be applied for the protection of both nature types and individual spe-cies. If one or more variables are unknown then approximate ranges are produced (Whitfield & McIntosh 2013; CL-Dokumentation 2014). Critical loads are mapped for the whole country on a 1x1 km2 grid. On the country scale, the EUNIS classification system is used, and for the SAC areas, the Annex 1 nature types. Where local mapping has not been made, the most likely EUNIS / Annex I class is derived based on combined information from the CORINE land cover map, soil map (Bük 1000) and regional cli-mate maps (Umwelt Bundesamt 2014).
iii) How are these classification systems and sensitivity assessments used in the national ammonia regulation in relationship to the Habitat Di-rective, and other EU and national regulations related to the protection of ammonia sensitive nature types Critical loads are used in appropriate assessments under Article 6.3 as well as in setting compensatory measures to maintain the coherence of the Natura 2000 site network. For project screening a contribution from a pro-ject of more than 3% of the CL is considered to be an adverse effect. Ap-propriate assessment is based on critical loads. Assessment values are still not uniformly defined in a federal approach. Critical loads are not used in setting site-specific conservation objectives or conservation measures, or in developing site management plans, but many site-/habitat-specific con-servation objectives and management activities aim to maintain or restore nutrient-poor conditions on a qualitative basis (Whitfield, C. & McIntosh, N. 2013).
f) In what year was the Schleswig-Holstein monitoring programme imple-mented? A system to monitor habitat types under Annex I and species under Annexes II and IV has been developed since 2001, and has been implemented since 2008 for the Atlantic and Continental region. It was incorporated into the Hab-itats Directive Report for the first time in 2013 (Doerpinghaus et al. 2003, Sachteleben & Behrens 2010, Schnitter et al. 2006, Weddeling et al. 2007).
A procedure for producing the national Habitats Directive Reports, based on close cooperation between the Länder and the federal government, has been established in Germany since the 2007 Habitats Directive Report.
15
Specialist knowledge on the occurrence of habitat types and species habitats was not always available to a sufficient degree. Basic data collection has now largely been completed and nationwide monitoring to meet the requirements of Article 11 of the Habitats Directive has been established. Currently special-ist knowledge is lacking for only a few very special species, particularly in the Alpine region.
In 2008, an administrative agreement between the federal government and the Länder on bird monitoring was set up, that allowed far-reaching statements about birdlife in Germany on the management and protection measures on bird species. Based on this, the federal government and Länder jointly finance nationwide coordination of the volunteer bird monitoring programmes and processing of the data by the Federation of German Avifaunists (DDA) (Sud-feldt et al. 2012). The results are used in the Article 12 reporting of the Birds Directive.
g) In what year was the Schleswig-Holstein Natura 2000 Natura Manage-ment Plans implemented? By the end of 2016 objectives and measures will be established for almost 80 % of areas, for 90 % by 2017, and for all areas by 2018 in Schleswig-Holstein (MELUND 2017b). In Germany, management plans are in place for 1,740 areas (20.4 % of the land area) and are being developed for 591 areas (Bundesregier-ung 2013). Management plans are scheduled to be developed for the vast ma-jority of areas, so that they give a good indication of implementation progress.
h) Is it possible to document a biological effect of the Natura 2000 manage-ment plans in the monitoring data in the period 2004-2015, and if not, when is this effect expected to be significant? Is not described
16
3 References
Ackermann, W.; Streiberger, M.; Lehrke, S. (2016): Maßnahmen für ausge-wählte Arten und Lebensraumtypen der FFH-Richtlinie zur Verbesserung des Erhaltungszustands von Natura 2000-Schutzgütern in der atlantischen bi-ogeographischen Region. BfN-Skripten 449. Bonn.
Bundesamt für Kartographie und Geodäsie (BKG, 2012): CORINE Land Co-ver 10 ha. Online access: http://www.geodatenzentrum.de/geodaten/gdz_rah-men.gdz_div?gdz_spr=deu&gdz_akt_zeile=5&gdz_anz_zeile=1&gdz_unt_zeile=22&gdz_user_id=0 (last access: 15.11.2017).
Bundesamt für Naturschutz (BFN, 2011): Management der Natura 2000-Ge-biete. Online access: https://www.bfn.de/themen/natura-2000/management.html (last access: 16.11.2017).
Bundesregierung (2013): Nationaler Bericht nach Artikel 17 der FFH-Richtli-nie. Bonn (BMUB & BfN): http://www.bfn.de/0316_nat-bericht_2013-kom-plett.html.
BFN (2015): Natura 2000. Bewertungsschema. Online access: https://www.bfn.de/themen/natura-2000/berichte-monitoring/nationaler-ffh-bericht/bewertungsschemata.html (last access: 16.11.2017).
CS-Bericht 2017. Bund-Länder-Fachgespräch Stickstoffbilanz (FGNB), Klä-rung der Anforderungen an die Stickstoffbilanzierung.
CL-Dokumentation 2014. AG Critical Loads Baden-Württemberg 2014 in Ab-stimmung mit dem Bund-Länder Fachgespräch Critical Loads, Ermittlung standortspezifischer Critical Loads für Stickstoff.
Doerpinghaus, A.; Verbücheln, G.; Schröder, E.; Westhus, W.; Mast, R. & Neu-kirchen, M. (2003): Empfehlungen zur Bewertung des Erhaltungszustands der FFH -Lebensraumtypen: Grünland.- Natur und Landschaft 78 (8): 337-401.
GENESIS - German official statistics portal 2017 https://www.eui.eu/Rese-arch/Library/ResearchGuides/Economics/Statistics/DataPortal/Genesis.
German fitness-report. http://ec.europa.eu/environment/nature/legisla-tion/fitness_check/evidence_gathering/docs/Member%20State%20Stake-holders/Nature%20Protection%20Authorities/DE/MS%20-%20DE%20-%20NPA%20-%20EGQ.pdf
LLUR, 2012: Landesamt für Landwirtschaft, Umwelt und ländliche Räume Schleswig-Holstein. Ergebnisse der landesweiten FFH-Lebensraumtypen-Kartierung im Zeitraum 2007-2012.
17
LLUR, 2015: Landesamt für Landwirtschaft, Umwelt und ländliche Räume Schleswig-Holstein. Erhaltungszustand der Lebensraumtypen des Anhangs I der FFH-Richtlinie. Ergebnisse für Deutschland und Schleswig-Holstein für den Berichtszeitraum 2007-2012. Gesamterhaltungszustand. Online access: http://www.schleswig-holstein.de/DE/Fachinhalte/N/natura2000/Down-loads/lrtUebersicht.pdf?__blob=publicationFile&v=4. (last access: 16.11.2017).
MELUND 2017a: Fauna-Flora-Habitat-Gebiete (FFH). Online access: https://www.schleswig-holstein.de/DE/Fachinhalte/S/schutzgebiete/na-turschutzflaechen/flaechentypenFFH.html. (last access: 20.11.2017)
MELUND, 2017b. H.-J. Kaiser, personal communication, November 2017.
Sachteleben, J. & M. Behrens (2010): Konzept zum Monitoring des Erhaltung-szustandes von Lebensraumtypen und Arten der FFH -Richtlinie in Deutsch-land. - Ergebnisse des F+E -Vorhabens "Konzeptionelle Umsetzung der EU-Vorgaben zum FFH -Monitoring und Berichtspflichten in Deutschland". - BfN-Skripten 278, 183 S.
Schnitter, P., Ellwanger, G., Neukirchen, M. & Schröder, E. (Bearb.)(2006): Empfehlungen für die Erfassung und Bewertung von Arten als Basis für das Monitoring nach Artikel 11 und 17 der FFH -Richtlinie in Deutschland. - Ber-ichte des Landesamtes für Umweltschutz Sachsen-Anhalt (Halle), Sonderheft 2, 370 S.
Standard Data Form, DE. 2016. EEA https://www.eea.europa.eu/data-and-maps/data/natura-8.
Statistisches Amt für Hamburg und Schleswig-Holstein (SASH, 2010): Statis-tische Berichte. Teil 8 Naturräume und Gemeinden. Tabelle 5. Online access: https://www.statistik-nord.de/fileadmin/Dokumente/Statistische_Be-richte/landwirtschaft/C_IV_Teil_8_S_Raum/C_IV_LZ2010_Teil8_Korr.xlsx (last access: 10.11.2017).
Statistisches Amt für Hamburg und Schleswig-Holstein (SASH, 2016): Statis-tische Berichte 2016. (unpublished).
Sudfeldt, C., Dröschmeister, R., Wahl, J., Berlin, K., Gottschalk, T., Grüneberg, C., Mitschke, A. & Trautmann, S. (2012): Vogelmonitoring in Deutschland: Programme und Anwendungen. Naturschutz und Biologische Vielfalt 119, Bundesamt für Naturschutz, Bonn: 255 S.
Umwelt Bundesamt 2014. Modellierung und Kartierung atmosphärischer Stoffeinträge und kritischer Belastungs-schwellen zur kontinuierlichen Be-wertung der ökosystem-spezifischen Gefährdung der Biodiversität in Deutschland - PINETI (Pollutant INput and EcosysTem Impact). Teilbericht 4 Critical Loads, Exceedance und Belastungsbewertung, Umwelt Bundesamt, Texte 63/2014.
18
Weddeling, K., Eichen C., Neukirchen, M., Ellwanger, G., Sachteleben, J. & M. Behrens (2007): Monitoring und Berichtspflichten im Kontext der FFH -Richt-linie: Konzepte zur bundesweiten Erfassung des Erhaltungszustandes von nutzungsabhängigen Arten und Lebensraumtypen. S. 177-195. - In: Bege-mann, F., Schröder, S., Wenkel, K.-O. & H.-J. Weigel: Monitoring und Indika-toren der Agrobiodiversität. - Agrobiodiversität - Schriftenreihe des Informa-tions- und Koordinationszentrums für Biologische Vielfalt 27, 328 S.
Whitfield, C. & McIntosh, N. 2013 Nitrogen Deposition and the Nature Direc-tives Impacts and Responses: Our Shared Experiences. Report of the Work-shop held 2-4 December 2013, JNCC Report No. 521.
19
Appendix 1
Designated sites of Special Areas of Conservation (SAC) with total area, land area and number of Annex I habitat types and
number of Annex II species present in the site.
Site
no. Designated Site
Total area,
ha
Land area,
ha
No. of
Habitats
No.
Species
1 NTP S-H Wattenmeer und angrenzende Küstengebiete 452101 9630 7 0
2 Dünen- und Heidelandschaften Nord-Sylt 1916 1862 0 0
3 Dünen- und Heidelandschaften Nord- und Mittel-Sylt 642 636 0 0
4 NSG Rantumbecken 567 337 0 8
5 Dünenlandschaft Süd-Sylt 741 726 1 0
6 Küstenlandschaft Ost-Sylt 380 371 0 0
7 Ruttebüller See 55 55 0 2
8 Süderlügumer Binnendünen 809 809 1 0
9 Eichenwälder der Böxlunder Geest 84 84 0 0
10 NSG Fröslev-Jardelunder Moor 224 224 1 8
11 Niehuuser Tunneltal und Krusau mit angrenzenden Flächen 137 137 1 0
12 Munkbrarupau- und Schwennautal 102 102 0 0
13 Blixmoor 29 29 1 0
14 Küstenbereiche Flensburger Förde von Flensburg bis Geltinger Birk 10946 2818 5 0
15 Leckfeld 111 111 0 0
16 Gewässer des Bongsieler Kanal-Systems 585 585 4 0
17 Heide- und Magerrasenlandschaft am Ochsenweg und im Soholmfeld 298 298 1 0
18 Wälder an der Lecker Au 50 50 0 3
19 Stiftungsflächen Schäferhaus 107 107 0 0
20 Staatsforst südöstlich Handewitt 17 17 0 0
21 Wälder an der Bondenau 126 126 0 0
22 Wald südlich Holzkoppel 22 22 0 0
23 Fehrenholz 19 19 0 0
24 Küsten- und Dünenlandschaften Amrums 2158 1938 1 0
25 Godelniederung / Föhr 149 148 0 0
26 NSG Bordelumer Heide und Langenhorner Heide mit Umgebung 201 201 1 0
27 Lütjenholmer und Bargumer Heide 313 313 0 0
28 Schirlbusch 14 14 0 0
29 Löwenstedter Sandberge 21 21 0 0
30 Pobüller Bauernwald 152 152 0 0
31 Dünen am Rimmelsberg 17 17 1 0
32 Treene Winderatter See bis Friedrichstadt und Bollingstedter Au 2906 2906 10 0
33 Wald-, Moor- und Heidelandschaft der Fröruper Berge und Umgebung 940 940 1 0
34 NSG Hechtmoor 34 34 1 0
35 Rehbergholz und Schwennholz 193 193 0 0
36 Wellspanger-Loiter-Oxbek-System und angrenzende Wälder 1434 1434 4 0
37 Drülter Holz 131 131 0 0
38 NSG Schwansener See 202 75 0 14
39 Standortübungsplatz Husum 150 150 1 0
40 Moorweiher im Staatsforst Drelsdorf 6 6 0 0
41 Quell- und Niedermoore der Arlauniederung 56 56 0 0
20
42 Immenstedter Wald 155 155 0 0
43 Wälder im Süderhackstedtfeld 76 76 0 0
44 Ahrenviölfelder Westermoor 69 69 0 0
45 Wald Rumbrand 60 60 0 0
46 Gammellunder See 36 36 0 0
47 Tiergarten 96 96 0 0
48 Idstedtweger Geestlandschaft 98 98 1 0
49 Schlei incl. Schleimünde und vorgelagerter Flachgründe 8748 1489 2 0
50 Kiuser Gehege 38 38 0 0
51 Karlsburger Holz 186 186 0 0
52 Aassee und Umgebung 110 104 2 0
53 Wälder der Ostenfelder Geest 733 733 1 0
54 Kalkquellmoor bei Klein Rheide 19 19 0 0
55 Karlshofer Moor 52 52 0 0
56 Busdorfer Tal 31 31 0 0
57 Großer Schnaaper See, Bültsee und anschließende Flächen 253 253 0 0
58 Hemmelmarker See 159 135 0 0
59 Stohl 204 204 2 0
60 Naturwald Stodthagen und angrenzende Hochmoore 321 321 3 0
61 Südküste der Eckernförder Bucht und vorgelagerte Flachgründe 8238 296 3 0
62 Küstenlandschaft Bottsand - Marzkamp u. vorgelagerte Flachgründe 5483 90 1 0
63 Sundwiesen Fehmarn 35 35 2 0
64 Küstenstreifen West- und Nordfehmarn 1456 1453 2 0
65 Staberhuk 1657 41 1 6
66 Dünen St. Peter 153 153 0 0
67 Lundener Niederung 902 902 0 0
68 Wälder bei Bergenhusen 145 145 0 0
69 Gräben der nördlichen Alten Sorge 769 769 3 0
70 Moore der Eider-Treene-Sorge-Niederung 3499 3499 1 0
71 Fockbeker Moor 375 375 0 0
72 Wald östlich Hohn 11 11 0 0
73 Owschlager See 44 44 0 0
74 Übergangsmoor im Kropper Forst 18 18 0 0
75 Binnendünen- und Moorlandschaft im Sorgetal 958 958 2 0
76 Wälder der Hüttener Berge 416 416 0 0
77 Wittensee und Flächen angrenzender Niederungen 1220 1220 0 1
78 Kluvensieker Holz 261 261 0 0
79 Kiel Wik / Bunkeranlage 0 0 1 0
80 Kalkquelle am Nord-Ostsee-Kanal in Kiel 9 9 0 0
81 Hagener Au und Passader See 525 525 1 0
82 Gorkwiese Kitzeberg 7 7 1 0
83 Kalkreiche Niedermoorwiese am Ostufer des Dobersdorfer Sees 26 26 2 0
84 Selenter See 2390 2390 4 0
85 Hohenfelder Mühlenau 155 155 1 0
86 Strandseen der Hohwachter Bucht 1319 1306 4 0
87 Seegalendorfer Gehölz 13 13 0 0
88 Seegalendorfer und Neuratjensdorfer Moor 68 68 0 0
89 Putlos 1042 1042 2 0
21
90 Meeresgebiet der östlichen Kieler Bucht 61830 19 1 0
91 Küstenlandschaft Nordseite der Wagrischen Halbinsel 315 249 2 0
92 Küstenlandschaft vor Großenbrode und vorgelagerte Meeresbereiche 1739 63 1 0
93 Steingrund 17450 0 3 3
94 Untereider 3606 2050 5 14
95 Weißes Moor 69 69 0 0
96 Wald bei Welmbüttel 105 105 0 0
97 Wald bei Hollingstedt 30 30 0 0
98 Kleiner Geestrücken südlich Dörpling 42 42 1 0
99 Wald westlich Wrohm 26 26 0 0
100 Gehege Osterhamm-Elsdorf 646 646 1 1
101 Dachsberg bei Wittenmoor 48 48 1 0
102 Wehrau und Mühlenau 246 246 3 0
103 Dünen bei Kattbek 152 152 0 0
104 Vollstedter See 160 160 1 0
105 Staatsforst Langwedel-Sören 278 278 1 0
106 Quellen am Großen Schierensee 23 23 0 0
107 Niedermoor bei Manhagen 25 25 0 0
108 Gebiet der Oberen Eider incl. Seen 2502 2502 10 0
109 Wald nordwestlich Boksee 25 25 0 0
110 Klosterforst Preetz 40 40 0 0
111 Untere Schwentine 451 451 7 0
112 Kolksee bei Schellhorn 6 6 1 0
113 Moorweiher bei Rastorf 55 55 0 0
114 Lanker See und Kührener Teich 679 679 7 0
115 Lehmkuhlener Stauung 29 29 0 0
116 NSG Rixdorfer Teiche und Umgebung 115 115 2 0
117 NSG Vogelfreistätte Lebrader Teich 144 144 1 0
118 Gottesgabe 686 686 2 0
119 Kalkflachmoor bei Mucheln 11 11 1 0
120 Großer und Kleiner Benzer See 48 48 0 0
121 Dannauer See und Hohensasel und Umgebung 341 341 2 1
122 Kossautal und angrenzende Flächen 213 213 4 0
123 Steinbek 150 150 1 0
124 Tal der Kükelühner Mühlenau 173 173 2 0
125 Wälder um Güldenstein 112 112 0 0
126 Guttauer Gehege 583 583 0 1
127 Rosenfelder Brök nördlich Dahme 45 45 0 0
128 Sagas-Bank 3238 0 1 3
129 Helgoland mit Helgoländer Felssockel 5509 48 3 0
130 NSG Fieler Moor 258 258 1 0
131 Ehemaliger Fuhlensee 86 86 1 0
132 Gieselautal 94 94 1 0
133 Riesewohld und angrenzende Flächen 435 435 1 0
134 Wälder der nördlichen Itzehoer Geest 711 711 2 0
135 Haaler Au 432 432 2 0
136 Wennebeker Moor und Langwedel 230 230 0 0
137 NSG Dosenmoor 546 546 1 1
22
138 Wald am Bordesholmer See 35 35 0 0
139 Grebiner See, Schluensee und Schmarkau 241 241 3 0
140 Seen des mittleren Schwentinesystems und Umgebung 6648 6648 7 0
141 Wald nördlich Malente 66 66 0 0
142 Buchenwälder Dodau 402 402 1 1
143 Röbeler Holz und Umgebung 333 333 2 0
144 NSG Neustädter Binnenwasser 277 277 0 9
145 Lachsau 159 159 0 0
146 Gebiet der Oberen Schwentine 420 420 3 0
147 Buchenwälder südlich Cismar 69 69 0 0
148 Kremper Au 191 191 1 0
149 Walkyriengrund 2224 0 0 0
150 Ostseeküste zwischen Grömitz und Kellenhusen 220 162 1 0
151 Windberger Niederung 363 363 0 0
152 Wälder östlich Mehlbek 60 60 0 1
153 Iselbek mit Lindhorster Teich 117 117 2 0
154 Schierenwald 588 588 1 0
155 Reher Kratt 92 92 0 0
156 Moore bei Christinenthal 37 37 0 0
157 Quellhangmoor Lohfiert 9 9 0 0
158 Wälder im Aukrug 879 879 3 0
159 Bönnebütteler Gehege 59 59 2 1
160 Kiebitzholmer Moor und Trentmoor 535 535 1 0
161 Tarbeker Moor 131 131 1 0
162 Wälder am Stocksee 109 109 0 0
163 Wälder zwischen Schlamersdorf und Garbek 111 111 0 0
164 Barkauer See 472 472 3 0
165 Heidmoorniederung 338 338 0 0
166 Wälder im Ahrensböker Endmoränengebiet 624 624 3 0
167 Middelburger Seen 124 124 1 0
168 Wälder im Pönitzer Seengebiet 210 210 0 0
169 Strandniederungen südlich Neustadt 46 34 0 0
170 Pönitzer Seengebiet 162 162 3 0
171 Süseler Baum und Süseler Moor 80 80 0 0
172 Ostseeküste am Brodtener Ufer 2084 17 0 4
173 Küstenlandschaft zwischen Pelzerhaken und Rettin 100 100 0 0
174 Klev- und Donnlandschaft bei St. Michaelisdonn 222 222 0 0
175 Kudensee 104 104 1 0
176 Vaaler Moor und Herrenmoor 964 964 0 0
177 Rantzau-Tal 215 215 3 0
178 Heiden und Dünen bei Störkathen 59 59 0 0
179 Mühlenbarbeker Au und angrenzendes Quellhangmoor 58 58 0 0
180 Mittlere Stör, Bramau und Bünzau 211 211 4 0
181 Moore der Breitenburger Niederung 514 514 0 0
182 Hasenmoor 275 275 0 0
183 Osterautal 320 320 4 2
184 Barker Heide 186 186 0 2
185 Altwaldbestände im Segeberger Forst 154 154 0 3
23
186 Moorweiher im Segeberger Forst 42 42 0 0
187 NSG Ihlsee und Ihlwald 42 42 2 0
188 Segeberger Kalkberghöhlen 3 3 3 0
189 Wald bei Söhren 29 29 0 0
190 Wald nördlich Steinbek 26 26 0 0
191 Bachschlucht Rösing 28 28 2 0
192 Wulfsfelder Moor 6 6 0 0
193 NSG Aalbeek-Niederung 310 310 0 11
194 Hobbersdorfer Gehege und Brammersöhlen 167 167 0 1
195 Schwartautal und Curauer Moor 764 764 5 0
196 Waldhusener Moore und Moorsee 41 41 0 0
197 Traveförde und angrenzende Flächen 2515 1123 3 0
198 NSG Dummersdorfer Ufer 340 250 2 0
199 Binnendünen Nordoe 390 390 2 0
200 Klein Offenseth-Bokelsesser Moor 473 473 1 0
201 Kaltenkirchener Heide 511 511 0 0
202 Pfeifengraswiese nördlich Seth 8 8 0 0
203 Wälder im Kisdorfer Wohld und angrenzende Flächen 472 472 1 3
204 Birkenmoor bei Groß Niendorf 32 32 0 0
205 Leezener Au-Niederung und Hangwälder 311 311 1 0
206 Travetal 1289 1289 8 0
207 Steinkampholz 54 54 0 0
208 Bachschlucht bei Herweg 3 3 0 0
209 Wüstenei 227 227 1 0
210 Friedhofseiche Genin 1 1 1 0
211 Lauerholz 339 339 0 1
212 Herrnburger Dünen 88 88 1 0
213 Moorwälder am Wesloer Moor und am Herrnburger Landgraben 91 91 1 0
214 Grönauer Heide, Grönauer Moor und Blankensee 345 345 5 0
215 Wetternsystem in der Kollmarer Marsch 26 26 1 0
216 Staatsforst Rantzau östlich Tornesch 113 113 0 0
217 Obere Krückau 74 74 3 0
218 Himmelmoor, Kummerfelder Gehege und angrenzende Flächen 766 766 0 11
219 Pinnau / Gronau 57 57 3 0
220 Glasmoor 140 140 0 0
221 Alstersystem bis Itzstedter See und Nienwohlder Moor 1165 1165 2 0
222 Hansdorfer Brook mit Ammersbek 292 292 3 2
223 Neuenteich und Binnenhorster Teiche 36 36 0 0
224 Nördlich Tiergarten 51 51 0 0
225 Rehbrook 49 49 1 0
226 Sülfelder Tannen 9 9 0 0
227 Rehkoppel 97 97 0 0
228 Wälder westlich des Ratzeburger Sees 336 336 1 0
229 Trockenflächen nordwestlich Groß Sarau 23 23 0 1
230 Wälder und Seeufer östlich des Ratzeburger Sees 756 756 4 0
231 Schleswig-Holsteinisches Elbästuar und angrenzende Flächen 19280 5410 10 0
232 Holmer Sandberge und Buttermoor 231 231 2 0
233 NSG Tävsmoor / Haselauer Moor 155 155 1 5
24
234 Ohmoor 51 51 0 0
235 Wittmoor 139 139 1 0
236 Kammolchgebiet Höltigbaum / Stellmoor 605 605 2 0
237 Sieker Moor 15 15 0 0
238 NSG Hahnheide 1351 1351 1 0
239 Großensee, Mönchsteich, Stenzer Teich 177 177 2 0
240 NSG Kranika 96 96 0 0
241 Trittauer Mühlenbach und Drahtmühlengebiet 120 120 0 0
242 Lankauer See 105 105 0 0
243 Koberger Moor 100 100 0 1
244 Pantener Moorweiher und Umgebung 89 89 0 0
245 Quellwald am Ankerschen See 65 65 0 0
246 NSG Borstgrasrasen Alt Mölln 12 12 0 0
247 Wälder des Hevenbruch und des Koberger Forstes 924 924 0 1
248 Moorwald im Ankerschen Ziegelbruch 18 18 0 0
249 NSG Oldenburger See und Umgebung 123 123 0 8
250 Salemer Moor und angrenzende Wälder und Seen 679 679 4 7
251 Amphibiengebiete westlich Kittlitz 665 665 3 0
252 Schaalsee mit angrenzenden Wäldern und Seen 2193 2193 3 0
253 Talwald Hahnenkoppel 33 33 0 0
254 Bille 217 217 5 0
255 Wälder im Sachsenwald und Schwarze Au 1534 1534 1 0
256 Birkenbruch südlich Groß Pampau 11 11 0 0
257 Kiefholz 149 149 0 0
258 Kleinstmoore bei Hornbek 20 20 0 1
259 Rosengartener Moor 16 16 0 0
260 Langenlehstener Heide 21 21 0 0
261 Seenkette Drüsensee bis Gudower See mit angrenzenden Wäldern u.a. 459 459 5 1
262 Talhänge bei Göttin, Grambeker Teiche und Umgebung 341 341 3 0
263 Amphibiengebiet Seedorfer Forst 213 213 3 0
264 Hakendorfer Wälder 85 85 2 0
265 NSG Dalbekschlucht 74 74 0 0
266 Besenhorster Sandberge und Elbinsel 250 250 6 0
267 GKSS-Forschungszentrum Geesthacht 0 0 2 0
268 Nüssauer Heide 88 88 0 0
269 Stecknitz-Delvenau 63 63 3 0
270 Gülzower Holz 448 448 0 0
271 Elbe mit Hohem Elbufer von Tesperhude bis Lauenburg mit angr. Fl. 734 734 6 0
25
Appendix 2
Annex I habitat types with total designated area and number of designated SAC’s.
Habitat code Habitat name Area (Ha) No of N2000 sites
1110 Sandbanks which are slightly covered by sea water all the time 12561 6
1130 Estuaries 34358 5
1140 Mudflats and sandflats not covered by seawater at low tide 135025 13
1150 Coastal lagoons 3496 24
1160 Large shallow inlets and bays 346285 17
1170 Reefs 41162 14
1210 Annual vegetation of drift lines 146 30
1220 Perennial vegetation of stony banks 519 25
1230 Vegetated sea cliffs of the Atlantic and Baltic Coasts 185 22
1310 Salicornia and other annuals colonizing mud and sand 1688 15
1320 Spartina swards (Spartinion maritimae) 1969 8
1330 Atlantic salt meadows (Glauco-Puccinellietalia maritimae) 9968 25
1340 Inland salt meadows 7 1
2110 Embryonic shifting dunes 123 22
2120 Shifting dunes along the shoreline with Ammophila arenaria ("white dunes") 480 25
2130 Fixed coastal dunes with herbaceous vegetation ("grey dunes") 1211 23
2140 Decalcified fixed dunes with Empetrum nigrum 1596 7
2150 Atlantic decalcified fixed dunes (Calluno-Ulicetea) 32 8
2160 Dunes with Hippophaë rhamnoides 12 7
2170 Dunes with Salix repens ssp. argentea (Salicion arenariae) 43 8
2180 Wooded dunes of the Atlantic, Continental and Boreal region 44 12
2190 Humid dune slacks 234 14
2310 Dry sand heaths with Calluna and Genista 190 17
2320 Dry sand heaths with Calluna and Empetrum nigrum 64 6
2330 Inland dunes with open Corynephorus and Agrostis grasslands 150 13
3110 Oligotrophic waters containing very few minerals of sandy plains 108 5
3130 Oligotrophic to mesotrophic standing waters with vegetation of the Littorelletea 173 19
3140 Hard oligo-mesotrophic waters with benthic vegetation of Chara spp. 8711 18
3150 Natural eutrophic lakes with Magnopotamion or Hydrocharition 4208 88
3160 Natural dystrophic lakes and ponds 212 25
3260 Water courses of plain to montane levels with the Ranunculion fluitantis 757 46
3270 Rivers with muddy banks with Chenopodion rubri p.p. and Bidention 237 2
4010 Northern Atlantic wet heaths with Erica tetralix 82 30
4030 European dry heaths 228 42
5130 Juniperus communis formations on heaths or calcareous grasslands 2 4
6120 Xeric sand calcareous grasslands 3 3
6210 Semi-natural dry grasslands and scrubland facies on calcareous substrates 76 6
6230 Species-rich Nardus grasslands, on silicious substrates in mountain areas 81 40
6410 Molinia meadows on calcareous, peaty or clayey-silt-laden soils 19 21
6430 Hydrophilous tall herb fringe communities of plains and of the montane 116 41
6440 Alluvial meadows of river valleys of the Cnidion dubii 28 2
6510 Lowland hay meadows (Alopecurus pratensis, Sanguisorba officinalis) 499 23
26
7120 Degraded raised bogs still capable of natural regeneration 4612 34
7140 Transition mires and quaking bogs 1047 95
7150 Depressions on peat substrates of the Rhynchosporion 17 25
7210 Calcareous fens with Cladium mariscus and species of the Caricion davallianae 21 11
7220 Petrifying springs with tufa formation (Cratoneurion) 20 17
7230 Alkaline fens 21 25
8310 Caves not open to the public 2 1
9110 Luzulo-Fagetum beech forests 4967 86
9120 Atlantic acidophilous beech forests with Ilex and sometimes also Taxus 51 14
9130 Asperulo-Fagetum beech forests 8476 131
9160 Sub-Atlantic and medio-European oak or oak-hornbeam forests 783 71
9180 Tilio-Acerion forests of slopes, screes and ravines 140 22
9190 Old acidophilous oak woods with Quercus robur on sandy plains 676 76
91D0 Bog woodland 368 55
91E0 Alluvial forests with Alnus glutinosa and Fraxinus excelsior 1048 102
91F0 Riparian mixed forests of Quercus robur, Ulmus laevis and Ulmus minor 3 1
27
Appendix 3
Annex II species with species group, total designated area and the number of designated SAC’s.
Species
Group Species name
Designated Area
(Ha)
No of N2000
sites
Amphibians Bombina bombina 27933 22
Triturus cristatus 49501 57
Fish Alosa fallax 474987 3
Aspius aspius 26987 6
Cobitis taenia 43750 21
Coregonus oxyrinchus 477893 4
Cottus gobio 217 1
Lampetra fluviatilis 484259 15
Lampetra planeri 13077 23
Misgurnus fossilis 23993 8
Petromyzon marinus 482638 12
Salmo salar 20264 3
Invertebrates Anisus vorticulus 14815 7
Cerambyx cerdo 1 1
Graphoderus bilineatus 679 1
Leucorrhinia pectoralis 5561 16
Osmoderma eremita 3412 3
Unio crassus 9294 7
Vertigo angustior 20640 8
Vertigo moulinsiana 50005 30
Mammals Castor fiber 734 1
Halichoerus grypus 477959 5
Lutra lutra 25799 27
Myotis bechsteinii 5746 10
Myotis dasycneme 19743 14
Myotis myotis 3 2
Phoca vitulina 494340 4
Phocoena phocoena 576939 11
Plants Apium repens 35 1
Drepanocladus vernicosus 37 2
Hamatocaulis vernicosus 3499 1
Luronium natans 177 1
Oenanthe conioides 19530 2
28
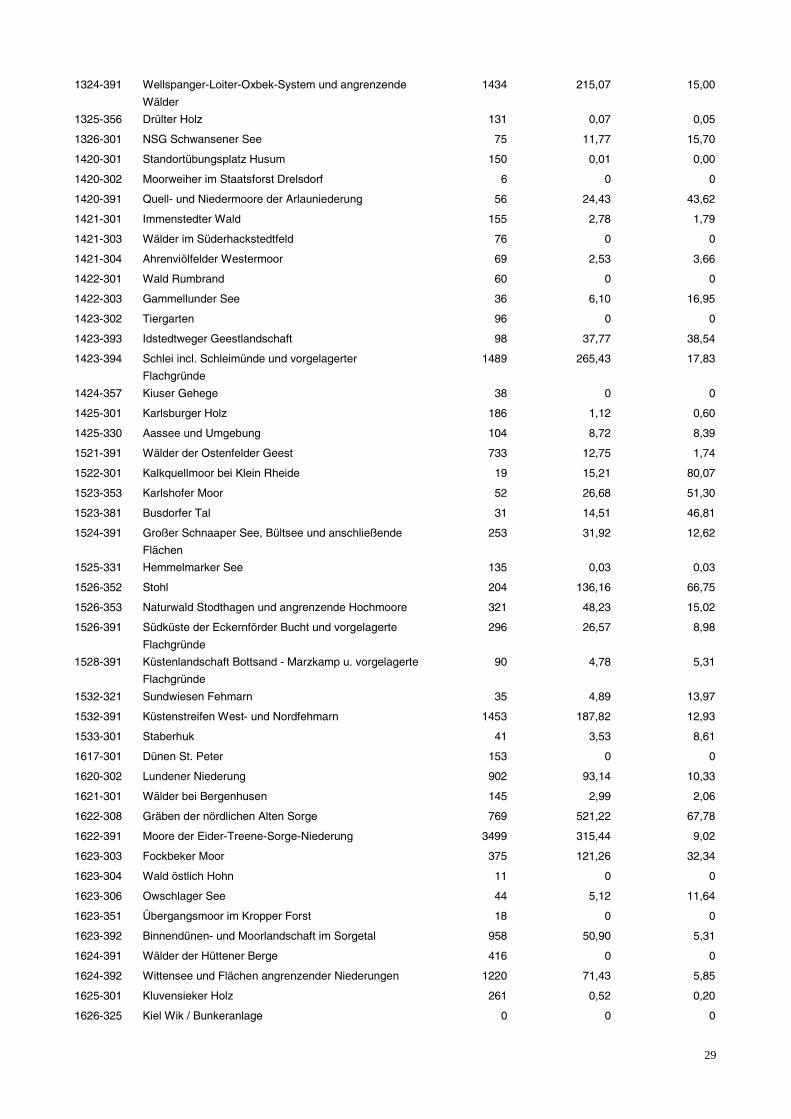
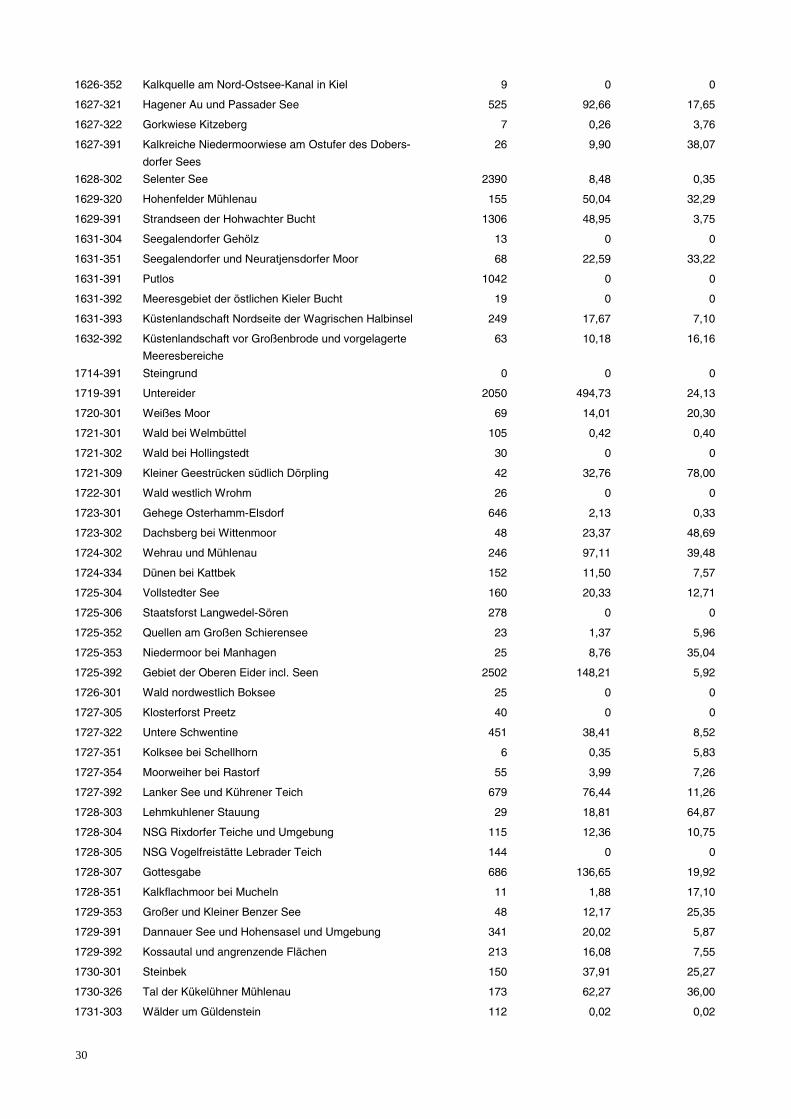
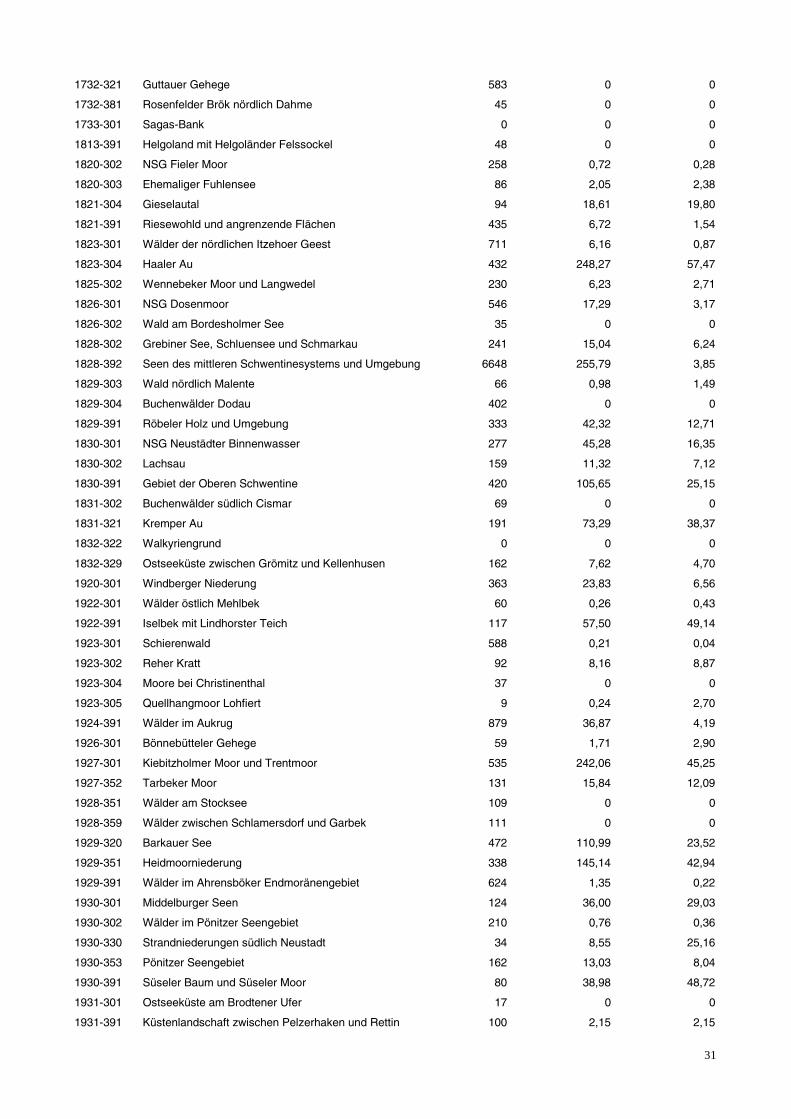
Appendix 4
Natura 2000 sites in Schleswig-Holstein and the area of agricultural land usage within the respective sites.
Site No. Designated Site Land area, ha
Area of intensive
agricultural
production, ha
Percentage of
agricultural land
0916-391 NTP S-H Wattenmeer und angrenzende Küstengebiete 9630 0 0
0916-392 Dünen- und Heidelandschaften Nord-Sylt 1862 0,32 0,02
1016-392 Dünen- und Heidelandschaften Nord- und Mittel-Sylt 636 0 0
1115-301 NSG Rantumbecken 337 0 0
1115-391 Dünenlandschaft Süd-Sylt 726 0 0
1116-391 Küstenlandschaft Ost-Sylt 371 3,82 1,03
1118-301 Ruttebüller See 55 1,42 2,57
1119-303 Süderlügumer Binnendünen 809 3,96 0,49
1121-304 Eichenwälder der Böxlunder Geest 84 0 0
1121-391 NSG Fröslev-Jardelunder Moor 224 84,66 37,80
1122-391 Niehuuser Tunneltal und Krusau mit angrenzenden
Flächen
137 47,05 34,35
1123-305 Munkbrarupau- und Schwennautal 102 22,70 22,26
1123-392 Blixmoor 29 0 0
1123-393 Küstenbereiche Flensburger Förde von Flensburg bis
Geltinger Birk
2818 106,91 3,79
1219-301 Leckfeld 111 23,27 20,96
1219-391 Gewässer des Bongsieler Kanal-Systems 585 116,40 19,90
1219-392 Heide- und Magerrasenlandschaft am Ochsenweg und
im Soholmfeld
298 11,16 3,74
1220-301 Wälder an der Lecker Au 50 7,14 14,28
1222-301 Stiftungsflächen Schäferhaus 107 0 0
1222-353 Staatsforst südöstlich Handewitt 17 0 0
1223-356 Wälder an der Bondenau 126 0,28 0,22
1224-321 Wald südlich Holzkoppel 22 0,11 0,48
1225-355 Fehrenholz 19 0 0
1315-391 Küsten- und Dünenlandschaften Amrums 1938 11,96 0,62
1316-301 Godelniederung / Föhr 148 14,98 10,12
1319-301 NSG Bordelumer Heide und Langenhorner Heide mit
Umgebung
201 7,99 3,97
1320-302 Lütjenholmer und Bargumer Heide 313 15,74 5,03
1320-303 Schirlbusch 14 0,06 0,44
1320-304 Löwenstedter Sandberge 21 0,34 1,61
1321-302 Pobüller Bauernwald 152 0 0
1321-303 Dünen am Rimmelsberg 17 0,49 2,89
1322-391 Treene Winderatter See bis Friedrichstadt
und Bollingstedter Au
2906 505,35 17,39
1322-392 Wald-, Moor- und Heidelandschaft der Fröruper Berge
und Umgebung
940 319,82 34,02
1323-301 NSG Hechtmoor 34 0,50 1,46
1323-355 Rehbergholz und Schwennholz 193 0 0
29
1324-391 Wellspanger-Loiter-Oxbek-System und angrenzende
Wälder
1434 215,07 15,00
1325-356 Drülter Holz 131 0,07 0,05
1326-301 NSG Schwansener See 75 11,77 15,70
1420-301 Standortübungsplatz Husum 150 0,01 0,00
1420-302 Moorweiher im Staatsforst Drelsdorf 6 0 0
1420-391 Quell- und Niedermoore der Arlauniederung 56 24,43 43,62
1421-301 Immenstedter Wald 155 2,78 1,79
1421-303 Wälder im Süderhackstedtfeld 76 0 0
1421-304 Ahrenviölfelder Westermoor 69 2,53 3,66
1422-301 Wald Rumbrand 60 0 0
1422-303 Gammellunder See 36 6,10 16,95
1423-302 Tiergarten 96 0 0
1423-393 Idstedtweger Geestlandschaft 98 37,77 38,54
1423-394 Schlei incl. Schleimünde und vorgelagerter
Flachgründe
1489 265,43 17,83
1424-357 Kiuser Gehege 38 0 0
1425-301 Karlsburger Holz 186 1,12 0,60
1425-330 Aassee und Umgebung 104 8,72 8,39
1521-391 Wälder der Ostenfelder Geest 733 12,75 1,74
1522-301 Kalkquellmoor bei Klein Rheide 19 15,21 80,07
1523-353 Karlshofer Moor 52 26,68 51,30
1523-381 Busdorfer Tal 31 14,51 46,81
1524-391 Großer Schnaaper See, Bültsee und anschließende
Flächen
253 31,92 12,62
1525-331 Hemmelmarker See 135 0,03 0,03
1526-352 Stohl 204 136,16 66,75
1526-353 Naturwald Stodthagen und angrenzende Hochmoore 321 48,23 15,02
1526-391 Südküste der Eckernförder Bucht und vorgelagerte
Flachgründe
296 26,57 8,98
1528-391 Küstenlandschaft Bottsand - Marzkamp u. vorgelagerte
Flachgründe
90 4,78 5,31
1532-321 Sundwiesen Fehmarn 35 4,89 13,97
1532-391 Küstenstreifen West- und Nordfehmarn 1453 187,82 12,93
1533-301 Staberhuk 41 3,53 8,61
1617-301 Dünen St. Peter 153 0 0
1620-302 Lundener Niederung 902 93,14 10,33
1621-301 Wälder bei Bergenhusen 145 2,99 2,06
1622-308 Gräben der nördlichen Alten Sorge 769 521,22 67,78
1622-391 Moore der Eider-Treene-Sorge-Niederung 3499 315,44 9,02
1623-303 Fockbeker Moor 375 121,26 32,34
1623-304 Wald östlich Hohn 11 0 0
1623-306 Owschlager See 44 5,12 11,64
1623-351 Übergangsmoor im Kropper Forst 18 0 0
1623-392 Binnendünen- und Moorlandschaft im Sorgetal 958 50,90 5,31
1624-391 Wälder der Hüttener Berge 416 0 0
1624-392 Wittensee und Flächen angrenzender Niederungen 1220 71,43 5,85
1625-301 Kluvensieker Holz 261 0,52 0,20
1626-325 Kiel Wik / Bunkeranlage 0 0 0
30
1626-352 Kalkquelle am Nord-Ostsee-Kanal in Kiel 9 0 0
1627-321 Hagener Au und Passader See 525 92,66 17,65
1627-322 Gorkwiese Kitzeberg 7 0,26 3,76
1627-391 Kalkreiche Niedermoorwiese am Ostufer des Dobers-
dorfer Sees
26 9,90 38,07
1628-302 Selenter See 2390 8,48 0,35
1629-320 Hohenfelder Mühlenau 155 50,04 32,29
1629-391 Strandseen der Hohwachter Bucht 1306 48,95 3,75
1631-304 Seegalendorfer Gehölz 13 0 0
1631-351 Seegalendorfer und Neuratjensdorfer Moor 68 22,59 33,22
1631-391 Putlos 1042 0 0
1631-392 Meeresgebiet der östlichen Kieler Bucht 19 0 0
1631-393 Küstenlandschaft Nordseite der Wagrischen Halbinsel 249 17,67 7,10
1632-392 Küstenlandschaft vor Großenbrode und vorgelagerte
Meeresbereiche
63 10,18 16,16
1714-391 Steingrund 0 0 0
1719-391 Untereider 2050 494,73 24,13
1720-301 Weißes Moor 69 14,01 20,30
1721-301 Wald bei Welmbüttel 105 0,42 0,40
1721-302 Wald bei Hollingstedt 30 0 0
1721-309 Kleiner Geestrücken südlich Dörpling 42 32,76 78,00
1722-301 Wald westlich Wrohm 26 0 0
1723-301 Gehege Osterhamm-Elsdorf 646 2,13 0,33
1723-302 Dachsberg bei Wittenmoor 48 23,37 48,69
1724-302 Wehrau und Mühlenau 246 97,11 39,48
1724-334 Dünen bei Kattbek 152 11,50 7,57
1725-304 Vollstedter See 160 20,33 12,71
1725-306 Staatsforst Langwedel-Sören 278 0 0
1725-352 Quellen am Großen Schierensee 23 1,37 5,96
1725-353 Niedermoor bei Manhagen 25 8,76 35,04
1725-392 Gebiet der Oberen Eider incl. Seen 2502 148,21 5,92
1726-301 Wald nordwestlich Boksee 25 0 0
1727-305 Klosterforst Preetz 40 0 0
1727-322 Untere Schwentine 451 38,41 8,52
1727-351 Kolksee bei Schellhorn 6 0,35 5,83
1727-354 Moorweiher bei Rastorf 55 3,99 7,26
1727-392 Lanker See und Kührener Teich 679 76,44 11,26
1728-303 Lehmkuhlener Stauung 29 18,81 64,87
1728-304 NSG Rixdorfer Teiche und Umgebung 115 12,36 10,75
1728-305 NSG Vogelfreistätte Lebrader Teich 144 0 0
1728-307 Gottesgabe 686 136,65 19,92
1728-351 Kalkflachmoor bei Mucheln 11 1,88 17,10
1729-353 Großer und Kleiner Benzer See 48 12,17 25,35
1729-391 Dannauer See und Hohensasel und Umgebung 341 20,02 5,87
1729-392 Kossautal und angrenzende Flächen 213 16,08 7,55
1730-301 Steinbek 150 37,91 25,27
1730-326 Tal der Kükelühner Mühlenau 173 62,27 36,00
1731-303 Wälder um Güldenstein 112 0,02 0,02
31
1732-321 Guttauer Gehege 583 0 0
1732-381 Rosenfelder Brök nördlich Dahme 45 0 0
1733-301 Sagas-Bank 0 0 0
1813-391 Helgoland mit Helgoländer Felssockel 48 0 0
1820-302 NSG Fieler Moor 258 0,72 0,28
1820-303 Ehemaliger Fuhlensee 86 2,05 2,38
1821-304 Gieselautal 94 18,61 19,80
1821-391 Riesewohld und angrenzende Flächen 435 6,72 1,54
1823-301 Wälder der nördlichen Itzehoer Geest 711 6,16 0,87
1823-304 Haaler Au 432 248,27 57,47
1825-302 Wennebeker Moor und Langwedel 230 6,23 2,71
1826-301 NSG Dosenmoor 546 17,29 3,17
1826-302 Wald am Bordesholmer See 35 0 0
1828-302 Grebiner See, Schluensee und Schmarkau 241 15,04 6,24
1828-392 Seen des mittleren Schwentinesystems und Umgebung 6648 255,79 3,85
1829-303 Wald nördlich Malente 66 0,98 1,49
1829-304 Buchenwälder Dodau 402 0 0
1829-391 Röbeler Holz und Umgebung 333 42,32 12,71
1830-301 NSG Neustädter Binnenwasser 277 45,28 16,35
1830-302 Lachsau 159 11,32 7,12
1830-391 Gebiet der Oberen Schwentine 420 105,65 25,15
1831-302 Buchenwälder südlich Cismar 69 0 0
1831-321 Kremper Au 191 73,29 38,37
1832-322 Walkyriengrund 0 0 0
1832-329 Ostseeküste zwischen Grömitz und Kellenhusen 162 7,62 4,70
1920-301 Windberger Niederung 363 23,83 6,56
1922-301 Wälder östlich Mehlbek 60 0,26 0,43
1922-391 Iselbek mit Lindhorster Teich 117 57,50 49,14
1923-301 Schierenwald 588 0,21 0,04
1923-302 Reher Kratt 92 8,16 8,87
1923-304 Moore bei Christinenthal 37 0 0
1923-305 Quellhangmoor Lohfiert 9 0,24 2,70
1924-391 Wälder im Aukrug 879 36,87 4,19
1926-301 Bönnebütteler Gehege 59 1,71 2,90
1927-301 Kiebitzholmer Moor und Trentmoor 535 242,06 45,25
1927-352 Tarbeker Moor 131 15,84 12,09
1928-351 Wälder am Stocksee 109 0 0
1928-359 Wälder zwischen Schlamersdorf und Garbek 111 0 0
1929-320 Barkauer See 472 110,99 23,52
1929-351 Heidmoorniederung 338 145,14 42,94
1929-391 Wälder im Ahrensböker Endmoränengebiet 624 1,35 0,22
1930-301 Middelburger Seen 124 36,00 29,03
1930-302 Wälder im Pönitzer Seengebiet 210 0,76 0,36
1930-330 Strandniederungen südlich Neustadt 34 8,55 25,16
1930-353 Pönitzer Seengebiet 162 13,03 8,04
1930-391 Süseler Baum und Süseler Moor 80 38,98 48,72
1931-301 Ostseeküste am Brodtener Ufer 17 0 0
1931-391 Küstenlandschaft zwischen Pelzerhaken und Rettin 100 2,15 2,15
32
2020-301 Klev- und Donnlandschaft bei St. Michaelisdonn 222 31,83 14,34
2021-301 Kudensee 104 0,18 0,18
2022-302 Vaaler Moor und Herrenmoor 964 248,08 25,73
2023-303 Rantzau-Tal 215 84,14 39,14
2024-301 Heiden und Dünen bei Störkathen 59 0 0
2024-308 Mühlenbarbeker Au und angrenzendes Quellhangmoor 58 7,23 12,47
2024-391 Mittlere Stör, Bramau und Bünzau 211 43,19 20,47
2024-392 Moore der Breitenburger Niederung 514 130,11 25,31
2025-303 Hasenmoor 275 12,64 4,60
2026-303 Osterautal 320 63,39 19,81
2026-304 Barker Heide 186 17,50 9,41
2026-305 Altwaldbestände im Segeberger Forst 154 0,93 0,60
2026-307 Moorweiher im Segeberger Forst 42 0,30 0,71
2027-301 NSG Ihlsee und Ihlwald 42 0 0
2027-302 Segeberger Kalkberghöhlen 3 0 0
2028-352 Wald bei Söhren 29 0,67 2,31
2028-359 Wald nördlich Steinbek 26 0 0
2029-351 Bachschlucht Rösing 28 2,91 10,40
2029-353 Wulfsfelder Moor 6 0 0
2030-303 NSG Aalbeek-Niederung 310 10,62 3,42
2030-304 Hobbersdorfer Gehege und Brammersöhlen 167 0 0
2030-328 Schwartautal und Curauer Moor 764 275,96 36,12
2030-351 Waldhusener Moore und Moorsee 41 4,75 11,58
2030-392 Traveförde und angrenzende Flächen 1123 10,83 0,96
2031-303 NSG Dummersdorfer Ufer 250 77,28 30,91
2123-301 Binnendünen Nordoe 390 0 0
2124-301 Klein Offenseth-Bokelsesser Moor 473 224,10 47,38
2125-334 Kaltenkirchener Heide 511 1,40 0,27
2126-303 Pfeifengraswiese nördlich Seth 8 0 0
2126-391 Wälder im Kisdorfer Wohld und angrenzende Flächen 472 60,58 12,83
2127-302 Birkenmoor bei Groß Niendorf 32 2,57 8,02
2127-333 Leezener Au-Niederung und Hangwälder 311 22,53 7,25
2127-391 Travetal 1289 152,44 11,83
2128-358 Steinkampholz 54 0,19 0,36
2129-351 Bachschlucht bei Herweg 3 0 0
2129-353 Wüstenei 227 3,24 1,43
2129-357 Friedhofseiche Genin 1 0 0
2130-301 Lauerholz 339 0 0
2130-322 Herrnburger Dünen 88 0 0
2130-352 Moorwälder am Wesloer Moor und am Herrnburger
Landgraben
91 3,02 3,31
2130-391 Grönauer Heide, Grönauer Moor und Blankensee 345 49,90 14,46
2222-321 Wetternsystem in der Kollmarer Marsch 26 0 0
2224-305 Staatsforst Rantzau östlich Tornesch 113 0 0
2224-306 Obere Krückau 74 11,34 15,33
2224-391 Himmelmoor, Kummerfelder Gehege und angrenzende
Flächen
766 96,38 12,58
2225-303 Pinnau / Gronau 57 2,07 3,62
33
2226-306 Glasmoor 140 39,66 28,33
2226-391 Alstersystem bis Itzstedter See und Nienwohlder Moor 1165 150,89 12,95
2227-303 Hansdorfer Brook mit Ammersbek 292 77,22 26,44
2227-304 Neuenteich und Binnenhorster Teiche 36 2,17 6,01
2227-351 Nördlich Tiergarten 51 0 0
2227-352 Rehbrook 49 0 0
2227-356 Sülfelder Tannen 9 0 0
2228-352 Rehkoppel 97 0 0
2230-304 Wälder westlich des Ratzeburger Sees 336 0,88 0,26
2230-381 Trockenflächen nordwestlich Groß Sarau 23 9,69 42,11
2230-391 Wälder und Seeufer östlich des Ratzeburger Sees 756 41,87 5,54
2323-392 Schleswig-Holsteinisches Elbästuar und angrenzende
Flächen
5410 1800,07 33,27
2324-303 Holmer Sandberge und Buttermoor 231 14,25 6,17
2324-304 NSG Tävsmoor / Haselauer Moor 155 6,36 4,10
2325-301 Ohmoor 51 0,06 0,11
2326-301 Wittmoor 139 3,82 2,75
2327-301 Kammolchgebiet Höltigbaum / Stellmoor 605 17,64 2,92
2327-351 Sieker Moor 15 0 0
2328-354 NSG Hahnheide 1351 10,41 0,77
2328-355 Großensee, Mönchsteich, Stenzer Teich 177 0,68 0,38
2328-381 NSG Kranika 96 3,29 3,43
2328-391 Trittauer Mühlenbach und Drahtmühlengebiet 120 13,45 11,21
2329-301 Lankauer See 105 0,71 0,68
2329-351 Koberger Moor 100 3,61 3,61
2329-352 Pantener Moorweiher und Umgebung 89 19,52 21,93
2329-353 Quellwald am Ankerschen See 65 9,03 13,90
2329-381 NSG Borstgrasrasen Alt Mölln 12 0 0
2329-391 Wälder des Hevenbruch und des Koberger Forstes 924 1,01 0,11
2330-351 Moorwald im Ankerschen Ziegelbruch 18 0 0
2330-353 NSG Oldenburger See und Umgebung 123 0,72 0,59
2330-391 Salemer Moor und angrenzende Wälder und Seen 679 50,77 7,48
2331-393 Amphibiengebiete westlich Kittlitz 665 74,18 11,15
2331-394 Schaalsee mit angrenzenden Wäldern und Seen 2193 53,39 2,43
2427-302 Talwald Hahnenkoppel 33 0 0
2427-391 Bille 217 16,33 7,53
2428-393 Wälder im Sachsenwald und Schwarze Au 1534 10,64 0,69
2429-301 Birkenbruch südlich Groß Pampau 11 0,05 0,48
2429-304 Kiefholz 149 0 0
2429-353 Kleinstmoore bei Hornbek 20 0,42 2,12
2430-302 Rosengartener Moor 16 0 0
2430-353 Langenlehstener Heide 21 0 0
2430-391 Seenkette Drüsensee bis Gudower See mit angren-
zenden Wäldern u.a.
459 19,17 4,18
2430-392 Talhänge bei Göttin, Grambeker Teiche und Umgebung 341 0,60 0,18
2431-391 Amphibiengebiet Seedorfer Forst 213 81,35 38,19
2431-392 Hakendorfer Wälder 85 9,38 11,03
2527-302 NSG Dalbekschlucht 74 0,75 1,02
34
2527-391 Besenhorster Sandberge und Elbinsel 250 10,51 4,21
2528-301 GKSS-Forschungszentrum Geesthacht 0 0 0
2529-301 Nüssauer Heide 88 0 0
2529-302 Stecknitz-Delvenau 63 27,21 43,19
2529-306 Gülzower Holz 448 0,04 0,01
2628-392 Elbe mit Hohem Elbufer von Tesperhude bis Lauenburg
mit angr. Fl.
734 10,43 1,42
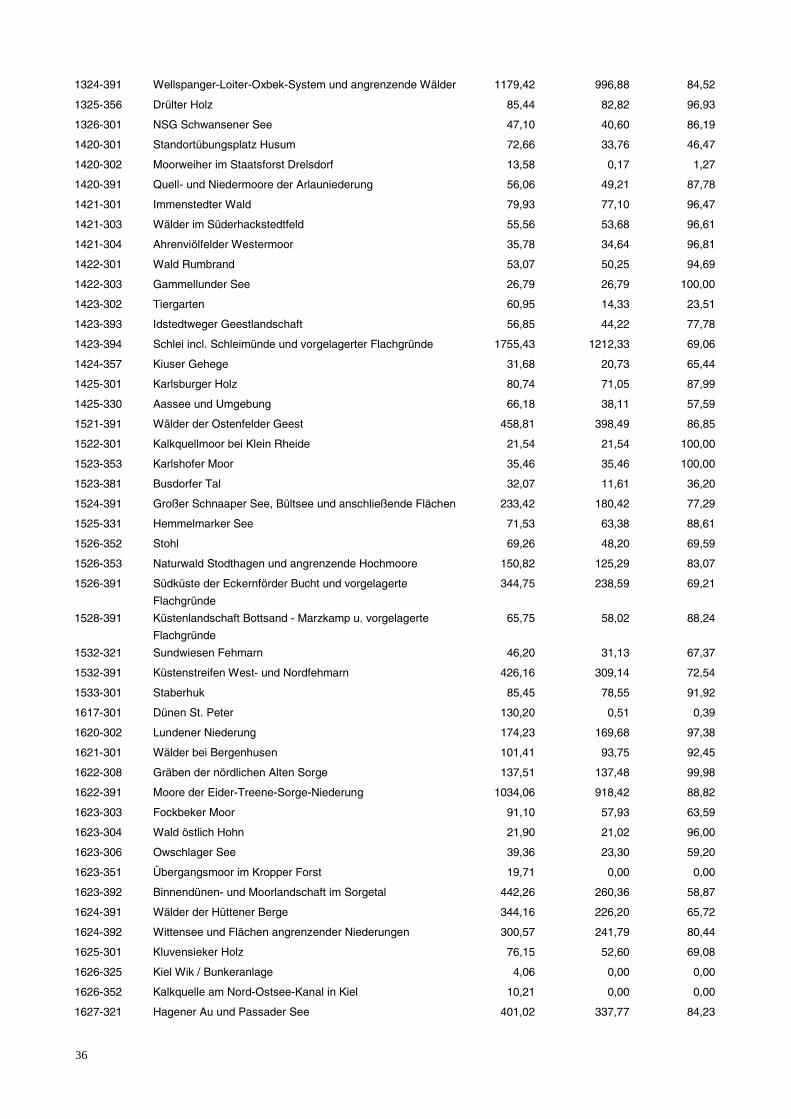
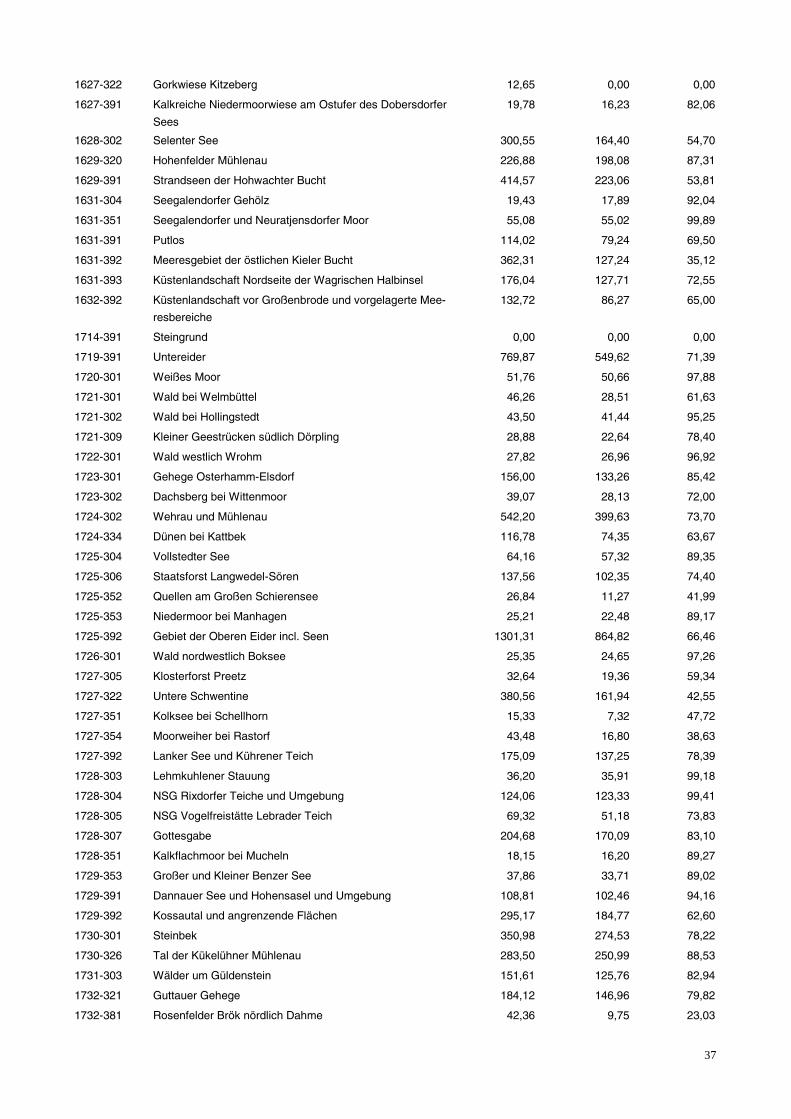
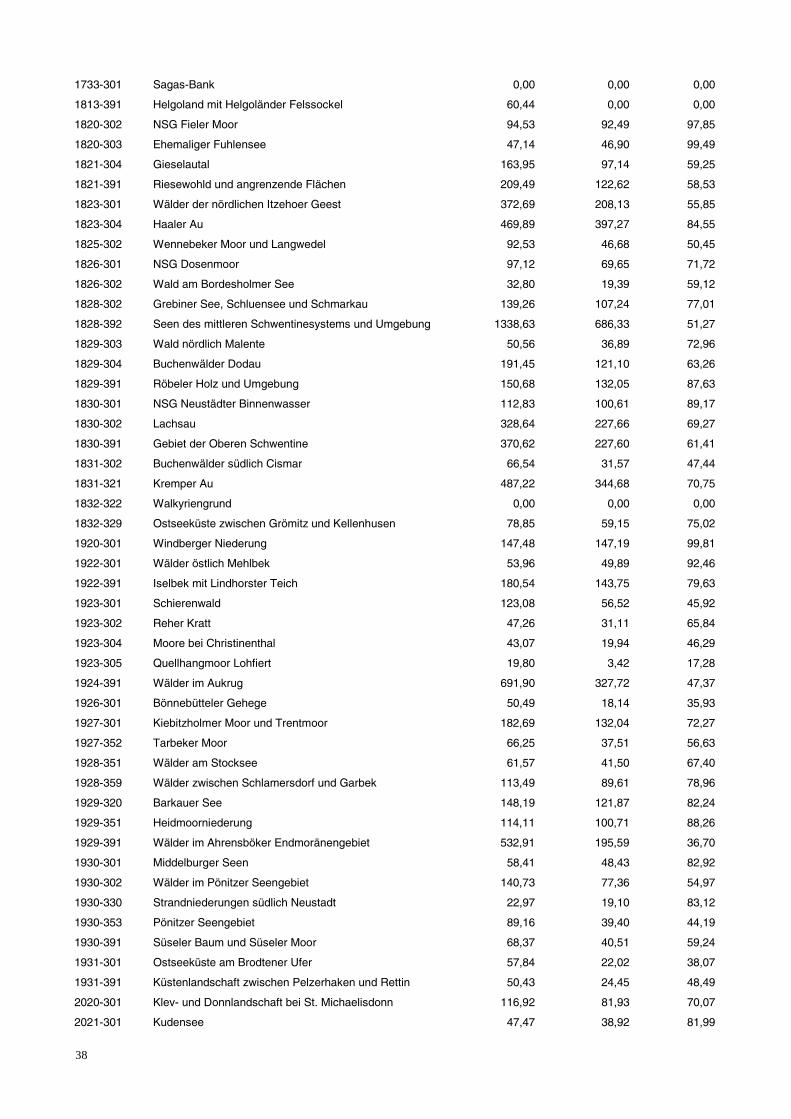
35
Appendix 5
Natura 2000 sites in Schleswig-Holstein and the area of agricultural land usage within the buffer zone of 100 m around the re-
spective sites.
Site No. Designated Site Land area
in 100m-
buffer, ha
Agricultural
land area in
100m buffer, ha
Percentage of
agricultural
land area
0916-391 NTP S-H Wattenmeer und angrenzende Küstengebiete 6850,52 2041,04 29,79
0916-392 Dünen- und Heidelandschaften Nord-Sylt 384,41 0,00 0,00
1016-392 Dünen- und Heidelandschaften Nord- und Mittel-Sylt 390,66 92,42 23,66
1115-301 NSG Rantumbecken 100,32 30,00 29,90
1115-391 Dünenlandschaft Süd-Sylt 315,77 0,00 0,00
1116-391 Küstenlandschaft Ost-Sylt 206,97 41,33 19,97
1118-301 Ruttebüller See 95,37 44,56 46,72
1119-303 Süderlügumer Binnendünen 297,18 187,33 63,04
1121-304 Eichenwälder der Böxlunder Geest 76,17 40,85 53,64
1121-391 NSG Fröslev-Jardelunder Moor 68,64 43,29 63,07
1122-391 Niehuuser Tunneltal und Krusau mit angrenzenden Flächen 148,84 73,42 49,33
1123-305 Munkbrarupau- und Schwennautal 125,01 69,46 55,57
1123-392 Blixmoor 33,52 19,48 58,11
1123-393 Küstenbereiche Flensburger Förde von Flensburg bis Geltin-
ger Birk
1221,99 690,65 56,52
1219-301 Leckfeld 46,52 26,67 57,32
1219-391 Gewässer des Bongsieler Kanal-Systems 1277,85 1087,24 85,08
1219-392 Heide- und Magerrasenlandschaft am Ochsenweg und im
Soholmfeld
217,87 71,95 33,02
1220-301 Wälder an der Lecker Au 76,04 74,47 97,95
1222-301 Stiftungsflächen Schäferhaus 54,12 25,38 46,89
1222-353 Staatsforst südöstlich Handewitt 19,60 4,90 24,98
1223-356 Wälder an der Bondenau 129,85 126,17 97,16
1224-321 Wald südlich Holzkoppel 23,90 21,77 91,08
1225-355 Fehrenholz 23,12 21,13 91,38
1315-391 Küsten- und Dünenlandschaften Amrums 512,70 74,58 14,55
1316-301 Godelniederung / Föhr 93,07 55,66 59,80
1319-301 NSG Bordelumer Heide und Langenhorner Heide mit Umge-
bung
111,03 55,66 50,13
1320-302 Lütjenholmer und Bargumer Heide 159,69 124,17 77,76
1320-303 Schirlbusch 22,18 21,64 97,60
1320-304 Löwenstedter Sandberge 34,68 30,41 87,69
1321-302 Pobüller Bauernwald 83,57 79,49 95,12
1321-303 Dünen am Rimmelsberg 30,55 26,13 85,54
1322-391 Treene Winderatter See bis Friedrichstadt und Bol-
lingstedter Au
2060,54 1637,14 79,45
1322-392 Wald-, Moor- und Heidelandschaft der Fröruper Berge und
Umgebung
227,10 185,46 81,66
1323-301 NSG Hechtmoor 32,12 30,45 94,80
1323-355 Rehbergholz und Schwennholz 80,75 75,37 93,34
36
1324-391 Wellspanger-Loiter-Oxbek-System und angrenzende Wälder 1179,42 996,88 84,52
1325-356 Drülter Holz 85,44 82,82 96,93
1326-301 NSG Schwansener See 47,10 40,60 86,19
1420-301 Standortübungsplatz Husum 72,66 33,76 46,47
1420-302 Moorweiher im Staatsforst Drelsdorf 13,58 0,17 1,27
1420-391 Quell- und Niedermoore der Arlauniederung 56,06 49,21 87,78
1421-301 Immenstedter Wald 79,93 77,10 96,47
1421-303 Wälder im Süderhackstedtfeld 55,56 53,68 96,61
1421-304 Ahrenviölfelder Westermoor 35,78 34,64 96,81
1422-301 Wald Rumbrand 53,07 50,25 94,69
1422-303 Gammellunder See 26,79 26,79 100,00
1423-302 Tiergarten 60,95 14,33 23,51
1423-393 Idstedtweger Geestlandschaft 56,85 44,22 77,78
1423-394 Schlei incl. Schleimünde und vorgelagerter Flachgründe 1755,43 1212,33 69,06
1424-357 Kiuser Gehege 31,68 20,73 65,44
1425-301 Karlsburger Holz 80,74 71,05 87,99
1425-330 Aassee und Umgebung 66,18 38,11 57,59
1521-391 Wälder der Ostenfelder Geest 458,81 398,49 86,85
1522-301 Kalkquellmoor bei Klein Rheide 21,54 21,54 100,00
1523-353 Karlshofer Moor 35,46 35,46 100,00
1523-381 Busdorfer Tal 32,07 11,61 36,20
1524-391 Großer Schnaaper See, Bültsee und anschließende Flächen 233,42 180,42 77,29
1525-331 Hemmelmarker See 71,53 63,38 88,61
1526-352 Stohl 69,26 48,20 69,59
1526-353 Naturwald Stodthagen und angrenzende Hochmoore 150,82 125,29 83,07
1526-391 Südküste der Eckernförder Bucht und vorgelagerte
Flachgründe
344,75 238,59 69,21
1528-391 Küstenlandschaft Bottsand - Marzkamp u. vorgelagerte
Flachgründe
65,75 58,02 88,24
1532-321 Sundwiesen Fehmarn 46,20 31,13 67,37
1532-391 Küstenstreifen West- und Nordfehmarn 426,16 309,14 72,54
1533-301 Staberhuk 85,45 78,55 91,92
1617-301 Dünen St. Peter 130,20 0,51 0,39
1620-302 Lundener Niederung 174,23 169,68 97,38
1621-301 Wälder bei Bergenhusen 101,41 93,75 92,45
1622-308 Gräben der nördlichen Alten Sorge 137,51 137,48 99,98
1622-391 Moore der Eider-Treene-Sorge-Niederung 1034,06 918,42 88,82
1623-303 Fockbeker Moor 91,10 57,93 63,59
1623-304 Wald östlich Hohn 21,90 21,02 96,00
1623-306 Owschlager See 39,36 23,30 59,20
1623-351 Übergangsmoor im Kropper Forst 19,71 0,00 0,00
1623-392 Binnendünen- und Moorlandschaft im Sorgetal 442,26 260,36 58,87
1624-391 Wälder der Hüttener Berge 344,16 226,20 65,72
1624-392 Wittensee und Flächen angrenzender Niederungen 300,57 241,79 80,44
1625-301 Kluvensieker Holz 76,15 52,60 69,08
1626-325 Kiel Wik / Bunkeranlage 4,06 0,00 0,00
1626-352 Kalkquelle am Nord-Ostsee-Kanal in Kiel 10,21 0,00 0,00
1627-321 Hagener Au und Passader See 401,02 337,77 84,23
37
1627-322 Gorkwiese Kitzeberg 12,65 0,00 0,00
1627-391 Kalkreiche Niedermoorwiese am Ostufer des Dobersdorfer
Sees
19,78 16,23 82,06
1628-302 Selenter See 300,55 164,40 54,70
1629-320 Hohenfelder Mühlenau 226,88 198,08 87,31
1629-391 Strandseen der Hohwachter Bucht 414,57 223,06 53,81
1631-304 Seegalendorfer Gehölz 19,43 17,89 92,04
1631-351 Seegalendorfer und Neuratjensdorfer Moor 55,08 55,02 99,89
1631-391 Putlos 114,02 79,24 69,50
1631-392 Meeresgebiet der östlichen Kieler Bucht 362,31 127,24 35,12
1631-393 Küstenlandschaft Nordseite der Wagrischen Halbinsel 176,04 127,71 72,55
1632-392 Küstenlandschaft vor Großenbrode und vorgelagerte Mee-
resbereiche
132,72 86,27 65,00
1714-391 Steingrund 0,00 0,00 0,00
1719-391 Untereider 769,87 549,62 71,39
1720-301 Weißes Moor 51,76 50,66 97,88
1721-301 Wald bei Welmbüttel 46,26 28,51 61,63
1721-302 Wald bei Hollingstedt 43,50 41,44 95,25
1721-309 Kleiner Geestrücken südlich Dörpling 28,88 22,64 78,40
1722-301 Wald westlich Wrohm 27,82 26,96 96,92
1723-301 Gehege Osterhamm-Elsdorf 156,00 133,26 85,42
1723-302 Dachsberg bei Wittenmoor 39,07 28,13 72,00
1724-302 Wehrau und Mühlenau 542,20 399,63 73,70
1724-334 Dünen bei Kattbek 116,78 74,35 63,67
1725-304 Vollstedter See 64,16 57,32 89,35
1725-306 Staatsforst Langwedel-Sören 137,56 102,35 74,40
1725-352 Quellen am Großen Schierensee 26,84 11,27 41,99
1725-353 Niedermoor bei Manhagen 25,21 22,48 89,17
1725-392 Gebiet der Oberen Eider incl. Seen 1301,31 864,82 66,46
1726-301 Wald nordwestlich Boksee 25,35 24,65 97,26
1727-305 Klosterforst Preetz 32,64 19,36 59,34
1727-322 Untere Schwentine 380,56 161,94 42,55
1727-351 Kolksee bei Schellhorn 15,33 7,32 47,72
1727-354 Moorweiher bei Rastorf 43,48 16,80 38,63
1727-392 Lanker See und Kührener Teich 175,09 137,25 78,39
1728-303 Lehmkuhlener Stauung 36,20 35,91 99,18
1728-304 NSG Rixdorfer Teiche und Umgebung 124,06 123,33 99,41
1728-305 NSG Vogelfreistätte Lebrader Teich 69,32 51,18 73,83
1728-307 Gottesgabe 204,68 170,09 83,10
1728-351 Kalkflachmoor bei Mucheln 18,15 16,20 89,27
1729-353 Großer und Kleiner Benzer See 37,86 33,71 89,02
1729-391 Dannauer See und Hohensasel und Umgebung 108,81 102,46 94,16
1729-392 Kossautal und angrenzende Flächen 295,17 184,77 62,60
1730-301 Steinbek 350,98 274,53 78,22
1730-326 Tal der Kükelühner Mühlenau 283,50 250,99 88,53
1731-303 Wälder um Güldenstein 151,61 125,76 82,94
1732-321 Guttauer Gehege 184,12 146,96 79,82
1732-381 Rosenfelder Brök nördlich Dahme 42,36 9,75 23,03
38
1733-301 Sagas-Bank 0,00 0,00 0,00
1813-391 Helgoland mit Helgoländer Felssockel 60,44 0,00 0,00
1820-302 NSG Fieler Moor 94,53 92,49 97,85
1820-303 Ehemaliger Fuhlensee 47,14 46,90 99,49
1821-304 Gieselautal 163,95 97,14 59,25
1821-391 Riesewohld und angrenzende Flächen 209,49 122,62 58,53
1823-301 Wälder der nördlichen Itzehoer Geest 372,69 208,13 55,85
1823-304 Haaler Au 469,89 397,27 84,55
1825-302 Wennebeker Moor und Langwedel 92,53 46,68 50,45
1826-301 NSG Dosenmoor 97,12 69,65 71,72
1826-302 Wald am Bordesholmer See 32,80 19,39 59,12
1828-302 Grebiner See, Schluensee und Schmarkau 139,26 107,24 77,01
1828-392 Seen des mittleren Schwentinesystems und Umgebung 1338,63 686,33 51,27
1829-303 Wald nördlich Malente 50,56 36,89 72,96
1829-304 Buchenwälder Dodau 191,45 121,10 63,26
1829-391 Röbeler Holz und Umgebung 150,68 132,05 87,63
1830-301 NSG Neustädter Binnenwasser 112,83 100,61 89,17
1830-302 Lachsau 328,64 227,66 69,27
1830-391 Gebiet der Oberen Schwentine 370,62 227,60 61,41
1831-302 Buchenwälder südlich Cismar 66,54 31,57 47,44
1831-321 Kremper Au 487,22 344,68 70,75
1832-322 Walkyriengrund 0,00 0,00 0,00
1832-329 Ostseeküste zwischen Grömitz und Kellenhusen 78,85 59,15 75,02
1920-301 Windberger Niederung 147,48 147,19 99,81
1922-301 Wälder östlich Mehlbek 53,96 49,89 92,46
1922-391 Iselbek mit Lindhorster Teich 180,54 143,75 79,63
1923-301 Schierenwald 123,08 56,52 45,92
1923-302 Reher Kratt 47,26 31,11 65,84
1923-304 Moore bei Christinenthal 43,07 19,94 46,29
1923-305 Quellhangmoor Lohfiert 19,80 3,42 17,28
1924-391 Wälder im Aukrug 691,90 327,72 47,37
1926-301 Bönnebütteler Gehege 50,49 18,14 35,93
1927-301 Kiebitzholmer Moor und Trentmoor 182,69 132,04 72,27
1927-352 Tarbeker Moor 66,25 37,51 56,63
1928-351 Wälder am Stocksee 61,57 41,50 67,40
1928-359 Wälder zwischen Schlamersdorf und Garbek 113,49 89,61 78,96
1929-320 Barkauer See 148,19 121,87 82,24
1929-351 Heidmoorniederung 114,11 100,71 88,26
1929-391 Wälder im Ahrensböker Endmoränengebiet 532,91 195,59 36,70
1930-301 Middelburger Seen 58,41 48,43 82,92
1930-302 Wälder im Pönitzer Seengebiet 140,73 77,36 54,97
1930-330 Strandniederungen südlich Neustadt 22,97 19,10 83,12
1930-353 Pönitzer Seengebiet 89,16 39,40 44,19
1930-391 Süseler Baum und Süseler Moor 68,37 40,51 59,24
1931-301 Ostseeküste am Brodtener Ufer 57,84 22,02 38,07
1931-391 Küstenlandschaft zwischen Pelzerhaken und Rettin 50,43 24,45 48,49
2020-301 Klev- und Donnlandschaft bei St. Michaelisdonn 116,92 81,93 70,07
2021-301 Kudensee 47,47 38,92 81,99
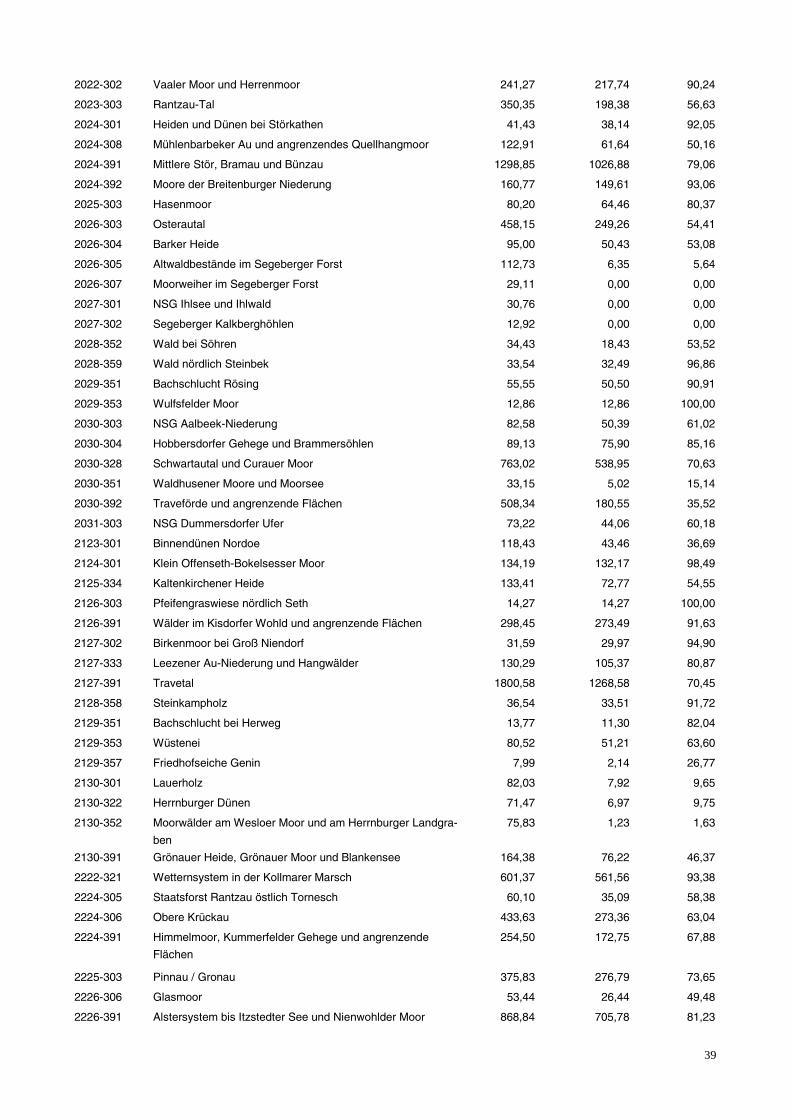
39
2022-302 Vaaler Moor und Herrenmoor 241,27 217,74 90,24
2023-303 Rantzau-Tal 350,35 198,38 56,63
2024-301 Heiden und Dünen bei Störkathen 41,43 38,14 92,05
2024-308 Mühlenbarbeker Au und angrenzendes Quellhangmoor 122,91 61,64 50,16
2024-391 Mittlere Stör, Bramau und Bünzau 1298,85 1026,88 79,06
2024-392 Moore der Breitenburger Niederung 160,77 149,61 93,06
2025-303 Hasenmoor 80,20 64,46 80,37
2026-303 Osterautal 458,15 249,26 54,41
2026-304 Barker Heide 95,00 50,43 53,08
2026-305 Altwaldbestände im Segeberger Forst 112,73 6,35 5,64
2026-307 Moorweiher im Segeberger Forst 29,11 0,00 0,00
2027-301 NSG Ihlsee und Ihlwald 30,76 0,00 0,00
2027-302 Segeberger Kalkberghöhlen 12,92 0,00 0,00
2028-352 Wald bei Söhren 34,43 18,43 53,52
2028-359 Wald nördlich Steinbek 33,54 32,49 96,86
2029-351 Bachschlucht Rösing 55,55 50,50 90,91
2029-353 Wulfsfelder Moor 12,86 12,86 100,00
2030-303 NSG Aalbeek-Niederung 82,58 50,39 61,02
2030-304 Hobbersdorfer Gehege und Brammersöhlen 89,13 75,90 85,16
2030-328 Schwartautal und Curauer Moor 763,02 538,95 70,63
2030-351 Waldhusener Moore und Moorsee 33,15 5,02 15,14
2030-392 Traveförde und angrenzende Flächen 508,34 180,55 35,52
2031-303 NSG Dummersdorfer Ufer 73,22 44,06 60,18
2123-301 Binnendünen Nordoe 118,43 43,46 36,69
2124-301 Klein Offenseth-Bokelsesser Moor 134,19 132,17 98,49
2125-334 Kaltenkirchener Heide 133,41 72,77 54,55
2126-303 Pfeifengraswiese nördlich Seth 14,27 14,27 100,00
2126-391 Wälder im Kisdorfer Wohld und angrenzende Flächen 298,45 273,49 91,63
2127-302 Birkenmoor bei Groß Niendorf 31,59 29,97 94,90
2127-333 Leezener Au-Niederung und Hangwälder 130,29 105,37 80,87
2127-391 Travetal 1800,58 1268,58 70,45
2128-358 Steinkampholz 36,54 33,51 91,72
2129-351 Bachschlucht bei Herweg 13,77 11,30 82,04
2129-353 Wüstenei 80,52 51,21 63,60
2129-357 Friedhofseiche Genin 7,99 2,14 26,77
2130-301 Lauerholz 82,03 7,92 9,65
2130-322 Herrnburger Dünen 71,47 6,97 9,75
2130-352 Moorwälder am Wesloer Moor und am Herrnburger Landgra-
ben
75,83 1,23 1,63
2130-391 Grönauer Heide, Grönauer Moor und Blankensee 164,38 76,22 46,37
2222-321 Wetternsystem in der Kollmarer Marsch 601,37 561,56 93,38
2224-305 Staatsforst Rantzau östlich Tornesch 60,10 35,09 58,38
2224-306 Obere Krückau 433,63 273,36 63,04
2224-391 Himmelmoor, Kummerfelder Gehege und angrenzende
Flächen
254,50 172,75 67,88
2225-303 Pinnau / Gronau 375,83 276,79 73,65
2226-306 Glasmoor 53,44 26,44 49,48
2226-391 Alstersystem bis Itzstedter See und Nienwohlder Moor 868,84 705,78 81,23
40
2227-303 Hansdorfer Brook mit Ammersbek 120,54 81,27 67,42
2227-304 Neuenteich und Binnenhorster Teiche 54,05 50,67 93,75
2227-351 Nördlich Tiergarten 45,13 18,55 41,10
2227-352 Rehbrook 40,33 20,20 50,09
2227-356 Sülfelder Tannen 15,41 10,39 67,44
2228-352 Rehkoppel 60,53 53,13 87,77
2230-304 Wälder westlich des Ratzeburger Sees 330,52 256,34 77,55
2230-381 Trockenflächen nordwestlich Groß Sarau 25,69 22,65 88,18
2230-391 Wälder und Seeufer östlich des Ratzeburger Sees 370,60 284,83 76,86
2323-392 Schleswig-Holsteinisches Elbästuar und angrenzende
Flächen
2536,52 2118,94 83,54
2324-303 Holmer Sandberge und Buttermoor 128,41 102,40 79,74
2324-304 NSG Tävsmoor / Haselauer Moor 76,09 51,88 68,18
2325-301 Ohmoor 56,98 19,30 33,88
2326-301 Wittmoor 85,19 70,41 82,65
2327-301 Kammolchgebiet Höltigbaum / Stellmoor 240,69 123,94 51,49
2327-351 Sieker Moor 23,24 21,64 93,09
2328-354 NSG Hahnheide 233,39 155,93 66,81
2328-355 Großensee, Mönchsteich, Stenzer Teich 156,89 48,90 31,17
2328-381 NSG Kranika 51,16 12,87 25,16
2328-391 Trittauer Mühlenbach und Drahtmühlengebiet 226,73 116,90 51,56
2329-301 Lankauer See 63,02 30,41 48,25
2329-351 Koberger Moor 42,00 31,51 75,02
2329-352 Pantener Moorweiher und Umgebung 44,58 35,81 80,34
2329-353 Quellwald am Ankerschen See 45,82 37,39 81,60
2329-381 NSG Borstgrasrasen Alt Mölln 22,17 6,89 31,09
2329-391 Wälder des Hevenbruch und des Koberger Forstes 326,09 200,46 61,47
2330-351 Moorwald im Ankerschen Ziegelbruch 26,27 7,86 29,93
2330-353 NSG Oldenburger See und Umgebung 52,30 42,76 81,76
2330-391 Salemer Moor und angrenzende Wälder und Seen 165,85 113,45 68,41
2331-393 Amphibiengebiete westlich Kittlitz 358,66 280,43 78,19
2331-394 Schaalsee mit angrenzenden Wäldern und Seen 570,70 342,08 59,94
2427-302 Talwald Hahnenkoppel 37,79 12,85 34,00
2427-391 Bille 684,75 305,95 44,68
2428-393 Wälder im Sachsenwald und Schwarze Au 729,34 113,63 15,58
2429-301 Birkenbruch südlich Groß Pampau 21,44 20,14 93,90
2429-304 Kiefholz 60,52 42,74 70,63
2429-353 Kleinstmoore bei Hornbek 66,12 58,84 88,99
2430-302 Rosengartener Moor 19,00 1,98 10,44
2430-353 Langenlehstener Heide 21,44 3,00 13,98
2430-391 Seenkette Drüsensee bis Gudower See mit angrenzenden
Wäldern u.a.
328,84 54,76 16,65
2430-392 Talhänge bei Göttin, Grambeker Teiche und Umgebung 156,41 47,42 30,32
2431-391 Amphibiengebiet Seedorfer Forst 101,81 92,33 90,69
2431-392 Hakendorfer Wälder 73,44 72,57 98,82
2527-302 NSG Dalbekschlucht 78,39 54,74 69,83
2527-391 Besenhorster Sandberge und Elbinsel 67,47 19,04 28,22
2528-301 GKSS-Forschungszentrum Geesthacht 5,01 0,00 0,00
41
2529-301 Nüssauer Heide 47,63 19,58 41,10
2529-302 Stecknitz-Delvenau 349,19 346,05 99,10
2529-306 Gülzower Holz 277,05 78,74 28,42
2628-392 Elbe mit Hohem Elbufer von Tesperhude bis Lauenburg mit
angr. Fl.
215,03 66,90 31,11
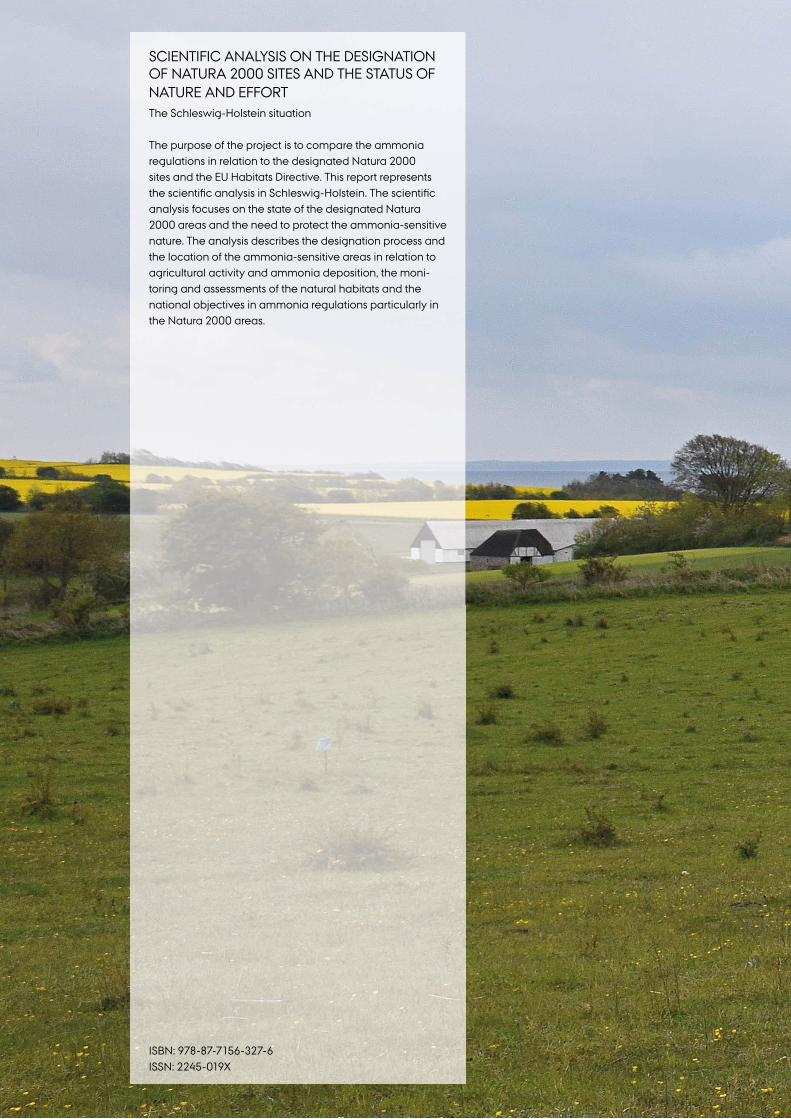
SCIENTIFIC ANALYSIS ON THE DESIGNATION OF NATURA 2000 SITES AND THE STATUS OF NATURE AND EFFORTThe Schleswig-Holstein situation
The purpose of the project is to compare the ammonia regulations in relation to the designated Natura 2000 sites and the EU Habitats Directive. This report represents the scientifi c analysis in Schleswig-Holstein. The scientifi c analysis focuses on the state of the designated Natura 2000 areas and the need to protect the ammonia-sensitive nature. The analysis describes the designation process and the location of the ammonia-sensitive areas in relation to agricultural activity and ammonia deposition, the moni-toring and assessments of the natural habitats and the national objectives in ammonia regulations particularly in the Natura 2000 areas.
ISBN: 978-87-7156-327-6ISSN: 2245-019X