Second year post-construction monitoring of bats and birds ...dce2.au.dk/pub/SR232.pdf · Bat...
144
AARHUS UNIVERSITY DCE – DANISH CENTRE FOR ENVIRONMENT AND ENERGY AU Scientific Report from DCE – Danish Centre for Environment and Energy No. 232 2017 SECOND YEAR POST-CONSTRUCTION MONITORING OF BATS AND BIRDS AT WIND TURBINE TEST CENTRE ØSTERILD
Transcript of Second year post-construction monitoring of bats and birds ...dce2.au.dk/pub/SR232.pdf · Bat...

AARHUS UNIVERSITYDCE – DANISH CENTRE FOR ENVIRONMENT AND ENERGY
AU
Scientifi c Report from DCE – Danish Centre for Environment and Energy No. 232 2017
SECOND YEAR POST-CONSTRUCTION MONITORING OF BATS AND BIRDS AT WIND TURBINE TEST CENTRE ØSTERILD

[Blank page]

Scientifi c Report from DCE – Danish Centre for Environment and Energy
AARHUS UNIVERSITYDCE – DANISH CENTRE FOR ENVIRONMENT AND ENERGY
AU
2017
SECOND YEAR POST-CONSTRUCTION MONITORING OF BATS AND BIRDS AT WIND TURBINE TEST CENTRE ØSTERILD
Ole Roland Therkildsen (Ed.)Morten Elmeros (Ed.)
Aarhus University, Department of Bioscience
No. 232

Data sheet
Series title and no.: Scientific Report from DCE – Danish Centre for Environment and Energy No. 232
Title: Second year post-construction monitoring of bats and birds at Wind Turbine Test Centre Østerild
Editors: Ole Roland Therkildsen & Morten Elmeros (Eds.) Institution: Aarhus University, Department of Bioscience
Publisher: Aarhus University, DCE – Danish Centre for Environment and Energy © URL: http://dce.au.dk/en
Year of publication: June 2017 Editing completed: June 2017
Referee: Anthony D. Fox, Department of Bioscience Quality assurance, DCE: Jesper R. Fredshavn
Financial support: The Danish Environmental Protection Agency
Please cite as: Therkildsen, O.R. & Elmeros, M. (Eds.). 2017. Second year post-construction monitoring of bats and birds at Wind Turbine Test Centre Østerild. Aarhus University, DCE – Danish Centre for Environment and Energy, 142 pp. Scientific Report from DCE – Danish Centre for Environment and Energy No. 232. http://dce2.au.dk/pub/SR232.pdf
Reproduction permitted provided the source is explicitly acknowledged
Abstract: The Department of Bioscience, Aarhus University was commissioned by the Danish Nature Agency to undertake a bat and bird monitoring programme of a national test centre for wind turbines near Østerild in Thy, Denmark. Here we present the results from the second and final year of the post-construction studies. A total of ten bat species were recorded in 2013-2014. Species composition and occurrence were comparable to the results obtained during the pre-construction survey in 2011. Bats were recorded at all turbine sites and on all nights at surveyed ponds and lakes. Overall, the bat activity level decreased from 2013 to 2014 to the levels recorded in 2011. Bat activity was higher near the wind turbines than at nearby forest edges. Bat activity at the turbines was correlated to aggregations of insects on the turbine towers, which suggest that bats exploit the food resources that accumulate on the turbine towers on some nights. Nathusius’ pipistrelles and noctules were recorded at nacelle height. Two dead Nathusius’ pipistrelles were found in 2014 at the southern turbine situated in forest. Whooper swan, taiga bean goose, pink-footed goose, common crane, light-bellied brent goose, white-tailed eagle and nightjar were included as focal species in the ornithological investigations. In addition, species specific data on all bird species occurring regularly in the study area were collected. On the basis of this final assessment of collision risk, the potential impacts of the combined structures on the bird species occurring in the study area were considered unlikely to be significant. We recommend that the mortality related to human developments on the white-tailed eagle, common crane and nightjar populations, particularly the impact of the continued development of wind energy in the region, is closely monitored in the future.
Keywords: Bats, birds, wind turbines, temporal activity pattern, flight altitude, collision risk, test centre, post-construction, avoidance, impact assessment, Østerild, Denmark
Layout: Graphic Group, AU Silkeborg Front page photo: Kristian Brink Laulund
ISBN: 978-87-7156-271-2ISSN (electronic): 2245-0203
Number of pages: 142
Internet version: The report is available in electronic format (pdf) at http://dce2.au.dk/pub/SR232.pdf

Contents
Preface 5 Acknowledgements 5
Summary 6 Bats 6 Birds 9
Sammenfatning 12 Flagermus 12 Fugle 15
Part A: Bats 19
Introduction 21
Materials and methods 25 Ultrasound detectors and species identification 25 Monitoring of bat occurrence and activity levels 26 Bat activity at turbine towers 27 Insect aggregations around turbine towers 27 Bats at nacelle height 27 Quality assurance and data storage 28 Bat carcass searches 28 Statistical analysis 30
Results and discussion 31 Bat occurrence in the study area 31 Bat activity 33 Bat activity near turbine towers 34 Insects on turbine towers and bat activity 36 Bats at nacelle height 38 Bat carcass searches 38
Conclusions and perspectives 40
References 42
Part B: Birds 47
Introduction 49
Methods 50 Wind Turbine Test Centre Østerild 50 Conservation issues 52 Focal species 53 Study design 56

4
Results 65 Meteorological observations 65 Carcass searches 67 Results on selected species 68 Avoidance 112
Evaluation of cumulative impacts 114
Conclusions 120
References 123
Appendices and Tables 128 Annex A1. 128 Annex A2. 130 Appendix B1 131 Appendix B2 134 Tables 139

5
Preface
In June 2010, the Danish Parliament passed a Public Works Act to establish a national test centre for wind turbines near Østerild in Thy, Denmark. This legislation requires that a bird, bat and vegetation monitoring programme should be implemented. The Department of Bioscience at Aarhus University was commissioned by the Danish Nature Agency to undertake a monitoring programme of bats and birds in the test area. The monitoring programme comprises one baseline (2011/12) and two post-construction study periods (2013/14 and 2015/16). In 2012 we presented the results of the baseline mon-itoring programme, which was undertaken to establish a reference for the fu-ture analysis of the potential impacts on bats and birds caused by the opera-tion of the test centre and to provide a preliminary risk assessment for rele-vant species. In 2015 we presented the results from the first year of the post-construction monitoring programme together with an intermediate assess-ment of the potential impacts of the test centre on the bat and bird populations occurring in the study area. Here we present the results of the second year of the post-construction monitoring programme for birds and bats, together with a final assessment of the potential impacts of the test centre on the pop-ulations occurring in the study area.
The report is divided into two separate sections concerning bats and birds, respectively.
Acknowledgements We are grateful to John Stål and Peter Ringgaard, who carried out carcass searches together with their dogs Vaks, Malthe, Inka and Patsy. We thank Ingemar Ahlén, Sveriges Lantbruksuniversitet for the additional opinions on atypical echolocation bat calls, Jørgen Brandt, Dep. of Environmental Re-search, Aarhus University for meteorological data from Østerild and our col-league Preben Clausen for useful advice regarding the spring migration of light-bellied brent geese. We thank Henrik Schjødt Kristensen and Claus Ras-mussen, Danish Nature Agency for assistance in the field and helpful advice. We would also like to extend thanks to Lars Bo Jacobsen for catching nightjars. We also thank Poul Falk Nielsen, DTU, Department of Wind Energy for his kind assistance and Siemens Wind Power for access to the turbines nacelles. Finally, we wish to thank the steering committee of the project for their sup-port.
Morten Elmeros & Ole Roland Therkildsen

6
Summary
In June 2010, the Danish Parliament passed a Public Works Act to establish a national test centre for wind turbines near Østerild in Thy, Denmark. This legislation requires that a bird, bat and vegetation monitoring programme should be implemented.
Since 2011, the technical facilities at the test centre have gradually been de-veloped and various structures erected on site. The test centre comprises a total of seven test sites for wind turbines of up to a maximum height of 250 m. Each test site consists of a single wind turbine, each with at least one mast for meteorological measuring equipment (up to 150 m in height) located imme-diately to the west of each turbine. These masts are secured with guy-wires. The test centre also comprises two masts at heights up to 250 m secured with guy-wires. These masts also support aviation safety lighting.
The Department of Bioscience at Aarhus University was commissioned by the Danish Nature Agency to undertake a monitoring programme of bats and birds in the test area.
Bats The development of wind energy facilities is a major cause for concern for the conservation of bats. If wind turbines are constructed at locations in or near important bat habitats, e.g. forests and wetlands, or on bat migration routes, the turbines may cause substantial fatalities. If the density of wind turbines is sufficiently high, the cumulative effects of even very low fatality frequencies per turbine per year may affect the status of bat populations. The detrimental impact from wind turbines conflicts with national and international obliga-tions to maintain viable bat populations. Factual knowledge on the conserva-tion conflict is needed to develop ecologically sustainable wind energy facili-ties. We studied bat activity and behaviour at wind turbines at the national test centre for large wind turbines in Østerild in northwestern Denmark. The test centre was developed in an area dominated by coniferous forest and ara-ble farmland.
Bats were monitored at the test centre area and on ponds within 2.5 km of the wind turbines to record the presence of bats, to assess the potential effects on populations, and to examine selected aspects of bat interactions with wind tur-bines and the aggregation of insects to turbines. A pre-construction survey was performed during July-October 2011 when forest clearing in the project area also commenced. Post-construction monitoring and studies were carried out during August-October in 2013 and 2014. Two turbines located in coniferous forest were made the focus of studies of variations in bat activity in relation to distance from wind turbines and insect aggregations. At one of these sites the turbine was operational in 2013, but in 2014 this was only a turbine tower with-out an active rotor. Bat activity at nacelle height was recorded at these ‘forest turbines’ during September-October 2013 and 2014.
Results Ten species was recorded in the test centre area. Pond bat (Myotis dascyneme) and Daubenton’s bat (Myotis daubentonii), and Nathusius’ pipistrelle (Pipistrel-lus nathusii) were the most common species in all years. Soprano pipistrelle

7
(Pipistrellus pygmaeus), common pipistrelle (Pipistrellus pipistrellus), serotine (Eptesicus serotinus), noctule (Nyctalus noctula), Leisler’s bat (Nyctalus leisleri), parti-coloured bat (Vespertilio murinus) and brown long-eared bat (Plecotus au-ritus) were recorded irregularly.
Bat activity (number of call sequences per hour) was high at ponds within 2.5 km of turbines and in the test centre, while activity close to turbine sites was relatively low. However, bat activity was significantly higher at the two turbine sites situated in forest compared to activity at three turbine sites in open habi-tats. Highest bat activity was recorded at both turbine sites and ponds in the first post-construction year (2013). Activity in 2014 dropped to similar levels recorded during the pre-construction survey. The temporal variation in bat ac-tivity during the three survey months differed between years.
Bat activity was significantly greater near turbine towers than along forest edges nearby (50m and 150m) and at a meteorological mast, and bats were observed foraging around the turbine towers. The bat activity at the turbine towers was correlated with insect aggregations around the towers. Insect ag-gregations and bat activity at the two neighbouring turbines differed despite the turbines being only 600m apart.
Bats were recorded at nacelle height on four nights during 55 survey nights in September-October 2014. The wind speed was 1.6-7.3 m/s and the temper-ature was 10-14 °C on those nights.
No dead bats were recorded during systematic carcass searches with dogs 2015 at selected wind turbines in late summer and autumn during 2013-. However, two dead Nathusius’ pipistrelles were coincidentally found in 2014 at a wind turbine located in forest during the more intensive studies at that site. Similar studies were not carried out at the turbines outside of the forest.
Conclusion and perspectives Overall, the habitat changes and the operation of turbines seem not to have altered species presence in the test centre area. Whether the increased bat ac-tivity during the first post-construction year was caused by an improved ac-cessibility to the survey area along the large roads, and the subsequent decline was caused by increased disturbance or mortality, or natural variations in bat activity in an area, cannot be determined as no supplementary data on popu-lation sizes in the region or comparable data were available from unaffected control areas.
No fatalities were detected during the systematic carcass searches, so it was not possible to estimate fatality rates associated with turbines. For this reason, the overall number of bat fatalities will probably be low even when the test centre is fully developed. However, we cannot conclude that the wind tur-bines at the test centre have no significant adverse effects on local or national bat populations. The two coincidentally recorded fatalities of Nathusius’ pip-istrelles at the site exceed the critical average level for bat fatalities per turbine per year that has been suggested from population models when considering the cumulative effects of all the wind turbines on a national level. While this threshold is based on German mortality rates for Swedish bat populations, it cannot be excluded that the mortality of even a few individuals from small local populations in Østerild may have detrimental effects on their status.

8
Presence-absence surveys are unsuitable for monitoring changes in popula-tion size and the effects of wind turbines on bats at local, national and inter-national scales. Declines in species presence may not be detected before sub-stantial declines in populations have occurred.
The studies in Østerild on bats behaviour around wind turbines demon-strated that:
• Bat activity at wind turbines is elevated in coniferous plantations in areas with relatively low bat occurrence. Wind turbines situated in forests are likely to represent more of a threat to the conservation of bat populations than wind turbines constructed in open, barren habitats.
• Fatality rates may reach critical levels at wind turbines in coniferous plan-tations in areas with generally low bat occurrence. Construction of tur-bines in or near other forest types, in areas with larger bat populations and greater bat diversity will represent an even more significant threat to bat populations.
• Several survey sessions from spring to autumn are needed in both pre- and post-construction periods to record species presence, activity levels and fatality rates at a wind turbine site and assess the risk to the status of bat populations. As bat activity levels may differ between years at a location, pre- and post-construction surveys to assess impacts from wind turbines should span several years, e.g. min. 3 years.
• Bats activity is elevated around wind turbines compared to the activity de-tected at distances up to 150m in bat flight routes and potential foraging habitats. This shows that bats are attracted to the turbines and actively ex-plore the structures.
• The bat activity at the wind turbine towers is correlated with the number of insects settling on the towers, suggesting aggregations of insects in their vicinity appear to attract actively foraging bats, which put the bats at greater risk of collisions.
• There can be significant differences in bat activity between neighbouring turbine sites. Thus, monitoring of bats must be performed at several sites in a planned wind turbine park and during post-construction to monitor bat activity and fatality risk.
• Continuous measurement of bat activity with ultrasound detectors at rotor height and at ground level seems to be a more effective method than car-cass surveys to monitor and assess mortality risk. At tall wind turbines towers (>100m) recordings should also be made at medium heights as some bat species are only detectable at <50m.
• Curtailment of rotor activity during the hours just after dusk and just be-fore dawn on nights with wind speeds <6 m/s at temperatures above 15 °C does not eliminate the risk of wind turbine induced bat fatalities.
To better ensure ecologically sustainable wind energy facilities, further more intensive studies are needed to develop quantitative tools to assess fatality risk at wind turbines and their effects on bat populations.
The results from the Østerild studies regarding bat activity levels and mortal-ity rates at wind turbines in forested areas cannot be extrapolated to other bat species or wind turbines in different landscapes, habitats, and forest types in other regions of Denmark.
Parallel studies are needed on wind turbines in landscapes with different hab-itat characteristics, higher bat diversity and activity levels to assess fatality risks and impacts on populations. Studies at a wider size range of turbines are

9
also needed to estimate the relationship between bat fatality risk and turbine size.
Birds The monitoring programme for birds comprises one baseline (2011/12) and two post-construction study periods (2013/14 and 2015/16).
The test centre is located near several Special Protection Areas (SPAs), which are sites designated for their particular importance for birds. These SPAs have been classified for rare and vulnerable breeding birds (as listed on Annex I of the Directive) as well as for regularly occurring migratory species according to Article 4.2 of the EC Birds Directive and generally following the criteria for designation of wetlands of international importance. As a result of their high conservation interest the monitoring programme has focused on this group of species in both the baseline and post-construction studies.
In 2012, we presented the results from the baseline monitoring programme. On the basis of a preliminary assessment, we considered the potential impacts of the combined structures on the bird species occurring in the study area un-likely to be significant.
In 2015, we presented the results from the first year of the post-construction bird studies, which were carried out from August 2013 to October 2014, to-gether with an intermediate assessment of the potential impacts of the test centre on the bird populations occurring in the study area.
Here we present the results from the second year of the post-construction monitoring programme, which was carried out from August 2015 until Au-gust 2016, together with a final assessment of the potential impacts of the test centre on the bird populations occurring in the study area. During the second year post-construction study period the test centre reached full capacity with 7 wind turbines in operation.
Initially, pink-footed goose, taiga bean goose, whooper swan and common crane, were included in the baseline investigations. However, on the basis of the results obtained during the baseline studies, light-bellied brent goose, white-tailed eagle and nightjar were also subsequently included as focal spe-cies in the post-construction programme.
Apart from minor modifications and special efforts targeted towards light-bellied brent goose and nightjar, the design of the post-construction study was similar to the baseline study, which aimed at generating species-specific data, whenever this was technically possible. For this reason, although data were partly collated from comprehensive automated recording processes, the col-lection of high quality and high resolution data at the species level was given priority at all times in the investigations. We used visual transect counts and laser range finder data, which was combined to provide the basic information for the assessment. In addition, we conducted carcass searches using trained dogs under turbines and masts to quantify actual fatality rates.
In general, the second year post-construction study supported the conclusions from the previous study years. We confirmed that the test centre is not situ-ated on a migration corridor, although seasonal migration took place to some extent. During the day, flight activity in the study area was dominated by lo-cal birds moving between feeding areas and night roosts in northwest Jutland,

10
some of which has been designated as SPAs for the species included in the study. We demonstrated local movements to take place on a regular basis for a number of species, which was the case in the previous study years.
From the results of the baseline study, the species for which we estimated that more than one annual collision with wind turbines would take place were cormorant (3 individuals per year), pink-footed goose (21-46), greylag goose (3-6) and golden plover (65).
Based on the first year post-construction study, we estimated that the annual collision rate with wind turbines that exceeded one would be for cormorant (6-14), pink-footed goose (10-23), greylag goose (23-52), buzzard (0.8-1.6), golden plover (3-7), wood pigeon (0.5-1.2) and passerines (3-5).
From the results of the second year post-construction study, the species for which we estimated that more than one annual collision with wind turbines would take place were cormorant (7-15), whooper swan (2-5), pink-footed goose (14-31), greylag goose (19-44), kestrel (0.71-1.60), buzzard (1.2-2.7), com-mon crane (0.6-1.3), golden plover (7-15), wood pigeon (7-17) and passerines (7-19).
For all of these species, a high proportion of individuals passing the study area did so at rotor height. Nevertheless, this still only resulted in a relatively limited number of predicted collisions even for these species. It is also im-portant to note that in contrast to the baseline study, the post-construction study period covered the whole annual cycle, except for June-July.
For the remainder of the species that regularly occur in the study area, includ-ing the focal species taiga bean goose and white-tailed eagle, we predicted that the annual number of collisions would be less than one. This was typi-cally because, for these species, a high proportion of individuals and flocks migrating occurred at flight altitudes below the rotor height of the wind tur-bines. The amount of data collected was not sufficient to estimate collision numbers for light-bellied brent goose.
In summer 2015, we used miniature GPS data loggers to track movements of nightjars to investigate the extent to which they forage in the proximity of wind turbines in the study area. Unfortunately, the GPS data obtained from the single male, which we were able to track for three nights, was insufficient to draw any conclusions with regard to the foraging patterns of nightjars and associated risk of collision between wind turbines and masts.
Only one bird, a goshawk, was retrieved during the carcass searches. We were unable to determine whether the fatality was caused by a collision. No other carcasses were found during the searches. We consider the almost complete absence of collisions between birds and the structures at the test centre to be highly unlikely. We therefore assume that either some fatalities were not de-tected because their remains were not available or missed by the dogs or they were removed by scavengers between searches. Nevertheless, the results from the carcass searches indicate that the number of collisions is probably rather small. The results from the carcass searches therefore support our con-clusion that although collisions between turbines and other structures at the test centre are to be expected, they will occur at a low rate.

11
Our investigations demonstrated that many species showed vertical and hor-izontal avoidance in relation to wind turbines and measuring masts. This ac-tive avoidance response may also explain some of the discrepancy between collision estimates obtained by the Band method and the lack of fatalities found during the carcass searches. The Band model assumes a uniform distri-bution of bird flights in the area. This is opposed to our analyses which indi-cate that several species actively avoid the wind turbines and measuring masts. Hence, our analysis suggests that the Band model has a tendency to overestimate collision risk.
On the basis of this final assessment, which uses more reliable estimates of col-lision risk based on two post-construction study years, we still consider that the potential impacts of the combined structures on the bird species occurring in the study area are unlikely to be significant. We stress that our crude estimates of the number of collisions should be interpreted with caution including com-parison of collision estimates between the three study periods.
Since the test centre had only four turbines in operation during the first year post-construction study period, the previous assessment did consider a fully developed test centre. During the second year post-construction study period the test centre became fully developed with seven turbines simultaneously in operation. The presence of more turbines had only limited effect on our esti-mates of the risk of collisions with turbines. We are therefore relatively confi-dent to conclude that the overall impact of the test centre on bird species is considered unlikely to be significant.
For three of our focal species, which are rare breeders in the study area, i.e. white-tailed eagle, common crane and nightjar, a single fatality will inevitably have negative impact on the local and regional populations. However, we consider this potential impact on the population to be short-term. At least for common crane and white-tailed eagle the continued growth of the popula-tions will make them more resilient to added mortality from wind turbines and other human pressures in the future.
We therefore recommend that the mortality related to human developments on the white-tailed eagle, common crane and nightjar populations, particu-larly the impact of the continued development of wind energy in the region, is closely monitored in the future.
It is important to keep in mind that the data collected during the baseline and the post-construction programmes only covers less than three years. We are therefore cautious when we assess the extent to which there may be year-to-year variation in the occurrence of birds both during night and day. In partic-ular, different weather conditions can affect flight behaviour and migration pathways, which may affect the risk of collisions.

12
Sammenfatning
I juni 2010 besluttede Folketinget at etablere et nationalt testcenter for vind-møller nær Østerild i Thy. Med beslutningen fulgte et krav om at gennemføre et overvågningsprogram for de potentielle effekter på fugle, flagermus og ve-getation i området.
I 2011 blev den gradvise udbygning af de tekniske faciliteter i testcenteret på-begyndt. Der er plads til at teste op til syv vindmøller med en højde på op til 250 meter til øverste vingespids. Hver testplads består af en vindmølle med mindst en tilknyttet målemast på op til 150 meters højde, der er placeret umid-delbart vest for møllen. Testcenteret har desuden to master på op til 250 me-ters højde, der er udstyret med lys af hensyn til flysikkerheden. Alle master er sikret med et antal barduner.
Flagermus Vindmøller udgør en væsentlig risiko for flagermus og beskyttelse af bestan-dene. Flagermus dræbes af de roterende møllevinger. Flagermus opsøger til-syneladende møllerne, hvilket øger risikoen for drab. I gennemsnit er der re-gistreret mortalitetsrater på 10-15 flagermus pr. vindmølle pr. år, men varia-tionen mellem hver mølle er stor alt afhængig af hvor møllerne er opstillet. Der findes typisk flest døde flagermus ved vindmøller opført i eller nær vig-tige levesteder for flagermus, fx skov og vådområder, og i trækkorridorer, fx i kystnære områder og ved havvindmøller i trækkorridorerne. Størrelsen af vindmøllen er positivt korreleret med mortalitetsraten, mens afstanden mel-lem jorden og rotoren ikke har betydning for antallet af flagermusdrab.
Flagermusbestandes status er meget følsom overfor en øget dødelighed. Mo-delberegninger viser, at den kumulative effekt af selv ganske lave morta-li-tetsrater pr. mølle pr. år (<1 selv for almindelige arter) kan have en væsentlig negativ effekt på bestandenes størrelse, hvis tætheden af møller er tilstrække-lig høj. Modelberegningerne viser, at denne bestandseffekt kan ske ved en mølletæthed, der er væsentlig lavere end den aktuelle tæthed i Danmark. Jo flere vindmøller der står i en bestands udbredelsesområde, jo færre drab per mølle per år skal der til før den kumulative effekt påvirker bestandens status.
Forekomsten og aktiviteten af flagermus blev registreret i og omkring det na-tionale testcenter for store vindmøller i Østerild for at belyse enkelte adfærds-mæssige aspekter i konflikten mellem vindenergiproduktion samt de natio-nale og internationale forpligtelser til beskyttelse af flagemus og for at vur-dere, i hvilken grad vindmøllerne i testcentret påvirker flagermus. Før-under-søgelser blev gennemført i juli-oktober 2011, da skovrydningen i forbindelse med etableringen af testcentret var startet.
Efter-undersøgelser af flagermusforekomster og aktivitet samt undersøgelser af flagermus’ adfærd og insektforekomster ved møllerne blev gennemført i august-oktober i 2013 og 2014. Aktivitet og insekter omkring møller blev kun undersøgt ved de to sydligste møllepladser (Plads 6 og Plads 7), der er omgi-vet af skov. I 2014 var der kun ét mølletårn uden aktiv mølle på den ene af disse to møllepladser. Flagermusaktivitet i nacellehøjde blev moniteret i sep-tember-oktober 2013 og 2014 i de to møller i skoven.

13
Resultater Ti flagermusarter blev registreret i testcenterområdet: damflagermus (Myotis dasycneme), vandflagermus (Myotis daubentonii), troldflagermus (Pipistrellus nat-husii), dværgflagermus (Pipistrellus pygmaeus), pipistrelflagermus (Pipistrellus pipistrellus), sydflagermus(Eptesicus serotinus), skimmelflagermus (Vespertilio murinus), brunflagermus noctule (Nyctalus noctula), Leislers flagermus (Nyctalus leisleri) og langøret flagermus (Plecotus auritus). Damflagermus, vandflagermus og troldflagermus var de almindeligste arter i testcentret. Forekomsten af syd-flagermus steg i løbet af undersøgelserne. Langøret flagermus blev ligeledes re-gisteret i alle årene. Fundene af de øvrige arter er formentlig individer, der strej-fer rundt i sensommeren uden for områder med ynglekolonier eller migrerer gennem området. Mortaliteten af omstrejfende individer bidrager også til den kumulative effekt af vindmøller på bestandene.
Aktivitetsniveauet af flagermus (antal optagelser af ekkolokationssekvenser pr. time) var højt ved søer både i og uden for testcentret, mens der var lav aktivitet ved møllepladserne. Der var dog regelmæssig og højere flagermus-aktivitet ved de to møllepladser, der er omkranset af nåleskov, end ved møl-lepladserne i de åbne habitater. Aktiviteten var højest i 2013, men faldt i 2014 til samme niveau som ved før-undersøgelserne i 2011. Flagermusaktiviteten varierede gennem de tre måneder, som hver undersøgelse varede, men vari-ationen i flagermusaktiviteten over de tre måneder var forskellig fra år til år.
Flagermusaktiviteten var væsentlig højere ved mølletårnene end ved skov-kanter og en gittermast til metrologiske målinger. Den højere flagermusakti-vitet ved mølletårnene var korreleret med forekomsten af insekter på mølle-tårnene. Forekomsten af insekter og flagermusaktiviteten var højere ved møl-letårnet på Plads 6 end på Plads 7. Flagermusaktivitetsniveauet ved mølletår-net på Plads 6 var den samme i 2013 og 2014, selvom der blot stod et mølletårn på pladsen i 2014.
Flagermus- og insektaktiviteten ved mølletårnene var korreleret med mini-mumstemperaturen om natten. Insektforekomsten var også korreleret med vindhastigheden, men da insektforekomst og flagermusaktivitet primært blev undersøgt på nætter med lave vindhastigheder, kan resultaterne ikke forven-tes fuldstændigt at belyse sammenhængen mellem vindhastighed, flagermus-aktivitet og insektforekomst ved vindmøller.
Detektoren i nacellen på vindmøllen på Plads 7 registrerede troldflagermus og brunflagermus i september-oktober 2014. Der blev detekteret flagermus på 7 % af de overvågede nætter, alle i september. Flagermusene blev registreret mere end to timer efter solnedgang og på nætter med vindhastigheder på 1,6-7,3 m/s og temperaturer på 10-14 °C i 10m’s højde. I nacellehøjde må vindha-stigheden og temperaturen forventes at have været hhv. højere og lavere.
Der blev ikke fundet døde flagermus ved de systematiske eftersøgninger med trænede hunde på åbne flader under udvalgte vindmøller og master. Der blev dog tilfældigt fundet to døde troldflagermus ved møllen på Plads 7 under de mere intensive undersøgelser af flagermusadfærd i 2014. Tilsvarende under-søgelser blev ikke gennemført ved de andre aktive vindmøller. De døde fla-germus blev fundet i en periode, hvor der også blev foretaget systematiske undersøgelser med hunde.

14
Konklusion og perspektiver Habitatændringerne ved etableringen af testcentret og opførslen af vindmøl-lerne har ikke reduceret artsforekomsten af de almindeligste flagermus i Øste-rildområdet. Sammenlignet med tidligere kendt viden om flagermus i områ-det blev der registreret en højere diversitet af flagermus. Det skyldes forment-lig blot en systematisk registrering af flagermus. Det kan ikke afgøres ud fra de foreliggende undersøgelser, i hvilken grad de årlige forskelle i flagermus-aktiviteten for de almindeligste arter kan tilskrives nemmere adgang til test-center området via de brede adgangsveje og lysåbne områder langs disse i 2013, øgede forstyrrelser og mortalitet i 2014 eller tilfældige variationer i fla-germusaktiviteten i et område.
Der blev ikke fundet døde flagermus ved de systematiske eftersøgninger og den totale dødelighed af flagermus vil formentlig være lav, selv når test cen-tret er fuldt udbygget. Det er dog ikke muligt at estimere mortalitetsraten eller at konkludere, at møllerne i testcentret ikke har en væsentlig negativ effekt på flagermusbestandene. Den observerede dødelighed ved den sydlige vind-mølle er tilstrækkelig stor til at vise, at den mølle bidrager over den kritiske mortalitetsrate som ifølge modelberegninger kan føre til bestandsnedgange for flagermus pga. de kumulative effekter af alle vindmøllerne i en bestands udbredelsesområde. Desuden kan drab af enkelte individer fra små lokale be-stande have væsentlig betydning på bestandenes status.
På grund af flagermusenes bestandsdynamik og arealbrug kræver det foku-serede undersøgelser for at detektere effekter af vindmøller på bestandenes status. Overvågning af flagermus ved ekstensiv registrering af artsforekomst, som fx ved NOVANA-overvågningen, er ikke anvendelig til at overvåge ud-viklingen i flagermusbestandes størrelse, effekter fra enkelte vindmølleanlæg og kumulative effekter på lokalt og nationalt plan. Ændringer i bestandenes status kan kun detekteres med stor forsinkelse, når der er sket markante til-bagegange i bestandsstørrelsen. En art kan forekomme i et område, som strej-fende eller migrerende individer, selvom de faste bestande er forsvundet.
Undersøgelserne i Østerild af flagermus’ adfærdsmønstre ved vindmøller vi-ser:
• Der er højere flagermusaktivitet ved vindmøller opstillet i skov sammen-lignet med vindmøller i åbne områder. Selv i en landsdel, hvor forekom-sten af flagermus er relativ lav, er flagermusaktiviteten ved møller i nåle-skov forøget.
• Den observerede mortalitet ved en vindmølle i nåleskov kan være kritisk for flagermusbestandes status (Rydell m.fl. 2011). Større negative effekter på fla-germusbestande må forventes ved vindmøller opstillet i andre skovtyper og ved vindmøller i landsdele med større flagermusforekomster.
• Flagermusenes brug af landskabet varierer gennem året. Derfor er det nød-vendigt at overvåge flagermus i et projektområde gennem hele sommer-halvåret fx ved før- og efter-undersøgelser.
• Flagermusaktiviteten på en lokalitet varierer fra år til år. Følgelig er det utilstrækkeligt kun at overvåge flagermusaktiviteten i én sommersæson for at kunne vurdere, hvilken risiko vindmøller udgør for flagermus. Fla-germusene bør overvåges i minimum 3 år ved både før- og efterundersø-gelser.
• Flagermusaktiviteten er forhøjet omkring vindmøller sammenlignet med overvågningspunkter 50m og 150m fra møllen. Flagermusaktiviteten var

15
korreleret med forekomsten af insekter ved møllerne. Flagermusene opsø-ger formentlig vindmøllerne aktivt og undersøger dem bl.a. for at foura-gere på insekter, der samles på og omkring mølletårne og naceller.
• Der kan være store forskelle i flagermusaktiviteten ved nabomøller. Ved før- og efter-undersøgelser er det derfor ikke tilstrækkeligt at undersøge en enkelt eller to møllepladser eller møller i en vindmøllepark.
• Registrering af flagermusaktiviteten vha. ultralydsdetektorer i nacellen og ved jorden nær mølletårnet over min. 3 år synes at være en mere effektiv metode end eftersøgninger af flagermuskadavere til at overvåge og vur-dere risikoen for flagermusdrab ved efterundersøgelser af vindmøller. Ved høje vindmøller (>100m) med bør aktiviteten også registreres i mel-lemhøjde, da mange flagermus ikke kan registreres på >50m’s afstand.
• Risikoen for flagermusdrab elimineres ikke ved at stoppe vindmøller i få timer omkring solnedgang og solopgang, ved vindhastigheder under 5-6 m/s ved jordhøjde eller i nacellehøjde. 5-6 m/s anvendes typisk som tær-skelværdi i miljøgodkendelser af møller for at undgå flagermusdrab.
Mens de generelle aspekter af flagermus’ adfærd omkring vindmøllerne i Østerild må formodes at være repræsentative for andre flagermusarter og i andre habitater, landskaber og landsdele, kan niveauerne for flagermusakti-vitet, mortalitet og de potentielle effekter på bestandene ved vindmøllerne i Østerild ikke ekstrapoleres til alle flagermusarter og vindmøller i andre lands-dele, i andre landskaber og skovtyper. Højere mortalitetsrater og større nega-tive effekter på bestande på lokale, nationale og internationale niveauer må forventes fra vindmøller i og nær andre skovtyper og andre flagermushabita-ter i landsdele med større flagermusbestande, -diversitet og trækaktivitet. Desuden mangler der undersøgelser af flagermusforekomst og -aktivitet i for-hold til vindmøller gennem foråret og forsommeren. Hvis sammenhængen mellem vindmøllers størrelse og mortalitetsraten skal bestemmes, skal der gennemføres systematiske undersøgelser af flere møller med større forskelle i højde og rotorstørrelser.
Det er nødvendigt med parallelle undersøgelser ved møller i forskellige land-skaber og habitattyper i landsdele med større forekomster af andre flagermus-arter for at udvikle databaserede, kvantitative redskaber til at vurdere risi-koen for flagermusdrab og bestandseffekter for at udvikle en økologisk bære-dygtig vindenergiproduktion.
Fugle Institut for Bioscience, Aarhus Universitet, har af Naturstyrelsen fået til op-gave at gennemføre overvågningen af fugle i området. Overvågningspro-grammet består af en baseline-undersøgelse (2011/12) samt to år med under-søgelser efter etableringen af testcenteret (2013/14 og 2015/16).
Testcenteret er placeret nær flere Fuglebeskyttelsesområder, der er udpeget på grund af deres betydning for fuglearter, der er opført på Fuglebeskyttel-sesdirektivets Bilag I. Disse Fuglebeskyttelsesområder sikrer beskyttelse af sjældne og sårbare ynglefugle samt regelmæssigt forekommende trækfugle. Overvågningsprogrammet har derfor fokuseret på disse arter, der således er omfattet af internationale beskyttelsesinteresser.
I 2012 præsenterede vi resultaterne af baseline-undersøgelserne. På baggrund af en foreløbig vurdering konkluderede vi, at den potentielle negative effekt af etableringen af testcenteret på de berørte fuglebestande formentlig var be-grænset.

16
I 2015 præsenterede vi resultaterne af den første undersøgelse efter etablerin-gen af testcenteret. Undersøgelsen blev gennemført i perioden fra august 2013 til oktober 2014. Vi fremlagde dermed den anden foreløbige vurdering af den potentielle negative effekt af etableringen af testcenteret på de relevante fug-lebestande, herunder fugle, der yngler eller raster i området eller i de om-kringliggende fuglebeskyttelsesområder, samt fugle på egentligt træk.
Her præsenterer vi resultaterne af den anden undersøgelse efter etableringen af testcenteret, der nu er fuldt udbygget. Denne vurdering tager derfor ud-gangspunkt i, at syv møller er i drift.
Kortnæbbet gås, skovsædgås, lysbuget knortegås, sangsvane, trane, natravn og havørn har været fokusarter i nærværende undersøgelse, men vores un-dersøgelser har omfattet alle fuglearter, der forekom i området.
Bortset fra en særlig indsats rettet mod lysbuget knortegås og natravn svarede undersøgelsens design til tidligere år. Vi forsøgte således at indsamle artsspe-cifikke data i det omfang, det var teknisk muligt. Dataindsamlingen var derfor kun delvist automatiseret. I stedet blev det prioriteret at generere artsspeci-fikke data af høj kvalitet og opløsning. Vi kombinerede transekttællinger og laserkikkert for at indsamle de data, der dannede grundlag for vurderingen. Vi gennemførte desuden afsøgninger med hunde under møller og master med henblik på at kvantificere omfanget af kollisioner.
Overordnet set bekræftede de endelige undersøgelser efter, at testcenteret er blevet fuldt udbygget, resultaterne fra de tidligere års undersøgelser. Det blev således bekræftet, at testcenteret ikke er beliggende på en trækkorridor, selvom et egentligt sæsontræk fandt sted i et vist omfang. Som i de første un-dersøgelsesår kunne vi påvise, at flere arter regelmæssigt trækker mellem fou-rageringsområder og overnatningspladser i området.
På baggrund af baseline-undersøgelsen estimerede vi, at der ville forekomme mere end én kollision med vindmøller om året for følgende arter: Skarv (3), kortnæbbet gås, (21-46), grågås (3-6) og hjejle (65).
I det første undersøgelsesår efter etableringen af testcenteret estimerede vi, at der ville forekomme mere end én kollision med vindmøller om året for føl-gende arter: Skarv (6-14), kortnæbbet gås (10-23), grågås (23-52), musvåge (0,8-1,6), hjejle (3-7), ringdue (0,5-1,2) og småfugle (3-5).
I nærværende og afsluttende undersøgelse estimerede vi, at der ville fore-komme mere end én kollision med vindmøller om året for følgende arter: Skarv (7-15), sangsvane (2-5), kortnæbbet gås (14-31), grågås (19-44), tårnfalk (0,71-1,60), musvåge (1,2-2,7), trane (0,6-1,3), hjejle (7-15), ringdue (7-17) og småfugle (7-19).
De endelige kollisionsestimater er dermed på niveau med eller en smule hø-jere end resultatet fra de tidligere undersøgelsesår og viser således, at kollisi-onsrisikoen er forholdsvis lav. Det skal i denne forbindelse bemærkes, at mod-sat baseline-undersøgelserne, dækkede nærværende undersøgelse hele året bortset fra juni-juli.
For de resterende arter, der forekommer i området, inklusiv fokusarterne skovsædgås og havørn, er det estimerede antal årlige kollisioner mindre end én. Dette skyldes typisk, at en stor andel af individerne eller flokkene tækker

17
gennem området under vindmøllernes rotorhøjde. Det var ikke muligt at be-regne et kollisionsestimat for lysbuget knortegås.
I sommeren 2015 gennemførte vi GPS-mærkning af ynglende natravne med henblik på at undersøge, hvorvidt de fouragerer i nærheden af møllerne og der-med er i risiko for at kollidere med møllevingerne. Det lykkedes os kun at kort-lægge fourageringsbevægelser for en enkelt natravn gennem tre nætter, hvilket er et utilstrækkeligt grundlag for en vurdering af kollisionsrisikoen for denne art. Det er dermed ikke muligt at estimere kollisionsrisikoen for natravn.
Under afsøgningerne med hunde blev der blot fundet en enkelt fugl (en due-høg), der kunne være død som følge af en kollision med en møller eller en maste. Det var dog ikke muligt at fastslå dødsårsagen. Vi vurderer dog, at det er sandsynligt, at der sker flere kollisioner end afsøgningerne har vist. Vi an-tager derfor, at enten lykkedes det ikke hundene at finde de døde fugle i for-bindelse med afsøgningerne, eller også blev fuglene taget af ådselsædere mel-lem afsøgningerne. Ikke desto mindre indikerer resultatet af afsøgningerne, at antallet af kollisioner er lavt. Afsøgningerne understøtter derfor vores vur-dering, idet kollisioner må forventes at forekomme, men at disse har et be-grænset omfang.
Vores undersøgelser viste, at mange fuglearter aktivt undgik området nær både møller og målemaster. Fuglene reducerede således risikoen for kollisio-ner med møller og målemaster ved at udvise undvigerespons i både det hori-sontale og vertikale plan. Undvigeresponsen kan til dels forklare forskellen på vores kollisionsestimater beregnet ved hjælp af Band-modellen og de manglende fund af døde under møller og master. Band-modellen antager en uniform fordeling af fugle i området, hvilket vores analyse viser, ikke er til-fældet. Dermed antyder vores resultater, at Band-modellen overestimerer kol-lisionsrisikoen.
Da testcenteret blev fuldt udbygget, mens de afsluttende undersøgelser fandt sted, omfatter vurderingen derfor et testcenter med de maksimale syv møller i drift. Denne endelige vurdering af kollisionsrisici bygger på mere robuste estimater for antallet af kollisioner, end det var tilfældet i de to foregående undersøgelsesår. Vi vurderer derfor samlet set, at den potentielle negative på-virkning af fuglearter i området er begrænset. For de tre fokusarter trane, hav-ørn og natravn, som er fåtallige eller sjældne ynglefugle i området, vil blot en enkelt kollision medføre en negativ påvirkning af de lokale og regionale yng-lebestande. Vi anser dog denne potentielt negative påvirkning til at være af midlertidig karakter.
Vi anbefaler imidlertid, at potentielt negative påvirkninger af bestandene af havørn, trane og natravn, som skyldes fortsat udbygning af vindenergien i regionen, nøje overvåges.
Det er vigtigt at bemærke, at vores undersøgelser omfatter en periode på min-dre end tre år. Der kan således være år-til-år-variation i fx forekomsterne af fugle, både om dagen og om natten. Især kan forskelle i vejrforholdene på-virke flyveadfærd og trækmønstre på både lille og stor skala, hvilket igen kan påvirke risikoen for kollisioner.

[Blank page]
19
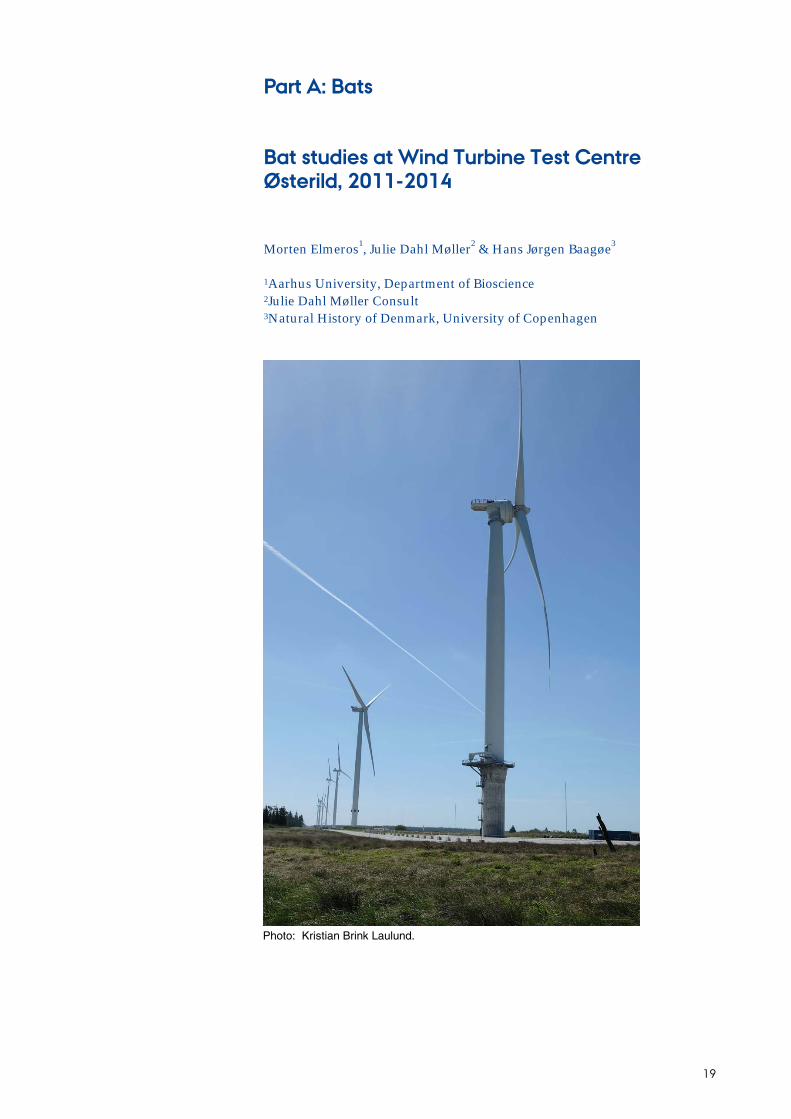
Part A: Bats
Bat studies at Wind Turbine Test Centre Østerild, 2011-2014
Morten Elmeros1, Julie Dahl Møller2 & Hans Jørgen Baagøe3
1Aarhus University, Department of Bioscience 2Julie Dahl Møller Consult 3Natural History of Denmark, University of Copenhagen
Photo: Kristian Brink Laulund.

[Blank page]

21
Introduction
The national test centre for large wind turbines at Østerild was established in 2011. An environmental monitoring programme was carried out during the first years of operation to assess the potential effect of the wind turbines on bats, and to study selected aspects of the conflict between wind turbines and the conservation of bat populations. No previous studies on bats and wind turbines have been carried out in Denmark. The data generated by the studies in Østerild should therefore have some relevance to the general assessment of the detrimental effects on bat populations from wind turbines.
The discovery of numerous bat carcasses under wind turbines in North Amer-ican and Europe shows that the development of wind energy facilities may have a significant adverse impact on bat populations (e.g. Ahlén 2002, John-son et al. 2003, Kerns & Kerlinger 2004). These observations led to research into the potential threat posed by wind turbines to the conservation of bat populations in many countries, and wind energy development is now recog-nized as a major cause for concern for the conservation of bat populations in most European countries and on other continents (e.g. Brinkmann et al. 2006, Hötker 2006, Ahlén et al. 2007, Kunz et al. 2007, Arnett et al. 2008, Ahlén 2010, Rodrigues et al. 2014, Mathews et al. 2016). Consequently, appropriate con-sideration to bats should be implemented in the planning and operation of wind turbines to develop ecologically sustainable wind energy facilities.
Bats do not collide with wind turbines or other stationary structures, but are killed by collisions with the moving turbine rotors or by barotrauma in the wake vortices behind them (Baerwald et al. 2008, Grodsky et al. 2011, Rollins et al. 2012). All European bats species use echolocation for navigation, detec-tion of objects and hunting, enabling them to fly in complete darkness. How-ever, bats cannot detect fast moving rotor blades by echolocation at suffi-ciently long distances to evade the approaching danger in time (Long et al. 2009, 2010). The tips of large wind turbine rotor blades travel speeds, which bats cannot detect at sufficiently long distance to avoid collisions.
Up to 70 bat carcasses per year have been recorded at wind turbines but num-bers of bat fatalities vary considerably between individual turbines (Brink-mann et al. 2006, Rydell et al. 2011). Survey methods and local conditions also varied considerably. Differing survey periods, survey intervals, detection method and detectability of the carcasses on the ground surrounding the tur-bines all hamper direct comparisons between studies (Rydell et al. 2011, Mathews et al. 2016). It is unlikely that all casualties are detected, even with elaborate systematic survey techniques, and even when using trained dogs to detect carcasses (Arnett 2006, Mathews et al. 2013). It has been suggested that actual fatalities may be up to three times those detected, but that ratio will depend on survey technique and intervals, habitat characteristics and density of natural and feral scavengers in the search area (Iuell 2013). Estimating num-bers of fatalities among rare species pose special difficulties, especially if no carcasses are observed (Huso et al. 2015).
Many factors may affect bat presence around wind turbines and the resulting fatalities. These include geographic location, topography and habitat charac-teristics of the turbine area, turbine size, weather parameters, seasonal varia-tions in bat habitat use, migration patterns and phenology of insect occurrence

22
(Hötker 2006, Barclay et al. 2007, Dulac 2008, Baerwald et al. 2009, Arnett et al. 2011). There is a positive correlation between bat activity and fatality rates at wind turbines, but elevated fatality rates are also recorded at some sites with generally low levels of bat activity (Mathews et al. 2016). The highest numbers of bat fatalities are found at wind turbines located in or near habitats that are attractive to bats such as forests, rivers and wetlands, along commut-ing routes and spring or autumn migration routes, e.g. along coastlines (Brinkmann et al. 2006, Rydell et al. 2011). High fatality rates have sometimes been reported at wind turbines in arable farmland where turbines are located on a local commuting or migration route (Traxler et al. 2004). High fatality rates can also be expected at near-shore and off-shore wind turbines located on bat migration routes (Ahlén et al. 2007).
The numbers of bat fatalities at wind turbines are higher than would be ex-pected if fatalities occurred randomly (Arnett et al. 2008). Bats appear to ac-tively seek out turbines and investigate turbine towers, nacelles and rotors, thus exposing them to high collision risk for extended periods of time. Some species that are found dead underneath turbines or recorded at nacelle height are not normally observed at such flight heights, e.g. brown long-eared bat (Plecotus auritus). The accumulation of insects around wind turbine structures may attract bats (Ahlén et al. 2007), and a positive correlation between the numbers of bats and insects flying near wind turbines have been observed in an American study (Horn et al. 2008). Some bat species may also use the wind turbines as intermediate resting sites or mating roost sites (Ahlén et al. 2007, Kunz et al. 2007, Arnett et al. 2008).
Numbers of bat fatalities are correlated with wind turbine size (both turbine height or rotor diameter, Barclay et al. 2007, Rydell et al. 2011, Mathews et al. 2016). The distance between the rotor and the ground level shows no relation-ship with bat fatalities, possibly because bats actively forage around or inves-tigate the wind turbine structure irrespective of the height of the rotor sweep area above the ground.
Bats have a relatively long life expectancy, long pre-reproduction period and a low reproductive rate; most species only produce one young per year and in some years only 50% of adult females breed successfully (Sendor & Simon 2003, Altringham 2011, Chauvenet et al. 2014). These life-history traits make bat populations highly susceptible to increased mortality and environmental change due to human land use and development (Schorcht et al. 2009). In Ger-many, estimated average annual fatality rates associated with individual wind turbines were 0.9 noctules (Nyctalus noctula) and 0.7 Nathusius’ pipi-strelles (Pipistrellus nathusii) per turbine per year in Germany (Seiche 2008, Dürr 2009), with similar average figures recorded in the United Kingdom (Mathews et al. 2016).
While these known average annual fatality rates for each turbine may seem low for each species, the cumulative effect of wind turbines is sufficiently large to cause substantial reductions in the size of bat populations. Population modelling based on the average mortality rates recorded in Germany suggest that the increased mortality caused by the present number of wind turbines in Sweden may result in 20-30% declines in the populations of noctule and Nathusius’ pipistrelles over a 30 year period (Rydell et al. 2011). If another 5000 turbines were constructed in Sweden the declines could amount to 50-70%. In Denmark, the density of on-shore wind turbines is significantly greater than the present and modelled wind turbine density in Sweden (Ry-

23
dell et al. 2011, www.dkwind.dk). Therefore, a significant impact on bat pop-ulations in Denmark is likely. Furthermore, some of the 500 off-shore turbines in Danish waters are constructed on potential migration routes for the bats which may further add to bat fatalities, enhancing cumulative effects. Assum-ing random location of wind turbines relative to bat habitats and migration routes, we may therefore predict higher impacts on bat populations in Den-mark and the fly-way populations that migrate through Denmark and Danish waters than in Sweden.
All European bat species are of conservation concern and protected both na-tionally and internationally under the Bonn Convention (The Convention on the Conservation of Migratory Species of Wild Animals), the Bern Convention (The Convention on the Conservation of European Wildlife and Natural Hab-itat) and the EUROBATS Agreement (Agreement on the Conservation of Pop-ulations of European Bats), to all of which Denmark is a signatory. All bats are strictly protected in European Union member states by the Habitats Di-rective (EC Council Directive 92/43/EEC on the conservation of natural hab-itats and of wild fauna and flora), implemented in their national legislation. The Habitats Directive prohibits deliberate killing of protected species, in-cluding all bats. Furthermore, legislation requires monitoring of levels of in-cidental killings of the protected species and that further research or conser-vation actions should be undertaken to ensure that incidental capture and kill-ing does not have a significant adverse impact on populations.
The national conservation and Red List status of bat species recorded in the eastern Thy-area are shown in Table 1 (Baagøe & Jensen 2007, Elmeros et al. 2012, Elmeros et al. 2015). Both status assessments were based on information on the national distribution determined from the species occurrences at a small number of monitoring sites (Søgaard & Baagøe 2012). No systematic data are available on national, regional or local population sizes and trends or on trends in changes in the extent and quality of bat habitat.
No systematic bat survey had been performed in the Østerild test centre area prior to the project. A baseline study was performed in the first year of the developmental phase to describe bat occurrence and activity periods to estab-lish a suitable monitoring programme for the operational phase (Elmeros et
Table 1. List of the bat species recorded in the Østerild study area in 2011-2014, the species’ overall conservation status in the
Atlantic biogeographic region in Denmark following the Habitat Directive Article 17 assessment (European Commission 1992,
Fredshavn et al. 2014), and the national red list assessment (Elmeros et al. 2010). Fav.: Favourable, Unfav.-1: Moderately unfa-
vourable, LC: Least concern, VU: Vulnerable).
Abbrevi-
ation English name Danish name Latin name
Habitat Directive
National
Red list Annex
Conservation
status
Mdas Pond bat Damflagermus Myotis dasycneme II & IV Fav. VU
Mdau Daubenton’s bat Vandflagermus Myotis daubentonii IV Fav. LC
Pnat Nathusius’ pipistrelle Troldflagermus Pipistrellus nathusii IV Fav. LC
Ppyg Soprano pipistrelle Dværgflagermus Pipistrellus pygmeaus IV Unfav-1 LC
Ppip Common pipistrelle Pipistrelflagermus Pipistrellus pipistrellus IV Fav. LC
Nlei Leisler’s bat Leisler’s flagermus Nyctalus leisleri IV n/a n/a
Nnoc Noctule Brunflagermus Nyctalus noctula IV Fav. LC
Eser Serotine Sydflagermus Eptesicus serotinus IV Fav. LC
Vmur Parti-coloured bat Skimmelflagermus Vespertilio murinus IV n/a LC
Paur Brown long-eared bat Langøret flagermus Plecotus auritus IV Fav. LC

24
al. 2012). Because of the procurement process, the baseline study did not cover the first half of the bat season, being restricted to the months of August, Sep-tember and October. As a result all subsequent monitoring was also restricted to these months. Studies on bat behaviour near wind turbines concentrated on the wind turbines at site 6 and 7 where highest bat occurrence had been detected during the baseline study. Only these turbine sites were in active use in the first year of the post-construction study. First year post-construction studies were reported in Elmeros et al. (2015).

25
Materials and methods
Ultrasound detectors and species identification The occurrence and activity levels of bats in the test centre area, at nearby ponds and at different distances from the turbine towers were recorded with automatic Pettersson D500X-detectors (Pettersson Electronik AB), that made real-time, full-spectrum recordings of the bats’ echolocation calls. Manual monitoring and direct observation of bat behaviour and use of the test centre area were undertaken using primarily Pettersson D1000X ultrasound detec-tors. In 2011 some recordings were made using a Pettersson D240X detector coupled to an Edirol R09HD recorder. Bat activity at nacelle heights was mon-itored with a Batcorder 3.0 detector coupled with a wind turbine extension kit and microphone from EcoObs GmbH.
Recordings of bat calls were analysed using BatSound 4 (Pettersson Electronik AB) to identify species. Species were identified based on the characteristics of their echolocation calls: frequency band, frequency of maximum energy, du-ration and shape of the calls and intervals between calls following Ahlén and Baagøe 1999.
Bats show considerable plasticity in their calls depending on their behaviour, distance to clutter, etc. All bat species known to occur in Jutland can be iden-tified by their echolocation calls, but only if optimal recordings are made. For many species long recordings of bats flying in search phase flight are needed to secure safe identifications, and visual observations of the size of the bats, their flight pattern together with the calls are often a great help. It is far from always that such optimal recordings can be made from bat flying near the wind turbines, and in many cases the recorded sequences are too short mak-ing the identification difficult based on recordings from the automatic detec-tors. Especially bats of the Myotis genus (e.g. pond bat, Daubenton’s bat, Brandt’s bat and Natterer’s bat that all occur in Jutland) often have very sim-ilar echolocation calls, and were often difficult, or in some cases impossible to identify, on the automatic recordings. The pond bat most often has some more or less unique calls, which makes it identifiable from automatic recordings. On some nights, we attempted to identify all recorded Myotis calls to assess the relative proportion of pond bats among the Myotis-bats recorded at the survey sites during the surveys. Also short sequences of calls from noctules, Leisler’s bats, serotines and parti-coloured bats and the 3 Pipistrellus species can be challenging to identify from their calls in certain situations, e.g. when approaching and investigating structures or catching an insect.
The ultrasound echolocation calls attenuate quickly. Bat calls are detectable at distances from <5 to 100m depending on species, behaviour, the type and di-rection of the call. Generally, the more common species detected at Østerild are detectable at a range of up to 30-50m. The most commonly used echoloca-tion calls from brown long-eared bat can only be detected from short distances <5-10m, but this species also uses louder calls while some calls from high-flying noctules can sometimes be detected up to ca. 100 or even 200m in op-timal conditions.

26
For further information of monitoring methods and species identification from their echolocation calls, see Ahlén & Baagøe (1999), Baagøe & Ahlén (2001) and Søgaard & Baagøe (2012).
Monitoring of bat occurrence and activity levels Bats were monitored at five wind turbine sites, at two ponds inside the test centre area and at three ponds within 2.5km of turbines around the test centre area with automatic detectors for up to 13 nights from August to late October 2011, 2013 and 2014 (Tab. 2, Figure 1). In 2011, wind turbine sites were also surveyed on four nights in July. The same sites, lakes and ponds were moni-tored during the baseline survey in 2011 and the post-construction surveys in 2013 and 2014 (Elmeros et al. 2012, Elmeros et al. 2015).
During the baseline survey of bats in 2011, detectors were placed along forest roads and forest edges near the projected wind turbine sites. Habitat changes, e.g. forest clearing, may affect bat activity at a fine spatial scale. To minimize biases in the 2013 and 2014 surveys, the detectors were placed along the near-est forest edges to the original monitoring location at the turbine sites where the forest had been cleared after the 2011 survey.
Bat activity at ponds in the test centre area and in the vicinity was monitored to determine species occurrence in eastern Thy and activity levels at potential major foraging sites. The survey at sites outside the test centre area also served as a reference for assessments of the potential effects of habitat changes or operation of wind turbines in the test centre area.
Recordings started near sunset and continued for four hours by which time bat activity usually has peaked. The surveys were conducted on nights with favourable weather conditions, i.e. on relatively warm nights with little wind and no precipitation to reduce weather dependent variations in bat activity. Numbers of surveys at each site varied due to noise disturbance from the veg-etation and the wind turbines on windy nights and a few technical issues.
Manual recordings and direct observations were collected at the survey sites, primarily pond sites, during each survey night, to collect more quantitative data on numbers of individual present and their behaviour.
Table 2. Monitoring nights and frequency of occurrence (% of monitored nights) of any
bats recorded up to four hours after sunset at forest roads/wind turbine sites and ponds in
Østerild.
2011 2013 2014
N Any bat N Any bat N Any bat
Site 1 14 29 12 75 13 62 Site 3 14 64 13 92 13 62
Site 5 14 43 12 67 13 31
Site 6 16 75 13 77 13 62
Site 7 15 73 12 75 13 69
Abildhave Pond 9 89 12 100 13 100
Klastrup Pond 7 100 11 100 12 92
Stensig Pond 8 100 12 100 13 100
Klitvejen Pond 5 40 2 100 - -
Tovsig Pond 2 100 3 100 6 100

27
Bat activity at turbine towers Bats are often observed flying around wind turbines examining the structure or foraging on insects aggregated around turbine towers. The potential attrac-tion of bats to the wind turbines was examined by recording the bat activity at different distances from the two southern wind turbines (Site 6 and 7) and the meteorological mast at Site 7. These studies were conducted in August-October 2013 and 2014 (Tab. 3).
Automatic bat detectors were placed at the base of the turbine tower (on the lee side of the tower) and along forest edges, ca. 50m and 150m from the tur-bine towers (Fig. 2). A set of detectors were also placed 0m, 50m and 150m from the meteorological mast for comparison between turbine towers and a lattice mast.
Recordings started around sunset and continued for four hours. The surveys were conducted on nights with favourable weather conditions, i.e. relatively warm with little wind and no precipitation to avoid weather dependent vari-ations in bat activity. Numbers of surveys at each site varied due to technical issues with the detectors, e.g. excessive noise from the vegetation or the wind turbines.
Insect aggregations around turbine towers Large numbers of insects may congregate around wind turbines (Ahlén et al. 2007, Rydell et al. 2010). To estimate the temporal variation in insect aggrega-tions on the towers eight patches of sticky fly paper (each 0.2 or 0.3m2) were placed on the turbine towers at ca. 2m height. Insects were sampled for mini-mum four hours starting at sunset. The nocturnal density of insects was esti-mated as the total number of insects sampled per m2 per hour for each turbine tower. Bat activity at the turbine towers was recorded simultaneously (Tab. 3).
Bats at nacelle height Automatic bat detectors were installed in the nacelle of the wind turbines in 2013 at sites 6 and 7 and in 2014 at site 7 to record activity of bats near the nacelles of the wind turbines. The microphone for the detectors protruded
Table 3. Number of survey nights at meteorological mast and wind turbine sites in August-
October 2013 and 2014 to examine the relationship between bat activity at different dis-
tances from wind turbine towers and insect aggregations on the towers.
2013 2014
Distance
Bat survey
nights
Bat survey
nights
Insects
survey nights
Met.mast 7 0m 4 10 50m 3 11
150m 2 5
Turbine 6 0m 4 11 13
50m 4 11
150m 4 11
Turbine 7 0m 6 9 13
50m 8 10
150m 4 11
28
through the underside of the nacelle close to the tower. The bat detectors were in operation in September-October in 2013 and 2014. The detectors were pro-grammed to record between 18:00 and 06:00 every night. The turbines were in operation during the monitoring of bats at nacelle height. Noise from the turbines may have interfered with the bat detectors and obscured bat calls.
Quality assurance and data storage The detection and species identification methods used in this study correspond to the methods and high quality criteria that were defined in the national mon-itoring programme for bats (Søgaard & Baagøe 2012). Species identification of recordings was determined independently by a minimum of two observers, if calls were not characteristic and easily identifiable. All recordings are stored electronically as uncompressed audio files (wav- or raw-format).
Bat carcass searches Bat carcasses were recorded under selected wind turbines and meteorological masts during searches for bird carcasses using trained dogs.
Carcass searches were conducted at 3-4 days intervals between: September 5 – November 5, 2013 (n=17) April 28 – June 5, 2014 (n=12) July 21 – August 29, 2014 (n=12) September 18 – October 9, 2014 (n=8) September 23 – November 3, 2015 (n=15) May 2 – June 1, 2016 (n=13).
For a more detailed description of methodology - see description of carcass searches in the bird chapter.

29
Figure 1. Bat monitoring sites at the national test centre area and its vicinity (Wind turbine sites: red, Ponds: blue) (Ortho photo, DDO®).
Figure 2. Monitoring sites for the study of bat activity in relation to distance to wind turbine towers and a meteorological mast (Ortho photo, DDO®).

30
Statistical analysis Generalized linear modelling (GLM) analyses with a negative binomial distri-bution error of the dependable variable were used to compare bat activity (call sequences per hour) between years, site types, survey sites and bat activity at different distances to turbine towers and the meteorological mast. Survey re-sults from July 2011 were excluded from the analyses to harmonise survey periods and avoid biases due to temporal differences in bat habitat use and activity in the survey area. GLM analysis was also used to examine factors explaining variations in bat activity, insect densities and the relationship be-tween bat activity and insect density.
Weather parameters, lunar cycle, month, year, survey site and survey type were included as explanatory variables in the models to explain the differ-ences in bat activity (Tab. 4). Weather parameters were extracted from the nu-merical weather forecast model ETA for Site 7 (Brandt, pers. comm., Nickovic et al. 1998, Brandt et al. 2001). Weather parameters were highly correlated. Amongst correlated weather parameters, only the variable with the best ex-planatory value was included in the final analysis. The best candidate models were selected using the ΔAIC (Akaike’s Information Criteria) value (Burnham et al. 2011). Differences between years, survey site, site types and distances were compared by t-tests of the differences between least square mean esti-mates. The statistical analyses were performed using SAS 9.3 and SAS Enter-prise Guide 4.3 (SAS Institute Inc., Cary, USA).
Table 4. Variables included as explanatory variables for the GLM analyses of bat activity
and insect densities at turbine towers. Cat.: categorical variable; Num.: numerical co-varia-
bles.
Variable Definition Type
Year Year Cat Mth Month Cat.
Site Locations, e.g. wind turbine site 5, Klastrup pond Cat.
Type Type of survey site: Wind turbine site or Pond Cat.
Jul_Date Julian day Num.
Lunar Lunar size 0 (new moon) -1 (full moon) Num.
T_SS Temperature at 2m at sunset Num.
T_Night Average temperature at 2m 4 hours after sunset Num.
T_minNight Minimum temperature at 2m 4 hours after sunset Num.
T_maxNight Minimum temperature at 2m 4 hours after sunset Num.
Prec_After Precipitation 4 hours before sunset Num.
Prec_Night Precipitation speed 4 hours after sunset Num.
WS_Night Average wind speed at 10m 4 hours after sunset Num.
WS_minNght Minimum wind speed at 10m 4 hours after sunset Num.
WS_maxNght Minimum wind speed at 10m 4 hours after sunset Num.
WD_SS Wind direction at 10m at sunset (N, NE; E, SE, S, SW, W, NW) Cat.

31
Results and discussion
Bat occurrence in the study area Species and spatial occurrence of the most common bat species in the two post-construction surveys were similar to those in 2011 (Tab. 5). The most commonly recorded species in all years at all monitoring sites were pond bats, Daubenton’s bats and Nathusius’ pipistrelle.
The two Myotis species (pond bat and Daubenton’s bat) were recorded most regularly over ponds which are the most typical foraging habitats for these species. Up to 80% of the recorded Myotis-bat calls on ponds on any one night were pond bats. Pond bats were also regularly foraging over the ponds inside the test centre area soon after sunset, and were regularly recorded at all the wind turbine sites. All the Myotis-bat recorded at turbines sites were pond bats on some nights.
No systematic roost surveys were performed, but pond bat maternity roosts are known from Østerild village and a roost was discovered in buildings near Tovsig Pond. The main distribution area of pond bats in Jutland includes cen-tral Jutland, Himmerland and the western Limfjord-area (Baagøe 2007a). The Danish pond bat population is one of the largest know populations globally. Daubenton’s bats are widespread and common throughout Jutland (Baagøe 2007b).
Nathusius’ pipistrelles were recorded regularly over ponds and in the test centre area. Buildings near Tovsig Pond housed a maternity roost of Nathu-sius’ pipistrelles. The species is common in landscapes with deciduous wood-lands in eastern Jutland, but breeding populations are very rare in the west (Baagøe 2007c). Nathusius’ pipistrelle is a long-distance migratory species and large numbers are migrating through Denmark each spring and autumn (Steffens et al. 2004, Baagøe pers. obs.).
Seven other species were recorded irregularly in the test centre area: Serotine, soprano pipistrelle, common pipistrelle, noctule, Leisler’s bat, parti-coloured bat and brown long-eared bat. The occurrence of serotine bats has increased during the three survey years and the species was registered at all turbine sites in 2014. Serotine is very common throughout most of Jutland but it had previ-ously only been recorded sporadically in Østerild area (Baagøe 2007g).
Vagrant individuals of most species are often found outside their usual breed-ing distribution range in late summer and early autumn. Soprano pipistrelle and noctule are widespread in most of Jutland in landscapes with deciduous woods, but both species are of limited occurrence in the Thy region (Baagøe 2007d, 2007f). The summer distribution ranges of parti-coloured bat and com-mon pipistrelle seem to have increased in Jutland during the last decade (Baa-gøe 2007e, 2007h, H.J. Baagøe, E.T. Fjederholt & M. Elmeros, unpublished NO-VANA-data 2012-2013).
A few brown long-eared bats were recorded in all years including at the wind turbine sites. The species had previously been recorded in the forest in the vicinity of the study area (Baagøe 2007i). Brown long-eared is a gleaning bat

32
that emits very weak echolocation calls. Thus, although present, the species is recorded less regularly than the other louder species.
The Leisler’s bat was recorded once in 2013 during the study of activity at different distances to the turbines. Leisler’s bat is only recorded very sporad-ically in Denmark (Baagøe & Jensen 2007, Møller et al. 2013). Leisler’s bat is a very common species in Central and southern Europe, and like the noctule bat, is a long-distance migrator.
Table 5. Occurrence of bats (% of monitored nights) during the four hours after sunset at wind turbine sites and ponds in the
test centre area and its vicinity. See Fig. 1 for locations and Tab. 1 for species abbreviations. * Mdas was recorded incidentally
at site 1 more than four hours after sunset in 2011. ** Paur was recorded in 2011 but not on the fixed survey sites.
2011 July-October
Location N Any bat Myotis Mdas Pnat Ppyg Ppip Eser Nnoc Vmur
Nyct/
Vmur Paur**
Un-
ident.
Site 1 14 29 14 0* 14 0 0 0 0 0 0 0 0
Site 3 14 64 50 36 14 14 0 0 0 0 0 0 7
Site 5 14 43 29 14 29 0 0 0 0 0 0 0 0
Site 6 16 75 38 25 38 0 0 6 0 6 0 0 0
Site 7 15 73 60 47 60 0 0 0 0 0 0 0 7
Abildhave Pond 9 89 56 56 56 0 0 0 0 0 0 0 11
Klastrup Pond 7 100 43 43 57 0 0 14 0 0 0 0 14
Stensig Pond 8 100 100 100 88 0 0 0 0 13 0 0 13
Klitvejen Pond 5 40 13 13 25 0 0 13 0 0 0 0 13
Tovsig Pond 2 100 100 100 100 0 0 100 0 50 0 0 0
2013 August-October
Location N Any bat Myotis Mdas Pnat Ppyg Ppip Eser Nnoc Vmur
Nyct/
Vmur Paur
Un-
ident.
Site 1 12 75 67 50 17 0 0 8 0 8 8 0 8
Site 3 13 92 85 38 62 8 0 23 15 23 0 0 0
Site 5 12 67 42 33 50 0 0 0 0 25 8 8 8
Site 6 13 77 77 54 69 8 0 15 8 0 8 0 8
Site 7 12 75 42 33 58 0 0 8 0 17 0 8 0
Abildhave Pond 12 100 100 100 92 0 0 0 0 25 8 0 8
Klastrup Pond 11 100 91 91 100 0 0 45 9 9 9 0 9
Stensig Pond 12 100 92 92 83 8 0 17 8 42 0 0 17
Klitvejen Pond 2 100 100 100 0 0 0 0 0 0 0 0 0
Tovsig Pond 3 100 67 33 100 0 0 0 0 0 0 0 0
2014 August-October
Location N Any bat Myotis Mdas Pnat Ppyg Ppip Eser Nnoc Vmur
Nyct/
Vmur Paur
Un-
ident.
Site 1 13 62 38 15 38 0 0 15 8 0 0 0 0
Site 3 13 62 46 23 23 0 8 38 8 8 0 0 8
Site 5 13 31 8 15 15 0 0 15 15 0 0 0 8
Site 6 13 62 38 23 38 0 0 8 15 0 0 0 0
Site 7 13 69 46 31 54 8 0 15 15 0 8 0 0
Abildhave Pond 13 100 100 100 69 8 0 8 0 0 0 0 8
Klastrup Pond 12 92 92 83 67 0 0 33 8 0 0 8 0
Stensig Pond 13 100 100 100 69 15 0 38 0 0 0 0 0
Klitvejen Pond - - - - - - - - - - - - -
Tovsig Pond 6 100 100 83 50 0 0 0 17 0 0 0 33

33
Bat activity The bat activity at the wind turbine monitoring sites was lower than at ponds in all years (Tab. 6) (Annex A1). Pond bats and Daubenton’s bats dominated the bats recorded at ponds. Bat activity was higher at the two southern turbine sites 6 and 7 surrounded by forest than at the other non-forested sites (Tab. 7). Overall, bat activity was significantly higher in 2013 than in 2011 and 2014, both at wind turbine and pond sites. Between-year differences in bat activity and between wind turbine sites and pond sites were also evident analysing Myotis-bats and Nathusius’ pipistrelles individually (Fig. 3).
Several pond bats were observed simultaneously foraging over the ponds during the manual monitoring sessions. Two and three individuals of Myotis-bats were also registered simultaneously on many of the recordings from the automatic bat detector. Pond bats, Daubenton’s bats and Nathusius’ bats were observed at the pond sites in the test centre area shortly after sunset on several nights. The early arrival of Myotis-bats at the ponds in the test centre area sug-gests that the bats commute directly to these ponds soon after emerging from their roosts in the evening. The individual bat optimizes its energy gain dur-ing the night by visiting several suitable foraging habitats sites, first visiting feeding habitats where they expect to find the most profitable food resources (Dietz et al. 2006, Encarnação et al. 2010). The optimal foraging habitats change during the summer, depending on the temporal variation in insect densities. The high activity levels of bats and early arrival at the small ponds in the plantation in and near the test centre show that the ponds represent important foraging sites for the local bat populations in late summer and au-tumn. To what extent the ponds are also important foraging sites for the bats in the spring and early summer is unknown.
Developing more wetlands near the wind turbines in the test centre area as described in the implementation plan for the test centre area, and construction of wind turbines near wetlands elsewhere, will inevitably increase the proba-bility that individual bats will encounter the turbines and/or explore the structures, thereby increasing the risk of bat fatalities.
Table 6. Differences between annual bat activity (least square mean estimates of call se-
quences per hour) at different monitoring types (turbine sites and ponds) at Østerild in Au-
gust-October.
Type & year
LS Mean
difference t value P
Turbine sites 2011 x Ponds 2011 -3.9428 -1.15 <.0001
Turbine sites 2013 x Ponds 2013 -3.9894 -1.63 <.0001
Turbine sites 2014 x Ponds 2014 -3.6584 -1.34 <.0001
Ponds 2011 x Ponds 2013 -1.0551 -4.15 <.0001
Ponds 2011 x Ponds 2014 -0.2074 -0.81 0.4193
Ponds 2013 x Ponds 2014 0.8477 3.64 <.0001
Turbine sites 2011 x Turbine sites 2013 -1.0086 -2.84 0.0048
Turbine sites 2011 x Turbine sites 2014 -0.4918 -1.34 0.1811
Turbine sites 2013 x Turbine sites 2014 0.5168 1.77 0.0772

34
Bat activity near turbine towers Myotis-bats and Nathusius’ pipistrelle were the most common species rec-orded during the studies of bat activity at different distances to the turbine towers and the meteorological mast (Annex A2). The most frequent species at the turbine tower sites was the Nathusius’ pipistrelle. The activity level near the turbine towers fluctuated from 0 to 35 call sequences per hour. On nights with most bat activity, levels were similar to activity levels recorded at the pond sites. Feeding buzzes of Nathusius’ pipistrelles were recorded near the turbine towers. Two individual Nathusius’ pipistrelles were observed forag-ing simultaneously near a wind turbine tower.
Overall, the bat activity was higher at turbine towers than at nearby forest edge sites, at the meteorological lattice mast and forest edges near the mast
Figure 3. Monthly variations in activity of Myotis bats (Pond bats and Daubenton’s bats) and Nathusis’ pipistrelles (least square mean and 95% confi-dence intervals) during a 4-hour period after sunset at forest roads/turbine sites (A) and ponds (B) in 2011, 2013 and 2014.
Table 7. Differences between bat activity (call sequences/hour) at the five wind turbine
sites at Østerild in August-October 2011-2014.
Locations LS Mean difference t value P
Site 1 x Site 3 -0.7476 -1.63 0.1052
Site 1 x Site 5 -0.2438 -0.49 0.6232
Site 1 x Site 6 -0.8778 -1.94 0.0536
Site 1 x Site 7 -1.1610 -2.61 0.0096
Site 3 x Site 5 0.5037 1.17 0.2430
Site 3 x Site 6 -0.1302 -0.34 0.7328
Site 3 x Site 7 -0.4134 -1.11 0.2663
Site 5 x Site 6 -0.6339 -1.5 0.1354
Site 5 x Site 7 -0.9172 -2.21 0.0279
Site 6 x Site 7 -0.2832 -0.78 0.4353

35
(Tab. 8). The difference between bat activity recorded at different distances to the turbine towers and between bat activity at the tower and the meteorolog-ical mast was only evident for the turbine tower at Site 6 (Tab. 8, Fig. 4).
Bat activity at the turbine towers was less in 2014 than in 2013 (Site 6: t = 2.63, P = 0.0124; Site 7: t = 2.15, P = 0.0383). There was higher bat activity at the tower at site 6 than at site 7 in both years (2013: t = 2.47, P = 0.0183; 2014: t = 2.60, P = 0.0133). Year was not included as an explanatory variable for the bat activity in the best fitting model at site 6 (inactive in 2014), thus the turbine tower was just as attractive to bats as a turbine supporting an active wind turbine.
Table 8. Differences of bat activity (least square mean estimates (LS Mean) of call se-
quences per hour) the first 4 hours after sunset at (A) different distances from wind tur-
bines and (B) at different distances to turbines and meteorological mast (B).
A /
Location Distances LS Mean difference t value P
Turbines 0m x 50m 1.5929 4.86 <.0001
0m x 150m 1.2683 4.06 <.0001
50m x 150m -0.3246 -0.89 0.371
Met. Mast 0m x 50m 0.5829 1.48 0.1388
0m x 150m -0.6539 -1.66 0.0967
50m x 150m -1.2368 -2.72 0.0065
Site 6 0m x 50m 2.3562 4.43 <.0001
0m x 150m 1.7253 3.62 0.0003
50m x 150m -0.6309 -1.09 0.2746
Site 7 0m x 50m 0.3838 1.09 0.2773
0m x 150m 0.1926 0.53 0.5932
50m x 150m -0.1912 -0.51 0.6121
B /
Distances LS Mean difference t value P
Turbines x Met. 0m 1.2684 3.12 0.0018 50m 0.1239 0.25 0.8022
150m -03731 -0.68 0.4956
Figure 4. Bat activity (least square mean and 95% confi-dence intervals) during the first 4 hours after sunset at different dis-tances from wind turbine towers and a meteorological mast during 17 nights in Aug.-Oct. 2013 and 2014.

36
The higher levels of bat activity around the turbine towers supports observa-tions that bats appear to be attracted to them and spend time to investigate and forage around the towers, increasing the risk of collisions with rotors, when the bats climb to such heights (Kunz et al. 2007; Arnett et al. 2011).
Insects on turbine towers and bat activity Lacewings (Chrysopa) were the most numerus genus sampled at both the tur-bine towers at Sites 6 and 7 (67% and 44%, respectively); mosquitos (Muscidae) being the second most important group. Insect density varied markedly noc-turnally and between sites. Average insect density was six times higher at the Site 6 turbine tower than at Site 7 (max nocturnal difference: 25) (Fig. 5, Tab. 9). The nocturnal density of insect varied 72- and 35-fold at the two turbine towers, primarily due to variations in lacewing numbers. The overall varia-tion in insect densities was positively correlated with the minimum tempera-ture during the 4-hour sampling period (Fig. 6).
Despite the small sample size, bat activity recorded at the wind turbine towers (0m) was positively significantly correlated with insect density on the turbine towers (Fig. 7). Nocturnal bat activity and insect densities were correlated with minimum temperatures. Insect density was also negatively correlated with wind speed. It should be noted we selectively surveyed nights when winds were calm.
Furthermore, we only considered insects that rested on the turbine towers. The majority of these, the lacewings, swarmed around and congregated on the turbine towers after sunset but other insect species might only swarm around the towers. These insects and diurnal species may also represent sig-nificant food resources for bats and attract the bats to the wind turbines (Ry-dell et al. 2016).
Table 9. Total number of insects collected on fly paper (total area: 24.8 m2) during 4 hour
periods starting at sunset at turbine towers on 13 nights.
Genus / Family Common name Site 6 Site 7
Chrysopa Lacewing 329 35 Tipulidae Crane flies 16 9
Culicidae Mosquitoes 66 18
Chironomidae Lake flies 11 2
Heterocera Moths 19 7
Muscidae Flies 34 7
Syrphidae Hoverflies 1 0
Ephemeroptera Mayflies 2 2
Coleoptera Beetles 13 0

37
Figure 5. Estimated density of in-sects (least square mean and 95% confidence intervals) at the two turbine towers on 10 nights in Aug.-Oct. 2014.
Table 10. Monthly differences in estimated insect densities (least square mean estimates)
at the two turbine towers on 10 nights in Aug.-Oct. 2014.
Month LS Mean difference t value P
Site 6 x Site 7 Aug 1.5535 2.38 0.0273
Sep 2.3723 3.16 0.0050
Oct 1.7148 2.16 0.0434
Figure 6. Relationship between insect densities (least square mean estimate) on turbine towers and minimum temperature during the first 4 hours after sunset in Aug.-Oct. 2014. Dotted lines indi-cate 95% confidence intervals on the LS mean estimate. Green dots are individual observations (N = 26).
Figure 7. Relationship between bat activity (least square mean estimate of call sequences per hour) and insect density during the first 4 hours after sunset in Aug.-Oct. 2014. Dotted lines indi-cate 95% confidence intervals on the LS mean estimate. Green dots are individual observations (N = 20).

38
Bats at nacelle height In 2013, none of the recordings from the nacelle at Sites 6 and 7 were triggered by bats, but were probably triggered by noise from the turbine. Noice from the turbines might have obscured the bat calls.
In 2014, Nathusius’ pipistrelles were recorded on four nights and noctules were recorded one night during 55 nights with recordings in September and October. Two Nathusius’ pipistrelles were recorded simultaneously on one night and on the recording of one call sequence of noctule, the bat was in the approach phase, i.e. homing in on an insect or flying close to the structure to examine it.
On those nights when bats were recorded at nacelle height wind speed in 10m height ranged between 1.6-7.3 m/s and the temperature ranged between 10-14 °C. At nacelle height the wind speeds would be higher and temperature would be lower. All bats were recorded at nacelle height more than two hours after sunset and more than two hours before sunrise. Thus, curtailment of the turbines only during the hours just after dusk and just before dawn and cur-tailment at wind speeds <5-6m/s and temperatures above 15 °C at nacelle height would not eliminate the risk of fatalities. A cut-in speed of 5-6 m/s is often suggested as a measure to mitigate bat fatalities at wind turbines (Arnett et al. 2011, Rodrigues et al. 2014, Møller et al. 2013). With the limited data from the present extensive study, we did not estimate the potential reduction in fatality rate under different curtailment scenarios.
Bat carcass searches No bats were recovered during the systematic searches in late spring (n=25), late summer (n=12) or autumn (n=40) during 2013-2015. Hence, it was not possible to statistically estimate total bat fatality rate at the wind turbines in Østerild. The search efficiency trial in 2013 showed that the tracker dogs found 82% of the test bat carcasses. This efficiency is comparable to other as-sessments of the use of dogs to recover bat fatalities at wind turbines at sites with high to medium visibility, i.e. sites where the vegetation is <50 cm high (Arnett 2006, Mathews et al. 2013).
However, two dead Nathusius’ pipistrelles were coincidentally found next to the wind turbine at site 7 on 4 September 2014 (Fig. 8). Based on the degree of decomposition of the two bats, one was killed the previous night; the other was desiccated and presumably killed some days earlier. Weather on the pre-vious night had been relatively warm (14-17°C) with calm south-westerly winds (1.5-2.0m/s in 10m height). No carcasses were recorded in 2013, when the general study activity was lower. No turbine was in operation at site 6 in 2014.
Although the bat fatalities are very rare events, the average of one Nathusius’ pipistrelle as recorded at site 7 per year is higher than the modelled average mortality per turbine per year that can cause significant declines in bat popu-lations when the cumulative effects of wind turbines are considered (Rydell et al. 2011).
The freshly killed bat had no apparent fractures to the major bones (Fig. 8). The majority of bats killed at wind turbines have severe physical trauma re-sulting from direct collisions by the turbine wings, but some bats die from

39
barotrauma (Baerwald et al. 2008, Grodsky et al. 2011, Rollins et al. 2012). Ba-rotrauma is caused by swift changes in air pressure around a turbine blade which may cause fatal damages to the bats’ lungs and ears. Either way, the fatal effect of the wind turbines has the same effect on the conservation status of the bat populations. To what extent sub-lethal barotrauma affects the sur-vival probability of bats is unknown, but would only increase the detrimental impacts of wind turbines on bat populations.
Figure 8. Two dead Nathusius’ pipistrelles were coincidentally recorded at Site 7 in 2014. When considering the cumulative ef-fects of wind turbines a figure of less than one bat per turbine per year may cause a significant de-cline in a bat population (Rydell et al. 2011).

40
Conclusions and perspectives
Overall, the habitat changes and operation of wind turbines in the test centre area in Østerild seem not to have altered species composition and diversity of bat species present. The higher diversity recorded in the area compared to prior information on bat occurrence, is probably just a result of a systematic survey effort.
The increased bat activity from the baseline survey in 2011 to 2013 at the tur-bine sites might be the result of improved access to the previously closed co-niferous plantation in the test centre area via access roads and turbine sites, which may function as commuting routes and create undesirable potential foraging habitats in proximity to the wind turbines. Whether the drop in bat activity from 2013 to 2014 was a result of increased mortality, disturbance, natural annual fluctuations of bat populations and activity in the study area cannot be determined as no survey data from other studies were available for comparison.
No fatalities were detected during the systematic carcass searches, so it was not possible to estimate fatality rates associated with turbines. For this rea-son, the overall number of bat fatalities will probably be low even when the test centre is fully developed. However, we cannot conclude that the wind turbines at the test centre have no significant adverse effects on local or na-tional bat populations, as we do not know the actual fatality rates or the population sizes and dynamics of the potentially affected species. The two coincidentally recorded fatalities of Nathusius’ pipistrelles at the site exceed the critical average level for bat fatalities per turbine per year that has been suggested from population models when considering the cumulative effects of all the wind turbines on a national level (Rydell et al. 2011). While this threshold is based on German mortality rates for Swedish bat populations, it cannot be excluded that the mortality of even a few individuals from small local populations in Østerild may have detrimental effects on their status.
Due to the nature of bat population dynamics and the spatial scale of their exploitation of habitats, presence-absence surveys are unsuitable to monitor the effects of wind turbines on bats on local, national and international levels. Reduction in species presence may not be detectable before the different bat populations have declined substantially.
The studies in Østerild on bats behaviour around wind turbines show that:
• Wind turbines in forest are likely to be more of a threat to bat populations than turbines in open unfavourable bat habitats. Fatalities may even reach critical levels at wind turbines in conifer plantations in regions with a gen-eral low density of bats (Rydell et al. 2011).
• Bats activity is elevated around wind turbines compared to the activity de-tected at distances up to 150m in bat habitats and flight routes.
• Bat activity was correlated to insect aggregations on the turbine towers. Sampling of insects settling on the turbine towers suggest aggregations in their vicinity, which appear to attract actively foraging bats and put them at greater risk of collisions.

41
• The spatial and temporal variability of bat activity is high at a site. Several survey sessions from spring to autumn are needed in pre- and post-con-struction surveys to assess species presence, activity levels and mortality risk at a site.
• There were between year temporal variations in bat activity at a site, thus more years are needed for pre- and post-construction surveys, e.g. mini-mum 3 years, to assess variation in species presence, activity levels and mortality risk at a site. Post-construction monitoring of bat activity and carcass searches for only one year at wind turbines is inadequate to collect reliable information to assess mitigation needs and effectiveness.
• Continuous measurement of bat activity with ultrasound detectors at rotor height and at ground level seems to be a more effective method than car-cass surveys to monitor and assess mortality risk.
• There can be significant differences in bat activity and insect aggregation at neighboring sites in a wind turbine farm. Thus, pre- and post-construc-tion monitoring of bat activity must be performed at several - preferably all turbine sites - in a wind farm.
• Curtailment of turbine operation during a few hours at dusk and dawn and at wind speeds < 6m/s does not eliminate mortality risk. High densi-ties of insects may aggregate on the turbine towers and bats can be active near the turbines throughout the night.
While revealing many general aspects of bats’ behaviour around wind tur-bines, the conclusions from the studies in Østerild regarding bat activity lev-els and mortality rates at turbines cannot be extrapolated to other forest types, landscapes and areas and certainly not for those with a richer bat fauna. Fur-thermore, the conclusions should not be regarded as representative of the threat posed by wind turbines to effective bat conservation during the spring and early summer periods. Parallel studies should be carried out on wind tur-bines in landscapes with different habitat characteristics (e.g. other forest types, mosaic structures and topography), and in areas with higher levels of bat activity and of greater species richness to estimate bat fatalities due to wind turbines. Bat activity and fatalities should be studied at a wider size range of wind turbines to estimate the potential relationship to turbine size. More intensive studies are also needed to develop evidence-based quantita-tive management tools to assess mortality risk and other detrimental effects on local and national bat populations by wind turbines and future develop-ment of ecological sustainable wind energy facilities.

42
References
Ahlén I 2002. Fladdermöss och fåglar dödade av vindkraftverk. - Fauna och flora 97: 14–22.
Ahlén I 2010. Vindkraft kräver hänsyn till fauna och känslig natur. - Kungliga Skogs- och Lantbruksakademiens Tidskrift 3: 22-27.
Ahlén I & Baagøe HJ 1999. Use of ultrasound detectors for bat studies in Eu-rope. Experiences from field identification, surveys and monitoring. - Acta Chiropterologica 1: 137-150.
Ahlén I, Bach L, Baagøe HJ & Pettersson J 2007. Bats and offshore wind tur-bines studied in southern Scandinavia. - Naturvårdsverket, Stockholm, Rap-port 5571.
Altringham JD 2011. Bats: from evolution to conservation. Oxford University Press, Oxford.
Arnett EB 2006. A preliminary evaluation on the use of dogs to recover bat fatalities at wind energy facilities. - Wildlife Society Bulletin 34: 1440-1445.
Arnett EB, Brown K, Erickson WP, Fiedler J, Henry TH, Johnson GD, Kerns J, Kolford RR, Nicholson CP, O’Connell T, Piorkowski M & Tankersly JR 2008. Patterns of fatality of bats at wind energy facilities in North America. - Journal of Wildlife Management 72: 61–78.
Arnett EB, Huso MMP, Schirmacher MR, Hayes JP 2011. Altering turbine speed reduces bat mortality at wind-energy facilities. - Frontiers in Ecology and the Environment 9: 209-214.
Baagøe HJ 2007a. Damflagermus Myotis dasycneme (Boie, 1825). - In: Baagøe HJ & Jensen TS (eds.): Dansk Pattedyratlas. - Gyldendal. 50-55.
Baagøe HJ 2007b. Vandflagermus Myotis daubentonii (Kuhl, 1817). - In: Baagøe HJ & Jensen TS (eds.): Dansk Pattedyratlas. - Gyldendal. 56-59.
Baagøe HJ 2007c. Troldflagermus Pipistrellus nathusii (Keyserling & Blasius, 1839). - In: Baagøe HJ & Jensen TS (eds.): Dansk Pattedyratlas. - Gyldendal. 66-69.
Baagøe HJ 2007d. Dværgflagermus Pipistrellus pygmaeus (Leach, 1825). - In: Baagøe HJ & Jensen TS (eds.): Dansk Pattedyratlas. - Gyldendal. 70-73.
Baagøe HJ 2007e. Pipistrelflagermus Pipistrellus pipistrellus sensu stricto (Schreber, 1774). - In: Baagøe HJ & Jensen TS (eds.): Dansk Pattedyratlas. - Gyldendal. 74-75.
Baagøe HJ 2007f. Brunflagermus Nyctalus noctula (Schreber, 1774). - In: Baagøe HJ & Jensen TS (eds.): Dansk Pattedyratlas. - Gyldendal. 78-81.
Baagøe HJ 2007g. Sydflagermus Eptesicus serotinus (Schreber, 1774). - In: Baagøe HJ & Jensen TS (eds.): Dansk Pattedyratlas. - Gyldendal. 84-87.

43
Baagøe HJ 2007h. Skimmelflagermus Vespertilio murinus Linnaeus, 1758. - In: Baagøe HJ & Jensen TS (eds.): Dansk Pattedyratlas. - Gyldendal. 88-91.
Baagøe HJ 2007i. Langøret flagermus Plecotus auritus (Linnaeus, 1758). - In: Baagøe HJ & Jensen TS (eds.): Dansk Pattedyratlas. - Gyldendal. 96-99.
Baagøe HJ & Ahlén I 2001. Dværgflagermusen opsplittes i to arter. – Flora og Fauna 107: 47-52.
Baagøe HJ & Jensen TS (eds.) 2007. Dansk pattedyratlas. - Gyldendal, Køben-havn.
Baerwald EF, D’Amours GH, Klug BJ & Barclay RMR 2008. Barotrauma is a sig-nificant cause of bat fatalities at wind turbines. - Current Biology 18: 695-696.
Baerwald, EF & Barclay RMR 2009. Geographic variation in activity and fatal-ity of migratory bats at wind energy facilities. - Journal of Mammalogy 90: 1341-1349.
Barclay RMR, Baerwald EF & Gruver JC 2007. Variation in bird and bat fatal-ities at wind energy facilities: assessing the effects of rotor size and tower height. - Canadian Journal of Zoology 85: 381-387.
Brandt J, Christensen JH, Frohn LM, Palmgren F, Berkowicz R & Zlatev Z 2001. Operational air pollution forecasts from European to local scale. Atmos-pheric Environment 35, Suppl. 1, S91-S98.
Brinkmann R, Schauer-Weisshahn H & Bontadina F 2006. Untersuchungen zu möglichen betriebsbedingten Auswirkungen von Windkraftanlagen auf Fle-dermäuse im Regierungsbezirk Freiburg. - Report to Regierungspräsidium Freiburg - Referat 56 Naturschutz und Landschaftspflege.
Burnham KP, Anderson DR & Huyvaert KP 2011. AIC model selection and multimodel inference in behavioral ecology: some background, observations, and comparisons. – Behavioral Ecology and Sociobiology 65: 23-35.
Chauvenet ALM, Hutson AM, Smith GC & Aegerter JN 2014. Demographic variation in the U.K. serotine bat: filling gaps in knowledge for management. Ecology and Evolution 4: 3820-3829.
Dietz M, Encarnação JA & Kalko EKV 2006. Small scale distribution patterns of female and male Daubenton’s bats (Myotis daubentonii). - Acta Chiroptero-logica 8: 403-415.
Dulac P 2008. Evaluation de l’impact du parc éolien de Bouin (Vendeé) sur l’avifaune et les chauves-souris. Bilan de 5 années de suivi. Ligue pour la Pro-tection des Oiseaux delegation Vendeé/ADEME Pays de la Loire, Nantes.
Dürr T 2009. Fledermausverluste an Windenergieanlagen. Daten aus der zen-tralen Fundkartei der Staatlichen Vogelschutzwarte im Landesumweltamt Brandenburg.
Elmeros M, Hansen TS, Baagøe HJ & Teilmann J 2010. Pattedyr. – In: Wind, P. & Pihl, S. (eds.). Den danske rødliste. - http://www.dmu.dk/dyrplanter/redlistframe/

44
Elmeros M, Møller JD & Baagøe HJ 2012. Baseline investigations of bats at Wind Turbine Test Centre Østerild 2011. – In: Therkildsen OR, Elmeros M, Kahlert J & Desholm M (eds.). Baseline investigations of bats and birds at Wind Turbine Test Centre Østerild. - Scientific report from Department of Bioscience and DCE - Danish Centre for Environment and Energy, Aarhus University, no. 28.
Elmeros M, Møller JD & Baagøe HJ 2015. Bat studies at Wind Turbine Test Cen-tre Østerild, 2013. – In: Therkildsen OR & Elmeros M (eds.). First year post-con-struction monitoring of bats and birds at Wind Turbine Test Centre Østerild. Scientific report from Department of Bioscience and DCE - Danish Centre for Environment and Energy, Aarhus University, no. 133.
Ecarnação JA, Becker NI & Ekschmitt K 2010. When do Daubenton’s bats (My-otis daubentonii) fly far for dinner? - Canadian Journal of Zoology 88: 1192-1202.
European Commission 1992. Council Directive 92/43/EEC of 21 May 1992 on the conservation of natural habitats and of wild fauna and flora. - Brussels, Belgium.
Fredshavn J, Søgaard B, Nygaard B, Johansson LS, Wiberg-Larsen P, Dahl K, Sveegaard S, Galatius A & Teilmann J 2014. Bevaringsstatus for naturtyper og arter. Habitatdirektivets Artikel 17 rapportering. - Aarhus University. Tech-nical report from DCE – - Danish Centre for Environment and Energy, Aarhus University, no. 98.
Grodsky SA, Behr MJ, Gendler A, Drake D, Dieterle BD, Rudd RJ & Walrath NL 2011. Investigating the causes of death for wind turbine-associated bat fa-talities. - Journal of Mammalogy 92: 917-925.
Horn JW, Kunz TH & Arnett EB 2008. Behavioral responses of bats to operat-ing wind turbines. - Journal of Wildlife Management 72: 123-132.
Huso MMP, Dalthorp D, Dail D & Madsen L 2015. Estimating wind-turbine-caused bird and bat fatality when zero carcasses are observed. - Ecological Applications 25: 1213-1225.
Hötker H 2006. The impact of repowering of wind farms on birds and bats. - Michael-Otto-Institute im NABU, Landesamt für Natur und Umwelt des landes Schleswig-Holstein, Bergenhusen.
Iuell B 2013. CWE Conference Summary’, Conference on Wind Power and Environmental Impacts, Stockholm 5-7 February.
Johnson GD, Erickson WP & Strickland MD 2003. Mortality of bats at a large-scale wind power development at Buffalo Ridge, Minnesota. - American Mid-land Naturalist 150, 332-342.
Kerns J & Kerlinger P 2004. A study of bird and bat collision fatalities at the Mountaineer Wind Energy center, Tucker County, West Virginia. - Annual report to FPL Energy and Mountaineer Wind Energy Center Technical Re-view Committee.

45
Kunz TH, Arnett EB, Erickson WP, Hoar AR, Johnson GD, Larkin RP, Strick-land MD, Thresher RW & Tuttle MD 2007. Ecological impacts of wind energy development on bats: questions, research needs, and hypotheses. - Frontiers in Ecology and the Environment 5: 315-324.
Long CV, Flint JA & Lepper PA 2009. Wind turbines and bat mortality: Inter-actions of bat echolocation pulses with moving turbine rotor. - Proceedings of the Institute of Acoustics 31: 185-192.
Long CV, Flint JA & Lepper PA 2010. Wind turbines and bat mortality: Dop-pler shift profiles and ultrasonic bat-like pulse reflection from moving turbine blades. - Journal of the Acoustical Society of America 128: 2238–2245
Mathews F, Swindells M, Goodhead R, August TA, Hardman P, Linton DM & Hosken DJ 2013. Effectiveness of search dogs compared with human ob-serves in locating bat carcasses at wind-turbine sites: A blinded randomized trial. - Wildlife Society Bulletin 37: 34-40.
Mathews F, Richardson S, Lintott P & Hosken D 2016. Understanding the risk to European protected species (bats) at onshore wind turbine sites to inform risk management. - Scientific report from University of Exeter for DEFRA.
Møller JD, Baagøe HJ, Degn HJ & Krabbe E 2013. Forvaltningsplan for flager-mus. Beskyttelse og forvaltning af de 17 danske flagermus-arter og deres le-vesteder. - Miljøministeriet, Naturstyrelsen.
Nickovic S, Mihailovic D, Rajkovic B & Papadopoulos A 1998. The weather forecasting system SKIRON, Vol. II, description of the model, Athens.
Rodrigues L, Bach L, Dubourg-Savage MJ, Goodwin J & Harbusch C 2014. Guidelines for consideration of bats in wind farm projects. - EUROBATS Pub-lication Series No. 6. UNEP/EUROBATS Secretariat, Bonn.
Rollins KE, Meyerholz DK, Johnson GD, Capparella AP & Loew SS 2012. A forensic investigation into the etiology of bat mortality at a wind farm: ba-rotrauma or traumatic injury? - Veterinary Pathology 49: 362-371.
Rydell J, Bach L, Dubourg-Savage M-J, Green M, Rodrigues L & Hedeström A 2010. Mortality of bats at wind turbines links to nocturnal insect migration? - European Journal of Wildlife Research.56: 823-827.
Rydell J, Engström H, Hedenström A, Larsen JK, Pettersson J & Green M 2011. Vindkraftens påverkan på fåglar och fladdermöss – Syntesrapport. - Natur-vårdsverket, Rapport 6467.
Rydell J, Bogdanowicz W, Boonman A, Pettersson S, Suchecka E & Pomorski JJ 2016. Bats may eat diurnal flies that rest on wind turbines. - Mammalian Biology 81: 331-339.
Schorcht W, Bontadina F & Schaub M 2009. Variation of adult survival drives population dynamics in a migrating forest bat. - Journal of Animal Ecology 78: 1182–1190.
Seiche K 2008. Fledermäuse und Windenergieanlagen in Sachsen 2006. Report to Freistaat Sachsen. Landesamt für Umwelt und Geologie. http://www.smul.sachsen.de/lfug

46
Sendor T & Simon M 2003. Population dynamics of the pipistrelle bat: effects of sex, age and winter weather on seasonal survival. - Journal of Animal Ecol-ogy 72: 308–320.
Steffens R, Zöphel U & Brockmann D 2004. 40th anniversary bat marking cen-tre Dresden – Evaluation of methods and overview of results. – Säschsisches Landesamt für Umvelt und Geologie.
Søgaard B & Baagøe HJ 2012. Overvågning af flagermus Chiroptera sp. - Teknisk anvisning fra Fagdatacenter for Biodiversitet og Terrestrisk Natur, TA-A04-2.
Traxler A, Wegleitner S & Jaklitsch H (2004). Vogelschlag, Meideverhalten & Habitatnutzung an bestehenden Windkraftanlagen Prellenkirchen - Obers-dorf – Steinberg/Prinzendorf. - Report by Büro für Biologie, Ökologie und Naturschutzforschung for WWS Ökoenergie, WEB Windenergie, evn Naturkraft, IG Windkraft und dem Amt der Niederösterreischen Landesre-gierung.

47
Part B: Birds
Second year post-construction monitoring of birds at Wind Turbine Test Centre Østerild
Ole Roland Therkildsen1, Thorsten Johannes Skovbjerg Balsby1, Rasmus Due Nielsen1, Lars Haugaard1 & Jørgen Peter Kjeldsen2
1Department of Bioscience, Aarhus University 2Ornit.dk
Photo: Kristian Brink Laulund.

[Blank page]

49
Introduction
In June 2010, the Danish Parliament passed a Public Works Act to establish a national test centre for wind turbines near Østerild in Thy, Denmark. This legislation requires that an environmental monitoring programme should be implemented.
Since 2011, the technical facilities at the test centre have gradually been devel-oped and various structures erected on site. The test centre comprises a total of seven test sites for wind turbines of up to a maximum height of 250 m. Each test site consists of a single wind turbine, each with a mast for measuring equipment (up to 150 m in height) located immediately to the west of each turbine.
The test centre also comprises two masts supporting meteorological equip-ment at heights up to 250 m secured with guy-wires. These masts are also used for aviation safety lighting.
The Department of Bioscience at Aarhus University was commissioned by the Danish Nature Agency to undertake a monitoring programme of birds in the test area. The monitoring programme comprises one baseline (2011/12) and two post-construction study periods (2013/14 and 2015/16).
In 2012 we presented the results of the baseline monitoring programme, which was undertaken to establish a baseline reference for the future analysis of the potential impacts on birds caused by the operation of the test centre and to provide a preliminary risk assessment for relevant species (Therkildsen et al. 2012).
On the basis of this preliminary assessment, which generated crude estimates of collision risk, we considered the potential impacts of the combined struc-tures on the bird species occurring in the study area were unlikely to be sig-nificant.
In 2015 we presented the results from the first year of the post-construction monitoring programme together with an intermediate assessment of the po-tential impacts of the test centre on the bird populations occurring in the study area (Therkildsen & Elmeros 2015).
At that time, the facilities at the test centre had not yet been fully developed and therefore the assessment considered a situation where around half of the planned wind turbines were in operation, although all of the masts had been constructed when the first post-construction study year was initiated.
Here we present the results from the second year of the post-construction monitoring programme, which was carried out from August 2015 until Au-gust 2016, together with a final assessment of the potential impacts of the test centre on the bird populations occurring in the study area. During the second year post-construction study period the test centre reached full capacity with 7 wind turbines in operation.

50
Methods
Wind Turbine Test Centre Østerild
Turbines
The test centre is located in the Østerild Plantation in northwest Jutland, Den-mark, and comprises seven north-south orientated sites on which turbines can be erected (Fig. 1). The average distance between sites is 600 m. A maximum of seven turbines may be in operation at the same time. The centre is allowed to erect turbines that reach an altitude up to 250 m at the upper wing tip, with rotor diameters of up to 220 m.
Figure 1. Wind Turbine Test Centre Østerild showing positions of wind turbines, associated structures, observation station and visual transects used for the data collection.

51
During the second year post-construction study period from August 2015 un-til August 2016 the test centre reached full capacity. The following configura-tion of turbines was in place at the time of the assessment:
Site 1: EDF Enérgies Nouvelles Haliade 150-6.0 Site 2: Vestas Wind Systems V164-8.0 Site 3: Vestas Wind Systems V126-3.3 Site 4: Vestas Wind Systems V110-2.0 Site 5: Energy Vision EN120-3.0 Site 6: Siemens Wind Power SWT 7.0-154 Site 7: Siemens Wind Power SWT 7.0-154
Associated structures
A total of eight masts supporting meteorological measuring equipment for the turbines were constructed at the test centre (Fig. 1). The triangular lattice masts were 1.20 m wide on each side and of a variable height between 100 and 150 m. The pipes that make up the lattice structure have a diameter of 168 mm at the corners. The angled pipes that make up the lattice are 38 mm in diame-ter. The measuring masts are each secured with a number of guy-wires. Each set comprise up to nine guy-wires, dependent on the height of the mast. The cross sectional diameter of the guy-wires is 25 mm and they are anchored at different heights.
Masts supporting meteorological measuring equipment and aviation lights (hereafter “light masts”) are placed 360 m NW of the northernmost and 360 m SW of the southernmost turbine site, reaching a height of 250 m (Fig. 2). The pipes and guy-wires are the same type as those used for the measurement masts. Each of the three guy-wire sets includes seven individual guy-wires.
Lighting
Turbines and measuring masts have no lighting, whereas on each aviation mast there is a set of three strobe lights (covering 360°) at 90 m, 170 m and 250 m. The lights flash synchronously once a second (1 Hz). Intensity of lighting is variable: 200,000 Cd at daytime, 20,000 at dusk and 2,000 at night-time.
Figure 2. The seven wind tur-bines and four of the measuring masts seen from the northern part of the study area. © Jørgen Peter Kjeldsen.

52
Conservation issues In general, collisions between birds and land-based wind turbines are ex-pected to be most likely related to the following situations:
• During seasonal migration, where birds migrate over longer distances be-tween breeding and wintering areas
• During local movements, where birds perform daily movements of shorter distance between feeding and roost sites
• When birds are disturbed by human activity • When birds are attracted to wind turbines • When birds undertake aerial pursuit of prey or are pursued by birds of prey.
The collision risk depends on numerous factors such as location and lay-out of the wind farm, size of turbines, landscape features, behaviour and mor-phology of the species and weather conditions.
Throughout the annual cycle large numbers of birds occur along the west coast of Jutland. In particular, the wetlands along the west coast are important breeding, staging and wintering areas for numerous species. During the mi-gration periods in autumn and spring many species stage in the area for shorter or longer periods, whereas other species arrive in autumn and over-winter in the area until they return to the breeding areas in spring. The diverse range of species occurring along the west coast can be characterised by their different migration patterns. In general, the west coast forms a guide route for migration with waterbirds more likely to migrate over water, whereas land birds are more likely to migrate over land. Many waterbirds (e.g. geese, swans (Fig. 3) and some landbirds (e.g. birds of prey, cranes) migrate during the day.
The baseline investigations confirmed that the test centre is not situated on a migration corridor, which is a result of the lack of topographical features to concentrate avian migration. Therefore daytime local movements accounts for more passages of birds at rotor height within the area than genuine seasonal migration. This means that regular daily movements between roosts and feed-ing sites by local birds are more important in relation to collision risk com-pared to annual movements undertaken by genuine migrants. Nevertheless, the design of the monitoring programme allows for an assessment of the col-lision risk associated with both types of migration/movement.
Figure 3. Whooper swans pass-ing the study area with a wind tur-bine in the background. © Jørgen Peter Kjeldsen.

53
Other species, especially smaller landbirds (e.g. warblers, thrushes) perform nocturnal migration. Little is known about the migration that occurs over land at the test centre. However, in contrast to the well-known Danish migratory hotspots at Blåvand (autumn) and Skagen (spring), which represent geo-physical features known to concentrate migratory birds and form geographic bottlenecks for avian migration, real migrants were not expected to be con-centrated at the test centre to any large extent. However, since collision risk may be elevated during periods of darkness, nocturnal migration in the area was included as a focal issue in the baseline programme. Our investigations showed that genuine nocturnal migration occurred in the study area, alt-hough the patterns indicated that the test centre is not situated on a migration corridor. The pattern of nocturnal migration merely suggested a broad-fronted movement of passerines, the magnitude of which was outnumbered by the activity of local birds around dusk. Since broad-fronted nocturnally migrating passerines are suggested to present a relatively low risk of collision (Desholm 2006), we assumed that this was also the case in the Østerild area.
Data on nocturnal migration were collected during the peak migration peri-ods in autumn 2015 and spring 2016. A final assessment of the potential im-pact of the combined structures of test centre on nocturnal migrants will be presented in an updated version of this report.
The test centre is located near several Special Protection Areas (SPAs), which are sites designated for their particular importance for birds. These SPAs have been classified for rare and vulnerable breeding birds (as listed on Annex I of the EC Birds Directive) as well as for regularly occurring migratory species according to Article 4.2 of the EC Birds Directive and generally following the criteria for designation of wetlands of international importance. As result of their high conservation interest we have focused attention on this group of species in both the baseline and post-construction studies.
Focal species Initially, whooper swan, taiga bean goose, pink-footed goose and common crane, were included in the baseline investigations. However, based on the results obtained during the baseline studies, white-tailed eagle and light-bel-lied brent goose were also included as focal species in the post-construction programme.
These six species share some of the following characteristics, which are rele-vant when assessing the potential impacts of increased mortality as a result of collisions with wind turbines:
• They are long-lived and slowly reproducing and therefore relatively more sensitive to added mortality
• They are relatively large birds with poor manoeuvrability • Most of them perform daily local movements between roosts and feeding
areas in the immediate area • Little is known about their local movements in the area.
Several pairs of nightjar breed in or adjacent to the study area. Nightjar was therefore identified as another focal species, which is also listed on Annex I of the EC Birds Directive.

54
Whooper swan
North Jutland is an important wintering area for the Scandinavian and Ice-landic breeding population of whooper swans. The flocks arrive in late Octo-ber and numbers build up until midwinter, when peak numbers are reached. The whooper swans may leave the area during cold spells. The flocks leave the area in late March.
Taiga bean goose
A small, isolated population of taiga bean goose numbering around 3,000 in-dividuals, winters in Great Britain and western Denmark, part of which win-ters in Thy and Vejlerne. Denmark has a special responsibility to protect the population and a complete hunting ban has been introduced in north Jutland. Highest numbers of taiga bean geese occur in northwest Jutland in December-January, when some continue to Britain, although smaller numbers are pre-sent in the area until the birds leave the country to return to their breeding areas in April.
Pink-footed goose
Northwest Jutland, in particular Vejlerne, constitutes an important area for pink-footed geese, which arrive from the breeding grounds in late September. In midwinter, particularly during cold spells, the flocks move further south along the west coast. Numbers build up in spring until the flocks leave the area in April. The flocks perform daily movements between for example the SPAs in Vejlerne and nearby feeding areas in the farmland.
Common crane
Thy and Han Herred, including Vejlerne, constitute an important area for common cranes (Fig. 4), which typically occur in the area from March until late November. In 2011, 31-35 pairs were breeding in Thy and Han Herred of which 6 pairs were found in Vejlerne (Kjeldsen & Nielsen 2011, Nyegaard 2012). In 2013, this number had increased to 11 pairs (Kjeldsen & Nielsen 2014)). From late August until late October a major aggregation occurs at
Figure 4. Common cranes occur regularly in the study area. © Jørgen Peter Kjeldsen.

55
Vejlerne (Kahlert et al. 2010). Little is known about the local movements be-tween areas in the eastern part of Thy, where the test centre is situated.
Light-bellied brent goose
Denmark is the most important wintering site for the East Atlantic (Svalbard) flyway population of the light-bellied brent goose, which breeds in the eastern and northern parts of Svalbard and to a lesser extent in northeast Greenland. In spring, the whole population assembles at a few staging sites in north-west Denmark. In May 2011smaller flocks of light-bellied brent geese migrated northwards within 2000 m of the test centre. The observation coincided with the northbound mass departure, which normally takes place under favoura-ble wind conditions in late May (e.g. tail-winds from a southerly direction) (Clausen et al. 2003). Therefore, given the high conservation status of this population, light-bellied brent goose was included as a focal species in the post construction programme and as was the case in spring 2014, intense field work was carried out at the time of the expected mass departure of light-bel-lied brent geese in spring 2016.
White-tailed eagle
During the baseline studies a white-tailed eagle was observed in the study area on one occasion. Therefore this species was not subject to further analy-sis. However, on the basis of the presence of a potential breeding pair in the vicinity of the test centre, white-tailed eagle was included as a focal species in case it occurred more often than expected in the study area. Indeed, regular observations of a pair of white-tailed eagles were made in the study area dur-ing both first and second year post-construction study periods.
Nightjar
No attempt was made to collect data on nightjars during the baseline pro-gramme, whereas in the first year post-construction study, we registered ad-vertising males of nightjars in the central part of the study area to support a preliminary assessment of the potential impact of the test centre on this local breeding population.
Insects attracted to wind turbines present a foraging opportunity to nightjars, and therefore this is likely to increase the time spent in the vicinity of the tur-bine mast and rotor blades, which in turn increases the risk of collisions. Dur-ing the second year post-construction study we therefore used miniature GPS data loggers to track movements of individual nightjars to investigate the ex-tent to which they forage in the proximity of wind turbines in the study area.
Field work took place from June 22-July 21 2015 in the northern part of the study area, where nightjar territories had been registered during the first year post-construction study. Once located, advertising birds were captured using mist-nets and playback of song, wing-clapping and flight-calls. PinPoint-50 tags (weight 2 g) were mounted using a ‘back-pack’ harness design with two wing loops. All birds were fitted with an individually numbered metal tarsus ring. Tags were programmed to begin collecting data on the following night at 22 hrs. From 22:00-04:00 (active period) positions were collected at 3 minute intervals, whereas from 06:00-20:00 (day-roost) positions were collected for every 2 hours. Recapture was attempted after four days, when the maximum capacity of the tag memory had been attained.

56
Study design Apart from minor modifications and special efforts targeted towards specific focal species, the design of the post-construction programme was similar to the baseline programme, which aimed at generating species-specific data, whenever this was technically possible. For this reason, although data were partly collated from comprehensive automated recording processes, the col-lection of high quality and high resolution data was given priority at all times in the investigations and especially species-specific during both the baseline and the post-construction studies. We used visual transect counts and laser range finder data, which in combination provided the basic information for the ornithological assessment.
We used established methodologies to secure relevant high quality data to address the specific questions concerning birds. At the same time, we made sure that the methodologies used were accurate and reproducible, which en-sured that post-construction and baseline data were compatible providing a reference for the final assessment of the potential impacts of the test centre on each of the bird species in question.
As mentioned above we focused on obtaining data to support the assessment of potential impacts of the test centre and the associated structures on bird species of high conservation interest, i.e. bird species listed on Annex 1 of the EU Birds Directive and other regularly occurring migratory species.
Visual transect counts
Visual counts have the advantage of providing a detailed quantitative species-specific description of bird migration during daytime. Throughout the study period, visual counts were carried out from a central observation station, along transects orientated in southerly and northerly directions situated be-tween the turbine sites and measuring masts (see Fig. 1).
The aims of the surveys were:
• To provide data for the species-specific description of migration intensity of birds, which were incorporated in the first preliminary estimation and assessment of the avian risk of collision with turbines.
• To provide a species-specific description of the migration intensity at the lo-cation of the structures in the study area, in order to determine and describe species-specific behavioural responses to the presence of the structures.
In addition to the focal species initially included in the baseline programme, this method also ensured that data were obtained for all other species present in the area. On each transect all birds were counted during an observation period of exactly 15 minutes (Tab. 1). Subsequently, numbers were extrapo-lated to express a calculated number of passages for each time period (see Appendix B2 for details). Observations were gathered using binoculars and telescopes.
The species-specific data on birds crossing the transects during 15-minute pe-riods were combined with weather data, and the effects on avian numbers and movements of wind direction (SW, NW, SE and NE), wind speed, tem-perature, time of the day and month were analysed for selected species, using general linear models.

57
For each species a substantial proportion of the transect counts resulted in zero counts for some or all species. A linear model that accounts for excessive numbers of zero-counts comprises two components: 1) A logistic component that investigates the presence or absence of birds in relation to factors and 2) a component that takes into account the numerical response to the factors in the model. So to analyse the effect of temperature, wind direction and wind speed, we used a generalized linear model with a zero-inflated Poisson distri-bution. The zero-inflated model was used because the data set had an excess of zeros as most species only occurred in certain months. Month was used for the zero model, whereas the effect of wind direction and wind speed were modeled with a Possion distribution. We used proc genmod in SAS 9.3 to test the model.
The model could only converge for six species. The species for which the model could not converge could also not converge with simpler models where one of the wind parameters or temperature had been omitted. The lack of model convergence suggest that wind direction and wind speed had lim-ited effect on the number of individuals that passed transects.
Laser range finder
A laser range finder (Vectronix, Vector 21 Aero ®) is an optical device that can instantaneously measure flight altitude, distance and angle to flying birds (distance capability: 12 km, range accuracy: ± 5 m, horizontal accuracy: 10 mils, elevation range: -30 to 90° (zenith); source: Vectronix AG, Switzerland). Sequential measurements of the same bird/flock returned the exact geo-graphical location of each measurement, which can then be connected by lines to provide a three-dimensional mapping of the flight paths of birds. The de-vice is hand-held and therefore data can be collected in all directions in con-trast to a vertically operated radar unit that can only cover avian movements in airspace in two dimensions, unless the position of the entire antenna unit is re-orientated (e.g. horizontal to vertical mounting). Hence, a laser range finder is a very flexible and efficient device for gathering data on species-spe-cific flight altitudes of the visible migration during daytime. Measurements of large birds or flocks e.g. cranes, geese and swans can be obtained at distances up to 3 to 4 km, while passerines can only be tracked at ranges of up to ca. 1,200 m. Thus, the limitations of the device relate to the reduced efficiency of the human observer to detect small birds at long distance and at high altitude. The laser range finder was therefore primarily expected to provide data on local movements of large birds (e.g. between foraging areas). However, the study area does not represent a daytime migration hot-spot for long-distance migrants, which show a much more diverse range, but typically higher flight altitudes than local movement of staging birds (Dirksen et al. 2000).
The aims of the surveys associated with laser range finder were:
Table 1. The number of 15 minute transect counts carried out each month during the second year post-construction programme
at the Wind Turbine Test Centre Østerild during daytime.
2015 2016 August September October November December January February March April May
North 49 69 46 37 33 34 30 52 46 52
South 47 68 45 36 31 33 30 51 46 52
Total 96 137 91 73 64 67 60 103 92 104

58
• To provide data on species-specific flight altitudes of birds, which were incorporated in the estimation and assessment of the collision risk at tur-bines.
• To provide a species-specific description of the flight altitudes, flight paths and distances in relation to the structures in the study area. These param-eters may be used for a comparison with baseline measurements in order to describe the behavioural responses to the structures.
Measurements with the laser-range finder were undertaken both during count sessions on transects (see above), whenever this was possible, and be-tween count sessions during the entire study period. Measurements of alti-tude, distance and angle to a bird/flock together with the information on spe-cies and flock size were transferred to a GIS-platform (ArcMAP 10) to provide information on flight paths and to calculate the distance of flight paths and individual points of measurements to the nearest structure categorized as tur-bines, met and aviation masts together with guy-wires supporting these.
Only the mean flight altitude of flocks on which repeated measurements had been obtained was used to avoid pseudo-replication.
To test how wind speed, wind direction and temperature affect the altitude we used a general linear model as altitude could be expected to follow a nor-mal distribution. The model consisted of wind direction, wind speed and tem-perature as dependent variables and altitude was the dependent variable. Temperature was the mean daily temperature for all observations. Wind speed was measured in m/sec, and wind direction was assigned to one of four groups (NE, SE, SW, NW) each with 45 degrees on both sides of the four directions. We analyzed the model for each species using general linear mod-els (Proc GLM) in SAS 9.3 (SAS Institute, Cary, NC).
Test for avoidance
Birds may avoid the wind turbines either by increasing altitude when ap-proaching the wind turbines or through adjusting/changing their flight di-rection. The recent data obtained after construction of wind turbines were compared with the baseline observations (i.e. prior to the presence of wind turbines) for each species.
The observations made by the laser range finder provided us with positions of the birds, which were used for a detailed GIS analysis (ArcView). This en-abled us to estimate the distance of each observation point to all the structures at the test centre, i.e. wind turbines, measuring masts and the two light masts. In addition, the laser range finder provided us with measurements of flight altitudes. We used the observations from the baseline study as a reference to test whether the flight patterns of individual bird species was altered as result of the establishment of the test centre. Specifically we tested meso-avoidance, i.e. how birds avoid wind turbines and masts when passing close to them:
• Vertical meso-avoidance. Did birds change their flight altitude relative to the distance to structures?
• Horizontal meso-avoidance: Did bird usage of the areas close to the struc-tures change between the baseline and post-construction study periods?
Vertical meso-avoidance We tested the extent to which individual species altered their flight altitude relative to the distance to the wind turbine and masts during baseline and

59
post-construction study periods. We use the term context to code whether ob-servations were made during baseline or post-construction study periods For several species the same individual or flock was measured multiple times to track their flight pattern. Consequently, such observations were non-inde-pendent. For the statistical analysis, all observations assigned with a laser_id, specific for each track of a bird or flock. The model tested the effect of distance, context and their interaction in relation to altitude. The interaction effect be-tween distance and context tested if birds changed flight altitude relative to the distance to the wind turbines by comparing the regressions between alti-tude and distance obtained for baseline and post-construction study periods, respectively. The distance was nested within laser_id, so the random effect became laser_id*distance. To test how flight altitude varied with distance to the structures we used a mixed model with random effects marked in bold:
Altitude= distance + context + distance*context + laser_id*distance
For this analysis we required at least five observations from both the baseline and post-construction periods. The mixed model was calculated using Proc Mixed in SAS 9.3 (SASInstitute, Cary, NC).
Horizontal meso-avoidance In the case that bird usage of the areas close to the structures was similar to the usage of surrounding areas, we would expect that the number of observa-tions to be independent of the distance to the towers. Accordingly, density of observations should be equal at all distances to the towers. However, there were more observations close to the observation station than further away. In addition, habitat preferences and flight corridors may also affect the observed density of birds in the study area. We therefore decided to use the observa-tions from the baseline study of each species to predict the unperturbed dis-tribution of distances to the positions of the structures. To focus the analysis on the effect of the structures we only included observations within 100 m of the structures. Since the laser observations were hampered close to the struc-tures, we discarded observations closer than 10 m from wind turbines and masts. We tested the usage of areas near structures using a Kolmogorov-Smirnoff two sample test. The Kolmogorov-Smirnoff test examines whether the cumulative probability distribution of observed distances differs between the baseline and post-construction study periods. We only included species with at least four observations from each study period. The test was per-formed in Proc NPAR1WAY in SAS 9.3.
Minimum distance to structures estimated on the basis of direct flight paths The analysis of bird usage of the area near structures may suffer from obser-vation bias if the observer is less likely to measure birds close to wind turbines and masts, e.g. when birds or flocks are flying behind structures. We therefore extended the analysis and included the estimated direct flight path between observation points to estimate a nearest distance to the structure positions for all tracks. We only included observations within 100 m of the structures. These observations were also examined in the same way using a Kolmogorov-Smirnoff test. We only included individual bird species with at least five ob-servations from each study period.
Birds crossing the line of wind turbines The wind turbines were placed on a straight line in a north-south direction (Fig. 1). This wind turbine line was defined as the straight line constructed between the wind turbines extending 75 m in both northerly and southerly directions. To test where birds crossed the line of wind turbines, we measured

60
the minimum distance between the estimated flight path and the nearest wind turbine. As wind turbines are placed in 600 m intervals, the minimum dis-tance to a wind turbine ranged from 0- 300 m. We also used a Kolmogorov-Smirnoff test to examine whether observations from baseline and post-con-struction differed. To conduct the test we required at least five observations from each study period. In the case that a bird or a flock had crossed the wind turbine line multiple times only one observation was used to ensure inde-pendence of the observations.
Carcass searches
To quantify fatality rates we conducted carcass searches using trained dogs in plots under turbines, met and aviation masts. This is a method which has been widely used to determine bird fatality rates at wind turbines (Nievergelt et al. 2011 and references therein). Plots were centred at the base of each structure and covered a radius equivalent to the height of the mast or turbine. In some parts of two of the plots the vegetation cover was very dense and therefore inaccessible to dogs. No attempt was made to search these areas. We placed plots under the following structures:
Northern aviation mast (9.8 ha, 50%) Measuring masts east of sites 2 (6.2 ha, 100%) and 4 (3.8 ha, 100%) Turbines at sites 2 (14.7 ha, 97%) and 3 (10.1 ha, 100%)
Numbers in brackets indicate the approximate proportion of the plot searched by dogs and the equivalent area. In total, an area of approximately 44.6 ha was covered on each search. All searches were initiated around sunrise.
Searches were conducted in the following time periods at 2-4 days intervals (the number of searches in brackets):
September 23 – November 3 2015 (n=15) May 2 – June 1 2016 (n=13)
Any carcasses found had their position recorded with GPS and were photo-graphed. Carcasses were collected and kept at -18 °C for potential post-mor-tem analyses or identification, e.g. DNA analysis.
In November 2013, during the first year post-construction study, we con-ducted a field test of the dogs to assess their ability to find carcasses. A total of 28 bird wings, typically of dabbling ducks, e.g. mallard and teal, were ran-domly placed in all plots, which were subsequently searched. The field test showed that 79% of all bird wings were retrieved by the dogs. The wings that were not retrieved were typically from smaller ducks, e.g. teal, and were those placed in high vegetation. No further tests have been conducted, although oc-casionally bird wings were placed in the search areas both to test and motivate the dogs.
As was the case during the first year post-construction study, we carried out removal trials to assess the persistence of carcasses. On August 15 2016, we placed carcasses of 50 female pheasants (Fig. 5) throughout the study area and visited them on a daily basis to quantify the rate at which carcasses were re-moved by scavengers. Each carcass was visited daily and the trial continued until all carcasses had been completely removed.

61
Movements of nightjars
During the first year post-construction study, we identified five nightjar ter-ritories on the basis of the presence of advertising males. Three of the territo-ries were situated in the northern part of the study area, one was close to tur-bine test site 5 and one was situated east of turbine test sites 5-6.
In summer 2015, we GPS tagged breeding nightjars to examine their move-ments in the study area. We used PinPoint-50 GPS tags, developed by Bio-Track, to record precise locations at short intervals over a few nights, provid-ing information on foraging movements and habitat use. We wanted specifi-cally to obtain detailed information about the extent to which nightjars forage in close proximity to wind turbines potentially exposing them to collision haz-ards. We used playback lures consisting of wing clapping and various contact and courtship calls placed at the mid-point of a mist-net (12-60 m) to attract territorial males. All birds were ringed and therefore individually recogniza-ble. GPS tags were attached using a full-body harness consisting of a neck and a body loop. The GPS data has to be downloaded directly from the tag, so birds must be recaptured. The GPS tags were programmed to record positions at 3 minute intervals from 22:00-04:00 (foraging) and at 2 hour intervals from 6:00-20:00 (roosting). The tag was programmed to start logging the following day from 22:00 to give the bird time to recover from capture stress and become accustomed to the tag. The storage of the tag is limited to around 540 GPS positions and we were therefore able to collect data over approximately 4 days. Fieldwork took place from June 22 to July 21.
Estimation of the number of collisions
Wind turbines Modelling of the collision risk was undertaken for the selected species based on the data collected on the count transects and measurements of flight alti-tude using the Scottish Natural Heritage models (Band 2000). Desholm (2006) demonstrated that the avoidance response of a bird when approaching a wind farm was the single factor that had the greatest impact on the collision risk.
Figure 5. Dead female pheas-ants were used to assess the rate at which carcasses were re-moved by scavengers. © Jørgen Peter Kjeldsen.

62
Some information on species-specific avoidance response rates exist on geese from a recent local study (Kahlert et al. 2010). However, in most cases we adopted the values recommended by the Scottish Natural Heritage (Urquhart 2010). Thus, for the selected species the avoidance rates incorporated in the collision models varied between 97.75 and 99.00%.
The collision models developed by Scottish Natural Heritage offer two forms of assessment dependent upon turbine arrangement and bird flight patterns (Band 2000). The first, most simple model simulates a predictable passage of birds across a single row of turbines. The alternative model is used for bird spe-cies that may use a wind farm area in a more unpredictable manner, (e.g. a feed-ing area), which incorporates the time that an individual bird may remain within the confines of the wind farm area, potentially of more complex geome-try (e.g. with turbines in one row or multiple rows). In general, the alternative model leads to an elevated risk of collisions compared to the simple model.
The modelling of the collision risk is described in detail in Appendix B2.
In order to explore the flight patterns at the test centre in further detail, the flight directions observed during the baseline study were used in a random simulation of passages of the wind farm area (using ArcMAP 10). Assuming that the flight directions would be the same after construction of the test cen-tre, the simulation predicted that on average birds would only be at risk of colliding with one turbine at each flight episode. This was confirmed likely to be the case, by the general flight pattern, which showed a general tendency to pass the wind farm area along an E-W axis. It should be noted that this as-sumption may be violated during the operation of the turbines as flight direc-tion may change due to avoidance.
For this reason the simple model was applied to geese, swans, common crane and cormorant, which typically crossed the wind farm area showing a con-sistent flight direction. The alternative model is typically used for birds of prey, which could potentially cross the single line of wind turbines several times dur-ing a foraging bout. In the present report the alternative model was applied to buzzard, hen harrier, marsh harrier, kestrel, peregrine falcon, common raven and small non-corvid passerines. In addition, it was applied to wood pigeon, which may also potentially undertake the same flight behaviour.
The results from the transect counts were converted to the number of birds crossing the row of turbines, which was incorporated in the model (see de-scription of parameter in Appendix B2), which included an extrapolation of the migration intensity during observation periods to the remainder of the hours with daylight (sensu Band 2000 and see also Appendix B2 for further details of the extrapolation). Data were collected evenly throughout the day-light period. The daylight correction was applied on a monthly basis as the mean of daylight hours. The frequency distribution of flight altitudes was used to derive the proportion of the birds that actually flew at altitudes with a risk of collision (i.e. the sweep area, min. 25 - max. 227 m). Further steps were undertaken in the calculation (see details in Band 2000) to estimate the number of collisions without avoidance response. Finally, avoidance was in-corporated in the model and corrections made for periods of turbine inactivity due to low or high wind speeds (operational at 3-25 m/s based on in situ data) and when maintenance was carried out (1 day per month).

63
Associated structures
Bird collisions at towers and masts have been subject to extensive research, especially in North America. Nevertheless, predictive models, comprising the same detailed features as collision models for turbines, have not been devel-oped, probably because of the complexity of the issue. For example, it would be a questionable approach just to calculate the number of collisions on the basis of the amount of airspace that is occupied by the structures, cf. the prin-ciples used in the collision models for turbines. Thus, guy-wires occupy a rel-atively small amount of airspace compared to the main tower or mast (Fig. 6), yet they seem to be considerably more hazardous to migrating birds than the tower or mast structures themselves (e.g. Avery et al. 1976), most likely be-cause guy-wires are difficult to discern even at daytime (for example when they appear to offer little visual contrast against a background of grey clouds).
Given our great lack of knowledge with respect to bird collisions at towers or masts in Denmark, a meta-analysis of North American studies undertaken by Longcore et al. (2008) was used to at least provide a crude estimate of the ex-pected number of casualties at met and aviation masts at the test centre. This meta-analysis confirmed the hypothesis that the number of casualties increased significantly with the height of the structure. By describing this relationship as a mathematical function (linear regression of the logarithm to the number of casualties and mast height), the heights of the Østerild masts could be inserted in the function (y = 0.0121*HEIGHT1.7763, R2 = 0.25) in order to derive a predic-tion of the expected order of magnitude of collisions. The use of this approach should be used with great caution and the results can only be considered as a rough guideline. For example the migration intensity could also affect the num-ber of casualties at tall towers or masts. This factor was not incorporated in the equation, and hence we assume that migration intensities are comparable be-tween North America and Østerild, which is unlikely to be the case.
Overall considerations regarding collisions with other structures
In the following, we present estimates of the number of collisions at turbines for each species included in the second year post-construction analysis (see species account below). However, as was the case in the baseline and first year post-construction reports, we only provide an overall prediction, which in-cludes all species registered in the study area, for the number of collisions with other structures (met and aviation masts) (Tab. 2). See pages 54-55 in the
Figure 6. Two common cranes passing the study area. A guy-wire can be seen in the back-ground. © Jørgen Peter Kjeldsen.

64
baseline report (Therkildsen et al. 2012) for a full evaluation of the collision risk between birds and structures at the test centre.
Meteorological data
Data on wind conditions and temperature are important factors that are known to affect flight behaviour and the general occurrence of individual bird species in the study area. Thus, strong headwinds relative to the prevailing direction of migration are likely to reduce flight altitude and migration inten-sity of birds (Kahlert et al. 2012a). Several species are sensitive to cold spells (temperatures below 0 °C) during the winter, as this may hamper feeding op-portunities and initiate southward migration of birds. For this reason, it was considered important to model the effects of meteorological variables on flight movements of different species.
For each observation session cloud cover, visibility and precipitation were rec-orded. Data on wind speed and direction were obtained from measurements at the test centre. We used measurements at 44 m height at the Østerild W tower from 2013 to 19 March 2015 and from 19 March 2015 to June 2016 we used the 44 m position from the southern light tower (http://vind-ponline01.win.dtu.dk/rodeo/ProjectListText.aspx?&Rnd=218081).
It was not possible to obtain data on wind speed, wind direction and temper-ature from the study area. In order to ensure consistent data sets across the study period, these weather data were therefore obtained from a weather sta-tion in Hanstholm, ca. 18 km NW of the study area (courtesy of the Danish Meteorological Institute; data collected at a height of 22 m above the ground).
Quality assurance and data storage
Quality assurance measures were integrated in all stages of both the baseline and the post-construction studies. This included all steps from the initial col-lection of data in the field, during data entry and analysis, until the final report writing. Field observers were responsible for entering data thereby inspecting their own data forms to control for accuracy. The electronic database was in-spected using SAS/STAT statistical software (SAS Institute, Cary, NC) and any errors detected were corrected. Statistical analyses, including modelling, were performed using SAS/STAT statistical software. A database and a GIS platform were developed to store and organize data. All data forms, including field notebooks, and electronic data files were retained for future reference.
Table 2. Crude estimates of the predicted annual number of bird casualties at masts in the
Østerild Test Centre.
Type of structure
Height
(m)
Number of
structures
Predicted annual
number of casualties
Aviation masts 250 2 440
Measuring masts 100-150 8 302-621

65
Results
Meteorological observations Cloud cover In about 60% of the observation sessions the cloud cover was 5/8 or more and only around 25% of the observations were made when the sky was clear. Since smaller birds are particularly more easily detected on a cloud covered sky compared to a clear sky, observation conditions with respect to cloud cover were good at most times (Fig. 7).
Visibility In general, the visibility recorded during field work was good and in more than 90% of the sessions visibility was more than 5 km (Fig. 8).
Precipitation More than 90% of all observation sessions were made during periods with no precipitation (Fig. 9).
Figure 7. Cloud cover recorded during field work in the study area from August 2015-May 2016.
Figure 8. Visibility recorded dur-ing field work in the study area from August 2015-May 2016.

66
Overall, observation conditions were favourable, which reflect the fact that observation days were chosen to ensure that sufficient data were collected during the study period. However, it should be noted that weather conditions showed some variation, which means that occasionally observations were made during periods with rain or light rain, which hampered visibility ac-cordingly.
Wind conditions and temperatures In late summer and autumn 2015, the direction of the wind generally showed great variation with winds from both easterly and westerly directions, alt-hough prevailing winds were from a south westerly direction. In winter 2015/16, prevailing winds were from a westerly direction, although in Janu-ary and February there were shorter periods with winds from an easterly di-rection. Wind direction showed great variation during spring 2016. Prevailing winds were from a westerly direction, although in late spring there were pe-riods of shorter duration with easterly winds particularly in late May (Fig. 10).
In late summer and early autumn, mean daily temperature decreased from approximately 15-20 °C in August to 10-15 °C in October. In November, tem-peratures dropped gradually towards the end of the month. In December-Jan-uary-February temperatures varied markedly with temperatures down to -6 °C in late January. In spring, mean daily temperature increased from approx-imately 5 °C in March to 15-20 °C in late May (Fig. 11).
Figure 9. Precipitation recorded during field work in the study area from August 2013-May 2014.
Figure 10. Daily mean wind direction broken into four main directions. Data were compiled at a measuring mast in Hanstholm from August 2015-July 2016. Data from the Danish Meteorological Institute.

67
Altogether, autumn 2015 in Denmark was somewhat warmer than normal with average temperatures at 10.1 °C, whereas the average winter tempera-tures of 3.1°C were 2.6 °C higher than normal. Likewise, spring 2016 was warmer than normal with mean temperature at 7.7 °C, which is 1.5 °C above the normal (Danish Meteorological Institute).
Carcass searches One dead adult male goshawk was found on May 6 2015 near test site number 2. We were unable to determine whether the fatality was caused by a collision. No other carcasses were found during the searches.
The removal trials showed that by the 3rd day, 20% of the carcasses had been removed. On the 9th day, 46% of the carcasses had been removed. No more carcasses were removed until we finished the trial after 14 days. At that time, the carcasses were decomposed to an extent which probably made them un-attractive to scavengers.
In contrast, by the 3rd day, 50% of the carcasses had been removed when we conducted the removal trial in 2013, whereas by the 15th day, no carcasses remained.
The fact that only one potential fatality was found during the carcass searches under masts and turbines may reflect the following situations:
• None or very few collisions took place • Carcasses landed outside the search area • Carcasses were broken by the impact into too small fragments to be de-
tected by the dogs • Carcasses were removed by scavengers prior to the searches • Dogs were unable to detect carcasses.
We consider the almost complete absence of collisions between birds and the structures at the test centre during the periods when searches were conducted to be highly unlikely. We therefore assume that either some fatalities were missed by or were not available to the dogs or they were removed by scaven-gers between searches. Nevertheless, the results from the carcass searches indicate that the number of collisions is probably rather small.
Figure 11. Daily mean temperatures based on data compiled at the test centre from August 2015-June 2016.

68
On this basis the carcass searches confirmed the overall conclusions from the baseline and first year post-construction studies that the wind turbines and associated structures will only result in a relatively small number of collisions with birds.
It is important to note that even though the carcass searches were placed to cover most of the year, including the peak migration periods in spring and autumn, not all weather conditions were covered. This is important, since most collisions have been reported to take place during adverse weather con-ditions (Newton 2007). Therefore, even though mass mortality resulting from collisions with physical structures is a rare event, this may have potential neg-ative impacts on the affected populations. This is particularly the case for the larger, long-lived species with a low reproductive rate and those species that are local residents where such mortality may have disproportionate effect on local abundance. In this context, it is worth mentioning that in many cases the more sensitive species occurring in the study area, e.g. white-tailed eagle and common crane, are also more likely to be retrieved by search dogs than smaller, less sensitive passerine species.
Our study was designed to obtain estimates of mortality by gathering infor-mation about the number of actual casualties, carcass persistence probability and the searcher efficiency. Therefore, we conducted experiments, i.e. re-moval trials and test of the dogs, to estimate carcass persistence probability and searcher efficiency. By combining these parameters into an estimate of the probability that a collision had occurred and the bird was subsequently found by the dogs, we would finally be able to estimate the mortality.
However, mortality estimates based on carcass searches can be very uncertain especially when the number of carcasses found and detection probability are low (Korner-Nievergelt et al. 2015). In our study the number of carcasses found was certainly low and even though we have showed that searcher effi-ciency was rather high, we are not able to perform a detailed analysis on the basis of this part of the study.
Nevertheless, the results of the carcass searches confirmed the overall conclu-sions from the baseline and first year post-construction studies that the wind turbines and associated structures will only result in a small number of colli-sions with birds.
Results on selected species Besides the focal species mentioned above a number of species and one spe-cies group were included in the analysis either on the basis of their regular occurrence in the study area or because of their elevated conservation status, e.g. one or more SPAs have been designated for the species in the vicinity of the test centre. The species or species groups, which have been included in this second year post-construction report is listed below. The list is identical to the one presented in the first year post-construction report.
• Cormorant • Whooper swan (focal species) • Tundra swan • Pink-footed goose (focal species) • Taiga bean goose (focal species) • Greylag goose • Light-bellied brent goose (focal species)

69
• White-tailed eagle (focal species) • Peregrine falcon • Kestrel • Marsh harrier • Hen harrier • Buzzard • Common crane (focal species) • Golden plover • Wood pigeon • Common raven • Passerines (corvids, swallows, larks, wagtails, pipits, etc.) • Nightjar • Nocturnal migrants.
A total list of the bird species registered during the post-construction pro-gramme is presented in Appendix B1, which also provides scientific and Dan-ish names for all species. It should be noted that since the occurrence and, therefore, the amount of data collected for individual species, varies, the level of detail and the robustness of the analysis differs markedly between species.
It should be noted that when we describe the temporal occurrence of the bird species below, we refer to the systematic observations made during transect counts. In many cases, particularly for the species occurring in smaller num-bers, most individuals were observed outside count sessions.
Avoidance, i.e. the ability of birds to avoid the wind turbines, is addressed in a separate section following the species accounts.
Cormorant
General occurrence In 2015 and 2016, the number of breeding pairs of cormorant in Denmark was 31,358 and 31,682, respectively (Bregnballe & Nitschke 2016). The Danish breeding population has maintained stable numbers at around 39,000 pairs dur-ing 1993-2006, followed by a decline to around 26,400 pairs in 2010-2013. In Vejlerne, 858 and 990 pairs were breeding on the island of Melsig in nearby Arup Vejle in 2015 and 2016, respectively. This makes the colony the largest in the region. Danish cormorants leave the country to spend the winter in central Europe and the Mediterranean Sea. Outside the breeding season cormorants from Norway occur in Denmark. The Danish and Norwegian cormorants rep-resent two different sub-species, Phalacrocorax carbo sinensis and Phalacrocorax carbo carbo, respectively. In recent years, the Norwegian population of cormo-rants has been stable at around 20,000 breeding pairs (Pedersen et al. 2016).

70
Temporal and spatial patterns of occurrence in the study area Cormorants occurred in the study area during August-October and from Jan-uary to May. In November-March only few cormorants were present in the area. Highest numbers occurred in late spring, which was also the case during the previous study years (Tab. 3).
The observations of cormorants were concentrated around the observation station in the central part of the study area. The north-south orientated flight pattern indicates that the majority of cormorants observed in the study area in spring and late summer were breeding birds commuting between the col-ony at Melsig and feeding areas in western Thy and Skagerrak (Kjeldsen 2008) (Fig. 12, 13). This pattern was also observed during the previous study years.
Figure 12. A flock of cormorants passing the test centre. © Jørgen Peter Kjeldsen.
Table 3. Numbers of cormorants passing the study area on visual transects during the second post-construction study period
expressed as observed/calculated number of individuals. August September October November December January February March April May
North 406/15583 545/12105 80/2230 0/0 0/0 0/0 0/0 11/311 67/2499 178/7012
South 181/7243 65/1465 15/427 54/1459 11/301 1/28 5/177 4/115 125/4662 255/10046
Total 587/22825 610/13570 95/2658 54/1459 11/301 1/28 5/177 15/426 192/7160 433/17058

71
Altogether, 95.3% and 98.0% of the observed individuals and flocks, respec-tively, of cormorants occurred at rotor height (min. 25 - max. 227 m), whereas 4.7% and 2.0% of individuals and flocks, respectively, were outside rotor height (Fig. 14).
Figure 13. Overall flight patterns of cormorants in the study area, August 2015 – May 2016. Black dots indicate single observation points obtained by laser range finder. Sequential observations of the same flock or individual are connected with a yellow line. Or-ange arrows indicate the flight di-rection, and the red bar indicates the distance (1,298 m) from the observer within which 90% of the observation points were located.
Figure 14. Flight altitudes of cormorants expressed as the proportion of individuals (blue) and flocks (red) occurring at 13 alti-tude categories. The shaded blue box indicates the altitude covered by the total sweep area of the wind turbines (min. 25 – max. 227 m).
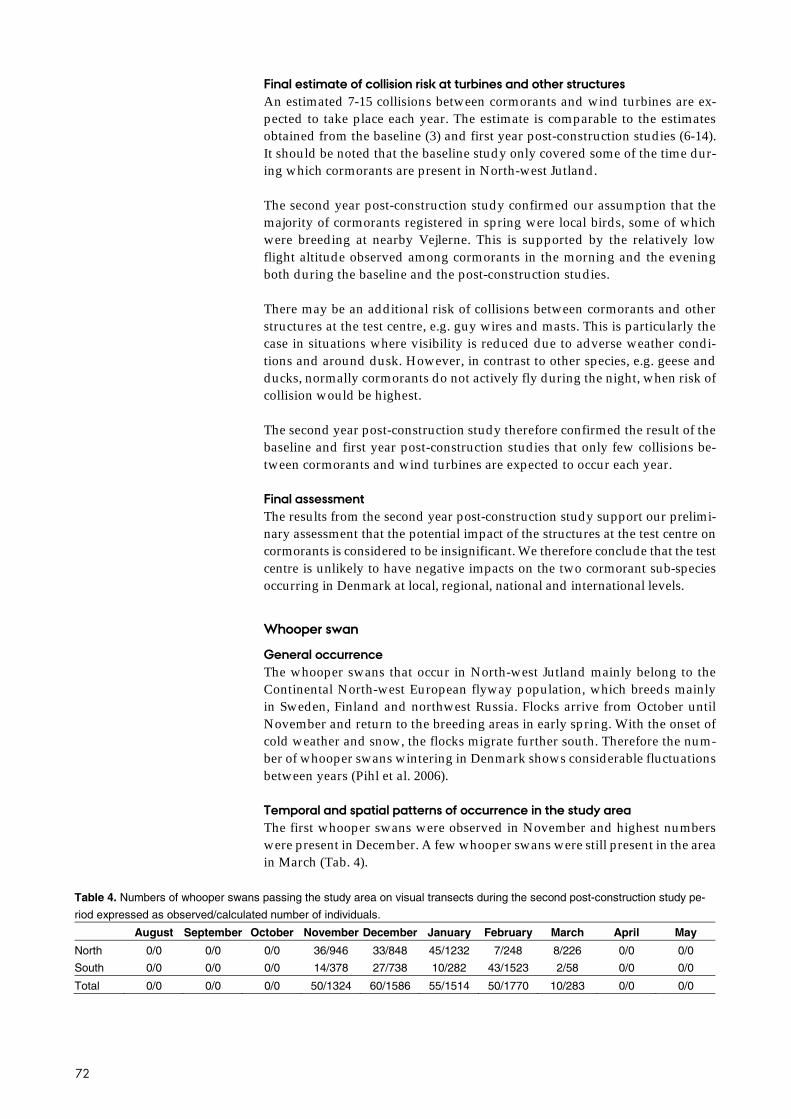
72
Final estimate of collision risk at turbines and other structures An estimated 7-15 collisions between cormorants and wind turbines are ex-pected to take place each year. The estimate is comparable to the estimates obtained from the baseline (3) and first year post-construction studies (6-14). It should be noted that the baseline study only covered some of the time dur-ing which cormorants are present in North-west Jutland.
The second year post-construction study confirmed our assumption that the majority of cormorants registered in spring were local birds, some of which were breeding at nearby Vejlerne. This is supported by the relatively low flight altitude observed among cormorants in the morning and the evening both during the baseline and the post-construction studies.
There may be an additional risk of collisions between cormorants and other structures at the test centre, e.g. guy wires and masts. This is particularly the case in situations where visibility is reduced due to adverse weather condi-tions and around dusk. However, in contrast to other species, e.g. geese and ducks, normally cormorants do not actively fly during the night, when risk of collision would be highest.
The second year post-construction study therefore confirmed the result of the baseline and first year post-construction studies that only few collisions be-tween cormorants and wind turbines are expected to occur each year.
Final assessment The results from the second year post-construction study support our prelimi-nary assessment that the potential impact of the structures at the test centre on cormorants is considered to be insignificant. We therefore conclude that the test centre is unlikely to have negative impacts on the two cormorant sub-species occurring in Denmark at local, regional, national and international levels.
Whooper swan
General occurrence The whooper swans that occur in North-west Jutland mainly belong to the Continental North-west European flyway population, which breeds mainly in Sweden, Finland and northwest Russia. Flocks arrive from October until November and return to the breeding areas in early spring. With the onset of cold weather and snow, the flocks migrate further south. Therefore the num-ber of whooper swans wintering in Denmark shows considerable fluctuations between years (Pihl et al. 2006).
Temporal and spatial patterns of occurrence in the study area The first whooper swans were observed in November and highest numbers were present in December. A few whooper swans were still present in the area in March (Tab. 4).
Table 4. Numbers of whooper swans passing the study area on visual transects during the second post-construction study pe-
riod expressed as observed/calculated number of individuals. August September October November December January February March April May
North 0/0 0/0 0/0 36/946 33/848 45/1232 7/248 8/226 0/0 0/0
South 0/0 0/0 0/0 14/378 27/738 10/282 43/1523 2/58 0/0 0/0
Total 0/0 0/0 0/0 50/1324 60/1586 55/1514 50/1770 10/283 0/0 0/0

73
Most whooper swans were observed close to the observation station, although flocks occurred throughout most of the study area. The flight pattern indicates that the majority of whooper swans were local birds commuting between dif-ferent feeding areas and night roosts in the area (Fig. 15). The overall flight pat-tern of whooper swans is similar to that which was observed during the previ-ous study years. However, there was a tendency for whooper swans to keep safe distance away from the sweep area when passing the row of turbines.
Figure 15. Overall flight patterns of whooper swans in the study area, August 2015 – May 2016. Black dots indicate single obser-vation points obtained by laser range finder. Sequential observa-tions of the same flock or individ-ual are connected with a yellow line. Orange arrows indicate the flight direction, and the red bar in-dicates the distance (1,195 m) from the observer within which 90% of the observation points were located.
Figure 16. Flight altitudes of whooper swans expressed as the proportion of individuals (blue) and flocks (red) occurring at 13 altitude categories. The shaded blue box indicates the altitude covered by the total sweep area of the wind turbines (min. 25 - max. 227 m).

74
Altogether, 49.5% and 48.8% of the observed individuals and flocks, respec-tively, of whooper swans occurred at rotor height (min. 25 - max. 227 m), whereas 50.5% and 51.2% of individuals and flocks, respectively, were below rotor height (Fig. 16).
Final estimate of collision risk at turbines and other structures An estimated 2-5 collisions between whooper swans and wind turbines are expected to take place each year. The estimate is lower than the estimate ob-tained from the baseline (4-9), but higher than the estimate obtained during the first post-construction studies (0.1-0.2). It should be noted that the baseline study covered only some of the time during which whooper swans are pre-sent in northwest Jutland. The second year post-construction study therefore confirmed the result of the baseline and first year post-construction studies that only a few collisions between whooper swans and wind turbines are ex-pected to occur each year.
As was the case during the previous study years, there were no indications that seasonal migration took place in the study area and we therefore still as-sume that the majority of whooper swans registered in the study were local birds. This is supported by the relatively low flight altitude observed among whooper swans.
Whooper swans are characterized by high wing loading and a low aspect ra-tio, resulting in rapid flight and low manoeuvrability. This means that there may also be an additional risk of collisions between this species and other structures at the test centre, e.g. guy wires and masts. This is particularly the case in situations where visibility is reduced due to adverse weather condi-tions, or during morning and evening flights, when light intensities are low (Larsen & Clausen 2002).
Final assessment The results from the second year post-construction study support our prelim-inary assessment that the potential impact of the structures at the test centre on whooper swans is considered to be insignificant. We therefore conclude that the test centre is unlikely to have negative impacts on the whooper swan population at local, regional, national and international levels.
Tundra swan
General occurrence The vast majority of tundra swans occurring in Denmark during spring and autumn migration belong to the Russian breeding population, which today comprises around 21,500 individuals following a decline since the mid-1990s (Nagy et al. 2011). In winter, most flocks migrate further south to wintering areas in England, Ireland, The Netherlands and Belgium. In November, up to 1,200 tundra swans occur in Denmark (Nagy et al. 2011), particularly in west-ern and northern Jutland.
Temporal and spatial patterns of occurrence in the study area A few tundra swans were registered in the study area in October and again in March (Tab. 5).

75
Three smaller flocks of tundra swans were observed near the observation point in the central part of the study area (Fig. 17).
Table 5. Numbers of tundra swans passing the study area on visual transects during the second post-construction study period
expressed as observed/calculated number of individuals. August September October November December January February March April May
North 0/0 0/0 0/0 0/0 0/0 0/0 0/0 8/226 0/0 0/0
South 0/0 0/0 4/114 0/0 0/0 0/0 0/0 0/0 0/0 0/0
Total 0/0 0/0 4/114 0/0 0/0 0/0 0/0 8/226 0/0 0/0
Figure 17. Overall flight patterns of tundra swans in the study area, August 2015 – May 2016. Sequential observations of the same flock or individual are con-nected with a yellow line. Orange arrows indicate the flight direc-tion, and the red bar indicates the distance (1,281 m) from the ob-server within which 90% of the observation points were located.
Figure 18. Flight altitudes of tundra swans expressed as the proportion of individuals (blue) and flocks (red) occurring at 13 altitude categories. The shaded blue box indicates the altitude covered by the total sweep area of the wind turbines (min. 25 - max. 227 m).

76
Altogether, 90.0% and 98.2% of the observed individuals and flocks, respec-tively, of tundra swans occurred at rotor height (min. 25 - max. 227 m), whereas 10.0% and 1.8% of individuals and flocks, respectively, were below rotor height (Fig. 18).
Thus, flight altitude of tundra swans is considerably higher than the flight altitude of the related whooper swan, which was also the case during the base-line and first year post-construction studies. This suggests that the tundra swans occurring in the study area are migrating over larger distances than the whooper swans.
Final estimate of collision risk at turbines and other structures An estimated 0.02-0.04 collisions between tundra swans and wind turbines are expected to take place each year. The estimate is lower than the estimate ob-tained from the baseline studies (0.42), but similar to the estimate obtained dur-ing the first year post-construction study (0.01-0.04). It should be noted that the baseline study covered only some of the time during which tundra swans are present in northwest Jutland. The second year post-construction study there-fore confirmed the result of the previous study years that only very few colli-sions between tundra swans and wind turbines are expected to occur each year.
Tundra swan is characterized by high wing loading and a low aspect ratio, resulting in rapid flight and low maneuverability. Therefore there may be an associated risk of collisions between tundra swans and other structures at the test centre, e.g. guy wires and masts. This is particularly the case in situations where visibility is reduced due to adverse weather conditions, or at dusk.
Final assessment The results from the second year post-construction study support our prelim-inary assessment that the potential impact of the structures at the test centre on tundra swans is considered to be insignificant. We therefore conclude that the test centre is unlikely to have negative impacts on the tundra swan popu-lation at local, regional, national and international levels.
Pink-footed goose
General occurrence Northwest Jutland is an important wintering and staging area for the Svalbard breeding population of pink-footed goose, which in recent years has increased to approximately 74,000 individuals (Madsen et al. 2014). Up to 16,000 pink-footed geese occur in Vejlerne from September until late April (DOFbasen), where they perform daily movements between night roosts and feeding areas, and additional movements between different feeding areas during the day. In the previous study years it was demonstrated that daily movements of pink-footed geese result in frequent passages through the study area.
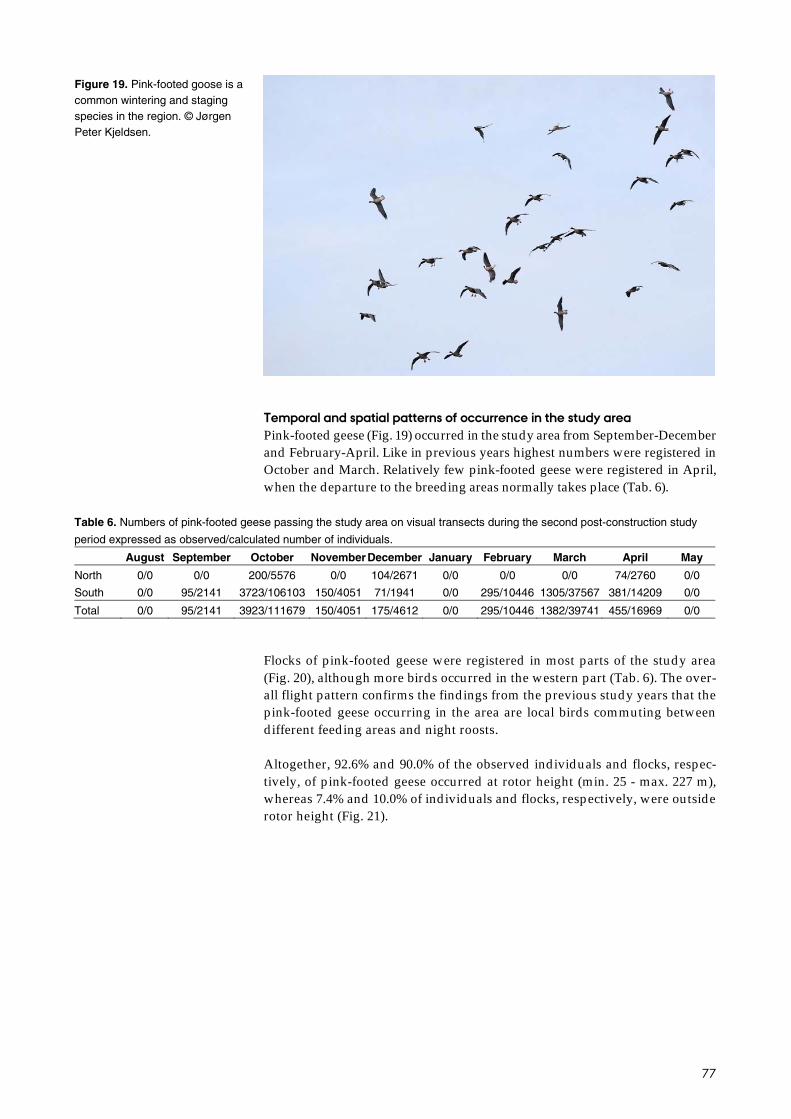
77
Temporal and spatial patterns of occurrence in the study area Pink-footed geese (Fig. 19) occurred in the study area from September-December and February-April. Like in previous years highest numbers were registered in October and March. Relatively few pink-footed geese were registered in April, when the departure to the breeding areas normally takes place (Tab. 6).
Flocks of pink-footed geese were registered in most parts of the study area (Fig. 20), although more birds occurred in the western part (Tab. 6). The over-all flight pattern confirms the findings from the previous study years that the pink-footed geese occurring in the area are local birds commuting between different feeding areas and night roosts.
Altogether, 92.6% and 90.0% of the observed individuals and flocks, respec-tively, of pink-footed geese occurred at rotor height (min. 25 - max. 227 m), whereas 7.4% and 10.0% of individuals and flocks, respectively, were outside rotor height (Fig. 21).
Figure 19. Pink-footed goose is a common wintering and staging species in the region. © Jørgen Peter Kjeldsen.
Table 6. Numbers of pink-footed geese passing the study area on visual transects during the second post-construction study
period expressed as observed/calculated number of individuals. August September October November December January February March April May
North 0/0 0/0 200/5576 0/0 104/2671 0/0 0/0 0/0 74/2760 0/0
South 0/0 95/2141 3723/106103 150/4051 71/1941 0/0 295/10446 1305/37567 381/14209 0/0
Total 0/0 95/2141 3923/111679 150/4051 175/4612 0/0 295/10446 1382/39741 455/16969 0/0

78
Final estimate of collision risk at turbines and other structures An estimated 14-31 collisions between pink-footed geese and wind turbines are expected to take place each year. This is comparable to the estimate ob-tained from the baseline (21-46), and first year post-construction (10-23) stud-ies. It should be noted that the baseline study covered only some of the time during which pink-footed geese are present in northwest Jutland. The second year post-construction study therefore confirmed the result of the previous study years that only a few collisions between pink-footed geese and wind turbines are expected to occur each year.
Figure 20. Overall flight patterns of pink-footed geese in the study area, August 2015 – May 2016. Black dots indicate single obser-vation points obtained by laser range finder. Sequential observa-tions of the same flock or individ-ual are connected with a yellow line. Orange arrows indicate the flight direction, and the red bar in-dicates the distance (1,537 m) from the observer within which 90% of the observation points were located.
Figure 21. Flight altitudes of pink-footed geese expressed as the proportion of individuals (blue) and flocks (red) occurring at 13 altitude categories. The shaded blue box indicates the altitude covered by the total sweep area of the wind turbines (min. 25 - max. 227 m).

79
It should be noted that observation days were restricted to periods with mainly favourable weather conditions, when flight activity is expected to be higher than during adverse weather conditions. It should also be noted that weather conditions (visibility and wind speed) and other factors may affect flight alti-tudes and, hence, the number of birds passing the area at rotor height.
It should also be noted that pink-footed geese are characterized by high wing loading and a low aspect ratio, resulting in rapid flight and low manoeuvra-bility, means that there may also be an additional risk of collisions between this species and other structures at the test centre, e.g. guy wires and masts.
Final assessment The estimated collision frequency corresponds to 0.02-0.04% of the total Sval-bard breeding population, which amounts to around 76,000 individuals (Madsen et al. 2016), and to 0.09-0.19% of the maximum number of individu-als (ca. 16,000) observed in northwest Jutland in recent years.
The results from the second year post-construction study support our prelim-inary assessment that the potential impact of the structures at the test centre on pink-footed geese is considered to be insignificant. We therefore conclude that the test centre is unlikely to have negative impacts on the pink-footed goose population at regional, national and international levels.
Taiga bean goose
General occurrence The bean geese that occur in northwest Jutland belong to the subspecies A. f. fabalis also known as the taiga bean goose. The flocks observed in northwest Jutland during migration and winter belong to the small sub-population breeding in central Sweden. The national conservation status for the sub-pop-ulation is at present uncertain (Pihl et al. 2006). Therefore, the proportion of the flyway wintering in Jutland, which numbers probably less than 2,000 in-dividuals, was protected from hunting in Jutland by Government Order from 2004 onwards.
Temporal and spatial patterns of occurrence in the study area Small numbers of taiga bean geese occurred in the study area in October-No-vember and February-March. The highest number of individuals was regis-tered in February (Tab. 7). In contrast to the first post-construction study year no taiga bean geese were observed in December.
Smaller flocks of taiga bean geese were registered in most parts of the study area. The overall flight pattern confirms the findings from the previous study years that the taiga bean geese occurring in the area are local birds commuting between different feeding areas and night roosts (Fig. 22). During the first year post-construction study taiga bean geese were feeding in the eastern part of the study area. This was not the case during the second year post-construction study.
Table 7. Numbers of taiga bean geese passing the study area on visual transects during the second post-construction study
period expressed as observed/calculated number of individuals. August September October November December January February March April May
North 0/0 0/0 0/0 18/473 0/0 6/164 7/248 0/0 0/0 0/0
South 0/0 0/0 27/769 0/0 0/0 15/423 25/885 0/0 0/0 0/0
Total 0/0 0/0 27/769 18/473 0/0 21/588 32/1133 0/0 0/0 0/0

80
Altogether, 84.4% and 79.7% of the observed individuals and flocks, respec-tively, of taiga bean geese occurred at rotor height (min. 25 - max. 227 m), whereas 15.6% and 20.3% of individuals and flocks, respectively, were below rotor height (Fig. 23).
Figure 22. Overall flight patterns of taiga bean geese in the study area, August 2015 – May 2016. Black dots indicate single obser-vation points obtained by laser range finder. Sequential observa-tions of the same flock or individ-ual are connected with a yellow line. Orange arrows indicate the flight direction, and the red bar in-dicates the distance (1,382 m) from the observer within which 90% of the observation points were located.
Figure 23. Flight altitudes of taiga bean geese expressed as the proportion of individuals (blue) and flocks (red) occurring at 13 altitude categories. The shaded blue box indicates the altitude covered by the total sweep area of the wind turbines (min. 25 - max. 227 m).

81
Final estimate of collision risk at turbines and other structures Less than one (0.34-0.77) collision per year between taiga bean geese and wind turbines is expected. This is similar to the result obtained during the first year post-construction study (0.04-0.10).
The data collected during both the baseline and post-construction pro-grammes is not sufficient to describe diurnal activity patterns of taiga bean geese. However, we assume that the pattern resembles what has been found for pink-footed geese at nearby Klim Fjordholme (Kahlert et al. 2012b), which means that taiga bean geese may be most active around sunrise and sunset. This observation combined with the fact that that bean geese are characterized by high wing loading and a low aspect ratio, resulting in rapid flight and low manoeuvrability, indicates that there may also be an associated risk of colli-sions between this species and other structures at the test centre, e.g. guy wires and masts. This is particularly the case in situations, when visibility is reduced due to adverse weather conditions.
In contrast to the baseline study, both post-construction periods covered the entire time during which taiga bean geese are present in northwest Jutland.
The second year post-construction study therefore confirmed the result of the baseline and first year post-construction studies that only a few collisions be-tween taiga bean geese and wind turbines are expected to occur each year.
Final assessment The results from the second year post-construction study support our previ-ous assessment that the potential impact of the structures at the test centre on the subpopulation of taiga bean geese is considered to be insignificant. We therefore conclude that the test centre is unlikely to have negative impacts on the taiga bean goose population at regional, national and international levels.
Greylag goose
General occurrence The Danish greylag geese belong to the northwest European breeding popula-tion, which winters in the Netherlands and Spain. Since the 1960s this population has increased dramatically to more than 960,000 individuals (Fox & Madsen 2017). Nearby Vejlerne is the most important breeding site with more than 1,000 pairs (Pihl et al. 2006). In autumn, greylag geese from Denmark and Norway stage in west Jutland prior to the departure to the wintering grounds further south. In mild winters an increasing number of greylag geese stay in the country.
Temporal and spatial patterns of occurrence in the study area Greylag geese were observed throughout the study period. The highest num-bers were observed in August-September, which coincided with the peak mi-gration period for this species. Relatively few greylag geese were observed during mid-winter and in spring (Tab. 8). This was also the case during the baseline and first year post-construction studies.
Table 8. Numbers of greylag geese passing the study area on visual transects during the second post-construction study period
expressed as observed/calculated number of individuals. August September October November December January February March April May
North 78/2994 94/2088 73/2035 7/184 36/925 27/739 0/0 31/875 33/1231 7/276
South 510/20407 1511/34055 769/21916 26/702 83/2269 67/1890 37/1310 105/3023 70/2611 45/1773
Total 588/23401 1605/36143 842/23951 33/886 119/3194 94/2630 37/1310 136/3898 103/3841 52/2049

82
Greylag geese were observed throughout the study area. There was no appar-ent overall flight pattern, although there was a tendency for greylag geese to keep safe distance to the sweep area when passing the row of turbines (Fig. 24).
Altogether, 94.3% and 87.3% of the observed individuals and flocks, respec-tively, of greylag geese occurred at rotor height (min. 25 - max. 227 m), whereas 5.7% and 12.6% of individuals and flocks, respectively, were outside rotor height (Fig. 25).
Figure 24. Overall flight patterns of graylag geese in the study area, August 2015 – May 2016. Black dots indicate single obser-vation points obtained by laser range finder. Sequential observa-tions of the same flock or individ-ual are connected with a yellow line. Orange arrows indicate the flight direction, and the red bar in-dicates the distance (1,148 m) from the observer within which 90% of the observation points were located.
Figure 25. Flight altitudes of greylag geese expressed as the proportion of individuals (blue) and flocks (red) occurring at 13 altitude categories. The shaded blue box indicates the altitude covered by the total sweep area of the wind turbines (min. 25 - max. 227 m).
83
Estimate of collision risk at turbines and other structures An estimated 19-44 collisions between greylag geese and wind turbines are ex-pected to take place each year. The estimate is higher than the estimate obtained from the baseline studies (3-6), but similar to the result obtained from the first year post-construction period (23-52). It should be noted that the baseline study only covered some of the time during which greylag geese are present in north-west Jutland. In particular, it is important to note that during the baseline study no data were collected in August, where high numbers of greylag geese are pre-sent in the area, and that in general greylag goose numbers were higher during the post-construction study years than during the baseline study.
The tendency for greylag geese to be more active around dawn in combina-tion with the fact that this species is characterized by high wing loading and a low aspect ratio, resulting in rapid flight and low manoeuvrability, indicates that there may also be an additional risk of collisions between greylag geese and other structures at the test centre, e.g. guy wires and masts. This is partic-ularly the case in situations where visibility is reduced due to adverse weather conditions.
Final assessment The results from the second year post-construction study support our prelim-inary assessment that the potential impact of the structures at the test centre on the population of greylag geese is considered to be insignificant. We there-fore conclude that the test centre is unlikely to have negative impacts on the greylag goose population at regional, national and international levels.
Light-bellied brent goose
General occurrence Denmark is the most important wintering site for The East Atlantic (Svalbard) flyway population of the light-bellied brent goose, which breeds in the eastern and northern parts of Svalbard and to a lesser extent in northeast Greenland. The whole population assembles at a few spring staging sites in northwest Denmark prior to departure to the breeding grounds.
Temporal and spatial patterns of occurrence in the study area In the morning of May 26, three flocks of 55, 230 and 35 light-bellied brent geese were observed migrating in the vicinity of the study area. In the even-ing, another two flocks of 45 and 120 individuals were observed. In the morn-ing of May 27, three flocks of 150, 40 and 220 individuals were observed. A total of 895 individuals were observed. The flocks were initially spotted at a distance of 4-7 km from the observation station. The observations coincided with the normal northbound mass departure (Clausen et al. 2003), which was also the case during the baseline and first year post-construction studies, where 279 and 275 individuals, respectively, were observed on their north-ward migration.
The higher number of migrating individuals observed during the second year post-construction study was probably a result of the use of horizontal radar, which enabled the observer to register flocks at larger distances compared to previous study years, where observations were made by telescope.
The migration routes of some of the flocks observed during the baseline stud-ies were closer to the test centre compared to the flocks observed during the first and second year post-construction studies. This may be a result of avoid-ance, although the sample size is too small to confirm this.
84
Fox et al. (2010) estimated the East-Atlantic flyway population of light-bellied brent geese to 7,600 individuals. However, based on a more recent expert judgment, the population may have declined to 6,000 individuals in winter 2011/12 (P. Clausen, pers. comm.). This means that the 895 individuals pass-ing the study area correspond to 12-15% of the total population.
The national conservation status for the small population of light-bellied brent goose is preliminarily assessed as unfavourable-increasing (Pihl et al. 2006). Therefore the population must be considered to be highly sensitive to any ad-ditional mortality.
Final assessment The amount of data collected during the baseline and post-construction stud-ies is not sufficient to perform meaningful statistical analyses to estimate col-lision numbers for this species. However, although the amount of data is lim-ited, the second year post-construction studies confirmed that the risk of col-lisions between turbines at the test centre and light-bellied brent geese is very low. Intense fieldwork during the time of the northbound mass departure demonstrated that in the three study years only a minor fraction of the popu-lation migrated within less than 4-5 km distance to the test centre and rarely closer. The majority of the population must therefore be assumed to follow a migration route farther away from the test centre.
We therefore consider the potential negative effects of the combined struc-tures at the test centre on the population of light-bellied brent geese to be small. It should be noted that given the small size of this population even a smaller number of collisions may have a negative impact on the species.
Even though both the baseline and the post-construction studies have con-firmed that the overall migration of light-bellied brent geese is expected to be in a northerly direction, which is parallel to the north-south orientation of the test centre, different wind directions may change the migration path and, hence, the risk of collisions. Therefore, collisions between the combined struc-tures at the test centre and light-bellied brent geese cannot be excluded, alt-hough they are unlikely to occur. We therefore conclude that the test centre is unlikely to have negative impacts on the light-bellied brent goose population at regional, national and international levels.
White-tailed eagle
General occurrence The breeding population size of Danish white-tailed eagles is 87 pairs (2016), which mainly occur on Zealand, Lolland and Falster, although in recent years the population has expanded towards the western part of the country. In win-ter, white-tailed eagles from Norway, Sweden, Finland and western Russia visit Denmark. White-tailed eagle is now becoming established as a breeding bird in northwest Jutland, including the Østerild area, and an increasing num-ber of immature individuals occur in nearby Vejlerne outside the breeding season.

85
Temporal and spatial patterns of occurrence in the study area
White-tailed eagle (Fig. 26) occurred irregularly in the study area with most observations in autumn (Tab. 9). Individuals of all age classes were observed, whereas two white-tailed eagles, which were observed together on several occasions, represent a breeding pair, which has become established in the vi-cinity of the test centre. During the baseline studies only one white-tailed ea-gle was registered and therefore the number of observations made during the first and second post-construction study periods represent a marked increase in the occurrence of this species.
White-tailed eagles were observed throughout the study area (Fig. 27). There was no clear flight pattern and we assume that most of the birds observed were from the local breeding pair.
Altogether, 77.2% and 75.9% of the observed individuals and flocks, respec-tively, of white-tailed eagles occurred at rotor height (45-175 m), whereas 22.8% and 24.1% of individuals and flocks, respectively, were outside rotor height (Fig. 28).
Figure 26. White-tailed eagle has become established as a breed-ing species in the region during the study period. © Jørgen Peter Kjeldsen.
Table 9. Numbers of white-tailed eagles passing the study area on visual transects during the second post-construction study
period expressed as observed/calculated number of individuals. August September October November December January February March April May
North 0/0 4/89 3/84 0/0 0/0 1/27 0/0 0/0 1/37 1/39
South 0/0 5/113 0/0 6/162 0/0 2/56 0/0 0/0 3/112 1/39
Total 0/0 9/202 3/84 6/162 0/0 3/84 0/0 0/0 4/149 2/79

86
Final estimate of collision risk at turbines and other structures Less than one (0.14-0.32) collision between white-tailed eagle and wind tur-bines is expected to take place each year. The estimate is somewhat higher than the result obtained during the first year post-construction study (0.03-0.08), which is primarily a result of the increased occurrence of this species in the study area. The number of observations of white-tailed eagles was too small to calculate collision rates on the basis of the baseline study.
Figure 27. Overall flight patterns of white-tailed eagles in the study area, August 2015 – May 2016. Black dots indicate single obser-vation points obtained by laser range finder. Sequential observa-tions of the same flock or individ-ual are connected with a yellow line. Orange arrows indicate the flight direction, and the red bar in-dicates the distance (1,834 m) from the observer within which 90% of the observation points were located.
Figure 28. Flight altitudes of white-tailed eagles expressed as the proportion of individuals (blue) and flocks (red) occurring at 13 altitude categories. The shaded blue box indicates the altitude covered by the total sweep area of the wind turbines (min. 25 - max. 227 m).

87
The post-construction study showed that the study area is regularly used by white-tailed eagles. Even though white-tailed eagles were observed more of-ten during the post-construction studies than during the baseline studies, only very few collisions are expected. It should be note that low visibility may in-crease the risk of collisions.
Final assessment White-tailed eagle is a scarce breeding bird in Denmark, although the popu-lation has increased in recent years. The recent establishment of a breeding population in northwest Jutland and particularly in the vicinity of the test cen-tre has increased the occurrence of the species in the study area and, hence, the risk of collisions with turbines and other structures. The relatively small size of the population both at the local and regional levels means that in the case of a collision between a breeding bird and a turbine or mast, a relatively large proportion of the population will be affected. To some extent this also applies to the national population (e.g. the estimated collision frequency cor-responds to 0.2-0.5% of the total breeding population in Denmark).
Even a single white-tailed eagle fatality will have a short-term, negative im-pact on the local and regional populations. However, considering the current development of the population at all levels supporting the future recruitment of individuals to the breeding population, we conclude that the test centre is unlikely to have long-term negative impacts on the white-tailed eagle popu-lation at local, regional, national and international levels.
Peregrine falcon
General occurrence Peregrine falcon is a rare breeding bird in Denmark and most of the individ-uals observed in the country originate from northern Scandinavia. Numbers in Denmark peak during spring (April) and autumn migration (September-October).
Temporal and spatial patterns of occurrence in the study area Peregrine falcon was observed in September and March. The observations were made near the observation station in the central part of the study area. Like in previous years, the observations coincided with the autumn and spring migration periods for this species (Tab. 10, Fig. 29). It should be noted that most peregrine falcons were observed between count sessions.
The peregrine falcons observed in the study area, were therefore most likely autumn and spring staging individuals of unknown origin.
Table10. Numbers of peregrine falcons passing the study area on visual transects during the second post-construction study
period expressed as observed/calculated number of individuals. August September October November December January February March April May
North 0/0 0/0 0/0 0/0 0/0 0/0 0/0 0/0 0/0 0/0
South 0/0 1/23 0/0 0/0 0/0 0/0 0/0 2/58 0/0 0/0
Total 0/0 1/23 0/0 0/0 0/0 0/0 0/0 2/58 0/0 0/0

88
Altogether, 57.1% and 59.6% of the observed individuals and flocks, respec-tively, of peregrine falcons occurred at rotor height (min. 25 - max. 227 m), whereas 42.9% and 40.4% of the remainder of individuals and flocks, respec-tively, were below rotor height (Fig. 30).
Figure 29. Overall flight patterns of peregrine falcons in the study area, August 2015 – May 2016. Black dots indicate single obser-vation points obtained by laser range finder. Sequential observa-tions of the same flock or individ-ual are connected with a yellow line. Orange arrows indicate the flight direction, and the red bar in-dicates the distance (1,100 m) from the observer within which 90% of the observation points were located.
Figure 30. Flight altitudes of peregrine falcons expressed as the proportion of individuals (blue) and flocks (red) occurring at 13 altitude categories. The shaded blue box indicates the altitude covered by the total sweep area of the wind turbines (min. 25 - max. 227 m).

89
Final estimate of collision risk at turbines and other structures Less than one (0.04-0.09) collision between peregrine falcons and wind tur-bines is expected to take place each year. This estimate is somewhat higher than the result obtained during the baseline (0.01 collisions per year) and first year post-construction studies (0.01-0.02). It should be noted that the baseline study covered only part of the year.
The second year post-construction study confirmed the finding from previous years that the study area is only used occasionally by peregrine falcons. We therefore expect the risk of collisions with turbines and other structures at the test centre to be of minor importance, although low visibility may increase the risk of collisions. It should be noted that on some occasions peregrine falcons were observed perching on measuring masts, which may potentially increase the risk of collisions.
Final assessment The Danish breeding population of peregrine falcons is small (around 15 pairs) and vulnerable to extra mortality. However, since observations were only during passage times it highly unlikely that individuals from the Danish breeding population occurred in the area. In the case of a collision between a non-breeding individual and a turbine or other structures, a relatively large proportion of the local and regional staging or wintering population of pere-grine falcons would be affected. However, considering the continued scarce occurrence of staging or overwintering individuals in the study area, we still consider the potential negative effects on peregrine falcons to be close to neg-ligible. We therefore conclude that the test centre is unlikely to have negative impacts on the peregrine falcon population at regional, national and interna-tional levels.
Kestrel
General occurrence Kestrel is a common breeding species throughout the country. In winter, some of the population may leave Denmark, whereas during the migration periods kestrels from Scandinavia pass through the country. The Danish breeding population has declined in recent years and numbers around 1,500 pairs (Pihl & Fredshavn 2015).
Temporal and spatial patterns of occurrence in the study area Kestrels occurred in the study area from August-September and April-May, which coincided with the migration periods for the species (Tab. 11).
Most kestrels were observed near the central observation station. Like in pre-vious study years, they were probably a mixture of local and staging individ-uals commuting between roosts and different feeding areas (Fig. 31).
Table 11. Numbers of kestrels passing the study area on visual transects during the second post-construction study period ex-
pressed as observed/calculated number of individuals. August September October November December January February March April May
North 8/307 6/133 0/0 0/0 0/0 0/0 0/0 0/0 1/37 8/315
South 6/240 14/316 0/0 0/0 0/0 0/0 0/0 0/0 0/0 2/79
Total 14/547 20/449 0/0 0/0 0/0 0/0 0/0 0/0 1/37 10/394

90
Altogether, 41.3% and 42.9% of the observed individuals and flocks, respec-tively, of kestrels occurred at rotor height (min. 25 - max. 227 m), whereas 58.7% and 57.1% of individuals and flocks, respectively, were outside rotor height (Fig. 32).
Final estimate of collision risk at turbines and other structures An estimated 0.71-1.60 collisions between kestrels and wind turbines is ex-pected to take place each year. The estimate is somewhat higher that the result
Figure 31. Overall flight patterns of kestrels in the study area, Au-gust 2015 – May 2016. Black dots indicate single observation points obtained by laser range finder. Sequential observations of the same flock or individual are connected with a yellow line. Or-ange arrows indicate the flight di-rection, and the red bar indicates the distance (930 m) from the ob-server within which 90% of the observation points were located.
Figure 32. Flight altitudes of kestrels expressed as the proportion of individuals (blue) and flocks (red) occurring at 13 altitude cate-gories. The shaded blue box indicates the altitude covered by the total sweep area of the wind turbines (min. 25 - max. 227 m).

91
obtained during the first year post-construction study (0.1-0.2), but similar to the result obtained during the baseline studies although this covered only part of the year.
The second year post-construction study therefore confirmed that the study area is regularly used by kestrels, which may potentially be breeding in the vicinity or in the study area. Even though more kestrels were observed during the post-construction studies than during the baseline studies, only very few collisions are expected. This is primarily a result of the low flight height of this species. We therefore expect the risk of collisions with turbines and other structures at the test centre to be of minor importance, although low visibility may increase the risk of collisions.
Final assessment The results from the post-construction study support our preliminary assess-ment that the potential impact of the structures at the test centre on kestrels is considered insignificant. We therefore conclude that the test centre is unlikely to have negative impacts on the kestrel population at regional, national and international levels.
Marsh harrier
General occurrence Marsh harrier is a common breeding bird in Denmark. Numbers in Denmark peak during spring (April) and autumn migration (late August-early Septem-ber). In winter, the birds leave the country. The Danish breeding population has been stable in recent years and numbers around 650 pairs (Pihl & Fred-shavn 2015).
Temporal and spatial patterns of occurrence in the study area Marsh harrier was observed in August, April and May. Most observations were made in August (Tab. 12) close to the observation station in the central part of the study area (Fig. 33). This was also the case in previous years and this pattern probably reflects that in most cases flight altitude of marsh harri-ers was low making it difficult to detect individuals at larger distances. There-fore more individuals may have occurred in other parts of the study area. The birds occurring in the study area were probably both migrants and local breeders from nearby wetlands, i.e. Vejlerne.
The occurrence of marsh harriers in the study area varied markedly between study years. This probably reflects yearly fluctuation in the size of the local breeding population.
Table 12. Numbers of marsh harriers passing the study area on visual transects during the second post-construction study pe-
riod expressed as observed/calculated number of individuals. August September October November December January February March April May
North 10/384 0/0 0/0 0/0 0/0 0/0 0/0 0/0 0/0 3/118
South 2/80 0/0 0/0 0/0 0/0 0/0 0/0 0/0 3/112 0/0
Total 12/464 0/0 0/0 0/0 0/0 0/0 0/0 0/0 3/112 3/118

92
Altogether, 48.8% and 48.8% of the observed individuals and flocks, respec-tively, of marsh harriers occurred at rotor height (min. 25 - max. 227 m), whereas 51.2% and 51.2% of individuals and flocks, respectively, were outside rotor height (Fig. 34).
Figure 33. Overall flight patterns of marsh harriers in the study area, August 2015 – May 2016. Black dots indicate single obser-vation points obtained by laser range finder. Sequential observa-tions of the same flock or individ-ual are connected with a yellow line. Orange arrows indicate the flight direction, and the red bar in-dicates the distance (956 m) from the observer within which 90% of the observation points were lo-cated.
Figure 34. Flight altitudes of marsh harriers expressed as the proportion of individuals occurring at 13 altitude categories. The shaded blue box indicates the altitude covered by the total sweep area of the wind turbines (min. 25 - max. 227 m).

93
Final estimate of collision risk at turbines and other structures Less than one (0.37-0.83) collision between marsh harriers and wind turbines are expected to take place each year. This estimate is somewhat higher than the result obtained during the first year post-construction (0.12-0.20) and base-line studies. It should be noted that the baseline studies covered only part of the year.
Our study showed that the study area is regularly used by marsh harriers, which may potentially be breeding in the vicinity or in the study area. Even though more marsh harriers were observed in the study area than during both the baseline and post-construction studies, only very few collisions are ex-pected. This is primarily a result of the low flight height of this species. We therefore expect the risk of collisions with turbines and other structures at the test centre to be of minor importance, although low visibility may increase the risk of collisions.
Final assessment Although the size of the regional population in northwest Jutland remains unknown and the calculated number of collisions must be regarded as a crude estimate, the potential negative effects of the combined structures at test cen-tre on marsh harriers is considered insignificant. Even a single marsh harrier fatality will have a short-term, negative impact on the local and regional pop-ulations. We therefore conclude that the test centre is unlikely to have nega-tive impacts on the marsh harrier population at local, regional, national and international levels.
Hen harrier
General occurrence Hen harrier is an extremely rare breeding bird in Denmark and most of the individuals observed in the country are migrants originating from Northern Scandinavia. Numbers in Denmark peak during spring (April) and autumn migration (October). During winter, hen harriers occur throughout the coun-try, although in small numbers.
Temporal and spatial patterns of occurrence in the study area Small numbers of hen harriers were observed in September-March and in May (Tab. 13, Fig. 35). Most observations were made close to the observation station and the relatively few observations of hen harriers probably reflect difficulties detecting low-flying individuals at longer distances. Like in previ-ous years, the hen harriers observed in the study area were probably autumn and spring staging individuals of unknown origin.
Table 13. Numbers of hen harriers passing the study area on visual transects during the second post-construction study period
expressed as observed/calculated number of individuals. August September October November December January February March April May
North 0/0 0/0 0/0 2/53 0/0 0/0 1/35 2/56 0/0 1/39
South 0/0 2/45 2/57 1/27 1/27 2/56 0/0 0/0 0/0 0/0
Total 0/0 2/45 2/57 3/80 1/27 2/56 1/35 2/56 0/0 1/39

94
Altogether, 27.9% and 29.5% of the observed individuals and flocks, respec-tively, of hen harriers occurred at rotor height (min. 25 - max. 227 m), whereas 72.1% and 70.5% of individuals and flocks, respectively, were below rotor height (Fig. 36).
Figure 35. Overall flight patterns of hen harriers in the study area, August 2015 – May 2016. Black dots indicate single observation points obtained by laser range finder. Sequential observations of the same flock or individual are connected with a yellow line. Or-ange arrows indicate the flight di-rection, and the red bar indicates the distance (885 m) from the ob-server within which 90% of the observation points were located.
Figure 36. Flight altitudes of hen harriers expressed as the proportion of individuals (blue) and flocks (red) occurring at 13 alti-tude categories. The shaded blue box indicates the altitude covered by the total sweep area of the wind turbines (min. 25 - max. 227 m).

95
Final estimate of collision risk at turbines and other structures Less than one (0.37-0.83) collision between hen harriers and wind turbines are expected to take place each year. The estimated number of collisions is some-what higher than during the first year post-construction (0.004-0.008) and baseline studies (0.005). It should be noted that the baseline study covered only part of the year. The second year post-construction study confirmed that the study area is only used occasionally by hen harriers and we therefore still expect the risk of collisions with turbines and other structures at the test centre to be of minor importance, although low visibility may increase the risk of collisions.
It should be noted that these results are supported by other studies, which typically have shown a strong propensity for hen harriers to fly at low eleva-tions. In general, it seems that hen harriers do not appear to be susceptible to colliding with turbine blades and that collision mortality should rarely be a serious concern (Whitfield & Madders 2005).
Final assessment Hen harrier is an extremely rare and irregular breeding bird in Denmark and therefore vulnerable to additional mortality. Therefore, in the case of a colli-sion between a breeding bird and a turbine or other structures, a relatively large proportion of the Danish population would be affected. This also applies to the scarce regional population. However, considering that absence of breeding pairs in north Jutland and the relatively limited occurrence of stag-ing or overwintering individuals in the study area, which probably originate from north Scandinavian breeding populations, we still consider the potential negative effects on this population to be negligible. We therefore conclude that the test centre is unlikely to have negative impacts on the hen harrier population at local, regional, national and international levels.
Buzzard
General occurrence Buzzard is the most common breeding bird of prey in Denmark. In recent years, the population has increased to 6,000 pairs. During spring and autumn migration, buzzards from Norway, Sweden and Finland pass through Den-mark. Many of the Scandinavian buzzards overwinter in Denmark (Fig. 37).
Figure 37. Buzzards occur in the study area throughout the year. © Jørgen Peter Kjeldsen.

96
Temporal and spatial patterns of occurrence in the study area Like in previous years, buzzards were observed throughout the study period. Peak numbers were observed in August-September and March-April. In both autumn and spring the peak coincided with the timing of the migration of Scandinavian buzzards (Tab. 14).
Buzzards were observed throughout the study area, although fewer observa-tions were made in the southern parts (Fig. 38).This was also the case during previous years and may reflect that low flying individuals and flocks may be difficult to see at greater distances. The overall flight pattern suggests that the majority of buzzards observed in the study area were local breeding and stag-ing individuals commuting between roosts and different feeding areas and not true migrants.
Table 14. Numbers of buzzards passing the study area on visual transects during the second post-construction study period
expressed as observed/calculated number of individuals. August September October November December January February March April May
North 26/998 22/489 5/139 3/79 5/128 8/219 6/212 34/960 31/1156 14/552
South 8/320 3/68 2/57 2/54 1/27 3/85 4/142 9/259 21/783 14/552
Total 34/1318 25/556 7/196 5/133 6/156 11/304 10/354 43/1219 52/1939 28/1103
Figure 38. Overall flight patterns of buzzards in the study area, Au-gust 2015 – May 2016. Black dots indicate single observation points obtained by laser range finder. Sequential observations of the same flock or individual are connected with a yellow line. Or-ange arrows indicate the flight di-rection, and the red bar indicates the distance (1,276 m) from the observer within which 90% of the observation points were located.

97
Altogether, 72.0% and 75.1% of the observed individuals and flocks, respec-tively, of buzzards occurred at rotor height (min. 25 - max. 227 m), whereas 28.0% and 24.9% of individuals and flocks, respectively, were outside rotor height (Fig. 39).
Final estimate of collision risk at turbines and other structures An estimated 1.2-2.7 collisions between buzzards and wind turbines are ex-pected to take place each year. The estimate is similar to the result obtained during the baseline (0.71 collision per year) and first year post-construction (0.8-1.7). It should be noted that the baseline study covered only part of the year.
Even though more buzzards were observed in the study area during the post-construction studies than during the baseline studies, only few collisions are expected. We therefore expect the risk of collisions with turbines and other structures at the test centre to be of minor importance, although low visibility may increase the risk of collisions.
It should be noted that on some occasions buzzards were observed perching on guy wires, which may potentially increase the risk of collisions, particu-larly during periods with low visibility.
Final assessment The estimated collision frequency corresponds to 0.02-0.05% of the size the Danish breeding population, which amounts to 6.000 pairs. Although the size of the regional population in northwest Jutland remains unknown and the calculated number of collisions must be regarded as a crude estimate, the po-tential impact of the combined structures at test centre on buzzards is still considered to be insignificant. We therefore conclude that the test centre is unlikely to have negative impacts on the hen harrier population at local, re-gional, national and international levels.
Figure 39. Flight altitudes of buzzards expressed as the proportion of individuals (blue) and flocks (red) occurring at 13 altitude categories. The shaded blue box indicates the altitude covered by the total sweep area of the wind turbines (min. 25 - max. 227 m).

98
Common crane
General occurrence Common crane is a scarce breeding bird in Denmark. In recent years, the pop-ulation has increased to around 140-168 pairs the majority of which breeds in northwest Jutland (Nyegaard 2012). During spring and autumn migration, common cranes from Scandinavia pass through Denmark. In mild winters, some individuals may overwinter. In Denmark, the most important breeding sites, some of which have been designated SPAs for this species, are located in Thy, near the test centre. In recent years, nearby Vejlerne has become an important autumn staging site (September-November) for common crane with more than 200 individuals present. In recent years, common crane has become established as a breeding bird in the study area with up to three ter-ritories identified in the northern part of the study area.
Temporal and spatial patterns of occurrence in the study area Common cranes were observed in the study area in August-October and in February-May. No observations were made from November-January. High-est numbers were observed in October, which probably is a result of the re-gional breeding population concentrating in nearby Vejlerne (Tab. 15). Many of the individuals observed in spring were probably local breeders and indi-viduals that have not reached the age of maturity (4 years).
The temporal pattern is similar to what was observed in previous years, alt-hough no data were collected in early spring 2011.
Most of the common cranes were tracked in the northern part of the study area (Fig. 40). The flight patterns support the initial assumption that the com-mon cranes observed in the study area are not migrants but mainly commute between feeding areas and nocturnal roosts or breeding sites in the northern part of the study area.
Altogether, 49.4% and 59.7% of the observed individuals and flocks, respec-tively, of common cranes occurred at rotor height (min. 25 - max. 227 m), whereas 50.6% and 40.3% of individuals and flocks, respectively, were outside rotor height (Fig. 41).
Table 15. Numbers of common cranes passing the study area on visual transects during the second post-construction study
period expressed as observed/calculated number of individuals. August September October November December January February March April May
North 3/115 1/22 0/0 0/0 0/0 0/0 3/106 7/198 15/559 4/158
South 0/0 0/0 14/399 0/0 0/0 0/0 0/0 0/0 2/57 2/60
Total 3/115 1/22 14/399 0/0 0/0 0/0 5/171 10/282 11/314 5/148

99
Final estimate of collision risk at turbines and other structures An estimated 0.6-1.3 collisions between common cranes and wind turbines are expected to take place each year. This estimate is higher than the result obtained during the baseline (0.37 collision per year) and first post-construc-tion year (0.01-0.03) studies. It should be noted that the baseline study covered only part of the year.
Figure 40. Overall flight patterns of common cranes in the study area, August 2015 – May 2016. Black dots indicate single obser-vation points obtained by laser range finder. Sequential observa-tions of the same flock or individ-ual are connected with a yellow line. Orange arrows indicate the flight direction, and the red bar in-dicates the distance (2,025 m) from the observer within which 90% of the observation points were located.
Figure 41. Flight altitudes of common cranes expressed as the proportion of individuals (blue) and flocks (red) occurring at 13 altitude categories. The shaded blue box indicates the altitude covered by the total sweep area of the wind turbines (min. 25 - max. 227 m).

100
Since no data have been collected during summer it still remains unknown whether non-breeding individuals may use the study area during this period. With regard to local breeders, we assume that flight activity is limited at this time of the year since adults are expected to be guarding nests and young.
The tendency for common cranes to be more active around and before dawn and the fact that that cranes are characterized by high wing loading and a low aspect ratio, resulting in rapid flight and low maneuverability (Bevanger 1998), means that there may also be an additional risk of collisions between this species and other structures at the test centre, e.g. guy wires and masts. This is particularly the case in situations where visibility is reduced due to adverse weather conditions.
Final assessment Common crane is a scarce breeding bird in Denmark, although the population has increased in recent years. The relatively small size of the population means that in the case of a collision between a breeding bird and a turbine or mast, a relatively large proportion of the local and the regional populations would be affected. Although our study shows that only a small number of collisions are expected, the establishment of common crane as a breeding bird within the study area may potentially increase the risk of collisions with tur-bines and masts.
At nearby wind park Klim Fjordholme Kahlert et al. (2012b) estimated that around 4-7 collisions between common cranes and wind turbines would take place each year. Subsequently Kahlert (2011) concluded that negative impacts on the population could not be excluded, although they were unlikely to occur (e.g. the number of collisions was below the threshold that would negatively affect the future positive development of the population). Kahlert (2011) based this assessment on the fact that the Danish breeding population is expanding rapidly and that breeders are probably being recruited from populations around the Baltic Sea. Kahlert also stated that over time continued population growth will increase the resilience in the population towards added mortality. It is therefore important to note that the common crane population in northwest Jutland and Denmark has increased markedly since this estimate was calcu-lated and that the increase must be expected to continue in the future.
Even a single common crane fatality will have a short-term, negative impact on the local and regional populations. However, considering the current pos-itive development of the Danish breeding population at all levels and the as-sessment made for nearby wind park Klim Fjordholme (Kahlert 2011), we con-clude that the test centre is unlikely to have long-term negative impacts on the common crane population at local, regional, national and international levels.
Golden plover
General occurrence Golden plover is an extremely rare breeding bird in Denmark. The Danish breeding birds belong to the southern form Pluvialis a. apricaria that, similarly to the northern golden plovers Pluvialis a. altifrons, winter in Western Europe. From March to May, 70,000-100,000 northern golden plovers stage in Denmark, particularly in the Wadden Sea, west and north Jutland. From July to Novem-ber, when numbers peak, the birds are dispersed throughout the country.

101
Temporal and spatial patterns of occurrence in the study area Golden plovers occurred in the study area from August-November and in April.
In autumn, highest numbers of golden plovers were registered in September (Tab. 16). The overall pattern was similar to previous years, although no ob-servations were made in spring during the baseline studies.
Golden plovers were mainly observed near the central observation station (Fig. 42). This was also the case in previous study years.
Altogether, 97.0% and 99.8% of the observed individuals and flocks, respec-tively, of golden plovers occurred at rotor height (min. 25 - max. 227 m), whereas 3.0% and 0.2% of individuals and flocks, respectively, were below rotor height (Fig. 43).
Table 16. Numbers of golden plovers passing the study area on visual transects during the second post-construction study pe-
riod expressed as observed/calculated number of individuals. August September October November December January February March April May
North 15/576 536/11905 25/697 1/26 0/0 0/0 0/0 0/0 90/3356 0/0
South 9/360 239/5387 0/0 0/0 0/0 0/0 0/0 0/0 0/0 0/0
Total 24/936 775/17292 25/697 1/26 0/0 0/0 0/0 0/0 90/3356 0/0
Figure 42. Overall flight patterns of golden plovers in the study area, August 2015 – May 2016. Black dots indicate single obser-vation points obtained by laser range finder. Sequential observa-tions of the same flock or individ-ual are connected with a yellow line. Orange arrows indicate the flight direction, and the red bar in-dicates the distance (1,118 m) from the observer within which 90% of the observation points were located.

102
Final estimate of collision risk at turbines and other structures An estimated 7-15 collisions between golden plovers and wind turbines are expected to take place each year. This is somewhat lower than the estimate obtained from the baseline studies (65), but higher than during the first post-construction study (3-7). It should be noted that the baseline study covered only some of the time during which golden plovers are present in northwest Jutland and that one single observation of golden plovers accounted for 96% of the total number of individuals registered on visual transects during the baseline study.
The second year post-construction study therefore confirmed the result of the previous years that only a few collisions between golden plovers and wind turbines are expected to occur each year.
We assume that the majority of golden plovers registered in the study area were spring and autumn staging individuals moving between feeding areas. This is supported by the relatively low flight altitude registered for golden plovers. We consider it to be highly unlikely that individuals from the Danish breeding pop-ulation were among the golden plovers registered in the study area.
Since golden plovers feed during both day and night there may be an addi-tional risk of collisions between this species and other structures at the test centre, e.g. guy wires and masts. During the day, this may also be the case in situations where visibility is reduced due to adverse weather conditions.
Final assessment The results from the second year post-construction study support our previ-ous assessment that the potential impact of the structures at the test centre on golden plovers is considered to be insignificant. We therefore conclude that the test centre is unlikely to have negative impacts on the golden plover pop-ulation at local, regional, national and international levels.
Figure 43. Flight altitudes of golden plovers expressed as the proportion of individuals (blue) and flocks (red) occurring at 13 altitude categories. The shaded blue box indicates the altitude covered by the total sweep area of the wind turbines (min. 25 - max. 227 m).

103
Wood pigeon
General occurrence The Danish population of wood pigeons has increased in recent years and more than 250,000 pairs breed throughout the country. During migration in autumn and spring wood pigeons originating from breeding areas in Scandi-navia pass through the country. Some of these stay to overwinter.
Temporal and spatial patterns of occurrence in the study area Wood pigeons were registered in the study area throughout the study period. Most birds occurred in the study area in October, which coincided with the peak migration period of this species (Tab. 17). This was also the case during the baseline and first year post-construction studies, although numbers were somewhat lower than during the first year post-construction period. Outside the migration periods the birds observed in the study area were probably a mixture of local and staging individuals commuting between roosts and dif-ferent feeding areas.
Most wood pigeons were observed close to the observation station. However, the low flight altitude of wood pigeons may hinder the detection of individu-als and flocks at larger distances. Therefore more individuals may have oc-curred in other parts of the study area (Fig. 44).
Table 17. Numbers of wood pigeons passing the study area on visual transects during the second post-construction study pe-
riod expressed as observed/calculated number of individuals. August September October November December January February March April May
North 12/461 25/555 69/1924 12/315 56/1438 17/466 3/106 10/282 25/932 20/788
South 15/600 22/496 8/228 0/0 25/683 1/28 27/956 15/432 11/410 20/788
Total 27/1061 47/1051 77/2152 12/315 81/2122 18/494 30/1062 25/714 36/1343 40/1576
Figure 44. Overall flight patterns of wood pigeons in the study area, August 2015 – May 2016. Black dots indicate single obser-vation points obtained by laser range finder. Sequential observa-tions of the same flock or individ-ual are connected with a yellow line. Orange arrows indicate the flight direction, and the red bar in-dicates the distance (1,005 m) from the observer within which 90% of the observation points were located.

104
Altogether, 67.8% and 78.9% of the observed individuals and flocks, respec-tively, of wood pigeons occurred at rotor height (min. 25 - max. 227 m), whereas 32.2% and 21.1% of individuals and flocks, respectively, were below rotor height (Fig. 45).
Final estimate of collision risk at turbines and other structures An estimated 7-17 collisions between wood pigeons and wind turbines are ex-pected to take place each year. This is higher than the estimate obtained from the baseline (0.91) and first year post-construction studies (0.5-1.2). It should be noted that the baseline study covered only part of the year. Even though the estimated number of collisions was higher than in previous years, the second year post-construction study confirmed that relatively few collisions between wood pigeons and wind turbines are expected to occur each year.
Like in previous years, there were no indications of extensive seasonal migra-tion taking place during the migration periods and we therefore assume that the majority of wood pigeons registered in the study area were either local or staging birds. This is supported by the relatively low flight altitude and small flock size observed among wood pigeons.
There may be an additional risk of collisions between wood pigeons and other structures at the test centre, e.g. guy wires and masts. This is particularly the case in situations where visibility is reduced due to adverse weather condi-tions, or around dusk.
Final assessment The results from the second year post-construction study support our previ-ous assessment that the potential impact of the structures at the test centre on the population of wood pigeons is considered to be insignificant. Although the calculated number of collisions must be regarded as a crude estimate, the potential impact of the combined structures at the test centre on wood pigeons is still considered to be insignificant. We therefore conclude that the test centre is unlikely to have negative impacts on the wood pigeon population at local, regional, national and international levels.
Figure 45. Flight altitudes of wood pigeons expressed as the proportion of individuals (blue) and flocks (red) occurring at 13 altitude categories. The shaded blue box indicates the altitude covered by the total sweep area of the wind turbines (min. 25 - max. 227 m).

105
Common raven
General occurrence In recent decades, the Danish population of common raven has increased dra-matically and today more than 500 breeding pairs are scattered throughout the country. However, relatively few pairs are found in northwest Jutland.
Temporal and spatial patterns of occurrence in the study area Common raven occurred in small numbers from August-March and in May (Tab. 18). The occurrence is similar to the baseline and first year post-construc-tion studies. It should be noted that most common ravens were observed be-tween count sessions.
Most common ravens were observed close to the central observation station. This was also the case during the baseline and first year post-construction studies and this pattern probably reflects that in most cases flight altitude of common ravens was low making it difficult to detect individuals at larger dis-tances. Therefore more individuals may have occurred in other parts of the study area (Fig. 46).
Altogether, 65.0% and 67.7% of the observed individuals and flocks, respec-tively, of common ravens occurred at rotor height (min. 25 - max. 227 m), whereas 34.9% and 32.2% of the remainder of individuals and flocks, respec-tively, were below rotor height (Fig. 47).
Table 18. Numbers of common ravens passing the study area on visual transects during the second post-construction study
period expressed as observed/calculated number of individuals. August September October November December January February March April May
North 1/38 2/44 3/84 2/53 1/26 5/137 1/35 2/56 0/0 0/0
South 0/0 1/23 2/57 0/0 1/27 0/0 1/35 3/86 0/0 1/39
Total 1/38 3/67 5/141 2/53 2/53 5/137 2/71 5/143 0/0 1/39
Figure 46. Overall flight patterns of common ravens in the study area, August 2015 – May 2016. Black dots indicate single obser-vation points obtained by laser range finder. Sequential observa-tions of the same flock or individ-ual are connected with a yellow line. Orange arrows indicate the flight direction, and the red bar in-dicates the distance (1,145 m) from the observer within which 90% of the observation points were located.

106
Final estimate of collision risk at turbines and other structures Less than one collision (0.2-0.4) between common raven and wind turbines is expected to take place each year. This estimate is higher than the results ob-tained during the baseline (0.08 collision per year) and first year post-con-struction (0.03-0.05) studies. It should be noted that the baseline study covered only part of the year.
The second year post-construction study therefore confirmed the results of the baseline and first year post-construction studies that only a few collisions between common ravens and wind turbines are expected to occur each year.
There were no indications of extensive seasonal migration taking place during the migration periods and we therefore assume that the majority of common ravens registered in the study were local birds. This was also the case during the previous study years.
There may be an associated risk of collisions between common ravens and other structures at the test centre, e.g. guy wires and masts. This is particularly the case in situations where visibility is reduced due to adverse weather con-ditions and around dusk. However, common raven is not active during night, when risk of collision is highest.
Final assessment Since common raven is a scarce breeding species in northwest Jutland, a col-lision between a breeding bird and a turbine or other structures will affect a relatively large proportion of the local population. On the other hand, ravens typically have large non-breeding elements to their population, so the re-moval of breeders will potentially enable recruitment from these birds. Alto-gether, in the light of the low risk of collision between common ravens and the combined structures at the test centre and the dramatic increase in the population during the last decades, we still consider the potential negative effect on common raven to be negligible. We therefore conclude that the test centre is unlikely to have negative impacts on the common raven population at local, regional, national and international levels.
Figure 47. Flight altitudes of common ravens expressed as the proportion of individuals (blue) and flocks (red) occurring at 13 altitudecategories. The shaded blue box indicates the altitude covered by the total sweep area of the wind turbines (min. 25 - max. 227 m).

107
Passerines
General occurrence Passerines (Order: Passeriformes) (Fig. 48) comprise a diverse group of spe-cies ranging from the very small goldcrests (9 cm body length) to the larger ravens (65 cm body length). Passerines occur in Denmark throughout the year both as breeding birds and as migrants, mainly from Northern Scandinavia, which stage or overwinter for shorter or longer periods. With the onset of cold weather and snow, many passerines migrate further south. Passerine mi-grants are usually divided into diurnal (e.g. swallows, larks, wagtails and pip-its) and nocturnal migrants (e.g. thrushes, warblers and flycatchers). How-ever, this strict separation is weakened amongst some species, which may prolong their migration into day or night when crossing ecological barriers, such as oceans. Here we focus on passerines observed during daytime, whereas the nocturnal migration is addressed below. Corvids (e.g. hooded crow, jackdaw) have been excluded from this part of the analysis and instead common raven is included as a representative of this group.
Figure 48. A flock of common starlings perching on one of the measuring masts in the study area. © Jørgen Peter Kjeldsen.

108
Temporal and spatial patterns of occurrence in the study area Passerines occurred in the study area throughout the study period (Tab. 19). Numbers peaked from August-September, which probably reflects the pres-ence of local breeding birds in combination with an influx of northern Scan-dinavian birds at this time. Even though the calculated numbers may seem high, it is important to keep in mind that these include a wide range of species (Appendix B1).
For the smaller species such as swallows, wagtails, finches and thrushes, de-tection is difficult at distances beyond 5-600 m, unless birds occur in dense flocks. Therefore passerines were mainly observed near the observation sta-tions and only few flight tracks were obtained (Fig. 49). This was also the case during the baseline and first year post-construction study periods.
Altogether, 56.6% and 50.8% of the observed individuals and flocks, respec-tively, of passerines occurred at rotor height (min. 25 - max. 227 m), whereas 43.4% and 49.2% of the remainder of individuals and flocks, respectively, were outside rotor height (Fig. 50).
Table 19. Numbers of passerines passing the study area on visual transects during the second post-construction study period
expressed as observed/calculated number of individuals. August September October November December January February March April May
North 1583/60757 523/11617 229/6384 66/1734 265/6806 80/2191 52/1841 70/1976 26/970 33/1300
South 737/29490 597/13455 56/1596 134/3619 84/2297 1/28 1/35 141/4059 7/261 18/709
Total 2320/90248 1120/25072 285/7980 200/5354 349/9102 81/2219 53/1877 211/6035 33/1231 51/2009
Figure 49. Overall flight patterns of passerines in the study area, August 2015 – May 2016. Black dots indicate observation points obtained by laser range finder. Sequential observations of the same flock or individual are con-nected with a yellow line. Orange arrows indicate the flight direc-tion, and the red bar indicates the distance (745 m) from the ob-server within which 90% of the observation points were located.

109
Final estimate of collision risk at turbines and other structures An estimated 7-19 collisions between passerines and wind turbines are ex-pected to take place each year. The estimate is higher than the estimate ob-tained from the first year post-construction study (3-5 collisions per year).
No attempt was made to calculate collision estimates on the basis of the rather limited data, which was available from the baseline study. This was partly due to the fact that most passerines were observed close to the observation station and therefore not representative for the study area as a whole. This was also the case during the post-construction study, although this covered most of the year. Therefore the expected number of collisions, which is based on a relatively lim-ited amount of data, should be interpreted with some caution.
The post-construction study confirmed the pattern from previous years. Therefore the expected number of collisions between wind turbines and pas-serines during daytime is low.
It is important to appreciate the difficulties of detecting smaller passerines at distances beyond 5-600 m also apply to birds passing the test area at high al-titudes. However, the relatively few observations of passerines at altitudes between 50-100 m indicate that this was not a case of birds being overlooked. On the basis of the relatively low flight altitude of passerines registered in the study area, we consider the majority of daytime passerines to be local birds moving between feeding areas. This was also the case during the baseline and first year post-construction studies.
The second year post-construction study confirmed the conclusion of the baseline and first year post-construction studies that migrating passerines are not concentrated in the study area.
The relatively low wing loading and high manoeuvrability of most passerines may contribute to reduce risk of collisions between passerines and the struc-tures at the test centre. However, this may not be the case in situations, where visibility is reduced due to adverse weather conditions.
Figure 50. Flight altitudes of passerines expressed as the proportion of individuals (blue) and flocks (red) occurring at 13 altitude categories. The shaded blue box indicates the altitude covered by the total sweep area of the wind turbines (min. 25 - max. 227 m).

110
Final assessment In general, passerines are suggested to be among the bird species least suscep-tible to additional mortality from wind turbines and other structures. In addi-tion, Erickson et al. (2005) point to the fact that even for nocturnal migrants global collision estimates clearly indicate that the numbers of casualties at wind farms are at least three orders of magnitudes lower than the numbers killed by collisions with buildings, power lines and air fields. Therefore, although the ex-pected number of collisions for this group of species should be regarded as a crude estimate, we still consider the potential effects of the combined structures at the test centre on passerines active at daytime to be insignificant. We there-fore conclude that the test centre is unlikely to have negative impacts on the passerine populations at local, regional, national and international levels.
Nightjar
General occurrence In Denmark, the breeding population of nightjars is concentrated in western and northern Jutland, with smaller numbers breeding in northern Zealand. In winter, the population leaves the country. In recent years, 5-6 breeding pairs have been registered in the vicinity of the study area (Niels Odder, pers. comm.). This was confirmed during the first year post-construction study, where five territories were identified in the northern part of study area.
Occurrence in the study area During our field work, we identified 5-7 territories on the basis of the presence of advertising males. They were all situated in the northern part of the study area and therefore we concentrated our activities to this area. Altogether, 7 males were captured from June 22-July 21. Unfortunately, we only retrieved GPS data from a single bird, which was tagged on June 25 and recaptured June 29. The logger recorded positions from June 26 at 22:00 until the nightjar was recaptured shortly after initiating foraging on June 29 at 23:45. We were therefore able to follow the foraging movements of the nightjar for three con-secutive nights, i.e. June 26-27, 27-28 and 28-29 (Fig. 51).
The first night, the nightjar was initially foraging around the territory, where it had been caught the previous night. Apparently the bird had spent the day roosting in this area. In the early morning it moved a short distance in a north-westerly direction and spent some time foraging in this area before spending the day roosting there. The second night it returned to the territory where it was foraging for a few hours before heading to the southern part of the study area. It spent some time foraging near the measuring masts west of test site 4 before spending the day roosting in this area. The third night it returned immediately to the territory, where it was foraging for a while before returning to the area west of test site 4 again. Shortly after it headed to the northern part of the area again, where it was foraging both in the territory and in the area where it had spent the day roosting two days before. It spent the day roosting in the same area, where it roosted after the first night. The fourth night it returned almost immediately to the territory, where it subsequently was recaptured.
The movements of nightjar showed that it used a large part of the study area for foraging. The maximum distance between GPS positions was more than four kilometers. The nightjar was foraging in close proximity to both light and measuring masts, but we recorded no foraging activity around wind turbines, even though the nightjar crossed the line of turbines on 3-4 occasions.

111
Final assessment Little is known about the behaviour of nightjars in relation to land based wind turbines and the associated mortality risks. It has been suggested that forag-ing nightjars may be attracted to insects resting on turbine towers, which may increase the risk of fatalities. Unfortunately, the GPS data obtained from the single male, which we were able to track for three nights, is insufficient to draw any conclusions with regard to the foraging patterns of nightjars and associated risk of collision between wind turbines and masts.
The Danish breeding population of nightjars is around 550 pairs (Pihl & Fred-shavn 2015) and the population appears to be stable. Northwest Jutland holds one of the densest populations in Denmark and in summer 2007, Jensen (2007) registered 117 pairs in 6 of the most important breeding areas in Thy. This was an increase of around 50% since the last count in 1994-95.
The relatively small size of the population means that in the case of a collision between a breeding bird and a turbine or mast, a relatively large proportion of the local and the regional populations will be affected. Indeed, the presence of breeding pairs within the study area may potentially increase the risk of collisions with turbines and masts. However, the fact that no nightjars were found during the carcass searches in both the first and second year post-con-struction studies indicates that the collision risk is low.
Unfortunately, our attempt to track foraging nightjars to investigate the extent to which they feed in the proximity of wind turbines and masts was unsuc-cessful. This part of our study therefore added limited value to our assessment of potential negative impacts at the local breeding population of nightjars.
Although a single nightjar fatality will have a short-term, negative impact on the local and regional breeding populations, we conclude that the test centre is unlikely to have long-term negative impacts on the nightjar population at local, regional and national levels.
Figure 51. The map shows the movements of an adult male nightjar from June 26-29 2016.

112
Avoidance Among the 29 species for which there were enough observations to perform the analysis, 18 species did not change their flight altitude in response to the wind turbines (Table tx1). However, several species showed significantly dif-ferent flight altitudes during post-construction compared to the baseline study period. Osprey, whooper swan, pink-footed goose and herring gull generally increased their flight altitude during post-construction compared to the baseline study period. In contrast, merlin and peregrine falcon lowered their flight altitude during post-construction compared to the baseline study period (Fig. 52, Table tx1). The mixed model suggested that pink-footed goose and whooper swan generally increased flight altitude when approaching the study area, although the estimates for the slopes were not significant (pink-footed goose: slope=-0.008, t432=1.59, p=0.113; whooper swan: slope=-0.004, t438=1.76, p=0.079).
The significant interaction effects seen for mute swan, greylag goose, taiga bean goose, common gull, golden plover and kestrel indicated another inter-esting type of avoidance. During the post-construction study period, these species changed their flight altitude in response to the distance to the wind turbines when compared to the baseline. Greylag goose and taiga bean goose increased their altitude when approaching the wind turbines. Interestingly, most of them did, however, not reach flight altitudes higher than the rotor height of the wind turbines.
Mute swan, golden plover and common gull also showed significant interac-tion effects between distance and context, but tended to fly at lower altitudes when approaching the wind turbines, i.e. they attempted to fly below rotor height. In this case the least square means estimate also suggest that on aver-age they did not fly below rotor height.
The bird usage of the area around wind turbines during post-construction could be tested relative to the observed usage of the study area during the baseline study period. The cumulative distribution of distances indicated that buzzards and common cranes increased the distance to wind turbines compared to the observation from the baseline stud. Apparently, pink-footed goose and lapwing passed closer to the wind turbines during post-construction compared to the baseline study period. Greylag goose, hooded crow, whooper swan and pere-grine falcon did not show significant deviations in area usage when comparing baseline and post-construction study periods (Table tx2).
Figure 52. Least square means estimates of flight altitude during baseline and post-construction contexts for species where the baseline/post-construction con-text was significant, and where the interaction with baseline/post-construction context did not show significance (Table T1).

113
The measuring masts also affected the area usage for some species (Table tx3). Kestrel, taiga bean goose and cormorants used areas close to the masts more during post-construction than during the baseline study period. Several other species such as greylag goose, pink-footed goose, buzzard, whooper swan, common crane and lapwing seemed to avoid the area close to the masts dur-ing post-construction compared to the baseline study period. For hen harrier, hooded crow and wood pigeon the area usage did not differ between the two study periods (Table t3x).
The measurements of the minimum distance (estimated from the line between two consecutive observation points) to the measuring masts resulted in much fewer observations. The analysis had therefore less statistical power to detect differences between baseline and post-construction study periods. The Kol-mogorov-Smirnoff test did not detect significant differences between the two study periods for any of the species with at least five observations (Table tx4).
Altogether, birds passed the line of wind turbines further away from the tur-bines during post-construction compared to the baseline study period (Figure 53, Kolmogorov-Smirnoff test KSa=1.99, D=0.14, p=0.0007). Only for 9 species a sufficient number of observations were available from both the baseline and post-construction study periods. Of the nine species, only common crane, whooper swan and greylag goose showed a significant shift in distance dis-tribution when comparing the two study periods (Table tx5).
To sum up, the analysis of avoidance showed the following:
• Many species actively avoided both wind turbines and measuring masts • Several species also showed vertical avoidance in relation to wind turbines • Many species seemed quite capable of reducing the risk of collision with
wind turbines and measuring masts by avoidance behavior. • The active avoidance in both vertical and horizontal dimensions may also
explain some of the discrepancy between collision estimates obtained by the Band method and the lack of fatalities found during the carcass searches. The Band model assumes a uniform distribution of bird flights in the area. This is opposed to our analyses which indicate that several species actively avoid the wind turbines and measuring masts. Hence, our analysis suggests that the Band model has a tendency to overestimate col-lision risk.
Figure 53. Cumulative distribu-tion of minimum distance when passing the line of wind turbines during the baseline (blue line) and post-construction (red line) study periods for all bird species. The fact that the curve for post-construction is lower than for the baseline study period indicates that birds used the area close to the wind turbines less during post-construction compared to the baseline study period.

114
Evaluation of cumulative impacts
We use the term “cumulative impact” as defined in the EU-guidelines for un-dertaking impact assessments (Walker & Johnston 1999). Here cumulative im-pacts are defined as “Impacts that result from incremental changes caused by other past, present or reasonably foreseeable actions together with the pro-ject”. Hence, a proper assessment of the cumulative impact imposed by the Østerild Test Centre on the bird populations necessitates that reliable esti-mates of the number of collisions or indirect effects causing additional mor-tality or reduced reproductive output have been predicted for other wind farms and other sources of man-induced mortality. Ideally all species on the various annexes of the EC-Birds Directive, vulnerable species, and all species with reproductive low output should be included in an assessment of the cu-mulative impact (King et al. 2009, Masden et al. 2010).
It is important to be aware that the issue of defining and assessing the cumu-lative impacts of multiple, human developments on sensitive species popula-tions has received limited attention. Therefore no clear, agreed methodologies by which to undertake such assessments have been developed. In addition, a wide range of difficulties have been encountered which makes an integrative assessment of all impacts on population dynamics both complex and difficult to interpret. In particular, we remain confronted with two challenges to effec-tive assessment of cumulative impacts, first because of the difficulties of as-signing birds at risk and impacted by the development to a biologically mean-ingful “population” unit and secondly because of the difficulties of assessing the impacts of other developments within the geographical range of the spe-cies. For instance, defining the relevant biographical population is frequently very difficult and often appropriate scale data are not available. So, for in-stance, with regard to the first issue, the peregrine falcons that pass through Østerild on passage may originate from an extremely localized breeding areas and overwinter in relatively small geographical ranges, yet these individuals cannot in any meaningful way be distinguished from those with which they breed and wintering within the larger continuous breeding and wintering ranges. For this reason, it often necessary to attempt to define impacts based upon smaller bio-geographic units, which are more relevant to the assessment (Masden et al. 2010). In relation to the second issue above, multiple smaller impacts on individual survival and productivity from developments along such a flyway may have an impact, particularly on sensitive bird populations. Therefore ideally the potential impacts from all relevant planned or existing projects across the geographical range must be included in the assessment. Obviously, it will be difficult, if not impossible, to obtain such knowledge, both because of the lack of availability and because of the challenges associ-ated with flyway population definition. As a result the assessment of cumu-lative impacts often relies upon weak scientific evidence.
In the baseline report (pages 113-116) we provided an analysis for the species or species groups (individuals or stages of the annual life cycle), which were most likely affected should any adverse effect occur (sensu Masden et al. 2010). The list of recommended species was preliminary to allow for other species to be added as new knowledge emerges from the post-construction studies.

115
The list comprised light-bellied brent geese, taiga bean goose, pink-footed goose, common crane, golden plover and day and night-migrating passerines.
For the final assessment of cumulative impact imposed by the combined structures of the test centre we have revised the preliminary list on the basis of the results of the post-construction studies. The revised list includes our focal species: Pink-footed goose, taiga bean goose, light-bellied brent goose, whooper swan, common crane, white-tailed eagle and nightjar.
Below is our revised and final assessment of the cumulative impact of the combined structures of the test centre on the focal species.
Pink-footed goose
Recently, an international species management plan for the Svalbard-breed-ing population of the pink-footed goose has been developed (Madsen & Wil-liams, 2012). The management plan lists a number of present and potential future threats from human activity. These comprise man-induced habitat loss (due to climate change in the Arctic breeding areas, changes in economic pol-icies and land use), hunting (mortality, crippling and illegal hunting), disturb-ance (recreational activities, intentional scaring by farmers and hunting dis-turbance). In addition, pink-footed goose is subject to an unknown magnitude of collisions and habitat loss at man-made super-structures (power lines, wind farms, towers etc.), mainly in the wintering areas.
In Denmark, the annual hunting bag is around 9-12.000 individuals (Asferg 2016). In addition, a few thousand pink-footed geese are shot each year in Norway (Madsen et al. 2016). Geese carrying shotgun pellets did not lead to detectable effects on body condition (Madsen & Riget 2007), despite being im-posed on a substantial part of the population. However, crippled birds were not included in the analysis. The pink-footed geese occurring in West and Northwest Jutland have shown some habituation to wind turbines and forage much closer to these structures than previously observed (Madsen & Boert-mann 2008). At nearby Klim Fjordholme Wind Farm Kahlert et al. (2012b) es-timated an annual collision frequency of several hundred individuals. For this reason the collision frequency is now being investigated as part of a post-con-struction programme. Although, it should also be noted that this case cannot be directly extrapolated to the circumstances at Østerild, our estimate of the collision risk for pink-footed goose at the test centre suggests a much smaller magnitude of the number of collisions (17-31 collisions per year), which com-pared to other population impacts seems insignificant.
In addition, the Svalbard pink-footed goose population is quite resilient to extra mortality with an annual growth of the population of ca. 5% in recent years, despite an increase in intentional scaring in farmland areas and the con-tinued development of land-based wind energy.
It should also be noted that the goal of the international management plan for the Svalbard pink-footed goose population is to maintain a sustainable and stable population of around 60,000 individuals (Madsen & Williams 2012). At present, the population size is around 75,000 individuals, which means that hunting regulations and practises to regulate the population size may be op-timised to achieve the goal of the management plan.
116
We conclude that the contribution of the combined structures of the test centre to the overall mortality of the Svalbard pink-footed goose population winter-ing in northwest Jutland is negligible.
Taiga bean goose
Both the conservation status of the small population of taiga bean goose and the magnitude of impacts of human-induced pressures are unknown. Like other goose species taiga bean goose is subject to an unknown number of col-lisions at man-made superstructures (power lines, turbines, towers etc.). Alt-hough protected on the wintering areas in most countries, including northern Jutland, no overview of hunting exists along the flyway. However, the contri-bution of hunting to the overall mortality of the population is probably rather limited. Given the small order of magnitude of the collision risk predicted from the baseline and post-construction studies (<1 collision per year), we conclude that the contribution of the combined structures of the test centre to the overall mortality of the taiga bean goose population wintering in north-west Jutland is negligible.
Light-bellied brent goose
The population of light-bellied brent goose that occurs in Denmark is proba-bly declining. The most important human-induced impact is eutrophication, which has caused a dramatic reduction in the distribution of Eelgrass Zostera marina, the most attractive food resource for the species. The intake of alter-native food items such as crops in cultivated areas and saltmarsh plants has negative consequences for the daily energy budget of light-bellied brent geese at least during autumn (Clausen et al. 2012). The impact on the annual mor-tality rate and reproductive output from habitat changes is, however, not pos-sible to quantify at present. Although little is known about the magnitude, the species is subject to collisions at man-made super structures (power lines, tur-bines, towers, etc.), especially in the wintering areas in Denmark and UK.
The baseline and post-construction studies showed that the north-orientated spring migration towards the breeding areas is likely to take place in the vi-cinity of the test centre. However, only a minor fraction of the population mi-grated within less than 4-5 km distance to the test centre and rarely closer. Accordingly, we consider the potential contribution of the test centre to the overall mortality of the light-bellied brent goose population to be negligible, although it should be noted that the light-bellied brent goose is amongst those goose species in Denmark, which are least resilient to extra mortality.
Whooper swan
The majority of the whooper swans wintering in Denmark belong to the Con-tinental Northwest European flyway population, which breeds mainly in Sweden, Finland and northwest Russia. The size of the population is around 90,000 individuals of which around 50,000 overwinter in Denmark.
Although little is known about the magnitude, whooper swan is subject to collisions at man-made super structures (power lines, turbines, towers, etc.) (Christensen 1980).

117
Given the small order of magnitude of the collision risk predicted from post-construction studies (2-5 collisions per year), we conclude that the contribu-tion of the combined structures of the test centre to the overall mortality of the whooper swan population wintering in northwest Jutland is negligible.
Common crane
In recent years, the common crane population in Denmark has increased to around 140-168 pairs the majority of which breeds in northwest Jutland (Nye-gaard 2012). During spring and autumn migration, common cranes from Scandinavia pass through Denmark. In mild winters, some individuals may overwinter. The most important breeding sites, some of which have been des-ignated SPAs for this species, are located in Thy, near the test centre. In recent years, nearby Vejlerne has become an important autumn staging site (Septem-ber-November) for common crane with more than 200 individuals present. During our study, common crane has become established as a breeding bird in the study area with up to three territories identified in the northern part of the study area.
Although little is known about the magnitude, common crane is subject to collisions at man-made super structures (power lines, turbines, towers, etc.). For example, Janss (2000) found that common crane suffered high mortality from collisions with power lines in Spain and in Germany, Franke et al. ( 2011) found that the most common causes of mortality were traumatic injuries (n=105, 62.9%) from collisions with power lines (n=39, 23.4%) and wire fences (n=12, 7.2%). Collisions with wind turbines was the cause of mortality in one case (n=1, 0.6%). It should be noted that since then the installed wind power capacity has increased rapidly. Although not confirmed by recent information common cranes may still be subject to illegal hunting in Southwest Europe and landuse changes.
In Denmark, Kahlert et al. (2010) conducted a ground search study at an ex-isting wind farm at nearby Klim Fjordholme and found no casualties during a study period of 72 days. The site is situated in an area with extensive local movements of common cranes, particularly in autumn, and the authors esti-mated up to five common crane casualties per year. Subsequently, based on modelling of the Potential Biological Removal, i.e. the maximum number of individuals, not including natural mortality, which may be removed from the population while allowing it to reach or maintain its optimum sustainable size, Kahlert (2011) showed that only relatively few casualties would have a negative impact on the regional population. Similar to our study, Kahlert con-cluded that even a single common crane fatality would have a short-term, negative impact on the local and regional populations. However, Kahlert also stated that the Potential Biological Removal was likely to be higher than the level indicated by his calculations. This is probably a result of an influx of birds from surrounding countries to the Danish breeding population. The supplement of adult birds may explain the high growth rate of the Danish breeding population, which to some degree makes it more resilient to added mortality from e.g. wind turbines.
It is also important to consider that the continued growth in the population will make it more resilient to added mortality in the future.
We conclude that the magnitude of the predicted mortality at the test centre, which is relatively small compared to other human-induced pressures, does not raise concern for the local, regional and national breeding populations of

118
common cranes at present. Even though a single fatality will have a negative impact at the local and regional levels, the impact on the population will be short-term.
We recommend that the potential cumulative impact from human develop-ments on the common crane population, particularly the impact of the contin-ued development of wind parks in the region, is closely monitored in the future.
White-tailed eagle
The breeding population size of Danish white-tailed eagles has now increased to 87 pairs (2016). For comparison, in 2006, 12 pairs were breeding in Den-mark. Most breeding pairs occur on Zealand, Lolland and Falster, although in recent years the population has expanded towards the western part of the country. In winter, white-tailed eagles from Norway, Sweden, Finland and western Russia visit Denmark. White-tailed eagle is now becoming estab-lished as a breeding bird in northwest Jutland, including the Østerild area, and an increasing number of immature individuals occur in nearby Vejlerne outside the breeding season. The Baltic population of white-tailed eagles has increased rapidly and in 2010 there were nearly 400 breeding pairs in the re-gion (Herrmann et al. 2011)
The main anthropogenic causes of mortality in the Baltic population of white-tailed eagles are from toxic contamination, collisions, and electrocution (Herrmann et al. 2011). Lead poisoning is currently one of the most important causes of death in the population. Illegal persecution of white-tailed eagles continues to be a risk factor for the population and ingestion of poisoned baits (e.g. Carbofuran) is still a common cause of death. This is also the case in Den-mark, where several white-tailed eagles have been found dead following poi-soning in recent years. Another mortality factor is illegal persecution by shooting, which has also been reported from Denmark.
Although little is known about the magnitude, white-tailed eagles are subject to collisions at man-made fast moving objects (e.g. cars, trains, etc.) or static su-perstructures (power lines, turbines, towers, etc.). Collisions with trains are of particular significance. Apparently, white-tailed eagles are attracted by car-casses of animals killed by trains and often become collision victims themselves.
In Finland, Krone et al. (2006) examined 11 white-tailed eagles for their causes of dead and found that electrocution, lead poisoning and drowning in fishing net were amongst the most common causes of death.
At Smøla, Norway, following the construction of a wind park, breeding suc-cess has reduced significantly compared to that pre-construction (Dahl et al. 2012) and caused a yearly average of 7.8 white-tailed eagle fatalities (Bevanger et al. 2010). It should be noted that Smøla holds a large, dense breeding pop-ulation of white-tailed eagles and in 2010 45 active territories were recorded.
It is also important to note that the continued growth in the Baltic population of white-tailed eagles will make it more resilient to added mortality in the future.
We conclude that the small magnitude of the predicted mortality at the test centre, which is relatively small compared to other human-induced pressures, does not raise concern for the local, regional and national breeding popula-tions of white-tailed eagles at present. Even though a single fatality will have

119
a negative impact at the local and regional levels, the impact on the population will be short-term.
We recommend that the potential mortality related to human developments on the white-tailed eagle population, particularly the impact of the continued development of wind energy in the region, is closely monitored in the future.
Nightjar
The magnitude of impacts of human-induced pressures on nightjar popula-tions is largely unknown. Nightjars often frequent roads at night and when caught in the headlights of an approaching vehicle, they often sit tight instead of flying off to safety and consequently many are killed (Jackson 2003). Colli-sions with man-made structures have rarely been reported. However, during a survey at a proposed site for wind energy development, a nightjar carcass was found under a measuring mast highlighting that guy wires pose a colli-sion risk to nightjars (AMEC, 2012).
We were unable to estimate the collision risk between turbines and nightjars. However, on the basis of the lack of nightjar carcasses recovered during our intensive searches, we assume that the collision risk with turbines and masts is relatively small. We therefore consider the magnitude of the mortality caused by the test centre to be relatively small compared to other human-in-duced pressures. Even though a single fatality will have a negative impact at the local and regional levels, the impact on the population will be short-term. At present, our findings do not raise concern for the local, regional and na-tional breeding populations of nightjars. However, it is important to recognise the uncertainties associated with the assessment of the potential impact of the test centre on the local and regional nightjar population. The assessment must therefore be interpreted with caution.
We recommend that the potential cumulative impact from human develop-ments on the nightjar population, particularly the impact of the continued de-velopment of wind energy in the region, is closely monitored in the future.

120
Conclusions
In the baseline report (Therkildsen et al. 2012) we presented the first species-specific study of the bird migration in the Østerild area. A preliminary assess-ment of the potential impact of the test centre on four focal species, for which SPAs have been designated in the vicinity of the test centre, was carried out. These species were whooper swan, pink-footed goose, taiga bean goose and common crane. In addition, a number of species were included in the prelim-inary assessment on the basis of their regular occurrence in the study area. In the baseline report we also presented the results of the first study of broad front nocturnal migration in this part of Denmark. In the first year post-con-struction study we included white-tailed eagle and light-bellied brent goose as focal species on the basis of their conservation status and their occurrence in the study area.
The amount of field work during the second year post-construction study was similar to the first post-construction year. Therefore, over the past three study years we have collected an exceptional amount of data, which has enabled us to perform a robust analysis of the potential impacts of the test centre on the bird species occurring in the study area.
In addition, we conducted searches by dogs to provide data on fatalities from collisions with wind turbines, measuring and light masts. Likewise, we used miniature GPS data loggers to track movements of nightjars to investigate whether, and to what extent, they forage in the proximity of wind turbines in the study area.
In general, the second year post-construction study supported the conclusions made from the first year post-construction study. We confirmed that the test centre is not situated on a migration corridor, although seasonal migration took place to some extent. During the day, flight activity in the study area was dominated by local birds moving between feeding areas and night roosts in northwest Jutland, some of which has been designated as SPAs for the species included in the study. Regular movements of local birds that may be breeding, staging or wintering can lead to a higher number of passages of an area com-pared to seasonal migration, when migrants pass through an area once or twice a year (Kahlert et al. 2010). Indeed, as was the case in previous study years, we demonstrated local movements to take place on a regular basis for a large number of species.
In the baseline study, the species for which we estimated that more than one annual collision with wind turbines would take place were cormorant (3), pink-footed goose (21-46), greylag goose (3-6) and golden plover (65).
In the first year post-construction study, we estimated that more than one an-nual collision with wind turbines would take place for cormorant (6-14), pink-footed goose (10-23), greylag goose (23-52), buzzard (0.8-1.6), golden plover (3-7), wood pigeon (0.5-1.2) and passerines (3-5).
In the second year post-construction study, we estimated that more than one annual collision with turbines would take place for cormorant (7-15), whooper swan (2-5), pink-footed goose (14-31), greylag goose (19-44), kestrel (0.71-

121
1.60), buzzard (1.2-2.7), common crane (0.6-1.3), golden plover (7-15), wood pigeon (7-17) and passerines (7-19).
Altogether, the two post-construction studies showed that despite the high proportion of individuals of these species passing the study area at rotor height, only very limited numbers of collisions were predicted. It is important to remember that in contrast to the baseline study, the two post-construction study years covered the whole annual cycle, except for June-July.
For the remainder of the species that regularly occur in the study area, includ-ing the focal species whooper swan, taiga bean goose, common crane, light bellied brent goose and white-tailed eagle, we predicted that the annual num-ber of collisions would be small. This was typically a result of a high propor-tion of individuals and flocks migrating at flight altitudes either below or above the rotor height in combination of horizontal avoidance of the wind turbines.
We were unable to estimate the collision risk between turbines and nightjars and therefore the assessment of potential negative impacts at the local and regional breeding population should be interpreted with caution. However, even though a single fatality will have a negative impact at the local and re-gional levels, the impact on the population will be short-term.
On the basis of this final assessment, which uses more reliable estimates of collision risk based on two post-construction study years, we still consider that the potential impacts of the combined structures on the bird species oc-curring in the study area are unlikely to be significant. We stress that our crude estimates of the number of collisions should be interpreted with caution including comparison of collision estimates between the three study periods.
Since the test centre had only four turbines in operation during the first year post-construction study period, the previous assessment did consider a fully developed test centre. During the second year post-construction study period the test centre became fully developed with seven turbines simultaneously in operation. The presence of more turbines had only limited effect on our esti-mates of the risk of collisions with turbines. We are therefore relatively confi-dent to conclude that the overall impact of the test centre on bird species is considered unlikely to be significant.
Although only one potential fatality was retrieved during the carcass searches, we consider the almost complete absence of collisions between birds and the structures at the test centre to be highly unlikely. We therefore assume that either some fatalities were missed by, or were not available to the dogs or they were removed by scavengers between searches. Nevertheless, the results of the carcass searches indicate that the number of collisions is probably rather small. The result of the carcass searches therefore supports our conclusion that collisions with turbines and other structures at the test centre are to be ex-pected, but at a low rate. This result is particularly important with respect to the local population of nightjar since we were unable to estimate the collision risk for this species.
Our analysis of avoidance showed that several species actively avoided both wind turbines and measuring masts and many species seemed quite capable of reducing the risk of collision with wind turbines and measuring masts by avoidance behavior. The active avoidance in both vertical and horizontal di-

122
mensions may also explain some of the discrepancy between collision esti-mates obtained by the Band method and the lack of fatalities found during the carcass searches. The Band model assumes a uniform distribution of bird flights in the area. This is opposed to our analyses which indicate that several species actively avoid the wind turbines and measuring masts. Hence, our analysis suggests that the Band model has a tendency to overestimate collision risk. This is supported by the fact that only one corpse was found despite in-tensive searching. Since many of the species occurring in the study area are large bodied conspicuous birds, which are likely to be retrieved by search dogs, it seems that the model overestimate collision rates. This is probably a result of the underinflated avoidance rates as suggested by your large scale studies of bird trajectories in relation to turbines and masts.
It is important to keep in mind that the data collected during the baseline and the post-construction programmes only covers less than three years. We are therefore cautious when we assess the extent to which there may be year-to-year variation in the occurrence of birds both during night and day. In partic-ular, different weather conditions can affect flight behaviour and migration pathways on both small and large scales. Severe weather conditions may in-crease collision risk and lead to situations different from the general patterns we have described in our study.
The use of standardized methods during our investigations and the collection of an exceptional amount of species-specific data during the baseline and post-construction programmes have improved the level of detail in the final impact assessment of the test centre on relevant bird populations. In particu-lar, we have focused on Annex 1 species of the EC Birds Directive and con-clude that the small magnitude of the predicted mortality at the test centre, which is relatively small compared to other human-induced pressures, does not raise concern for the majority of their populations at present.
For three of our focal species, which are rare breeders in the study area, i.e. white-tailed eagle, common crane and nightjar, a single fatality will inevitably have negative impact on the local and regional populations. However, we consider this potential impact on the population to be short-term. At least for common crane and white-tailed eagle the continued growth of the popula-tions will make them more resilient to added mortality from wind turbines and other human pressures in the future.
We therefore recommend that the mortality related to human developments on the white-tailed eagle, common crane and nightjar populations, particu-larly the impact of the continued development of wind energy in the region, is closely monitored in the future.

123
References
Alerstam, T., Rosén, M., Bäckman, J., Ericson, P.G.P. & Hellgren, O. (2007). Flight Speeds among Bird Species: Allometric and Phylogenetic Effects. - PLoS Biol 5(8): e197.
AMEC. (2012) Technical Note. Camp Hill Wind Energy Development, 2012 Nightjar Surveys, AMEC Environment & Infrastructure, UK.
Asferg, T. (2016). Vildtudbyttestatistik for jagtsæsonerne 2014/15 og 2015/16. Notat fra DCE - Nationalt Center for Miljø og Energi, Aarhus Universitet.
Avery, M., Springer, P.F. & Cassel, J.F. (1976). The effects of a tall tower on nocturnal bird migration — A portable ceilometer study. - Auk 93: 281–291.
Band, W. (2000). Windfarms and birds: Calculating a theoretical collision risk assuming no avoidance. SNH Guidance. Spreadsheet and model available at http://www.snh.gov.uk/docs/C234672.xls.
Bevanger, K. (1998). - Biological and conservation aspects of bird mortality caused by electricity power lines: a review. - Biological Conservation 86: 67–76.
Bevanger, K., Berntsen, F., Clausen, S., Dahl, E.L., Flagstad, Ø. Follestad, A., Halley, D., Hanssen, F., Johnsen, L., Kvaløy, P., Lund-Hoel, P., May, R., Nygård, T., Pedersen, H.C., Reitan, O., Røskaft, E., Steinheim, Y., Stokke, B. & Vang, R. (2010). Pre- and post-construction studies of conflicts between birds and wind turbines in coastal Norway (BirdWind). Report on findings 2007-2010. - NINA Report 620. 152 pp.
Bregnballe, T. & Nitschke, M. (2016). Danmarks ynglebestand af skarver i 2016. Aarhus Universitet, DCE – Nationalt Center for Miljø og Energi, 36 s. - Teknisk rapport fra DCE - Nationalt Center for Miljø og Energi nr. 87, http://dce2.au.dk/pub/TR87.pdf
Christensen, H. (1980). Undersøgelse over fuglekollisioner mod højspæn-dingsledninger gennem det naturvidenskabelige reservat Vejlerne, efteråret 1979. Naturhistorisk Museum, Århus.
Clausen, P., Green, M. & Alerstam, T. (2003). Energy limitations for spring migration and breeding: the case of brent geese Branta bernicla tracked by satellite telemetry to Svalbard and Greenland. - Oikos 103: 426–445.
Clausen, K. K., Clausen, P., Fælled, C. C. & Mouritsen, K. N. (2012), Energetic consequences of a major change in habitat use: endangered Brent Geese Branta bernicla hrota losing their main food resource. Ibis, 154: 803–814.
Dahl. E. L., Bevanger, K., Nygård, T., Röskaft, E. & Stokke, B. G. (2012). Re-duced breeding success in white-tailed eagles at Smöla windfarm, western Norway, is caused by mortality and displacement. Biol. Conserv. 145:79-85.
Danish Meteorological Institute. Website accessed December 2016: http://www.dmi.dk/dmi/index/danmark/maanedens_vejr_-_over-sigt.htm

124
Desholm, M. (2006). Wind farm related mortality among avian migrants – are-mote sensing study and model analysis. - PhD thesis. Dept. of Wildlife Ecol-ogy and Biodiversity, NERI and Dept. of Population Biology, University Of Copenhagen. National Environment Research Institute, Denmark. 128 pp.
Dirksen, S., Spaans, A.L. & van der Winden, J. (2000). Studies on nocturnal flight paths and altitudes of waterbirds in relation to wind turbines: A review of current research in the Netherlands. – In: Proceedings of the national avian-wind power planning meeting III, San Diego, California, May 1998: 97-109. LGL Ltd, King City, Ontario.
Erickson, W. P., Johnson, G. D. & Young, D. P. (2005). A summary and com-parison of bird mortality from anthropogenic causes with an emphasis on col-lisions, - USDA Forest Gen. Tech. Rep. PSW-GTR-191.2005: 1029-1042.
Fox, A.D., Ebbinge, B.S., Mitchell, C., Heinicke, T., Aarvak, T., Colhoun, K., Clausen, P., Dereliev, S., Farago, S., Koffijberg, K., Kruckenberg, H., Loonen, M., Madsen, J., Mooij, J., Musil, P., Nilsson, L., Pihl, S. & Van der Jeugd, H. (2010). Current estimates of goose population sizes in western Europe, a gap analysis and an assessment of trends. - Ornis Svecica 20: 115–127.
Fox, A.D. & Madsen, J. (2017) Threatened species to super-abundance: The un-expected international implications of successful goose conservation. Am-bio 46 (Supplement 2): 179-187.
Franke, J., G. Wibbelt & O. Krone. (2011). Mortality factors and diseases in free-ranging Eurasian cranes (Grus grus) in Germany. Journal of Wildlife Dis-eases 47: 627–637.
Herrmann, C., O. Krone, T. Stjernberg & B. Helander (2011). Population De-velopment of Baltic Bird Species: White-tailed Sea Eagle (Haliaeetus albicilla). HELCOM Baltic Sea Environment Fact Sheets 2011. Online.
Jackson, H.D. (2003). A field survey to investigate why nightjars frequent roads at night. - Ostrich, 74: 97-101.
Janss, G.F.E. (2000). Avian mortality from power lines: a morphologic approach of a species-specific mortality. - Biological Conservation 95(3): 353–359.
Jensen, N.O. (2007). Bestanden af Natravn Caprimulgus europaeus i Thy – 2007. Skov- og Naturstyrelsen, Miljøministeriet, Kbh. 27 pp.
Kahlert, J. 2011. Beregning af de bestandsmæssige konsekvenser for kortnæb-bet gås og trane ved en ændring af en vindmøllepark ved Klim. Fagligt notat udarbejdet for Vattenfall Vindkraft A/S. - Institut for Bioscience, Aarhus Uni-versitet, 24 pp.
Kahlert, J., Leito, A., Laubek, B., Luigujõe, L., Kuresoo, A., Aaen, K. & Luud, A. (2012a). Factors affecting the flight altitude of migrating waterbirds in Western Estonia. - Ornis Fennica 89: 241–253.
Kahlert, J., Therkildsen, O.R. & Haugaard, L. (2012b). Konsekvensvurdering af effekten på fugle- og dyreliv ved ændring af en vindmøllepark ved Klim Fjordholme. Notat fra DCE - Nationalt Center for Miljø og Energi, 26 pp.

125
Kahlert, J., Therkildsen, O.R., Haugaard, L. & Elmeros, M. (2010). Vurdering af effekten på fugle ved ændringer af en vindmøllepark ved Klim Fjordholme. - Faglig redegørelse udarbejdet for Vattenfall Vindkraft A/S. Danmarks Mil-jøundersøgelser, Aarhus Universitet, 73 pp.
King, S., Maclean, I., Norman, T. & Prior, A. (2009). Developing guidance on ornithological cumulative impact assessment for offshore wind farm devel-opers. - COWRIE CIBIRD Stage 2.
Kjeldsen, J.P. (2008). Ynglefugle i Vejlerne efter inddæmningen, med særlig vægt på feltstationsårene 1978-2003. - Dansk Ornitologisk Forenings Tids-skrift 102: 1-238.
Kjeldsen, J.P. & Nielsen, H.H. (2011): Ynglefugle i Vejlerne 2011. – Aarhus Universitet, DCE – Nationalt Center for Miljø og Energi.– Teknisk rapport fra DCE – Nationalt Center for Miljø og Energi nr. 6. 40 pp.
Kjeldsen, J.P. & Nielsen, H.H. (2014). Ynglefugle i Vejlerne 2013. Aarhus Uni-versitet, DCE – Nationalt Center for Miljø og Energi, 40 s. - Teknisk rapport fra DCE – Nationalt Center for Miljø og Energi nr. 35. http://dce2.au.dk/pub/TR35.pdf
Korner-Nievergelt, F., Behr, O., Brinkmann, R., Etterson, M.A., Huso, M.M., Dalthorp, D., Korner-Nievergelt, P., Roth, T. & Niermann, I. (2015). Mortality estimation from carcass searches using the R-package carcass – a tutorial. Wildl. Biol. 21: 30–43.
Krone O., T. Stjernberg, N. Kenntner, F. Tataruch, J. Koivusaari & I. Nuuja (2006): Mortality, helminth burden and contaminant residues in White-tailed Sea Eagles from Finland. Ambio 35: 98-104.
Larsen, J.K. & Clausen, P. (2002). Potential wind park impacts on whooper swans in winter: the risk of collision. - Waterbirds 25: 327–330.
Longcore, T., Rich, C. & Gauthreaux, Jr., S.A. (2008). Height, guy wires, and steady-burning lights increase hazard of communication towers to nocturnal migrants: a review and meta-analysis. - Auk 125: 485–492.
Madsen, J. & Williams, J.H. (Compilers) (2012). International Species Manage-ment Plan for the Svalbard Population of the Pink-footed Goose Anser brachyrhynchus. - AEWA Technical Series No. 48. Bonn, Germany.
Madsen, J. & Riget, F.F. (2007): Do embedded shotgun pellets have a chronic effect on body condition of pink-footed geese? - Journal of Wildlife Manage-ment 71(5): 1427–1430.
Madsen, J., Cottaar, F., Amstrup, O., Asferg, T., Bak, M., Bakken, J., Frikke, J., Goma, V., Gundersen, O.M., Günther, K., Kjeldsen, J.P., Kruckenberg, H., Kuijken, E., Månsson, J., Nicolaisen, P.I., Nielsen, H.H., Nilsson, L., Reinsborg, T., Shimmings, P., Tapio, T., Tombre, I., Verscheure, C. & Ødegård, P-I. (2016). Svalbard Pink-footed Goose. Population Status Report 2015-16. Aarhus Uni-versity, DCE – Danish Centre for Environment and Energy, 14 pp. Technical Report from DCE – Danish Centre for Environment and Energy No. 82. http://dce2.au.dk/pub/TR82.pdf

126
Masden, E.A., Fox, A.D., Furness, R.W., Bullman, R. & Haydon, D.T. (2010). Cumulative impact assessments and bird/wind farm interactions: Develop-ing a conceptual framework. - Environmental Impact Assessment Review 30: 1–7.
Nagy, S., Petkov, N., Rees, E., Solokha, A., Hilton, G., Beekman, J. & Nolet, B. (2011). Draft International Single Species Action Plan for the Northwest Euro-pean Population of the Bewick's Swan. - Wetlands International and The Wildfowl & Wetlands Trust, 59 pp.
Newton, I. (2007). Weather-related mass-mortality events in migrants. - Ibis 149: 453–467.
ievergelt, F. K., P. K. Nievergelt, O. Behr, I. Niermann, R. Brinkmann, and B. Hellriegel. (2011). A new method to determine bird and bat fatality at wind energy turbines from carcass searches. - Wildlife Biology 17:350–363.
Nyegaard, T. (Ed.) (2012). Truede og sjældne ynglefugle i Danmark 2011. – Dansk Ornitologisk Forening. 23 pp.
Pedersen, H.C., Follestad, A., Gjershaug, J.O. & Nilsen, E. (2016). Statusover-sikt for jaktbart småvilt- NINA Rapport 1178. 258 pp.
Pihl, S. & Fredshavn, J.R. (2015). Størrelse og udvikling af fuglebestande i Danmark. Artikel 12 rapportering til Fuglebeskyttelsesdirektivet. Aarhus Universitet, DCE – Nationalt Center for Miljø og Energi, 44 s. - Videnskabelig rapport fra DCE – Nationalt Center for Miljø og Energi nr. 176 http://dce2.au.dk/pub/SR176.pdf
Pihl, S., Clausen, P., Laursen, K., Madsen, J. & Bregnballe, T. (2006). Conser-vation status of bird species in Denmark covered by the EU Wild Birds Di-rective. - National Environmental Research Institute. NERI Technical Report no. 570, 128 pp.
Therkildsen, O.R., Elmeros, M., Kahlert, J. & Desholm, M. (eds.)(2012). Base-line investigations of bats and birds at Wind Turbine Test Centre Østerild. Aarhus University, DCE – Danish Centre for Environment and Energy, 128 pp. Scientific Report from DCE – Danish Centre for Environment and Energy No. 28 http://www.dmu.dk/Pub/SR28.pdf
Therkildsen, O.R. & Elmeros, M. (eds.) 2015. First year post-construction mon-itoring of bats and birds at Wind Turbine Test Centre Østerild. Aarhus Uni-versity, DCE – Danish Centre for Environment and Energy, 126 pp. Scientific Report from DCE – Danish Centre for Environment and Energy No. 133 http://dce2.au.dk/pub/SR133.pdf
Urquhart, B. (2010). Use of avoidance rates in the SNH wind farm collision risk model. SNH Avoidance rate information & Guidance Note. Available at http://www.snh.gov.uk/docs/B721137.pdf, 10 pp.
Walker, L.J. & Johnston, J. (1999). Consulting guidelines for the assessment of indirect and cumulative impacts as well as impact interactions. - Brussels: EC DGX1 Environment, Nuclear Safety and Civil Protection, 172 pp.

127
Whitfield, D.P. & Madders, M. (2005). A review of the impacts of wind farms on hen harriers Circus cyaneus. - Natural Research Information Note 1. Natural Research Ltd, Banchory, UK.

128
Appendices and Tables
Annex A1. Mean (and maximum) of bat call sequences per hour during 4 hours after sunset at turbine sites and pond survey sites in the test centre area and in the vicinity at Østerild. See Figure 1 for locations and Table 1 for species abbreviations.
2011
N Myotis sp. Pnat Ppyg Ppip Eser Nnoc Vmur Nyct/Vmur Paur Unident
Site 1 14 0.04 (0.25) 0.04 (0.25) - - - - - - - - Site 3 14 0.02 (0.75) 0.05 (0.50) - - - - - - - 0.02 (0.25)
Site 5 14 0.11 (0.75) 0.11 (0.59) - - - - - - - -
Site 6 16 0.13 (0.78) 0.15 (0.75) - - 0.02 (0.32) - 0.02 (0.25) - - -
Site 7 15 0.52 (1.52) 0.23 (0.71) - - - - - - - 0.02 (0.25)
Abildhave Pond 9 14.68 (67.50) 1.29 (2.86) - - - - - - - 0.03 (0.30)
Klastrup Pond 7 4.78 (17.31) 0.44 (1.30) - - 0.14 (0.97) - - - - 0.05 (0.33)
Stensig Pond 8 20.85 (83.25) 1.08 (3.13) - - - - 0.03 (0.25) - - 0.10 (0.81)
Klitvejen Pond 5 0.30 (1.50) 0.24 (0.97) - - 0.19 (0.97) - - - - 0.06 (0.32)
Tovsig Pond 2 15.11 (22.06) 0.63 (0.95) - - 1.26 (1.57) - - 0.16 (0.31) - -
2013
N Myotis sp. Pnat Ppyg Ppip Eser Nnoc Vmur Nyct/Vmur Paur Unident.
Site 1 12 0.27 (0.75) 0.05 (0.30) - - 0.02 (0.25) - 0.06 (0.76) 0.02 (0.25) - 0.02 (0.30) Site 3 13 0.49 (2.07) 0.17 (0.33) 0.03 (0.33) - 0.12 (0.98) 0.08 (0.75) 0.16 (1.50) - - -
Site 5 12 0.23 (1.00) 0.15 (0.50) - - - - 0.15 (1.00) 0.06 (0.75) 0.02 (0.25) 0.02 (0.25)
Site 6 13 0.28 (0.63) 0.47 (2.00) 0.02 (0.25) - 0.04 (0.31) 0.23 (3.00) - 0.04 (0.50) - 0.02 (0.25)
Site 7 12 0.24 (1.03) 0.71 (2.54) - - 0.07 (0.85) - 0.16 (1.69) - 0.02 (0.25) -
Abildhave Pond 12 29.89 (108.63) 9.06 (62.32) - - - - 0.21 (1.00) 0.08 (1.00) - 0.02 (0.25)
Klastrup Pond 11 4.78 (17.31) 0.44 (1.30) - - 0.14 (0.97) 0.11 (1.25) 0.07 (0.75) 0.02 (0.25) - 0.07 (0.75)
Stensig Pond 12 61.18 (185.75) 7.89 (21.50) 0.02 (0.25) - 0.87 (9.50) 0.04 (0.50) 0.32 (1.29) - - 0.04 (0.25)
Klitvejen Pond 2 22.37 (38.73) - - - - - - - - -
Tovsig Pond 3 5.67 (16.75) 1.17 (1.75) - - - - - - - -

129
2014
N Myotis sp. Pnat Ppyg Ppip Eser Nnoc Vmur Nyct/Vmur Paur Unident.
Site 1 13 0.10 (0.28) 0.10 (0.29) - - 0.04 (0.29) 0.04 (0.50) - - - -
Site 3 13 0.13 (0.36) 0.06 (0.29) - 0.02 (0.25) 0.17 (1.07) 0.05 (0.25) 0.02 (0.29) - - 0.02 (0.29)
Site 5 13 0.04 (0.53) 0.11 (1.22) - - 0.04 (0.28) 0.04 (0.30) - - - 0.02 (0.28)
Site 6 13 0.17 (0.56) 0.38 (2.25) - - 0.02 (0.25) 0.05 (0.43) - - - -
Site 7 13 0.19 (0.60) 0.49 (1.66) 0.02 (0.28) - 0.04 (0.29) 0.07 (0.57) - 0.02 (0.28) - -
Abildhave Pond 13 28.59 (93.82) 2.12 (15.15) 0.04 (0.58) - 0.01 (1.30) - - - - 0.02 (0.25)
Klastrup Pond 12 10.61 (47.11) 0.56 (2.20) - - 0.09 (0.31) 0.04 (0.51) - - 0.02 (0.28) -
Stensig Pond 13 12.37 (31.65) 2.14 (14.15) 0.04 (0.28) - 0.38 (1.94) - - - - -
Klitvejen Pond - - - - - - - - - - -
Tovsig Pond 6 5.66 (12.32) 1.20 (4.26) - - - 0.04 (0.27) - - - 0.09 (0.27)

130
Annex A2. Mean (and maximum) number of bat call sequences per hour during 4 hours after sunset at different distances from wind turbines and a meteorological mast in August--October 2013 and 2014. See Figure 1 for locations and Appendix 1 for species abbreviations.
2013
Distance N Any bat Myotis sp. Pnat Ppyg Eser Nlei Nnoc Vmur Nyct/Vmur Paur Unident.
Met.mast 7 0m 4 1.24 (2.91) 0.15 (0.58) 0.98 (2.33) - - - - 0.11 (0.45) - - - 50m 3 1.44 (2.10) 0.42 (1.26) 0.87 (1.78) - - - - 0.15 (0.44) - - -
150m 2 6.31 (6.41) - 0.71 (0.83) - 5.60 (5.83) - - - - - -
Turbine 6 0m 4 9.92 (27.84) 0.46 (0.83) 9.46 (27.45) - - - - - - - -
50m 4 1.27 (2.75) 0.27 (0.65) 1.21 (2.75) - - - - - - - -
150m 4 3.14 (8.80) 0.25 (0.58) 2.42 (8.80) - - 0.12 (0.48) 0.12 (0.48) - 0.12 (0.48) 0.10 (0.42) -
Turbine 7 0m 6 2.05 (3.62) 0.45 (1.32) 1.53 (3.62) - - - - - - 0.07 (0.44) -
50m 8 1.04 (1.98) 0.28 (1.29) 0.70 (1.98) - 0.06 (0.50) - - - - - -
150m 4 1.32 (2.13) 0.21 (0.85) 1.11 (1.40) - - - - - - - -
2014
Distance N Any bat Myotis sp. Pnat Ppyg Eser Nlei Nnoc Vmur Nyct/Vmur Paur Unident
Met.mast 7 0m 10 1.34 (8.79) 0.16 (0.50) 1.04 (7.27) - 0.09 (0.61) - - 0.03 (0.30) - 0.03 (0.30) - 50m 11 0.51 (1.75) 0.19 (0.62) 0.20 (0.62) - 0.10 (0.50) - - - - 0.03 (0.31) -
150m 5 0.10 (0.27) - 0.05 (0.25) - 0.05 (0.25) - - - - - -
Turbine 6 0m 11 4.74 (34.74) 0.51 (2.03) 4.09 (34.74) - 0.05 (0.28) - - 0.09 (1.00 - - -
50m 11 0.42 (1.75) 0.05 (0.25) 0.26 (1.50) - 0.05 (0.28) - 0.07 (0.75) - - - -
150m 11 0.55 (1.25) 0.29 (0.75) 0.19 (0.75) 0.02 (0.25) 0.03 (0.27) - 0.03 (0.28) - - - -
Turbine 7 0m 9 0.59 (2.00) 0.21 (0.92) 0.37 (1.75) - - - - - - - -
50m 10 0.64 (2.55) 0.22 (0.64) 0.34 (1.60) - - - - 0.05 (0.50) - - -
150m 11 0.84 (3.25) 0.21 (1.00) 0.45 (1.18) - 0.11 (1.18) - 0.02 (0.25) 0.02 (0.25) - - 0.03 (0.30)

131
Appendix B1 The list contains all species registered during the baseline and post-construc-tion studies. The number of passages represents all observations of an indi-vidual or a flock on transect counts. The number of individuals represent the total number of individuals registered on transects. The number of measure-ments obtained using laser ranger finder includes sequential measurements of the same individual or flock.
Transects
Laser range
finder
Species name Scientific name Danish name Passages Individuals Measurements
Barn swallow Hirundo rustica Landsvale 253 1324 73
Barnacle goose Branta leucopsis Bramgås 11 718 50
Black kite Milvus migrans Sort glente 2 2 5
Blackbird Turdus merula Solsort 7 10 10
Blue tit Cyanistes caeruleus Blåmejse 0 0 1
Bohemian waxwing Bombycilla garrulus Silkehale 2 4 2
Brambling Fringilla montifringilla Kvækerfinke 4 18 1
Brent goose Branta hrota Knortegås 0 0 1
Buzzard Buteo buteo Musvåge 485 555 3154
Canada goose Anser canadensis Canadagås 0 0 2
Carrion crow Corvus corone Sortkrage 29 30 20
Collared dove Streptopelia decaocto Tyrkerdue 3 7 1
Common black-headed gull Chroicocephalus ridibundus Hættemåge 78 214 64
Common chaffinch Fringilla coelebs Bogfinke 73 906 34
Common crane Grus grus Trane 55 150 531
Common cuckoo Cuculus canorus Gøg 5 7 26
Common greenshank Tringa nebularia Hvidklire 2 2 3
Common house martin Delichon urbicum Bysvale 9 11 8
Common merganser Mergus merganser Stor skallesluger 0 0 1
Common raven Corvus corax Ravn 50 78 194
Common redshank Tringa totanus Rødben 0 0 1
Common ringed plover Charadrius hiaticula Stor præstekrave 0 0 8
Common shelduck Tadorna tadorna Gravand 25 45 109
Common snipe Gallinago gallinago Dobbeltbekkasin 28 86 31
Common starling Sturnus vulgaris Stær 303 9688 198
Common swift Apus apus Mursejler 1 1 7
Common tern Sterna hirundo Fjordterne 2 2 9
Cormorant Phalacrocorax carbo Skarv 1079 5459 3818
Corn bunting Emberiza calandra Bomlærke 25 630 24
Crossbill Loxia sp. Korsnæb 0 0 4
Curlew Numenius arquata Stor regnspove 1 1 18
Egyptian goose Alopochen aegyptiaca Nilgås 0 0 4
Eurasian bullfinch Pyrrhula pyrrhula Dompap 1 1 0
Eurasian magpie Pica pica Husskade 44 55 41
Eurasian siskin Carduelis spinus Grønsisken 5 41 3
Eurasian sparrowhawk Accipiter nisus Spurvehøg 56 59 153
Eurasian teal Anas crecca Krikand 4 130 2
European greenfinch Carduelis chloris Grønirisk 6 11 4
European honey-buzzard Pernis apivorus Hvepsevåge 2 2 5
Fieldfare Turdus pilaris Sjagger 49 1296 83
Golden eagle Aquila chrysaetos Kongeørn 0 0 1
Golden plover Pluvialis apricaria Hjejle 61 12280 80
Goldeneye Bucephala clangula Hvinand 0 0 1

132
Goldfinch Carduelis carduelis Stillits 6 15 1
Great black-backed gull Larus marinus Svartbag 111 242 303
Great grey shrike Lanius excubitor Stor tornskade 11 11 31
Great spotted woodpecker Dendrocopos major Stor flagspætte 8 10 9
Green sandpiper Tringa ochropus Svaleklire 1 1 1
Grey heron Ardea cinerea Fiskehejre 60 66 325
Grey wagtail Motacilla cinerea Bjergvipstjert 0 0 1
Greylag goose Anser anser Grågås 630 15918 2199
Hawfinch Coccothraustes coccothraustes Kernebider 1 1 1
Hen harrier Circus cyaneus Blå kærhøg 30 30 111
Herring gull Larus argentatus Sølvmåge 242 881 687
Hooded crow Corvus cornix Gråkrage 876 1878 1060
Horned lark Eremophila alpestris Bjerglærke 2 4 1
House sparrow Passer domesticus Gråspurv 1 1 1
Jackdaw Corvus monedula Allike 55 432 66
Jay Garrulus glandarius Skovskade 46 56 69
Kestrel Falco tinnunculus Tårnfalk 163 174 879
Lapland longspur Calcarius lapponicus Laplandsværling 4 4 2
Lapwing Vanellus vanellus Vibe 66 1389 245
Lesser black-backed gull Larus fuscus Sildemåge 12 41 51
Lesser/Common redpoll Acanthis flammea/cabaret Gråsisken 20 165 11
Light-bellied brent goose Branta bernicla hrota Lysbuget knortegås 0 0 16
Linnet Carduelis cannabina Tornirisk 7 25 4
Mallard Anas platyrhynchos Gråand 44 183 63
Marsh harrier Circus aeruginosus Rørhøg 63 64 381
Meadow pipit Anthus pratensis Engpiber 49 246 28
Merlin Falco columbarius Dværgfalk 9 9 20
Mew gull Larus canus Stormmåge 9 83 40
Mistle thrush Turdus viscivorus Misteldrossel 6 14 3
Montagu's/Pallid harrier Circus pygargus/macrourus Hede-/Steppehøg 0 0 1
Mute swan Cygnus olor Knopsvane 4 9 18
Northern goshawk Accipiter gentilis Duehøg 10 10 59
Osprey Pandion haliaetus Fiskeørn 6 6 53
Pallid harrier Circus macrourus Steppehøg 1 1 0
Parrot crossbill Loxia pytyopsittacus Stor korsnæb 5 25 6
Peregrine falcon Falco peregrinus Vandrefalk 17 18 142
Pink-footed goose Anser brachyrhynchus Kortnæbbet gås 273 23373 1353
Red crossbill Loxia curvirostra Lille korsnæb 16 112 16
Red kite Milvus milvus Rød glente 3 3 33
Red-footed falcon Falco vespertinus Aftenfalk 1 1 0
Red-throated pipit Anthus cervinus Rødstrubet piber 0 0 1
Redwing Turdus iliacus Vindrossel 6 40 13
Reed bunting Emberiza schoeniclus Rørspurv 17 42 10
Richard's pipit Anthus richardi Storpiber 0 0 1
Ring ouzel Turdus torquatus Ringdrossel 7 24 8
Rook Corvus frugilegus Råge 1 2 13
Rough-legged buzzard Buteo lagopus Fjeldvåge 9 9 79
Sand martin Riparia riparia Digesvale 6 226 3
Short-eared owl Asio flammeus Mosehornugle 0 0 1
Skylark Alauda arvensis Sanglærke 66 205 158
Snow bunting Plectrophenax nivalis Snespurv 4 7 4
Song thrush Turdus philomelos Sangdrossel 0 0 2
Stock dove Columba oenas Huldue 1 2 1
Taiga bean goose Anser fabalis fabalis Skovsædgås 30 302 423
Tree pipit Anthus trivialis Skovpiber 1 1 2

133
Tree sparrow Passer montanus Skovspurv 2 12 3
Tundra swan Cygnus columbianus Pibesvane 11 85 78
Twite Carduelis flavirostris Bjergirisk 2 6 1
Two-barred crossbill Loxia leucoptera Hvidvinget korsnæb 1 1 2
Water pipit Anthus spinoletta Bjergpiber 2 3 3
Wheatear Oenanthe oenanthe Stenpikker 3 3 1
Whinchat Saxicola rubetra Bynkefugl 1 2 0
White wagtail Motacilla alba Hvid vipstjert 34 42 7
White-fronted goose Anser albifrons Blisgås 1 8 17
White-tailed eagle Haliaeetus albicilla Havørn 62 68 653
Whitethroat Sylvia communis Tornsanger 1 1 0
Whooper swan Cygnus cygnus Sangsvane 166 757 1093
Wood pigeon Columba palumbus Ringdue 560 1595 487
Woodcock Scolopax rusticola Skovsneppe 1 1 0
Yellow wagtail Motacilla flava Gul vipstjert 1 1 2
Yellowhammer Emberiza citrinella Gulspurv 103 720 63

134
Appendix B2 In order to estimate the theoretical annual number of collisions at the test cen-tre the so-called “Band-model” (Band 2000) was applied. The Band-model did not originally incorporate avoidance responses. However, given the im-portance of this factor, the model was extended with this factor. The number of collisions (Ctot) can be calculated as:
Ctot = Nbird * Pa * Pna,
where Nbird = number of bird transits through the rotor, Pa = probability of avoidance and Pna = probability of bird flying through rotor showing no avoidance being hit.
Calculation of Nbird
The first approach was applied on species with a predictable flight pattern (modified description after Band (2000) given that sufficient data on flight al-titude of birds was available):
1. Identify a 'risk window', i.e. a window of width equal to the width of the windfarm across the general flight direction of the birds, and of height of the rotor. The cross-sectional area at rotor height W = width x height.
2. Estimate the number of birds n flying through this risk window per annum, i.e. numbers crossing the row of turbines (ncros) x proportion flying at the alti-tude of the risk window (prisk). ncros was calculated as the total number of birds observed on the transects multiplied by the proportion of birds that were likely to occur between the observation station and the northernmost (1,550 m) and southernmost (2,150 m) turbine location. This proportion was derived from the distance measurements with the laser range finder. As the calcula-tion was done on a monthly basis, the ratio between total time of daylight per month and observation time per month was multiplied by the numbers oc-curring between the northernmost and southernmost turbines per month as calculated above in order to extrapolate from the actual observation periods to the entire month (only daylight periods). prisk was derived from the meas-urements of flight altitude obtained by laser range finder.
3. Calculate the area A presented by the wind farm rotors. Assume the rotors are aligned in the plane of the risk window as, to a first approximation, any reduction in cross-sectional area because the rotors are at an oblique angle is offset by the increased risk to birds which have to make a longer transit through the rotors.
A = N x πR2 where N is the number of rotors and R is the rotor radius.
4. Express the total rotor area as a proportion A / W of the risk window.
5. Number of birds passing through rotors (Nbird) = number of birds through risk window x proportion occupied by rotors = n x (A / W).
The second approach is most appropriate for birds such as raptors which oc-cupy a recognized territory, and where observations have led to some under-standing of the likely distribution of flights within this territory.

135
1. Identify a 'flight risk volume' Vw which is the area of the wind farm multi-plied by the height of the rotors.
2. Calculate the combined volume swept out by the wind farm rotors Vr = N x πR2 x (d + l ) where N is the number of wind turbines, d is the depth of the rotor back to front, and l is the length of the bird.
3. Estimate the bird occupancy n within the flight risk volume. This is the number of birds present multiplied by the proportion of birds occurring at the altitude of the flight risk volume multiplied by the time spent flying in the flight risk volume
4. The bird occupancy of the volume swept by the rotors is then n x (Vr / Vw) bird-secs.
5. Calculate the time taken for a bird to make a transit through the rotor and completely clear the rotors: t = (d + l ) / v where v m/sec is the speed of the bird through the rotor
6. To calculate the number of bird transits through the rotors, divide the total occupancy of the volume swept by the rotors in bird-secs by the transit time t: Number of birds passing through rotors (Nbird) = n x ( Vr / Vw ) / t
Calculation of Pa
Little information exists on specific avoidance rates from field studies, and hence most avoidance rates (see table below) were based on the recommen-dations of Scottish Natural Heritage (Urquhart 2010).
Calculation of Pna
The computation of the probability of birds being hit when passing rotors is complex and involves many factors. The approach was again taken from the Band model (below a modified description after Band (2000)).
Species Avoidance rate (%)
Cormorant 97.75-99.00
Whooper swan 97.75-99.00
Tundra swan 97.75-99.00
Pink-footed goose 97.75-99.00
Taiga bean goose 97.75-99.00
Greylag goose 97.75-99.00
Marsh harrier 98.00-99.00
Hen harrier 98.00-99.00
Buzzard 98.00-99.00
White-tailed eagle 97.75-99.00
Kestrel 98.00-99.00
Peregrine falcon 98.00-99.00
Common crane 97.75-99.00
Golden plover 97.75-99.00
Wood pigeon 97.75-99.00
Common raven 98.00-99.00
Passerines 98.00-99.00

136
The probability depends on the size of the bird (both length and wingspan), the breadth and pitch of the turbine blades, the rotation speed of the turbine, and of course the flight speed of the bird. To facilitate calculation, many simplifica-tions have to be made. The bird is assumed to be of simple cruciform shape, with the wings at the halfway point between bill and tail. The turbine blade is assumed to have a width and a pitch angle (relative to the plane of the turbine), but to have no thickness. Each blade cuts a swathe through the air which de-pends both on the breadth of the blade and its pitch angle. Successive blades cut parallel swathes, but progressively closer to the bird. The angle of approach of the blade α depends on both bird speed and blade speed. At the rotor ex-tremity, where blade speed is usually high compared to bird speed, the ap-proach angle α is low, i.e. the blades approach the bird from the side. Close to the rotor hub, where the blade speed is low and the bird is therefore flying to-wards a slow-moving object, the approach angle α is high. The probability of bird collision, for given bird and blade dimensions and speeds, is the probabil-ity, were the bird placed anywhere at random on the line of flight, of it overlap-ping with a blade swathe (since the bird, in this frame, is stationary). It may therefore be calculated from simple geometric considerations. Where the angle of approach is shallow, it is the length of the bird, compared to the separation distance of successive swathes, which is the controlling factor. Where the angle of approach is high, it is the wingspan of the bird compared to the physical dis-tance between blades, which is the controlling factor.
The calculation derives a probability p(r, ϕ) of collision for a bird at a radius r from the hub, and at a position along a radial line which is an angle ϕ from the vertical. It is then necessary to integrate this probability over the entire rotor disc, assuming that the bird transit may be anywhere at random within the area of the rotor disc:
Total probability = (1/πR2) ∫∫ p(r, ϕ) r dr dϕ = 2∫ p(r) (r/R) d(r/R) (1),
where p(r) now allows for the integration over ϕ.
Probability p of collision for a bird at a radius r from hub, l for α < β
p(r) = ( bΩ/2πv ) [ K | ± c sinγ + α c cosγ | + ] wαF for α > β (2),
where b = number of blades in rotor, Ω = angular velocity of rotor (radi-ans/sec), c = chord width of blade
γ = pitch angle of blade, R = outer rotor radius, l = length of bird, w = wing-span of bird, β = aspect ratio of bird i.e. l / w, v = velocity of bird through rotor, r = radius of point of passage of bird, α = v/rΩ, F = 1 for a bird with flapping wings (no dependence on ϕ) = (2/π) for a gliding bird, K = 0 for one-dimensional model (rotor with no zero chord width) K = 1 for three-dimen-sional model (rotor with real chord width).
The chord width of the blade c and the blade pitch γ, i.e. the angle of the blade relative to the rotor plane, vary from rotor hub to rotor tip. The chord width is typically greatest close to the hub and the blade tapers towards the tip. The pitch is shallowest close to the tip where the blade speed is highest. The ap-parent width of the blade, looked at from the front, is c cosγ, and the depth of blade from back to front is c sinγ.

137
The factor F is included to cover the two extreme cases where the bird has flapping wings (p(r, ϕ) has no dependence on ϕ) or is gliding (p(r, ϕ) is ϕ dependent, i.e. at maximum above and below hub, at minimum when wings are parallel with rotor blade). F=1 for flapping bird, F = 2/π for a gliding bird. The sign of the c sinγ term depends on whether the flight is upwind (+) or downwind (-). The factor K is included to give a simple option of checking the effect of real blade width in the result: K=0 models a one-dimensional blade with no chord width. As α, c and γ all vary between hub and rotor tip, a nu-merical integration is easiest when evaluating equation (1).
For ease of use these calculations are laid out on spreadsheet available at http://www.snh.gov.uk/docs/C234672.xls. The spreadsheet calculates p(r) at intervals of 0.05 R from the rotor centre (i.e. evaluating equation (2)), and then undertakes a numerical integration from r=0 to r=R (i.e. evaluating equation (1).
In a real case it may be important to add in the effect of wind to the bird's ground speed, and flight patterns may not be such that upwind and downwind flights are equally frequent. The result is an average collision risk for a bird passing through a rotor. Note that there are many approximations involved, for example in assuming that a bird can be modelled by a simple cruciform shape, that a turbine blade has width and pitch but no thickness, and that a bird's flight will be unaffected by a near miss, despite the slipstream around a turbine blade. Thus the calculated collision risks should be held as an indication of the risk - say to around ±10%, rather than an exact figure. It is also simplistic to assume that bird flight velocity is likely to be the same relative to the ground both up-wind and downwind. Ideally, separate calculations should be done for the up-wind and downwind case, using typical observed flight speeds.
In the present case the length of the bird species and wingspan were derived from DOFbasen (www.dofbasen.dk/art), while flight speeds were mainly ob-tained from Alerstam et al. (2007).
Species
Body length
(m)
Wing span
(m)
Flight speed
(m/s)
Greylag goose 0.80 1.63 17.1
Pink-footed goose 0.68 1.53 16.1
Taiga bean goose 0.67 1.61 17.3
Common crane 1.15 2.15 14.9
Golden plover 0.27 0.72 13.7
Tundra swan 1.22 1.96 18.5
Whooper swan 1.52 2.31 17.3
Cormorant 0.9 1.45 15.2
Peregrine falcon 0.4 1.05 12.1
Kestrel 0.34 0.7 12.1
Marsh harrier 0.5 1.3 9.1
White-tailed eagle 0.9 2.3 13.0
Hen harrier 0.47 1.10 9.1
Buzzard 0.54 1.21 12.5
Wood pigeon 0.41 0.78 17.0
Common raven 0.64 1.35 14.3
Passerines 0.24 0.34 13.0

138
The technical specifications of the turbines, which were incorporated in the model in the present case, are presented in the table below.
Vestas v110 vestas v126 Vestas v164
Siemens
SWT 4.4 130
Siemens
SWT70 154
EDF GE–
Alstrom 150 Envision 120
Hub height 98 116 140 110 120 117 90
Rotor altitude (m) 43-153 53-179 58-222 45-175 43-197 42-192 30-150
Rotor diameter (m) 110 126 164 130 154 150 120
Time per rotation (sec) 4.96 3.6 5.22 4.48 5.45 5.0 4.0
Wing breath (m) 3,9 4 5,4 4,1 6 3,6 4
Effect (MW) 2 3,3 9 4 8 6 3

139
Tables
Table tx1. Mixed model results for the 29 species where sufficient data have been collected. In addition, white-tailed eagle has
also been included with distance as dependent variable. The df for main factors and the interaction were all 1. The listed df rep-
resent the relevant residual term for each of the factors. These tests were made with mixed models. Baseline/post-construction
context
Distance Distance x baseline/post-
construction context
Species F P dfresidual F p dfresidual F p p
Hen harrier 45 3.12 0.084 62 0.11 0.738 45 1.14 0.29
Goshawk 33 0.03 0.871 22 0.21 0.653 33 0.81 0.373
Merlin 2 26.26 0.036 14 7.49 0.016 2 14.75 0.062
Osprey 36 6.74 0.014 13 2.13 0.168 36 0.21 0.651
Grey heron 210 0.06 0.799 111 0.7 0.405 210 0.02 0.89
Rough-legged buzzard 54 0.03 0.875 21 0.9 0.354 54 0.95 0.335
Greylag goose 1433 0.14 0.707 758 8.39 0.004 1433 12.33 <0.001
White-tailed eagle N/A N/A N/A 141 1.41 0.238 N/A N/A N/A
Golden plover 17 8.72 0.009 59 3.6 0.063 17 5.76 0.028
Mute swan 11 26.05 <0.001 3 1.69 0.285 11 5.18 0.044
Pink-footed goose 906 50.39 <0.001 432 13.21 <0.001 906 1.68 0.196
Buzzard 1960 1.22 0.269 1188 0.06 0.811 1960 0.1 0.756
Tundra swan 52 0.42 0.52 22 0.17 0.683 52 0.29 0.591
Red kite 25 0.35 0.56 4 0 0.952 25 0.02 0.881
Marsh harrier 247 0.02 0.902 130 0.01 0.918 247 0.06 0.804
Raven 88 1.03 0.312 102 1.15 0.287 88 1.28 0.261
Wood pigeon 90 0.48 0.488 392 0.15 0.699 90 0.1 0.756
Taiga bean goose 282 2.4 0.123 137 7.41 0.007 282 10.54 0.001
Herring gull 389 6.34 0.012 294 0.84 0.36 389 0.03 0.873
Whooper swan 654 14.93 <0.001 434 13.75 <0.001 654 1.17 0.279
Lesser black-backed gull 27 2.66 0.115 20 0.08 0.774 27 1.48 0.234
Cormorant 2401 0.04 0.844 1403 0.95 0.329 2401 0.19 0.661
Sparrow hawk 59 2.37 0.129 89 0.93 0.337 59 0.04 0.841
Common gull 17 8.53 0.01 19 11.81 0.003 17 14.61 0.001
Greater black-backed gull 153 0.09 0.763 146 2.31 0.13 153 3.03 0.084
Kestrel 432 2.79 0.096 443 2.55 0.111 432 3.81 0.051
Common crane 344 0.31 0.579 182 0 0.986 344 1.98 0.161
Peregrine falcon 86 10.41 0.002 52 1.55 0.219 86 0.69 0.407
Lapwing 106 1.7 0.196 135 0.05 0.826 106 0.47 0.494
Great grey shrike 1 1.87 0.402 26 4.02 0.056 1 0.12 0.791

140
Table tx2. Test of differences in distance to wind turbines between baseline and post-construction periods. Test was made as
a Kolmogorov-Smirnoff test and for observations between 10 and 100 m from wind turbines. Ksa was the test statistic for the
test, D was the maximum distance between the two cumulative distributions, and distance marked the distance where the larg-
est difference was observed. N-baseline and N-post was the sample size for each of the periods. Post<baseline indicated
whether the post-construction period observations were smaller than observed in the baseline period which meant that the birds
increased their distance to the wind turbines during the post-construction period.
Species Ksa p D Distance at
max deviation
Post< base-
line initial
N baseline N post
Greylag goose 0.963205 0.3115 0.261905 71
21 38
Hooded crow 0.665750 0.7672 0.261905 89
12 14
Pink-footed goose 1.962232 0.0009 0.472851 73 no 51 26
Buzzard 1.384791 0.0432 0.352941 11 yes 17 163
Whooper swan 1.092515 0.1836 0.350000 16
19 20
Cormorant 1.244944 0.0901 0.295062 91
20 162
Common crane 1.894993 0.0015 0.515584 59 yes 22 35
Peregrine falcon 1.013072 0.2562 0.500000 41
13 6
Lapwing 1.421637 0.0351 0.800000 77 no 4 15
Table tx3. Test of differences in distance to towers between baseline and post-construction periods. Test was made as a Kol-
mogorov-Smirnoff test and for observations between 10 and 100 m from towers. Ksa was the test statistic for the test, D was the
maximum distance between the two cumulative distributions, and distance marked the distance where the largest difference
was observed. N-baseline and N-post was the sample size for each of the periods. Post<baseline indicated whether the post-
construction period observations were smaller than observed during the baseline study, e.g. birds increased their distance to the
towers during the post-construction period.
Species Ksa p D Distance at
max deviation
Post<Baseline N baseline N post
Hen harrier 1.250000 0.0879 0.625000 34
8 8
Greylag goose 2.199260 0.0001 0.470833 72 yes 30 80
Hooded crow 0.645195 0.7994 0.125356 49
52 54
Pink-footed goose 2.788872 <.0001 0.554487 72 yes 72 39
Buzzard 1.507385 0.0213 0.443009 61 yes 12 329
Wood pigeon 0.474342 0.9780 0.225000 82
10 8
Taiga bean goose 2.004459 0.0006 0.714286 86 no 32 14
Whooper swan 1.514490 0.0204 0.585366 75 yes 8 41
Cormorant 1.395900 0.0406 0.282721 92 no 27 251
Kestrel 2.467319 <.0001 0.974026 94 no 7 77
Common crane 1.482499 0.0247 0.476190 46 yes 21 18
Lapwing 1.343406 0.0541 0.652778 65 yes 8 9
Table tx4. Test of minimum distance to measurement towers in baseline and post-con-
struction period. Tests were made with a Kolmogorov-Smirnoff test.
Species Ksa p D N baseline N post
Greylag goose 0.664578 0.769098 0.191388 19 33
Hooded crow 0.443203 0.989412 0.196429 8 14
Pink-footed goose 0.719211 0.679063 0.253659 41 10
Taiga bean goose 0.487950 0.971133 0.285714 7 5
Whooper swan 0.438529 0.990646 0.192308 39 6
Cormorant 0.785445 0.567995 0.286585 8 123
Common crane 0.876501 0.42598 0.488889 5 9

141
Table tx5. Test of difference in distance to individual wind turbines when crossing the line of 7 wind turbines. Tests were made
with Kolmogorov-Smirnoff test.
Species Ksa p D N Baseline N Post Post vs. baseline
Greylag goose 1.361884 0.04898 0.255051 44 81 lower
Pink-footed goose 0.955033 0.321346 0.188541 79 38
Buzzard 0.440096 0.990245 0.129670 14 65
Taiga bean goose 1.074573 0.198444 0.338164 18 23
Whooper swan 1.332811 0.05729 0.266458 58 44 lower
Cormorant 1.215604 0.104103 0.438830 8 188
Greater black-backed gull 0.97759 0.294801 0.527273 5 11
Common crane 1.380585 0.04421 0.464286 14 24 lower
Lapwing 0.912871 0.375207 0.500000 5 10

SECOND YEAR POST-CONSTRUCTION MONITORING OF BATS AND BIRDS AT WIND TURBINE TEST CENTRE ØSTERILD
The Department of Bioscience, Aarhus University was com-missioned by the Danish Nature Agency to undertake a bat and bird monitoring programme of a national test centre for wind turbines near Østerild in Thy, Denmark.
Here we present the results from the second and fi nal year of the post-construction studies. A total of ten bat species were recorded in 2013-2014. Species composition and oc-currence were comparable to the results obtained during the pre-construction survey in 2011. Bats were recorded at all turbine sites and on all nights at surveyed ponds and lakes. Overall, the bat activity level decreased from 2013 to 2014 to the levels recorded in 2011.Bat activity was higher near the wind turbines than at nearby forest edges. Bat ac-tivity at the turbines was correlated to aggregations of in-sects on the turbine towers, which suggest that bats exploit the food resources that accumulate on the turbine towers on some nights. Nathusius’ pipistrelles and noctules were recorded at nacelle height. Two dead Nathusius’ pipistrel-les were found in 2014 at the southern turbine situated in forest. Whooper swan, taiga bean goose, pink-footed goose, common crane, light-bellied brent goose, white-tailed eagle and nightjar were included as focal species in the ornithological investigations. In addition, species speci-fi c data on all bird species occurring regularly in the study area were collected. On the basis of this fi nal assessment of collision risk, the potential impacts of the combined structures on the bird species occurring in the study area were considered unlikely to be signifi cant. We recommend that the mortality related to human developments on the white-tailed eagle, common crane and nightjar populati-ons, particularly the impact of the continued development of wind energy in the region, is closely monitored in the future.
ISBN: 978-87-7156-271-2ISSN: 2245-0203