SCIENCE OF TSUNAMI HAZARDS · SCIENCE OF TSUNAMI HAZARDS ......
13
ISSN 8755-6839 SCIENCE OF TSUNAMI HAZARDS Journal of Tsunami Society International Volume 31 Number 4 2012 EARLY DETECTION OF NEAR-FIELD TSUNAMIS USING UNDERWATER SENSOR NETWORKS L. K. Comfort, T. Znati, M. Voortman, and Xerandy, University of Pittsburgh, USA L. E. Freitag, Woods Hole Oceanographic Institution, USA ABSTRACT We propose a novel approach for near-field tsunami detection, specifically for the area near the city of Padang, Indonesia. Padang is located on the western shore of Sumatra, directly across from the Mentawai segment of the Sunda Trench, where accumulated strain has not been released since the great earthquake of 1797. Consequently, the risk of a major tsunamigenic earthquake on this segment is high. Currently, no ocean-bottom pressure sensors are deployed in the Mentawai basin to provide a definitive tsunami warning for Padang. Timely warnings are essential to initiate evacuation procedures and minimize loss of human life. Our approach augments existing technology with a network of underwater sensors to detect tsunamis generated by an earthquake or landslide fast enough to provide at least 15 minutes of warning. Data from the underwater sensor network would feed into existing decision support systems that accept input from land and sea-based sensors and provide warning information to city and regional authorities. Vol. 31, No. 4, page 231 (2012)
Transcript of SCIENCE OF TSUNAMI HAZARDS · SCIENCE OF TSUNAMI HAZARDS ......

ISSN 8755-6839
SCIENCE OF TSUNAMI HAZARDS
Journal of Tsunami Society International
Volume 31 Number 4 2012
EARLY DETECTION OF NEAR-FIELD TSUNAMIS USING UNDERWATER SENSOR NETWORKS
L. K. Comfort, T. Znati, M. Voortman, and Xerandy,
University of Pittsburgh, USA
L. E. Freitag,
Woods Hole Oceanographic Institution, USA
ABSTRACT
We propose a novel approach for near-field tsunami detection, specifically for the area near the city of Padang, Indonesia. Padang is located on the western shore of Sumatra, directly across from the Mentawai segment of the Sunda Trench, where accumulated strain has not been released since the great earthquake of 1797. Consequently, the risk of a major tsunamigenic earthquake on this segment is high. Currently, no ocean-bottom pressure sensors are deployed in the Mentawai basin to provide a definitive tsunami warning for Padang. Timely warnings are essential to initiate evacuation procedures and minimize loss of human life. Our approach augments existing technology with a network of underwater sensors to detect tsunamis generated by an earthquake or landslide fast enough to provide at least 15 minutes of warning. Data from the underwater sensor network would feed into existing decision support systems that accept input from land and sea-based sensors and provide warning information to city and regional authorities.
Vol. 31, No. 4, page 231 (2012)

1. PROBLEM STATEMENT The threat of near-field tsunamis represents a significant risk for coastal communities located near earthquake subduction zones, and it is particularly high along the west coast of Sumatra, Indonesia. In a recent paper in Nature Geoscience, J. McCloskey et. al. (2010) noted that the 2009 Padang Earthquake had not ruptured the Mentawai segment of the Sunda Trench, and that the accumulated strain of more than 200 years represented high potential for a major tsunamigenic earthquake that would threaten the cities of Padang and Bengkulu on the western coast of Sumatra. The threat is different than that posed by distant tsunamis in that the warning time is much less and detection must occur close to the affected area. The DART system has achieved significant success in detecting tsunamis that originate far away (offshore on or near other continents), but it has three key limitations. First, due to their primary function, the DART buoys are anchored at least 250 miles off shore and therefore do not generally detect near-field tsunamis for the coasts they protect. Second, the cost of building, deploying, and maintaining a network of DART buoys is high, and places a heavy financial burden on developing nations such as Indonesia. Third, as Indonesia has deployed a network of DART buoys for both near- and far-field tsunami detection, BPPT (Agency for Assessment and Application of Technology) has reported that vandalism is a consistent problem, reducing the number of buoys that can be maintained. At a recent visit to the BPPT engineering laboratory in Pusipitek Serpong, Senior Scientist Wahyu Pandoe stated that of 19 sites established by BPPT for DART buoys on the coasts of Indonesia, only 4 were populated by operating buoys, after repeated instances of vandalism.1 Given this situation, BPPT is seeking alternative methods for tsunami detection, which obviate or reduce the need for near-shore buoys. 2. GOAL OF RESEARCH This paper describes a new approach for telemetering data to allow detection of near-field tsunamis without the use of surface buoys. The system would be located off the shore of Padang, Sumatra, Indonesia (Figure 1). The work focuses specifically on the design of an underwater sensor network, the most technically challenging component. If a demonstration system proves successful, the network would be connected to the existing land-based Indonesian Tsunami Early Warning System (TEWS). In addition the data from this network may feed into a land-based model that could estimate the impact of a tsunami on the built infrastructure and population of a city at risk. The design and development of the land-based model and the associated dynamic Geographic Information Systems that present the model outputs to users are additional components of an end-to-end tsunami detection system, but both are beyond the scope of this paper. The land-based model was addressed briefly in a
1 Personal communication, BPPT Facility, Serpong, Indonesia, July 10, 2012.
Vol. 31, No. 4, page 232 (2012)

previous paper (Boulos et al., 2012) and the dynamic GIS functions will be addressed in subsequent work. Designing, building, and testing an experimental system to address this threat would help to address a gap in near-field tsunami detection and warning research that will help coastal communities. Recent events have highlighted the importance of this problem, notably the December 26, 2004 Sumatran Earthquake and Tsunami; February 27, 2010 Chile Earthquake and Tsunami; October 25, 2010 Mentawai, Indonesia Tsunami; and March 11, 2011 Tohoku, Japan Earthquake, Tsunami, and Nuclear Reactor Breach.
Figure 1. Map of study region showing ocean depth in meters offshore Padang, Sumatra
3. ESTIMATING TSUNAMI PARAMETERS Tsunami warning systems, as currently deployed, are challenged by the simple fact that near-field tsunamis strike so quickly (Strunz et al, 2011; Lauterjung et al, 2010). Prediction of wave propagation has been greatly advanced by Titov et al. (2003), who developed the Method of Splitting Tsunami (MOST) model, which is used extensively throughout the international community, including the US National Oceanic, and Atmospheric Administration (Morrissey, 2005). This model includes elements
Vol. 31, No. 4, page 233 (2012)

that estimate the fault plane parameters and sea-floor displacement to then generate the initial conditions for the tsunami wave. As implemented at National Oceanic and Atmospheric Administration (NOAA) Pacific Marine and Environmental Laboratory (PMEL), the codes then estimate propagation through the ocean, and finally, the inundation that may result. Ocean-bottom pressure sensor data from the DART buoys (Bernard et al., 2006; Satake, Okal, and Borrero, 2007) are used to refine the initial conditions and propagation estimates. Methods for quickly and accurately estimating earthquake magnitude and sea floor displacement continue to be refined with the goal of improving tsunami prediction. As networks of real-time GPS stations expand and fault plane parameter calculation improves in accuracy and speed, the estimation of tsunami magnitude may improve. Work on use of W-phase to compute Mw may provide a faster estimate of earthquake moment (Singh et al., 2012) that may then be used for tsunami parameter calculation. It has also been proposed that appropriately-located real-time GPS stations on Sumatra and its offshore islands could provide estimates of co seismic slip and consequently improve tsunami warnings (Behrens, 2010). However, ocean-bottom pressure sensors offer definitive measurements that when coupled with propagation models can provide accurate inundation information. Unfortunately, due to vandalism (UNESCO, 2011) and the maintenance issues alluded to above, a near-shore, buoy-based approach to telemeter ocean bottom pressure data (or host real-time kinematic GPS, another sea-based measurement), is not practical for Indonesia.
4. TECHNICAL APPROACH 4.1 Bottom Sensor A bottom pressure signal indicating the magnitude of a tsunami wave well away from shore would be a significant addition to the Indonesian TEWS for western Sumatra. As noted above, the bottom pressure sensor provides an unambiguous measurement (e.g. Figure 2) that can be directly extrapolated to compute the height and time of arrival of the tsunami. However, an additional complication arises when the pressure sensor is near the earthquake source: the seismic signal is also detected by the sensor. This is not a significant issue when the pressure sensor and earthquake source are widely separated because the early signal on the pressure sensor can be identified as being seismically generated. However, it must be addressed when both are present at the same time on the pressure sensor. Fortunately, a recent development by Paroscientific, the primary manufacturer of ocean-bottom pressure sensors used for tsunami detection, has resulted in an enhanced instrument, a nano-resolution sensor that may allow separation of earthquake vibrations and low-level pressure signals (Paros et al, 2011). The nano-resolution sensor is not significantly more expensive than the standard sensor (about 20% more), and it is capable of measuring 1 mm signals in deep water. The capability of the instrument is currently being tested in Monterey Bay, California with support by the US National Science Foundation. The sensor will ultimately be used on the permanent regional cabled observatory
Vol. 31, No. 4, page 234 (2012)
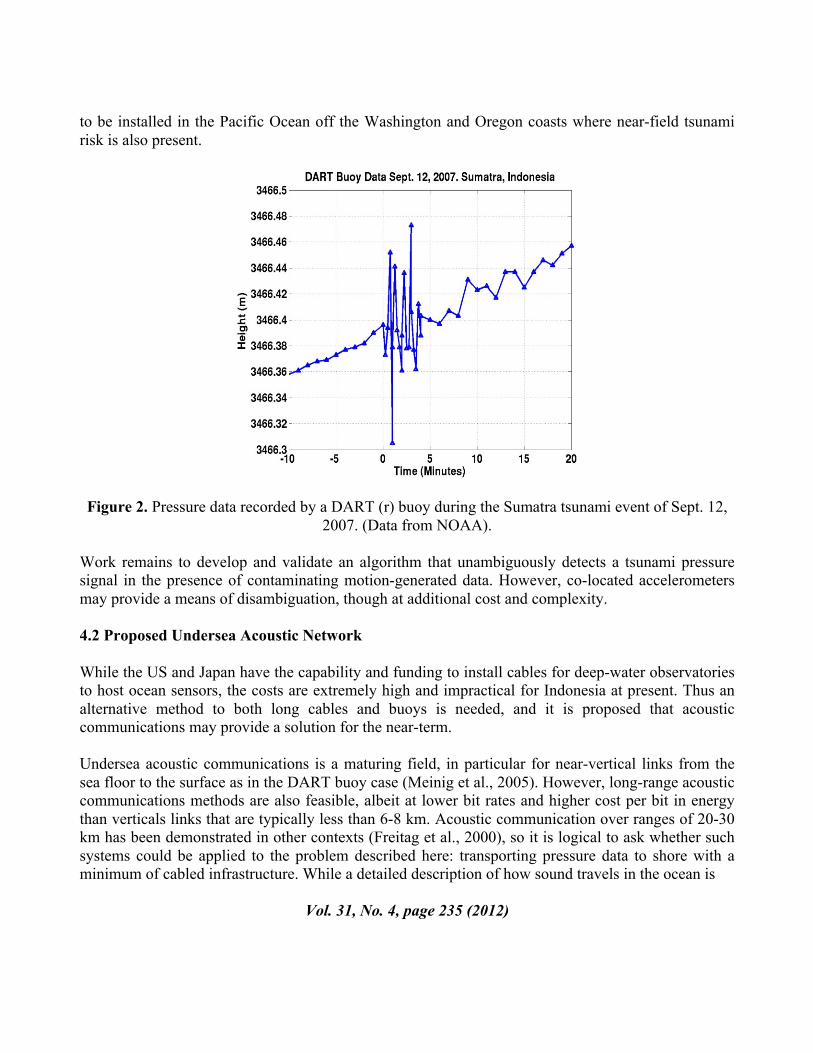
to be installed in the Pacific Ocean off the Washington and Oregon coasts where near-field tsunami risk is also present.
Figure 2. Pressure data recorded by a DART (r) buoy during the Sumatra tsunami event of Sept. 12,
2007. (Data from NOAA). Work remains to develop and validate an algorithm that unambiguously detects a tsunami pressure signal in the presence of contaminating motion-generated data. However, co-located accelerometers may provide a means of disambiguation, though at additional cost and complexity. 4.2 Proposed Undersea Acoustic Network While the US and Japan have the capability and funding to install cables for deep-water observatories to host ocean sensors, the costs are extremely high and impractical for Indonesia at present. Thus an alternative method to both long cables and buoys is needed, and it is proposed that acoustic communications may provide a solution for the near-term. Undersea acoustic communications is a maturing field, in particular for near-vertical links from the sea floor to the surface as in the DART buoy case (Meinig et al., 2005). However, long-range acoustic communications methods are also feasible, albeit at lower bit rates and higher cost per bit in energy than verticals links that are typically less than 6-8 km. Acoustic communication over ranges of 20-30 km has been demonstrated in other contexts (Freitag et al., 2000), so it is logical to ask whether such systems could be applied to the problem described here: transporting pressure data to shore with a minimum of cabled infrastructure. While a detailed description of how sound travels in the ocean is
Vol. 31, No. 4, page 235 (2012)

beyond the scope of this paper, it suffices to note that it does not travel in a straight line, but rather bends due to changes in density, which affect the speed of sound. Warm surface water is faster than deeper, colder water, though as pressure increases with depth, sound ultimately travels faster at the bottom than at the surface. In equatorial areas such as Indonesia, the surface water is very warm and the temperature is relatively constant throughout the seasons. As sound transmitted from the bottom approaches the surface, at a certain critical angle it will fully refract, bending away from the surface and never striking it. The lack of surface interaction eliminates the scatter that would otherwise reduce the signal level and distort it, and thus creates the propagation conditions that will be exploited in the proposed system: bottom-to-bottom communications links that may be used to build an underwater sensor network. The effect is illustrated in Figure 3. Here a model of transmission loss from a sound source on the bottom is shown, using sound speed derived from archival temperature, conductivity and pressure data to perform the computations. The effect described here is clearly visible, the sound bends away from the surface, returning to the bottom at ranges of 15 to 45 km.
Figure 3. Modeled transmission loss of a signal sent from the bottom of the Mentawai Basin, which demonstrates how sound, refracts at the surface and returns to the bottom 15 to 45 km away (not all
angles are shown).
Vol. 31, No. 4, page 236 (2012)

While the existence of these acoustic propagation conditions implies that communications using an acoustic modem is possible, many questions remain regarding its configuration, including the number of hops and the use of relay nodes to increase the size of the network. For example, longer links can be established by using more energy per bit of information, but multiple hops at shorter ranges (for example, 20 km), could allow adding additional sensors to increase redundancy. These and other trade-offs are examined within the framework of a simple network design model in the following section.
4.3 Design parameters for the underwater sensor network
Designing the underwater sensor network requires determining the key parameters for the network and the possible trade-offs in cost, efficiency, and robustness among them. Given the objective of the network to achieve at least 15 minutes of warning time between the detection of a tsunamigenic earthquake and the arrival of the wave on shore, several parameters in the network design can be varied, resulting in different balances of cost, efficiency, and robustness in an underwater sensor network. An overview of the design parameters is given in Figure 4.
Figure 4. Design parameters for the underwater sensor network.
Vol. 31, No. 4, page 237 (2012)

The design constraint for any functional sensor network can be expressed by the following equation:
Where:
T1 = Time for the tsunami wave to reach the pressure sensor, which is a complex function of sea depth, earthquake magnitude, and distance from the sensor.
T2 = Time for acoustic wave to reach the acoustic modem, which is a function of the underwater acoustic channel propagation model, ocean temperature, and distance, D1 . T3 = Time for the optical signal to reach the land station, which is a function of the speed of light in fiber, and the distance, D2. ϴ = Time for the tsunami wave to strike land, which is a function of the sea depth, earthquake magnitude, gravitational acceleration, and distance, D3. TP = Packet processing time at pressure sensor and acoustic modem. W = Warning time necessary for evacuation, for example, 15 minutes.
The threat zone is the area where an earthquake might occur, and the impact zone is the area we are trying to protect by giving out a timely warning. Given the impact zone and the threat zone, the threat distance is fixed and the time it will take the tsunami to travel from the threat zone to the impact zone depends on the bathymetry of the area between the zones. D1 is defined as the distance between the threat zone and the pressure sensors, and B is defined as the distance between specific pressure sensors. Bottom pressure sensors forward their measurements to a cable modem attached to the end of the optical fiber cable over a distance D2, and this information is relayed through communication nodes, if necessary. D3 is the cable length. We first make our design constraint explicit before defining the remaining parameters. The objective of the underwater sensor network is to achieve reliable, on-time delivery of data that detects the passing of a tsunami wave. Several factors could affect this model, resulting in different rates of transmission under different conditions. While the climatological data and propagation modeling described above indicate that the warm upper-layer water refracts sound away from the surface and back to the bottom, it is necessary to verify this and confirm the presence or absence of other propagation effects that may impact data rate and power efficiency. Any effects that are revealed by initial testing will need to be evaluated and taken into consideration in the final design of the underwater sensor network. Our design of the sensor network will incorporate adaptive features of network communications technology to conserve energy, reduce error, and extend the operational capacity of the network. For
Vol. 31, No. 4, page 238 (2012)

example, it will include adaptive automatic repeat-request (ARQ) protocols with minimal reliance on Request to Send/Clear to Send (RTS and CTS) mechanisms. Second, the communications network will include dynamic routing to overcome enduring failures in network transmission. This approach will identify relay points for path redundancy in transmission, while minimizing energy consumption. Third, the design will include in-network storage of data to overcome transient failures in transmission and improve network reliability. Fourth, the design will employ joint optimization of erasure codes and forward error correction protocols to minimize the impact of bit errors and packet loss in transmission. This will include calculating trade-offs in context, quality of data, and climate sensitivity to achieve optimum energy consumption while achieving high levels of reliability in accuracy and time. Given the potential complexity of the underwater sensor network, with its spatial extent still in the design phase, we seek to test our assumptions and explore different options by using computational modeling to simulate the different alternatives. The results allow a comparative assessment of the optimum design for the underwater network, given the specific conditions of the Padang coastal environment. This approach will inform the development of a testbed that will allow systematic evaluation of different designs prior to a major investment in the deployment of a underwater sensor network.
4.4 Optimizing design parameters The previous section explained which design parameters we take into account for the underwater sensor network. In this section, we evaluate and compare several different designs for Padang by running a computer program that takes as input the warning time and reliability, and then finds an optimal design in terms of cost. We also evaluate alternative designs by fixing some parameter, e.g., making the cable a fixed length, and then compare the alternatives to the optimal design. Several parameters were determined prior to running the program. For Padang, we know in which areas earthquakes are likely to occur, so we can fix the threat zone. The impact zone will be the most densely populated area along the coast, which we estimated using maps available to us. If decision makers disagree with this estimate, it could easily be changed. Having these two zones fixed, we can estimate , which is the minimum time it would take for the wave to travel from the threat zone to the impact zone, by using bathymetry data and an approximation of the shallow water equations. Given the locations of our threat and impact zone, it will take about 28 minutes for the wave to reach the coastline. The propagation model for acoustic waves is very complicated, since it depends on the temperature, pressure (or depth), and salinity. The propagation model for channel loss and absorption is also very complicated, because it not only depends on distance, but also frequency and temperature. For these reasons, we used simple constants that approximate the real values for acoustic wave propagation. In future work we are planning to incorporate the real values. It is important to emphasize that every design should satisfy , which is defined in the previous section, otherwise the warning may be too late. There could actually be many designs
Vol. 31, No. 4, page 239 (2012)

that satisfy this criterion, which is why the program will simply return the design with the lowest cost to implement. When warning time W is set too high, it is possible that no design could satisfy the equation. Different designs also have different reliability levels. One approach to increase the reliability is to install more sensors and relay nodes because they provide backup and alternate communication routes. Deploying more devices, however, incurs more expenses. We previously noted that alternative designs could be evaluated by fixing some of the parameters, such as the cable. In that setting, only the values of other parameters will be chosen that minimize the cost. This cost will never be less than the design without the fixed parameter, but in some cases policy makers may have a preference for a certain design parameter, and they would like to see how that parameter affects the cost. The cost function takes into account the cost for the pressure sensors, the communication sensors, the cable, and the deployment of the cable. The costs shown are relative to the Design 1 cost. Design 1: This is the optimal design, i.e., the design with the lowest cost, but without any redundancy built in (low reliability). Design 2: This is the same as design 1, but all the sensors are redundant so there is no single point of failure (high reliability). Design 3: This is the same as design 2, but with a 20 km cable. Design 4: This is the same as design 3, but with a 20 minute warning time. The results of the different designs are listed in Table 1 below:
Table 1. Comparison of Design Parameters for Underwater Sensor Network
Parameter Design 1 Design 2 Design 3 Design 4
W (warning time) 15 15 15 20 Reliability Low High High High
# of pressure sensors 1 2 2 2 # of communication
nodes 2 4 4 4
D1 68 km 54 km 32 km 43 km D2 17 km 29 km 37 km 37 km
D3 (cable length) 4 km 7 km 20 km 9 km Cost N 1.8*N 3.2*N 2*N
The least expensive design does not have any redundancy built in. The design with redundancy is almost twice the cost, but is much safer, because there is no single point of failure. Since extending the cable is expensive, design 3 is by far the most costly. The fourth design gives some valuable insight into the design process. Note that the cable length has increased compared to designs 1 and 2 because a longer (optical fiber) cable means faster transmission than through the acoustic network, so the warning can be given earlier. Yet the design is much cheaper than design 3, which warrants a 15
Vol. 31, No. 4, page 240 (2012)

minute warning time, but the reason is that the time constraint on the model is only a lower bound and, in fact, design 3 actually provides 22-minute warning time. 4.5 Visualizing the Tsunami Warning Network After identifying an optimal design, we would like to use it in a scenario and present it graphically to those involved in making design and policy decisions. In order to do that, we created an additional module that simulates an earthquake and subsequent events, including traffic through the different sections of the network. In Figure 4 below, the output of this module is shown on a map. The orange line is the threat zone and the red line is the impact zone. The blue line is the communication cable. An earthquake is simulated in the threat zone, which causes a tsunami to start traveling to the coast. The green lines show the location of the wave in one-minute increments. The wave has reached the pressure sensor, which has become active (colored red). This information has not been transmitted to the coast yet, because the gateway is still inactive (colored gray).
Figure 4. Computer simulation of tsunami wave propagation, detection by a sensor, and transmission through the acoustic and cable network for a particular scenario.
Vol. 31, No. 4, page 241 (2012)

5. Conclusions Four primary conclusions summarize the work described in this paper. First, near-field tsunami detection remains an important topic that warrants continued research into both methods and real-time data telemetry. Second, at the moment, ocean bottom pressure sensors offer the most practical means of detecting and then reliably estimating the magnitude of tsunamis. Third, warm ocean waters in equatorial environments create the effect of bending sound waves back to the bottom of the ocean floor, allowing acoustic communications to travel longer distances than would otherwise be possible from bottom sensors. This condition creates the basis for an underwater sensor network that could transmit tsunami detection data to a shore-connected receiving station with sufficient warning time (at least 15 minutes) to inform emergency managers who could mobilize evacuation strategies for communities at risk. Fourth, such a sensor network, such as described here in model form, requires prototyping and testing in an actual ocean environment to determine the optimal design, using metrics that include cost, efficiency, and robustness before making a major investment. If validated through such a demonstration project, this approach could benefit hundreds of thousands of people who live in coastal communities at risk from tsunamis. While the proposed solution is motivated by the difficulty in maintaining buoys near shore in Indonesia due to vandalism, it may find uses in other environments as well where the acoustic system can connect to existing or planned subsea ocean observatories. ACKNOWLEDGEMENTS We acknowledge, with thanks and appreciation, financial support from the U.S. National Science Foundation, Decision, Risk, and Uncertainty grant #0729456, institutional support of the University of Pittsburgh, Woods Hole Oceanographic Institution, and our Indonesian collaborators, Bandung Institute of Technology, Ministry of Science and Technology, Agency for Assessment and Application of Technology, and Agency for Meteorology, Climatology, and Geophysics. REFERENCES Behrens, J., Androsov, A., Babeyko, A. Y., Harig, S., Klaschka, F., and Mentrup, L. (2010). A new
multi-sensor approach to simulation assisted tsunami early warning, Nat. Hazards Earth Syst. Sci., 10, 1085-1100, doi:10.5194/nhess-10-1085-2010.
Bernard, E. N., H. O. Mofjeld, V. Titov, C. E. Synolakis, & F. I. Gonzalez. (2006). Tsunami: Scientific Frontiers, Mitigation. Forecasting and Policy Implications. Phil. Trans. R. Soc. A. Math. Phys. Eng. Sci. 364 (1845): 1989-2007.
Boulos, G. Huggins, L., Siciliano, M., Yackovich, J., Ling, H., Mossé, D., Comfort, L. (2011). Detecting and communicating risk of near-shore tsunamis: Coupling near-shore sensor networks with land-based modeling for Padang, Indonesia. Journal of Comparative Policy Analysis. Vol. 14, 2, 1-15.
Cabinet Office of Japan, (2011). White Paper on Disaster Management (in Japanese). Available at http://www.bousai.go.jp/hakusho/H23_zenbun.pdf
Vol. 31, No. 4, page 242 (2012)

Comfort, L. (2007). Crisis Management in Hindsight: Cognition, Communication, Coordination, and
Control. Public Administration Review. Vol. 67. Special Issue, Administrative Failure in the Wake of Katrina. December. Pp. S188-S196.
Freitag, L., M. Johnson, M. Stojanovic, D. Nagle and J. Catipovic, “Survey and analysis of underwater acoustic channels for coherent communication in the medium-frequency band,” Proc. Oceans 2000, Providence, RI, Vol. 1, pp. 123-128, 2000.
Lauterjung, J., Münch, U., and Rudloff, A. (2010). The challenge of installing a tsunami early warning system in the vicinity of the Sunda Arc, Indonesia, Nat. Hazards Earth Syst. Sci., 10, 641-646, doi:10.5194/nhess-10-641-2010.
McCloskey, J., Lange, D., Tilmann, F., Nalbant, S. Bell, A., Natawidjaja, D., and Rietbrock, A. (2010). Nature Geoscience, 3:February, 70-71.
Meinig, C., S. E. Stalin, A. I. Nakamura, F. Gonzalez, and H. B. Milburn, 2005: Technology developments in real-time tsu- nami measuring, monitoring and forecasting. Oceans 2005, MTS (Marine Technology Society)/IEEE Proceedings, Vol. 2, IEEE, 1673–1679.
Morrissey, W. (2005). Tsunamis: Monitoring, Detection, and Early Warning Systems. Washington, DC: Congressional Research Service. Order Code RL32739, 1-8.
Paros, J.; Bernard, E.; Delaney, J.; Meinig, C.; Spillane, M.; Migliacio, P.; Tang, L.; Chadwick, W.; Schaad, T.; Stalin, S. (2011). "Breakthrough underwater technology holds promise for improved local tsunami warnings," Underwater Technology (UT), 2011 IEEE Symposium on and 2011 Workshop on Scientific Use of Submarine Cables and Related Technologies (SSC) , vol., no., pp.1-9, 5-8 April 2011. doi: 10.1109/UT.2011.5774145
Satake, K., Okal, E. & Borrero, J. (2007). Tsunami and Its Hazards in the Indian and Pacific Oceans. Boston, MA: Springer-Verlag.
Singh, S., Pérez -Campos, X., Iglesias, A., Melgar, D. (2012). A Method for Rapid Estimation of Moment Magnitude for Early Tsunami Warning Based on Coastal GPS Networks. Seismological Research Letters(May 2012), 83(3):516-530
Strunz, G., Post, J., Zosseder, K., Wegscheider, S., Mück, M., Riedlinger, T., Mehl, H., Dech, S., Birkmann, J., Gebert, N., Harjono, H., Anwar, H. Z., Sumaryono, Khomarudin, R. M., and Muhari, A. (2011). Tsunami risk assessment in Indonesia, Nat. Hazards Earth Syst. Sci., 11, 67-82, doi:10.5194/nhess-11-67-2011.
Titov, V., Gonzalez, F., Bernard, E., Eble, M., Mofjeld, H., Newman, J. and Venturato, A. (2003). Real-Time Tsunami Forecasting: Challenges and Solutions. Netherlands. Kluwer Academic Publishers, pp. 1-16.
UNESCO IOC Data Buoy Cooperation Panel, International Tsunameter Partnership. (2011). Ocean Data Buoy Vandalism - Incidence, Impact and Responses, DBCP Technical Document No. 41, Version 1.
United Nations. (2005a). Humanitarian Response Review. New York and Geneva: Office for the Coordination of Humanitarian Affairs. August.
United Nations Educational, Scientific and Cultural Organization. (2005b). IOC Principles and Strategy For Capacity Building. Intergovernmental Oceanographic Committee [IOC] General Assembly. June. http://ngdc.noaa.gov/hazard/tsu_db.shtml)
Vol. 31, No. 4, page 243 (2012)