
Science of the Total Environment - Stanford Universityweb.stanford.edu/group/deleolab/pdf/2013...
12
Effects of heat recovery for district heating on waste incineration health impact: A simulation study in Northern Italy Michele Cordioli a, ⁎, Simone Vincenzi b , Giulio A. De Leo c a Department of Environmental Sciences, University of Parma, Parco Area delle Scienze 33/A, I-43100 Parma, Italy b Center for Stock Assessment Research, Department of Applied Mathematics and Statistics, University of California, Santa Cruz, CA, USA c Hopkins Marine Station and Woods Institute for the Environment, Stanford University, CA, USA HIGHLIGHTS ► We estimated the health effect caused by the emission of PM 10 , PCDD/F, PAH, Cd and Hg from a new waste incinerator. ► We considered the compensation in PM 10 emission obtained through the activation of a district heating network. ► We found a moderate impact of the incinerator on human health for the exposed population. ► The switch-off of domestic boilers compensates for health impacts caused by PM 10 emission from the incinerator. ► The degree of self-subsistence of the diet and the consumption habits contributes substantially to risk determination. abstract article info Article history: Received 5 July 2012 Received in revised form 30 October 2012 Accepted 25 November 2012 Available online xxxx Keywords: Health risk assessment Air pollution MSW incinerator Exposure assessment Sensitivity analysis District heating The construction of waste incinerators in populated areas always causes substantial public concern. Since the heat from waste combustion can be recovered to power district heating networks and allows for the switch-off of domestic boilers in urbanized areas, predictive models for health assessment should also take into account the potential benefits of abating an important source of diffuse emission. In this work, we simulated the dispersion of atmospheric pollutants from a waste incinerator under construc- tion in Parma (Italy) into different environmental compartments and estimated the potential health effect of both criteria- (PM 10 ) and micro-pollutants (PCDD/F, PAH, Cd, Hg). We analyzed two emission scenarios, one considering only the new incinerator, and the other accounting for the potential decrease in pollutant con- centrations due to the activation of a district heating network. We estimated the effect of uncertainty in pa- rameter estimation on health risk through Monte Carlo simulations. In addition, we analyzed the robustness of health risk to alternative assumptions on: a) the geographical origins of the potentially contaminated food, and b) the dietary habits of the exposed population. Our analysis showed that under the specific set of assumptions and emission scenarios explored in the present work: (i) the proposed waste incinerator plant appears to cause negligible harm to the resident population; (ii) despite the net increase in PM 10 mass balance, ground-level concentration of fine particulate matter may be curbed by the activation of an extensive district heating system powered through waste combustion heat recovery and the concurrent switch-off of domestic/industrial heating boilers. In addition, our study showed that the health risk caused by waste incineration emissions is sensitive to assumptions about the typ- ical diet of the resident population, and the geographical origins of food production. © 2012 Elsevier B.V. All rights reserved. 1. Introduction The estimation of health effects caused by the anthropogenic emis- sion of atmospheric pollutants is a key issue in the debate on the sustain- ability of human activities. Human exposure to atmospheric pollution may occur not only through air inhalation, but also indirectly through in- gestion of contaminated water, soil or food (Abrahams, 2002; Lippmann, 2009; Sweetman et al., 2000; WHO Europe, 2000). A number of methodologies for assessing the direct and indirect effects on health caused by air pollution have been proposed by public health institutions, international research organizations and environ- mental agencies (Fryer et al., 2006; Rovira et al., 2012). The general approach, inspired by the scheme proposed by the National Academy of Sciences (NAS, 1983), is to track the diffusion of Chemicals Of Poten- tial Concern (COPC) through different environmental media according to the so called “source–pathway–receptor” model (Fig. 1). Widespread public concern is associated with the atmospheric emission of pollutants from municipal solid waste (MSW) incinerators. The epidemiologic literature on the health effects caused by the activity Science of the Total Environment 444 (2013) 369–380 ⁎ Corresponding author. Tel.: +39 0521 905696; fax: +39 0521 906611. E-mail address: [email protected] (M. Cordioli). 0048-9697/$ – see front matter © 2012 Elsevier B.V. All rights reserved. http://dx.doi.org/10.1016/j.scitotenv.2012.11.079 Contents lists available at SciVerse ScienceDirect Science of the Total Environment journal homepage: www.elsevier.com/locate/scitotenv
Transcript of Science of the Total Environment - Stanford Universityweb.stanford.edu/group/deleolab/pdf/2013...
Science of the Total Environment 444 (2013) 369–380
Contents lists available at SciVerse ScienceDirect
Science of the Total Environment
j ourna l homepage: www.e lsev ie r .com/ locate /sc i totenv
Effects of heat recovery for district heating on waste incineration health impact:A simulation study in Northern Italy
Michele Cordioli a,⁎, Simone Vincenzi b, Giulio A. De Leo c
a Department of Environmental Sciences, University of Parma, Parco Area delle Scienze 33/A, I-43100 Parma, Italyb Center for Stock Assessment Research, Department of Applied Mathematics and Statistics, University of California, Santa Cruz, CA, USAc Hopkins Marine Station and Woods Institute for the Environment, Stanford University, CA, USA
H I G H L I G H T S
► We estimated the health effect caused by the emission of PM10, PCDD/F, PAH, Cd and Hg from a new waste incinerator.► We considered the compensation in PM10 emission obtained through the activation of a district heating network.► We found a moderate impact of the incinerator on human health for the exposed population.► The switch-off of domestic boilers compensates for health impacts caused by PM10 emission from the incinerator.► The degree of self-subsistence of the diet and the consumption habits contributes substantially to risk determination.
⁎ Corresponding author. Tel.: +39 0521 905696; fax:E-mail address: [email protected] (M. Cordiol
0048-9697/$ – see front matter © 2012 Elsevier B.V. Allhttp://dx.doi.org/10.1016/j.scitotenv.2012.11.079
a b s t r a c t
a r t i c l e i n f oArticle history:Received 5 July 2012Received in revised form 30 October 2012Accepted 25 November 2012Available online xxxx
Keywords:Health risk assessmentAir pollutionMSW incineratorExposure assessmentSensitivity analysisDistrict heating
The construction of waste incinerators in populated areas always causes substantial public concern. Since theheat from waste combustion can be recovered to power district heating networks and allows for theswitch-off of domestic boilers in urbanized areas, predictive models for health assessment should also takeinto account the potential benefits of abating an important source of diffuse emission.In this work, we simulated the dispersion of atmospheric pollutants from a waste incinerator under construc-tion in Parma (Italy) into different environmental compartments and estimated the potential health effect ofboth criteria- (PM10) and micro-pollutants (PCDD/F, PAH, Cd, Hg). We analyzed two emission scenarios, oneconsidering only the new incinerator, and the other accounting for the potential decrease in pollutant con-centrations due to the activation of a district heating network. We estimated the effect of uncertainty in pa-rameter estimation on health risk through Monte Carlo simulations. In addition, we analyzed the robustnessof health risk to alternative assumptions on: a) the geographical origins of the potentially contaminated food,and b) the dietary habits of the exposed population.Our analysis showed that under the specific set of assumptions and emission scenarios explored in the presentwork: (i) the proposed waste incinerator plant appears to cause negligible harm to the resident population;(ii) despite the net increase in PM10 mass balance, ground-level concentration of fine particulate mattermay be curbed by the activation of an extensive district heating system powered through waste combustionheat recovery and the concurrent switch-off of domestic/industrial heating boilers. In addition, our studyshowed that the health risk caused by waste incineration emissions is sensitive to assumptions about the typ-ical diet of the resident population, and the geographical origins of food production.
© 2012 Elsevier B.V. All rights reserved.
1. Introduction
The estimation of health effects caused by the anthropogenic emis-sion of atmospheric pollutants is a key issue in thedebate on the sustain-ability of human activities. Human exposure to atmospheric pollutionmay occur not only through air inhalation, but also indirectly through in-gestion of contaminatedwater, soil or food (Abrahams, 2002; Lippmann,2009; Sweetman et al., 2000; WHO Europe, 2000).
+39 0521 906611.i).
rights reserved.
A number of methodologies for assessing the direct and indirecteffects on health caused by air pollution have been proposed by publichealth institutions, international research organizations and environ-mental agencies (Fryer et al., 2006; Rovira et al., 2012). The generalapproach, inspired by the scheme proposed by the National Academyof Sciences (NAS, 1983), is to track the diffusion of Chemicals Of Poten-tial Concern (COPC) through different environmental media accordingto the so called “source–pathway–receptor” model (Fig. 1).
Widespread public concern is associated with the atmosphericemission of pollutants frommunicipal solid waste (MSW) incinerators.The epidemiologic literature on the health effects caused by the activity
List of acronyms
COPC Chemicals Of Potential ConcernCSF Cancer Slope FactorDb domestic boilersERF Exposure–Response FunctionEIA Environmental Impact AssessmentES1/ES2 first/second emission scenario for PM10ESM Electronic Supplementary MaterialFHItD Full Home-grown Italian DietFHNAD Full Home-grown North American DietFMItD Full Mix Italian DietHHRAP Human Health Risk Assessment ProtocolHI Hazard IndexHMs heavy metalsHp existing heating plantHQ Hazard QuotientHRA Health Risk AssessmentIn IncineratorLADD Lifetime Average Daily DoseLCA Life Cycle AssessmentMSW Municipal Solid WastePHItD Partial Home-grown Italian DietRfD Reference DoseRR Relative RiskSb supplementary gas boilerTCR Total Cancer RiskTDI Tolerable Daily Intake
Model parameters cited in the textEF exposure frequencyAT averaging timetD lifetime of the incineratorBvFOR air–plant biotransfer factor for forageBrAG soil–plant biotransfer factor for aboveground vegetablesCrMILKagr milk and dairy products consumption rateCrAGPurb aboveground protected vegetables consumption rateFlocVEGurb fraction of home-grown vegetable consumption, urban
scenarioQpSILmilk quantity of silage ingested by cowsBD soil bulk densityZsURB soil accumulation depth
370 M. Cordioli et al. / Science of the Total Environment 444 (2013) 369–380
of MSW incinerators is extensive and well reviewed (Franchini et al.,2004; Porta et al., 2009; UK DEFRA, 2004; WHO Europe, 2007). Anassociation between health risk and proximity to incinerators was doc-umented in a number of epidemiological studies (Cordier et al., 2010;Ranzi et al., 2011; Viel et al., 2008). Nevertheless, while very informa-tive, the results of these ex-post epidemiological studies cannot beeasily extrapolated to estimate ex-ante the future health effects of alter-native emission scenarios from proposed projects of modern waste in-cinerators. On the contrary, simulation studies are able to provideex-ante estimates of the potential health effects of a proposed wasteincinerator by: (i) linking stack emissions to the projected level of expo-sure of the resident population, and then (ii) by using pollutant-specificExposure–Response Functions to quantitatively estimate the potentialrisk for human health.
Several simulation studies have recently estimated the health effectsof pollutants from MSWI incinerators and other industrial plants(Cangialosi et al., 2008; Kim et al., 2011; Lonati and Zanoni, 2012;Morra et al., 2009; Roberts and Chen, 2006; Rovira et al., 2010). Never-theless, while HRAs have been routinely performed in the last twenty
years, there are still a number of issues that have not been thoroughly in-vestigated in the literature.
First, it is not clear whether the potential health impacts caused byincinerator stack emissions can be partially compensated for by thereduction in atmospheric emissions achievable through district heatingand the switch-off of a substantial number of domestic boilers (Rezaieand Rosen, 2012). It is critical to determinewhether the choice to locatea waste incineration facility near a densely populated area may bejustified by the benefits derived from heat recovery fromwaste inciner-ation and the activation of extensive district heating.
Second, in standardHRAs it is often assumed that only food producedat the exposure location (i.e., home-grown at the residence address) ispotentially contaminated by stack emissions (EPA, 2005a), while foodof animal origin consumed by residents in urban areas is commonlyassumed to be produced elsewhere and, as such, considered to beuncontaminated. Although this might be true in large urban settings, inmany semi-urbanized areas “farmers' markets” selling local food prod-ucts are becoming increasingly popular. As a consequence, it is importantto assess whether people living in small- and medium-sized urbansettings could be potentially affected by stack emissions by regularly eat-ing food produced in the nearby countryside that may be potentiallycontaminated by waste incineration.
Third, previous risk assessment studies performed in Italy usedthe typical diet of North American (Cangialosi et al., 2008; Morra etal., 2006) or Spanish citizens (Lonati and Zanoni, 2012). However,the typical Italian diet is substantially different from the NorthAmerican one (Da Silva et al., 2009), and therefore it is relevant toassess whether assuming the consumption of one diet or the othermay change the outcome of HRA studies.
Here, we present the results of a preliminary analysis of a multi-compartment model to estimate the potential long-term consequenceson human health of the operations of aMSW incinerator plant currentlyunder construction in the city of Parma (Italy). The analysis was carriedout specifically to investigate the effect on HRA of: (i) the activation ofdistrict heating fuelled by the MSW incinerator and the switch-off ofdomestic boilers, and (ii) different assumptions on dietary habits andgeographical origin of production of food consumed by the residentpopulation.
2. Materials and methods
HRA studies of incinerators emissions typically focus on two COPCclasses (Roberts and Chen, 2006; Schuhmacher et al., 2004):(i) criteria pollutants (i.e., particulate matter, nitrogen oxides, etc.)and (ii) micropollutants (i.e., dioxins, heavy metals, etc.).
Different approaches have been developed to analyze these two cat-egories of pollutants (Fig. 1), as described below. Here, we focused onhealth effects due to chronic exposure under the assumption that thewaste incinerator plant under study will be well managed (and thusemissions will never exceed legal limits) and, consequently, the proba-bility of acute short-term exposure to high level of pollutants will benegligible.
2.1. Health risk assessment for criteria pollutants
Criteria pollutants have short residence times in the atmosphere dueto degradation reactions, and do not usually show bioaccumulationproperties. Direct inhalation through contaminated air is usually con-sidered the main pathway of exposure (WHO Europe, 2000, 2006).
The number E of new cases per unit time (case year−1) caused by aprojected increase in ground concentration of atmospheric pollutants(or the number of cases avoided due to a reduction in ground concentra-tion of pollutants) was estimated by means of Exposure–ResponseFunctions (ERFs), as described in previous studies (Forastiere et al.,2011; Kunzli et al., 2000; Martuzzi et al., 2006). Appendix D in the
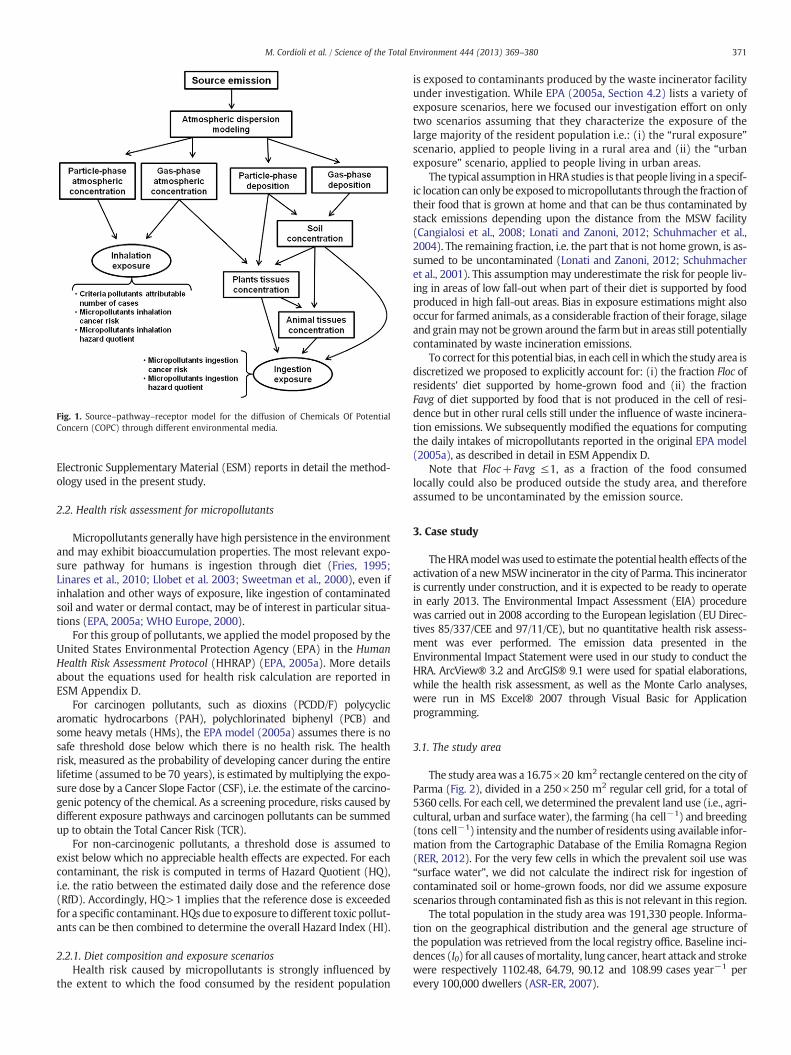
Fig. 1. Source–pathway–receptor model for the diffusion of Chemicals Of PotentialConcern (COPC) through different environmental media.
371M. Cordioli et al. / Science of the Total Environment 444 (2013) 369–380
Electronic Supplementary Material (ESM) reports in detail the method-ology used in the present study.
2.2. Health risk assessment for micropollutants
Micropollutants generally have high persistence in the environmentand may exhibit bioaccumulation properties. The most relevant expo-sure pathway for humans is ingestion through diet (Fries, 1995;Linares et al., 2010; Llobet et al. 2003; Sweetman et al., 2000), even ifinhalation and other ways of exposure, like ingestion of contaminatedsoil and water or dermal contact, may be of interest in particular situa-tions (EPA, 2005a; WHO Europe, 2000).
For this group of pollutants, we applied the model proposed by theUnited States Environmental Protection Agency (EPA) in the HumanHealth Risk Assessment Protocol (HHRAP) (EPA, 2005a). More detailsabout the equations used for health risk calculation are reported inESM Appendix D.
For carcinogen pollutants, such as dioxins (PCDD/F) polycyclicaromatic hydrocarbons (PAH), polychlorinated biphenyl (PCB) andsome heavy metals (HMs), the EPA model (2005a) assumes there is nosafe threshold dose below which there is no health risk. The healthrisk, measured as the probability of developing cancer during the entirelifetime (assumed to be 70 years), is estimated bymultiplying the expo-sure dose by a Cancer Slope Factor (CSF), i.e. the estimate of the carcino-genic potency of the chemical. As a screening procedure, risks caused bydifferent exposure pathways and carcinogen pollutants can be summedup to obtain the Total Cancer Risk (TCR).
For non-carcinogenic pollutants, a threshold dose is assumed toexist below which no appreciable health effects are expected. For eachcontaminant, the risk is computed in terms of Hazard Quotient (HQ),i.e. the ratio between the estimated daily dose and the reference dose(RfD). Accordingly, HQ>1 implies that the reference dose is exceededfor a specific contaminant. HQs due to exposure to different toxic pollut-ants can be then combined to determine the overall Hazard Index (HI).
2.2.1. Diet composition and exposure scenariosHealth risk caused by micropollutants is strongly influenced by
the extent to which the food consumed by the resident population
is exposed to contaminants produced by the waste incinerator facilityunder investigation. While EPA (2005a, Section 4.2) lists a variety ofexposure scenarios, here we focused our investigation effort on onlytwo scenarios assuming that they characterize the exposure of thelarge majority of the resident population i.e.: (i) the “rural exposure”scenario, applied to people living in a rural area and (ii) the “urbanexposure” scenario, applied to people living in urban areas.
The typical assumption inHRA studies is that people living in a specif-ic location can only be exposed tomicropollutants through the fraction oftheir food that is grown at home and that can be thus contaminated bystack emissions depending upon the distance from the MSW facility(Cangialosi et al., 2008; Lonati and Zanoni, 2012; Schuhmacher et al.,2004). The remaining fraction, i.e. the part that is not home grown, is as-sumed to be uncontaminated (Lonati and Zanoni, 2012; Schuhmacheret al., 2001). This assumption may underestimate the risk for people liv-ing in areas of low fall-out when part of their diet is supported by foodproduced in high fall-out areas. Bias in exposure estimations might alsooccur for farmed animals, as a considerable fraction of their forage, silageand grainmay not be grown around the farmbut in areas still potentiallycontaminated by waste incineration emissions.
To correct for this potential bias, in each cell inwhich the study area isdiscretized we proposed to explicitly account for: (i) the fraction Floc ofresidents' diet supported by home-grown food and (ii) the fractionFavg of diet supported by food that is not produced in the cell of resi-dence but in other rural cells still under the influence of waste incinera-tion emissions. We subsequently modified the equations for computingthe daily intakes of micropollutants reported in the original EPA model(2005a), as described in detail in ESM Appendix D.
Note that Floc+Favg ≤1, as a fraction of the food consumedlocally could also be produced outside the study area, and thereforeassumed to be uncontaminated by the emission source.
3. Case study
TheHRAmodelwas used to estimate thepotential health effects of theactivation of a newMSW incinerator in the city of Parma. This incineratoris currently under construction, and it is expected to be ready to operatein early 2013. The Environmental Impact Assessment (EIA) procedurewas carried out in 2008 according to the European legislation (EU Direc-tives 85/337/CEE and 97/11/CE), but no quantitative health risk assess-ment was ever performed. The emission data presented in theEnvironmental Impact Statement were used in our study to conduct theHRA. ArcView® 3.2 and ArcGIS® 9.1 were used for spatial elaborations,while the health risk assessment, as well as the Monte Carlo analyses,were run in MS Excel® 2007 through Visual Basic for Applicationprogramming.
3.1. The study area
The study areawas a 16.75×20 km2 rectangle centered on the city ofParma (Fig. 2), divided in a 250×250 m2 regular cell grid, for a total of5360 cells. For each cell, we determined the prevalent land use (i.e., agri-cultural, urban and surfacewater), the farming (ha cell−1) and breeding(tons cell−1) intensity and thenumber of residents using available infor-mation from the Cartographic Database of the Emilia Romagna Region(RER, 2012). For the very few cells in which the prevalent soil use was“surface water”, we did not calculate the indirect risk for ingestion ofcontaminated soil or home-grown foods, nor did we assume exposurescenarios through contaminated fish as this is not relevant in this region.
The total population in the study area was 191,330 people. Informa-tion on the geographical distribution and the general age structure ofthe population was retrieved from the local registry office. Baseline inci-dences (I0) for all causes ofmortality, lung cancer, heart attack and strokewere respectively 1102.48, 64.79, 90.12 and 108.99 cases year−1 perevery 100,000 dwellers (ASR-ER, 2007).
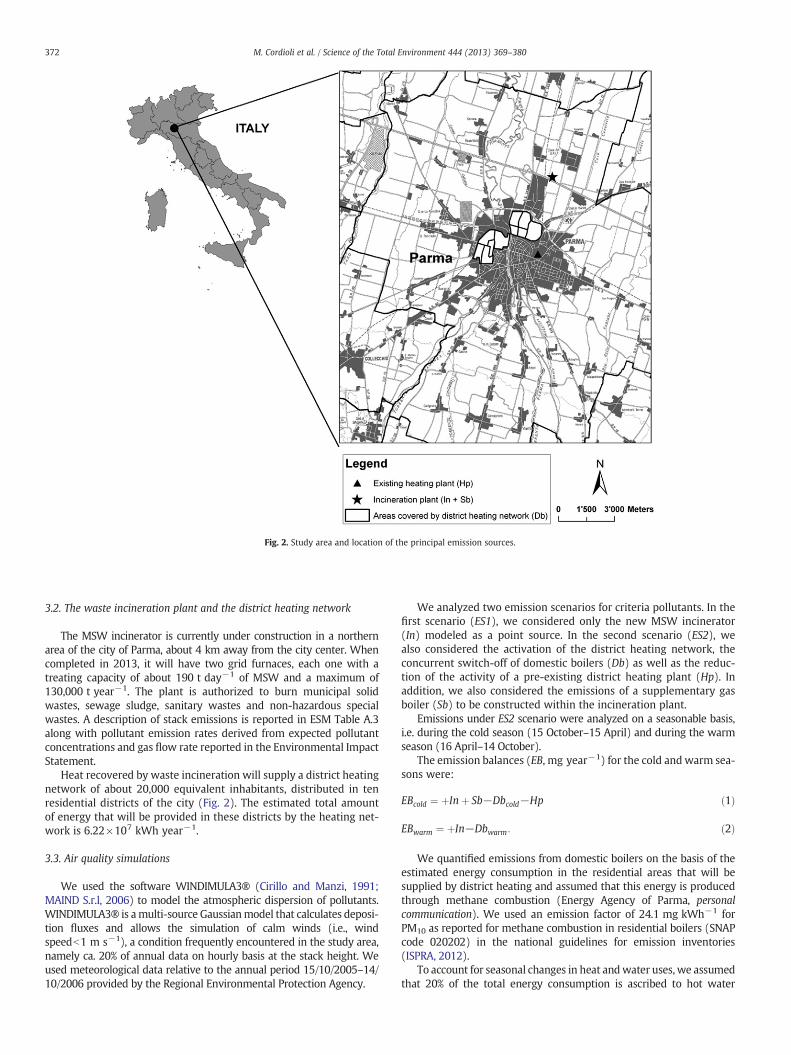
Fig. 2. Study area and location of the principal emission sources.
372 M. Cordioli et al. / Science of the Total Environment 444 (2013) 369–380
3.2. The waste incineration plant and the district heating network
The MSW incinerator is currently under construction in a northernarea of the city of Parma, about 4 km away from the city center. Whencompleted in 2013, it will have two grid furnaces, each one with atreating capacity of about 190 t day−1 of MSW and a maximum of130,000 t year−1. The plant is authorized to burn municipal solidwastes, sewage sludge, sanitary wastes and non-hazardous specialwastes. A description of stack emissions is reported in ESM Table A.3along with pollutant emission rates derived from expected pollutantconcentrations and gas flow rate reported in the Environmental ImpactStatement.
Heat recovered by waste incineration will supply a district heatingnetwork of about 20,000 equivalent inhabitants, distributed in tenresidential districts of the city (Fig. 2). The estimated total amountof energy that will be provided in these districts by the heating net-work is 6.22×10⁷ kWh year−1.
3.3. Air quality simulations
We used the software WINDIMULA3® (Cirillo and Manzi, 1991;MAIND S.r.l, 2006) to model the atmospheric dispersion of pollutants.WINDIMULA3® is amulti-source Gaussianmodel that calculates deposi-tion fluxes and allows the simulation of calm winds (i.e., windspeedb1 m s−1), a condition frequently encountered in the study area,namely ca. 20% of annual data on hourly basis at the stack height. Weused meteorological data relative to the annual period 15/10/2005–14/10/2006 provided by the Regional Environmental Protection Agency.
We analyzed two emission scenarios for criteria pollutants. In thefirst scenario (ES1), we considered only the new MSW incinerator(In) modeled as a point source. In the second scenario (ES2), wealso considered the activation of the district heating network, theconcurrent switch-off of domestic boilers (Db) as well as the reduc-tion of the activity of a pre-existing district heating plant (Hp). Inaddition, we also considered the emissions of a supplementary gasboiler (Sb) to be constructed within the incineration plant.
Emissions under ES2 scenario were analyzed on a seasonable basis,i.e. during the cold season (15 October–15 April) and during the warmseason (16 April–14 October).
The emission balances (EB, mg year−1) for the cold andwarm sea-sons were:
EBcold ¼ þInþ Sb−Dbcold−Hp ð1Þ
EBwarm ¼ þIn−Dbwarm: ð2Þ
We quantified emissions from domestic boilers on the basis of theestimated energy consumption in the residential areas that will besupplied by district heating and assumed that this energy is producedthrough methane combustion (Energy Agency of Parma, personalcommunication). We used an emission factor of 24.1 mg kWh−1 forPM10 as reported for methane combustion in residential boilers (SNAPcode 020202) in the national guidelines for emission inventories(ISPRA, 2012).
To account for seasonal changes in heat andwater uses, we assumedthat 20% of the total energy consumption is ascribed to hot water
373M. Cordioli et al. / Science of the Total Environment 444 (2013) 369–380
production throughout the entire year and 80% imputable to househeating during the cold season only (ENEA, 2005).
The warm season emission rate (EFwarm, mg s−1) for hot waterproduction was assumed to be constant over the year and computedas follows:
EFwarm ¼ Ehwtot= 8760⋅3600ð Þ ð3Þ
where Ehwtot is the total emission due to hot water production(mg year−1) and 8760·3600 is the number of seconds in a year.
The cold season emission rate (EFcold, mg s−1) was computed as:
EFcold ¼ Erhtot= 4392⋅3600ð Þ þ Ehwtot= 8760⋅3600ð Þ ð4Þ
where Erhtot is the total emission as a result of house heating(mg year−1), and 4392·3600 is the number of seconds in the coldseason.
The ten residential areas that will be connected to the new heatingnetwork (Fig. 2) were aggregated for modeling purposes into two cir-cular areas of equivalent surface and treated in the second emissionscenario (ES2) as distributed pollution sources: the pollutant concen-tration from these two sources was subtracted from that derived fromthe incinerator. Their emission height was assumed to be 15 m (ESMTable A.4).
3.4. Case study COPC
There is no general consensus on ERFs for chronic health effect of pol-lutants other than PM10, e.g. NOx and SOx. In fact, PM10 concentrationsgenerally exhibit a very high correlation with these criteria pollutants.Therefore, in epidemiological studies it may be particularly problematicto disentangle the health effect of SOx and NOx from that of PM10
(Torfs et al., 2007; WHO, 2003). As a consequence, HRA for criteria pol-lutants was performed only with reference to primary PM10 emissionsso as to avoid double counting.
The evidence for an independent effect of tropospheric ozone (O3)is stronger. However, O3 modeling requires the use of more complexphotochemical models, and this was beyond the scope of the presentwork.
Table A.1 in the ESM reports the ERFs for PM10.We noted that the rel-ative risks for some health outcomes (i.e. stroke, acute bronchitis andasthma) are not statistically significant. However, since the central esti-mate suggests that an effect of PM10 on those outcomes is indeed possi-ble, we decided to use these ERFs in our RHA consistently with aprecautionary approach. For ERFs relative to PM2.5, a ratio PM2.5/PM10
of 0.7 was assumed according to Medina et al. (2005).As for micropollutants, we modeled PCDD/F (as equivalent
2,3,7,8-tetrachloro-dibenzo-p-dioxin), PAH (as benzo[a]pyrene), mercu-ry (as Hg0, Hg2+ and methyl-Hg) and cadmium (as the sum of Cd+Tlauthorized emissions).
We followed EPA (2005a) guidelines for the partitioning of differentpollutants between the gas and particle phase (ESM, Table A.5). Mercu-ry was assumed to be released as Hg0 and HgCl2 and 2% of depositedmercury was assumed to speciate to Methyl-Hg in soil (EPA, 2005a).
The CSFs and RfDs values reported in ESM Table A.2 were derivedfrom the Integrated Risk Information System (IRIS) (EPA, 2008) andthe Risk Assessment Information System (RAIS) (Oak Ridge NationalLaboratory, 2008).
ESM Table A.6 lists the values chosen for the other parameters ofthe model.
For PM10 we modeled both scenarios ES1 and ES2, whilemicropollutants were modeled only for scenario ES1, as domestic meth-ane boilers do not represent a relevant source for these chemicals.
3.5. Dietary habits
It is well known that food consumption may change substantiallydepending upon regional habits and local culinary traditions, and thismight significantly affect the potential intake of environmental pollut-ants from food (Undeman et al., 2010). The North American diet in par-ticular is known to be quite different from the typical Italian diet (DaSilva et al., 2009).We thus investigatedwhether alternative assumptionson diet composition may significantly affect health risk assessment.
Since detailed dietary data were not available for the province ofParma, we derived the average Italian diet composition from Turrini etal. (1991) on the basis of nation-wide food consumption data. Accordingto the inclusion criteria presented in EPA (1997), food items weregrouped in the eight food categories used in the EPA model (EPA,2005a). When needed, we derived dry weight consumption values bycorrecting Turrini et al.'s data (1991) for water content on the basis offood composition tables developed by the Italian Institute for Researchon Foods and Nutrition (INRAN, 2012). Average body weight for adultswas set to 70 kg as in Walpole et al. (2012). No preparing and cookinglosses were considered.
Health risk was first estimated for the Italian diet under the fol-lowing assumptions:
- all food consumed by resident people was produced in the studyarea and, thus, potentially contaminated (i.e., Floc+Favg=1);
- in “rural” cells 100% of vegetables in the residents' diet werehome-grown (FlocVEG=1) while only 50% of animal productswere home-grown (FlocANI=0.5) and the other 50% were pro-duced elsewhere within the study area (FavgANI=0.5);
- in “urban” cells 50% of vegetables were home-grown (FlocVEG=0.5, FavgVEG=0.5) and 100% of animal products came from thestudy area (FavgANI=1)
- 50% of livestock's diet came from the cell, the other 50% from thestudy area.
We named this scenario “Partial Home-grown Italian Diet” (PHItD)and used it as our reference exposure scenario.
In order to test the sensitivity of model results to alternative assump-tions of food origin and diet type, we also computed health risk for thefollowing exposure scenarios (ESM, Table C.2):
- “Full HomegrownNorth AmericanDiet” (FHNAD): EPA (2005a) stan-dard North American diet, with the dietary consumption for “rural”cells exclusively supported by food produced in the same cell of res-idence and no consumption of contaminated animal products in“urban” cells;
- “Full Homegrown Italian Diet” (FHItD): as above but with the Italiandiet;
- “Full Mixed Italian Diet” (FMItD): Italian diet under the extreme as-sumption that the dietary consumption is entirely supported by aperfect mix of food produced within the overall study area. Underthis assumption, the same food contamination level applies to allthe cells of the study area
3.6. Sensitivity analysis through Monte Carlo simulations
The results of a health risk assessment depend upon a large numberof assumptions on processes and model parameterization. Therefore,we carried out a Monte Carlo analysis to assess what model parametershealth risk is most sensitive to (Hwong-Wen, 2002; Lonati and Zanoni,2012; Schuhmacher et al., 2001).
We implemented the “Tier 2”methodology presented in EPA (2001)as follows: first, for eachmodel parameter we defined an uninformativeuniform probability distribution over a range of ±50% the mean valuereported in ESM Table A.6. We then drew a parameter value fromeach respective probability distribution and estimated the correspond-ing health risk in each of the 67×80 cells in which the study area was
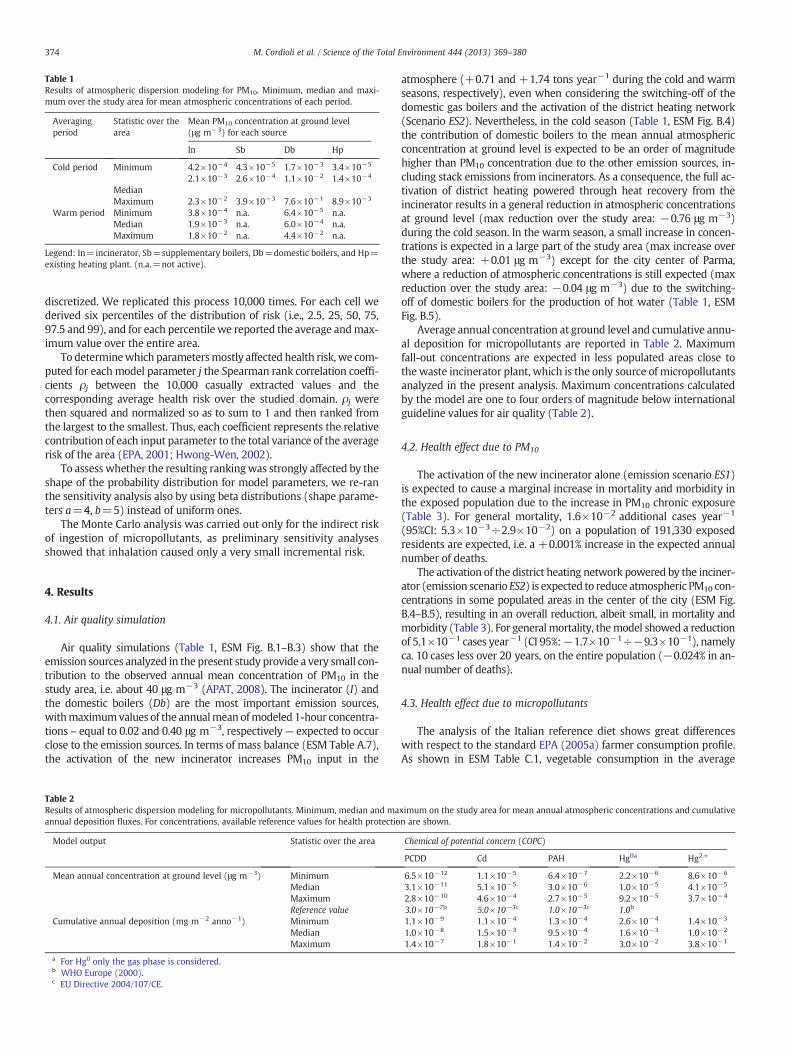
Table 1Results of atmospheric dispersion modeling for PM10. Minimum, median and maxi-mum over the study area for mean atmospheric concentrations of each period.
Averagingperiod
Statistic over thearea
Mean PM10 concentration at ground level(μg m−3) for each source
In Sb Db Hp
Cold period Minimum 4.2×10⁻⁴ 4.3×10⁻⁵ 1.7×10⁻³ 3.4×10⁻⁵
Median2.1×10−3 2.6×10⁻⁴ 1.1×10⁻² 1.4×10⁻⁴
Maximum 2.3×10⁻² 3.9×10⁻³ 7.6×10⁻¹ 8.9×10⁻³
Warm period Minimum 3.8×10⁻⁴ n.a. 6.4×10⁻⁵ n.a.Median 1.9×10⁻³ n.a. 6.0×10⁻⁴ n.a.Maximum 1.8×10⁻² n.a. 4.4×10⁻² n.a.
Legend: In=incinerator, Sb=supplementary boilers, Db=domestic boilers, and Hp=existing heating plant. (n.a.=not active).
374 M. Cordioli et al. / Science of the Total Environment 444 (2013) 369–380
discretized. We replicated this process 10,000 times. For each cell wederived six percentiles of the distribution of risk (i.e., 2.5, 25, 50, 75,97.5 and 99), and for each percentile we reported the average andmax-imum value over the entire area.
To determinewhich parametersmostly affected health risk, we com-puted for eachmodel parameter j the Spearman rank correlation coeffi-cients ρj between the 10,000 casually extracted values and thecorresponding average health risk over the studied domain. ρj werethen squared and normalized so as to sum to 1 and then ranked fromthe largest to the smallest. Thus, each coefficient represents the relativecontribution of each input parameter to the total variance of the averagerisk of the area (EPA, 2001; Hwong-Wen, 2002).
To assess whether the resulting rankingwas strongly affected by theshape of the probability distribution for model parameters, we re-ranthe sensitivity analysis also by using beta distributions (shape parame-ters a=4, b=5) instead of uniform ones.
The Monte Carlo analysis was carried out only for the indirect riskof ingestion of micropollutants, as preliminary sensitivity analysesshowed that inhalation caused only a very small incremental risk.
4. Results
4.1. Air quality simulation
Air quality simulations (Table 1, ESM Fig. B.1–B.3) show that theemission sources analyzed in the present study provide a very small con-tribution to the observed annual mean concentration of PM10 in thestudy area, i.e. about 40 μg m−3 (APAT, 2008). The incinerator (I) andthe domestic boilers (Db) are the most important emission sources,withmaximumvalues of the annualmean ofmodeled 1-hour concentra-tions – equal to 0.02 and 0.40 μg m−3, respectively— expected to occurclose to the emission sources. In terms of mass balance (ESM Table A.7),the activation of the new incinerator increases PM10 input in the
Table 2Results of atmospheric dispersion modeling for micropollutants. Minimum, median and maannual deposition fluxes. For concentrations, available reference values for health protectio
Model output Statistic over the area
Mean annual concentration at ground level (μg m−3) MinimumMedianMaximumReference value
Cumulative annual deposition (mg m−2 anno−1) MinimumMedianMaximum
a For Hg0 only the gas phase is considered.b WHO Europe (2000).c EU Directive 2004/107/CE.
atmosphere (+0.71 and +1.74 tons year−1 during the cold and warmseasons, respectively), even when considering the switching-off of thedomestic gas boilers and the activation of the district heating network(Scenario ES2). Nevertheless, in the cold season (Table 1, ESM Fig. B.4)the contribution of domestic boilers to the mean annual atmosphericconcentration at ground level is expected to be an order of magnitudehigher than PM10 concentration due to the other emission sources, in-cluding stack emissions from incinerators. As a consequence, the full ac-tivation of district heating powered through heat recovery from theincinerator results in a general reduction in atmospheric concentrationsat ground level (max reduction over the study area: −0.76 μg m−3)during the cold season. In the warm season, a small increase in concen-trations is expected in a large part of the study area (max increase overthe study area: +0.01 μg m−3) except for the city center of Parma,where a reduction of atmospheric concentrations is still expected (maxreduction over the study area: −0.04 μg m−3) due to the switching-off of domestic boilers for the production of hot water (Table 1, ESMFig. B.5).
Average annual concentration at ground level and cumulative annu-al deposition for micropollutants are reported in Table 2. Maximumfall-out concentrations are expected in less populated areas close tothe waste incinerator plant, which is the only source of micropollutantsanalyzed in the present analysis. Maximum concentrations calculatedby the model are one to four orders of magnitude below internationalguideline values for air quality (Table 2).
4.2. Health effect due to PM10
The activation of the new incinerator alone (emission scenario ES1)is expected to cause a marginal increase in mortality and morbidity inthe exposed population due to the increase in PM10 chronic exposure(Table 3). For general mortality, 1.6×10⁻² additional cases year−1
(95%CI: 5.3×10⁻³÷2.9×10⁻²) on a population of 191,330 exposedresidents are expected, i.e. a +0.001% increase in the expected annualnumber of deaths.
The activation of the district heating network powered by the inciner-ator (emission scenario ES2) is expected to reduce atmospheric PM10 con-centrations in some populated areas in the center of the city (ESM Fig.B.4–B.5), resulting in an overall reduction, albeit small, in mortality andmorbidity (Table 3). For generalmortality, themodel showed a reductionof 5.1×10⁻¹ cases year−1 (CI 95%:−1.7×10⁻¹÷−9.3×10⁻¹), namelyca. 10 cases less over 20 years, on the entire population (−0.024% in an-nual number of deaths).
4.3. Health effect due to micropollutants
The analysis of the Italian reference diet shows great differenceswith respect to the standard EPA (2005a) farmer consumption profile.As shown in ESM Table C.1, vegetable consumption in the average
ximum on the study area for mean annual atmospheric concentrations and cumulativen are shown.
Chemical of potential concern (COPC)
PCDD Cd PAH Hg0a Hg2+
6.5×10⁻¹² 1.1×10⁻⁵ 6.4×10⁻⁷ 2.2×10⁻⁶ 8.6×10⁻⁶
3.1×10⁻¹¹ 5.1×10⁻⁵ 3.0×10⁻⁶ 1.0×10⁻⁵ 4.1×10⁻⁵
2.8×10⁻¹⁰ 4.6×10⁻⁴ 2.7×10⁻⁵ 9.2×10⁻⁵ 3.7×10⁻⁴
3.0×10⁻⁷b 5.0×10⁻³c 1.0×10⁻³c 1.0b
1.1×10⁻⁹ 1.1×10⁻⁴ 1.3×10⁻⁴ 2.6×10⁻⁴ 1.4×10⁻³
1.0×10⁻⁸ 1.5×10⁻³ 9.5×10⁻⁴ 1.6×10⁻³ 1.0×10⁻²
1.4×10⁻⁷ 1.8×10⁻¹ 1.4×10⁻² 3.0×10⁻² 3.8×10⁻¹
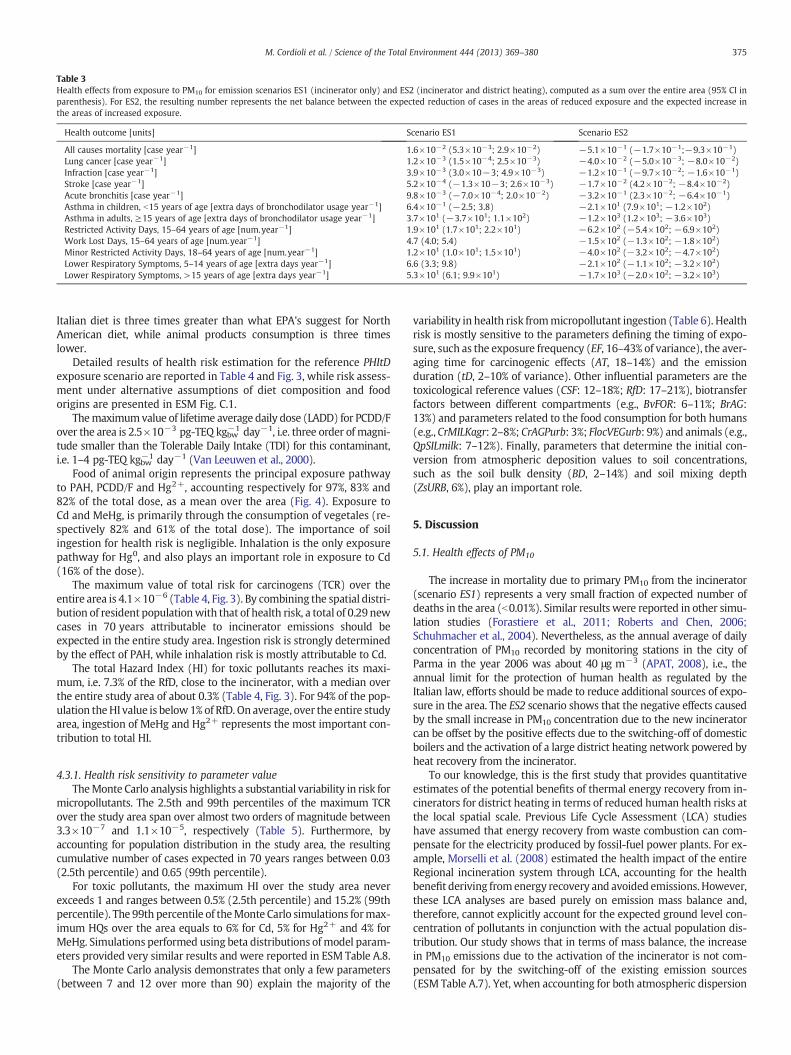
Table 3Health effects from exposure to PM10 for emission scenarios ES1 (incinerator only) and ES2 (incinerator and district heating), computed as a sum over the entire area (95% CI inparenthesis). For ES2, the resulting number represents the net balance between the expected reduction of cases in the areas of reduced exposure and the expected increase inthe areas of increased exposure.
Health outcome [units] Scenario ES1 Scenario ES2
All causes mortality [case year−1] 1.6×10⁻² (5.3×10⁻³; 2.9×10⁻²) −5.1×10⁻¹ (−1.7×10⁻¹;−9.3×10⁻¹)Lung cancer [case year−1] 1.2×10⁻³ (1.5×10⁻⁴; 2.5×10⁻³) −4.0×10⁻² (−5.0×10⁻³; −8.0×10⁻²)Infraction [case year−1] 3.9×10⁻³ (3.0×10⁻³; 4.9×10⁻³) −1.2×10⁻¹ (−9.7×10⁻²; −1.6×10⁻¹)Stroke [case year−1] 5.2×10⁻⁴ (−1.3×10⁻³; 2.6×10⁻³) −1.7×10⁻² (4.2×10⁻²; −8.4×10⁻²)Acute bronchitis [case year−1] 9.8×10⁻³ (−7.0×10⁻⁴; 2.0×10⁻²) −3.2×10⁻¹ (2.3×10⁻²; −6.4×10⁻¹)Asthma in children, b15 years of age [extra days of bronchodilator usage year−1] 6.4×10⁻¹ (−2.5; 3.8) −2.1×101 (7.9×101; −1.2×10²)Asthma in adults, ≥15 years of age [extra days of bronchodilator usage year−1] 3.7×101 (−3.7×101; 1.1×10²) −1.2×10³ (1.2×10³; −3.6×10³)Restricted Activity Days, 15–64 years of age [num.year−1] 1.9×101 (1.7×101; 2.2×101) −6.2×10² (−5.4×10²; −6.9×10²)Work Lost Days, 15–64 years of age [num.year−1] 4.7 (4.0; 5.4) −1.5×10² (−1.3×10²; −1.8×10²)Minor Restricted Activity Days, 18–64 years of age [num.year−1] 1.2×101 (1.0×101; 1.5×101) −4.0×10² (−3.2×10²; −4.7×10²)Lower Respiratory Symptoms, 5–14 years of age [extra days year−1] 6.6 (3.3; 9.8) −2.1×10² (−1.1×10²; −3.2×10²)Lower Respiratory Symptoms, >15 years of age [extra days year−1] 5.3×101 (6.1; 9.9×101) −1.7×10³ (−2.0×10²; −3.2×10³)
375M. Cordioli et al. / Science of the Total Environment 444 (2013) 369–380
Italian diet is three times greater than what EPA's suggest for NorthAmerican diet, while animal products consumption is three timeslower.
Detailed results of health risk estimation for the reference PHItDexposure scenario are reported in Table 4 and Fig. 3, while risk assess-ment under alternative assumptions of diet composition and foodorigins are presented in ESM Fig. C.1.
Themaximumvalue of lifetime average daily dose (LADD) for PCDD/Fover the area is 2.5×10⁻³ pg-TEQ kgbw−1 day−1, i.e. three order of magni-tude smaller than the Tolerable Daily Intake (TDI) for this contaminant,i.e. 1–4 pg-TEQ kgbw−1 day−1 (Van Leeuwen et al., 2000).
Food of animal origin represents the principal exposure pathwayto PAH, PCDD/F and Hg2+, accounting respectively for 97%, 83% and82% of the total dose, as a mean over the area (Fig. 4). Exposure toCd and MeHg, is primarily through the consumption of vegetales (re-spectively 82% and 61% of the total dose). The importance of soilingestion for health risk is negligible. Inhalation is the only exposurepathway for Hg0, and also plays an important role in exposure to Cd(16% of the dose).
The maximum value of total risk for carcinogens (TCR) over theentire area is 4.1×10⁻⁶ (Table 4, Fig. 3). By combining the spatial distri-bution of resident populationwith that of health risk, a total of 0.29 newcases in 70 years attributable to incinerator emissions should beexpected in the entire study area. Ingestion risk is strongly determinedby the effect of PAH, while inhalation risk is mostly attributable to Cd.
The total Hazard Index (HI) for toxic pollutants reaches its maxi-mum, i.e. 7.3% of the RfD, close to the incinerator, with a median overthe entire study area of about 0.3% (Table 4, Fig. 3). For 94% of the pop-ulation theHI value is below1% of RfD. On average, over the entire studyarea, ingestion of MeHg and Hg2+ represents the most important con-tribution to total HI.
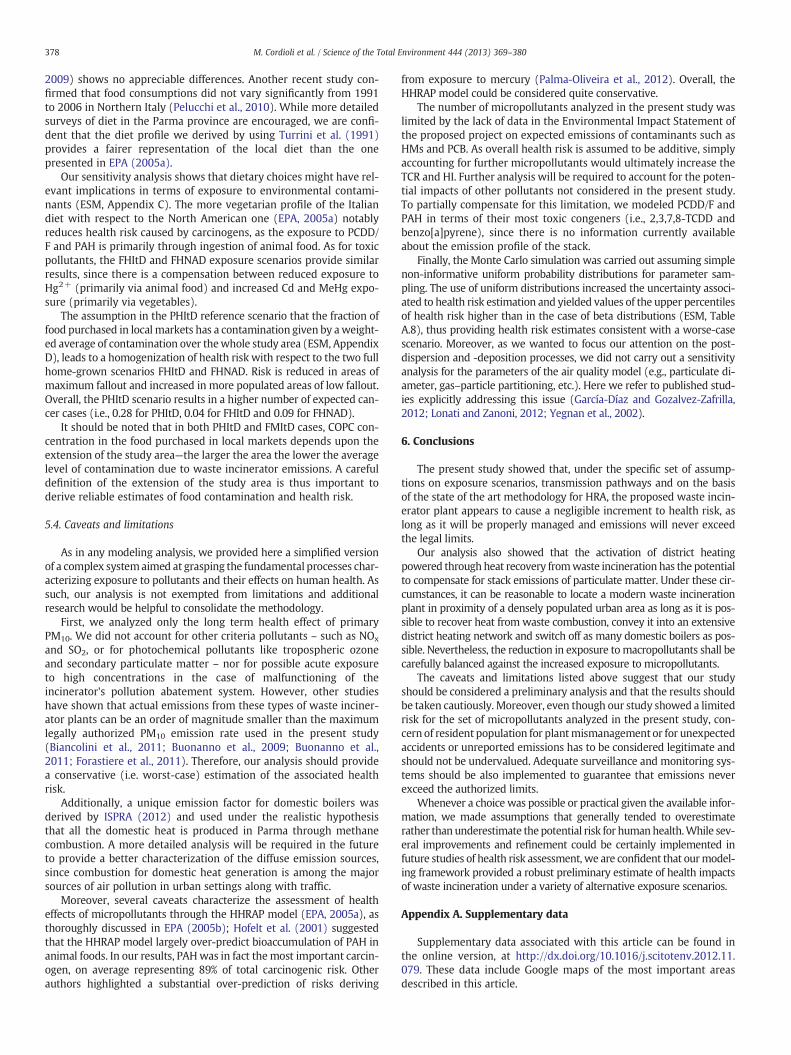
4.3.1. Health risk sensitivity to parameter valueTheMonte Carlo analysis highlights a substantial variability in risk for
micropollutants. The 2.5th and 99th percentiles of the maximum TCRover the study area span over almost two orders of magnitude between3.3×10−7 and 1.1×10⁻⁵, respectively (Table 5). Furthermore, byaccounting for population distribution in the study area, the resultingcumulative number of cases expected in 70 years ranges between 0.03(2.5th percentile) and 0.65 (99th percentile).
For toxic pollutants, the maximum HI over the study area neverexceeds 1 and ranges between 0.5% (2.5th percentile) and 15.2% (99thpercentile). The 99th percentile of theMonte Carlo simulations formax-imum HQs over the area equals to 6% for Cd, 5% for Hg2+ and 4% forMeHg. Simulations performed using beta distributions of model param-eters provided very similar results and were reported in ESM Table A.8.
The Monte Carlo analysis demonstrates that only a few parameters(between 7 and 12 over more than 90) explain the majority of the
variability in health risk frommicropollutant ingestion (Table 6). Healthrisk is mostly sensitive to the parameters defining the timing of expo-sure, such as the exposure frequency (EF, 16–43% of variance), the aver-aging time for carcinogenic effects (AT, 18–14%) and the emissionduration (tD, 2–10% of variance). Other influential parameters are thetoxicological reference values (CSF: 12–18%; RfD: 17–21%), biotransferfactors between different compartments (e.g., BvFOR: 6–11%; BrAG:13%) and parameters related to the food consumption for both humans(e.g., CrMILKagr: 2–8%; CrAGPurb: 3%; FlocVEGurb: 9%) and animals (e.g.,QpSILmilk: 7–12%). Finally, parameters that determine the initial con-version from atmospheric deposition values to soil concentrations,such as the soil bulk density (BD, 2–14%) and soil mixing depth(ZsURB, 6%), play an important role.
5. Discussion
5.1. Health effects of PM10
The increase in mortality due to primary PM10 from the incinerator(scenario ES1) represents a very small fraction of expected number ofdeaths in the area (b0.01%). Similar results were reported in other simu-lation studies (Forastiere et al., 2011; Roberts and Chen, 2006;Schuhmacher et al., 2004). Nevertheless, as the annual average of dailyconcentration of PM10 recorded by monitoring stations in the city ofParma in the year 2006 was about 40 μg m−3 (APAT, 2008), i.e., theannual limit for the protection of human health as regulated by theItalian law, efforts should be made to reduce additional sources of expo-sure in the area. The ES2 scenario shows that the negative effects causedby the small increase in PM10 concentration due to the new incineratorcan be offset by the positive effects due to the switching-off of domesticboilers and the activation of a large district heating network powered byheat recovery from the incinerator.
To our knowledge, this is the first study that provides quantitativeestimates of the potential benefits of thermal energy recovery from in-cinerators for district heating in terms of reduced human health risks atthe local spatial scale. Previous Life Cycle Assessment (LCA) studieshave assumed that energy recovery from waste combustion can com-pensate for the electricity produced by fossil-fuel power plants. For ex-ample, Morselli et al. (2008) estimated the health impact of the entireRegional incineration system through LCA, accounting for the healthbenefit deriving fromenergy recovery and avoided emissions. However,these LCA analyses are based purely on emission mass balance and,therefore, cannot explicitly account for the expected ground level con-centration of pollutants in conjunction with the actual population dis-tribution. Our study shows that in terms of mass balance, the increasein PM10 emissions due to the activation of the incinerator is not com-pensated for by the switching-off of the existing emission sources(ESM Table A.7). Yet, when accounting for both atmospheric dispersion
Table 4Doses and health risks for micropollutants under the Partial Home-grown Italian Diet (PHItD) scenario. Median and (maximum) on the study area are shown. Number of cases iscomputed only for carcinogens, as a sum over the entire area.
COPC Dose (mg kg−1 day−1) Risk for carcinogens (adimensional) Hazard Quotient for toxics (adimensional)
Ingestion Inhalation Ingestion Inhalation Numberof cases
Ingestion Inhalation
PCDD 9.4×10⁻¹³ (2.5×10⁻¹²) 4.8×10⁻¹⁵ (4.3×10⁻¹⁴) 7.7×10⁻⁸ (2.1×10⁻⁷) 5.5×10⁻¹⁰ (5.0×10⁻⁹) 1.6×10⁻²
PAH 3.5×10⁻⁷ (8.5×10⁻⁷) 4.7×10⁻¹⁰ (4.2×10⁻⁹) 1.4×10⁻⁶ (3.4×10⁻⁶) 1.8×10⁻⁹ (1.6×10⁻⁸) 2.7×10⁻¹
Cd 7.7×10⁻⁸ (1.3×10⁻⁵) 8.0×10⁻⁹ (7.2×10⁻⁸) 5.0×10⁻⁸ (4.5×10⁻⁷) 1.2×10⁻² 7.4×10⁻⁵ (1.2×10⁻²)Hg0 1.6×10⁻⁹ (1.4×10⁻⁸) 3.3×10⁻⁵ (2.9×10⁻⁴)Hg2+ 4.9×10⁻⁷ (3.7×10⁻⁶) 6.3×10⁻⁹ (5.7×10⁻⁸) 1.6×10⁻³ (1.2×10⁻²) 3.5×10⁻⁵ (3.2×10⁻⁴)MeHg 1.3×10⁻⁷ (5.4×10⁻⁶) 1.3×10⁻³ (5.2×10⁻²)Total 1.5×10⁻⁶ (3.6×10⁻⁶) 5.3×10⁻⁸ (4.7×10⁻⁷) 2.9×10⁻¹ 3.0×10⁻³ (7.3×10⁻²) 6.8×10⁻⁵ (6.1×10⁻⁴)
376 M. Cordioli et al. / Science of the Total Environment 444 (2013) 369–380
and population distribution, the increase in ground level concentrationsof PM10 due to waste incineration is more than compensated by the re-duction in PM10 concentration as a result of switching-off of domesticboilers achievable through district heating. Therefore, heat recoveryfor district heating is a key factor to effectively curb the environmentalburden of a new waste incineration facility. Accordingly, efforts shouldbe made to recover as much energy as possible, extend the districtheating network so as to switch-off the largest number of domesticand non-domestic boilers. Additional benefits in terms of electricityconsumptions could be obtained by using the district heating networkalso for air conditioning during the hot season.
5.2. Health effects of micropollutants
According to air quality simulations, the expected contribution of theMSW plant to long-term atmospheric concentrations of micropollutants
Fig. 3. Spatial distribution of Total Risk for Carcinogens (
at ground level is almost negligible when compared to internationallimits or guidelines (Table 2). Health risks computed through the useof the HHRAPmodel (EPA, 2005a) are alsomoderate (Table 4). Themax-imum value for TCR estimated in the area (i.e., 4.1×10⁻⁶) is within theacceptable risk range (i.e., 10−6 to 10−5) recommended by EPA (1998)for exposure to emissions from a single facility. Furthermore, whenaccounting for population distribution, less than 1 new mortality casedue to waste incineration is expected over a lifetime. The maximumvalue for the total HI for toxics (i.e., 7.3% of the RfD) is smaller than thereference value of 25% recommended by EPA (1998) to account alsofor potential background exposures. These results derive from a set ofconservative (i.e. protective) assumptions. For example, we assumedthat the food consumed by residents, either purchased in the marketsor home-grown, was in some way all contaminated.
The 99-th percentiles derived from the Monte Carlo simulation(Table 5) for (i) maximum TCR (i.e., 1.1×10⁻⁵), (ii) number of lifetime
sx) and total Hazard Index (dx) over the study area.
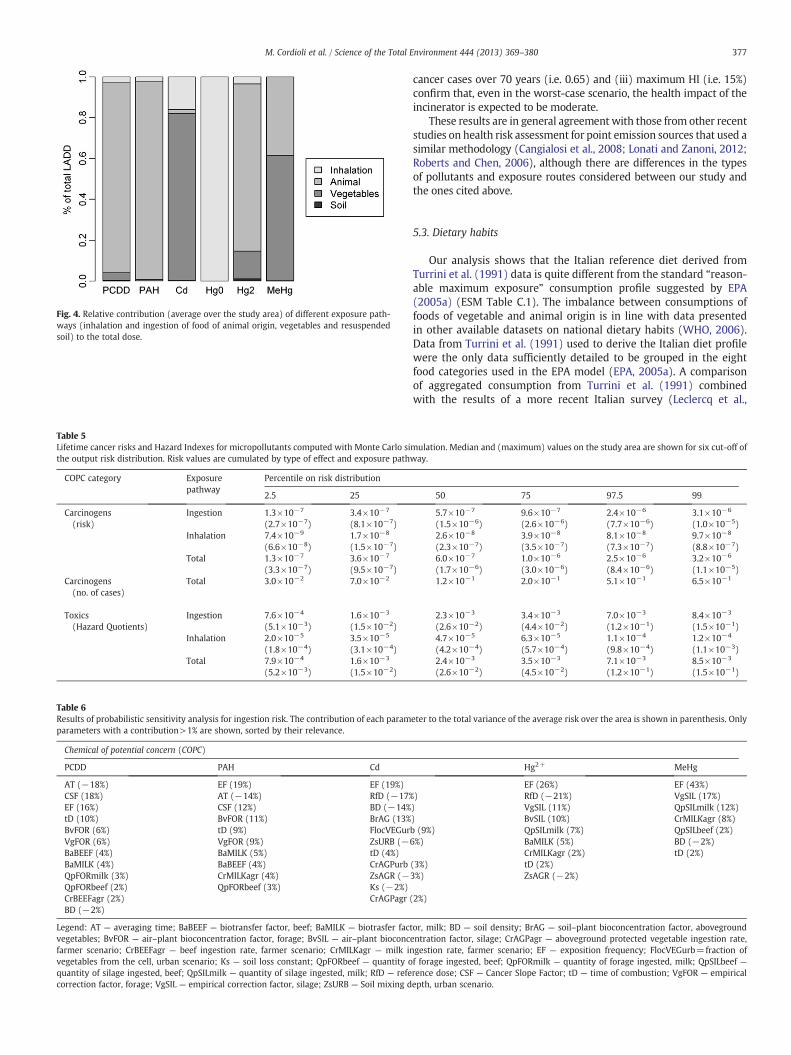
Fig. 4. Relative contribution (average over the study area) of different exposure path-ways (inhalation and ingestion of food of animal origin, vegetables and resuspendedsoil) to the total dose.
Table 5Lifetime cancer risks and Hazard Indexes for micropollutants computed with Monte Carlo sithe output risk distribution. Risk values are cumulated by type of effect and exposure path
COPC category Exposurepathway
Percentile on risk distribution
2.5 25
Carcinogens(risk)
Ingestion 1.3×10⁻⁷
(2.7×10⁻⁷)3.4×10⁻⁷
(8.1×10⁻⁷)Inhalation 7.4×10⁻⁹
(6.6×10⁻⁸)1.7×10⁻⁸
(1.5×10⁻⁷)Total 1.3×10⁻⁷
(3.3×10⁻⁷)3.6×10⁻⁷
(9.5×10⁻⁷)Carcinogens(no. of cases)
Total 3.0×10⁻² 7.0×10⁻²
Toxics(Hazard Quotients)
Ingestion 7.6×10⁻⁴
(5.1×10⁻³)1.6×10⁻³
(1.5×10⁻²)Inhalation 2.0×10⁻⁵
(1.8×10⁻⁴)3.5×10⁻⁵
(3.1×10⁻⁴)Total 7.9×10⁻⁴
(5.2×10⁻³)1.6×10⁻³
(1.5×10⁻²)
Table 6Results of probabilistic sensitivity analysis for ingestion risk. The contribution of each paramparameters with a contribution>1% are shown, sorted by their relevance.
Chemical of potential concern (COPC)
PCDD PAH Cd
AT (−18%) EF (19%) EF (19%)CSF (18%) AT (−14%) RfD (−17%EF (16%) CSF (12%) BD (−14%tD (10%) BvFOR (11%) BrAG (13%BvFOR (6%) tD (9%) FlocVEGurVgFOR (6%) VgFOR (9%) ZsURB (−BaBEEF (4%) BaMILK (5%) tD (4%)BaMILK (4%) BaBEEF (4%) CrAGPurbQpFORmilk (3%) CrMILKagr (4%) ZsAGR (−QpFORbeef (2%) QpFORbeef (3%) Ks (−2%)CrBEEFagr (2%) CrAGPagr (BD (−2%)
Legend: AT — averaging time; BaBEEF — biotransfer factor, beef; BaMILK — biotrasfer factvegetables; BvFOR — air–plant bioconcentration factor, forage; BvSIL — air–plant bioconcfarmer scenario; CrBEEFagr — beef ingestion rate, farmer scenario; CrMILKagr — milk invegetables from the cell, urban scenario; Ks — soil loss constant; QpFORbeef — quantity oquantity of silage ingested, beef; QpSILmilk — quantity of silage ingested, milk; RfD — refecorrection factor, forage; VgSIL — empirical correction factor, silage; ZsURB — Soil mixing d
377M. Cordioli et al. / Science of the Total Environment 444 (2013) 369–380
cancer cases over 70 years (i.e. 0.65) and (iii) maximum HI (i.e. 15%)confirm that, even in the worst-case scenario, the health impact of theincinerator is expected to be moderate.
These results are in general agreement with those from other recentstudies on health risk assessment for point emission sources that used asimilar methodology (Cangialosi et al., 2008; Lonati and Zanoni, 2012;Roberts and Chen, 2006), although there are differences in the typesof pollutants and exposure routes considered between our study andthe ones cited above.
5.3. Dietary habits
Our analysis shows that the Italian reference diet derived fromTurrini et al. (1991) data is quite different from the standard “reason-able maximum exposure” consumption profile suggested by EPA(2005a) (ESM Table C.1). The imbalance between consumptions offoods of vegetable and animal origin is in line with data presentedin other available datasets on national dietary habits (WHO, 2006).Data from Turrini et al. (1991) used to derive the Italian diet profilewere the only data sufficiently detailed to be grouped in the eightfood categories used in the EPA model (EPA, 2005a). A comparisonof aggregated consumption from Turrini et al. (1991) combinedwith the results of a more recent Italian survey (Leclercq et al.,
mulation. Median and (maximum) values on the study area are shown for six cut-off ofway.
50 75 97.5 99
5.7×10⁻⁷
(1.5×10⁻⁶)9.6×10⁻⁷
(2.6×10⁻⁶)2.4×10⁻⁶
(7.7×10⁻⁶)3.1×10⁻⁶
(1.0×10⁻⁵)2.6×10⁻⁸
(2.3×10⁻⁷)3.9×10⁻⁸
(3.5×10⁻⁷)8.1×10⁻⁸
(7.3×10⁻⁷)9.7×10⁻⁸
(8.8×10⁻⁷)6.0×10⁻⁷
(1.7×10⁻⁶)1.0×10⁻⁶
(3.0×10⁻⁶)2.5×10⁻⁶
(8.4×10⁻⁶)3.2×10⁻⁶
(1.1×10⁻⁵)1.2×10⁻¹ 2.0×10⁻¹ 5.1×10⁻¹ 6.5×10⁻¹
2.3×10⁻³
(2.6×10⁻²)3.4×10⁻³
(4.4×10⁻²)7.0×10⁻³
(1.2×10⁻¹)8.4×10⁻³
(1.5×10⁻¹)4.7×10⁻⁵
(4.2×10⁻⁴)6.3×10⁻⁵
(5.7×10⁻⁴)1.1×10⁻⁴
(9.8×10⁻⁴)1.2×10⁻⁴
(1.1×10⁻³)2.4×10⁻³
(2.6×10⁻²)3.5×10⁻³
(4.5×10⁻²)7.1×10⁻³
(1.2×10⁻¹)8.5×10⁻³
(1.5×10⁻¹)
eter to the total variance of the average risk over the area is shown in parenthesis. Only
Hg2+ MeHg
EF (26%) EF (43%)) RfD (−21%) VgSIL (17%)) VgSIL (11%) QpSILmilk (12%)) BvSIL (10%) CrMILKagr (8%)b (9%) QpSILmilk (7%) QpSILbeef (2%)6%) BaMILK (5%) BD (−2%)
CrMILKagr (2%) tD (2%)(3%) tD (2%)3%) ZsAGR (−2%)
2%)
or, milk; BD — soil density; BrAG — soil–plant bioconcentration factor, abovegroundentration factor, silage; CrAGPagr — aboveground protected vegetable ingestion rate,gestion rate, farmer scenario; EF — exposition frequency; FlocVEGurb=fraction off forage ingested, beef; QpFORmilk — quantity of forage ingested, milk; QpSILbeef —rence dose; CSF — Cancer Slope Factor; tD — time of combustion; VgFOR — empiricalepth, urban scenario.
378 M. Cordioli et al. / Science of the Total Environment 444 (2013) 369–380
2009) shows no appreciable differences. Another recent study con-firmed that food consumptions did not vary significantly from 1991to 2006 in Northern Italy (Pelucchi et al., 2010). While more detailedsurveys of diet in the Parma province are encouraged, we are confi-dent that the diet profile we derived by using Turrini et al. (1991)provides a fairer representation of the local diet than the onepresented in EPA (2005a).
Our sensitivity analysis shows that dietary choices might have rel-evant implications in terms of exposure to environmental contami-nants (ESM, Appendix C). The more vegetarian profile of the Italiandiet with respect to the North American one (EPA, 2005a) notablyreduces health risk caused by carcinogens, as the exposure to PCDD/F and PAH is primarily through ingestion of animal food. As for toxicpollutants, the FHItD and FHNAD exposure scenarios provide similarresults, since there is a compensation between reduced exposure toHg2+ (primarily via animal food) and increased Cd and MeHg expo-sure (primarily via vegetables).
The assumption in the PHItD reference scenario that the fraction offood purchased in local markets has a contamination given by aweight-ed average of contamination over thewhole study area (ESM, AppendixD), leads to a homogenization of health risk with respect to the two fullhome-grown scenarios FHItD and FHNAD. Risk is reduced in areas ofmaximum fallout and increased in more populated areas of low fallout.Overall, the PHItD scenario results in a higher number of expected can-cer cases (i.e., 0.28 for PHItD, 0.04 for FHItD and 0.09 for FHNAD).
It should be noted that in both PHItD and FMItD cases, COPC con-centration in the food purchased in local markets depends upon theextension of the study area—the larger the area the lower the averagelevel of contamination due to waste incinerator emissions. A carefuldefinition of the extension of the study area is thus important toderive reliable estimates of food contamination and health risk.
5.4. Caveats and limitations
As in any modeling analysis, we provided here a simplified versionof a complex systemaimed at grasping the fundamental processes char-acterizing exposure to pollutants and their effects on human health. Assuch, our analysis is not exempted from limitations and additionalresearch would be helpful to consolidate the methodology.
First, we analyzed only the long term health effect of primaryPM10. We did not account for other criteria pollutants – such as NOx
and SO2, or for photochemical pollutants like tropospheric ozoneand secondary particulate matter – nor for possible acute exposureto high concentrations in the case of malfunctioning of theincinerator's pollution abatement system. However, other studieshave shown that actual emissions from these types of waste inciner-ator plants can be an order of magnitude smaller than the maximumlegally authorized PM10 emission rate used in the present study(Biancolini et al., 2011; Buonanno et al., 2009; Buonanno et al.,2011; Forastiere et al., 2011). Therefore, our analysis should providea conservative (i.e. worst-case) estimation of the associated healthrisk.
Additionally, a unique emission factor for domestic boilers wasderived by ISPRA (2012) and used under the realistic hypothesisthat all the domestic heat is produced in Parma through methanecombustion. A more detailed analysis will be required in the futureto provide a better characterization of the diffuse emission sources,since combustion for domestic heat generation is among the majorsources of air pollution in urban settings along with traffic.
Moreover, several caveats characterize the assessment of healtheffects of micropollutants through the HHRAP model (EPA, 2005a), asthoroughly discussed in EPA (2005b); Hofelt et al. (2001) suggestedthat the HHRAP model largely over-predict bioaccumulation of PAH inanimal foods. In our results, PAHwas in fact themost important carcin-ogen, on average representing 89% of total carcinogenic risk. Otherauthors highlighted a substantial over-prediction of risks deriving
from exposure to mercury (Palma-Oliveira et al., 2012). Overall, theHHRAP model could be considered quite conservative.
The number of micropollutants analyzed in the present study waslimited by the lack of data in the Environmental Impact Statement ofthe proposed project on expected emissions of contaminants such asHMs and PCB. As overall health risk is assumed to be additive, simplyaccounting for further micropollutants would ultimately increase theTCR and HI. Further analysis will be required to account for the poten-tial impacts of other pollutants not considered in the present study.To partially compensate for this limitation, we modeled PCDD/F andPAH in terms of their most toxic congeners (i.e., 2,3,7,8-TCDD andbenzo[a]pyrene), since there is no information currently availableabout the emission profile of the stack.
Finally, the Monte Carlo simulation was carried out assuming simplenon-informative uniform probability distributions for parameter sam-pling. The use of uniform distributions increased the uncertainty associ-ated to health risk estimation and yielded values of the upper percentilesof health risk higher than in the case of beta distributions (ESM, TableA.8), thus providing health risk estimates consistent with a worse-casescenario. Moreover, as we wanted to focus our attention on the post-dispersion and -deposition processes, we did not carry out a sensitivityanalysis for the parameters of the air quality model (e.g., particulate di-ameter, gas–particle partitioning, etc.). Here we refer to published stud-ies explicitly addressing this issue (García-Díaz and Gozalvez-Zafrilla,2012; Lonati and Zanoni, 2012; Yegnan et al., 2002).
6. Conclusions
The present study showed that, under the specific set of assump-tions on exposure scenarios, transmission pathways and on the basisof the state of the art methodology for HRA, the proposed waste incin-erator plant appears to cause a negligible increment to health risk, aslong as it will be properly managed and emissions will never exceedthe legal limits.
Our analysis also showed that the activation of district heatingpowered through heat recovery fromwaste incineration has the potentialto compensate for stack emissions of particulate matter. Under these cir-cumstances, it can be reasonable to locate a modern waste incinerationplant in proximity of a densely populated urban area as long as it is pos-sible to recover heat from waste combustion, convey it into an extensivedistrict heating network and switch off as many domestic boilers as pos-sible. Nevertheless, the reduction in exposure tomacropollutants shall becarefully balanced against the increased exposure to micropollutants.
The caveats and limitations listed above suggest that our studyshould be considered a preliminary analysis and that the results shouldbe taken cautiously. Moreover, even though our study showed a limitedrisk for the set of micropollutants analyzed in the present study, con-cern of resident population for plantmismanagement or for unexpectedaccidents or unreported emissions has to be considered legitimate andshould not be undervalued. Adequate surveillance and monitoring sys-tems should be also implemented to guarantee that emissions neverexceed the authorized limits.
Whenever a choice was possible or practical given the available infor-mation, we made assumptions that generally tended to overestimaterather than underestimate the potential risk for humanhealth.While sev-eral improvements and refinement could be certainly implemented infuture studies of health risk assessment, we are confident that ourmodel-ing framework provided a robust preliminary estimate of health impactsof waste incineration under a variety of alternative exposure scenarios.
Appendix A. Supplementary data
Supplementary data associated with this article can be found inthe online version, at http://dx.doi.org/10.1016/j.scitotenv.2012.11.079. These data include Google maps of the most important areasdescribed in this article.
379M. Cordioli et al. / Science of the Total Environment 444 (2013) 369–380
References
Abrahams PW. Soils: their implications to human health. Sci Total Environ 2002;291:1-32.APAT, Agenzia per la Protezione dell'Ambiente e i servizi Tecnici. Annuario dei dati
ambientali 2007 [Internet]; 2008 [Available at: http://annuario.isprambiente.it/(last accessed: June 2012). Italian].
ASR-ER, Azienda Sanitaria Regionale dell'Emilia Romagna. Atlante della mortalità in EmiliaRomagna 1998–2004. Bologna: Regione Emilia Romagna; 2007 [Available at:http://asr.regione.emilia-romagna.it/wcm/asr/collana_dossier/dossier156.htm (last accessed:June 2012). Italian].
Biancolini V, Canè M, Fornaciari S, Forti S. Le emissioni degli inceneritori di ultimagenerazione. Quaderni di MONITER. Bologna: Regione Emilia Romagna; 2011 [Italian].
Buonanno G, Ficco G, Stabile L. Size distribution and number concentration of particlesat the stack of a municipal waste incinerator. Waste Manag 2009;29:749–55.
Buonanno G, Stabile L, Avino P, Belluso E. Chemical, dimensional and morphologicalultrafine particle characterization from a waste-to-energy plant. Waste Manag2011;31:2253–62.
Cangialosi F, Intini G, Liberti L, Notarnicola M, Stellacci P. Health risk assessment of airemissions from a municipal solid waste incineration plant — a case study. WasteManag 2008;28:885–95.
Cirillo MC, Manzi D. PC DIMULA 2.0: an atmospheric multisource dispersion model ofair pollutants on local scale. Environ Softw 1991;6:43–8.
Cordier S, Lehébel A, Amar E, Anzivino-Viricel L, Hours M, Monfort C, et al. Maternalresidence near municipal waste incinerators and the risk of urinary tract birth de-fects. Occup Environ Med 2010;67:493–9.
Da Silva R, Bach-Faig A, Quintana BR, Buckland G, de Almeida MD Vaz, Serra-Majem L.Worldwide variation of adherence to the Mediterranean diet, in 1961–1965 and2000–2003. Public Health Nutr 2009;12:1676–884.
ENEA, Ente Nazionale Energia e Ambiente. Rapporto Energia e Ambiente 2005 —
L'analisi [Internet]; 2005 [Available at: www.enea.it/it/produzione-scientifica(last accessed: June 2012). Italian].
EPA, United States Environmental Protection Agency. Exposure factors handbook (finalreport). Washington DC: U.S.: Environmental Protection Agency; 1997
EPA, United States Environmental Protection Agency. Region 6 risk management ad-dendum — draft human health risk assessment protocol for hazardous waste com-bustion facilities. Report No.:EPA-R6-98-002. Washington DC: Region 6Multimedia Planning and Permitting Division; 1998.
EPA, United States Environmental Protection Agency. Risk assessment guidance forsuperfund: volume III — part A. Process for conducting probabilistic risk assess-ment. Report no.:EPA 540-R-02-002. Washington DC: EPA Office of Emergencyand Remedial Response; 2001.
EPA, United States Environmental Protection Agency. Human health risk assessmentprotocol for hazardous waste combustion facilities. Report no.:EPA530-R-05-006.Washington DC: EPA Office of Solid Waste; 2005.
EPA United States Environmental Protection Agency. U.S. EPA response to commentson the human health risk assessment protocol for hazardous waste combustion fa-cilities. Report No.:EPA530-R-05-020. Washington DC: EPA Solid Waste and Emer-gency Response; 2005.
EPA United States Environmental Protection Agency. Integrated Risk Information Sys-tem [Internet]; 2008 [Available at: http://www.epa.gov/IRIS/. (last accessed:November 2008)].
Forastiere F, Badaloni C, de Hoogh K, von Kraus MK, Martuzzi M, Mitis F, et al. Healthimpact assessment of waste management facilities in three European countries.Environ Health 2011;10:53.
Franchini M, Rial M, Buiatti E, Bianchi F. Health effects of exposure to waste incineratoremissions: a review of epidemiological studies. Ann Ist Super Sanita 2004;40:101–15.
Fries GF. A review of the significance of animal food products as potential exposures todioxins pathways of human. J Anim Sci 1995;73:1639–50.
Fryer M, Collins CD, Ferrier H, Colvile RN, Nieuwenhuijsen MJ. Human exposure model-ling for chemical risk assessment: a review of current approaches and research andpolicy implications. Environ Sci Pol 2006;9:261–74.
García-Díaz JC, Gozalvez-Zafrilla JM. Uncertainty and sensitive analysis of environmentalmodel for risk assessments: an industrial case study. Reliab Eng Syst Saf 2012;107:16–22.
Hofelt C, Honeycutt M, McCoy J, Haws L. Development of a metabolism factor for poly-cyclic aromatic hydrocarbons for use in multipathway risk assessments of hazard-ous waste combustion facilities. Regul Toxicol Pharmacol 2001;33:60–5.
Hwong-Wen M. Using stochastic risk assessment in setting information priorities for man-aging dioxin impact from a municipal waste incinerator. Chemosphere 2002;48:1035–40.
INRAN Istituto Nazionale per la Ricerca sugli Alimenti e la Nutrizione. Tabelle dicomposizione degli alimenti [Internet]; 2012 [Available at: http://www.inran.it/646/tabelle_di_composizione_degli_alimenti.html (last accessed: June 2012). Italian].
ISPRA, Istituto Superiore per la Protezione e la Ricerca Ambientale. Manuale dei fattoridi emissione [Internet]; 2012 [Available at: www.sinanet.isprambiente.it/it/inventaria/disaggregazione-2000/db/ (last accessed: June 2012). Italian].
Kim Y-M, Kim J-W, Lee H-J. Burden of disease attributable to air pollutants frommunic-ipal solid waste incinerators in Seoul, Korea: a source-specific approach for envi-ronmental burden of disease. Sci Total Environ 2011;409:2019–28.
Kunzli N, Kaiser R, Medina S, Studnicka M, Chanel O, Filliger P, et al. Public-health impact ofoutdoor and traffic-related air pollution: a European assessment. Lancet 2000;356:795–801.
Leclercq C, Arcella D, Piccinelli R, Sette S, Le Donne C, Turrini A. The Italian NationalFood Consumption Survey INRAN-SCAI 2005–06: main results in terms of foodconsumption. Public Health Nutr 2009;12:2504–32.
Linares V, Perello G, Nadal M, Gomez-Catalan J, Llobet JM, Domingo JL. Environmentalversus dietary exposure to POPs and metals: a probabilistic assessment of humanhealth risks. J Environ Monit 2010;12:681–8.
Lippmann M. Environmental toxicants: human exposures and their health effects.Third edition. Hoboken, New Jersey: John Wiley and Sons; 2009.
Llobet JM, Domingo JL, Bocio A, Casas C, Lutz M, Teixid A. Human exposure to dioxinsthrough the diet in Catalonia, Spain: carcinogenic and non-carcinogenic risk.Chemosphere 2003;50:1193–200.
Lonati G, Zanoni F. Probabilistic health risk assessment of carcinogenic emissions froma MSW gasification plant. Environ Int 2012;44:80–91.
MAIND S.r.l.. WinDimula 3.0: descrizione delle equazioni utilizzate dal modello WD3 [In-ternet]; 2006 [Available at: http://www.maind.it/document/windimula_equazioni.pdf. (last accessed: November 2008)].
Martuzzi M, Mitis F, Iavarone I, Serinelli M. Health impact of PM10 and Ozone in 13 Italiancities. Copenhagen: WHO Regional Office for Europe; 2006 [Available at: http://www.euro.who.int/en/what-we-publish/full-list-of-books (last accessed: June 2012)].
Medina S, Boldo E, Saklad M, Niciu EM, Krzyzanowski M, Frank F, et al. Health Impact As-sessment of Air Pollution and Communication Strategy (APHEIS): third year report[Internet]; 2005 [Available at: http://www.apheis.net/pages/communications.htm(last accessed: June 2012)].
Morra P, Bagli S, Spadoni G. The analysis of human health risk with a detailed proce-dure operating in a GIS environment. Environ Int 2006;32:444–54.
Morra P, Lisi R, Spadoni G, Maschio G. The assessment of human health impact causedby industrial and civil activities in the Pace Valley of Messina. Sci Total Environ2009;407:3712–20.
Morselli L, Robertis CD, Luzi J, Passarini F, Vassura I. Environmental impacts of wasteincineration in a regional system (Emilia Romagna, Italy) evaluated from a lifecycle perspective. J Hazard Mater 2008;159:505–11.
NAS, National Academy of Science. Risk assessment in the federal government: manag-ing the process. Washington D.C.: National Academy Press; 1983
Oak Ridge National Laboratory. Risk Assessment Information Sistem [Internet]; 2008[Available at: http://rais.ornl.gov/ (last accessed: November 2008)].
Palma-Oliveira J, Zemba SG, Ames MR, Green LC, Linkov I. Human and ecological riskassessment: uncertainty in multi-pathway risk assessment for combustion facili-ties. Hum Ecol Risk Assess 2012;18:501–16.
Pelucchi C, Galeone C, Negri E, Vecchia CL. Trends in adherence to the Mediterranean dietin an Italian population between 1991 and 2006. Eur J Clin Nutr 2010;64:1052–6.
Porta D, Milani S, Lazzarino AI, Perucci CA, Forastiere F. Systematic review of epidemi-ological studies on health effects associated with management of solid waste. En-viron Health 2009;8:1-14.
Ranzi A, Fano V, Erspamer L, Lauriola P, Perucci CA, Forastiere F. Mortality and morbid-ity among people living close to incinerators: a cohort study based on dispersionmodeling for exposure assessment. Environ Health 2011;10:22.
RERE, Region Emilia Romagna. Geoportale [Internet]; 2012 [Available at: http://geoportale.emilia-romagna.it (last accessed: June 2012). Italian].
Rezaie B, Rosen MA. District heating and cooling: review of technology and potentialenhancements. Appl Energy 2012;93:2-10.
Roberts RJ, ChenM.Waste incineration— how big is the health risk? A quantitativemeth-od to allow comparison with other health risks. J Public Health 2006;28:261–6.
Rovira J, Mari M, Nadal M, Schuhmacher M, Domingo JL. Partial replacement of fossilfuel in a cement plant: risk assessment for the population living in the neighbor-hood. Sci Total Environ 2010;408:5372–80.
Rovira J, Nadal M, Domingo JL, Tanaku T, Suciu NA, Trevisan M, et al. A revision of cur-rent models for environmental and human health impact and risk assessment forapplication to emerging chemicals. The handbook of environmental chemistry.Berlin Heidelberg: Springer; 2012. p. 1-18.
Schuhmacher M, Meneses M, Xifr A, Domingo L. The use of Monte-Carlo simulationtechniques for risk assessment: study of a municipal waste incinerator. EnvironEng 2001;43:787–99.
Schuhmacher M, Domingo JL, Garreta J. Pollutants emitted by a cement plant: healthrisks for the population living in the neighborhood. Environ Res 2004;95:198–206.
Sweetman AJ, Alcock RE, Wittsiepe J, Jones KC. Human exposure to PCDD/Fs in the UK:the development of a modelling approach to give historical and future perspec-tives. Environ Int 2000;26:37–47.
Torfs R, Hurley F, Miller B, Rabl A. A set of concentration–response functions. Deliver-able 3.7 — RS1b/WP3 of the NEEDS project [Internet]; 2007 [Available at: http://www.needs-project.org (last accessed: June 2012)].
Turrini A, Saba A, Lintas C. Study of the Italian reference diet for monitoring food con-stituents and contaminants. Nutr Res 1991;11:861–73.
Undeman E, Brown T, Wania F, Mclachlan M. Susceptibility of human populations to envi-ronmental exposure to organic contaminants. Environ Sci Technol 2010;44:6249–55.
UK DEFRA, United Kingdom Department for Environment. Food and Rural Affairs; 2004[Available at: http://www.defra.gov.uk/publications/2011/03/26/health-report-pb9052a/ (last accessed: June 2012)].
Van Leeuwen FXR, Feeley M, Schrenk D, Larsen JC, Farland W, Younes M. Dioxins:WHO's tolerable daily intake (TDI) revisited. Chemosphere 2000;40:1095–101.
Viel J, Daniau C, Goria S, Fabre P, De Crouy-Chanel P, Sauleau E, et al. Risk for nonHodgkin's lymphoma in the vicinity of French municipal solid waste incinerators.Environ Health 2008;7:51.
Walpole SC, Prieto-Merino D, Edwards P, Cleland J, Stevens G, Roberts I. The weight ofnations: an estimation of adult human biomass. BMC Public Health 2012;12:439.
WHO, World Health Organization. Health aspects of air pollution with particulate mat-ter, ozone and nitrogen dioxide. Report on a WHO working group [Internet]; 2003[Available at: www.euro.who.int (last accessed: June 2012)].
WHO, World Health Organization. Global Environment Monitoring System — FoodContamination Monitoring and Assessment Programme (GEMS/Food) [Internet];

380 M. Cordioli et al. / Science of the Total Environment 444 (2013) 369–380
2006 [Available at: www.who.int/foodsafety/chem/gems/en/index1.html (lastaccessed: June 2012)].
WHO Europe, World Health Organization, European Office. Air Quality Guidelines forEurope II edition [Internet]. European series No.: 91. Copenhagen: WHO regional pub-lications; 2000 [Available at: www.euro.who.int/document/e71922.pdf/ (lastaccessed: June 2012)].
WHO Europe, World Health Organization, European Office. Air Quality Guidelines —
Global Update 2005 [Internet]. Copenhagen: World Health Organization; 2006[Available at: www.euro.who.int/document/e90038.pdf (last accessed: June2012)].
WHO Europe, World Health Organization, European Office. Population health and wastemanagement: scientific data and policy options [Internet]. Copenhagen: WorldHealth Organization; 2007 [Available at: www.euro.who.int/document/e91021.pdf(last accessed: June 2012)].
Yegnan A, Williamson DG, Graettinger AJ. Uncertainty analysis in air dispersion model-ing. Environ Model Software 2002;17:639–49.