Science Arts & Métiers (SAM) - core.ac.uk · 1MECASURF, ENSAM, 2 cours des Arts et Metiers,´...
14
Science Arts & Métiers (SAM) is an open access repository that collects the work of Arts et Métiers ParisTech researchers and makes it freely available over the web where possible. This is an author-deposited version published in: http://sam.ensam.eu Handle ID: .http://hdl.handle.net/10985/10129 To cite this version : Karim INAL, Raphaël PESCI, Jean-Lou LEBRUN, Olivier DIARD, Renaud MASSON - Grain and phase stress criteria for behaviour and cleavage in duplex and bainitic steels - Fatigue & Fracture of Engineering Materials & Structures - Vol. 29, n°9-10, p.685-696 - 2006 Any correspondence concerning this service should be sent to the repository Administrator : [email protected]
Transcript of Science Arts & Métiers (SAM) - core.ac.uk · 1MECASURF, ENSAM, 2 cours des Arts et Metiers,´...

Science Arts & Métiers (SAM)is an open access repository that collects the work of Arts et Métiers ParisTech
researchers and makes it freely available over the web where possible.
This is an author-deposited version published in: http://sam.ensam.euHandle ID: .http://hdl.handle.net/10985/10129
To cite this version :
Karim INAL, Raphaël PESCI, Jean-Lou LEBRUN, Olivier DIARD, Renaud MASSON - Grain andphase stress criteria for behaviour and cleavage in duplex and bainitic steels - Fatigue & Fractureof Engineering Materials & Structures - Vol. 29, n°9-10, p.685-696 - 2006
Any correspondence concerning this service should be sent to the repository
Administrator : [email protected]

Science Arts & Métiers (SAM)is an open access repository that collects the work of Arts et Métiers ParisTech
researchers and makes it freely available over the web where possible.
This is an author-deposited version published in: http://sam.ensam.euHandle ID: .http://hdl.handle.net/null
To cite this version :
Karim INAL, Raphaël PESCI, Jean-Lou LEBRUN, Olivier DIARD, Renaud MASSON - Grain andphase stress criteria for behaviour and cleavage in duplex and bainitic steels - Fatigue & Fractureof Engineering Materials & Structures - Vol. 29, n°9-10, p.685-696 - 2006
Any correspondence concerning this service should be sent to the repository
Administrator : [email protected]
Grain and phase stress criteria for behaviour and cleavage in duplexand bainitic steels
K. INAL1, R. PESCI2, J. L . LEBRUN3, O. DIARD4 and R. MASSON4
1MECASURF, ENSAM, 2 cours des Arts et Metiers, 13617 Aix en Provence cedex 1 – France, 2LPMM, ENSAM, 4 Av Augustin Fresnel, 57078Metz cedex 3 – France, 3LPMI, ENSAM, 2 Bd du Ronceray, BP 93525, 49035 Angers cedex 6 – France, 4MMC, EDF, Centre des Renardieres, BP 1,77250 Moret sur Loing – France
A B S T R A C T Stress analyses by X-ray diffraction are performed on a cast duplex (32% ferrite) stainlesssteel elbow and a bainitic (95% ferrite) pressure vessel steel. During an in situ tensile test,micrographic observations are made (visible glides and microcracks) and related to thestress state determined in the individual ferritic grains (aged duplex) and the ferritic phase(bainite loaded at low temperatures). Several material parameters have been identifiedat different scales, as for example, the critical resolved shear stress of 245 MPa for theaged ferritic grain (duplex) or 275 MPa for bainite (–60 ◦C), a crystallographic cleavagepropagation criterion of 465 MPa (stress normal to {100} planes), and a fracture stressof approximately 700 MPa in the ferritic phase. Even though the two steels are differentin many respects, the macroscopic fracture strains and stresses are well predicted by thepolycrystalline model developed for bainite, whatever the temperatures tested (considering7% of the grains reaching the local criterion).
Keywords behaviour; crystallographic criteria; damage; microstructure; phase interac-tions; stress analysis.
I N T R O D U C T I O N
The industrial processing of steels involves the use of var-ious techniques (such as rolling, casting, welding, machin-ing, etc.) that inevitably have an influence on the mechan-ical properties of materials. The characteristics of a givensteel can then be said to depend on several forming param-eters, on its chemical composition, on its phase morphol-ogy, etc. In the case of multiphase steels, it is thereforeimportant to have a thorough knowledge of theproduction-related microstructure specificities of eachphase and their effects on mechanical properties, with spe-cial attention to phase interactions. In fact, many studieshave already characterized the industrial performances ofsteels, but in order to identify more precisely the mechan-ical properties and damage processes, the polycrystallineand heterogeneous nature of the material must be takeninto account. Various scales in the material are, thereforedefined and associated to a stress order description:1,2
1 First order corresponds to the macroscopic mechanicalstates;
2 Second order (or mesoscopic stress) is present on the crys-talline level; the crystal orientation must be introduced totake the anisotropy of the properties into account, as ex-pressed in the single crystal anisotropic Hooke’s law, and
3 In the third order, the mechanical state varies over a fewhundred interatomic distances. Its description is morecomplex since the local stresses depend on the dislocationdensities, on their distribution, on their motion, etc.
In a multiphase material, another scale must be intro-duced, following Ref. [3]. It corresponds to the averagestress over all crystals or grains of the considered phase:we will call it pseudo-macroscopic. In the present pa-per, superscripts I, II and III will denote, respectively,macroscopic (or pseudo-macroscopic), mesoscopic andmicroscopic mechanical states. To distinguish the macroor pseudo-macroscopic scales, subscripts α (ferrite), γ
(austenite) or Fe3C (cementite) will be added to the sym-bol. In the case of two-phase steels, Fig. 1 summarizesthe different stress orders. To come to a better under-standing of the contribution of each phase to the wholemacroscopic behaviour, mechanical state determinationon different scales must be considered as essential.
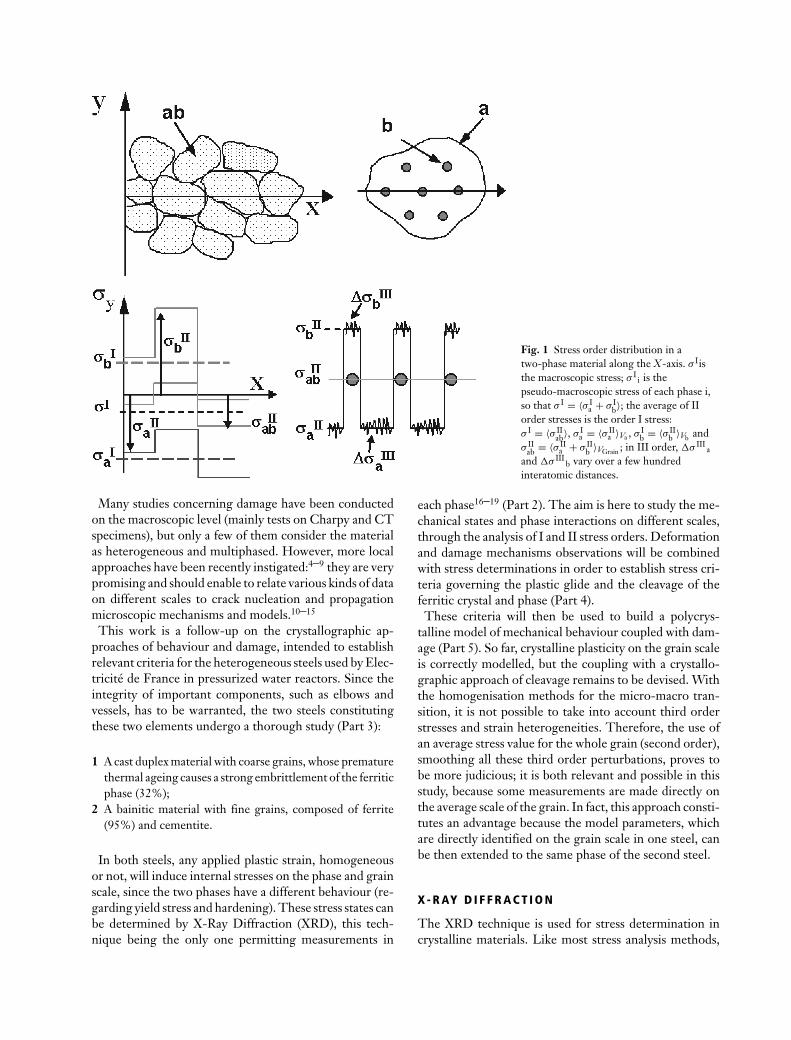
Fig. 1 Stress order distribution in atwo-phase material along the X-axis. σ Iisthe macroscopic stress; σ I
i is thepseudo-macroscopic stress of each phase i,so that σ I = 〈σ I
a + σ Ib〉; the average of II
order stresses is the order I stress:σ I = 〈σ II
ab〉, σ Ia = 〈σ II
a 〉Va , σ Ib = 〈σ II
b 〉Vb andσ II
ab = 〈σ IIa + σ II
b 〉VGrain ; in III order, �σ IIIa
and �σ IIIb vary over a few hundred
interatomic distances.
Many studies concerning damage have been conductedon the macroscopic level (mainly tests on Charpy and CTspecimens), but only a few of them consider the materialas heterogeneous and multiphased. However, more localapproaches have been recently instigated:4–9 they are verypromising and should enable to relate various kinds of dataon different scales to crack nucleation and propagationmicroscopic mechanisms and models.10–15
This work is a follow-up on the crystallographic ap-proaches of behaviour and damage, intended to establishrelevant criteria for the heterogeneous steels used by Elec-tricite de France in pressurized water reactors. Since theintegrity of important components, such as elbows andvessels, has to be warranted, the two steels constitutingthese two elements undergo a thorough study (Part 3):
1 A cast duplex material with coarse grains, whose prematurethermal ageing causes a strong embrittlement of the ferriticphase (32%);
2 A bainitic material with fine grains, composed of ferrite(95%) and cementite.
In both steels, any applied plastic strain, homogeneousor not, will induce internal stresses on the phase and grainscale, since the two phases have a different behaviour (re-garding yield stress and hardening). These stress states canbe determined by X-Ray Diffraction (XRD), this tech-nique being the only one permitting measurements in
each phase16–19 (Part 2). The aim is here to study the me-chanical states and phase interactions on different scales,through the analysis of I and II stress orders. Deformationand damage mechanisms observations will be combinedwith stress determinations in order to establish stress cri-teria governing the plastic glide and the cleavage of theferritic crystal and phase (Part 4).
These criteria will then be used to build a polycrys-talline model of mechanical behaviour coupled with dam-age (Part 5). So far, crystalline plasticity on the grain scaleis correctly modelled, but the coupling with a crystallo-graphic approach of cleavage remains to be devised. Withthe homogenisation methods for the micro-macro tran-sition, it is not possible to take into account third orderstresses and strain heterogeneities. Therefore, the use ofan average stress value for the whole grain (second order),smoothing all these third order perturbations, proves tobe more judicious; it is both relevant and possible in thisstudy, because some measurements are made directly onthe average scale of the grain. In fact, this approach consti-tutes an advantage because the model parameters, whichare directly identified on the grain scale in one steel, canbe then extended to the same phase of the second steel.
X - R AY D I F F R A C T I O N
The XRD technique is used for stress determination incrystalline materials. Like most stress analysis methods,
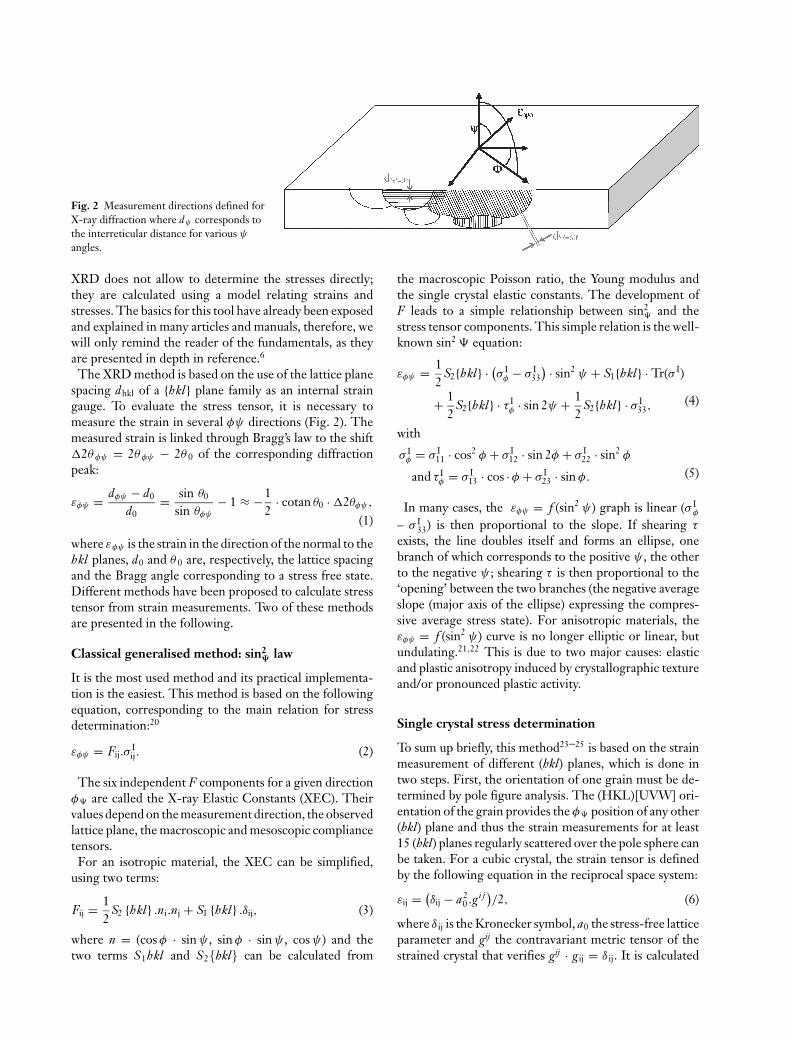
Fig. 2 Measurement directions defined forX-ray diffraction where dψ corresponds tothe interreticular distance for various ψ
angles.
XRD does not allow to determine the stresses directly;they are calculated using a model relating strains andstresses. The basics for this tool have already been exposedand explained in many articles and manuals, therefore, wewill only remind the reader of the fundamentals, as theyare presented in depth in reference.6
The XRD method is based on the use of the lattice planespacing dhkl of a {hkl} plane family as an internal straingauge. To evaluate the stress tensor, it is necessary tomeasure the strain in several φψ directions (Fig. 2). Themeasured strain is linked through Bragg’s law to the shift�2θ φψ = 2θ φψ − 2θ 0 of the corresponding diffractionpeak:
εφψ = dφψ − d0
d0= sin θ0
sin θφψ
− 1 ≈ −12
· cotan θ0 · �2θφψ,
(1)
where εφψ is the strain in the direction of the normal to thehkl planes, d0 and θ 0 are, respectively, the lattice spacingand the Bragg angle corresponding to a stress free state.Different methods have been proposed to calculate stresstensor from strain measurements. Two of these methodsare presented in the following.
Classical generalised method: sin2Ψ law
It is the most used method and its practical implementa-tion is the easiest. This method is based on the followingequation, corresponding to the main relation for stressdetermination:20
εφψ = Fij.σIij. (2)
The six independent F components for a given directionφ are called the X-ray Elastic Constants (XEC). Theirvalues depend on the measurement direction, the observedlattice plane, the macroscopic and mesoscopic compliancetensors.
For an isotropic material, the XEC can be simplified,using two terms:
Fij = 12
S2 {hkl} .ni.nj + S1 {hkl} .δij, (3)
where n = (cos φ · sin ψ , sin φ · sin ψ , cos ψ) and thetwo terms S1hkl and S2{hkl} can be calculated from
the macroscopic Poisson ratio, the Young modulus andthe single crystal elastic constants. The development ofF leads to a simple relationship between sin2
and thestress tensor components. This simple relation is the well-known sin2 equation:
εφψ = 12
S2{hkl} · (σ I
φ − σ I33
) · sin2 ψ + S1{hkl} · Tr(σ I)
+ 12
S2{hkl} · τ Iφ · sin 2ψ + 1
2S2{hkl} · σ I
33,(4)
with
σ Iφ = σ I
11 · cos2 φ + σ I12 · sin 2φ + σ I
22 · sin2 φ
and τ Iφ = σ I
13 · cos · φ + σ I23 · sin φ. (5)
In many cases, the εφψ = f (sin2 ψ) graph is linear (σ Iφ
– σ I33) is then proportional to the slope. If shearing τ
exists, the line doubles itself and forms an ellipse, onebranch of which corresponds to the positive ψ , the otherto the negative ψ ; shearing τ is then proportional to the‘opening’ between the two branches (the negative averageslope (major axis of the ellipse) expressing the compres-sive average stress state). For anisotropic materials, theεφψ = f (sin2 ψ) curve is no longer elliptic or linear, butundulating.21,22 This is due to two major causes: elasticand plastic anisotropy induced by crystallographic textureand/or pronounced plastic activity.
Single crystal stress determination
To sum up briefly, this method23–25 is based on the strainmeasurement of different (hkl) planes, which is done intwo steps. First, the orientation of one grain must be de-termined by pole figure analysis. The (HKL)[UVW] ori-entation of the grain provides the φ position of any other(hkl) plane and thus the strain measurements for at least15 (hkl) planes regularly scattered over the pole sphere canbe taken. For a cubic crystal, the strain tensor is definedby the following equation in the reciprocal space system:
εij = (δij − a2
0 .gi j )/2, (6)
where δ ij is the Kronecker symbol, a0 the stress-free latticeparameter and gij the contravariant metric tensor of thestrained crystal that verifies gij · g ij = δ ij. It is calculated
from the lattice planes spacing measured by diffraction:
d−2hkl = gi j · mi · mj, (7)
(the mi are the coordinates of the (hkl) reciprocal vector,with i = 1 to 3).
The components of the metric tensor are calculated by amultilinear regression analysis. The stress tensor compo-nents are then deduced from Hooke’s law. The above cal-culations are in general carried out in the crystal referenceframe. The stress tensor is then calculated in the samplereference frame. In this method, finding the stress-freereference state, which appears in the Eq. (6) as parametera0, turns out to be one of the difficulties.
In fact, for both methods, it is often assumed that σ I33
is null; this allows the calculation of a stress free latticeparameter (for cubic structure). This assumption is justi-fied by the fact that XRD only analyzes a very thin layerof material near the surface (a few micrometers), and it isreasonable to assume that no stress is applied on the freesurface of the sample.
S T U D I E D M AT E R I A L S
Elaboration
The first material is a cast duplex stainless steel (S1) com-posed of ferrite and austenite. It is quenched from 1050to 1150 ◦C after a 6 h annealing: this treatment eliminatesbrittle phases and fixes the volume fraction of ferrite. Thesecond material, elaborated by forging, is a low alloy steel16MND5 similar to ASTM A508 cl. 3 (S2). It undergoesseveral heat treatments that lead to a microstructure com-
Table 1 Chemical analysis (weight percentage, and balance iron) of the S1 duplex and S2 bainitic steels
Cr Ni Si Mn Mo Cu P S C N
S1 duplex 21.9 10.15 1.19 1.07 2.71 0.027 0.04S2 bainite 0.17 0.7 0.24 1.37 0.5 0.06 0.005 0.008 0.159 0.007
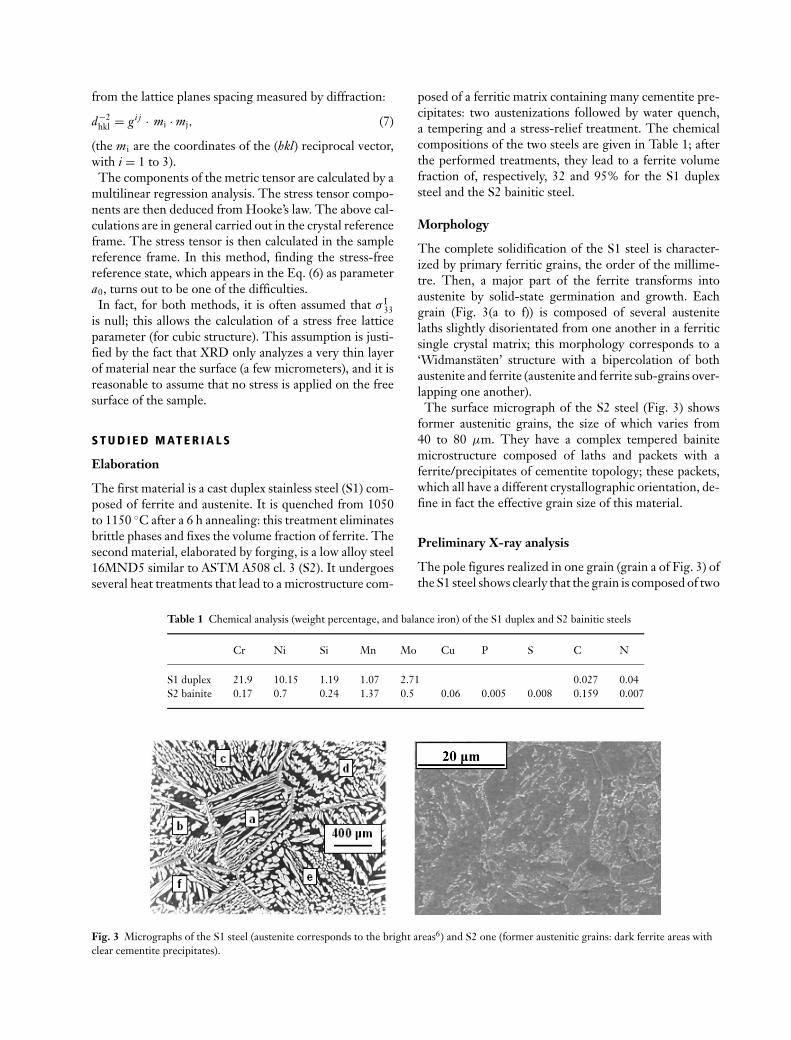
Fig. 3 Micrographs of the S1 steel (austenite corresponds to the bright areas6) and S2 one (former austenitic grains: dark ferrite areas withclear cementite precipitates).
posed of a ferritic matrix containing many cementite pre-cipitates: two austenizations followed by water quench,a tempering and a stress-relief treatment. The chemicalcompositions of the two steels are given in Table 1; afterthe performed treatments, they lead to a ferrite volumefraction of, respectively, 32 and 95% for the S1 duplexsteel and the S2 bainitic steel.
Morphology
The complete solidification of the S1 steel is character-ized by primary ferritic grains, the order of the millime-tre. Then, a major part of the ferrite transforms intoaustenite by solid-state germination and growth. Eachgrain (Fig. 3(a to f)) is composed of several austenitelaths slightly disorientated from one another in a ferriticsingle crystal matrix; this morphology corresponds to a‘Widmanstaten’ structure with a bipercolation of bothaustenite and ferrite (austenite and ferrite sub-grains over-lapping one another).
The surface micrograph of the S2 steel (Fig. 3) showsformer austenitic grains, the size of which varies from40 to 80 µm. They have a complex tempered bainitemicrostructure composed of laths and packets with aferrite/precipitates of cementite topology; these packets,which all have a different crystallographic orientation, de-fine in fact the effective grain size of this material.
Preliminary X-ray analysis
The pole figures realized in one grain (grain a of Fig. 3) ofthe S1 steel shows clearly that the grain is composed of two
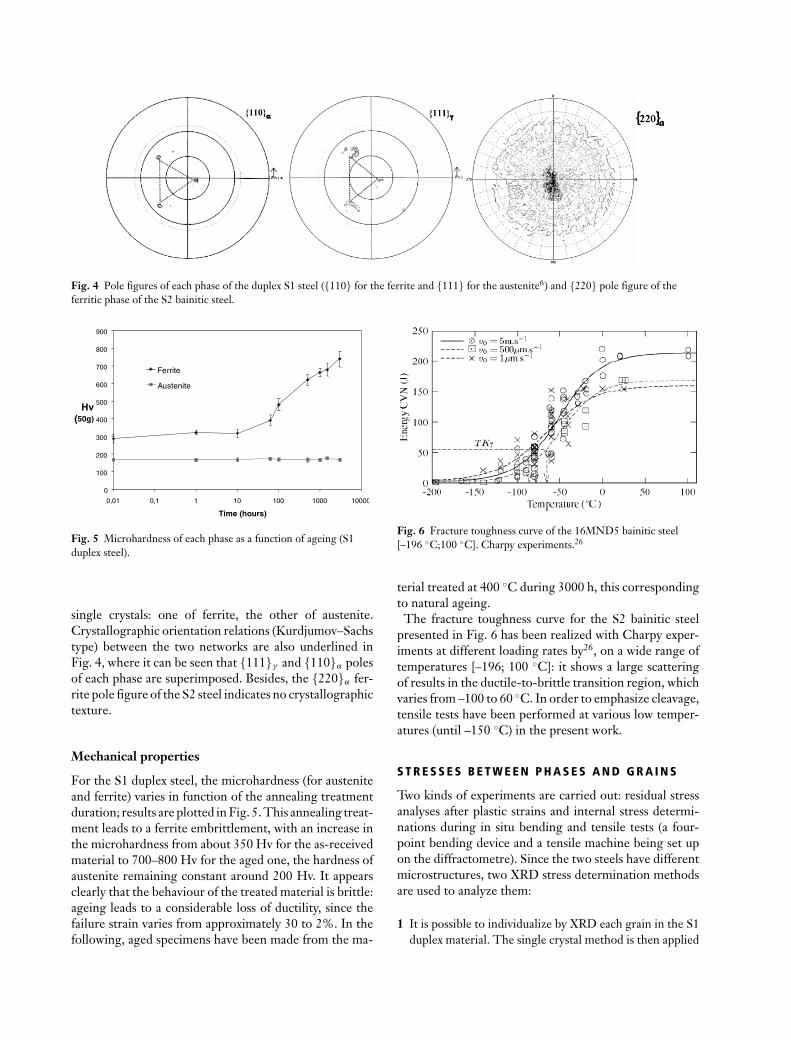
Fig. 4 Pole figures of each phase of the duplex S1 steel ({110} for the ferrite and {111} for the austenite6) and {220} pole figure of theferritic phase of the S2 bainitic steel.
0
100
200
300
400
500
600
700
800
900
0,01 0,1 1 10 100 1000 10000
Time (hours)
Hv (50g)
Ferrite
Austenite
Fig. 5 Microhardness of each phase as a function of ageing (S1duplex steel).
single crystals: one of ferrite, the other of austenite.Crystallographic orientation relations (Kurdjumov–Sachstype) between the two networks are also underlined inFig. 4, where it can be seen that {111}γ and {110}α polesof each phase are superimposed. Besides, the {220}α fer-rite pole figure of the S2 steel indicates no crystallographictexture.
Mechanical properties
For the S1 duplex steel, the microhardness (for austeniteand ferrite) varies in function of the annealing treatmentduration; results are plotted in Fig. 5. This annealing treat-ment leads to a ferrite embrittlement, with an increase inthe microhardness from about 350 Hv for the as-receivedmaterial to 700–800 Hv for the aged one, the hardness ofaustenite remaining constant around 200 Hv. It appearsclearly that the behaviour of the treated material is brittle:ageing leads to a considerable loss of ductility, since thefailure strain varies from approximately 30 to 2%. In thefollowing, aged specimens have been made from the ma-
Fig. 6 Fracture toughness curve of the 16MND5 bainitic steel[–196 ◦C;100 ◦C]. Charpy experiments.26
terial treated at 400 ◦C during 3000 h, this correspondingto natural ageing.
The fracture toughness curve for the S2 bainitic steelpresented in Fig. 6 has been realized with Charpy exper-iments at different loading rates by26, on a wide range oftemperatures [–196; 100 ◦C]: it shows a large scatteringof results in the ductile-to-brittle transition region, whichvaries from –100 to 60 ◦C. In order to emphasize cleavage,tensile tests have been performed at various low temper-atures (until –150 ◦C) in the present work.
S T R E S S E S B E T W E E N P H A S E S A N D G R A I N S
Two kinds of experiments are carried out: residual stressanalyses after plastic strains and internal stress determi-nations during in situ bending and tensile tests (a four-point bending device and a tensile machine being set upon the diffractometre). Since the two steels have differentmicrostructures, two XRD stress determination methodsare used to analyze them:
1 It is possible to individualize by XRD each grain in the S1duplex material. The single crystal method is then applied
to the coarse structure; it only requires the elastic constantsof the single crystals (see Table 2) to determine the elasticstrain tensor, the stress tensor being deduced from Hooke’slaw.
2 The conventional method is used for the S2 bainitic steelbecause of its small grain size. The measurements are re-alized in the ferritic phase, using the XEC: S1 = –1.28 ×10⁻⁶ MPa−1 and 1/2S2= 5.92 × 10⁻⁶ MPa−1.
S1 duplex steel
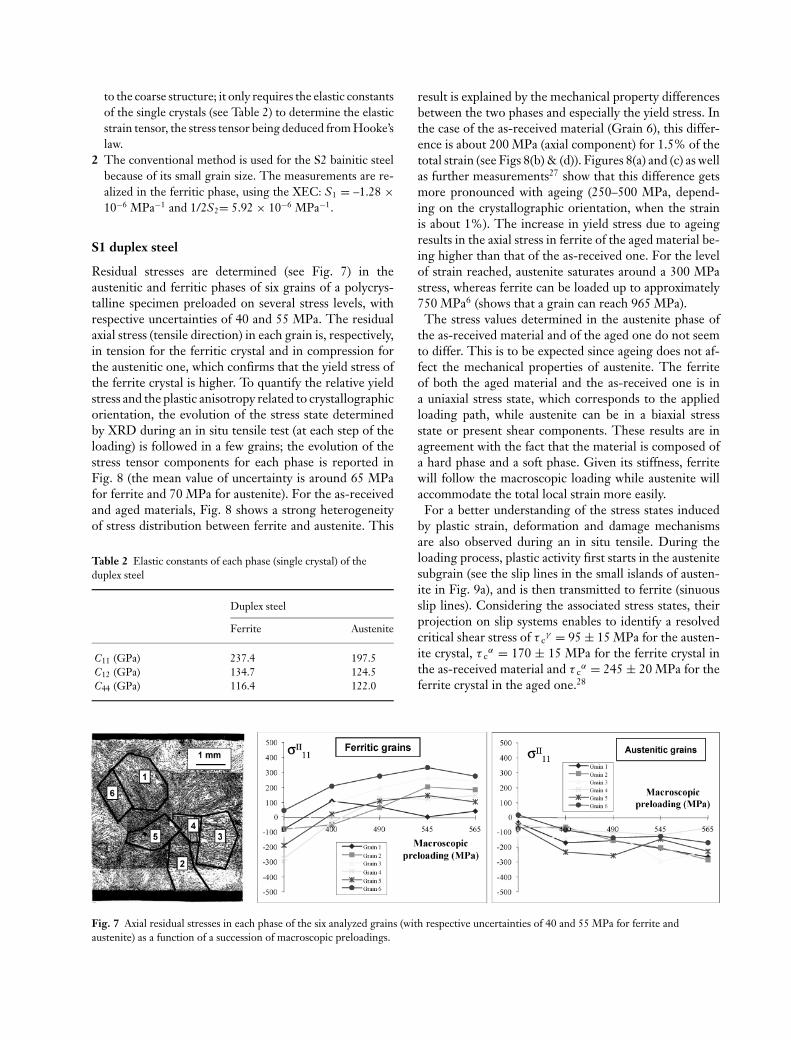
Residual stresses are determined (see Fig. 7) in theaustenitic and ferritic phases of six grains of a polycrys-talline specimen preloaded on several stress levels, withrespective uncertainties of 40 and 55 MPa. The residualaxial stress (tensile direction) in each grain is, respectively,in tension for the ferritic crystal and in compression forthe austenitic one, which confirms that the yield stress ofthe ferrite crystal is higher. To quantify the relative yieldstress and the plastic anisotropy related to crystallographicorientation, the evolution of the stress state determinedby XRD during an in situ tensile test (at each step of theloading) is followed in a few grains; the evolution of thestress tensor components for each phase is reported inFig. 8 (the mean value of uncertainty is around 65 MPafor ferrite and 70 MPa for austenite). For the as-receivedand aged materials, Fig. 8 shows a strong heterogeneityof stress distribution between ferrite and austenite. This
Table 2 Elastic constants of each phase (single crystal) of theduplex steel
Duplex steel
Ferrite Austenite
C11 (GPa) 237.4 197.5C12 (GPa) 134.7 124.5C44 (GPa) 116.4 122.0
Fig. 7 Axial residual stresses in each phase of the six analyzed grains (with respective uncertainties of 40 and 55 MPa for ferrite andaustenite) as a function of a succession of macroscopic preloadings.
result is explained by the mechanical property differencesbetween the two phases and especially the yield stress. Inthe case of the as-received material (Grain 6), this differ-ence is about 200 MPa (axial component) for 1.5% of thetotal strain (see Figs 8(b) & (d)). Figures 8(a) and (c) as wellas further measurements27 show that this difference getsmore pronounced with ageing (250–500 MPa, depend-ing on the crystallographic orientation, when the strainis about 1%). The increase in yield stress due to ageingresults in the axial stress in ferrite of the aged material be-ing higher than that of the as-received one. For the levelof strain reached, austenite saturates around a 300 MPastress, whereas ferrite can be loaded up to approximately750 MPa6 (shows that a grain can reach 965 MPa).
The stress values determined in the austenite phase ofthe as-received material and of the aged one do not seemto differ. This is to be expected since ageing does not af-fect the mechanical properties of austenite. The ferriteof both the aged material and the as-received one is ina uniaxial stress state, which corresponds to the appliedloading path, while austenite can be in a biaxial stressstate or present shear components. These results are inagreement with the fact that the material is composed ofa hard phase and a soft phase. Given its stiffness, ferritewill follow the macroscopic loading while austenite willaccommodate the total local strain more easily.
For a better understanding of the stress states inducedby plastic strain, deformation and damage mechanismsare also observed during an in situ tensile. During theloading process, plastic activity first starts in the austenitesubgrain (see the slip lines in the small islands of austen-ite in Fig. 9a), and is then transmitted to ferrite (sinuousslip lines). Considering the associated stress states, theirprojection on slip systems enables to identify a resolvedcritical shear stress of τ c
γ = 95 ± 15 MPa for the austen-ite crystal, τ c
α = 170 ± 15 MPa for the ferrite crystal inthe as-received material and τ c
α = 245 ± 20 MPa for theferrite crystal in the aged one.28
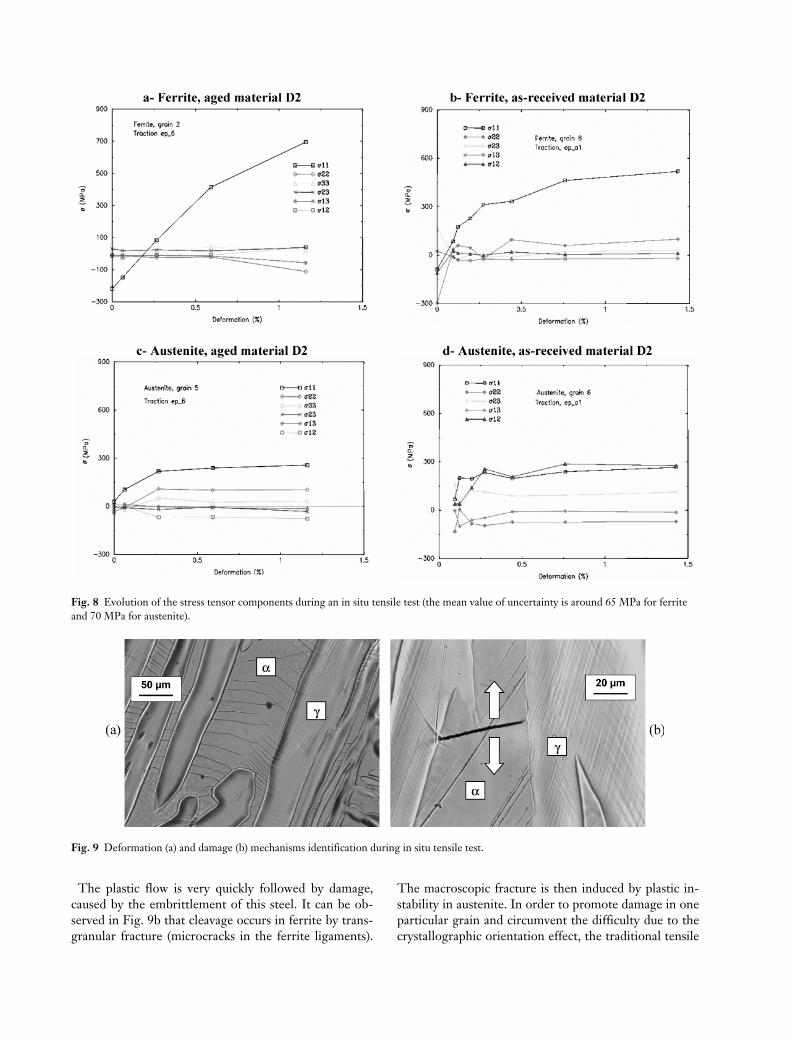
Fig. 8 Evolution of the stress tensor components during an in situ tensile test (the mean value of uncertainty is around 65 MPa for ferriteand 70 MPa for austenite).
Fig. 9 Deformation (a) and damage (b) mechanisms identification during in situ tensile test.
The plastic flow is very quickly followed by damage,caused by the embrittlement of this steel. It can be ob-served in Fig. 9b that cleavage occurs in ferrite by trans-granular fracture (microcracks in the ferrite ligaments).
The macroscopic fracture is then induced by plastic in-stability in austenite. In order to promote damage in oneparticular grain and circumvent the difficulty due to thecrystallographic orientation effect, the traditional tensile
specimens studied by XRD are notched in order to in-troduce a stress concentration.6 A 10 mm notch radius ischosen so that no high applied stress triaxiality is intro-duced in the notched zone; the notched section generallycontains one or two grains. Four samples are thus pre-pared and X-ray stress analyses are realized during in situuniaxial tensile tests (until failure). As σ IIα
ij is then exper-imentally determined in the ferrite of the various grains,it is especially interesting to follow the projection of thisstress tensor on the normal to the {100} planes, that arewell known in literature to be cleavage planes for body-centred cubic crystals:29
σ IIα{100} = ni . σIIαij . nj
with n the unit vector normal to {100} planes. (8)
A subscript c is added to the stress symbol when this stressis considered to be related to micrographic observationsof cleavage initiation. A significant difference between thefour crystals is noticed for the critical longitudinal stressvalues σ c
IIα11 (1 being the tensile direction). The aver-
age value of this stress is 710 MPa with a large standarddeviation of 240 MPa. The σ c
IIα11 stress is absolutely not
representative of local damage initiation; it is only an aver-age value over a few grains. In the case of σ c
IIα {100} values,it can be observed that for the four studied samples, theresults agree with an average value of 465 MPa, with asmall dispersion (45 MPa). σ c
IIα {100} is the critical cleav-age stress and it can be considered as a local criterion. Forthese various tests, failure takes place for different macro-scopic loadings, but on the crystal level, the critical valueof the stress normal to {100} cleavage planes remains thesame: 465 MPa.
S2 Bainitic steel
Flat specimens are used to characterize the level and thesign of the residual stresses induced by a plastic strain (dur-ing tensile test). Axial (tensile direction) residual stressesare given in Table 3 for each phase of these specimensstretched at various strain levels (up to 15%).
Contrary to S1 steel, the ferritic phase is here in com-pression (negative residual stresses), which is explained byits lower yield stress; this has been already observed inother materials such as pearlitic steels, with a differencebetween the macroscopic stress and the average stress inthe ferritic phase of over 400 MPa.30 The volume frac-
Table 3 Residual stresses in each phase of the 16MND5 steel aftermacroscopic pre-strain at –60 ◦C
Overall pre-strain (%) 6,5 11,9XRD measurements in ferrite (MPa) −80 ± 20 −105 ± 30Residual stresses in cementite (MPa) 1520 1995
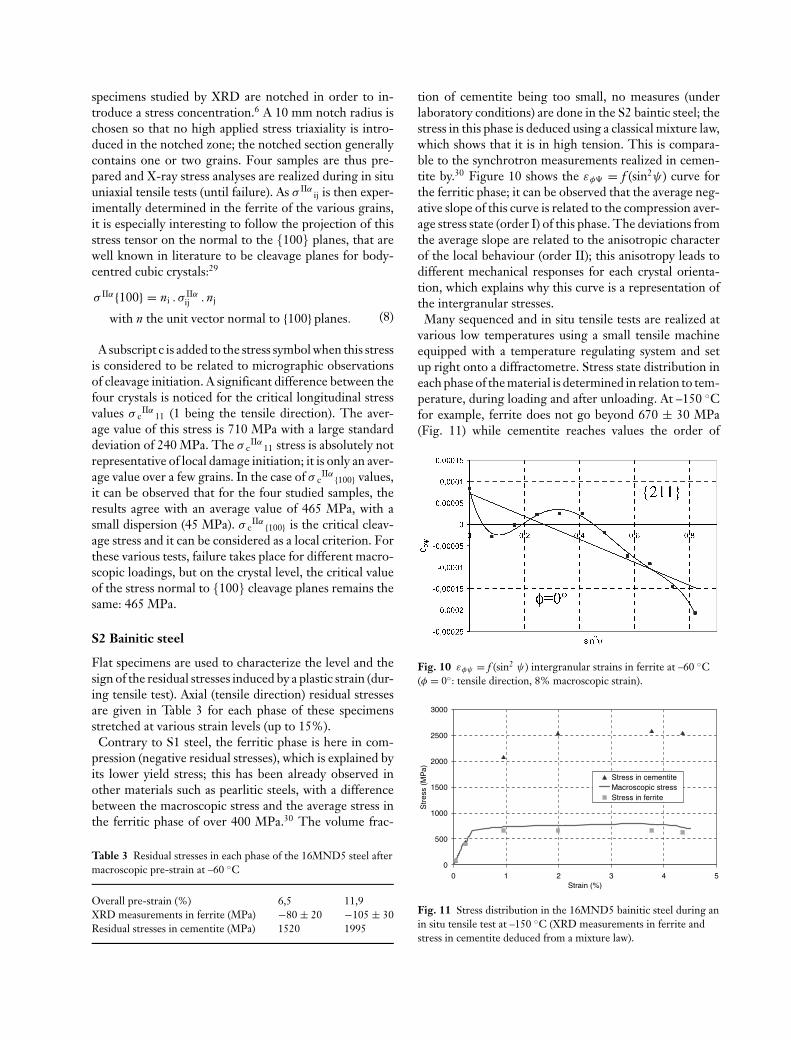
tion of cementite being too small, no measures (underlaboratory conditions) are done in the S2 baintic steel; thestress in this phase is deduced using a classical mixture law,which shows that it is in high tension. This is compara-ble to the synchrotron measurements realized in cemen-tite by.30 Figure 10 shows the εφ = f (sin2ψ) curve forthe ferritic phase; it can be observed that the average neg-ative slope of this curve is related to the compression aver-age stress state (order I) of this phase. The deviations fromthe average slope are related to the anisotropic characterof the local behaviour (order II); this anisotropy leads todifferent mechanical responses for each crystal orienta-tion, which explains why this curve is a representation ofthe intergranular stresses.
Many sequenced and in situ tensile tests are realized atvarious low temperatures using a small tensile machineequipped with a temperature regulating system and setup right onto a diffractometre. Stress state distribution ineach phase of the material is determined in relation to tem-perature, during loading and after unloading. At –150 ◦Cfor example, ferrite does not go beyond 670 ± 30 MPa(Fig. 11) while cementite reaches values the order of
Fig. 10 εφψ = f (sin2 ψ) intergranular strains in ferrite at –60 ◦C(φ = 0◦: tensile direction, 8% macroscopic strain).
0
500
1000
1500
2000
2500
3000
0 1 2 3 4 5Strain (%)
Str
ess
(MP
a)
Stress in cementiteMacroscopic stressStress in ferrite
Fig. 11 Stress distribution in the 16MND5 bainitic steel during anin situ tensile test at –150 ◦C (XRD measurements in ferrite andstress in cementite deduced from a mixture law).
2600 MPa (mixture law). The stress in ferrite remainstherefore lower than the macroscopic one, with a differ-ence never exceeding –150 MPa (it is maximum at –196◦C). This is very important when studying the failure ofthe material, because the fracture stress will not be con-sidered in bainite, but in the ferritic phase. Indeed, thefracture stress in ferrite is close to 700 MPa at –150 ◦Cand seems to remain constant with temperature (from –60 to –150 ◦C). This stress value agrees with the averagestress of 710 MPa in ferritic grains which has been deter-mined in the S1 duplex steel. A σ c
Iα of about 700 MPacan be therefore considered as an average stress criterionfor damage of the ferritic phase.
B E H AV I O U R A N D D A M A G E P O LY C R I S TA L L I N EM O D E L L I N G
For the bainitic steel, a polycrystalline modelling with atwo-level homogenization has been developed7 to takeinto account each kind of heterogeneity as well as thephase and grain interactions; a Mori–Tanaka formula-tion31 enables to describe the elastoplastic behaviour ofa bainitic single crystal (cementite inclusions in a ferriticmatrix), while the transition to polycrystal is achieved bya self-consistent approach.32 In addition, cementite in-clusions are considered to be exclusively elastic while theplastic strain of ferrite is induced by crystallographic glid-ing when slip systems become active.
The constitutive relation of a bainitic single crystal mustbe first presented. The activation of slip systems is deter-mined thanks to an energetic criterion and a two-phaseelastoplastic tangent modulus lα/Fe3C characterizes the lo-cal behaviour law:33
σ t = lα/Fe3C · εt = [lα + f · (CFe3C · T − lα)
]
· [(1 − f ) · I + f · T]−1 · εt, (9)
where σ t and εt are, respectively, the overall stress andstrain rates of the bainitic grain, f is the volume frac-tion of cementite, CFe3C and lα are the elastic andelastoplastic characteristics of each phase and T = [I +SEsh.l−1
α .(CFe3C − lα)]−1 comes from the solution of theelastic inclusion problem, with SEsh the Eshelby tensor.34
The polycrystal is then considered to be an aggregate ofbainitic single crystals, so that a self-consistent approachcan be adopted. The macroscopic constitutive relationtherefore reads:∑
= Lα/Fe3C · Et with Lα/Fe3C
= lα/Fe3C.[I + SEsh.L−1
α/Fe3C.(lα/Fe3C − Lα/Fe3C
)]−1
(10)
where Et and � are, respectively, the macroscopic strainand stress rates and Lα/Fe3C is the average macroscopic
Table 4 Elastic constants and parameters of the model identifiedwith a tensile test at –60 ◦C
Critical Hardeningshear parameters
Elastic constants (MPa) stress (MPa) (MPa)
C11 C12 C44 τgc h1 h2 = 1,2·h1
237400 134700 116400 275 225 270
-200
0
200
400
600
800
1000
1200
0 1 2 3 4 5 6
Strain (%)
Str
ess
(MP
a)
Model: cementiteModel: bainiteModel: ferr iteTensile test at -60°C
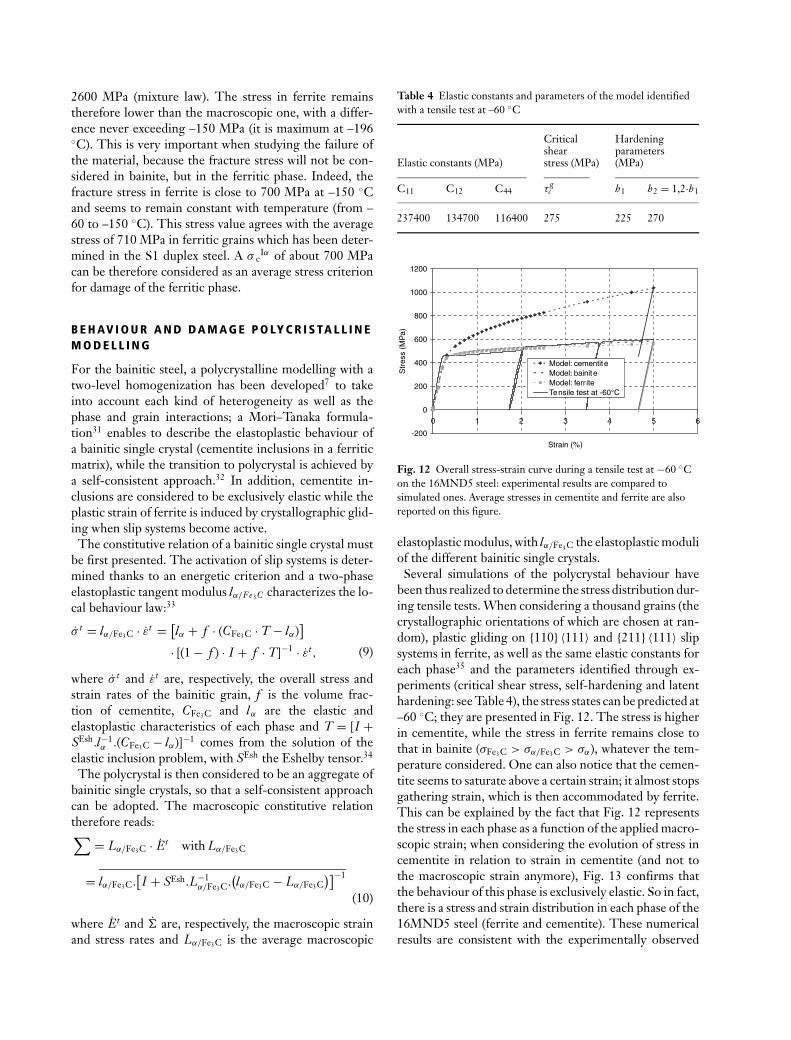
Fig. 12 Overall stress-strain curve during a tensile test at −60 ◦Con the 16MND5 steel: experimental results are compared tosimulated ones. Average stresses in cementite and ferrite are alsoreported on this figure.
elastoplastic modulus, with lα/Fe3C the elastoplastic moduliof the different bainitic single crystals.
Several simulations of the polycrystal behaviour havebeen thus realized to determine the stress distribution dur-ing tensile tests. When considering a thousand grains (thecrystallographic orientations of which are chosen at ran-dom), plastic gliding on {110} 〈111〉 and {211} 〈111〉 slipsystems in ferrite, as well as the same elastic constants foreach phase35 and the parameters identified through ex-periments (critical shear stress, self-hardening and latenthardening: see Table 4), the stress states can be predicted at–60 ◦C; they are presented in Fig. 12. The stress is higherin cementite, while the stress in ferrite remains close tothat in bainite (σFe3C > σα/Fe3C > σα), whatever the tem-perature considered. One can also notice that the cemen-tite seems to saturate above a certain strain; it almost stopsgathering strain, which is then accommodated by ferrite.This can be explained by the fact that Fig. 12 representsthe stress in each phase as a function of the applied macro-scopic strain; when considering the evolution of stress incementite in relation to strain in cementite (and not tothe macroscopic strain anymore), Fig. 13 confirms thatthe behaviour of this phase is exclusively elastic. So in fact,there is a stress and strain distribution in each phase of the16MND5 steel (ferrite and cementite). These numericalresults are consistent with the experimentally observed
0
200
400
600
800
1000
1200
0 0,1 0,2 0,3 0,4 0,5 0,6
Strain in cementite (%)
Str
ess
in c
emen
tite
(MP
a)
Fig. 13 Average stress in cementite (σ 11 component) as a functionof the average strain in cementite (ε11 component) during a tensiletest at −60 ◦C (4.5% macroscopic strain).
one, even if the difference between bainite and ferrite is alittle underestimated.
The εφψ = f (sin2 ψ) intergranular strain can also be cal-culated with the proposed modelling, by projecting theelastic strain tensor normally to the considered diffract-ing plane:
εφψ = ⟨ni · εe
ij · nj⟩φ,ψ
. (11)
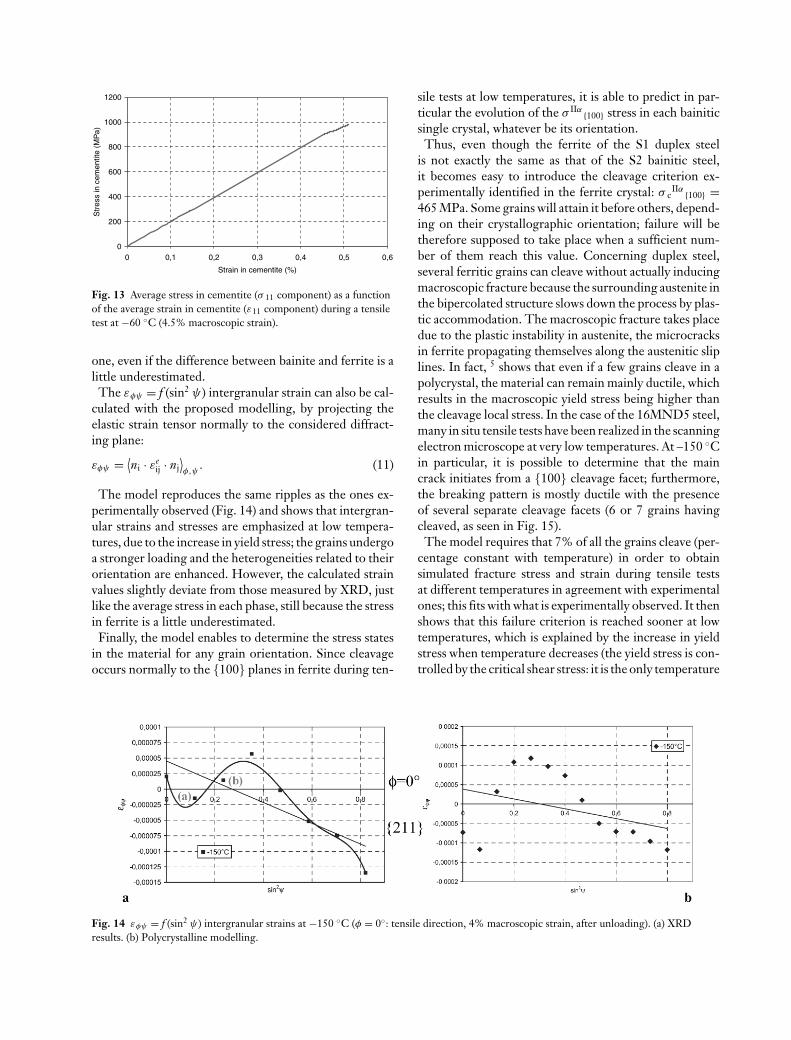
The model reproduces the same ripples as the ones ex-perimentally observed (Fig. 14) and shows that intergran-ular strains and stresses are emphasized at low tempera-tures, due to the increase in yield stress; the grains undergoa stronger loading and the heterogeneities related to theirorientation are enhanced. However, the calculated strainvalues slightly deviate from those measured by XRD, justlike the average stress in each phase, still because the stressin ferrite is a little underestimated.
Finally, the model enables to determine the stress statesin the material for any grain orientation. Since cleavageoccurs normally to the {100} planes in ferrite during ten-
Fig. 14 εφψ = f (sin2 ψ) intergranular strains at −150 ◦C (φ = 0◦: tensile direction, 4% macroscopic strain, after unloading). (a) XRDresults. (b) Polycrystalline modelling.
sile tests at low temperatures, it is able to predict in par-ticular the evolution of the σ IIα {100} stress in each bainiticsingle crystal, whatever be its orientation.
Thus, even though the ferrite of the S1 duplex steelis not exactly the same as that of the S2 bainitic steel,it becomes easy to introduce the cleavage criterion ex-perimentally identified in the ferrite crystal: σ c
IIα {100} =465 MPa. Some grains will attain it before others, depend-ing on their crystallographic orientation; failure will betherefore supposed to take place when a sufficient num-ber of them reach this value. Concerning duplex steel,several ferritic grains can cleave without actually inducingmacroscopic fracture because the surrounding austenite inthe bipercolated structure slows down the process by plas-tic accommodation. The macroscopic fracture takes placedue to the plastic instability in austenite, the microcracksin ferrite propagating themselves along the austenitic sliplines. In fact, 5 shows that even if a few grains cleave in apolycrystal, the material can remain mainly ductile, whichresults in the macroscopic yield stress being higher thanthe cleavage local stress. In the case of the 16MND5 steel,many in situ tensile tests have been realized in the scanningelectron microscope at very low temperatures. At –150 ◦Cin particular, it is possible to determine that the maincrack initiates from a {100} cleavage facet; furthermore,the breaking pattern is mostly ductile with the presenceof several separate cleavage facets (6 or 7 grains havingcleaved, as seen in Fig. 15).
The model requires that 7% of all the grains cleave (per-centage constant with temperature) in order to obtainsimulated fracture stress and strain during tensile testsat different temperatures in agreement with experimentalones; this fits with what is experimentally observed. It thenshows that this failure criterion is reached sooner at lowtemperatures, which is explained by the increase in yieldstress when temperature decreases (the yield stress is con-trolled by the critical shear stress: it is the only temperature
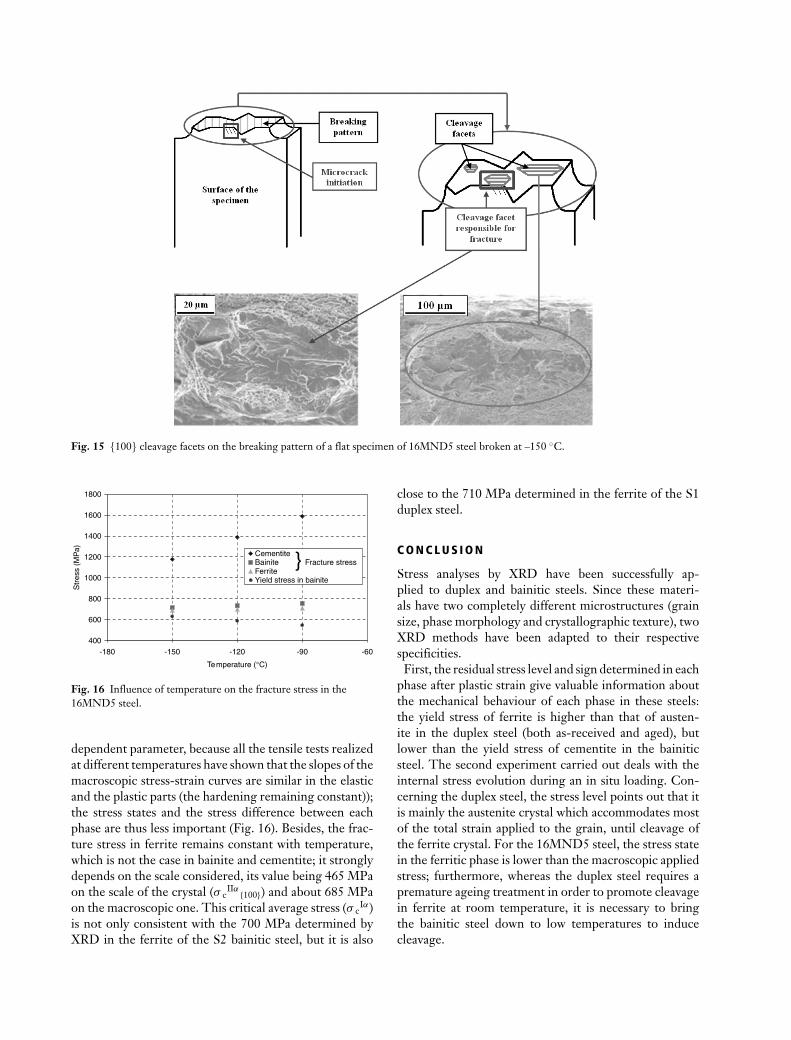
Fig. 15 {100} cleavage facets on the breaking pattern of a flat specimen of 16MND5 steel broken at –150 ◦C.
400
600
800
1000
1200
1400
1600
1800
-180 -150 -120 -90 -60
Temperature (°C)
Str
ess
(MP
a) CementiteBainite Fracture stress FerriteYield stress in bainite
}
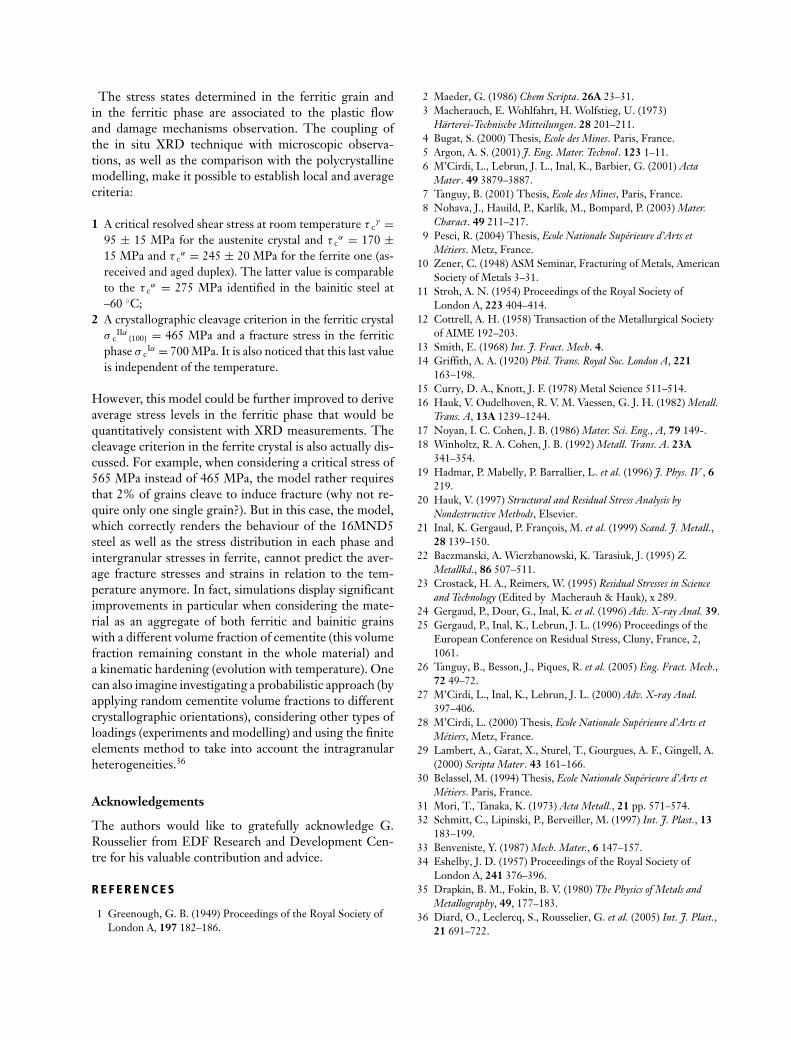
Fig. 16 Influence of temperature on the fracture stress in the16MND5 steel.
dependent parameter, because all the tensile tests realizedat different temperatures have shown that the slopes of themacroscopic stress-strain curves are similar in the elasticand the plastic parts (the hardening remaining constant));the stress states and the stress difference between eachphase are thus less important (Fig. 16). Besides, the frac-ture stress in ferrite remains constant with temperature,which is not the case in bainite and cementite; it stronglydepends on the scale considered, its value being 465 MPaon the scale of the crystal (σ c
IIα {100}) and about 685 MPaon the macroscopic one. This critical average stress (σ c
Iα)is not only consistent with the 700 MPa determined byXRD in the ferrite of the S2 bainitic steel, but it is also
close to the 710 MPa determined in the ferrite of the S1duplex steel.
C O N C L U S I O N
Stress analyses by XRD have been successfully ap-plied to duplex and bainitic steels. Since these materi-als have two completely different microstructures (grainsize, phase morphology and crystallographic texture), twoXRD methods have been adapted to their respectivespecificities.
First, the residual stress level and sign determined in eachphase after plastic strain give valuable information aboutthe mechanical behaviour of each phase in these steels:the yield stress of ferrite is higher than that of austen-ite in the duplex steel (both as-received and aged), butlower than the yield stress of cementite in the bainiticsteel. The second experiment carried out deals with theinternal stress evolution during an in situ loading. Con-cerning the duplex steel, the stress level points out that itis mainly the austenite crystal which accommodates mostof the total strain applied to the grain, until cleavage ofthe ferrite crystal. For the 16MND5 steel, the stress statein the ferritic phase is lower than the macroscopic appliedstress; furthermore, whereas the duplex steel requires apremature ageing treatment in order to promote cleavagein ferrite at room temperature, it is necessary to bringthe bainitic steel down to low temperatures to inducecleavage.
The stress states determined in the ferritic grain andin the ferritic phase are associated to the plastic flowand damage mechanisms observation. The coupling ofthe in situ XRD technique with microscopic observa-tions, as well as the comparison with the polycrystallinemodelling, make it possible to establish local and averagecriteria:
1 A critical resolved shear stress at room temperature τ cγ =
95 ± 15 MPa for the austenite crystal and τ cα = 170 ±
15 MPa and τ cα = 245 ± 20 MPa for the ferrite one (as-
received and aged duplex). The latter value is comparableto the τ c
α = 275 MPa identified in the bainitic steel at–60 ◦C;
2 A crystallographic cleavage criterion in the ferritic crystalσ c
IIα {100} = 465 MPa and a fracture stress in the ferriticphase σ c
Iα = 700 MPa. It is also noticed that this last valueis independent of the temperature.
However, this model could be further improved to deriveaverage stress levels in the ferritic phase that would bequantitatively consistent with XRD measurements. Thecleavage criterion in the ferrite crystal is also actually dis-cussed. For example, when considering a critical stress of565 MPa instead of 465 MPa, the model rather requiresthat 2% of grains cleave to induce fracture (why not re-quire only one single grain?). But in this case, the model,which correctly renders the behaviour of the 16MND5steel as well as the stress distribution in each phase andintergranular stresses in ferrite, cannot predict the aver-age fracture stresses and strains in relation to the tem-perature anymore. In fact, simulations display significantimprovements in particular when considering the mate-rial as an aggregate of both ferritic and bainitic grainswith a different volume fraction of cementite (this volumefraction remaining constant in the whole material) anda kinematic hardening (evolution with temperature). Onecan also imagine investigating a probabilistic approach (byapplying random cementite volume fractions to differentcrystallographic orientations), considering other types ofloadings (experiments and modelling) and using the finiteelements method to take into account the intragranularheterogeneities.36
Acknowledgements
The authors would like to gratefully acknowledge G.Rousselier from EDF Research and Development Cen-tre for his valuable contribution and advice.
R E F E R E N C E S
1 Greenough, G. B. (1949) Proceedings of the Royal Society ofLondon A, 197 182–186.
2 Maeder, G. (1986) Chem Scripta. 26A 23–31.3 Macherauch, E. Wohlfahrt, H. Wolfstieg, U. (1973)
Harterei-Technische Mitteilungen. 28 201–211.4 Bugat, S. (2000) Thesis, Ecole des Mines. Paris, France.5 Argon, A. S. (2001) J. Eng. Mater. Technol. 123 1–11.6 M’Cirdi, L., Lebrun, J. L., Inal, K., Barbier, G. (2001) Acta
Mater. 49 3879–3887.7 Tanguy, B. (2001) Thesis, Ecole des Mines, Paris, France.8 Nohava, J., Hauild, P., Karlık, M., Bompard, P. (2003) Mater.
Charact. 49 211–217.9 Pesci, R. (2004) Thesis, Ecole Nationale Superieure d’Arts et
Metiers. Metz, France.10 Zener, C. (1948) ASM Seminar, Fracturing of Metals, American
Society of Metals 3–31.11 Stroh, A. N. (1954) Proceedings of the Royal Society of
London A, 223 404–414.12 Cottrell, A. H. (1958) Transaction of the Metallurgical Society
of AIME 192–203.13 Smith, E. (1968) Int. J. Fract. Mech. 4.14 Griffith, A. A. (1920) Phil. Trans. Royal Soc. London A, 221
163–198.15 Curry, D. A., Knott, J. F. (1978) Metal Science 511–514.16 Hauk, V. Oudelhoven, R. V. M. Vaessen, G. J. H. (1982) Metall.
Trans. A, 13A 1239–1244.17 Noyan, I. C. Cohen, J. B. (1986) Mater. Sci. Eng., A, 79 149-.18 Winholtz, R. A. Cohen, J. B. (1992) Metall. Trans. A. 23A
341–354.19 Hadmar, P. Mabelly, P. Barrallier, L. et al. (1996) J. Phys. IV , 6
219.20 Hauk, V. (1997) Structural and Residual Stress Analysis by
Nondestructive Methods, Elsevier.21 Inal, K. Gergaud, P. Francois, M. et al. (1999) Scand. J. Metall.,
28 139–150.22 Baczmanski, A. Wierzbanowski, K. Tarasiuk, J. (1995) Z.
Metallkd., 86 507–511.23 Crostack, H. A., Reimers, W. (1995) Residual Stresses in Science
and Technology (Edited by Macherauh & Hauk), x 289.24 Gergaud, P., Dour, G., Inal, K. et al. (1996) Adv. X-ray Anal. 39.25 Gergaud, P., Inal, K., Lebrun, J. L. (1996) Proceedings of the
European Conference on Residual Stress, Cluny, France, 2,1061.
26 Tanguy, B., Besson, J., Piques, R. et al. (2005) Eng. Fract. Mech.,72 49–72.
27 M’Cirdi, L., Inal, K., Lebrun, J. L. (2000) Adv. X-ray Anal.397–406.
28 M’Cirdi, L. (2000) Thesis, Ecole Nationale Superieure d’Arts etMetiers, Metz, France.
29 Lambert, A., Garat, X., Sturel, T., Gourgues, A. F., Gingell, A.(2000) Scripta Mater. 43 161–166.
30 Belassel, M. (1994) Thesis, Ecole Nationale Superieure d’Arts etMetiers. Paris, France.
31 Mori, T., Tanaka, K. (1973) Acta Metall., 21 pp. 571–574.32 Schmitt, C., Lipinski, P., Berveiller, M. (1997) Int. J. Plast., 13
183–199.33 Benveniste, Y. (1987) Mech. Mater., 6 147–157.34 Eshelby, J. D. (1957) Proceedings of the Royal Society of
London A, 241 376–396.35 Drapkin, B. M., Fokin, B. V. (1980) The Physics of Metals and
Metallography, 49, 177–183.36 Diard, O., Leclercq, S., Rousselier, G. et al. (2005) Int. J. Plast.,
21 691–722.