Science and Engineering Doctorate Awards: 2004buell/References/FederalReports/nsf06308... ·...
112
Susan T. Hill, Project Officer Detailed Statistical Tables Science and Engineering Doctorate Awards: 2004 Division of Science Resources Statistics Directorate for Social, Behavioral, and Economic Sciences National Science Foundation February 2006
Transcript of Science and Engineering Doctorate Awards: 2004buell/References/FederalReports/nsf06308... ·...
Susan T. Hill, Project Officer
Detailed Statistical Tables
Science andEngineering DoctorateAwards:2004
Division of Science Resources StatisticsDirectorate for Social, Behavioral, and Economic Sciences
National Science Foundation February 2006
National Science FoundationArden L. Bement, Jr.Director
Directorate for Social, Behavioral, and Economic SciencesDavid W. LightfootAssistant Director
Division of Science Resources StatisticsLynda T. Carlson Mary J. FraseDivision Director Deputy Director
Ronald S. FecsoChief Statistician
Human Resources Statistics ProgramNancy L. LeachProgram Director
DIVISION OF SCIENCE RESOURCES STATISTICS
The Division of Science Resources Statistics (SRS) fulfills the legislative mandate of the National ScienceFoundation Act to ...
provide a central clearinghouse for the collection, interpretation, and analysis of data on scientific andengineering resources and to provide a source of information for policy formulation by other agencies ofthe Federal Government...
To carry out this mandate, SRS designs, supports, and directs periodic surveys as well as a variety of otherdata collections and research projects. These surveys yield the materials for SRS staff to compile, analyze, anddisseminate quantitative information about domestic and international resources devoted to science,engineering, and technology.
If you have any comments or suggestions about this or any other SRS product or report, we would like to hearfrom you. Please direct your comments to:
National Science FoundationDivision of Science Resources Statistics4201 Wilson Blvd., Suite 965Arlington, VA 22230Telephone: (703) 292-8780Fax: (703) 292-9092E-mail: [email protected]
Suggested CitationNational Science Foundation, Division of Science Resources Statistics, Science and Engineering DoctorateAwards: 2004, NSF 06-308, Project Officer, Susan T. Hill (Arlington, VA 2006).
February 2006
Information and data from the Division of Science Resources Statistics are available on theWeb at http://www.nsf.gov/statistics/. This report is available in electronic format only. ForNSF's Telephonic Device for the Deaf, dial toll-free (800) 281-8749 or (703) 292-5090.
ii

iii
The development of Science and Engineering Doc-torate Awards: 2004 was managed by Susan T. Hill,Director, Doctorate Data Project, National Science Foun-dation (NSF), Division of Science Resources Statistics(SRS), Human Resources Statistics Program (HRS), underthe overall direction of Nancy L. Leach, Program Direc-tor, HRS, and Mary J. Frase, Deputy Division Director,SRS. Tanya R. Gore and Cheryl S. Roesel of the SRS
ACKNOWLEDGMENTSInformation and Technology Services Program (ITSP)provided editorial assistance and final composition forthis report. Peg Whalen, ITSP, oversaw electronic publi-cation. ORC Division of Macro International Inc. pre-pared the tables. ORC staff members who worked onthis project were Laura Williams, Cheryl Lloyd, TeresaGrimes, and Mark Morgan.

iv
CONTENTS
Section Page
GENERAL NOTES ............................................................................................................................... 1
DETAILED STATISTICAL TABLES .................................................................................................. 2
APPENDIX A: TECHNICAL NOTES ............................................................................................... 91
APPENDIX B: FIELDS OF STUDY ................................................................................................. 93
APPENDIX C: SURVEY QUESTIONNAIRE .................................................................................. 100
1
The data presented in this report show trends in doc-torate awards by science and engineering (S&E) fieldand recipient characteristics, institutions awarding doc-torates, and postgraduation plans of recipients. The sourceof the data is the Survey of Earned Doctorates (SED).The data were developed as part of the Doctorate DataProject. The Doctorate Data Project consists of the Sur-vey of Earned Doctorates (a census of research doctoraterecipients) and the Survey of Doctorate Recipients (abiennial survey of the employment of doctoral scientistsand engineers).
The SED is conducted annually for the National Sci-ence Foundation (NSF) and five other federal agencies(NEH, NIH, USDA, USED, NASA). Information fromthis survey becomes part of the Doctorate Records File,which is a census, begun in 1920, of individuals who havereceived research doctorates from regionally accrediteduniversities and colleges in the United States. Doctoral de-grees, such as the Ph.D. or D.Sc., are included in thesesurveys, but first professional degrees, such as the J.D.or M.D., are not.
Data for the SED are collected directly from indi-vidual doctorate recipients. The questionnaire is distributedthrough the cooperation of the graduate deans to personsas they are completing their doctorate. The data for agiven year include all doctorates awarded in the 12-monthperiod ending on June 30 of that year.
These tables present detailed data on S&E doctoraterecipients, with some totals provided for broad non-S&Efields in most tables. Detailed data on all fields of studyare published annually in the interagency report DoctorateRecipients from United States Universities: SummaryReport. Data are also provided by the other federal agen-cies that sponsor the Survey of Earned Doctorates; thegroupings of field specialties into broad fields may differamong the sponsoring agencies according to their missions.
Almost 91 percent of doctorate recipients in 2004responded to the questionnaire. Over the period 1995–2004, the response rate varied between 91 and 95 percent.Most of the numbers presented are actual self-reports, asthere are no adjustments for nonresponse. For thenonrespondents, partial data from public sources areadded to the file; therefore, more complete counts arepresented for conferred doctorates by field of study andsex of recipient. Because some tables present data subjectto nonresponse, these summaries represent the conser-vative known responses for any data item. Therefore,small changes in numbers should be interpreted withcaution, as numerical trends are affected by fluctuationsin response rates, and declines and increases may appeargreater than they actually are.
Further information on the survey methodology andother data on S&E doctorate recipients is available athttp://www.nsf.gov/statistics/doctorates.
GENERAL NOTES

2
DETAILED STATISTICAL TABLES
Table Page
1. Doctorates awarded, by field of study: 1995–2004 ............................................................................ 3
2. Doctorates awarded to women, by field of study: 1995–2004 ........................................................... 7
3. Doctorates awarded, by sex, citizenship status, and major field of study of recipients:1995–2004 .......................................................................................................................................... 11
4. Percentage distribution of science and engineering doctorates awarded, by sex,citizenship status, and major field of study of recipients: 1995–2004............................................... 22
5. Doctorates awarded to U.S. citizens or permanent residents, by race/ethnicity andmajor field of study of recipients: 1995–2004 ................................................................................... 31
6. Doctorates awarded to male U.S. citizens or permanent residents, by race/ethnicity andmajor field of study of recipients: 1995–2004 ................................................................................... 36
7. Doctorates awarded to female U.S. citizens or permanent residents, by race/ethnicity andmajor field of study of recipients: 1995–2004 ................................................................................... 41
8. Doctorates awarded to U.S. citizens, by race/ethnicity and major field of study of recipients:1995–2004 .......................................................................................................................................... 46
9. Doctorates awarded to male U.S. citizens, by race/ethnicity and major field of study ofrecipients: 1995–2004 ......................................................................................................................... 51
10. Doctorates awarded to female U.S. citizens, by race/ethnicity and major field of study ofrecipients: 1995–2004 ......................................................................................................................... 56
11. Non-U.S. citizens awarded doctorates in science and engineering, by visa type andcountry of citizenship: 1995–2004 ..................................................................................................... 61
12. Doctorates awarded, by state, institution, and major field: 2004....................................................... 69
13. Definite postgraduation plans of doctorate recipients, by citizenship status andmajor field: 2004................................................................................................................................. 83
14. Percentage distribution of definite postgraduation plans of doctorate recipients,by citizenship status and major field: 2004 ........................................................................................ 85
15. Definite postgraduation plans of U.S. citizen and permanent resident doctorate recipients,by sex and major field: 2004 .............................................................................................................. 87
16. Percentage distribution of definite postgraduation plans of U.S. citizen and permanentresident doctorate recipients, by sex and major field: 2004 ............................................................... 89
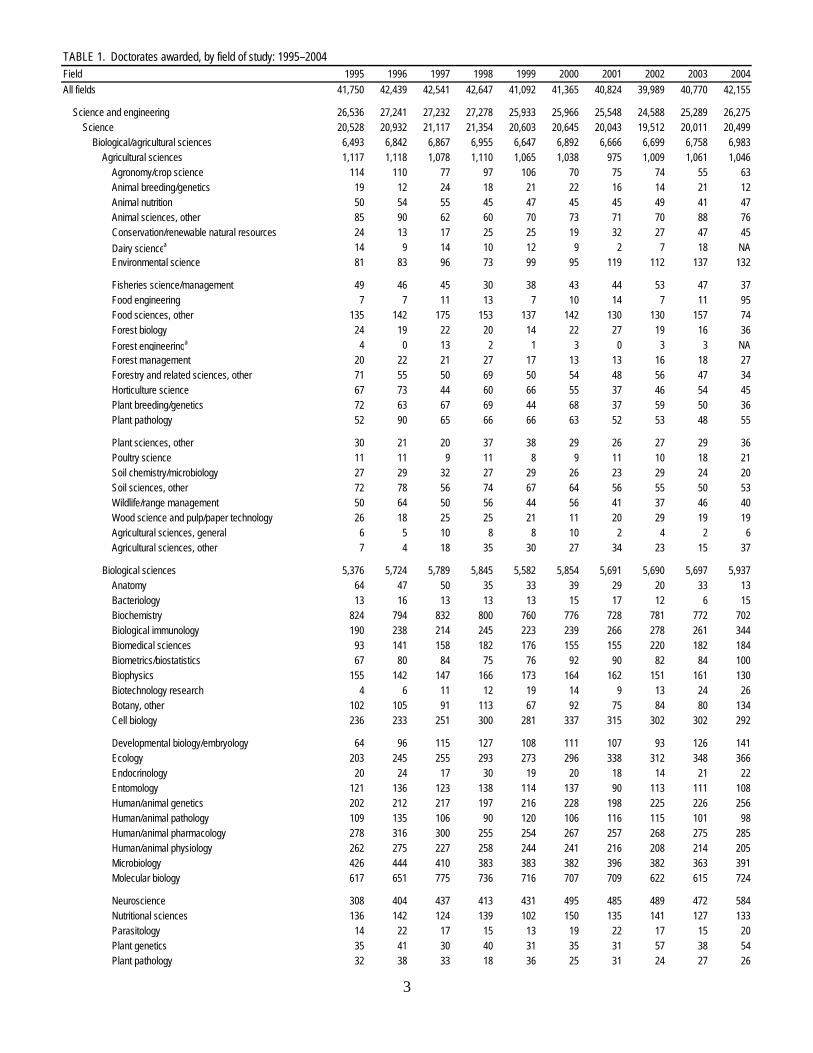
TABLE 1. Doctorates awarded, by field of study: 1995–2004Field 1995 1996 1997 1998 1999 2000 2001 2002 2003 2004All fields 41,750 42,439 42,541 42,647 41,092 41,365 40,824 39,989 40,770 42,155
Science and engineering 26,536 27,241 27,232 27,278 25,933 25,966 25,548 24,588 25,289 26,275 Science 20,528 20,932 21,117 21,354 20,603 20,645 20,043 19,512 20,011 20,499 Biological/agricultural sciences 6,493 6,842 6,867 6,955 6,647 6,892 6,666 6,699 6,758 6,983 Agricultural sciences 1,117 1,118 1,078 1,110 1,065 1,038 975 1,009 1,061 1,046 Agronomy/crop science 114 110 77 97 106 70 75 74 55 63 Animal breeding/genetics 19 12 24 18 21 22 16 14 21 12 Animal nutrition 50 54 55 45 47 45 45 49 41 47 Animal sciences, other 85 90 62 60 70 73 71 70 88 76 Conservation/renewable natural resources 24 13 17 25 25 19 32 27 47 45 Dairy sciencea 14 9 14 10 12 9 2 7 18 NA Environmental science 81 83 96 73 99 95 119 112 137 132
Fisheries science/management 49 46 45 30 38 43 44 53 47 37 Food engineering 7 7 11 13 7 10 14 7 11 95 Food sciences, other 135 142 175 153 137 142 130 130 157 74 Forest biology 24 19 22 20 14 22 27 19 16 36 Forest engineeringa 4 0 13 2 1 3 0 3 3 NA Forest management 20 22 21 27 17 13 13 16 18 27 Forestry and related sciences, other 71 55 50 69 50 54 48 56 47 34 Horticulture science 67 73 44 60 66 55 37 46 54 45 Plant breeding/genetics 72 63 67 69 44 68 37 59 50 36 Plant pathology 52 90 65 66 66 63 52 53 48 55
Plant sciences, other 30 21 20 37 38 29 26 27 29 36 Poultry science 11 11 9 11 8 9 11 10 18 21 Soil chemistry/microbiology 27 29 32 27 29 26 23 29 24 20 Soil sciences, other 72 78 56 74 67 64 56 55 50 53 Wildlife/range management 50 64 50 56 44 56 41 37 46 40 Wood science and pulp/paper technology 26 18 25 25 21 11 20 29 19 19 Agricultural sciences, general 6 5 10 8 8 10 2 4 2 6 Agricultural sciences, other 7 4 18 35 30 27 34 23 15 37
Biological sciences 5,376 5,724 5,789 5,845 5,582 5,854 5,691 5,690 5,697 5,937 Anatomy 64 47 50 35 33 39 29 20 33 13 Bacteriology 13 16 13 13 13 15 17 12 6 15 Biochemistry 824 794 832 800 760 776 728 781 772 702 Biological immunology 190 238 214 245 223 239 266 278 261 344 Biomedical sciences 93 141 158 182 176 155 155 220 182 184 Biometrics/biostatistics 67 80 84 75 76 92 90 82 84 100 Biophysics 155 142 147 166 173 164 162 151 161 130 Biotechnology research 4 6 11 12 19 14 9 13 24 26 Botany, other 102 105 91 113 67 92 75 84 80 134 Cell biology 236 233 251 300 281 337 315 302 302 292
Developmental biology/embryology 64 96 115 127 108 111 107 93 126 141 Ecology 203 245 255 293 273 296 338 312 348 366 Endocrinology 20 24 17 30 19 20 18 14 21 22 Entomology 121 136 123 138 114 137 90 113 111 108 Human/animal genetics 202 212 217 197 216 228 198 225 226 256 Human/animal pathology 109 135 106 90 120 106 116 115 101 98 Human/animal pharmacology 278 316 300 255 254 267 257 268 275 285 Human/animal physiology 262 275 227 258 244 241 216 208 214 205 Microbiology 426 444 410 383 383 382 396 382 363 391 Molecular biology 617 651 775 736 716 707 709 622 615 724
Neuroscience 308 404 437 413 431 495 485 489 472 584 Nutritional sciences 136 142 124 139 102 150 135 141 127 133 Parasitology 14 22 17 15 13 19 22 17 15 20 Plant genetics 35 41 30 40 31 35 31 57 38 54 Plant pathology 32 38 33 18 36 25 31 24 27 26
3
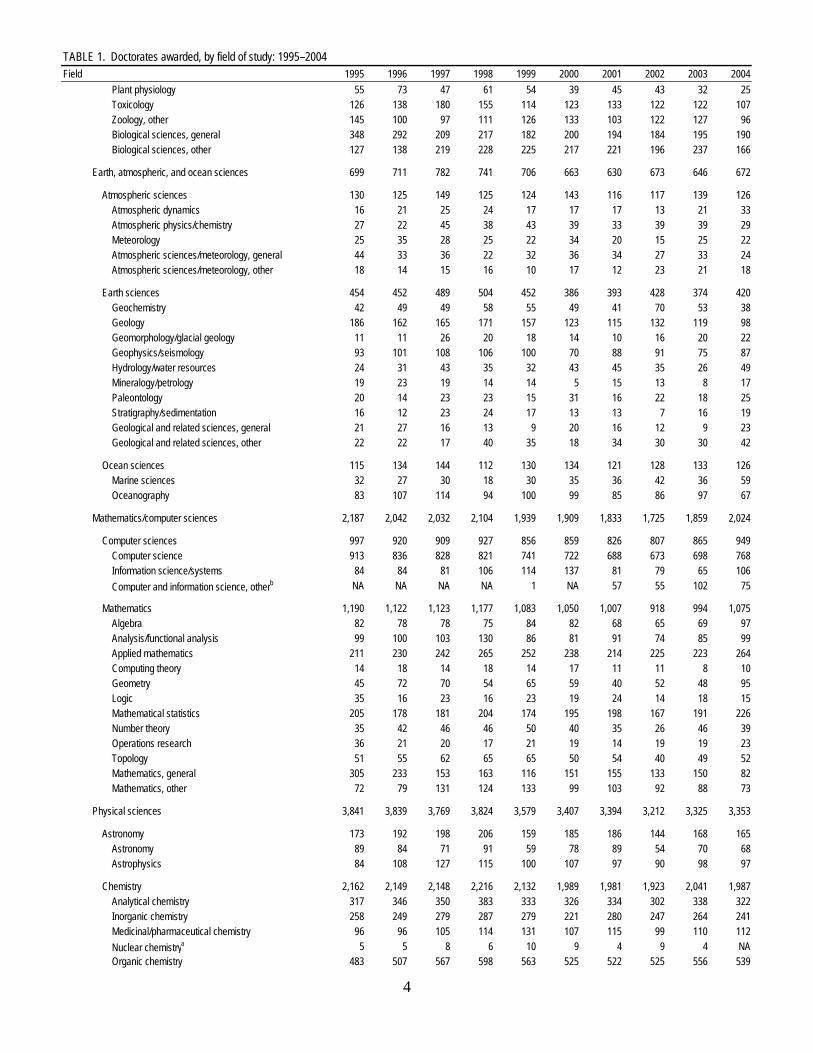
TABLE 1. Doctorates awarded, by field of study: 1995–2004Field 1995 1996 1997 1998 1999 2000 2001 2002 2003 2004 Plant physiology 55 73 47 61 54 39 45 43 32 25 Toxicology 126 138 180 155 114 123 133 122 122 107 Zoology, other 145 100 97 111 126 133 103 122 127 96 Biological sciences, general 348 292 209 217 182 200 194 184 195 190 Biological sciences, other 127 138 219 228 225 217 221 196 237 166
Earth, atmospheric, and ocean sciences 699 711 782 741 706 663 630 673 646 672
Atmospheric sciences 130 125 149 125 124 143 116 117 139 126 Atmospheric dynamics 16 21 25 24 17 17 17 13 21 33 Atmospheric physics/chemistry 27 22 45 38 43 39 33 39 39 29 Meteorology 25 35 28 25 22 34 20 15 25 22 Atmospheric sciences/meteorology, general 44 33 36 22 32 36 34 27 33 24 Atmospheric sciences/meteorology, other 18 14 15 16 10 17 12 23 21 18
Earth sciences 454 452 489 504 452 386 393 428 374 420 Geochemistry 42 49 49 58 55 49 41 70 53 38 Geology 186 162 165 171 157 123 115 132 119 98 Geomorphology/glacial geology 11 11 26 20 18 14 10 16 20 22 Geophysics/seismology 93 101 108 106 100 70 88 91 75 87 Hydrology/water resources 24 31 43 35 32 43 45 35 26 49 Mineralogy/petrology 19 23 19 14 14 5 15 13 8 17 Paleontology 20 14 23 23 15 31 16 22 18 25 Stratigraphy/sedimentation 16 12 23 24 17 13 13 7 16 19 Geological and related sciences, general 21 27 16 13 9 20 16 12 9 23 Geological and related sciences, other 22 22 17 40 35 18 34 30 30 42
Ocean sciences 115 134 144 112 130 134 121 128 133 126 Marine sciences 32 27 30 18 30 35 36 42 36 59 Oceanography 83 107 114 94 100 99 85 86 97 67
Mathematics/computer sciences 2,187 2,042 2,032 2,104 1,939 1,909 1,833 1,725 1,859 2,024
Computer sciences 997 920 909 927 856 859 826 807 865 949 Computer science 913 836 828 821 741 722 688 673 698 768 Information science/systems 84 84 81 106 114 137 81 79 65 106 Computer and information science, otherb NA NA NA NA 1 NA 57 55 102 75
Mathematics 1,190 1,122 1,123 1,177 1,083 1,050 1,007 918 994 1,075 Algebra 82 78 78 75 84 82 68 65 69 97 Analysis/functional analysis 99 100 103 130 86 81 91 74 85 99 Applied mathematics 211 230 242 265 252 238 214 225 223 264 Computing theory 14 18 14 18 14 17 11 11 8 10 Geometry 45 72 70 54 65 59 40 52 48 95 Logic 35 16 23 16 23 19 24 14 18 15 Mathematical statistics 205 178 181 204 174 195 198 167 191 226 Number theory 35 42 46 46 50 40 35 26 46 39 Operations research 36 21 20 17 21 19 14 19 19 23 Topology 51 55 62 65 65 50 54 40 49 52 Mathematics, general 305 233 153 163 116 151 155 133 150 82 Mathematics, other 72 79 131 124 133 99 103 92 88 73
Physical sciences 3,841 3,839 3,769 3,824 3,579 3,407 3,394 3,212 3,325 3,353
Astronomy 173 192 198 206 159 185 186 144 168 165 Astronomy 89 84 71 91 59 78 89 54 70 68 Astrophysics 84 108 127 115 100 107 97 90 98 97
Chemistry 2,162 2,149 2,148 2,216 2,132 1,989 1,981 1,923 2,041 1,987 Analytical chemistry 317 346 350 383 333 326 334 302 338 322 Inorganic chemistry 258 249 279 287 279 221 280 247 264 241 Medicinal/pharmaceutical chemistry 96 96 105 114 131 107 115 99 110 112 Nuclear chemistrya 5 5 8 6 10 9 4 9 4 NA Organic chemistry 483 507 567 598 563 525 522 525 556 539
4
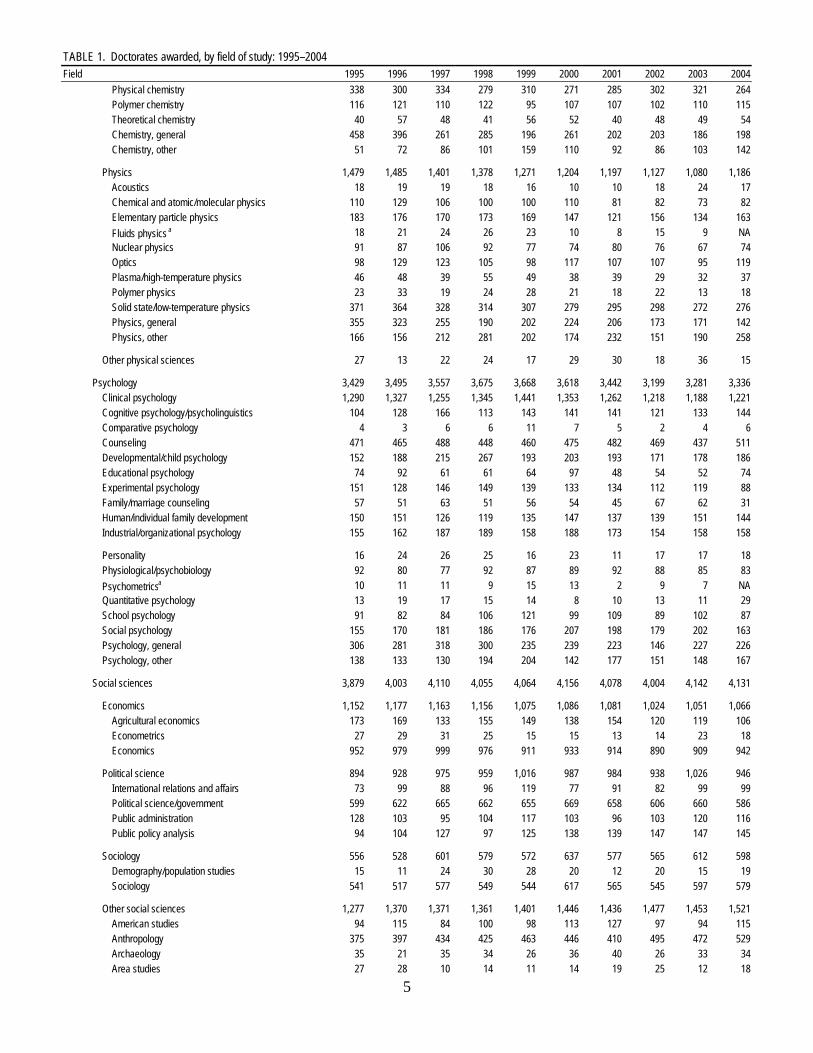
TABLE 1. Doctorates awarded, by field of study: 1995–2004Field 1995 1996 1997 1998 1999 2000 2001 2002 2003 2004 Physical chemistry 338 300 334 279 310 271 285 302 321 264 Polymer chemistry 116 121 110 122 95 107 107 102 110 115 Theoretical chemistry 40 57 48 41 56 52 40 48 49 54 Chemistry, general 458 396 261 285 196 261 202 203 186 198 Chemistry, other 51 72 86 101 159 110 92 86 103 142
Physics 1,479 1,485 1,401 1,378 1,271 1,204 1,197 1,127 1,080 1,186 Acoustics 18 19 19 18 16 10 10 18 24 17 Chemical and atomic/molecular physics 110 129 106 100 100 110 81 82 73 82 Elementary particle physics 183 176 170 173 169 147 121 156 134 163 Fluids physics a 18 21 24 26 23 10 8 15 9 NA Nuclear physics 91 87 106 92 77 74 80 76 67 74 Optics 98 129 123 105 98 117 107 107 95 119 Plasma/high-temperature physics 46 48 39 55 49 38 39 29 32 37 Polymer physics 23 33 19 24 28 21 18 22 13 18 Solid state/low-temperature physics 371 364 328 314 307 279 295 298 272 276 Physics, general 355 323 255 190 202 224 206 173 171 142 Physics, other 166 156 212 281 202 174 232 151 190 258
Other physical sciences 27 13 22 24 17 29 30 18 36 15
Psychology 3,429 3,495 3,557 3,675 3,668 3,618 3,442 3,199 3,281 3,336 Clinical psychology 1,290 1,327 1,255 1,345 1,441 1,353 1,262 1,218 1,188 1,221 Cognitive psychology/psycholinguistics 104 128 166 113 143 141 141 121 133 144 Comparative psychology 4 3 6 6 11 7 5 2 4 6 Counseling 471 465 488 448 460 475 482 469 437 511 Developmental/child psychology 152 188 215 267 193 203 193 171 178 186 Educational psychology 74 92 61 61 64 97 48 54 52 74 Experimental psychology 151 128 146 149 139 133 134 112 119 88 Family/marriage counseling 57 51 63 51 56 54 45 67 62 31 Human/individual family development 150 151 126 119 135 147 137 139 151 144 Industrial/organizational psychology 155 162 187 189 158 188 173 154 158 158
Personality 16 24 26 25 16 23 11 17 17 18 Physiological/psychobiology 92 80 77 92 87 89 92 88 85 83 Psychometricsa 10 11 11 9 15 13 2 9 7 NA Quantitative psychology 13 19 17 15 14 8 10 13 11 29 School psychology 91 82 84 106 121 99 109 89 102 87 Social psychology 155 170 181 186 176 207 198 179 202 163 Psychology, general 306 281 318 300 235 239 223 146 227 226 Psychology, other 138 133 130 194 204 142 177 151 148 167
Social sciences 3,879 4,003 4,110 4,055 4,064 4,156 4,078 4,004 4,142 4,131
Economics 1,152 1,177 1,163 1,156 1,075 1,086 1,081 1,024 1,051 1,066 Agricultural economics 173 169 133 155 149 138 154 120 119 106 Econometrics 27 29 31 25 15 15 13 14 23 18 Economics 952 979 999 976 911 933 914 890 909 942
Political science 894 928 975 959 1,016 987 984 938 1,026 946 International relations and affairs 73 99 88 96 119 77 91 82 99 99 Political science/government 599 622 665 662 655 669 658 606 660 586 Public administration 128 103 95 104 117 103 96 103 120 116 Public policy analysis 94 104 127 97 125 138 139 147 147 145
Sociology 556 528 601 579 572 637 577 565 612 598 Demography/population studies 15 11 24 30 28 20 12 20 15 19 Sociology 541 517 577 549 544 617 565 545 597 579
Other social sciences 1,277 1,370 1,371 1,361 1,401 1,446 1,436 1,477 1,453 1,521 American studies 94 115 84 100 98 113 127 97 94 115 Anthropology 375 397 434 425 463 446 410 495 472 529 Archaeology 35 21 35 34 26 36 40 26 33 34 Area studies 27 28 10 14 11 14 19 25 12 18
5

TABLE 1. Doctorates awarded, by field of study: 1995–2004Field 1995 1996 1997 1998 1999 2000 2001 2002 2003 2004 Criminology 44 60 49 55 51 66 62 56 76 69 Geography 150 165 149 154 144 197 186 197 168 192 History/philosophy of science and technology 41 37 35 44 50 42 40 46 46 48 Linguistics 201 230 244 220 251 230 230 195 225 253 Statistics 48 48 56 61 72 60 49 54 48 31 Urban affairs and studies 103 108 92 77 57 79 80 92 78 84 Social sciences, general 35 26 26 30 25 37 25 33 28 32 Social sciences, other 124 135 157 147 153 126 168 161 173 116
Engineering 6,008 6,309 6,115 5,924 5,330 5,321 5,505 5,076 5,278 5,776 Aeronautical/astronautical engineering 252 287 273 241 206 214 203 209 200 201 Chemical engineering 708 798 767 776 674 725 729 705 648 723 Chemical engineering 602 681 662 669 576 618 635 607 567 635 Petroleum engineering 48 52 51 48 45 45 37 45 36 34 Polymer/plastics engineering 58 65 54 59 53 62 57 53 45 54 Civil engineering 656 698 655 650 584 556 594 626 674 675 Civil engineering 572 600 592 587 506 480 500 539 552 547 Environmental health 84 98 63 63 78 76 94 87 122 128
Electrical engineering 1,731 1,741 1,720 1,596 1,478 1,544 1,576 1,395 1,466 1,649 Communications 29 32 33 40 39 42 47 22 36 34 Computer engineering 189 208 227 210 203 172 186 164 192 227 Electrical/electronics engineering 1,513 1,501 1,460 1,346 1,236 1,330 1,343 1,209 1,238 1,388 Industrial/manufacturing engineering 284 259 246 229 211 176 206 230 213 217 Materials/metallurgical engineering 588 574 582 565 469 451 497 396 474 509 Ceramic sciences 39 41 39 24 33 22 17 13 18 14 Materials science 476 472 483 482 393 404 448 364 437 473 Metallurgical engineering 73 61 60 59 43 25 32 19 19 22
Mechanical engineering 1,025 1,052 1,022 1,022 855 864 953 827 814 853 Engineering mechanics 108 105 93 86 68 57 75 56 63 98 Mechanical engineering 917 947 929 936 787 807 878 771 751 755 Other engineering 764 900 850 845 853 791 747 688 789 949 Agricultural engineering 73 104 79 74 59 60 52 50 54 60 Bioengineering/biomedical engineering 189 220 211 208 245 252 232 246 280 369 Engineering physics 17 37 24 15 28 26 22 16 28 28 Engineering science 56 52 45 49 49 34 53 31 39 61 Mining/mineral engineering 19 31 33 21 18 10 10 8 14 9 Nuclear engineering 105 113 103 96 76 98 75 64 75 59 Ocean engineering 21 26 34 29 16 18 28 23 12 21
Operations research 48 74 74 62 67 51 55 66 80 72 Systems engineering 47 47 49 68 42 34 47 45 45 58 Engineering, general 60 60 51 29 40 42 25 19 19 29 Engineering, other 129 136 147 194 213 166 148 120 143 183
Non-science and engineering 15,214 15,198 15,309 15,369 15,159 15,399 15,276 15,401 15,481 15,880 Education 6,650 6,785 6,574 6,571 6,546 6,430 6,337 6,487 6,632 6,635 Health 1,329 1,324 1,421 1,500 1,407 1,592 1,622 1,653 1,636 1,730 Humanities 4,691 4,712 5,034 5,116 5,034 5,213 5,161 5,010 5,015 5,017 Professional/other/unknown 2,544 2,377 2,280 2,182 2,172 2,164 2,156 2,251 2,198 2,498
NA = not available (i.e., subfield was not identified separately in questionnaire for that year).
a This subfield dropped in 2004.b This subfield introduced in 2001.
SOURCE: National Science Foundation/Division of Science Resources Statistics, Survey of Earned Doctorates.
NOTE: Categories are grouped differently from questionnaire and summary reports in that linguistics, history of science, American studies, and archaeology are included in social science and not in humanities, and public administration is included in social science and not in professional fields.
6
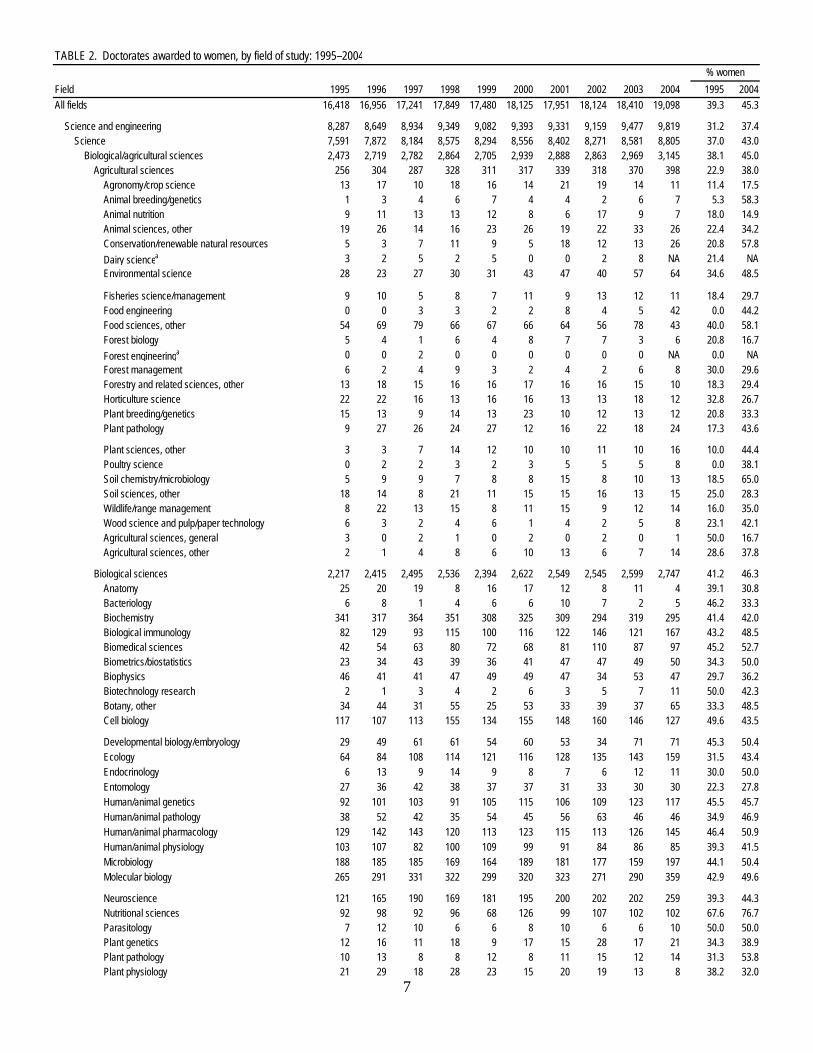
TABLE 2. Doctorates awarded to women, by field of study: 1995–2004
Field 1995 1996 1997 1998 1999 2000 2001 2002 2003 2004 1995 2004All fields 16,418 16,956 17,241 17,849 17,480 18,125 17,951 18,124 18,410 19,098 39.3 45.3
Science and engineering 8,287 8,649 8,934 9,349 9,082 9,393 9,331 9,159 9,477 9,819 31.2 37.4 Science 7,591 7,872 8,184 8,575 8,294 8,556 8,402 8,271 8,581 8,805 37.0 43.0 Biological/agricultural sciences 2,473 2,719 2,782 2,864 2,705 2,939 2,888 2,863 2,969 3,145 38.1 45.0 Agricultural sciences 256 304 287 328 311 317 339 318 370 398 22.9 38.0 Agronomy/crop science 13 17 10 18 16 14 21 19 14 11 11.4 17.5 Animal breeding/genetics 1 3 4 6 7 4 4 2 6 7 5.3 58.3 Animal nutrition 9 11 13 13 12 8 6 17 9 7 18.0 14.9 Animal sciences, other 19 26 14 16 23 26 19 22 33 26 22.4 34.2 Conservation/renewable natural resources 5 3 7 11 9 5 18 12 13 26 20.8 57.8 Dairy sciencea 3 2 5 2 5 0 0 2 8 NA 21.4 NA Environmental science 28 23 27 30 31 43 47 40 57 64 34.6 48.5
Fisheries science/management 9 10 5 8 7 11 9 13 12 11 18.4 29.7 Food engineering 0 0 3 3 2 2 8 4 5 42 0.0 44.2 Food sciences, other 54 69 79 66 67 66 64 56 78 43 40.0 58.1 Forest biology 5 4 1 6 4 8 7 7 3 6 20.8 16.7 Forest engineeringa 0 0 2 0 0 0 0 0 0 NA 0.0 NA Forest management 6 2 4 9 3 2 4 2 6 8 30.0 29.6 Forestry and related sciences, other 13 18 15 16 16 17 16 16 15 10 18.3 29.4 Horticulture science 22 22 16 13 16 16 13 13 18 12 32.8 26.7 Plant breeding/genetics 15 13 9 14 13 23 10 12 13 12 20.8 33.3 Plant pathology 9 27 26 24 27 12 16 22 18 24 17.3 43.6
NA NA NA NA NA NA NA NA NA Plant sciences, other 3 3 7 14 12 10 10 11 10 16 10.0 44.4 Poultry science 0 2 2 3 2 3 5 5 5 8 0.0 38.1 Soil chemistry/microbiology 5 9 9 7 8 8 15 8 10 13 18.5 65.0 Soil sciences, other 18 14 8 21 11 15 15 16 13 15 25.0 28.3 Wildlife/range management 8 22 13 15 8 11 15 9 12 14 16.0 35.0 Wood science and pulp/paper technology 6 3 2 4 6 1 4 2 5 8 23.1 42.1 Agricultural sciences, general 3 0 2 1 0 2 0 2 0 1 50.0 16.7 Agricultural sciences, other 2 1 4 8 6 10 13 6 7 14 28.6 37.8
Biological sciences 2,217 2,415 2,495 2,536 2,394 2,622 2,549 2,545 2,599 2,747 41.2 46.3 Anatomy 25 20 19 8 16 17 12 8 11 4 39.1 30.8 Bacteriology 6 8 1 4 6 6 10 7 2 5 46.2 33.3 Biochemistry 341 317 364 351 308 325 309 294 319 295 41.4 42.0 Biological immunology 82 129 93 115 100 116 122 146 121 167 43.2 48.5 Biomedical sciences 42 54 63 80 72 68 81 110 87 97 45.2 52.7 Biometrics/biostatistics 23 34 43 39 36 41 47 47 49 50 34.3 50.0 Biophysics 46 41 41 47 49 49 47 34 53 47 29.7 36.2 Biotechnology research 2 1 3 4 2 6 3 5 7 11 50.0 42.3 Botany, other 34 44 31 55 25 53 33 39 37 65 33.3 48.5 Cell biology 117 107 113 155 134 155 148 160 146 127 49.6 43.5
Developmental biology/embryology 29 49 61 61 54 60 53 34 71 71 45.3 50.4 Ecology 64 84 108 114 121 116 128 135 143 159 31.5 43.4 Endocrinology 6 13 9 14 9 8 7 6 12 11 30.0 50.0 Entomology 27 36 42 38 37 37 31 33 30 30 22.3 27.8 Human/animal genetics 92 101 103 91 105 115 106 109 123 117 45.5 45.7 Human/animal pathology 38 52 42 35 54 45 56 63 46 46 34.9 46.9 Human/animal pharmacology 129 142 143 120 113 123 115 113 126 145 46.4 50.9 Human/animal physiology 103 107 82 100 109 99 91 84 86 85 39.3 41.5 Microbiology 188 185 185 169 164 189 181 177 159 197 44.1 50.4 Molecular biology 265 291 331 322 299 320 323 271 290 359 42.9 49.6
Neuroscience 121 165 190 169 181 195 200 202 202 259 39.3 44.3 Nutritional sciences 92 98 92 96 68 126 99 107 102 102 67.6 76.7 Parasitology 7 12 10 6 6 8 10 6 6 10 50.0 50.0 Plant genetics 12 16 11 18 9 17 15 28 17 21 34.3 38.9 Plant pathology 10 13 8 8 12 8 11 15 12 14 31.3 53.8 Plant physiology 21 29 18 28 23 15 20 19 13 8 38.2 32.0
% women
7
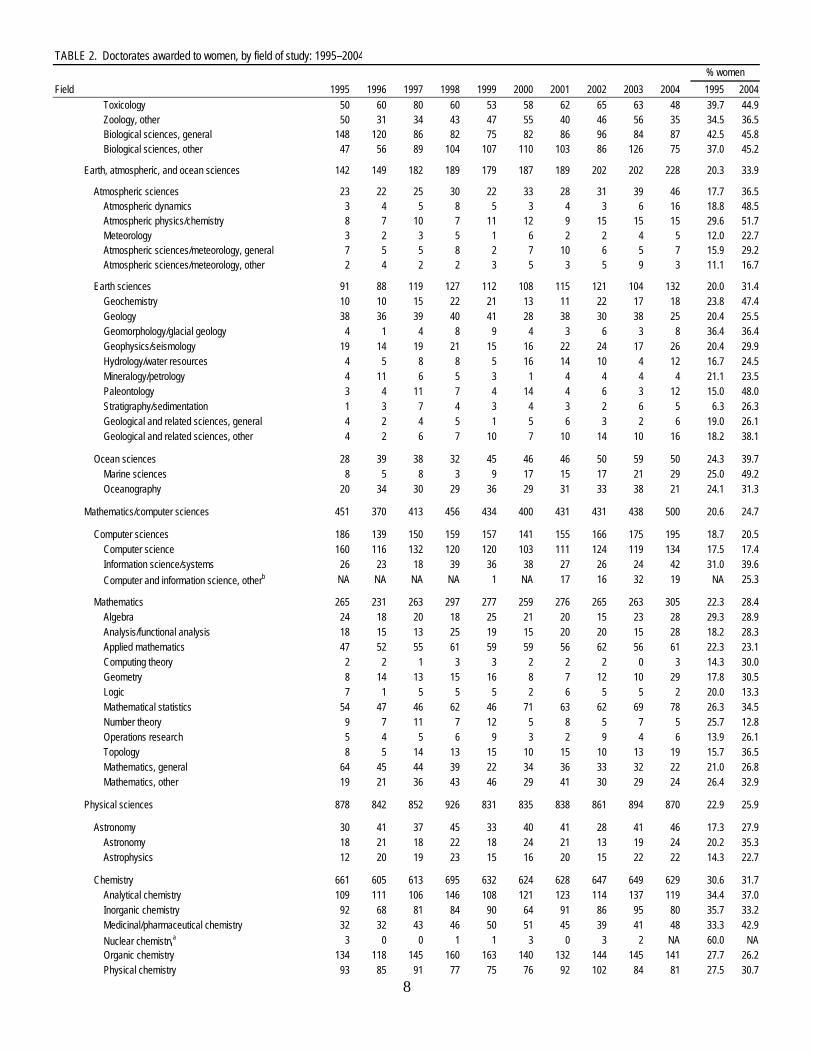
TABLE 2. Doctorates awarded to women, by field of study: 1995–2004
Field 1995 1996 1997 1998 1999 2000 2001 2002 2003 2004 1995 2004% women
Toxicology 50 60 80 60 53 58 62 65 63 48 39.7 44.9 Zoology, other 50 31 34 43 47 55 40 46 56 35 34.5 36.5 Biological sciences, general 148 120 86 82 75 82 86 96 84 87 42.5 45.8 Biological sciences, other 47 56 89 104 107 110 103 86 126 75 37.0 45.2
Earth, atmospheric, and ocean sciences 142 149 182 189 179 187 189 202 202 228 20.3 33.9
Atmospheric sciences 23 22 25 30 22 33 28 31 39 46 17.7 36.5 Atmospheric dynamics 3 4 5 8 5 3 4 3 6 16 18.8 48.5 Atmospheric physics/chemistry 8 7 10 7 11 12 9 15 15 15 29.6 51.7 Meteorology 3 2 3 5 1 6 2 2 4 5 12.0 22.7 Atmospheric sciences/meteorology, general 7 5 5 8 2 7 10 6 5 7 15.9 29.2 Atmospheric sciences/meteorology, other 2 4 2 2 3 5 3 5 9 3 11.1 16.7
Earth sciences 91 88 119 127 112 108 115 121 104 132 20.0 31.4 Geochemistry 10 10 15 22 21 13 11 22 17 18 23.8 47.4 Geology 38 36 39 40 41 28 38 30 38 25 20.4 25.5 Geomorphology/glacial geology 4 1 4 8 9 4 3 6 3 8 36.4 36.4 Geophysics/seismology 19 14 19 21 15 16 22 24 17 26 20.4 29.9 Hydrology/water resources 4 5 8 8 5 16 14 10 4 12 16.7 24.5 Mineralogy/petrology 4 11 6 5 3 1 4 4 4 4 21.1 23.5 Paleontology 3 4 11 7 4 14 4 6 3 12 15.0 48.0 Stratigraphy/sedimentation 1 3 7 4 3 4 3 2 6 5 6.3 26.3 Geological and related sciences, general 4 2 4 5 1 5 6 3 2 6 19.0 26.1 Geological and related sciences, other 4 2 6 7 10 7 10 14 10 16 18.2 38.1
Ocean sciences 28 39 38 32 45 46 46 50 59 50 24.3 39.7 Marine sciences 8 5 8 3 9 17 15 17 21 29 25.0 49.2 Oceanography 20 34 30 29 36 29 31 33 38 21 24.1 31.3
Mathematics/computer sciences 451 370 413 456 434 400 431 431 438 500 20.6 24.7
Computer sciences 186 139 150 159 157 141 155 166 175 195 18.7 20.5 Computer science 160 116 132 120 120 103 111 124 119 134 17.5 17.4 Information science/systems 26 23 18 39 36 38 27 26 24 42 31.0 39.6 Computer and information science, otherb NA NA NA NA 1 NA 17 16 32 19 NA 25.3
Mathematics 265 231 263 297 277 259 276 265 263 305 22.3 28.4 Algebra 24 18 20 18 25 21 20 15 23 28 29.3 28.9 Analysis/functional analysis 18 15 13 25 19 15 20 20 15 28 18.2 28.3 Applied mathematics 47 52 55 61 59 59 56 62 56 61 22.3 23.1 Computing theory 2 2 1 3 3 2 2 2 0 3 14.3 30.0 Geometry 8 14 13 15 16 8 7 12 10 29 17.8 30.5 Logic 7 1 5 5 5 2 6 5 5 2 20.0 13.3 Mathematical statistics 54 47 46 62 46 71 63 62 69 78 26.3 34.5 Number theory 9 7 11 7 12 5 8 5 7 5 25.7 12.8 Operations research 5 4 5 6 9 3 2 9 4 6 13.9 26.1 Topology 8 5 14 13 15 10 15 10 13 19 15.7 36.5 Mathematics, general 64 45 44 39 22 34 36 33 32 22 21.0 26.8 Mathematics, other 19 21 36 43 46 29 41 30 29 24 26.4 32.9
Physical sciences 878 842 852 926 831 835 838 861 894 870 22.9 25.9
Astronomy 30 41 37 45 33 40 41 28 41 46 17.3 27.9 Astronomy 18 21 18 22 18 24 21 13 19 24 20.2 35.3 Astrophysics 12 20 19 23 15 16 20 15 22 22 14.3 22.7
Chemistry 661 605 613 695 632 624 628 647 649 629 30.6 31.7 Analytical chemistry 109 111 106 146 108 121 123 114 137 119 34.4 37.0 Inorganic chemistry 92 68 81 84 90 64 91 86 95 80 35.7 33.2 Medicinal/pharmaceutical chemistry 32 32 43 46 50 51 45 39 41 48 33.3 42.9 Nuclear chemistrya 3 0 0 1 1 3 0 3 2 NA 60.0 NA Organic chemistry 134 118 145 160 163 140 132 144 145 141 27.7 26.2 Physical chemistry 93 85 91 77 75 76 92 102 84 81 27.5 30.7
8

TABLE 2. Doctorates awarded to women, by field of study: 1995–2004
Field 1995 1996 1997 1998 1999 2000 2001 2002 2003 2004 1995 2004% women
Polymer chemistry 28 30 25 40 31 31 33 35 25 40 24.1 34.8 Theoretical chemistry 10 14 11 10 9 12 6 17 12 16 25.0 29.6 Chemistry, general 135 119 76 88 52 81 72 61 68 55 29.5 27.8 Chemistry, other 25 28 35 43 53 45 34 46 40 49 49.0 34.5
Physics 182 193 193 177 160 163 160 177 193 184 12.3 15.5 Acoustics 3 2 4 6 1 1 1 1 5 1 16.7 5.9 Chemical and atomic/molecular physics 15 10 11 13 14 21 7 11 14 11 13.6 13.4 Elementary particle physics 7 19 21 11 17 15 9 28 15 20 3.8 12.3 Fluids physicsa 0 4 0 0 2 0 1 2 0 NA 0.0 NA Nuclear physics 12 9 11 11 9 9 13 18 10 12 13.2 16.2 Optics 13 20 16 18 12 16 14 19 23 21 13.3 17.6 Plasma/high-temperature physics 5 2 2 2 2 0 3 3 2 4 10.9 10.8 Polymer physics 3 12 7 4 7 6 5 6 1 1 13.0 5.6 Solid state/low-temperature physics 57 54 51 37 42 42 32 48 48 41 15.4 14.9 Physics, general 41 39 36 29 22 31 23 21 25 29 11.5 20.4 Physics, other 26 22 34 46 32 22 52 20 50 44 15.7 17.1
Other physical sciences 5 3 9 9 6 8 9 9 11 11 18.5 73.3
Psychology 2,181 2,330 2,363 2,456 2,449 2,411 2,306 2,133 2,230 2,245 63.6 67.3 Clinical psychology 870 920 894 967 1,033 992 891 852 848 868 67.4 71.1 Cognitive psychology/psycholinguistics 52 60 75 50 70 66 76 67 70 76 50.0 52.8 Comparative psychology 1 2 3 4 7 2 1 1 2 4 25.0 66.7 Counseling 298 303 314 295 295 312 334 321 312 351 63.3 68.7 Developmental/child psychology 121 154 170 207 149 163 159 141 144 160 79.6 86.0 Educational psychology 53 66 45 39 44 63 31 38 42 53 71.6 71.6 Experimental psychology 83 68 70 65 65 59 72 63 65 45 55.0 51.1 Family/marriage counseling 37 28 43 28 38 29 22 35 42 19 64.9 61.3 Human/individual family development 118 121 101 91 112 103 97 95 111 92 78.7 63.9 Industrial/organizational psychology 89 99 103 110 99 113 105 85 86 85 57.4 53.8
Personality 9 11 13 15 11 14 6 12 11 10 56.3 55.6 Physiological/psychobiology 35 41 42 49 49 56 46 51 42 48 38.0 57.8 Psychometricsa 4 3 7 5 2 5 2 2 4 NA 40.0 NA Quantitative psychology 9 7 10 8 7 2 5 6 3 14 69.2 48.3 School psychology 62 71 66 81 89 78 90 68 72 73 68.1 83.9 Social psychology 84 111 116 117 115 135 107 104 129 109 54.2 66.9 Psychology, general 185 181 199 201 132 134 152 86 141 128 60.5 56.6 Psychology, other 71 84 92 124 132 85 110 106 106 110 51.4 65.9
Social sciences 1,466 1,462 1,592 1,684 1,696 1,784 1,750 1,781 1,848 1,817 37.8 44.0
Economics 279 263 266 312 291 293 306 281 302 311 24.2 29.2 Agricultural economics 42 37 34 40 39 38 46 32 40 29 24.3 27.4 Econometrics 4 8 4 4 5 3 2 2 6 3 14.8 16.7 Economics 233 218 228 268 247 252 258 247 256 279 24.5 29.6
Political science 265 305 298 364 356 365 330 394 397 344 29.6 36.4 International relations and affairs 21 32 19 32 38 26 31 34 27 39 28.8 39.4 Political science/government 166 186 197 243 216 235 214 252 251 195 27.7 33.3 Public administration 43 37 30 48 46 42 41 35 48 46 33.6 39.7 Public policy analysis 35 50 52 41 56 62 44 73 71 64 37.2 44.1
Sociology 295 276 334 317 342 376 337 345 361 351 53.1 58.7 Demography/population studies 6 2 16 13 17 10 8 12 9 13 40.0 68.4 Sociology 289 274 318 304 325 366 329 333 352 338 53.4 58.4
Other social sciences 627 618 694 691 707 750 777 761 788 811 49.1 53.3 American studies 53 67 47 52 56 63 87 56 66 67 56.4 58.3 Anthropology 219 214 241 239 263 252 244 289 288 292 58.4 55.2 Archaeology 18 11 20 23 12 24 19 15 20 18 51.4 52.9 Area studies 12 9 5 11 3 4 10 14 7 10 44.4 55.6
9

TABLE 2. Doctorates awarded to women, by field of study: 1995–2004
Field 1995 1996 1997 1998 1999 2000 2001 2002 2003 2004 1995 2004% women
Criminology 23 25 25 22 20 34 29 30 30 40 52.3 58.0 Geography 43 45 54 49 49 70 66 64 65 86 28.7 44.8 History/philosophy of science and technology 17 10 13 20 18 17 8 11 23 12 41.5 25.0 Linguistics 102 113 135 123 148 135 136 114 132 149 50.7 58.9 Statistics 11 7 23 21 21 22 22 23 19 15 22.9 48.4 Urban affairs and studies 37 39 29 26 17 28 33 35 32 33 35.9 39.3 Social sciences, general 23 15 14 17 14 20 20 17 11 20 65.7 62.5 Social sciences, other 69 63 88 88 86 81 103 93 95 69 55.6 59.5
Engineering 696 777 750 774 788 837 929 888 896 1,014 11.6 17.6 Aeronautical/astronautical engineering 14 24 16 15 17 21 28 24 27 24 5.6 11.9 Chemical engineering 109 143 122 140 123 151 180 176 154 173 15.4 23.9 Chemical engineering 96 126 106 119 101 130 156 150 140 150 15.9 23.6 Petroleum engineering 1 3 3 6 5 6 7 10 5 5 2.1 14.7 Polymer/plastics engineering 12 14 13 15 17 15 17 16 9 18 20.7 33.3 Civil engineering 76 79 80 100 89 88 111 120 125 132 11.6 19.6 Civil engineering 55 64 70 83 76 78 82 96 86 85 9.6 15.5 Environmental health 21 15 10 17 13 10 29 24 39 47 25.0 36.7
Electrical engineering 173 169 150 156 155 195 203 163 179 222 10.0 13.5 Communications 5 2 3 6 6 7 12 4 7 3 17.2 8.8 Computer engineering 18 23 21 22 32 31 33 16 27 30 9.5 13.2 Electrical/electronics engineering 150 144 126 128 117 157 158 143 145 189 9.9 13.6 Industrial/manufacturing engineering 50 51 40 40 42 35 45 67 53 42 17.6 19.4 Materials/metallurgical engineering 95 84 106 84 88 83 105 80 101 90 16.2 17.7 Ceramic sciences 5 3 8 2 9 8 3 1 1 1 12.8 7.1 Materials science 84 72 96 75 75 73 99 78 99 84 17.6 17.8 Metallurgical engineering 6 9 2 7 4 2 3 1 1 5 8.2 22.7
Mechanical engineering 64 78 88 93 96 96 91 96 84 95 6.2 11.1 Engineering mechanics 8 10 6 13 11 7 5 8 9 11 7.4 11.2 Mechanical engineering 56 68 82 80 85 89 86 88 75 84 6.1 11.1 Other engineering 115 149 148 146 178 168 166 162 173 236 15.1 24.9 Agricultural engineering 7 17 12 5 12 7 8 9 6 14 9.6 23.3 Bioengineering/biomedical engineering 48 49 54 51 63 71 69 69 78 111 25.4 30.1 Engineering physics 1 3 4 3 4 1 2 3 9 7 5.9 25.0 Engineering science 6 4 7 8 4 6 9 8 2 15 10.7 24.6 Mining/mineral engineering 0 3 3 4 2 0 2 0 1 2 0.0 22.2 Nuclear engineering 9 9 8 10 8 9 6 13 11 11 8.6 18.6 Ocean engineering 3 3 5 0 1 3 3 3 1 3 14.3 14.3
Operations research 8 16 15 15 16 11 17 13 19 11 16.7 15.3 Systems engineering 5 9 10 9 7 6 8 9 8 11 10.6 19.0 Engineering, general 9 11 3 3 4 10 4 6 4 6 15.0 20.7 Engineering, other 19 25 27 38 57 44 38 29 34 45 14.7 24.6
Non-science and engineering 8,131 8,307 8,307 8,500 8,398 8,732 8,620 8,965 8,933 9,279 53.4 58.4 Education 4,093 4,187 4,120 4,130 4,195 4,173 4,095 4,290 4,364 4,361 61.5 65.7 Health 843 860 936 1,006 899 1,066 1,033 1,123 1,087 1,180 63.4 68.2 Humanities 2,256 2,343 2,381 2,469 2,418 2,593 2,578 2,506 2,505 2,588 48.1 51.6 Professional/other/unknown 939 917 870 895 886 900 914 1,046 977 1,150 36.9 46.0
NA = not available (i.e., subfield was not identified separately in questionnaire for that year).
a This subfield dropped in 2004.b This subfield introduced in 2001.
SOURCE: National Science Foundation/Division of Science Resources Statistics, Survey of Earned Doctorates.
NOTE: Categories are grouped differently from questionnaire and summary reports in that linguistics, history of science, American studies, and archaeology are included in social science and not in humanities, and public administration is included in social science and not in professional fields.
10

TABLE 3. Doctorates awarded, by sex, citizenship status, and major field of study of recipients: 1995–2004Characteristic and field 1995 1996 1997 1998 1999 2000 2001 2002 2003 2004All fields 41,750 42,439 42,541 42,647 41,092 41,365 40,824 39,989 40,770 42,155
Science and engineering 26,536 27,241 27,232 27,278 25,933 25,966 25,548 24,588 25,289 26,275 Science 20,528 20,932 21,117 21,354 20,603 20,645 20,043 19,512 20,011 20,499 Agricultural sciences 1,117 1,118 1,078 1,110 1,065 1,038 975 1,009 1,061 1,046 Biological sciences 5,376 5,724 5,789 5,845 5,582 5,854 5,691 5,690 5,697 5,937 Computer sciences 997 920 909 927 856 859 826 807 865 949 Earth, atmospheric, and ocean sciences 699 711 782 741 706 663 630 673 646 672 Mathematics 1,190 1,122 1,123 1,177 1,083 1,050 1,007 918 994 1,075 Physical sciences 3,841 3,839 3,769 3,824 3,579 3,407 3,394 3,212 3,325 3,353 Astronomy 173 192 198 206 159 185 186 144 168 165 Chemistry 2,162 2,149 2,148 2,216 2,132 1,989 1,981 1,923 2,041 1,987 Physics 1,479 1,485 1,401 1,378 1,271 1,204 1,197 1,127 1,080 1,186 Other physical sciences 27 13 22 24 17 29 30 18 36 15 Psychology 3,429 3,495 3,557 3,675 3,668 3,618 3,442 3,199 3,281 3,336 Social sciences 3,879 4,003 4,110 4,055 4,064 4,156 4,078 4,004 4,142 4,131
Engineering 6,008 6,309 6,115 5,924 5,330 5,321 5,505 5,076 5,278 5,776 Aeronautical/astronautical engineering 252 287 273 241 206 214 203 209 200 201 Chemical engineering 708 798 767 776 674 725 729 705 648 723 Civil engineering 656 698 655 650 584 556 594 626 674 675 Electrical engineering 1,731 1,741 1,720 1,596 1,478 1,544 1,576 1,395 1,466 1,649 Industrial engineering 284 259 246 229 211 176 206 230 213 217 Materials/metallurgical engineering 588 574 582 565 469 451 497 396 474 509 Mechanical engineering 1,025 1,052 1,022 1,022 855 864 953 827 814 853 Other engineering 764 900 850 845 853 791 747 688 789 949
Non-science and engineering 15,214 15,198 15,309 15,369 15,159 15,399 15,276 15,401 15,481 15,880 Education 6,650 6,785 6,574 6,571 6,546 6,430 6,337 6,487 6,632 6,635 Health 1,329 1,324 1,421 1,500 1,407 1,592 1,622 1,653 1,636 1,730 Humanities 4,691 4,712 5,034 5,116 5,034 5,213 5,161 5,010 5,015 5,017 Professional/other/unknown 2,544 2,377 2,280 2,182 2,172 2,164 2,156 2,251 2,198 2,498
Male, all fields 25,161 25,286 24,943 24,633 23,434 23,166 22,793 21,771 22,201 22,976 Science and engineering 18,117 18,454 18,083 17,810 16,735 16,521 16,174 15,374 15,728 16,405 Science 12,847 12,966 12,767 12,699 12,231 12,062 11,607 11,203 11,375 11,655 Agricultural sciences 857 813 783 781 749 719 629 683 685 644 Biological sciences 3,132 3,287 3,262 3,294 3,171 3,226 3,133 3,143 3,085 3,181 Computer sciences 808 775 743 765 692 716 669 638 690 749 Earth, atmospheric, and ocean sciences 555 555 595 549 524 473 440 471 443 444 Mathematics 919 881 851 872 803 790 731 650 729 770 Physical sciences 2,944 2,970 2,893 2,879 2,733 2,567 2,551 2,346 2,420 2,476 Astronomy 143 151 161 161 126 145 145 116 127 119 Chemistry 1,488 1,526 1,523 1,509 1,493 1,361 1,349 1,275 1,386 1,352 Physics 1,291 1,283 1,196 1,195 1,103 1,040 1,036 946 882 1,001 Other physical sciences 22 10 13 14 11 21 21 9 25 4 Psychology 1,245 1,162 1,162 1,206 1,209 1,204 1,132 1,061 1,042 1,086 Social sciences 2,387 2,523 2,478 2,353 2,350 2,367 2,322 2,211 2,281 2,305
Engineering 5,270 5,488 5,316 5,111 4,504 4,459 4,567 4,171 4,353 4,750 Aeronautical/astronautical engineering 237 262 254 225 188 191 174 184 172 177 Chemical engineering 597 653 641 630 550 571 547 527 492 549 Civil engineering 575 616 571 544 495 466 482 504 545 541 Electrical engineering 1,545 1,556 1,560 1,429 1,310 1,339 1,372 1,224 1,279 1,421 Industrial engineering 231 208 205 188 169 140 160 162 156 174 Materials/metallurgical engineering 489 483 470 477 376 367 392 315 373 419 Mechanical engineering 954 963 928 922 751 767 860 729 726 758 Other engineering 642 747 687 696 665 618 580 526 610 711
Non-science and engineering 7,044 6,832 6,860 6,823 6,699 6,645 6,619 6,397 6,473 6,571 Education 2,547 2,579 2,394 2,424 2,334 2,254 2,237 2,186 2,240 2,266 Health 477 456 469 489 499 523 576 529 540 544
11
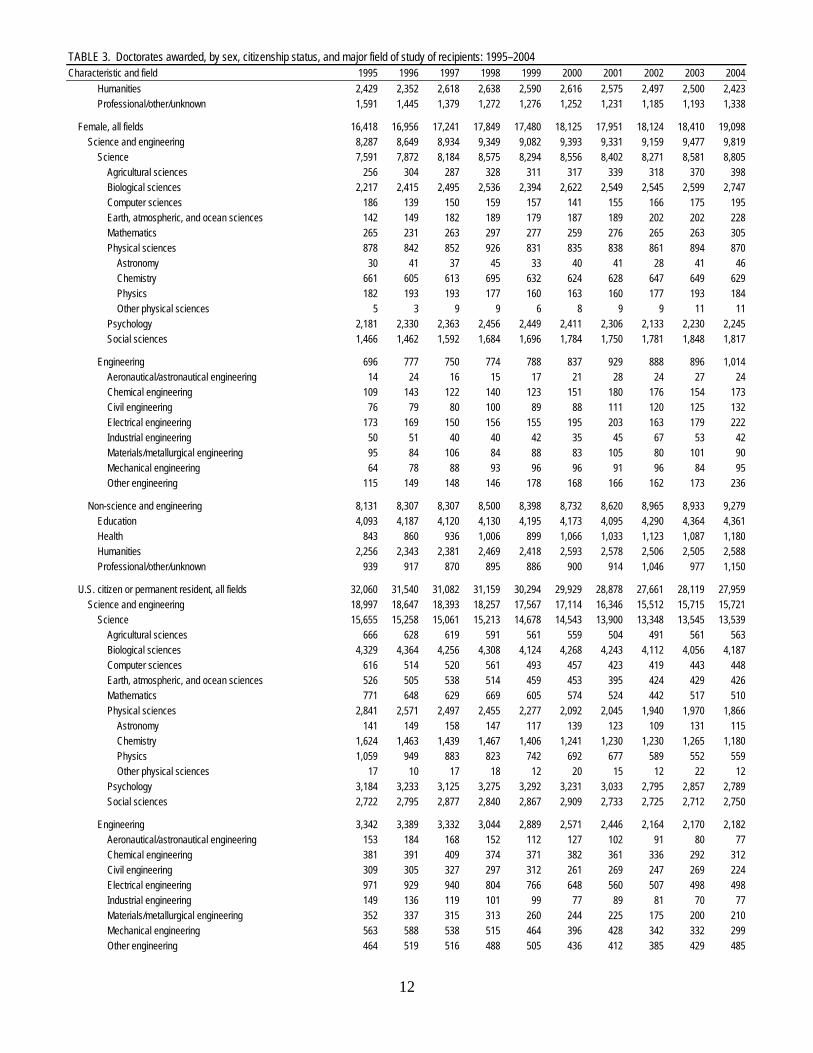
TABLE 3. Doctorates awarded, by sex, citizenship status, and major field of study of recipients: 1995–2004Characteristic and field 1995 1996 1997 1998 1999 2000 2001 2002 2003 2004 Humanities 2,429 2,352 2,618 2,638 2,590 2,616 2,575 2,497 2,500 2,423 Professional/other/unknown 1,591 1,445 1,379 1,272 1,276 1,252 1,231 1,185 1,193 1,338
Female, all fields 16,418 16,956 17,241 17,849 17,480 18,125 17,951 18,124 18,410 19,098 Science and engineering 8,287 8,649 8,934 9,349 9,082 9,393 9,331 9,159 9,477 9,819 Science 7,591 7,872 8,184 8,575 8,294 8,556 8,402 8,271 8,581 8,805 Agricultural sciences 256 304 287 328 311 317 339 318 370 398 Biological sciences 2,217 2,415 2,495 2,536 2,394 2,622 2,549 2,545 2,599 2,747 Computer sciences 186 139 150 159 157 141 155 166 175 195 Earth, atmospheric, and ocean sciences 142 149 182 189 179 187 189 202 202 228 Mathematics 265 231 263 297 277 259 276 265 263 305 Physical sciences 878 842 852 926 831 835 838 861 894 870 Astronomy 30 41 37 45 33 40 41 28 41 46 Chemistry 661 605 613 695 632 624 628 647 649 629 Physics 182 193 193 177 160 163 160 177 193 184 Other physical sciences 5 3 9 9 6 8 9 9 11 11 Psychology 2,181 2,330 2,363 2,456 2,449 2,411 2,306 2,133 2,230 2,245 Social sciences 1,466 1,462 1,592 1,684 1,696 1,784 1,750 1,781 1,848 1,817
Engineering 696 777 750 774 788 837 929 888 896 1,014 Aeronautical/astronautical engineering 14 24 16 15 17 21 28 24 27 24 Chemical engineering 109 143 122 140 123 151 180 176 154 173 Civil engineering 76 79 80 100 89 88 111 120 125 132 Electrical engineering 173 169 150 156 155 195 203 163 179 222 Industrial engineering 50 51 40 40 42 35 45 67 53 42 Materials/metallurgical engineering 95 84 106 84 88 83 105 80 101 90 Mechanical engineering 64 78 88 93 96 96 91 96 84 95 Other engineering 115 149 148 146 178 168 166 162 173 236
Non-science and engineering 8,131 8,307 8,307 8,500 8,398 8,732 8,620 8,965 8,933 9,279 Education 4,093 4,187 4,120 4,130 4,195 4,173 4,095 4,290 4,364 4,361 Health 843 860 936 1,006 899 1,066 1,033 1,123 1,087 1,180 Humanities 2,256 2,343 2,381 2,469 2,418 2,593 2,578 2,506 2,505 2,588 Professional/other/unknown 939 917 870 895 886 900 914 1,046 977 1,150
U.S. citizen or permanent resident, all fields 32,060 31,540 31,082 31,159 30,294 29,929 28,878 27,661 28,119 27,959 Science and engineering 18,997 18,647 18,393 18,257 17,567 17,114 16,346 15,512 15,715 15,721 Science 15,655 15,258 15,061 15,213 14,678 14,543 13,900 13,348 13,545 13,539 Agricultural sciences 666 628 619 591 561 559 504 491 561 563 Biological sciences 4,329 4,364 4,256 4,308 4,124 4,268 4,243 4,112 4,056 4,187 Computer sciences 616 514 520 561 493 457 423 419 443 448 Earth, atmospheric, and ocean sciences 526 505 538 514 459 453 395 424 429 426 Mathematics 771 648 629 669 605 574 524 442 517 510 Physical sciences 2,841 2,571 2,497 2,455 2,277 2,092 2,045 1,940 1,970 1,866 Astronomy 141 149 158 147 117 139 123 109 131 115 Chemistry 1,624 1,463 1,439 1,467 1,406 1,241 1,230 1,230 1,265 1,180 Physics 1,059 949 883 823 742 692 677 589 552 559 Other physical sciences 17 10 17 18 12 20 15 12 22 12 Psychology 3,184 3,233 3,125 3,275 3,292 3,231 3,033 2,795 2,857 2,789 Social sciences 2,722 2,795 2,877 2,840 2,867 2,909 2,733 2,725 2,712 2,750
Engineering 3,342 3,389 3,332 3,044 2,889 2,571 2,446 2,164 2,170 2,182 Aeronautical/astronautical engineering 153 184 168 152 112 127 102 91 80 77 Chemical engineering 381 391 409 374 371 382 361 336 292 312 Civil engineering 309 305 327 297 312 261 269 247 269 224 Electrical engineering 971 929 940 804 766 648 560 507 498 498 Industrial engineering 149 136 119 101 99 77 89 81 70 77 Materials/metallurgical engineering 352 337 315 313 260 244 225 175 200 210 Mechanical engineering 563 588 538 515 464 396 428 342 332 299 Other engineering 464 519 516 488 505 436 412 385 429 485
12

TABLE 3. Doctorates awarded, by sex, citizenship status, and major field of study of recipients: 1995–2004Characteristic and field 1995 1996 1997 1998 1999 2000 2001 2002 2003 2004 Non-science and engineering 13,063 12,893 12,689 12,902 12,727 12,815 12,532 12,149 12,404 12,238 Education 5,995 6,075 5,747 5,745 5,814 5,681 5,450 5,398 5,643 5,417 Health 1,043 1,016 1,028 1,154 1,049 1,195 1,158 1,194 1,229 1,271 Humanities 4,056 4,047 4,235 4,327 4,292 4,391 4,379 4,115 4,134 4,051 Professional/other/unknown 1,969 1,755 1,679 1,676 1,572 1,548 1,545 1,442 1,398 1,499
Male U.S. citizen or permanent resident, all fields 17,872 17,203 16,881 16,537 15,893 15,290 14,642 13,725 13,892 13,734 Science and engineering 12,081 11,682 11,391 11,067 10,495 9,980 9,433 8,810 8,890 8,875 Science 9,259 8,819 8,572 8,481 8,097 7,900 7,466 7,088 7,160 7,163 Agricultural sciences 506 443 443 387 376 364 310 309 361 337 Biological sciences 2,469 2,423 2,333 2,385 2,260 2,281 2,272 2,194 2,138 2,188 Computer sciences 473 423 419 437 387 371 325 322 346 345 Earth, atmospheric, and ocean sciences 407 386 393 364 330 314 260 266 284 260 Mathematics 588 503 452 470 413 409 370 308 365 356 Physical sciences 2,132 1,961 1,909 1,849 1,724 1,546 1,518 1,399 1,401 1,356 Astronomy 116 114 132 120 91 104 94 87 100 82 Chemistry 1,087 1,024 1,007 1,003 980 819 822 809 848 798 Physics 915 815 759 715 647 609 590 497 439 473 Other physical sciences 14 8 11 11 6 14 12 6 14 3 Psychology 1,127 1,048 1,014 1,058 1,063 1,052 983 916 894 895 Social sciences 1,557 1,632 1,609 1,531 1,544 1,563 1,428 1,374 1,371 1,426
Engineering 2,822 2,863 2,819 2,586 2,398 2,080 1,967 1,722 1,730 1,712 Aeronautical/astronautical engineering 141 166 156 140 102 113 83 80 69 67 Chemical engineering 293 293 332 297 296 282 268 248 220 232 Civil engineering 257 258 269 239 251 213 203 190 200 159 Electrical engineering 851 823 834 712 685 555 493 441 433 430 Industrial engineering 115 100 91 77 68 59 61 49 48 57 Materials/metallurgical engineering 273 273 244 262 206 190 171 129 155 173 Mechanical engineering 514 528 482 461 404 340 390 298 292 255 Other engineering 378 422 411 398 386 328 298 287 313 339
Non-science and engineering 5,791 5,521 5,490 5,470 5,398 5,310 5,209 4,915 5,002 4,859 Education 2,243 2,243 2,051 2,049 2,013 1,925 1,889 1,796 1,858 1,792 Health 324 293 287 310 329 341 340 340 354 346 Humanities 2,076 2,001 2,197 2,217 2,209 2,215 2,153 2,073 2,082 1,992 Professional/other/unknown 1,148 984 955 894 847 829 827 706 708 729
Female U.S. citizen or permanent resident, all fields 14,185 14,337 14,168 14,592 14,401 14,634 14,236 13,935 14,223 14,221 Science and engineering 6,914 6,965 6,988 7,172 7,072 7,132 6,913 6,701 6,823 6,842 Science 6,394 6,439 6,476 6,720 6,581 6,641 6,434 6,259 6,383 6,372 Agricultural sciences 160 185 175 204 185 195 194 181 200 226 Biological sciences 1,859 1,941 1,920 1,921 1,864 1,987 1,971 1,918 1,916 1,997 Computer sciences 143 91 100 123 106 86 98 97 97 102 Earth, atmospheric, and ocean sciences 119 119 144 150 129 139 135 158 145 166 Mathematics 183 145 177 198 192 164 154 134 152 154 Physical sciences 708 610 587 604 553 546 527 541 569 510 Astronomy 25 35 26 27 26 35 29 22 31 33 Chemistry 537 439 431 463 426 422 408 421 417 382 Physics 143 134 124 107 95 83 87 92 113 86 Other physical sciences 3 2 6 7 6 6 3 6 8 9 Psychology 2,057 2,185 2,106 2,212 2,229 2,178 2,050 1,879 1,963 1,893 Social sciences 1,165 1,163 1,267 1,308 1,323 1,346 1,305 1,351 1,341 1,324
Engineering 520 526 512 452 491 491 479 442 440 470 Aeronautical/astronautical engineering 12 18 12 12 10 14 19 11 11 10 Chemical engineering 88 98 77 76 75 100 93 88 72 80 Civil engineering 52 47 58 58 61 48 66 57 69 65 Electrical engineering 120 106 106 91 81 93 67 66 65 68 Industrial engineering 34 36 28 24 31 18 28 32 22 20 Materials/metallurgical engineering 79 64 71 51 54 54 54 46 45 37
13
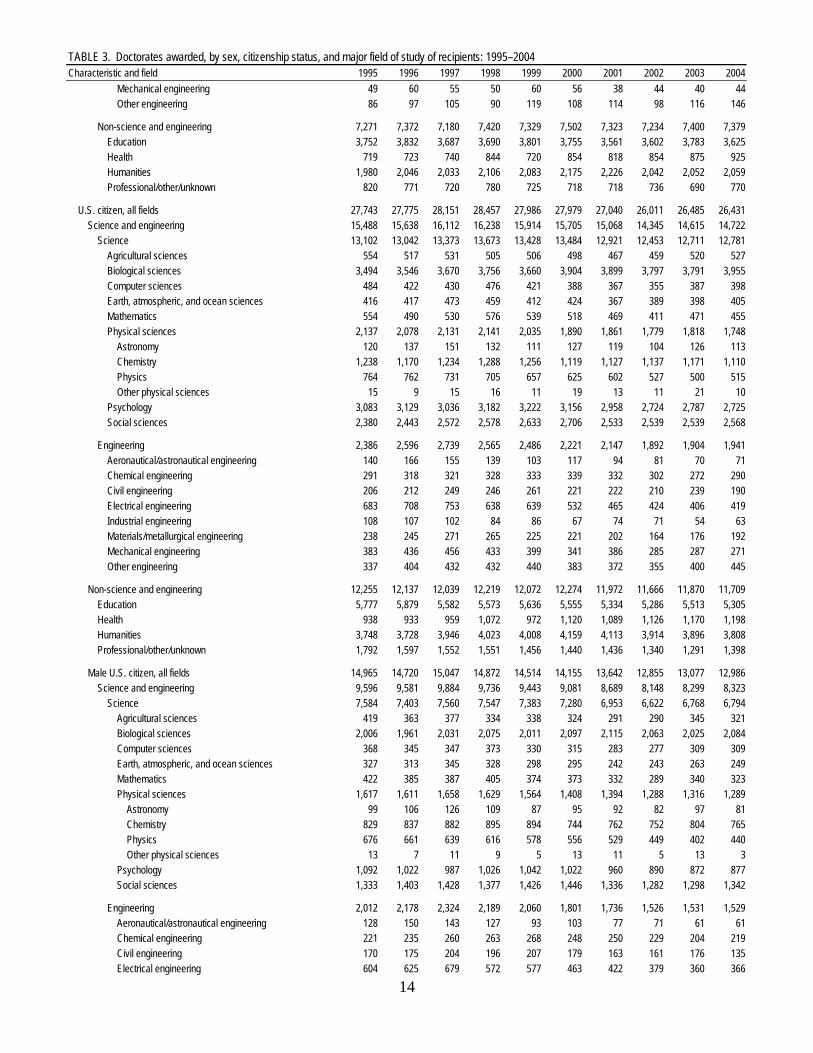
TABLE 3. Doctorates awarded, by sex, citizenship status, and major field of study of recipients: 1995–2004Characteristic and field 1995 1996 1997 1998 1999 2000 2001 2002 2003 2004 Mechanical engineering 49 60 55 50 60 56 38 44 40 44 Other engineering 86 97 105 90 119 108 114 98 116 146
Non-science and engineering 7,271 7,372 7,180 7,420 7,329 7,502 7,323 7,234 7,400 7,379 Education 3,752 3,832 3,687 3,690 3,801 3,755 3,561 3,602 3,783 3,625 Health 719 723 740 844 720 854 818 854 875 925 Humanities 1,980 2,046 2,033 2,106 2,083 2,175 2,226 2,042 2,052 2,059 Professional/other/unknown 820 771 720 780 725 718 718 736 690 770
U.S. citizen, all fields 27,743 27,775 28,151 28,457 27,986 27,979 27,040 26,011 26,485 26,431 Science and engineering 15,488 15,638 16,112 16,238 15,914 15,705 15,068 14,345 14,615 14,722 Science 13,102 13,042 13,373 13,673 13,428 13,484 12,921 12,453 12,711 12,781 Agricultural sciences 554 517 531 505 506 498 467 459 520 527 Biological sciences 3,494 3,546 3,670 3,756 3,660 3,904 3,899 3,797 3,791 3,955 Computer sciences 484 422 430 476 421 388 367 355 387 398 Earth, atmospheric, and ocean sciences 416 417 473 459 412 424 367 389 398 405 Mathematics 554 490 530 576 539 518 469 411 471 455 Physical sciences 2,137 2,078 2,131 2,141 2,035 1,890 1,861 1,779 1,818 1,748 Astronomy 120 137 151 132 111 127 119 104 126 113 Chemistry 1,238 1,170 1,234 1,288 1,256 1,119 1,127 1,137 1,171 1,110 Physics 764 762 731 705 657 625 602 527 500 515 Other physical sciences 15 9 15 16 11 19 13 11 21 10 Psychology 3,083 3,129 3,036 3,182 3,222 3,156 2,958 2,724 2,787 2,725 Social sciences 2,380 2,443 2,572 2,578 2,633 2,706 2,533 2,539 2,539 2,568
Engineering 2,386 2,596 2,739 2,565 2,486 2,221 2,147 1,892 1,904 1,941 Aeronautical/astronautical engineering 140 166 155 139 103 117 94 81 70 71 Chemical engineering 291 318 321 328 333 339 332 302 272 290 Civil engineering 206 212 249 246 261 221 222 210 239 190 Electrical engineering 683 708 753 638 639 532 465 424 406 419 Industrial engineering 108 107 102 84 86 67 74 71 54 63 Materials/metallurgical engineering 238 245 271 265 225 221 202 164 176 192 Mechanical engineering 383 436 456 433 399 341 386 285 287 271 Other engineering 337 404 432 432 440 383 372 355 400 445
Non-science and engineering 12,255 12,137 12,039 12,219 12,072 12,274 11,972 11,666 11,870 11,709 Education 5,777 5,879 5,582 5,573 5,636 5,555 5,334 5,286 5,513 5,305 Health 938 933 959 1,072 972 1,120 1,089 1,126 1,170 1,198 Humanities 3,748 3,728 3,946 4,023 4,008 4,159 4,113 3,914 3,896 3,808 Professional/other/unknown 1,792 1,597 1,552 1,551 1,456 1,440 1,436 1,340 1,291 1,398
Male U.S. citizen, all fields 14,965 14,720 15,047 14,872 14,514 14,155 13,642 12,855 13,077 12,986 Science and engineering 9,596 9,581 9,884 9,736 9,443 9,081 8,689 8,148 8,299 8,323 Science 7,584 7,403 7,560 7,547 7,383 7,280 6,953 6,622 6,768 6,794 Agricultural sciences 419 363 377 334 338 324 291 290 345 321 Biological sciences 2,006 1,961 2,031 2,075 2,011 2,097 2,115 2,063 2,025 2,084 Computer sciences 368 345 347 373 330 315 283 277 309 309 Earth, atmospheric, and ocean sciences 327 313 345 328 298 295 242 243 263 249 Mathematics 422 385 387 405 374 373 332 289 340 323 Physical sciences 1,617 1,611 1,658 1,629 1,564 1,408 1,394 1,288 1,316 1,289 Astronomy 99 106 126 109 87 95 92 82 97 81 Chemistry 829 837 882 895 894 744 762 752 804 765 Physics 676 661 639 616 578 556 529 449 402 440 Other physical sciences 13 7 11 9 5 13 11 5 13 3 Psychology 1,092 1,022 987 1,026 1,042 1,022 960 890 872 877 Social sciences 1,333 1,403 1,428 1,377 1,426 1,446 1,336 1,282 1,298 1,342
Engineering 2,012 2,178 2,324 2,189 2,060 1,801 1,736 1,526 1,531 1,529 Aeronautical/astronautical engineering 128 150 143 127 93 103 77 71 61 61 Chemical engineering 221 235 260 263 268 248 250 229 204 219 Civil engineering 170 175 204 196 207 179 163 161 176 135 Electrical engineering 604 625 679 572 577 463 422 379 360 366
14
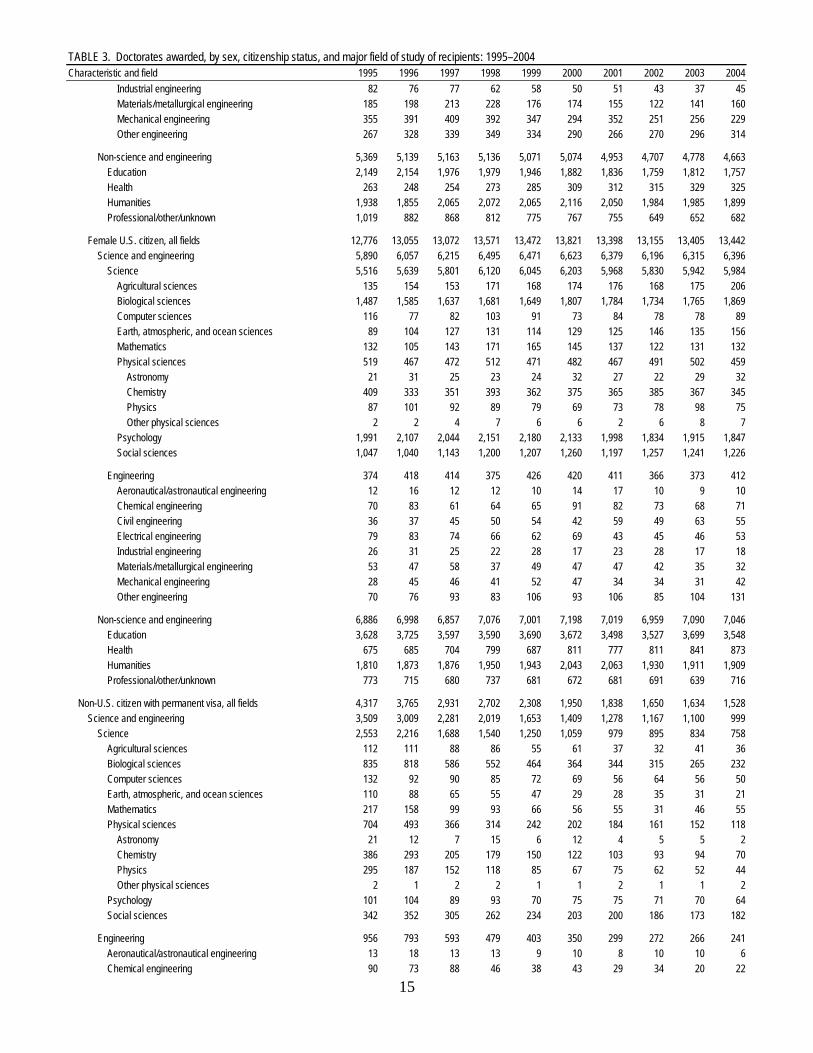
TABLE 3. Doctorates awarded, by sex, citizenship status, and major field of study of recipients: 1995–2004Characteristic and field 1995 1996 1997 1998 1999 2000 2001 2002 2003 2004 Industrial engineering 82 76 77 62 58 50 51 43 37 45 Materials/metallurgical engineering 185 198 213 228 176 174 155 122 141 160 Mechanical engineering 355 391 409 392 347 294 352 251 256 229 Other engineering 267 328 339 349 334 290 266 270 296 314
Non-science and engineering 5,369 5,139 5,163 5,136 5,071 5,074 4,953 4,707 4,778 4,663 Education 2,149 2,154 1,976 1,979 1,946 1,882 1,836 1,759 1,812 1,757 Health 263 248 254 273 285 309 312 315 329 325 Humanities 1,938 1,855 2,065 2,072 2,065 2,116 2,050 1,984 1,985 1,899 Professional/other/unknown 1,019 882 868 812 775 767 755 649 652 682
Female U.S. citizen, all fields 12,776 13,055 13,072 13,571 13,472 13,821 13,398 13,155 13,405 13,442 Science and engineering 5,890 6,057 6,215 6,495 6,471 6,623 6,379 6,196 6,315 6,396 Science 5,516 5,639 5,801 6,120 6,045 6,203 5,968 5,830 5,942 5,984 Agricultural sciences 135 154 153 171 168 174 176 168 175 206 Biological sciences 1,487 1,585 1,637 1,681 1,649 1,807 1,784 1,734 1,765 1,869 Computer sciences 116 77 82 103 91 73 84 78 78 89 Earth, atmospheric, and ocean sciences 89 104 127 131 114 129 125 146 135 156 Mathematics 132 105 143 171 165 145 137 122 131 132 Physical sciences 519 467 472 512 471 482 467 491 502 459 Astronomy 21 31 25 23 24 32 27 22 29 32 Chemistry 409 333 351 393 362 375 365 385 367 345 Physics 87 101 92 89 79 69 73 78 98 75 Other physical sciences 2 2 4 7 6 6 2 6 8 7 Psychology 1,991 2,107 2,044 2,151 2,180 2,133 1,998 1,834 1,915 1,847 Social sciences 1,047 1,040 1,143 1,200 1,207 1,260 1,197 1,257 1,241 1,226
Engineering 374 418 414 375 426 420 411 366 373 412 Aeronautical/astronautical engineering 12 16 12 12 10 14 17 10 9 10 Chemical engineering 70 83 61 64 65 91 82 73 68 71 Civil engineering 36 37 45 50 54 42 59 49 63 55 Electrical engineering 79 83 74 66 62 69 43 45 46 53 Industrial engineering 26 31 25 22 28 17 23 28 17 18 Materials/metallurgical engineering 53 47 58 37 49 47 47 42 35 32 Mechanical engineering 28 45 46 41 52 47 34 34 31 42 Other engineering 70 76 93 83 106 93 106 85 104 131
Non-science and engineering 6,886 6,998 6,857 7,076 7,001 7,198 7,019 6,959 7,090 7,046 Education 3,628 3,725 3,597 3,590 3,690 3,672 3,498 3,527 3,699 3,548 Health 675 685 704 799 687 811 777 811 841 873 Humanities 1,810 1,873 1,876 1,950 1,943 2,043 2,063 1,930 1,911 1,909 Professional/other/unknown 773 715 680 737 681 672 681 691 639 716
Non-U.S. citizen with permanent visa, all fields 4,317 3,765 2,931 2,702 2,308 1,950 1,838 1,650 1,634 1,528 Science and engineering 3,509 3,009 2,281 2,019 1,653 1,409 1,278 1,167 1,100 999 Science 2,553 2,216 1,688 1,540 1,250 1,059 979 895 834 758 Agricultural sciences 112 111 88 86 55 61 37 32 41 36 Biological sciences 835 818 586 552 464 364 344 315 265 232 Computer sciences 132 92 90 85 72 69 56 64 56 50 Earth, atmospheric, and ocean sciences 110 88 65 55 47 29 28 35 31 21 Mathematics 217 158 99 93 66 56 55 31 46 55 Physical sciences 704 493 366 314 242 202 184 161 152 118 Astronomy 21 12 7 15 6 12 4 5 5 2 Chemistry 386 293 205 179 150 122 103 93 94 70 Physics 295 187 152 118 85 67 75 62 52 44 Other physical sciences 2 1 2 2 1 1 2 1 1 2 Psychology 101 104 89 93 70 75 75 71 70 64 Social sciences 342 352 305 262 234 203 200 186 173 182
Engineering 956 793 593 479 403 350 299 272 266 241 Aeronautical/astronautical engineering 13 18 13 13 9 10 8 10 10 6 Chemical engineering 90 73 88 46 38 43 29 34 20 22
15
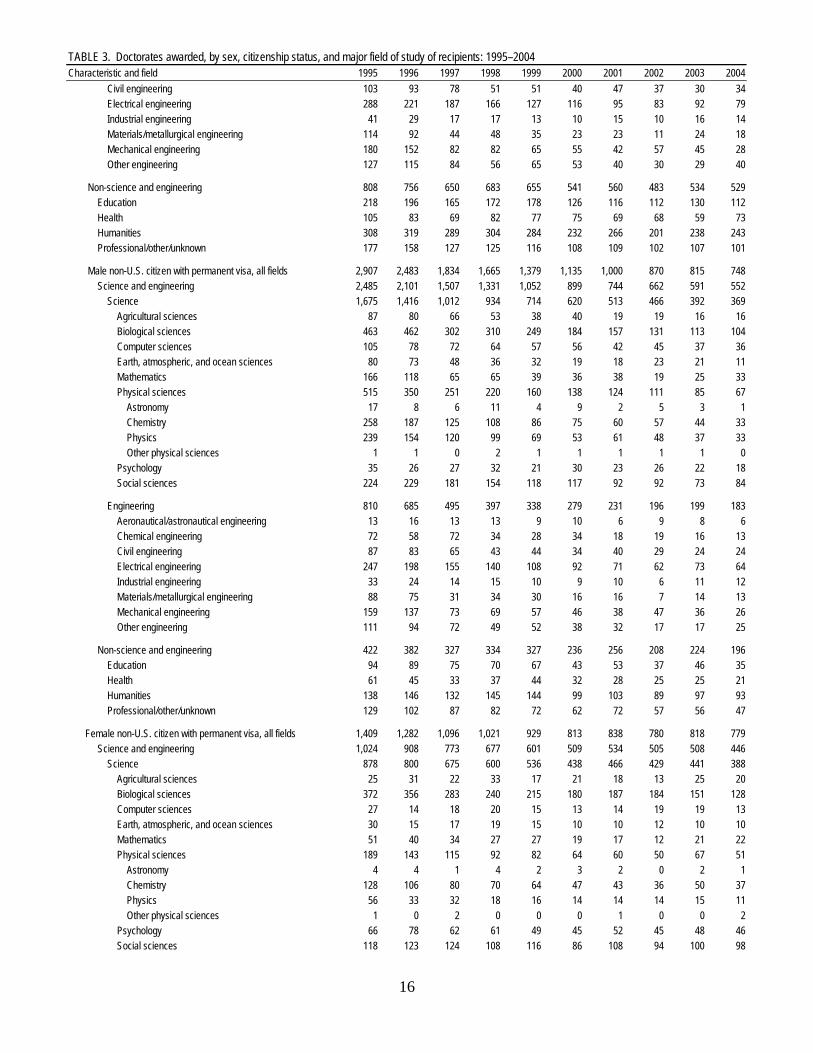
TABLE 3. Doctorates awarded, by sex, citizenship status, and major field of study of recipients: 1995–2004Characteristic and field 1995 1996 1997 1998 1999 2000 2001 2002 2003 2004 Civil engineering 103 93 78 51 51 40 47 37 30 34 Electrical engineering 288 221 187 166 127 116 95 83 92 79 Industrial engineering 41 29 17 17 13 10 15 10 16 14 Materials/metallurgical engineering 114 92 44 48 35 23 23 11 24 18 Mechanical engineering 180 152 82 82 65 55 42 57 45 28 Other engineering 127 115 84 56 65 53 40 30 29 40
Non-science and engineering 808 756 650 683 655 541 560 483 534 529 Education 218 196 165 172 178 126 116 112 130 112 Health 105 83 69 82 77 75 69 68 59 73 Humanities 308 319 289 304 284 232 266 201 238 243 Professional/other/unknown 177 158 127 125 116 108 109 102 107 101
Male non-U.S. citizen with permanent visa, all fields 2,907 2,483 1,834 1,665 1,379 1,135 1,000 870 815 748 Science and engineering 2,485 2,101 1,507 1,331 1,052 899 744 662 591 552 Science 1,675 1,416 1,012 934 714 620 513 466 392 369 Agricultural sciences 87 80 66 53 38 40 19 19 16 16 Biological sciences 463 462 302 310 249 184 157 131 113 104 Computer sciences 105 78 72 64 57 56 42 45 37 36 Earth, atmospheric, and ocean sciences 80 73 48 36 32 19 18 23 21 11 Mathematics 166 118 65 65 39 36 38 19 25 33 Physical sciences 515 350 251 220 160 138 124 111 85 67 Astronomy 17 8 6 11 4 9 2 5 3 1 Chemistry 258 187 125 108 86 75 60 57 44 33 Physics 239 154 120 99 69 53 61 48 37 33 Other physical sciences 1 1 0 2 1 1 1 1 1 0 Psychology 35 26 27 32 21 30 23 26 22 18 Social sciences 224 229 181 154 118 117 92 92 73 84
Engineering 810 685 495 397 338 279 231 196 199 183 Aeronautical/astronautical engineering 13 16 13 13 9 10 6 9 8 6 Chemical engineering 72 58 72 34 28 34 18 19 16 13 Civil engineering 87 83 65 43 44 34 40 29 24 24 Electrical engineering 247 198 155 140 108 92 71 62 73 64 Industrial engineering 33 24 14 15 10 9 10 6 11 12 Materials/metallurgical engineering 88 75 31 34 30 16 16 7 14 13 Mechanical engineering 159 137 73 69 57 46 38 47 36 26 Other engineering 111 94 72 49 52 38 32 17 17 25
Non-science and engineering 422 382 327 334 327 236 256 208 224 196 Education 94 89 75 70 67 43 53 37 46 35 Health 61 45 33 37 44 32 28 25 25 21 Humanities 138 146 132 145 144 99 103 89 97 93 Professional/other/unknown 129 102 87 82 72 62 72 57 56 47
Female non-U.S. citizen with permanent visa, all fields 1,409 1,282 1,096 1,021 929 813 838 780 818 779 Science and engineering 1,024 908 773 677 601 509 534 505 508 446 Science 878 800 675 600 536 438 466 429 441 388 Agricultural sciences 25 31 22 33 17 21 18 13 25 20 Biological sciences 372 356 283 240 215 180 187 184 151 128 Computer sciences 27 14 18 20 15 13 14 19 19 13 Earth, atmospheric, and ocean sciences 30 15 17 19 15 10 10 12 10 10 Mathematics 51 40 34 27 27 19 17 12 21 22 Physical sciences 189 143 115 92 82 64 60 50 67 51 Astronomy 4 4 1 4 2 3 2 0 2 1 Chemistry 128 106 80 70 64 47 43 36 50 37 Physics 56 33 32 18 16 14 14 14 15 11 Other physical sciences 1 0 2 0 0 0 1 0 0 2 Psychology 66 78 62 61 49 45 52 45 48 46 Social sciences 118 123 124 108 116 86 108 94 100 98
16

TABLE 3. Doctorates awarded, by sex, citizenship status, and major field of study of recipients: 1995–2004Characteristic and field 1995 1996 1997 1998 1999 2000 2001 2002 2003 2004 Engineering 146 108 98 77 65 71 68 76 67 58 Aeronautical/astronautical engineering 0 2 0 0 0 0 2 1 2 0 Chemical engineering 18 15 16 12 10 9 11 15 4 9 Civil engineering 16 10 13 8 7 6 7 8 6 10 Electrical engineering 41 23 32 25 19 24 24 21 19 15 Industrial engineering 8 5 3 2 3 1 5 4 5 2 Materials/metallurgical engineering 26 17 13 14 5 7 7 4 10 5 Mechanical engineering 21 15 9 9 8 9 4 10 9 2 Other engineering 16 21 12 7 13 15 8 13 12 15
Non-science and engineering 385 374 323 344 328 304 304 275 310 333 Education 124 107 90 100 111 83 63 75 84 77 Health 44 38 36 45 33 43 41 43 34 52 Humanities 170 173 157 156 140 132 163 112 141 150 Professional/other/unknown 47 56 40 43 44 46 37 45 51 54
Non-U.S. citizen with temporary visa, all fields 8,831 9,650 9,193 9,496 9,057 9,663 9,833 9,727 10,612 11,585 Science and engineering 7,007 7,836 7,509 7,776 7,238 7,660 7,964 7,690 8,407 9,122 Science 4,480 5,102 4,954 5,194 5,046 5,208 5,173 5,042 5,491 5,820 Agricultural sciences 442 470 412 480 486 444 402 433 428 413 Biological sciences 971 1,244 1,322 1,334 1,287 1,385 1,242 1,292 1,404 1,462 Computer sciences 365 377 330 328 330 363 360 349 380 459 Earth, atmospheric, and ocean sciences 160 178 211 198 215 174 210 218 193 221 Mathematics 384 443 441 447 444 443 436 440 441 526 Physical sciences 931 1,141 1,084 1,203 1,127 1,156 1,219 1,113 1,225 1,347 Astronomy 28 42 37 52 37 42 53 31 34 47 Chemistry 493 613 599 658 622 648 675 596 690 720 Physics 400 483 446 488 463 458 482 481 494 577 Other physical sciences 10 3 2 5 5 8 9 5 7 3 Psychology 165 180 137 169 153 164 153 156 197 188 Social sciences 1,062 1,069 1,017 1,035 1,004 1,079 1,151 1,041 1,223 1,204
Engineering 2,527 2,734 2,555 2,582 2,192 2,452 2,791 2,648 2,916 3,302 Aeronautical/astronautical engineering 94 93 97 71 82 74 87 106 111 116 Chemical engineering 318 401 343 373 282 307 336 326 341 365 Civil engineering 337 372 310 316 253 280 300 348 389 421 Electrical engineering 712 750 712 709 637 785 933 824 920 1,054 Industrial engineering 131 117 118 120 108 94 110 134 137 134 Materials/metallurgical engineering 224 222 244 228 194 181 250 196 260 279 Mechanical engineering 439 436 449 454 354 433 494 447 447 524 Other engineering 272 343 282 311 282 298 281 267 311 409
Non-science and engineering 1,824 1,814 1,684 1,720 1,819 2,003 1,869 2,037 2,205 2,463 Education 506 482 411 489 517 539 503 474 588 627 Health 246 268 273 286 286 306 320 323 328 366 Humanities 548 522 530 534 536 630 554 648 659 714 Professional/other/unknown 524 542 470 411 480 528 492 592 630 756
Male non-U.S. citizen with temporary visa, all fields 6,855 7,416 6,974 7,007 6,630 6,854 7,030 6,752 7,265 7,882 Science and engineering 5,748 6,329 5,976 6,006 5,588 5,796 5,999 5,724 6,159 6,677 Science 3,383 3,825 3,636 3,705 3,657 3,647 3,614 3,462 3,689 3,867 Agricultural sciences 349 357 313 366 364 327 275 316 285 261 Biological sciences 631 801 818 795 819 832 744 776 806 822 Computer sciences 322 335 292 305 283 315 313 287 312 377 Earth, atmospheric, and ocean sciences 141 152 179 163 174 129 166 179 142 163 Mathematics 305 360 366 362 366 359 326 318 336 383 Physical sciences 770 931 858 923 879 905 946 826 935 1,014 Astronomy 24 36 27 34 30 37 45 27 24 34 Chemistry 377 464 445 454 442 475 478 396 489 486 Physics 361 429 386 432 402 387 417 401 417 493 Other physical sciences 8 2 0 3 5 6 6 2 5 1
17
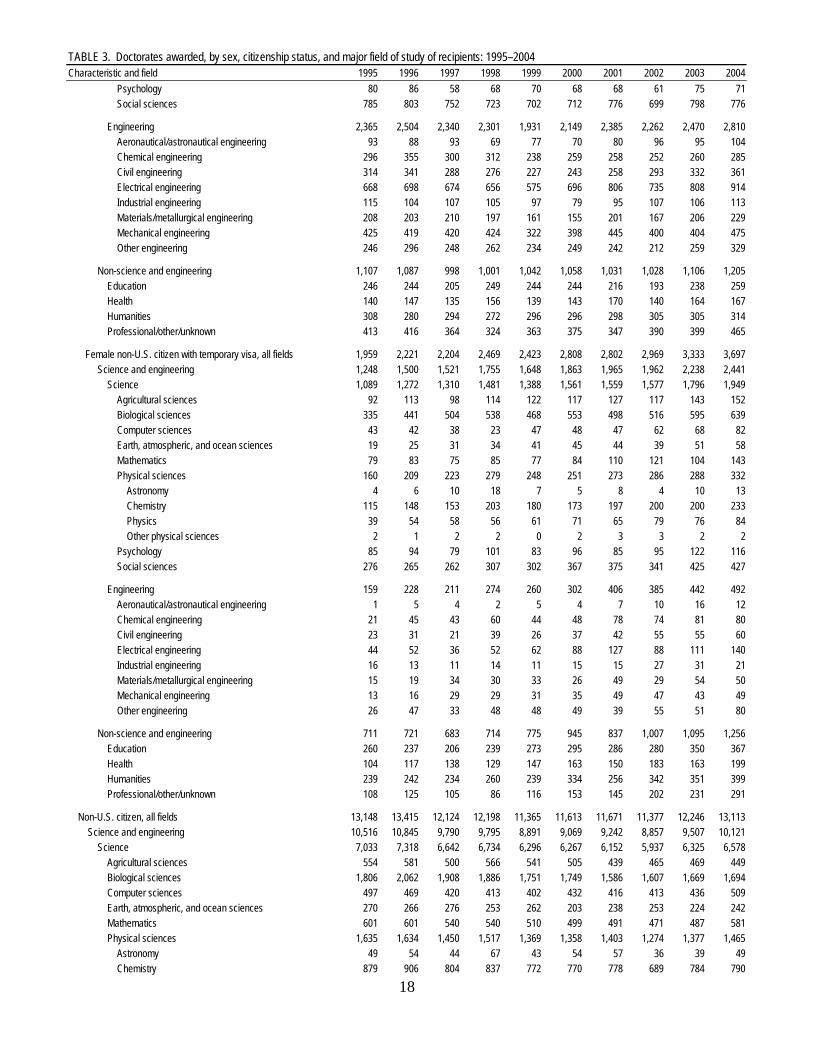
TABLE 3. Doctorates awarded, by sex, citizenship status, and major field of study of recipients: 1995–2004Characteristic and field 1995 1996 1997 1998 1999 2000 2001 2002 2003 2004 Psychology 80 86 58 68 70 68 68 61 75 71 Social sciences 785 803 752 723 702 712 776 699 798 776
Engineering 2,365 2,504 2,340 2,301 1,931 2,149 2,385 2,262 2,470 2,810 Aeronautical/astronautical engineering 93 88 93 69 77 70 80 96 95 104 Chemical engineering 296 355 300 312 238 259 258 252 260 285 Civil engineering 314 341 288 276 227 243 258 293 332 361 Electrical engineering 668 698 674 656 575 696 806 735 808 914 Industrial engineering 115 104 107 105 97 79 95 107 106 113 Materials/metallurgical engineering 208 203 210 197 161 155 201 167 206 229 Mechanical engineering 425 419 420 424 322 398 445 400 404 475 Other engineering 246 296 248 262 234 249 242 212 259 329
Non-science and engineering 1,107 1,087 998 1,001 1,042 1,058 1,031 1,028 1,106 1,205 Education 246 244 205 249 244 244 216 193 238 259 Health 140 147 135 156 139 143 170 140 164 167 Humanities 308 280 294 272 296 296 298 305 305 314 Professional/other/unknown 413 416 364 324 363 375 347 390 399 465
Female non-U.S. citizen with temporary visa, all fields 1,959 2,221 2,204 2,469 2,423 2,808 2,802 2,969 3,333 3,697 Science and engineering 1,248 1,500 1,521 1,755 1,648 1,863 1,965 1,962 2,238 2,441 Science 1,089 1,272 1,310 1,481 1,388 1,561 1,559 1,577 1,796 1,949 Agricultural sciences 92 113 98 114 122 117 127 117 143 152 Biological sciences 335 441 504 538 468 553 498 516 595 639 Computer sciences 43 42 38 23 47 48 47 62 68 82 Earth, atmospheric, and ocean sciences 19 25 31 34 41 45 44 39 51 58 Mathematics 79 83 75 85 77 84 110 121 104 143 Physical sciences 160 209 223 279 248 251 273 286 288 332 Astronomy 4 6 10 18 7 5 8 4 10 13 Chemistry 115 148 153 203 180 173 197 200 200 233 Physics 39 54 58 56 61 71 65 79 76 84 Other physical sciences 2 1 2 2 0 2 3 3 2 2 Psychology 85 94 79 101 83 96 85 95 122 116 Social sciences 276 265 262 307 302 367 375 341 425 427
Engineering 159 228 211 274 260 302 406 385 442 492 Aeronautical/astronautical engineering 1 5 4 2 5 4 7 10 16 12 Chemical engineering 21 45 43 60 44 48 78 74 81 80 Civil engineering 23 31 21 39 26 37 42 55 55 60 Electrical engineering 44 52 36 52 62 88 127 88 111 140 Industrial engineering 16 13 11 14 11 15 15 27 31 21 Materials/metallurgical engineering 15 19 34 30 33 26 49 29 54 50 Mechanical engineering 13 16 29 29 31 35 49 47 43 49 Other engineering 26 47 33 48 48 49 39 55 51 80
Non-science and engineering 711 721 683 714 775 945 837 1,007 1,095 1,256 Education 260 237 206 239 273 295 286 280 350 367 Health 104 117 138 129 147 163 150 183 163 199 Humanities 239 242 234 260 239 334 256 342 351 399 Professional/other/unknown 108 125 105 86 116 153 145 202 231 291
Non-U.S. citizen, all fields 13,148 13,415 12,124 12,198 11,365 11,613 11,671 11,377 12,246 13,113 Science and engineering 10,516 10,845 9,790 9,795 8,891 9,069 9,242 8,857 9,507 10,121 Science 7,033 7,318 6,642 6,734 6,296 6,267 6,152 5,937 6,325 6,578 Agricultural sciences 554 581 500 566 541 505 439 465 469 449 Biological sciences 1,806 2,062 1,908 1,886 1,751 1,749 1,586 1,607 1,669 1,694 Computer sciences 497 469 420 413 402 432 416 413 436 509 Earth, atmospheric, and ocean sciences 270 266 276 253 262 203 238 253 224 242 Mathematics 601 601 540 540 510 499 491 471 487 581 Physical sciences 1,635 1,634 1,450 1,517 1,369 1,358 1,403 1,274 1,377 1,465 Astronomy 49 54 44 67 43 54 57 36 39 49 Chemistry 879 906 804 837 772 770 778 689 784 790
18
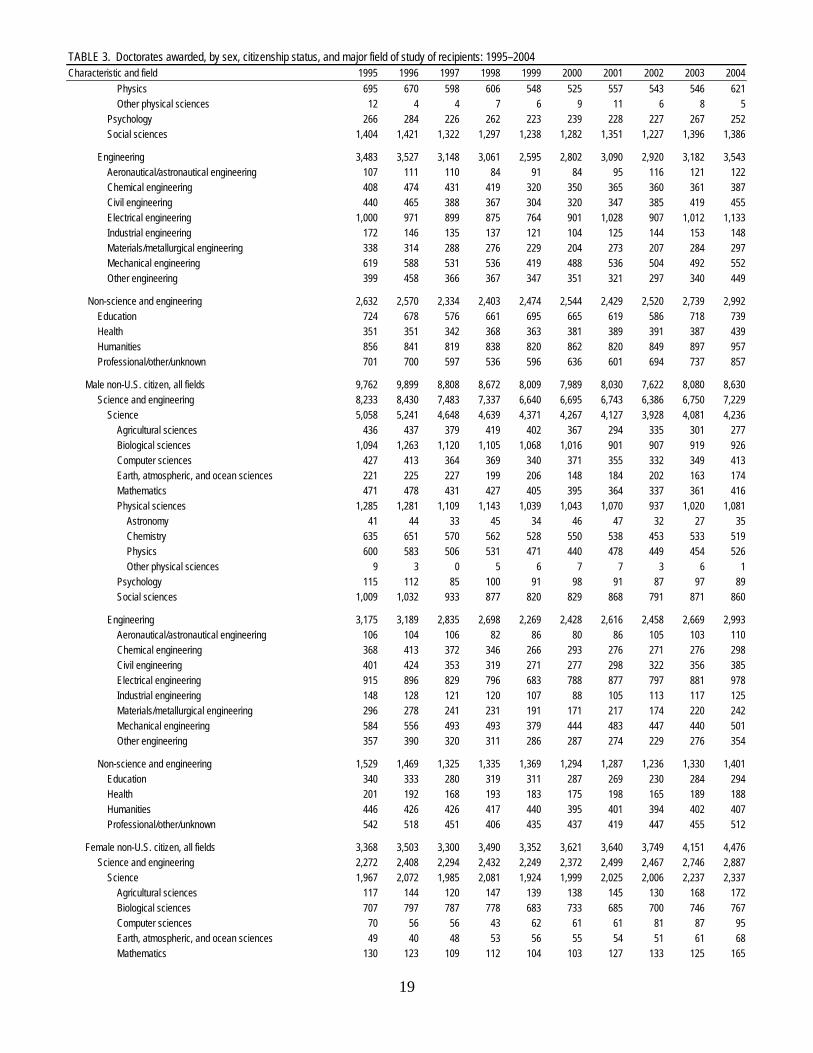
TABLE 3. Doctorates awarded, by sex, citizenship status, and major field of study of recipients: 1995–2004Characteristic and field 1995 1996 1997 1998 1999 2000 2001 2002 2003 2004 Physics 695 670 598 606 548 525 557 543 546 621 Other physical sciences 12 4 4 7 6 9 11 6 8 5 Psychology 266 284 226 262 223 239 228 227 267 252 Social sciences 1,404 1,421 1,322 1,297 1,238 1,282 1,351 1,227 1,396 1,386
Engineering 3,483 3,527 3,148 3,061 2,595 2,802 3,090 2,920 3,182 3,543 Aeronautical/astronautical engineering 107 111 110 84 91 84 95 116 121 122 Chemical engineering 408 474 431 419 320 350 365 360 361 387 Civil engineering 440 465 388 367 304 320 347 385 419 455 Electrical engineering 1,000 971 899 875 764 901 1,028 907 1,012 1,133 Industrial engineering 172 146 135 137 121 104 125 144 153 148 Materials/metallurgical engineering 338 314 288 276 229 204 273 207 284 297 Mechanical engineering 619 588 531 536 419 488 536 504 492 552 Other engineering 399 458 366 367 347 351 321 297 340 449
Non-science and engineering 2,632 2,570 2,334 2,403 2,474 2,544 2,429 2,520 2,739 2,992 Education 724 678 576 661 695 665 619 586 718 739 Health 351 351 342 368 363 381 389 391 387 439 Humanities 856 841 819 838 820 862 820 849 897 957 Professional/other/unknown 701 700 597 536 596 636 601 694 737 857
Male non-U.S. citizen, all fields 9,762 9,899 8,808 8,672 8,009 7,989 8,030 7,622 8,080 8,630 Science and engineering 8,233 8,430 7,483 7,337 6,640 6,695 6,743 6,386 6,750 7,229 Science 5,058 5,241 4,648 4,639 4,371 4,267 4,127 3,928 4,081 4,236 Agricultural sciences 436 437 379 419 402 367 294 335 301 277 Biological sciences 1,094 1,263 1,120 1,105 1,068 1,016 901 907 919 926 Computer sciences 427 413 364 369 340 371 355 332 349 413 Earth, atmospheric, and ocean sciences 221 225 227 199 206 148 184 202 163 174 Mathematics 471 478 431 427 405 395 364 337 361 416 Physical sciences 1,285 1,281 1,109 1,143 1,039 1,043 1,070 937 1,020 1,081 Astronomy 41 44 33 45 34 46 47 32 27 35 Chemistry 635 651 570 562 528 550 538 453 533 519 Physics 600 583 506 531 471 440 478 449 454 526 Other physical sciences 9 3 0 5 6 7 7 3 6 1 Psychology 115 112 85 100 91 98 91 87 97 89 Social sciences 1,009 1,032 933 877 820 829 868 791 871 860
Engineering 3,175 3,189 2,835 2,698 2,269 2,428 2,616 2,458 2,669 2,993 Aeronautical/astronautical engineering 106 104 106 82 86 80 86 105 103 110 Chemical engineering 368 413 372 346 266 293 276 271 276 298 Civil engineering 401 424 353 319 271 277 298 322 356 385 Electrical engineering 915 896 829 796 683 788 877 797 881 978 Industrial engineering 148 128 121 120 107 88 105 113 117 125 Materials/metallurgical engineering 296 278 241 231 191 171 217 174 220 242 Mechanical engineering 584 556 493 493 379 444 483 447 440 501 Other engineering 357 390 320 311 286 287 274 229 276 354
Non-science and engineering 1,529 1,469 1,325 1,335 1,369 1,294 1,287 1,236 1,330 1,401 Education 340 333 280 319 311 287 269 230 284 294 Health 201 192 168 193 183 175 198 165 189 188 Humanities 446 426 426 417 440 395 401 394 402 407 Professional/other/unknown 542 518 451 406 435 437 419 447 455 512
Female non-U.S. citizen, all fields 3,368 3,503 3,300 3,490 3,352 3,621 3,640 3,749 4,151 4,476 Science and engineering 2,272 2,408 2,294 2,432 2,249 2,372 2,499 2,467 2,746 2,887 Science 1,967 2,072 1,985 2,081 1,924 1,999 2,025 2,006 2,237 2,337 Agricultural sciences 117 144 120 147 139 138 145 130 168 172 Biological sciences 707 797 787 778 683 733 685 700 746 767 Computer sciences 70 56 56 43 62 61 61 81 87 95 Earth, atmospheric, and ocean sciences 49 40 48 53 56 55 54 51 61 68 Mathematics 130 123 109 112 104 103 127 133 125 165
19

TABLE 3. Doctorates awarded, by sex, citizenship status, and major field of study of recipients: 1995–2004Characteristic and field 1995 1996 1997 1998 1999 2000 2001 2002 2003 2004 Physical sciences 349 352 338 371 330 315 333 336 355 383 Astronomy 8 10 11 22 9 8 10 4 12 14 Chemistry 243 254 233 273 244 220 240 236 250 270 Physics 95 87 90 74 77 85 79 93 91 95 Other physical sciences 3 1 4 2 0 2 4 3 2 4 Psychology 151 172 141 162 132 141 137 140 170 162 Social sciences 394 388 386 415 418 453 483 435 525 525
Engineering 305 336 309 351 325 373 474 461 509 550 Aeronautical/astronautical engineering 1 7 4 2 5 4 9 11 18 12 Chemical engineering 39 60 59 72 54 57 89 89 85 89 Civil engineering 39 41 34 47 33 43 49 63 61 70 Electrical engineering 85 75 68 77 81 112 151 109 130 155 Industrial engineering 24 18 14 16 14 16 20 31 36 23 Materials/metallurgical engineering 41 36 47 44 38 33 56 33 64 55 Mechanical engineering 34 31 38 38 39 44 53 57 52 51 Other engineering 42 68 45 55 61 64 47 68 63 95
Non-science and engineering 1,096 1,095 1,006 1,058 1,103 1,249 1,141 1,282 1,405 1,589 Education 384 344 296 339 384 378 349 355 434 444 Health 148 155 174 174 180 206 191 226 197 251 Humanities 409 415 391 416 379 466 419 454 492 549 Professional/other/unknown 155 181 145 129 160 199 182 247 282 345
Citizenship unknown, all fields 859 1,249 2,266 1,992 1,741 1,773 2,113 2,601 2,039 2,611 Science and engineering 532 758 1,330 1,245 1,128 1,192 1,238 1,386 1,167 1,432 Science 393 572 1,102 947 879 894 970 1,122 975 1,140 Agricultural sciences 9 20 47 39 18 35 69 85 72 70 Biological sciences 76 116 211 203 171 201 206 286 237 288 Computer sciences 16 29 59 38 33 39 43 39 42 42 Earth, atmospheric, and ocean sciences 13 28 33 29 32 36 25 31 24 25 Mathematics 35 31 53 61 34 33 47 36 36 39 Physical sciences 69 127 188 166 175 159 130 159 130 140 Astronomy 4 1 3 7 5 4 10 4 3 3 Chemistry 45 73 110 91 104 100 76 97 86 87 Physics 20 53 72 67 66 54 38 57 34 50 Other physical sciences 0 0 3 1 0 1 6 1 7 0 Psychology 80 82 295 231 223 223 256 248 227 359 Social sciences 95 139 216 180 193 168 194 238 207 177
Engineering 139 186 228 298 249 298 268 264 192 292 Aeronautical/astronautical engineering 5 10 8 18 12 13 14 12 9 8 Chemical engineering 9 6 15 29 21 36 32 43 15 46 Civil engineering 10 21 18 37 19 15 25 31 16 30 Electrical engineering 48 62 68 83 75 111 83 64 48 97 Industrial engineering 4 6 9 8 4 5 7 15 6 6 Materials/metallurgical engineering 12 15 23 24 15 26 22 25 14 20 Mechanical engineering 23 28 35 53 37 35 31 38 35 30 Other engineering 28 38 52 46 66 57 54 36 49 55
Non-science and engineering 327 491 936 747 613 581 875 1,215 872 1,179 Education 149 228 416 337 215 210 384 615 401 591 Health 40 40 120 60 72 91 144 136 79 93 Humanities 87 143 269 255 206 192 228 247 222 252 Professional/other/unknown 51 80 131 95 120 88 119 217 170 243
Male, citizenship unknown, all fields 434 667 1,088 1,089 911 1,022 1,121 1,294 1,044 1,360 Science and engineering 288 443 716 737 652 745 742 840 679 853 Science 205 322 559 513 477 515 527 653 526 625 Agricultural sciences 2 13 27 28 9 28 44 58 39 46 Biological sciences 32 63 111 114 92 113 117 173 141 171 Computer sciences 13 17 32 23 22 30 31 29 32 27
20
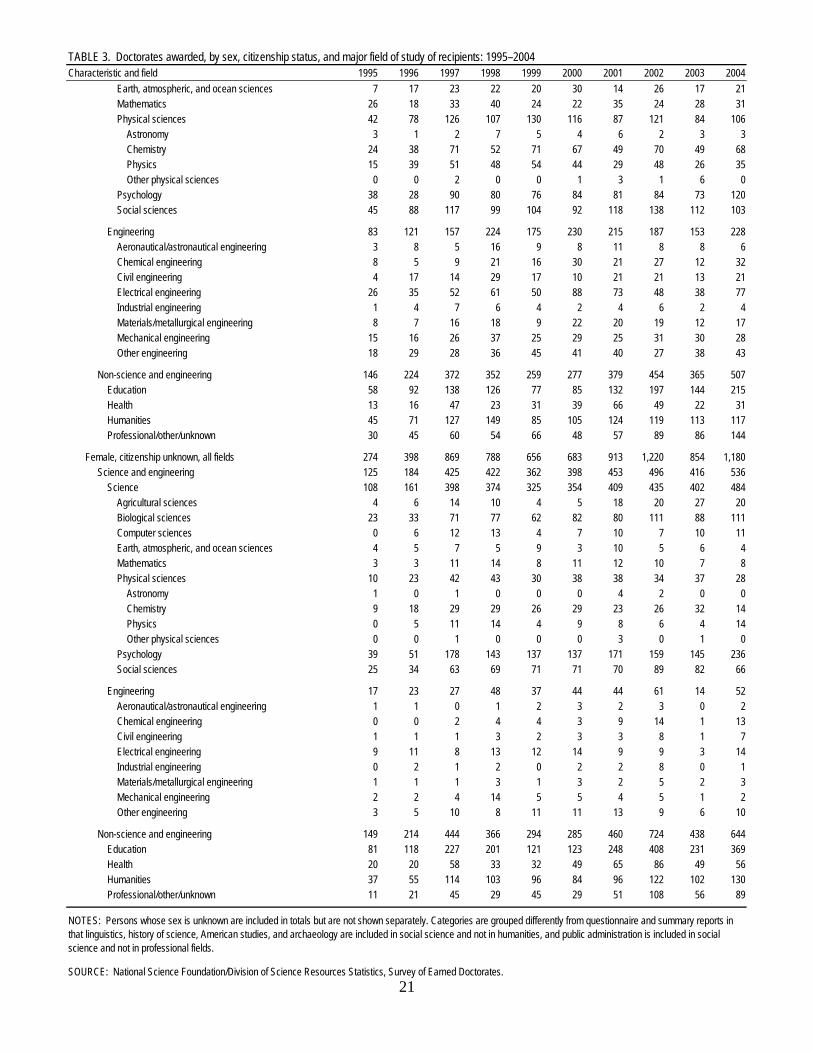
TABLE 3. Doctorates awarded, by sex, citizenship status, and major field of study of recipients: 1995–2004Characteristic and field 1995 1996 1997 1998 1999 2000 2001 2002 2003 2004 Earth, atmospheric, and ocean sciences 7 17 23 22 20 30 14 26 17 21 Mathematics 26 18 33 40 24 22 35 24 28 31 Physical sciences 42 78 126 107 130 116 87 121 84 106 Astronomy 3 1 2 7 5 4 6 2 3 3 Chemistry 24 38 71 52 71 67 49 70 49 68 Physics 15 39 51 48 54 44 29 48 26 35 Other physical sciences 0 0 2 0 0 1 3 1 6 0 Psychology 38 28 90 80 76 84 81 84 73 120 Social sciences 45 88 117 99 104 92 118 138 112 103
Engineering 83 121 157 224 175 230 215 187 153 228 Aeronautical/astronautical engineering 3 8 5 16 9 8 11 8 8 6 Chemical engineering 8 5 9 21 16 30 21 27 12 32 Civil engineering 4 17 14 29 17 10 21 21 13 21 Electrical engineering 26 35 52 61 50 88 73 48 38 77 Industrial engineering 1 4 7 6 4 2 4 6 2 4 Materials/metallurgical engineering 8 7 16 18 9 22 20 19 12 17 Mechanical engineering 15 16 26 37 25 29 25 31 30 28 Other engineering 18 29 28 36 45 41 40 27 38 43
Non-science and engineering 146 224 372 352 259 277 379 454 365 507 Education 58 92 138 126 77 85 132 197 144 215 Health 13 16 47 23 31 39 66 49 22 31 Humanities 45 71 127 149 85 105 124 119 113 117 Professional/other/unknown 30 45 60 54 66 48 57 89 86 144
Female, citizenship unknown, all fields 274 398 869 788 656 683 913 1,220 854 1,180 Science and engineering 125 184 425 422 362 398 453 496 416 536 Science 108 161 398 374 325 354 409 435 402 484 Agricultural sciences 4 6 14 10 4 5 18 20 27 20 Biological sciences 23 33 71 77 62 82 80 111 88 111 Computer sciences 0 6 12 13 4 7 10 7 10 11 Earth, atmospheric, and ocean sciences 4 5 7 5 9 3 10 5 6 4 Mathematics 3 3 11 14 8 11 12 10 7 8 Physical sciences 10 23 42 43 30 38 38 34 37 28 Astronomy 1 0 1 0 0 0 4 2 0 0 Chemistry 9 18 29 29 26 29 23 26 32 14 Physics 0 5 11 14 4 9 8 6 4 14 Other physical sciences 0 0 1 0 0 0 3 0 1 0 Psychology 39 51 178 143 137 137 171 159 145 236 Social sciences 25 34 63 69 71 71 70 89 82 66
Engineering 17 23 27 48 37 44 44 61 14 52 Aeronautical/astronautical engineering 1 1 0 1 2 3 2 3 0 2 Chemical engineering 0 0 2 4 4 3 9 14 1 13 Civil engineering 1 1 1 3 2 3 3 8 1 7 Electrical engineering 9 11 8 13 12 14 9 9 3 14 Industrial engineering 0 2 1 2 0 2 2 8 0 1 Materials/metallurgical engineering 1 1 1 3 1 3 2 5 2 3 Mechanical engineering 2 2 4 14 5 5 4 5 1 2 Other engineering 3 5 10 8 11 11 13 9 6 10
Non-science and engineering 149 214 444 366 294 285 460 724 438 644 Education 81 118 227 201 121 123 248 408 231 369 Health 20 20 58 33 32 49 65 86 49 56 Humanities 37 55 114 103 96 84 96 122 102 130 Professional/other/unknown 11 21 45 29 45 29 51 108 56 89
SOURCE: National Science Foundation/Division of Science Resources Statistics, Survey of Earned Doctorates.
NOTES: Persons whose sex is unknown are included in totals but are not shown separately. Categories are grouped differently from questionnaire and summary reports in that linguistics, history of science, American studies, and archaeology are included in social science and not in humanities, and public administration is included in social science and not in professional fields.
21
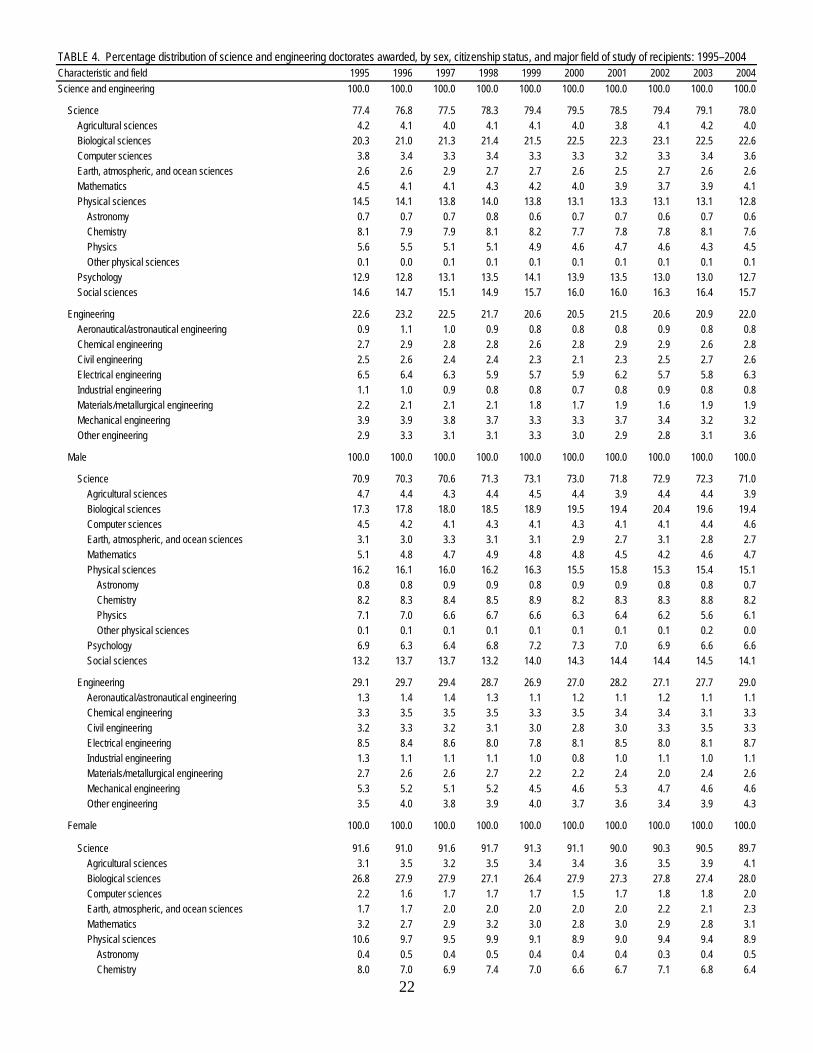
TABLE 4. Percentage distribution of science and engineering doctorates awarded, by sex, citizenship status, and major field of study of recipients: 1995–2004Characteristic and field 1995 1996 1997 1998 1999 2000 2001 2002 2003 2004Science and engineering 100.0 100.0 100.0 100.0 100.0 100.0 100.0 100.0 100.0 100.0
Science 77.4 76.8 77.5 78.3 79.4 79.5 78.5 79.4 79.1 78.0 Agricultural sciences 4.2 4.1 4.0 4.1 4.1 4.0 3.8 4.1 4.2 4.0 Biological sciences 20.3 21.0 21.3 21.4 21.5 22.5 22.3 23.1 22.5 22.6 Computer sciences 3.8 3.4 3.3 3.4 3.3 3.3 3.2 3.3 3.4 3.6 Earth, atmospheric, and ocean sciences 2.6 2.6 2.9 2.7 2.7 2.6 2.5 2.7 2.6 2.6 Mathematics 4.5 4.1 4.1 4.3 4.2 4.0 3.9 3.7 3.9 4.1 Physical sciences 14.5 14.1 13.8 14.0 13.8 13.1 13.3 13.1 13.1 12.8 Astronomy 0.7 0.7 0.7 0.8 0.6 0.7 0.7 0.6 0.7 0.6 Chemistry 8.1 7.9 7.9 8.1 8.2 7.7 7.8 7.8 8.1 7.6 Physics 5.6 5.5 5.1 5.1 4.9 4.6 4.7 4.6 4.3 4.5 Other physical sciences 0.1 0.0 0.1 0.1 0.1 0.1 0.1 0.1 0.1 0.1 Psychology 12.9 12.8 13.1 13.5 14.1 13.9 13.5 13.0 13.0 12.7 Social sciences 14.6 14.7 15.1 14.9 15.7 16.0 16.0 16.3 16.4 15.7
Engineering 22.6 23.2 22.5 21.7 20.6 20.5 21.5 20.6 20.9 22.0 Aeronautical/astronautical engineering 0.9 1.1 1.0 0.9 0.8 0.8 0.8 0.9 0.8 0.8 Chemical engineering 2.7 2.9 2.8 2.8 2.6 2.8 2.9 2.9 2.6 2.8 Civil engineering 2.5 2.6 2.4 2.4 2.3 2.1 2.3 2.5 2.7 2.6 Electrical engineering 6.5 6.4 6.3 5.9 5.7 5.9 6.2 5.7 5.8 6.3 Industrial engineering 1.1 1.0 0.9 0.8 0.8 0.7 0.8 0.9 0.8 0.8 Materials/metallurgical engineering 2.2 2.1 2.1 2.1 1.8 1.7 1.9 1.6 1.9 1.9 Mechanical engineering 3.9 3.9 3.8 3.7 3.3 3.3 3.7 3.4 3.2 3.2 Other engineering 2.9 3.3 3.1 3.1 3.3 3.0 2.9 2.8 3.1 3.6
Male 100.0 100.0 100.0 100.0 100.0 100.0 100.0 100.0 100.0 100.0
Science 70.9 70.3 70.6 71.3 73.1 73.0 71.8 72.9 72.3 71.0 Agricultural sciences 4.7 4.4 4.3 4.4 4.5 4.4 3.9 4.4 4.4 3.9 Biological sciences 17.3 17.8 18.0 18.5 18.9 19.5 19.4 20.4 19.6 19.4 Computer sciences 4.5 4.2 4.1 4.3 4.1 4.3 4.1 4.1 4.4 4.6 Earth, atmospheric, and ocean sciences 3.1 3.0 3.3 3.1 3.1 2.9 2.7 3.1 2.8 2.7 Mathematics 5.1 4.8 4.7 4.9 4.8 4.8 4.5 4.2 4.6 4.7 Physical sciences 16.2 16.1 16.0 16.2 16.3 15.5 15.8 15.3 15.4 15.1 Astronomy 0.8 0.8 0.9 0.9 0.8 0.9 0.9 0.8 0.8 0.7 Chemistry 8.2 8.3 8.4 8.5 8.9 8.2 8.3 8.3 8.8 8.2 Physics 7.1 7.0 6.6 6.7 6.6 6.3 6.4 6.2 5.6 6.1 Other physical sciences 0.1 0.1 0.1 0.1 0.1 0.1 0.1 0.1 0.2 0.0 Psychology 6.9 6.3 6.4 6.8 7.2 7.3 7.0 6.9 6.6 6.6 Social sciences 13.2 13.7 13.7 13.2 14.0 14.3 14.4 14.4 14.5 14.1
Engineering 29.1 29.7 29.4 28.7 26.9 27.0 28.2 27.1 27.7 29.0 Aeronautical/astronautical engineering 1.3 1.4 1.4 1.3 1.1 1.2 1.1 1.2 1.1 1.1 Chemical engineering 3.3 3.5 3.5 3.5 3.3 3.5 3.4 3.4 3.1 3.3 Civil engineering 3.2 3.3 3.2 3.1 3.0 2.8 3.0 3.3 3.5 3.3 Electrical engineering 8.5 8.4 8.6 8.0 7.8 8.1 8.5 8.0 8.1 8.7 Industrial engineering 1.3 1.1 1.1 1.1 1.0 0.8 1.0 1.1 1.0 1.1 Materials/metallurgical engineering 2.7 2.6 2.6 2.7 2.2 2.2 2.4 2.0 2.4 2.6 Mechanical engineering 5.3 5.2 5.1 5.2 4.5 4.6 5.3 4.7 4.6 4.6 Other engineering 3.5 4.0 3.8 3.9 4.0 3.7 3.6 3.4 3.9 4.3
Female 100.0 100.0 100.0 100.0 100.0 100.0 100.0 100.0 100.0 100.0
Science 91.6 91.0 91.6 91.7 91.3 91.1 90.0 90.3 90.5 89.7 Agricultural sciences 3.1 3.5 3.2 3.5 3.4 3.4 3.6 3.5 3.9 4.1 Biological sciences 26.8 27.9 27.9 27.1 26.4 27.9 27.3 27.8 27.4 28.0 Computer sciences 2.2 1.6 1.7 1.7 1.7 1.5 1.7 1.8 1.8 2.0 Earth, atmospheric, and ocean sciences 1.7 1.7 2.0 2.0 2.0 2.0 2.0 2.2 2.1 2.3 Mathematics 3.2 2.7 2.9 3.2 3.0 2.8 3.0 2.9 2.8 3.1 Physical sciences 10.6 9.7 9.5 9.9 9.1 8.9 9.0 9.4 9.4 8.9 Astronomy 0.4 0.5 0.4 0.5 0.4 0.4 0.4 0.3 0.4 0.5 Chemistry 8.0 7.0 6.9 7.4 7.0 6.6 6.7 7.1 6.8 6.4
22
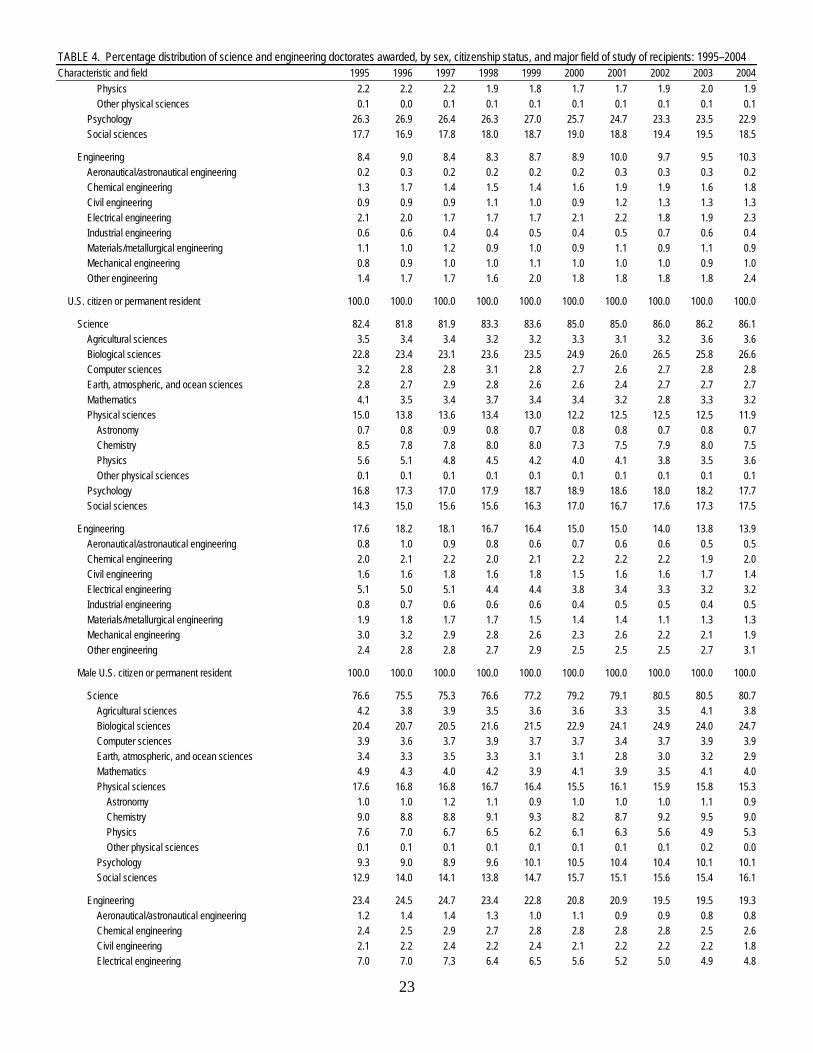
TABLE 4. Percentage distribution of science and engineering doctorates awarded, by sex, citizenship status, and major field of study of recipients: 1995–2004Characteristic and field 1995 1996 1997 1998 1999 2000 2001 2002 2003 2004 Physics 2.2 2.2 2.2 1.9 1.8 1.7 1.7 1.9 2.0 1.9 Other physical sciences 0.1 0.0 0.1 0.1 0.1 0.1 0.1 0.1 0.1 0.1 Psychology 26.3 26.9 26.4 26.3 27.0 25.7 24.7 23.3 23.5 22.9 Social sciences 17.7 16.9 17.8 18.0 18.7 19.0 18.8 19.4 19.5 18.5
Engineering 8.4 9.0 8.4 8.3 8.7 8.9 10.0 9.7 9.5 10.3 Aeronautical/astronautical engineering 0.2 0.3 0.2 0.2 0.2 0.2 0.3 0.3 0.3 0.2 Chemical engineering 1.3 1.7 1.4 1.5 1.4 1.6 1.9 1.9 1.6 1.8 Civil engineering 0.9 0.9 0.9 1.1 1.0 0.9 1.2 1.3 1.3 1.3 Electrical engineering 2.1 2.0 1.7 1.7 1.7 2.1 2.2 1.8 1.9 2.3 Industrial engineering 0.6 0.6 0.4 0.4 0.5 0.4 0.5 0.7 0.6 0.4 Materials/metallurgical engineering 1.1 1.0 1.2 0.9 1.0 0.9 1.1 0.9 1.1 0.9 Mechanical engineering 0.8 0.9 1.0 1.0 1.1 1.0 1.0 1.0 0.9 1.0 Other engineering 1.4 1.7 1.7 1.6 2.0 1.8 1.8 1.8 1.8 2.4
U.S. citizen or permanent resident 100.0 100.0 100.0 100.0 100.0 100.0 100.0 100.0 100.0 100.0
Science 82.4 81.8 81.9 83.3 83.6 85.0 85.0 86.0 86.2 86.1 Agricultural sciences 3.5 3.4 3.4 3.2 3.2 3.3 3.1 3.2 3.6 3.6 Biological sciences 22.8 23.4 23.1 23.6 23.5 24.9 26.0 26.5 25.8 26.6 Computer sciences 3.2 2.8 2.8 3.1 2.8 2.7 2.6 2.7 2.8 2.8 Earth, atmospheric, and ocean sciences 2.8 2.7 2.9 2.8 2.6 2.6 2.4 2.7 2.7 2.7 Mathematics 4.1 3.5 3.4 3.7 3.4 3.4 3.2 2.8 3.3 3.2 Physical sciences 15.0 13.8 13.6 13.4 13.0 12.2 12.5 12.5 12.5 11.9 Astronomy 0.7 0.8 0.9 0.8 0.7 0.8 0.8 0.7 0.8 0.7 Chemistry 8.5 7.8 7.8 8.0 8.0 7.3 7.5 7.9 8.0 7.5 Physics 5.6 5.1 4.8 4.5 4.2 4.0 4.1 3.8 3.5 3.6 Other physical sciences 0.1 0.1 0.1 0.1 0.1 0.1 0.1 0.1 0.1 0.1 Psychology 16.8 17.3 17.0 17.9 18.7 18.9 18.6 18.0 18.2 17.7 Social sciences 14.3 15.0 15.6 15.6 16.3 17.0 16.7 17.6 17.3 17.5
Engineering 17.6 18.2 18.1 16.7 16.4 15.0 15.0 14.0 13.8 13.9 Aeronautical/astronautical engineering 0.8 1.0 0.9 0.8 0.6 0.7 0.6 0.6 0.5 0.5 Chemical engineering 2.0 2.1 2.2 2.0 2.1 2.2 2.2 2.2 1.9 2.0 Civil engineering 1.6 1.6 1.8 1.6 1.8 1.5 1.6 1.6 1.7 1.4 Electrical engineering 5.1 5.0 5.1 4.4 4.4 3.8 3.4 3.3 3.2 3.2 Industrial engineering 0.8 0.7 0.6 0.6 0.6 0.4 0.5 0.5 0.4 0.5 Materials/metallurgical engineering 1.9 1.8 1.7 1.7 1.5 1.4 1.4 1.1 1.3 1.3 Mechanical engineering 3.0 3.2 2.9 2.8 2.6 2.3 2.6 2.2 2.1 1.9 Other engineering 2.4 2.8 2.8 2.7 2.9 2.5 2.5 2.5 2.7 3.1
Male U.S. citizen or permanent resident 100.0 100.0 100.0 100.0 100.0 100.0 100.0 100.0 100.0 100.0
Science 76.6 75.5 75.3 76.6 77.2 79.2 79.1 80.5 80.5 80.7 Agricultural sciences 4.2 3.8 3.9 3.5 3.6 3.6 3.3 3.5 4.1 3.8 Biological sciences 20.4 20.7 20.5 21.6 21.5 22.9 24.1 24.9 24.0 24.7 Computer sciences 3.9 3.6 3.7 3.9 3.7 3.7 3.4 3.7 3.9 3.9 Earth, atmospheric, and ocean sciences 3.4 3.3 3.5 3.3 3.1 3.1 2.8 3.0 3.2 2.9 Mathematics 4.9 4.3 4.0 4.2 3.9 4.1 3.9 3.5 4.1 4.0 Physical sciences 17.6 16.8 16.8 16.7 16.4 15.5 16.1 15.9 15.8 15.3 Astronomy 1.0 1.0 1.2 1.1 0.9 1.0 1.0 1.0 1.1 0.9 Chemistry 9.0 8.8 8.8 9.1 9.3 8.2 8.7 9.2 9.5 9.0 Physics 7.6 7.0 6.7 6.5 6.2 6.1 6.3 5.6 4.9 5.3 Other physical sciences 0.1 0.1 0.1 0.1 0.1 0.1 0.1 0.1 0.2 0.0 Psychology 9.3 9.0 8.9 9.6 10.1 10.5 10.4 10.4 10.1 10.1 Social sciences 12.9 14.0 14.1 13.8 14.7 15.7 15.1 15.6 15.4 16.1
Engineering 23.4 24.5 24.7 23.4 22.8 20.8 20.9 19.5 19.5 19.3 Aeronautical/astronautical engineering 1.2 1.4 1.4 1.3 1.0 1.1 0.9 0.9 0.8 0.8 Chemical engineering 2.4 2.5 2.9 2.7 2.8 2.8 2.8 2.8 2.5 2.6 Civil engineering 2.1 2.2 2.4 2.2 2.4 2.1 2.2 2.2 2.2 1.8 Electrical engineering 7.0 7.0 7.3 6.4 6.5 5.6 5.2 5.0 4.9 4.8
23

TABLE 4. Percentage distribution of science and engineering doctorates awarded, by sex, citizenship status, and major field of study of recipients: 1995–2004Characteristic and field 1995 1996 1997 1998 1999 2000 2001 2002 2003 2004 Industrial engineering 1.0 0.9 0.8 0.7 0.6 0.6 0.6 0.6 0.5 0.6 Materials/metallurgical engineering 2.3 2.3 2.1 2.4 2.0 1.9 1.8 1.5 1.7 1.9 Mechanical engineering 4.3 4.5 4.2 4.2 3.8 3.4 4.1 3.4 3.3 2.9 Other engineering 3.1 3.6 3.6 3.6 3.7 3.3 3.2 3.3 3.5 3.8
Female U.S. citizen or permanent resident 100.0 100.0 100.0 100.0 100.0 100.0 100.0 100.0 100.0 100.0
Science 92.5 92.4 92.7 93.7 93.1 93.1 93.1 93.4 93.6 93.1 Agricultural sciences 2.3 2.7 2.5 2.8 2.6 2.7 2.8 2.7 2.9 3.3 Biological sciences 26.9 27.9 27.5 26.8 26.4 27.9 28.5 28.6 28.1 29.2 Computer sciences 2.1 1.3 1.4 1.7 1.5 1.2 1.4 1.4 1.4 1.5 Earth, atmospheric, and ocean sciences 1.7 1.7 2.1 2.1 1.8 1.9 2.0 2.4 2.1 2.4 Mathematics 2.6 2.1 2.5 2.8 2.7 2.3 2.2 2.0 2.2 2.3 Physical sciences 10.2 8.8 8.4 8.4 7.8 7.7 7.6 8.1 8.3 7.5 Astronomy 0.4 0.5 0.4 0.4 0.4 0.5 0.4 0.3 0.5 0.5 Chemistry 7.8 6.3 6.2 6.5 6.0 5.9 5.9 6.3 6.1 5.6 Physics 2.1 1.9 1.8 1.5 1.3 1.2 1.3 1.4 1.7 1.3 Other physical sciences 0.0 0.0 0.1 0.1 0.1 0.1 0.0 0.1 0.1 0.1 Psychology 29.8 31.4 30.1 30.8 31.5 30.5 29.7 28.0 28.8 27.7 Social sciences 16.8 16.7 18.1 18.2 18.7 18.9 18.9 20.2 19.7 19.4
Engineering 7.5 7.6 7.3 6.3 6.9 6.9 6.9 6.6 6.4 6.9 Aeronautical/astronautical engineering 0.2 0.3 0.2 0.2 0.1 0.2 0.3 0.2 0.2 0.1 Chemical engineering 1.3 1.4 1.1 1.1 1.1 1.4 1.3 1.3 1.1 1.2 Civil engineering 0.8 0.7 0.8 0.8 0.9 0.7 1.0 0.9 1.0 1.0 Electrical engineering 1.7 1.5 1.5 1.3 1.1 1.3 1.0 1.0 1.0 1.0 Industrial engineering 0.5 0.5 0.4 0.3 0.4 0.3 0.4 0.5 0.3 0.3 Materials/metallurgical engineering 1.1 0.9 1.0 0.7 0.8 0.8 0.8 0.7 0.7 0.5 Mechanical engineering 0.7 0.9 0.8 0.7 0.8 0.8 0.5 0.7 0.6 0.6 Other engineering 1.2 1.4 1.5 1.3 1.7 1.5 1.6 1.5 1.7 2.1
U.S. citizen 100.0 100.0 100.0 100.0 100.0 100.0 100.0 100.0 100.0 100.0
Science 84.6 83.4 83.0 84.2 84.4 85.9 85.8 86.8 87.0 86.8 Agricultural sciences 3.6 3.3 3.3 3.1 3.2 3.2 3.1 3.2 3.6 3.6 Biological sciences 22.6 22.7 22.8 23.1 23.0 24.9 25.9 26.5 25.9 26.9 Computer sciences 3.1 2.7 2.7 2.9 2.6 2.5 2.4 2.5 2.6 2.7 Earth, atmospheric, and ocean sciences 2.7 2.7 2.9 2.8 2.6 2.7 2.4 2.7 2.7 2.8 Mathematics 3.6 3.1 3.3 3.5 3.4 3.3 3.1 2.9 3.2 3.1 Physical sciences 13.8 13.3 13.2 13.2 12.8 12.0 12.4 12.4 12.4 11.9 Astronomy 0.8 0.9 0.9 0.8 0.7 0.8 0.8 0.7 0.9 0.8 Chemistry 8.0 7.5 7.7 7.9 7.9 7.1 7.5 7.9 8.0 7.5 Physics 4.9 4.9 4.5 4.3 4.1 4.0 4.0 3.7 3.4 3.5 Other physical sciences 0.1 0.1 0.1 0.1 0.1 0.1 0.1 0.1 0.1 0.1 Psychology 19.9 20.0 18.8 19.6 20.2 20.1 19.6 19.0 19.1 18.5 Social sciences 15.4 15.6 16.0 15.9 16.5 17.2 16.8 17.7 17.4 17.4
Engineering 15.4 16.6 17.0 15.8 15.6 14.1 14.2 13.2 13.0 13.2 Aeronautical/astronautical engineering 0.9 1.1 1.0 0.9 0.6 0.7 0.6 0.6 0.5 0.5 Chemical engineering 1.9 2.0 2.0 2.0 2.1 2.2 2.2 2.1 1.9 2.0 Civil engineering 1.3 1.4 1.5 1.5 1.6 1.4 1.5 1.5 1.6 1.3 Electrical engineering 4.4 4.5 4.7 3.9 4.0 3.4 3.1 3.0 2.8 2.8 Industrial engineering 0.7 0.7 0.6 0.5 0.5 0.4 0.5 0.5 0.4 0.4 Materials/metallurgical engineering 1.5 1.6 1.7 1.6 1.4 1.4 1.3 1.1 1.2 1.3 Mechanical engineering 2.5 2.8 2.8 2.7 2.5 2.2 2.6 2.0 2.0 1.8 Other engineering 2.2 2.6 2.7 2.7 2.8 2.4 2.5 2.5 2.7 3.0
Male U.S. citizen 100.0 100.0 100.0 100.0 100.0 100.0 100.0 100.0 100.0 100.0
Science 79.0 77.3 76.5 77.5 78.2 80.2 80.0 81.3 81.6 81.6 Agricultural sciences 4.4 3.8 3.8 3.4 3.6 3.6 3.3 3.6 4.2 3.9 Biological sciences 20.9 20.5 20.5 21.3 21.3 23.1 24.3 25.3 24.4 25.0 Computer sciences 3.8 3.6 3.5 3.8 3.5 3.5 3.3 3.4 3.7 3.7
24
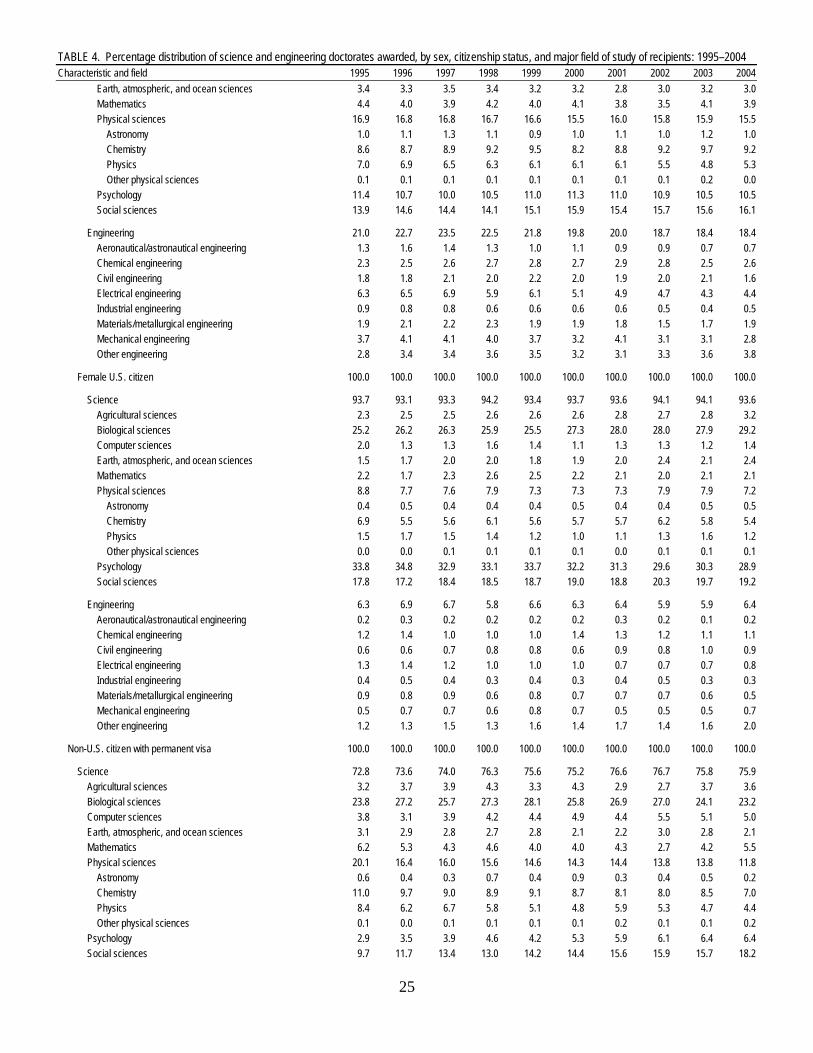
TABLE 4. Percentage distribution of science and engineering doctorates awarded, by sex, citizenship status, and major field of study of recipients: 1995–2004Characteristic and field 1995 1996 1997 1998 1999 2000 2001 2002 2003 2004 Earth, atmospheric, and ocean sciences 3.4 3.3 3.5 3.4 3.2 3.2 2.8 3.0 3.2 3.0 Mathematics 4.4 4.0 3.9 4.2 4.0 4.1 3.8 3.5 4.1 3.9 Physical sciences 16.9 16.8 16.8 16.7 16.6 15.5 16.0 15.8 15.9 15.5 Astronomy 1.0 1.1 1.3 1.1 0.9 1.0 1.1 1.0 1.2 1.0 Chemistry 8.6 8.7 8.9 9.2 9.5 8.2 8.8 9.2 9.7 9.2 Physics 7.0 6.9 6.5 6.3 6.1 6.1 6.1 5.5 4.8 5.3 Other physical sciences 0.1 0.1 0.1 0.1 0.1 0.1 0.1 0.1 0.2 0.0 Psychology 11.4 10.7 10.0 10.5 11.0 11.3 11.0 10.9 10.5 10.5 Social sciences 13.9 14.6 14.4 14.1 15.1 15.9 15.4 15.7 15.6 16.1
Engineering 21.0 22.7 23.5 22.5 21.8 19.8 20.0 18.7 18.4 18.4 Aeronautical/astronautical engineering 1.3 1.6 1.4 1.3 1.0 1.1 0.9 0.9 0.7 0.7 Chemical engineering 2.3 2.5 2.6 2.7 2.8 2.7 2.9 2.8 2.5 2.6 Civil engineering 1.8 1.8 2.1 2.0 2.2 2.0 1.9 2.0 2.1 1.6 Electrical engineering 6.3 6.5 6.9 5.9 6.1 5.1 4.9 4.7 4.3 4.4 Industrial engineering 0.9 0.8 0.8 0.6 0.6 0.6 0.6 0.5 0.4 0.5 Materials/metallurgical engineering 1.9 2.1 2.2 2.3 1.9 1.9 1.8 1.5 1.7 1.9 Mechanical engineering 3.7 4.1 4.1 4.0 3.7 3.2 4.1 3.1 3.1 2.8 Other engineering 2.8 3.4 3.4 3.6 3.5 3.2 3.1 3.3 3.6 3.8
Female U.S. citizen 100.0 100.0 100.0 100.0 100.0 100.0 100.0 100.0 100.0 100.0
Science 93.7 93.1 93.3 94.2 93.4 93.7 93.6 94.1 94.1 93.6 Agricultural sciences 2.3 2.5 2.5 2.6 2.6 2.6 2.8 2.7 2.8 3.2 Biological sciences 25.2 26.2 26.3 25.9 25.5 27.3 28.0 28.0 27.9 29.2 Computer sciences 2.0 1.3 1.3 1.6 1.4 1.1 1.3 1.3 1.2 1.4 Earth, atmospheric, and ocean sciences 1.5 1.7 2.0 2.0 1.8 1.9 2.0 2.4 2.1 2.4 Mathematics 2.2 1.7 2.3 2.6 2.5 2.2 2.1 2.0 2.1 2.1 Physical sciences 8.8 7.7 7.6 7.9 7.3 7.3 7.3 7.9 7.9 7.2 Astronomy 0.4 0.5 0.4 0.4 0.4 0.5 0.4 0.4 0.5 0.5 Chemistry 6.9 5.5 5.6 6.1 5.6 5.7 5.7 6.2 5.8 5.4 Physics 1.5 1.7 1.5 1.4 1.2 1.0 1.1 1.3 1.6 1.2 Other physical sciences 0.0 0.0 0.1 0.1 0.1 0.1 0.0 0.1 0.1 0.1 Psychology 33.8 34.8 32.9 33.1 33.7 32.2 31.3 29.6 30.3 28.9 Social sciences 17.8 17.2 18.4 18.5 18.7 19.0 18.8 20.3 19.7 19.2
Engineering 6.3 6.9 6.7 5.8 6.6 6.3 6.4 5.9 5.9 6.4 Aeronautical/astronautical engineering 0.2 0.3 0.2 0.2 0.2 0.2 0.3 0.2 0.1 0.2 Chemical engineering 1.2 1.4 1.0 1.0 1.0 1.4 1.3 1.2 1.1 1.1 Civil engineering 0.6 0.6 0.7 0.8 0.8 0.6 0.9 0.8 1.0 0.9 Electrical engineering 1.3 1.4 1.2 1.0 1.0 1.0 0.7 0.7 0.7 0.8 Industrial engineering 0.4 0.5 0.4 0.3 0.4 0.3 0.4 0.5 0.3 0.3 Materials/metallurgical engineering 0.9 0.8 0.9 0.6 0.8 0.7 0.7 0.7 0.6 0.5 Mechanical engineering 0.5 0.7 0.7 0.6 0.8 0.7 0.5 0.5 0.5 0.7 Other engineering 1.2 1.3 1.5 1.3 1.6 1.4 1.7 1.4 1.6 2.0
Non-U.S. citizen with permanent visa 100.0 100.0 100.0 100.0 100.0 100.0 100.0 100.0 100.0 100.0
Science 72.8 73.6 74.0 76.3 75.6 75.2 76.6 76.7 75.8 75.9 Agricultural sciences 3.2 3.7 3.9 4.3 3.3 4.3 2.9 2.7 3.7 3.6 Biological sciences 23.8 27.2 25.7 27.3 28.1 25.8 26.9 27.0 24.1 23.2 Computer sciences 3.8 3.1 3.9 4.2 4.4 4.9 4.4 5.5 5.1 5.0 Earth, atmospheric, and ocean sciences 3.1 2.9 2.8 2.7 2.8 2.1 2.2 3.0 2.8 2.1 Mathematics 6.2 5.3 4.3 4.6 4.0 4.0 4.3 2.7 4.2 5.5 Physical sciences 20.1 16.4 16.0 15.6 14.6 14.3 14.4 13.8 13.8 11.8 Astronomy 0.6 0.4 0.3 0.7 0.4 0.9 0.3 0.4 0.5 0.2 Chemistry 11.0 9.7 9.0 8.9 9.1 8.7 8.1 8.0 8.5 7.0 Physics 8.4 6.2 6.7 5.8 5.1 4.8 5.9 5.3 4.7 4.4 Other physical sciences 0.1 0.0 0.1 0.1 0.1 0.1 0.2 0.1 0.1 0.2 Psychology 2.9 3.5 3.9 4.6 4.2 5.3 5.9 6.1 6.4 6.4 Social sciences 9.7 11.7 13.4 13.0 14.2 14.4 15.6 15.9 15.7 18.2
25
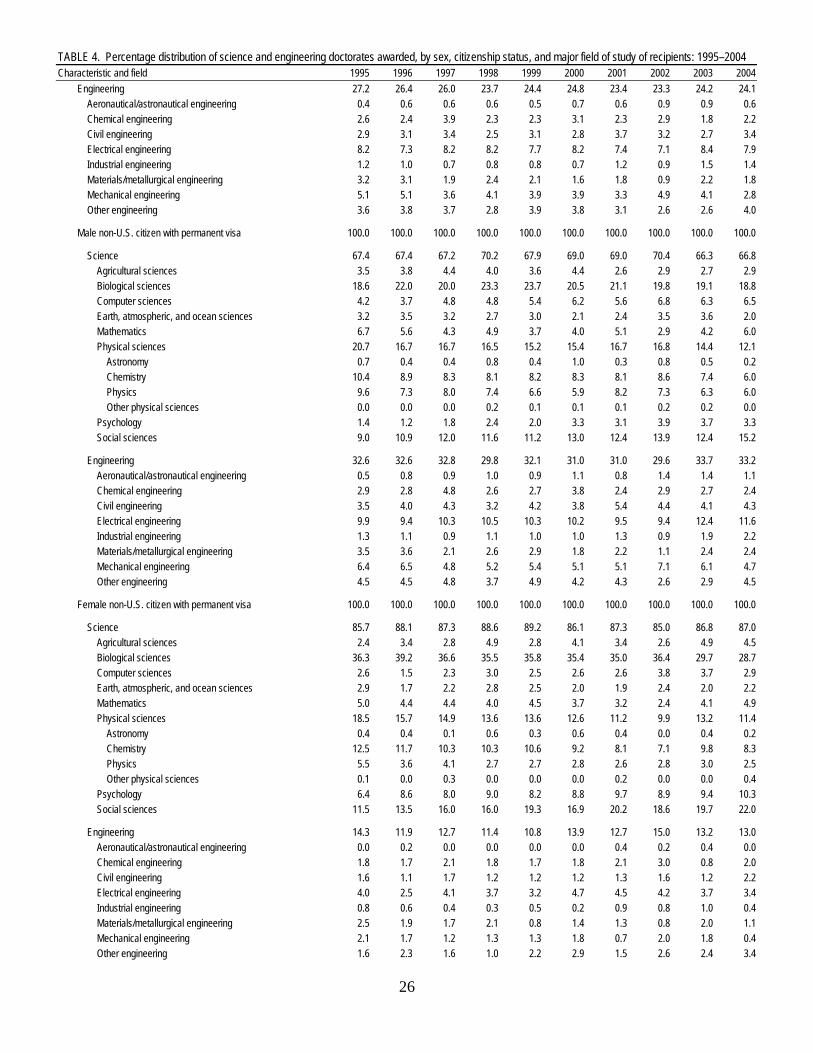
TABLE 4. Percentage distribution of science and engineering doctorates awarded, by sex, citizenship status, and major field of study of recipients: 1995–2004Characteristic and field 1995 1996 1997 1998 1999 2000 2001 2002 2003 2004 Engineering 27.2 26.4 26.0 23.7 24.4 24.8 23.4 23.3 24.2 24.1 Aeronautical/astronautical engineering 0.4 0.6 0.6 0.6 0.5 0.7 0.6 0.9 0.9 0.6 Chemical engineering 2.6 2.4 3.9 2.3 2.3 3.1 2.3 2.9 1.8 2.2 Civil engineering 2.9 3.1 3.4 2.5 3.1 2.8 3.7 3.2 2.7 3.4 Electrical engineering 8.2 7.3 8.2 8.2 7.7 8.2 7.4 7.1 8.4 7.9 Industrial engineering 1.2 1.0 0.7 0.8 0.8 0.7 1.2 0.9 1.5 1.4 Materials/metallurgical engineering 3.2 3.1 1.9 2.4 2.1 1.6 1.8 0.9 2.2 1.8 Mechanical engineering 5.1 5.1 3.6 4.1 3.9 3.9 3.3 4.9 4.1 2.8 Other engineering 3.6 3.8 3.7 2.8 3.9 3.8 3.1 2.6 2.6 4.0
Male non-U.S. citizen with permanent visa 100.0 100.0 100.0 100.0 100.0 100.0 100.0 100.0 100.0 100.0
Science 67.4 67.4 67.2 70.2 67.9 69.0 69.0 70.4 66.3 66.8 Agricultural sciences 3.5 3.8 4.4 4.0 3.6 4.4 2.6 2.9 2.7 2.9 Biological sciences 18.6 22.0 20.0 23.3 23.7 20.5 21.1 19.8 19.1 18.8 Computer sciences 4.2 3.7 4.8 4.8 5.4 6.2 5.6 6.8 6.3 6.5 Earth, atmospheric, and ocean sciences 3.2 3.5 3.2 2.7 3.0 2.1 2.4 3.5 3.6 2.0 Mathematics 6.7 5.6 4.3 4.9 3.7 4.0 5.1 2.9 4.2 6.0 Physical sciences 20.7 16.7 16.7 16.5 15.2 15.4 16.7 16.8 14.4 12.1 Astronomy 0.7 0.4 0.4 0.8 0.4 1.0 0.3 0.8 0.5 0.2 Chemistry 10.4 8.9 8.3 8.1 8.2 8.3 8.1 8.6 7.4 6.0 Physics 9.6 7.3 8.0 7.4 6.6 5.9 8.2 7.3 6.3 6.0 Other physical sciences 0.0 0.0 0.0 0.2 0.1 0.1 0.1 0.2 0.2 0.0 Psychology 1.4 1.2 1.8 2.4 2.0 3.3 3.1 3.9 3.7 3.3 Social sciences 9.0 10.9 12.0 11.6 11.2 13.0 12.4 13.9 12.4 15.2
Engineering 32.6 32.6 32.8 29.8 32.1 31.0 31.0 29.6 33.7 33.2 Aeronautical/astronautical engineering 0.5 0.8 0.9 1.0 0.9 1.1 0.8 1.4 1.4 1.1 Chemical engineering 2.9 2.8 4.8 2.6 2.7 3.8 2.4 2.9 2.7 2.4 Civil engineering 3.5 4.0 4.3 3.2 4.2 3.8 5.4 4.4 4.1 4.3 Electrical engineering 9.9 9.4 10.3 10.5 10.3 10.2 9.5 9.4 12.4 11.6 Industrial engineering 1.3 1.1 0.9 1.1 1.0 1.0 1.3 0.9 1.9 2.2 Materials/metallurgical engineering 3.5 3.6 2.1 2.6 2.9 1.8 2.2 1.1 2.4 2.4 Mechanical engineering 6.4 6.5 4.8 5.2 5.4 5.1 5.1 7.1 6.1 4.7 Other engineering 4.5 4.5 4.8 3.7 4.9 4.2 4.3 2.6 2.9 4.5
Female non-U.S. citizen with permanent visa 100.0 100.0 100.0 100.0 100.0 100.0 100.0 100.0 100.0 100.0
Science 85.7 88.1 87.3 88.6 89.2 86.1 87.3 85.0 86.8 87.0 Agricultural sciences 2.4 3.4 2.8 4.9 2.8 4.1 3.4 2.6 4.9 4.5 Biological sciences 36.3 39.2 36.6 35.5 35.8 35.4 35.0 36.4 29.7 28.7 Computer sciences 2.6 1.5 2.3 3.0 2.5 2.6 2.6 3.8 3.7 2.9 Earth, atmospheric, and ocean sciences 2.9 1.7 2.2 2.8 2.5 2.0 1.9 2.4 2.0 2.2 Mathematics 5.0 4.4 4.4 4.0 4.5 3.7 3.2 2.4 4.1 4.9 Physical sciences 18.5 15.7 14.9 13.6 13.6 12.6 11.2 9.9 13.2 11.4 Astronomy 0.4 0.4 0.1 0.6 0.3 0.6 0.4 0.0 0.4 0.2 Chemistry 12.5 11.7 10.3 10.3 10.6 9.2 8.1 7.1 9.8 8.3 Physics 5.5 3.6 4.1 2.7 2.7 2.8 2.6 2.8 3.0 2.5 Other physical sciences 0.1 0.0 0.3 0.0 0.0 0.0 0.2 0.0 0.0 0.4 Psychology 6.4 8.6 8.0 9.0 8.2 8.8 9.7 8.9 9.4 10.3 Social sciences 11.5 13.5 16.0 16.0 19.3 16.9 20.2 18.6 19.7 22.0
Engineering 14.3 11.9 12.7 11.4 10.8 13.9 12.7 15.0 13.2 13.0 Aeronautical/astronautical engineering 0.0 0.2 0.0 0.0 0.0 0.0 0.4 0.2 0.4 0.0 Chemical engineering 1.8 1.7 2.1 1.8 1.7 1.8 2.1 3.0 0.8 2.0 Civil engineering 1.6 1.1 1.7 1.2 1.2 1.2 1.3 1.6 1.2 2.2 Electrical engineering 4.0 2.5 4.1 3.7 3.2 4.7 4.5 4.2 3.7 3.4 Industrial engineering 0.8 0.6 0.4 0.3 0.5 0.2 0.9 0.8 1.0 0.4 Materials/metallurgical engineering 2.5 1.9 1.7 2.1 0.8 1.4 1.3 0.8 2.0 1.1 Mechanical engineering 2.1 1.7 1.2 1.3 1.3 1.8 0.7 2.0 1.8 0.4 Other engineering 1.6 2.3 1.6 1.0 2.2 2.9 1.5 2.6 2.4 3.4
26
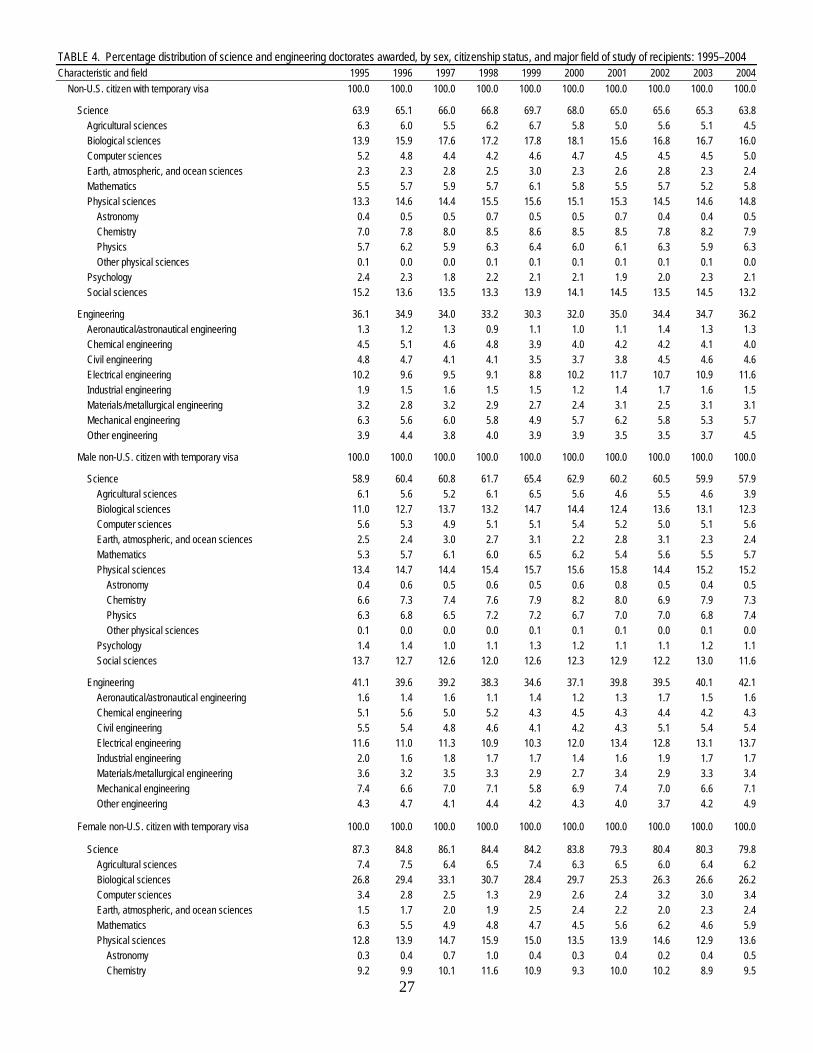
TABLE 4. Percentage distribution of science and engineering doctorates awarded, by sex, citizenship status, and major field of study of recipients: 1995–2004Characteristic and field 1995 1996 1997 1998 1999 2000 2001 2002 2003 2004 Non-U.S. citizen with temporary visa 100.0 100.0 100.0 100.0 100.0 100.0 100.0 100.0 100.0 100.0
Science 63.9 65.1 66.0 66.8 69.7 68.0 65.0 65.6 65.3 63.8 Agricultural sciences 6.3 6.0 5.5 6.2 6.7 5.8 5.0 5.6 5.1 4.5 Biological sciences 13.9 15.9 17.6 17.2 17.8 18.1 15.6 16.8 16.7 16.0 Computer sciences 5.2 4.8 4.4 4.2 4.6 4.7 4.5 4.5 4.5 5.0 Earth, atmospheric, and ocean sciences 2.3 2.3 2.8 2.5 3.0 2.3 2.6 2.8 2.3 2.4 Mathematics 5.5 5.7 5.9 5.7 6.1 5.8 5.5 5.7 5.2 5.8 Physical sciences 13.3 14.6 14.4 15.5 15.6 15.1 15.3 14.5 14.6 14.8 Astronomy 0.4 0.5 0.5 0.7 0.5 0.5 0.7 0.4 0.4 0.5 Chemistry 7.0 7.8 8.0 8.5 8.6 8.5 8.5 7.8 8.2 7.9 Physics 5.7 6.2 5.9 6.3 6.4 6.0 6.1 6.3 5.9 6.3 Other physical sciences 0.1 0.0 0.0 0.1 0.1 0.1 0.1 0.1 0.1 0.0 Psychology 2.4 2.3 1.8 2.2 2.1 2.1 1.9 2.0 2.3 2.1 Social sciences 15.2 13.6 13.5 13.3 13.9 14.1 14.5 13.5 14.5 13.2
Engineering 36.1 34.9 34.0 33.2 30.3 32.0 35.0 34.4 34.7 36.2 Aeronautical/astronautical engineering 1.3 1.2 1.3 0.9 1.1 1.0 1.1 1.4 1.3 1.3 Chemical engineering 4.5 5.1 4.6 4.8 3.9 4.0 4.2 4.2 4.1 4.0 Civil engineering 4.8 4.7 4.1 4.1 3.5 3.7 3.8 4.5 4.6 4.6 Electrical engineering 10.2 9.6 9.5 9.1 8.8 10.2 11.7 10.7 10.9 11.6 Industrial engineering 1.9 1.5 1.6 1.5 1.5 1.2 1.4 1.7 1.6 1.5 Materials/metallurgical engineering 3.2 2.8 3.2 2.9 2.7 2.4 3.1 2.5 3.1 3.1 Mechanical engineering 6.3 5.6 6.0 5.8 4.9 5.7 6.2 5.8 5.3 5.7 Other engineering 3.9 4.4 3.8 4.0 3.9 3.9 3.5 3.5 3.7 4.5
Male non-U.S. citizen with temporary visa 100.0 100.0 100.0 100.0 100.0 100.0 100.0 100.0 100.0 100.0
Science 58.9 60.4 60.8 61.7 65.4 62.9 60.2 60.5 59.9 57.9 Agricultural sciences 6.1 5.6 5.2 6.1 6.5 5.6 4.6 5.5 4.6 3.9 Biological sciences 11.0 12.7 13.7 13.2 14.7 14.4 12.4 13.6 13.1 12.3 Computer sciences 5.6 5.3 4.9 5.1 5.1 5.4 5.2 5.0 5.1 5.6 Earth, atmospheric, and ocean sciences 2.5 2.4 3.0 2.7 3.1 2.2 2.8 3.1 2.3 2.4 Mathematics 5.3 5.7 6.1 6.0 6.5 6.2 5.4 5.6 5.5 5.7 Physical sciences 13.4 14.7 14.4 15.4 15.7 15.6 15.8 14.4 15.2 15.2 Astronomy 0.4 0.6 0.5 0.6 0.5 0.6 0.8 0.5 0.4 0.5 Chemistry 6.6 7.3 7.4 7.6 7.9 8.2 8.0 6.9 7.9 7.3 Physics 6.3 6.8 6.5 7.2 7.2 6.7 7.0 7.0 6.8 7.4 Other physical sciences 0.1 0.0 0.0 0.0 0.1 0.1 0.1 0.0 0.1 0.0 Psychology 1.4 1.4 1.0 1.1 1.3 1.2 1.1 1.1 1.2 1.1 Social sciences 13.7 12.7 12.6 12.0 12.6 12.3 12.9 12.2 13.0 11.6
Engineering 41.1 39.6 39.2 38.3 34.6 37.1 39.8 39.5 40.1 42.1 Aeronautical/astronautical engineering 1.6 1.4 1.6 1.1 1.4 1.2 1.3 1.7 1.5 1.6 Chemical engineering 5.1 5.6 5.0 5.2 4.3 4.5 4.3 4.4 4.2 4.3 Civil engineering 5.5 5.4 4.8 4.6 4.1 4.2 4.3 5.1 5.4 5.4 Electrical engineering 11.6 11.0 11.3 10.9 10.3 12.0 13.4 12.8 13.1 13.7 Industrial engineering 2.0 1.6 1.8 1.7 1.7 1.4 1.6 1.9 1.7 1.7 Materials/metallurgical engineering 3.6 3.2 3.5 3.3 2.9 2.7 3.4 2.9 3.3 3.4 Mechanical engineering 7.4 6.6 7.0 7.1 5.8 6.9 7.4 7.0 6.6 7.1 Other engineering 4.3 4.7 4.1 4.4 4.2 4.3 4.0 3.7 4.2 4.9
Female non-U.S. citizen with temporary visa 100.0 100.0 100.0 100.0 100.0 100.0 100.0 100.0 100.0 100.0
Science 87.3 84.8 86.1 84.4 84.2 83.8 79.3 80.4 80.3 79.8 Agricultural sciences 7.4 7.5 6.4 6.5 7.4 6.3 6.5 6.0 6.4 6.2 Biological sciences 26.8 29.4 33.1 30.7 28.4 29.7 25.3 26.3 26.6 26.2 Computer sciences 3.4 2.8 2.5 1.3 2.9 2.6 2.4 3.2 3.0 3.4 Earth, atmospheric, and ocean sciences 1.5 1.7 2.0 1.9 2.5 2.4 2.2 2.0 2.3 2.4 Mathematics 6.3 5.5 4.9 4.8 4.7 4.5 5.6 6.2 4.6 5.9 Physical sciences 12.8 13.9 14.7 15.9 15.0 13.5 13.9 14.6 12.9 13.6 Astronomy 0.3 0.4 0.7 1.0 0.4 0.3 0.4 0.2 0.4 0.5 Chemistry 9.2 9.9 10.1 11.6 10.9 9.3 10.0 10.2 8.9 9.5
27
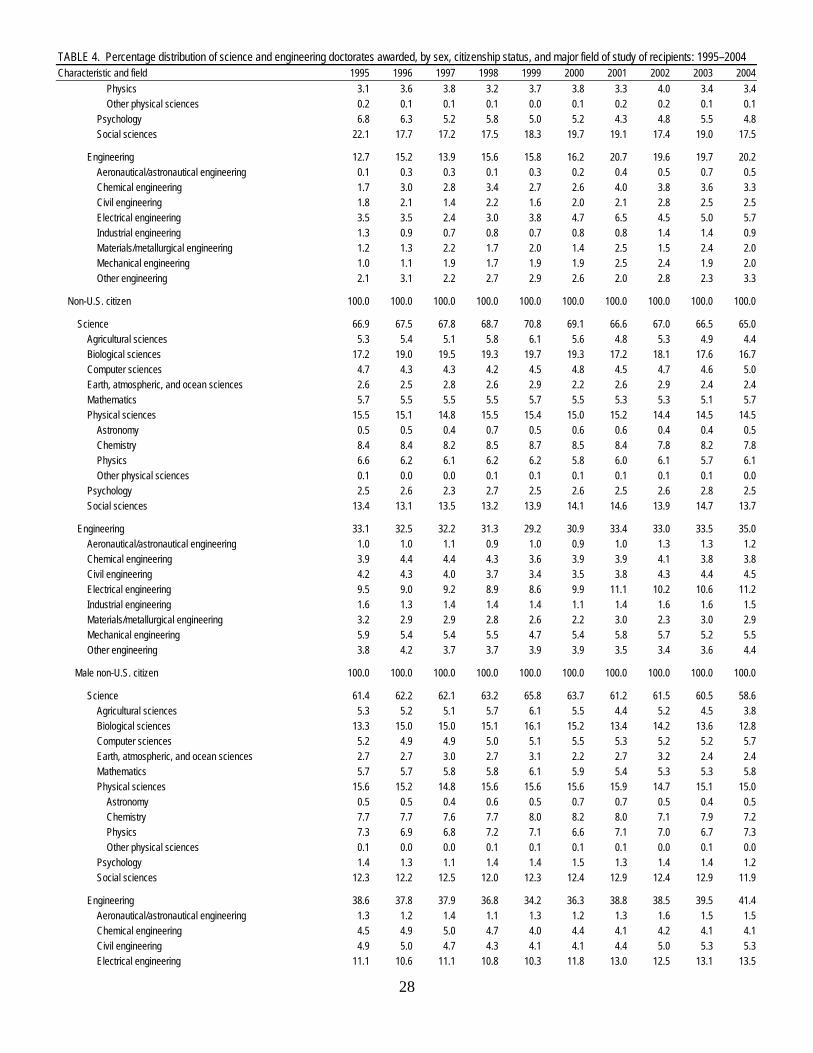
TABLE 4. Percentage distribution of science and engineering doctorates awarded, by sex, citizenship status, and major field of study of recipients: 1995–2004Characteristic and field 1995 1996 1997 1998 1999 2000 2001 2002 2003 2004 Physics 3.1 3.6 3.8 3.2 3.7 3.8 3.3 4.0 3.4 3.4 Other physical sciences 0.2 0.1 0.1 0.1 0.0 0.1 0.2 0.2 0.1 0.1 Psychology 6.8 6.3 5.2 5.8 5.0 5.2 4.3 4.8 5.5 4.8 Social sciences 22.1 17.7 17.2 17.5 18.3 19.7 19.1 17.4 19.0 17.5
Engineering 12.7 15.2 13.9 15.6 15.8 16.2 20.7 19.6 19.7 20.2 Aeronautical/astronautical engineering 0.1 0.3 0.3 0.1 0.3 0.2 0.4 0.5 0.7 0.5 Chemical engineering 1.7 3.0 2.8 3.4 2.7 2.6 4.0 3.8 3.6 3.3 Civil engineering 1.8 2.1 1.4 2.2 1.6 2.0 2.1 2.8 2.5 2.5 Electrical engineering 3.5 3.5 2.4 3.0 3.8 4.7 6.5 4.5 5.0 5.7 Industrial engineering 1.3 0.9 0.7 0.8 0.7 0.8 0.8 1.4 1.4 0.9 Materials/metallurgical engineering 1.2 1.3 2.2 1.7 2.0 1.4 2.5 1.5 2.4 2.0 Mechanical engineering 1.0 1.1 1.9 1.7 1.9 1.9 2.5 2.4 1.9 2.0 Other engineering 2.1 3.1 2.2 2.7 2.9 2.6 2.0 2.8 2.3 3.3
Non-U.S. citizen 100.0 100.0 100.0 100.0 100.0 100.0 100.0 100.0 100.0 100.0
Science 66.9 67.5 67.8 68.7 70.8 69.1 66.6 67.0 66.5 65.0 Agricultural sciences 5.3 5.4 5.1 5.8 6.1 5.6 4.8 5.3 4.9 4.4 Biological sciences 17.2 19.0 19.5 19.3 19.7 19.3 17.2 18.1 17.6 16.7 Computer sciences 4.7 4.3 4.3 4.2 4.5 4.8 4.5 4.7 4.6 5.0 Earth, atmospheric, and ocean sciences 2.6 2.5 2.8 2.6 2.9 2.2 2.6 2.9 2.4 2.4 Mathematics 5.7 5.5 5.5 5.5 5.7 5.5 5.3 5.3 5.1 5.7 Physical sciences 15.5 15.1 14.8 15.5 15.4 15.0 15.2 14.4 14.5 14.5 Astronomy 0.5 0.5 0.4 0.7 0.5 0.6 0.6 0.4 0.4 0.5 Chemistry 8.4 8.4 8.2 8.5 8.7 8.5 8.4 7.8 8.2 7.8 Physics 6.6 6.2 6.1 6.2 6.2 5.8 6.0 6.1 5.7 6.1 Other physical sciences 0.1 0.0 0.0 0.1 0.1 0.1 0.1 0.1 0.1 0.0 Psychology 2.5 2.6 2.3 2.7 2.5 2.6 2.5 2.6 2.8 2.5 Social sciences 13.4 13.1 13.5 13.2 13.9 14.1 14.6 13.9 14.7 13.7
Engineering 33.1 32.5 32.2 31.3 29.2 30.9 33.4 33.0 33.5 35.0 Aeronautical/astronautical engineering 1.0 1.0 1.1 0.9 1.0 0.9 1.0 1.3 1.3 1.2 Chemical engineering 3.9 4.4 4.4 4.3 3.6 3.9 3.9 4.1 3.8 3.8 Civil engineering 4.2 4.3 4.0 3.7 3.4 3.5 3.8 4.3 4.4 4.5 Electrical engineering 9.5 9.0 9.2 8.9 8.6 9.9 11.1 10.2 10.6 11.2 Industrial engineering 1.6 1.3 1.4 1.4 1.4 1.1 1.4 1.6 1.6 1.5 Materials/metallurgical engineering 3.2 2.9 2.9 2.8 2.6 2.2 3.0 2.3 3.0 2.9 Mechanical engineering 5.9 5.4 5.4 5.5 4.7 5.4 5.8 5.7 5.2 5.5 Other engineering 3.8 4.2 3.7 3.7 3.9 3.9 3.5 3.4 3.6 4.4
Male non-U.S. citizen 100.0 100.0 100.0 100.0 100.0 100.0 100.0 100.0 100.0 100.0
Science 61.4 62.2 62.1 63.2 65.8 63.7 61.2 61.5 60.5 58.6 Agricultural sciences 5.3 5.2 5.1 5.7 6.1 5.5 4.4 5.2 4.5 3.8 Biological sciences 13.3 15.0 15.0 15.1 16.1 15.2 13.4 14.2 13.6 12.8 Computer sciences 5.2 4.9 4.9 5.0 5.1 5.5 5.3 5.2 5.2 5.7 Earth, atmospheric, and ocean sciences 2.7 2.7 3.0 2.7 3.1 2.2 2.7 3.2 2.4 2.4 Mathematics 5.7 5.7 5.8 5.8 6.1 5.9 5.4 5.3 5.3 5.8 Physical sciences 15.6 15.2 14.8 15.6 15.6 15.6 15.9 14.7 15.1 15.0 Astronomy 0.5 0.5 0.4 0.6 0.5 0.7 0.7 0.5 0.4 0.5 Chemistry 7.7 7.7 7.6 7.7 8.0 8.2 8.0 7.1 7.9 7.2 Physics 7.3 6.9 6.8 7.2 7.1 6.6 7.1 7.0 6.7 7.3 Other physical sciences 0.1 0.0 0.0 0.1 0.1 0.1 0.1 0.0 0.1 0.0 Psychology 1.4 1.3 1.1 1.4 1.4 1.5 1.3 1.4 1.4 1.2 Social sciences 12.3 12.2 12.5 12.0 12.3 12.4 12.9 12.4 12.9 11.9
Engineering 38.6 37.8 37.9 36.8 34.2 36.3 38.8 38.5 39.5 41.4 Aeronautical/astronautical engineering 1.3 1.2 1.4 1.1 1.3 1.2 1.3 1.6 1.5 1.5 Chemical engineering 4.5 4.9 5.0 4.7 4.0 4.4 4.1 4.2 4.1 4.1 Civil engineering 4.9 5.0 4.7 4.3 4.1 4.1 4.4 5.0 5.3 5.3 Electrical engineering 11.1 10.6 11.1 10.8 10.3 11.8 13.0 12.5 13.1 13.5
28
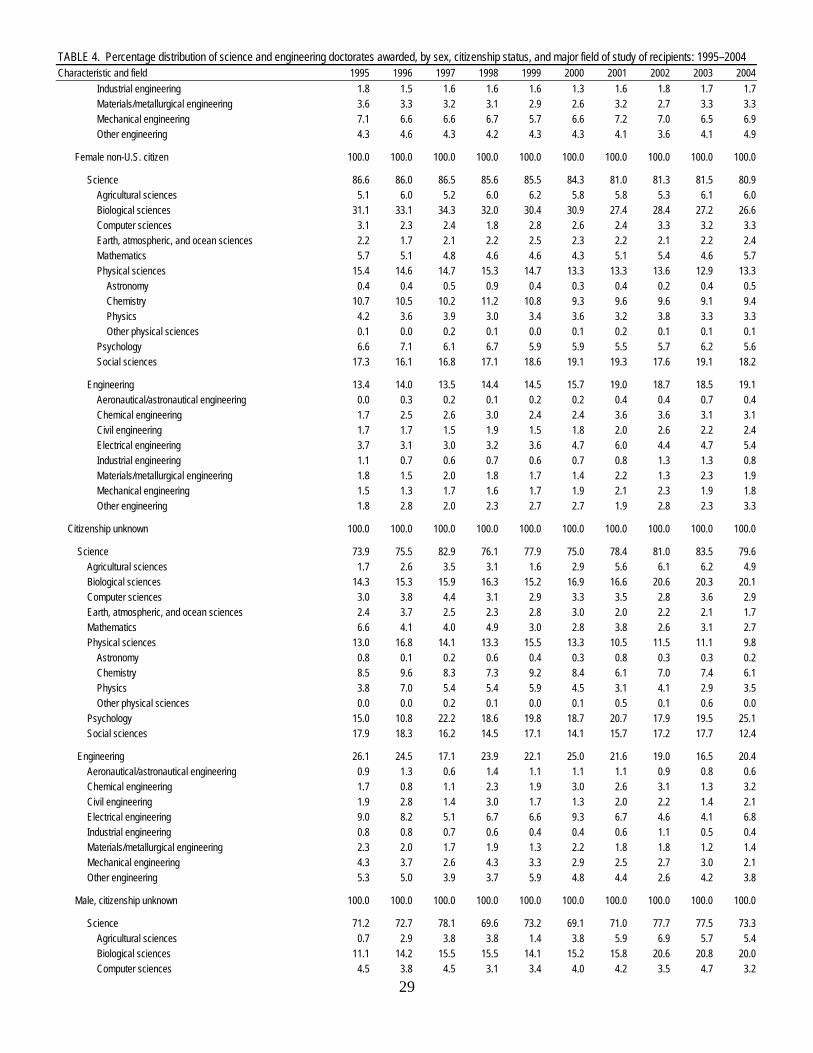
TABLE 4. Percentage distribution of science and engineering doctorates awarded, by sex, citizenship status, and major field of study of recipients: 1995–2004Characteristic and field 1995 1996 1997 1998 1999 2000 2001 2002 2003 2004 Industrial engineering 1.8 1.5 1.6 1.6 1.6 1.3 1.6 1.8 1.7 1.7 Materials/metallurgical engineering 3.6 3.3 3.2 3.1 2.9 2.6 3.2 2.7 3.3 3.3 Mechanical engineering 7.1 6.6 6.6 6.7 5.7 6.6 7.2 7.0 6.5 6.9 Other engineering 4.3 4.6 4.3 4.2 4.3 4.3 4.1 3.6 4.1 4.9
Female non-U.S. citizen 100.0 100.0 100.0 100.0 100.0 100.0 100.0 100.0 100.0 100.0
Science 86.6 86.0 86.5 85.6 85.5 84.3 81.0 81.3 81.5 80.9 Agricultural sciences 5.1 6.0 5.2 6.0 6.2 5.8 5.8 5.3 6.1 6.0 Biological sciences 31.1 33.1 34.3 32.0 30.4 30.9 27.4 28.4 27.2 26.6 Computer sciences 3.1 2.3 2.4 1.8 2.8 2.6 2.4 3.3 3.2 3.3 Earth, atmospheric, and ocean sciences 2.2 1.7 2.1 2.2 2.5 2.3 2.2 2.1 2.2 2.4 Mathematics 5.7 5.1 4.8 4.6 4.6 4.3 5.1 5.4 4.6 5.7 Physical sciences 15.4 14.6 14.7 15.3 14.7 13.3 13.3 13.6 12.9 13.3 Astronomy 0.4 0.4 0.5 0.9 0.4 0.3 0.4 0.2 0.4 0.5 Chemistry 10.7 10.5 10.2 11.2 10.8 9.3 9.6 9.6 9.1 9.4 Physics 4.2 3.6 3.9 3.0 3.4 3.6 3.2 3.8 3.3 3.3 Other physical sciences 0.1 0.0 0.2 0.1 0.0 0.1 0.2 0.1 0.1 0.1 Psychology 6.6 7.1 6.1 6.7 5.9 5.9 5.5 5.7 6.2 5.6 Social sciences 17.3 16.1 16.8 17.1 18.6 19.1 19.3 17.6 19.1 18.2
Engineering 13.4 14.0 13.5 14.4 14.5 15.7 19.0 18.7 18.5 19.1 Aeronautical/astronautical engineering 0.0 0.3 0.2 0.1 0.2 0.2 0.4 0.4 0.7 0.4 Chemical engineering 1.7 2.5 2.6 3.0 2.4 2.4 3.6 3.6 3.1 3.1 Civil engineering 1.7 1.7 1.5 1.9 1.5 1.8 2.0 2.6 2.2 2.4 Electrical engineering 3.7 3.1 3.0 3.2 3.6 4.7 6.0 4.4 4.7 5.4 Industrial engineering 1.1 0.7 0.6 0.7 0.6 0.7 0.8 1.3 1.3 0.8 Materials/metallurgical engineering 1.8 1.5 2.0 1.8 1.7 1.4 2.2 1.3 2.3 1.9 Mechanical engineering 1.5 1.3 1.7 1.6 1.7 1.9 2.1 2.3 1.9 1.8 Other engineering 1.8 2.8 2.0 2.3 2.7 2.7 1.9 2.8 2.3 3.3
Citizenship unknown 100.0 100.0 100.0 100.0 100.0 100.0 100.0 100.0 100.0 100.0
Science 73.9 75.5 82.9 76.1 77.9 75.0 78.4 81.0 83.5 79.6 Agricultural sciences 1.7 2.6 3.5 3.1 1.6 2.9 5.6 6.1 6.2 4.9 Biological sciences 14.3 15.3 15.9 16.3 15.2 16.9 16.6 20.6 20.3 20.1 Computer sciences 3.0 3.8 4.4 3.1 2.9 3.3 3.5 2.8 3.6 2.9 Earth, atmospheric, and ocean sciences 2.4 3.7 2.5 2.3 2.8 3.0 2.0 2.2 2.1 1.7 Mathematics 6.6 4.1 4.0 4.9 3.0 2.8 3.8 2.6 3.1 2.7 Physical sciences 13.0 16.8 14.1 13.3 15.5 13.3 10.5 11.5 11.1 9.8 Astronomy 0.8 0.1 0.2 0.6 0.4 0.3 0.8 0.3 0.3 0.2 Chemistry 8.5 9.6 8.3 7.3 9.2 8.4 6.1 7.0 7.4 6.1 Physics 3.8 7.0 5.4 5.4 5.9 4.5 3.1 4.1 2.9 3.5 Other physical sciences 0.0 0.0 0.2 0.1 0.0 0.1 0.5 0.1 0.6 0.0 Psychology 15.0 10.8 22.2 18.6 19.8 18.7 20.7 17.9 19.5 25.1 Social sciences 17.9 18.3 16.2 14.5 17.1 14.1 15.7 17.2 17.7 12.4
Engineering 26.1 24.5 17.1 23.9 22.1 25.0 21.6 19.0 16.5 20.4 Aeronautical/astronautical engineering 0.9 1.3 0.6 1.4 1.1 1.1 1.1 0.9 0.8 0.6 Chemical engineering 1.7 0.8 1.1 2.3 1.9 3.0 2.6 3.1 1.3 3.2 Civil engineering 1.9 2.8 1.4 3.0 1.7 1.3 2.0 2.2 1.4 2.1 Electrical engineering 9.0 8.2 5.1 6.7 6.6 9.3 6.7 4.6 4.1 6.8 Industrial engineering 0.8 0.8 0.7 0.6 0.4 0.4 0.6 1.1 0.5 0.4 Materials/metallurgical engineering 2.3 2.0 1.7 1.9 1.3 2.2 1.8 1.8 1.2 1.4 Mechanical engineering 4.3 3.7 2.6 4.3 3.3 2.9 2.5 2.7 3.0 2.1 Other engineering 5.3 5.0 3.9 3.7 5.9 4.8 4.4 2.6 4.2 3.8
Male, citizenship unknown 100.0 100.0 100.0 100.0 100.0 100.0 100.0 100.0 100.0 100.0
Science 71.2 72.7 78.1 69.6 73.2 69.1 71.0 77.7 77.5 73.3 Agricultural sciences 0.7 2.9 3.8 3.8 1.4 3.8 5.9 6.9 5.7 5.4 Biological sciences 11.1 14.2 15.5 15.5 14.1 15.2 15.8 20.6 20.8 20.0 Computer sciences 4.5 3.8 4.5 3.1 3.4 4.0 4.2 3.5 4.7 3.2
29
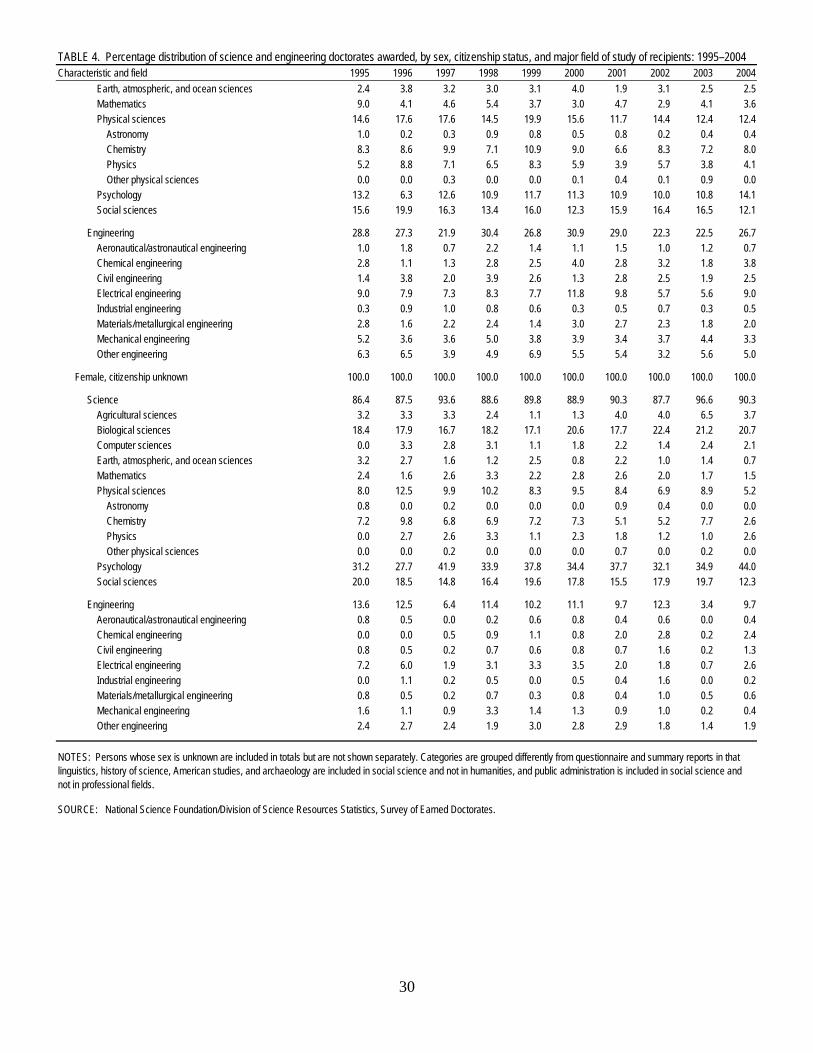
TABLE 4. Percentage distribution of science and engineering doctorates awarded, by sex, citizenship status, and major field of study of recipients: 1995–2004Characteristic and field 1995 1996 1997 1998 1999 2000 2001 2002 2003 2004 Earth, atmospheric, and ocean sciences 2.4 3.8 3.2 3.0 3.1 4.0 1.9 3.1 2.5 2.5 Mathematics 9.0 4.1 4.6 5.4 3.7 3.0 4.7 2.9 4.1 3.6 Physical sciences 14.6 17.6 17.6 14.5 19.9 15.6 11.7 14.4 12.4 12.4 Astronomy 1.0 0.2 0.3 0.9 0.8 0.5 0.8 0.2 0.4 0.4 Chemistry 8.3 8.6 9.9 7.1 10.9 9.0 6.6 8.3 7.2 8.0 Physics 5.2 8.8 7.1 6.5 8.3 5.9 3.9 5.7 3.8 4.1 Other physical sciences 0.0 0.0 0.3 0.0 0.0 0.1 0.4 0.1 0.9 0.0 Psychology 13.2 6.3 12.6 10.9 11.7 11.3 10.9 10.0 10.8 14.1 Social sciences 15.6 19.9 16.3 13.4 16.0 12.3 15.9 16.4 16.5 12.1
Engineering 28.8 27.3 21.9 30.4 26.8 30.9 29.0 22.3 22.5 26.7 Aeronautical/astronautical engineering 1.0 1.8 0.7 2.2 1.4 1.1 1.5 1.0 1.2 0.7 Chemical engineering 2.8 1.1 1.3 2.8 2.5 4.0 2.8 3.2 1.8 3.8 Civil engineering 1.4 3.8 2.0 3.9 2.6 1.3 2.8 2.5 1.9 2.5 Electrical engineering 9.0 7.9 7.3 8.3 7.7 11.8 9.8 5.7 5.6 9.0 Industrial engineering 0.3 0.9 1.0 0.8 0.6 0.3 0.5 0.7 0.3 0.5 Materials/metallurgical engineering 2.8 1.6 2.2 2.4 1.4 3.0 2.7 2.3 1.8 2.0 Mechanical engineering 5.2 3.6 3.6 5.0 3.8 3.9 3.4 3.7 4.4 3.3 Other engineering 6.3 6.5 3.9 4.9 6.9 5.5 5.4 3.2 5.6 5.0
Female, citizenship unknown 100.0 100.0 100.0 100.0 100.0 100.0 100.0 100.0 100.0 100.0
Science 86.4 87.5 93.6 88.6 89.8 88.9 90.3 87.7 96.6 90.3 Agricultural sciences 3.2 3.3 3.3 2.4 1.1 1.3 4.0 4.0 6.5 3.7 Biological sciences 18.4 17.9 16.7 18.2 17.1 20.6 17.7 22.4 21.2 20.7 Computer sciences 0.0 3.3 2.8 3.1 1.1 1.8 2.2 1.4 2.4 2.1 Earth, atmospheric, and ocean sciences 3.2 2.7 1.6 1.2 2.5 0.8 2.2 1.0 1.4 0.7 Mathematics 2.4 1.6 2.6 3.3 2.2 2.8 2.6 2.0 1.7 1.5 Physical sciences 8.0 12.5 9.9 10.2 8.3 9.5 8.4 6.9 8.9 5.2 Astronomy 0.8 0.0 0.2 0.0 0.0 0.0 0.9 0.4 0.0 0.0 Chemistry 7.2 9.8 6.8 6.9 7.2 7.3 5.1 5.2 7.7 2.6 Physics 0.0 2.7 2.6 3.3 1.1 2.3 1.8 1.2 1.0 2.6 Other physical sciences 0.0 0.0 0.2 0.0 0.0 0.0 0.7 0.0 0.2 0.0 Psychology 31.2 27.7 41.9 33.9 37.8 34.4 37.7 32.1 34.9 44.0 Social sciences 20.0 18.5 14.8 16.4 19.6 17.8 15.5 17.9 19.7 12.3
Engineering 13.6 12.5 6.4 11.4 10.2 11.1 9.7 12.3 3.4 9.7 Aeronautical/astronautical engineering 0.8 0.5 0.0 0.2 0.6 0.8 0.4 0.6 0.0 0.4 Chemical engineering 0.0 0.0 0.5 0.9 1.1 0.8 2.0 2.8 0.2 2.4 Civil engineering 0.8 0.5 0.2 0.7 0.6 0.8 0.7 1.6 0.2 1.3 Electrical engineering 7.2 6.0 1.9 3.1 3.3 3.5 2.0 1.8 0.7 2.6 Industrial engineering 0.0 1.1 0.2 0.5 0.0 0.5 0.4 1.6 0.0 0.2 Materials/metallurgical engineering 0.8 0.5 0.2 0.7 0.3 0.8 0.4 1.0 0.5 0.6 Mechanical engineering 1.6 1.1 0.9 3.3 1.4 1.3 0.9 1.0 0.2 0.4 Other engineering 2.4 2.7 2.4 1.9 3.0 2.8 2.9 1.8 1.4 1.9
SOURCE: National Science Foundation/Division of Science Resources Statistics, Survey of Earned Doctorates.
NOTES: Persons whose sex is unknown are included in totals but are not shown separately. Categories are grouped differently from questionnaire and summary reports in that linguistics, history of science, American studies, and archaeology are included in social science and not in humanities, and public administration is included in social science and not in professional fields.
30

TABLE 5. Doctorates awarded to U.S. citizens or permanent residents, by race/ethnicity and major field of study of recipients: 1995–2004Race/ethnicity and field 1995 1996 1997 1998 1999 2000 2001 2002 2003 2004All fields 32,060 31,540 31,082 31,159 30,294 29,929 28,878 27,661 28,119 27,959
Science and engineering 18,997 18,647 18,393 18,257 17,567 17,114 16,346 15,512 15,715 15,721 Science 15,655 15,258 15,061 15,213 14,678 14,543 13,900 13,348 13,545 13,539 Agricultural sciences 666 628 619 591 561 559 504 491 561 563 Biological sciences 4,329 4,364 4,256 4,308 4,124 4,268 4,243 4,112 4,056 4,187 Computer sciences 616 514 520 561 493 457 423 419 443 448 Earth, atmospheric, and ocean sciences 526 505 538 514 459 453 395 424 429 426 Mathematics 771 648 629 669 605 574 524 442 517 510 Physical sciences 2,841 2,571 2,497 2,455 2,277 2,092 2,045 1,940 1,970 1,866 Astronomy 141 149 158 147 117 139 123 109 131 115 Chemistry 1,624 1,463 1,439 1,467 1,406 1,241 1,230 1,230 1,265 1,180 Physics 1,059 949 883 823 742 692 677 589 552 559 Other physical sciences 17 10 17 18 12 20 15 12 22 12 Psychology 3,184 3,233 3,125 3,275 3,292 3,231 3,033 2,795 2,857 2,789 Social sciences 2,722 2,795 2,877 2,840 2,867 2,909 2,733 2,725 2,712 2,750
Engineering 3,342 3,389 3,332 3,044 2,889 2,571 2,446 2,164 2,170 2,182 Chemical engineering 381 391 409 374 371 382 361 336 292 312 Civil engineering 309 305 327 297 312 261 269 247 269 224 Electrical engineering 971 929 940 804 766 648 560 507 498 498 Mechanical engineering 563 588 538 515 464 396 428 342 332 299 Other engineering 1,118 1,176 1,118 1,054 976 884 828 732 779 849
Non-science and engineering 13,063 12,893 12,689 12,902 12,727 12,815 12,532 12,149 12,404 12,238 Education 5,995 6,075 5,747 5,745 5,814 5,681 5,450 5,398 5,643 5,417 Health 1,043 1,016 1,028 1,154 1,049 1,195 1,158 1,194 1,229 1,271 Humanities 4,056 4,047 4,235 4,327 4,292 4,391 4,379 4,115 4,134 4,051 Professional/other/unknown 1,969 1,755 1,679 1,676 1,572 1,548 1,545 1,442 1,398 1,499
American Indian/Alaska Native, all fields 148 186 167 189 214 169 150 150 137 131 Science and engineering 68 95 79 96 114 88 73 70 73 61 Science 59 81 62 83 102 80 67 63 61 55 Agricultural sciences 2 7 5 9 1 5 0 2 4 4 Biological sciences 15 20 7 12 20 17 15 12 11 14 Computer sciences 0 4 1 4 1 1 1 2 2 2 Earth, atmospheric, and ocean sciences 0 1 2 3 6 4 0 0 2 4 Mathematics 2 1 1 3 1 2 2 3 2 0 Physical sciences 8 6 10 9 9 9 12 7 2 5 Astronomy 0 0 1 1 1 1 1 0 0 0 Chemistry 6 4 6 7 5 7 11 5 2 4 Physics 2 2 2 1 3 1 0 2 0 1 Other physical sciences 0 0 1 0 0 0 0 0 0 0 Psychology 14 17 18 31 35 22 17 15 22 13 Social sciences 18 25 18 12 29 20 20 22 16 13
Engineering 9 14 17 13 12 8 6 7 12 6 Chemical engineering 2 1 4 3 2 1 1 2 1 2 Civil engineering 0 2 2 0 2 1 0 0 1 3 Electrical engineering 1 2 5 3 1 0 1 0 5 1 Mechanical engineering 2 3 6 2 2 3 1 1 1 0 Other engineering 4 6 0 5 5 3 3 4 4 0
Non-science and engineering 80 91 88 93 100 81 77 80 64 70 Education 41 60 51 50 58 51 42 46 40 46 Health 9 4 6 4 6 4 6 3 2 3 Humanities 18 18 19 21 21 20 21 20 15 13 Professional/other/unknown 12 9 12 18 15 6 8 11 7 8
Asian, all fieldsa 4,297 3,674 3,109 2,707 2,495 2,272 2,173 2,109 2,025 2,054 Science and engineering 3,659 3,079 2,529 2,135 1,932 1,706 1,617 1,616 1,511 1,491 Science 2,627 2,183 1,822 1,581 1,420 1,267 1,195 1,208 1,171 1,137 Agricultural sciences 84 87 73 54 50 36 23 29 25 31 Biological sciences 920 885 721 657 608 539 546 561 526 488
31
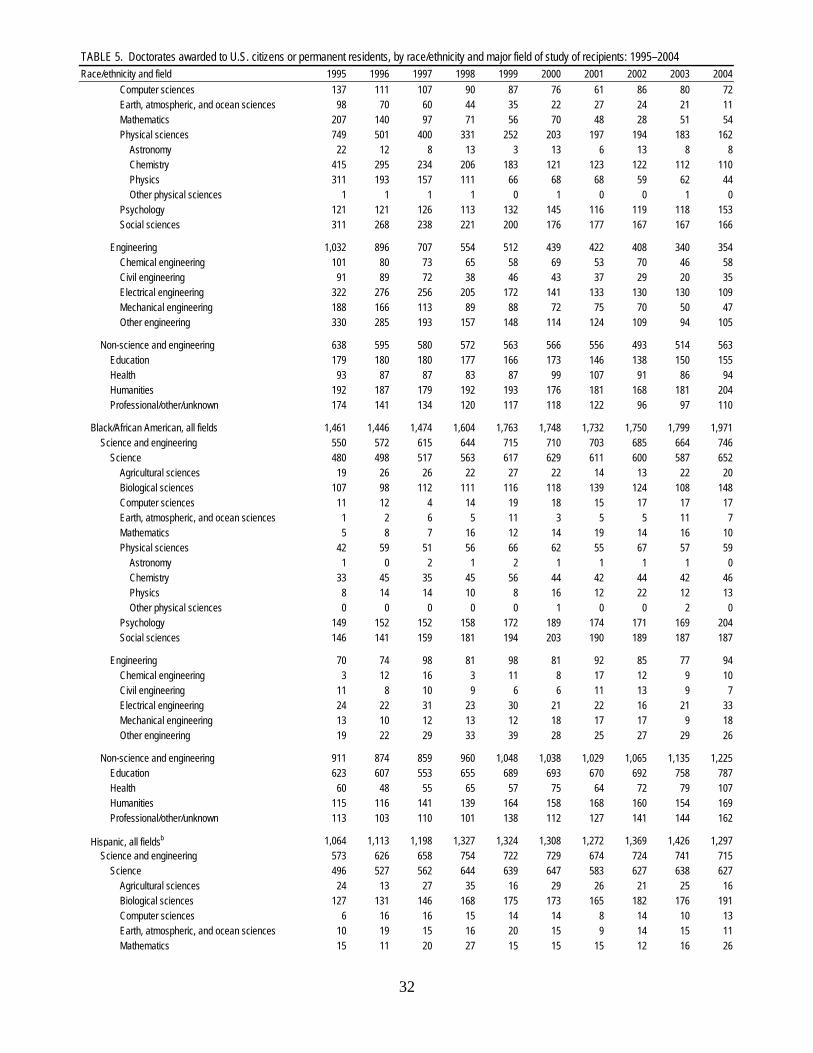
TABLE 5. Doctorates awarded to U.S. citizens or permanent residents, by race/ethnicity and major field of study of recipients: 1995–2004Race/ethnicity and field 1995 1996 1997 1998 1999 2000 2001 2002 2003 2004 Computer sciences 137 111 107 90 87 76 61 86 80 72 Earth, atmospheric, and ocean sciences 98 70 60 44 35 22 27 24 21 11 Mathematics 207 140 97 71 56 70 48 28 51 54 Physical sciences 749 501 400 331 252 203 197 194 183 162 Astronomy 22 12 8 13 3 13 6 13 8 8 Chemistry 415 295 234 206 183 121 123 122 112 110 Physics 311 193 157 111 66 68 68 59 62 44 Other physical sciences 1 1 1 1 0 1 0 0 1 0 Psychology 121 121 126 113 132 145 116 119 118 153 Social sciences 311 268 238 221 200 176 177 167 167 166
Engineering 1,032 896 707 554 512 439 422 408 340 354 Chemical engineering 101 80 73 65 58 69 53 70 46 58 Civil engineering 91 89 72 38 46 43 37 29 20 35 Electrical engineering 322 276 256 205 172 141 133 130 130 109 Mechanical engineering 188 166 113 89 88 72 75 70 50 47 Other engineering 330 285 193 157 148 114 124 109 94 105
Non-science and engineering 638 595 580 572 563 566 556 493 514 563 Education 179 180 180 177 166 173 146 138 150 155 Health 93 87 87 83 87 99 107 91 86 94 Humanities 192 187 179 192 193 176 181 168 181 204 Professional/other/unknown 174 141 134 120 117 118 122 96 97 110
Black/African American, all fields 1,461 1,446 1,474 1,604 1,763 1,748 1,732 1,750 1,799 1,971 Science and engineering 550 572 615 644 715 710 703 685 664 746 Science 480 498 517 563 617 629 611 600 587 652 Agricultural sciences 19 26 26 22 27 22 14 13 22 20 Biological sciences 107 98 112 111 116 118 139 124 108 148 Computer sciences 11 12 4 14 19 18 15 17 17 17 Earth, atmospheric, and ocean sciences 1 2 6 5 11 3 5 5 11 7 Mathematics 5 8 7 16 12 14 19 14 16 10 Physical sciences 42 59 51 56 66 62 55 67 57 59 Astronomy 1 0 2 1 2 1 1 1 1 0 Chemistry 33 45 35 45 56 44 42 44 42 46 Physics 8 14 14 10 8 16 12 22 12 13 Other physical sciences 0 0 0 0 0 1 0 0 2 0 Psychology 149 152 152 158 172 189 174 171 169 204 Social sciences 146 141 159 181 194 203 190 189 187 187
Engineering 70 74 98 81 98 81 92 85 77 94 Chemical engineering 3 12 16 3 11 8 17 12 9 10 Civil engineering 11 8 10 9 6 6 11 13 9 7 Electrical engineering 24 22 31 23 30 21 22 16 21 33 Mechanical engineering 13 10 12 13 12 18 17 17 9 18 Other engineering 19 22 29 33 39 28 25 27 29 26
Non-science and engineering 911 874 859 960 1,048 1,038 1,029 1,065 1,135 1,225 Education 623 607 553 655 689 693 670 692 758 787 Health 60 48 55 65 57 75 64 72 79 107 Humanities 115 116 141 139 164 158 168 160 154 169 Professional/other/unknown 113 103 110 101 138 112 127 141 144 162
Hispanic, all fieldsb 1,064 1,113 1,198 1,327 1,324 1,308 1,272 1,369 1,426 1,297 Science and engineering 573 626 658 754 722 729 674 724 741 715 Science 496 527 562 644 639 647 583 627 638 627 Agricultural sciences 24 13 27 35 16 29 26 21 25 16 Biological sciences 127 131 146 168 175 173 165 182 176 191 Computer sciences 6 16 16 15 14 14 8 14 10 13 Earth, atmospheric, and ocean sciences 10 19 15 16 20 15 9 14 15 11 Mathematics 15 11 20 27 15 15 15 12 16 26
32
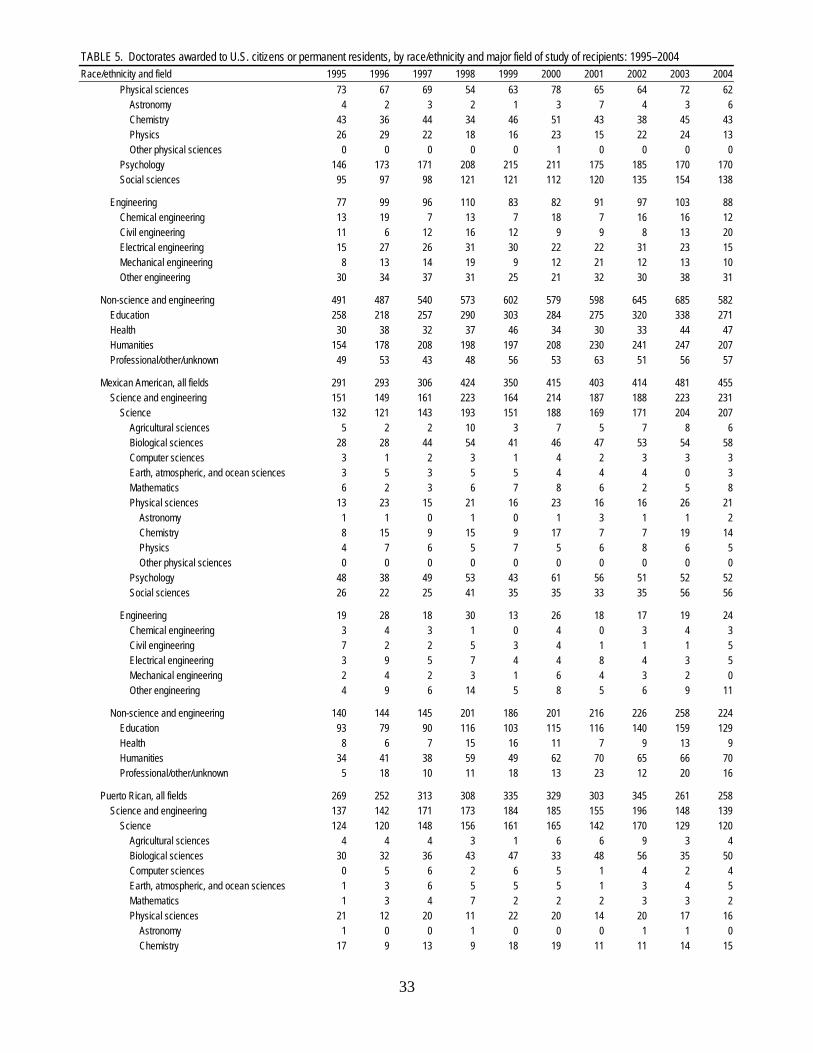
TABLE 5. Doctorates awarded to U.S. citizens or permanent residents, by race/ethnicity and major field of study of recipients: 1995–2004Race/ethnicity and field 1995 1996 1997 1998 1999 2000 2001 2002 2003 2004 Physical sciences 73 67 69 54 63 78 65 64 72 62 Astronomy 4 2 3 2 1 3 7 4 3 6 Chemistry 43 36 44 34 46 51 43 38 45 43 Physics 26 29 22 18 16 23 15 22 24 13 Other physical sciences 0 0 0 0 0 1 0 0 0 0 Psychology 146 173 171 208 215 211 175 185 170 170 Social sciences 95 97 98 121 121 112 120 135 154 138
Engineering 77 99 96 110 83 82 91 97 103 88 Chemical engineering 13 19 7 13 7 18 7 16 16 12 Civil engineering 11 6 12 16 12 9 9 8 13 20 Electrical engineering 15 27 26 31 30 22 22 31 23 15 Mechanical engineering 8 13 14 19 9 12 21 12 13 10 Other engineering 30 34 37 31 25 21 32 30 38 31
Non-science and engineering 491 487 540 573 602 579 598 645 685 582 Education 258 218 257 290 303 284 275 320 338 271 Health 30 38 32 37 46 34 30 33 44 47 Humanities 154 178 208 198 197 208 230 241 247 207 Professional/other/unknown 49 53 43 48 56 53 63 51 56 57
Mexican American, all fields 291 293 306 424 350 415 403 414 481 455 Science and engineering 151 149 161 223 164 214 187 188 223 231 Science 132 121 143 193 151 188 169 171 204 207 Agricultural sciences 5 2 2 10 3 7 5 7 8 6 Biological sciences 28 28 44 54 41 46 47 53 54 58 Computer sciences 3 1 2 3 1 4 2 3 3 3 Earth, atmospheric, and ocean sciences 3 5 3 5 5 4 4 4 0 3 Mathematics 6 2 3 6 7 8 6 2 5 8 Physical sciences 13 23 15 21 16 23 16 16 26 21 Astronomy 1 1 0 1 0 1 3 1 1 2 Chemistry 8 15 9 15 9 17 7 7 19 14 Physics 4 7 6 5 7 5 6 8 6 5 Other physical sciences 0 0 0 0 0 0 0 0 0 0 Psychology 48 38 49 53 43 61 56 51 52 52 Social sciences 26 22 25 41 35 35 33 35 56 56
Engineering 19 28 18 30 13 26 18 17 19 24 Chemical engineering 3 4 3 1 0 4 0 3 4 3 Civil engineering 7 2 2 5 3 4 1 1 1 5 Electrical engineering 3 9 5 7 4 4 8 4 3 5 Mechanical engineering 2 4 2 3 1 6 4 3 2 0 Other engineering 4 9 6 14 5 8 5 6 9 11
Non-science and engineering 140 144 145 201 186 201 216 226 258 224 Education 93 79 90 116 103 115 116 140 159 129 Health 8 6 7 15 16 11 7 9 13 9 Humanities 34 41 38 59 49 62 70 65 66 70 Professional/other/unknown 5 18 10 11 18 13 23 12 20 16
Puerto Rican, all fields 269 252 313 308 335 329 303 345 261 258 Science and engineering 137 142 171 173 184 185 155 196 148 139 Science 124 120 148 156 161 165 142 170 129 120 Agricultural sciences 4 4 4 3 1 6 6 9 3 4 Biological sciences 30 32 36 43 47 33 48 56 35 50 Computer sciences 0 5 6 2 6 5 1 4 2 4 Earth, atmospheric, and ocean sciences 1 3 6 5 5 5 1 3 4 5 Mathematics 1 3 4 7 2 2 2 3 3 2 Physical sciences 21 12 20 11 22 20 14 20 17 16 Astronomy 1 0 0 1 0 0 0 1 1 0 Chemistry 17 9 13 9 18 19 11 11 14 15
33
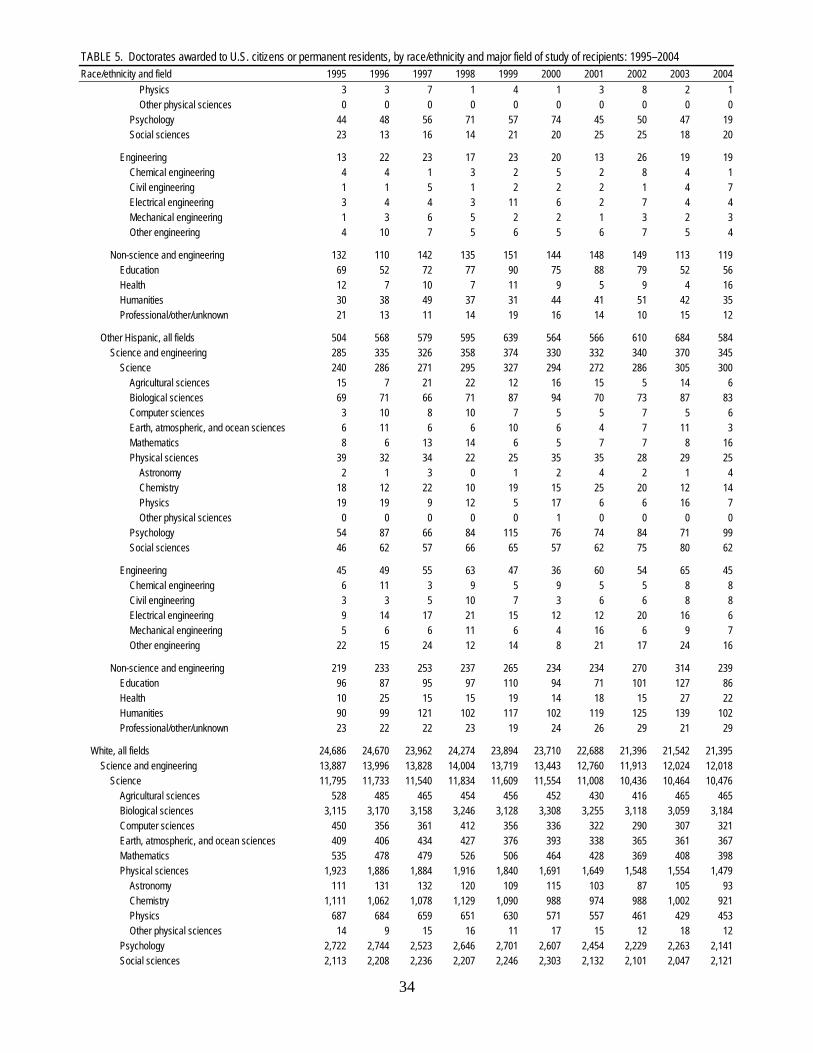
TABLE 5. Doctorates awarded to U.S. citizens or permanent residents, by race/ethnicity and major field of study of recipients: 1995–2004Race/ethnicity and field 1995 1996 1997 1998 1999 2000 2001 2002 2003 2004 Physics 3 3 7 1 4 1 3 8 2 1 Other physical sciences 0 0 0 0 0 0 0 0 0 0 Psychology 44 48 56 71 57 74 45 50 47 19 Social sciences 23 13 16 14 21 20 25 25 18 20
Engineering 13 22 23 17 23 20 13 26 19 19 Chemical engineering 4 4 1 3 2 5 2 8 4 1 Civil engineering 1 1 5 1 2 2 2 1 4 7 Electrical engineering 3 4 4 3 11 6 2 7 4 4 Mechanical engineering 1 3 6 5 2 2 1 3 2 3 Other engineering 4 10 7 5 6 5 6 7 5 4
Non-science and engineering 132 110 142 135 151 144 148 149 113 119 Education 69 52 72 77 90 75 88 79 52 56 Health 12 7 10 7 11 9 5 9 4 16 Humanities 30 38 49 37 31 44 41 51 42 35 Professional/other/unknown 21 13 11 14 19 16 14 10 15 12
Other Hispanic, all fields 504 568 579 595 639 564 566 610 684 584 Science and engineering 285 335 326 358 374 330 332 340 370 345 Science 240 286 271 295 327 294 272 286 305 300 Agricultural sciences 15 7 21 22 12 16 15 5 14 6 Biological sciences 69 71 66 71 87 94 70 73 87 83 Computer sciences 3 10 8 10 7 5 5 7 5 6 Earth, atmospheric, and ocean sciences 6 11 6 6 10 6 4 7 11 3 Mathematics 8 6 13 14 6 5 7 7 8 16 Physical sciences 39 32 34 22 25 35 35 28 29 25 Astronomy 2 1 3 0 1 2 4 2 1 4 Chemistry 18 12 22 10 19 15 25 20 12 14 Physics 19 19 9 12 5 17 6 6 16 7 Other physical sciences 0 0 0 0 0 1 0 0 0 0 Psychology 54 87 66 84 115 76 74 84 71 99 Social sciences 46 62 57 66 65 57 62 75 80 62
Engineering 45 49 55 63 47 36 60 54 65 45 Chemical engineering 6 11 3 9 5 9 5 5 8 8 Civil engineering 3 3 5 10 7 3 6 6 8 8 Electrical engineering 9 14 17 21 15 12 12 20 16 6 Mechanical engineering 5 6 6 11 6 4 16 6 9 7 Other engineering 22 15 24 12 14 8 21 17 24 16
Non-science and engineering 219 233 253 237 265 234 234 270 314 239 Education 96 87 95 97 110 94 71 101 127 86 Health 10 25 15 15 19 14 18 15 27 22 Humanities 90 99 121 102 117 102 119 125 139 102 Professional/other/unknown 23 22 22 23 19 24 26 29 21 29
White, all fields 24,686 24,670 23,962 24,274 23,894 23,710 22,688 21,396 21,542 21,395 Science and engineering 13,887 13,996 13,828 14,004 13,719 13,443 12,760 11,913 12,024 12,018 Science 11,795 11,733 11,540 11,834 11,609 11,554 11,008 10,436 10,464 10,476 Agricultural sciences 528 485 465 454 456 452 430 416 465 465 Biological sciences 3,115 3,170 3,158 3,246 3,128 3,308 3,255 3,118 3,059 3,184 Computer sciences 450 356 361 412 356 336 322 290 307 321 Earth, atmospheric, and ocean sciences 409 406 434 427 376 393 338 365 361 367 Mathematics 535 478 479 526 506 464 428 369 408 398 Physical sciences 1,923 1,886 1,884 1,916 1,840 1,691 1,649 1,548 1,554 1,479 Astronomy 111 131 132 120 109 115 103 87 105 93 Chemistry 1,111 1,062 1,078 1,129 1,090 988 974 988 1,002 921 Physics 687 684 659 651 630 571 557 461 429 453 Other physical sciences 14 9 15 16 11 17 15 12 18 12 Psychology 2,722 2,744 2,523 2,646 2,701 2,607 2,454 2,229 2,263 2,141 Social sciences 2,113 2,208 2,236 2,207 2,246 2,303 2,132 2,101 2,047 2,121
34
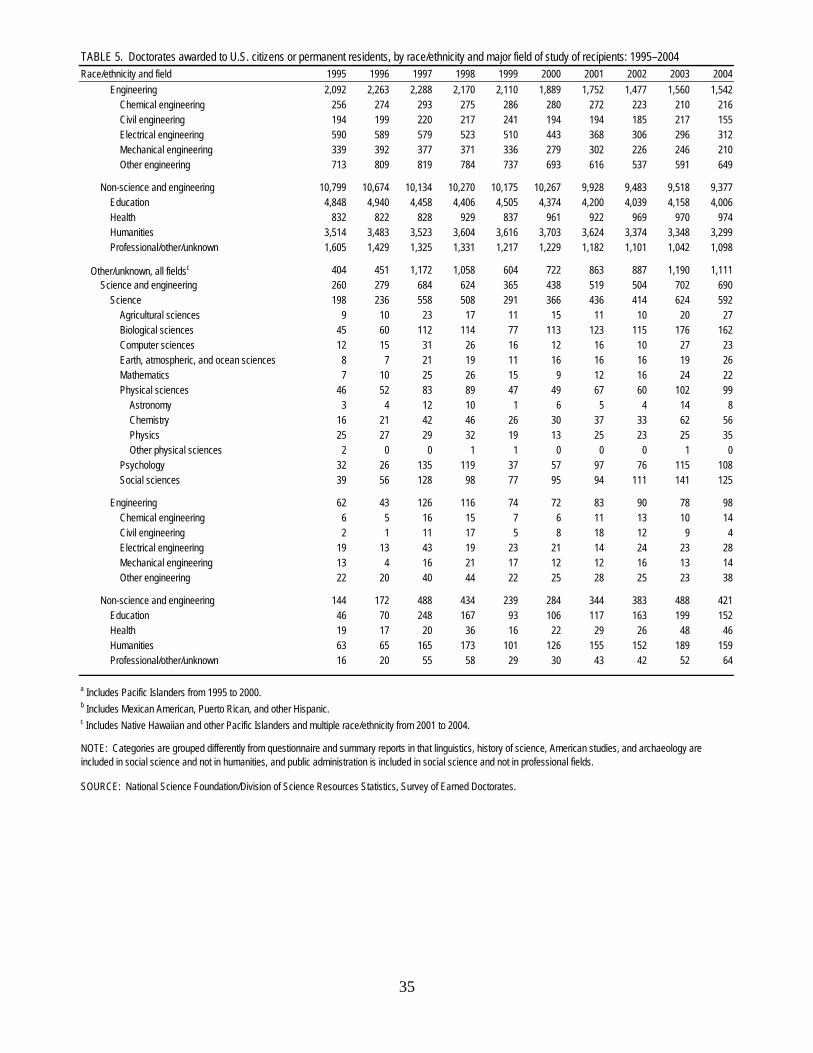
TABLE 5. Doctorates awarded to U.S. citizens or permanent residents, by race/ethnicity and major field of study of recipients: 1995–2004Race/ethnicity and field 1995 1996 1997 1998 1999 2000 2001 2002 2003 2004 Engineering 2,092 2,263 2,288 2,170 2,110 1,889 1,752 1,477 1,560 1,542 Chemical engineering 256 274 293 275 286 280 272 223 210 216 Civil engineering 194 199 220 217 241 194 194 185 217 155 Electrical engineering 590 589 579 523 510 443 368 306 296 312 Mechanical engineering 339 392 377 371 336 279 302 226 246 210 Other engineering 713 809 819 784 737 693 616 537 591 649
Non-science and engineering 10,799 10,674 10,134 10,270 10,175 10,267 9,928 9,483 9,518 9,377 Education 4,848 4,940 4,458 4,406 4,505 4,374 4,200 4,039 4,158 4,006 Health 832 822 828 929 837 961 922 969 970 974 Humanities 3,514 3,483 3,523 3,604 3,616 3,703 3,624 3,374 3,348 3,299 Professional/other/unknown 1,605 1,429 1,325 1,331 1,217 1,229 1,182 1,101 1,042 1,098
Other/unknown, all fieldsc 404 451 1,172 1,058 604 722 863 887 1,190 1,111 Science and engineering 260 279 684 624 365 438 519 504 702 690 Science 198 236 558 508 291 366 436 414 624 592 Agricultural sciences 9 10 23 17 11 15 11 10 20 27 Biological sciences 45 60 112 114 77 113 123 115 176 162 Computer sciences 12 15 31 26 16 12 16 10 27 23 Earth, atmospheric, and ocean sciences 8 7 21 19 11 16 16 16 19 26 Mathematics 7 10 25 26 15 9 12 16 24 22 Physical sciences 46 52 83 89 47 49 67 60 102 99 Astronomy 3 4 12 10 1 6 5 4 14 8 Chemistry 16 21 42 46 26 30 37 33 62 56 Physics 25 27 29 32 19 13 25 23 25 35 Other physical sciences 2 0 0 1 1 0 0 0 1 0 Psychology 32 26 135 119 37 57 97 76 115 108 Social sciences 39 56 128 98 77 95 94 111 141 125
Engineering 62 43 126 116 74 72 83 90 78 98 Chemical engineering 6 5 16 15 7 6 11 13 10 14 Civil engineering 2 1 11 17 5 8 18 12 9 4 Electrical engineering 19 13 43 19 23 21 14 24 23 28 Mechanical engineering 13 4 16 21 17 12 12 16 13 14 Other engineering 22 20 40 44 22 25 28 25 23 38
Non-science and engineering 144 172 488 434 239 284 344 383 488 421 Education 46 70 248 167 93 106 117 163 199 152 Health 19 17 20 36 16 22 29 26 48 46 Humanities 63 65 165 173 101 126 155 152 189 159 Professional/other/unknown 16 20 55 58 29 30 43 42 52 64
a Includes Pacific Islanders from 1995 to 2000.b Includes Mexican American, Puerto Rican, and other Hispanic.c Includes Native Hawaiian and other Pacific Islanders and multiple race/ethnicity from 2001 to 2004.
SOURCE: National Science Foundation/Division of Science Resources Statistics, Survey of Earned Doctorates.
NOTE: Categories are grouped differently from questionnaire and summary reports in that linguistics, history of science, American studies, and archaeology are included in social science and not in humanities, and public administration is included in social science and not in professional fields.
35
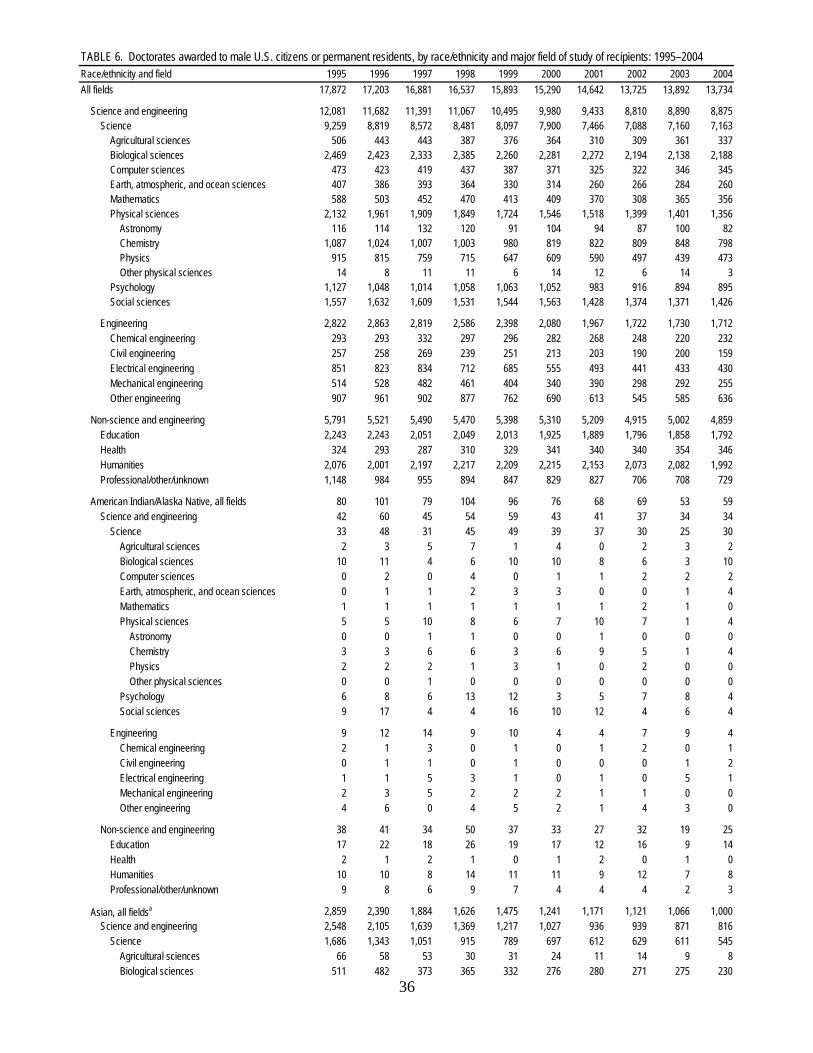
TABLE 6. Doctorates awarded to male U.S. citizens or permanent residents, by race/ethnicity and major field of study of recipients: 1995–2004Race/ethnicity and field 1995 1996 1997 1998 1999 2000 2001 2002 2003 2004All fields 17,872 17,203 16,881 16,537 15,893 15,290 14,642 13,725 13,892 13,734
Science and engineering 12,081 11,682 11,391 11,067 10,495 9,980 9,433 8,810 8,890 8,875 Science 9,259 8,819 8,572 8,481 8,097 7,900 7,466 7,088 7,160 7,163 Agricultural sciences 506 443 443 387 376 364 310 309 361 337 Biological sciences 2,469 2,423 2,333 2,385 2,260 2,281 2,272 2,194 2,138 2,188 Computer sciences 473 423 419 437 387 371 325 322 346 345 Earth, atmospheric, and ocean sciences 407 386 393 364 330 314 260 266 284 260 Mathematics 588 503 452 470 413 409 370 308 365 356 Physical sciences 2,132 1,961 1,909 1,849 1,724 1,546 1,518 1,399 1,401 1,356 Astronomy 116 114 132 120 91 104 94 87 100 82 Chemistry 1,087 1,024 1,007 1,003 980 819 822 809 848 798 Physics 915 815 759 715 647 609 590 497 439 473 Other physical sciences 14 8 11 11 6 14 12 6 14 3 Psychology 1,127 1,048 1,014 1,058 1,063 1,052 983 916 894 895 Social sciences 1,557 1,632 1,609 1,531 1,544 1,563 1,428 1,374 1,371 1,426
Engineering 2,822 2,863 2,819 2,586 2,398 2,080 1,967 1,722 1,730 1,712 Chemical engineering 293 293 332 297 296 282 268 248 220 232 Civil engineering 257 258 269 239 251 213 203 190 200 159 Electrical engineering 851 823 834 712 685 555 493 441 433 430 Mechanical engineering 514 528 482 461 404 340 390 298 292 255 Other engineering 907 961 902 877 762 690 613 545 585 636
Non-science and engineering 5,791 5,521 5,490 5,470 5,398 5,310 5,209 4,915 5,002 4,859 Education 2,243 2,243 2,051 2,049 2,013 1,925 1,889 1,796 1,858 1,792 Health 324 293 287 310 329 341 340 340 354 346 Humanities 2,076 2,001 2,197 2,217 2,209 2,215 2,153 2,073 2,082 1,992 Professional/other/unknown 1,148 984 955 894 847 829 827 706 708 729
American Indian/Alaska Native, all fields 80 101 79 104 96 76 68 69 53 59 Science and engineering 42 60 45 54 59 43 41 37 34 34 Science 33 48 31 45 49 39 37 30 25 30 Agricultural sciences 2 3 5 7 1 4 0 2 3 2 Biological sciences 10 11 4 6 10 10 8 6 3 10 Computer sciences 0 2 0 4 0 1 1 2 2 2 Earth, atmospheric, and ocean sciences 0 1 1 2 3 3 0 0 1 4 Mathematics 1 1 1 1 1 1 1 2 1 0 Physical sciences 5 5 10 8 6 7 10 7 1 4 Astronomy 0 0 1 1 0 0 1 0 0 0 Chemistry 3 3 6 6 3 6 9 5 1 4 Physics 2 2 2 1 3 1 0 2 0 0 Other physical sciences 0 0 1 0 0 0 0 0 0 0 Psychology 6 8 6 13 12 3 5 7 8 4 Social sciences 9 17 4 4 16 10 12 4 6 4
Engineering 9 12 14 9 10 4 4 7 9 4 Chemical engineering 2 1 3 0 1 0 1 2 0 1 Civil engineering 0 1 1 0 1 0 0 0 1 2 Electrical engineering 1 1 5 3 1 0 1 0 5 1 Mechanical engineering 2 3 5 2 2 2 1 1 0 0 Other engineering 4 6 0 4 5 2 1 4 3 0
Non-science and engineering 38 41 34 50 37 33 27 32 19 25 Education 17 22 18 26 19 17 12 16 9 14 Health 2 1 2 1 0 1 2 0 1 0 Humanities 10 10 8 14 11 11 9 12 7 8 Professional/other/unknown 9 8 6 9 7 4 4 4 2 3
Asian, all fieldsa 2,859 2,390 1,884 1,626 1,475 1,241 1,171 1,121 1,066 1,000 Science and engineering 2,548 2,105 1,639 1,369 1,217 1,027 936 939 871 816 Science 1,686 1,343 1,051 915 789 697 612 629 611 545 Agricultural sciences 66 58 53 30 31 24 11 14 9 8 Biological sciences 511 482 373 365 332 276 280 271 275 230
36

TABLE 6. Doctorates awarded to male U.S. citizens or permanent residents, by race/ethnicity and major field of study of recipients: 1995–2004Race/ethnicity and field 1995 1996 1997 1998 1999 2000 2001 2002 2003 2004 Computer sciences 107 95 81 67 68 61 41 60 63 53 Earth, atmospheric, and ocean sciences 72 58 43 31 25 14 20 14 14 7 Mathematics 158 104 69 44 36 49 32 23 27 37 Physical sciences 539 356 267 228 159 132 124 132 111 109 Astronomy 18 8 7 10 3 9 6 12 5 5 Chemistry 269 187 141 133 103 67 62 72 62 68 Physics 251 160 119 84 53 56 56 48 44 36 Other physical sciences 1 1 0 1 0 0 0 0 0 0 Psychology 43 31 31 29 34 46 25 39 37 26 Social sciences 190 159 134 121 104 95 79 76 75 75
Engineering 862 762 588 454 428 330 324 310 260 271 Chemical engineering 76 62 61 46 44 48 34 49 36 40 Civil engineering 77 75 58 32 41 33 28 22 17 24 Electrical engineering 276 246 217 173 146 108 105 104 100 89 Mechanical engineering 165 149 97 77 77 56 67 55 41 41 Other engineering 268 230 155 126 120 85 90 80 66 77
Non-science and engineering 311 285 245 257 258 214 235 182 195 184 Education 59 69 52 69 63 53 43 39 41 36 Health 52 47 37 35 39 36 38 20 37 30 Humanities 83 83 72 79 82 63 77 68 66 75 Professional/other/unknown 117 86 84 74 74 62 77 55 51 43
Black/African American, all fields 612 638 636 610 700 642 676 673 653 714 Science and engineering 287 321 329 293 347 319 328 315 286 327 Science 232 266 254 234 273 262 261 258 228 266 Agricultural sciences 13 25 20 17 18 11 8 8 14 9 Biological sciences 64 58 52 41 50 44 55 57 44 59 Computer sciences 7 9 3 6 9 13 5 10 12 12 Earth, atmospheric, and ocean sciences 1 1 5 4 7 2 3 5 6 6 Mathematics 4 6 5 9 6 7 12 6 11 7 Physical sciences 24 46 40 25 37 41 35 39 36 34 Astronomy 1 0 1 1 0 0 1 0 1 0 Chemistry 16 35 26 17 33 25 23 22 28 26 Physics 7 11 13 7 4 15 11 17 7 8 Other physical sciences 0 0 0 0 0 1 0 0 0 0 Psychology 39 38 41 43 37 45 50 42 43 50 Social sciences 80 83 88 89 109 99 93 91 62 89
Engineering 55 55 75 59 74 57 67 57 58 61 Chemical engineering 2 7 10 2 7 3 7 6 6 3 Civil engineering 8 7 10 7 4 5 11 9 7 4 Electrical engineering 20 17 27 19 25 19 21 12 17 24 Mechanical engineering 12 7 11 13 11 13 16 13 8 15 Other engineering 13 17 17 18 27 17 12 17 20 15
Non-science and engineering 325 317 307 317 353 323 348 358 367 387 Education 203 202 171 192 202 186 210 210 233 233 Health 18 13 15 14 12 14 12 16 17 26 Humanities 54 53 68 67 70 70 65 73 61 71 Professional/other/unknown 50 49 53 44 69 53 61 59 56 57
Hispanic, all fieldsb 542 567 624 682 579 609 569 601 664 597 Science and engineering 341 353 392 428 360 379 336 345 376 354 Science 275 269 319 331 300 310 268 273 296 287 Agricultural sciences 16 9 20 22 9 18 12 13 14 5 Biological sciences 80 65 83 89 99 82 88 68 96 84 Computer sciences 2 9 14 14 11 11 4 12 6 10 Earth, atmospheric, and ocean sciences 7 13 10 10 16 12 4 12 9 6 Mathematics 11 11 14 20 10 8 10 8 9 19
37
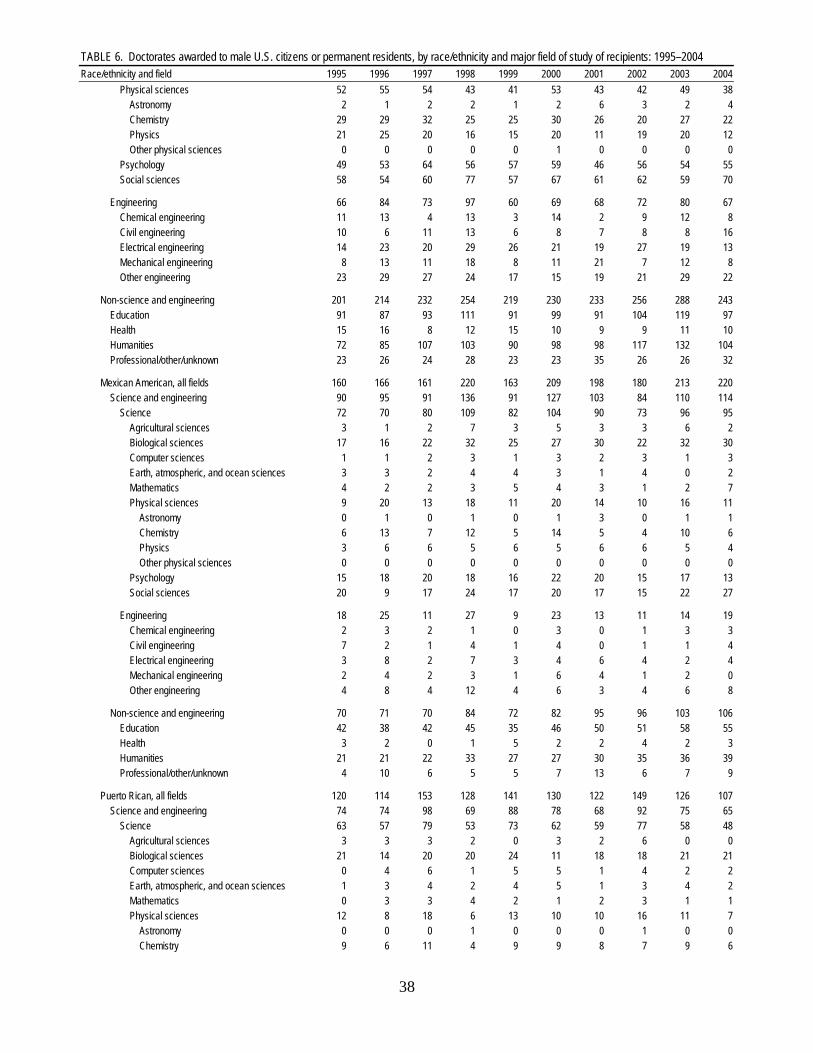
TABLE 6. Doctorates awarded to male U.S. citizens or permanent residents, by race/ethnicity and major field of study of recipients: 1995–2004Race/ethnicity and field 1995 1996 1997 1998 1999 2000 2001 2002 2003 2004 Physical sciences 52 55 54 43 41 53 43 42 49 38 Astronomy 2 1 2 2 1 2 6 3 2 4 Chemistry 29 29 32 25 25 30 26 20 27 22 Physics 21 25 20 16 15 20 11 19 20 12 Other physical sciences 0 0 0 0 0 1 0 0 0 0 Psychology 49 53 64 56 57 59 46 56 54 55 Social sciences 58 54 60 77 57 67 61 62 59 70
Engineering 66 84 73 97 60 69 68 72 80 67 Chemical engineering 11 13 4 13 3 14 2 9 12 8 Civil engineering 10 6 11 13 6 8 7 8 8 16 Electrical engineering 14 23 20 29 26 21 19 27 19 13 Mechanical engineering 8 13 11 18 8 11 21 7 12 8 Other engineering 23 29 27 24 17 15 19 21 29 22
Non-science and engineering 201 214 232 254 219 230 233 256 288 243 Education 91 87 93 111 91 99 91 104 119 97 Health 15 16 8 12 15 10 9 9 11 10 Humanities 72 85 107 103 90 98 98 117 132 104 Professional/other/unknown 23 26 24 28 23 23 35 26 26 32
Mexican American, all fields 160 166 161 220 163 209 198 180 213 220 Science and engineering 90 95 91 136 91 127 103 84 110 114 Science 72 70 80 109 82 104 90 73 96 95 Agricultural sciences 3 1 2 7 3 5 3 3 6 2 Biological sciences 17 16 22 32 25 27 30 22 32 30 Computer sciences 1 1 2 3 1 3 2 3 1 3 Earth, atmospheric, and ocean sciences 3 3 2 4 4 3 1 4 0 2 Mathematics 4 2 2 3 5 4 3 1 2 7 Physical sciences 9 20 13 18 11 20 14 10 16 11 Astronomy 0 1 0 1 0 1 3 0 1 1 Chemistry 6 13 7 12 5 14 5 4 10 6 Physics 3 6 6 5 6 5 6 6 5 4 Other physical sciences 0 0 0 0 0 0 0 0 0 0 Psychology 15 18 20 18 16 22 20 15 17 13 Social sciences 20 9 17 24 17 20 17 15 22 27
Engineering 18 25 11 27 9 23 13 11 14 19 Chemical engineering 2 3 2 1 0 3 0 1 3 3 Civil engineering 7 2 1 4 1 4 0 1 1 4 Electrical engineering 3 8 2 7 3 4 6 4 2 4 Mechanical engineering 2 4 2 3 1 6 4 1 2 0 Other engineering 4 8 4 12 4 6 3 4 6 8
Non-science and engineering 70 71 70 84 72 82 95 96 103 106 Education 42 38 42 45 35 46 50 51 58 55 Health 3 2 0 1 5 2 2 4 2 3 Humanities 21 21 22 33 27 27 30 35 36 39 Professional/other/unknown 4 10 6 5 5 7 13 6 7 9
Puerto Rican, all fields 120 114 153 128 141 130 122 149 126 107 Science and engineering 74 74 98 69 88 78 68 92 75 65 Science 63 57 79 53 73 62 59 77 58 48 Agricultural sciences 3 3 3 2 0 3 2 6 0 0 Biological sciences 21 14 20 20 24 11 18 18 21 21 Computer sciences 0 4 6 1 5 5 1 4 2 2 Earth, atmospheric, and ocean sciences 1 3 4 2 4 5 1 3 4 2 Mathematics 0 3 3 4 2 1 2 3 1 1 Physical sciences 12 8 18 6 13 10 10 16 11 7 Astronomy 0 0 0 1 0 0 0 1 0 0 Chemistry 9 6 11 4 9 9 8 7 9 6
38
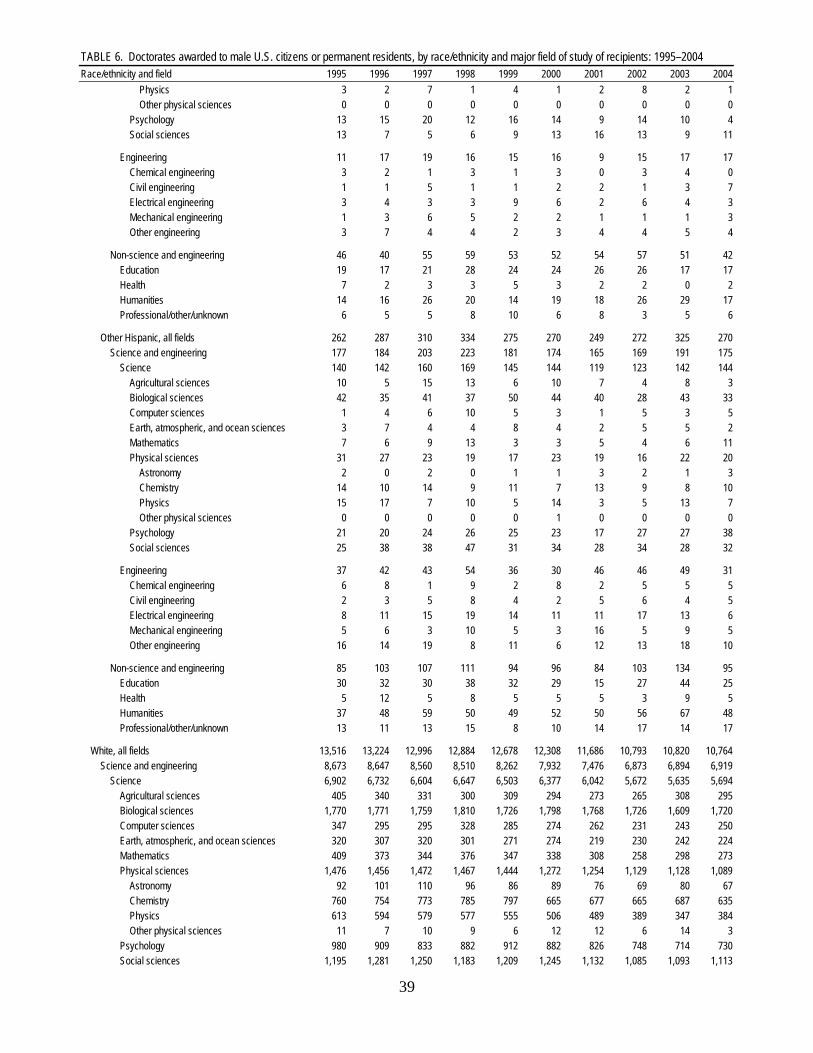
TABLE 6. Doctorates awarded to male U.S. citizens or permanent residents, by race/ethnicity and major field of study of recipients: 1995–2004Race/ethnicity and field 1995 1996 1997 1998 1999 2000 2001 2002 2003 2004 Physics 3 2 7 1 4 1 2 8 2 1 Other physical sciences 0 0 0 0 0 0 0 0 0 0 Psychology 13 15 20 12 16 14 9 14 10 4 Social sciences 13 7 5 6 9 13 16 13 9 11
Engineering 11 17 19 16 15 16 9 15 17 17 Chemical engineering 3 2 1 3 1 3 0 3 4 0 Civil engineering 1 1 5 1 1 2 2 1 3 7 Electrical engineering 3 4 3 3 9 6 2 6 4 3 Mechanical engineering 1 3 6 5 2 2 1 1 1 3 Other engineering 3 7 4 4 2 3 4 4 5 4
Non-science and engineering 46 40 55 59 53 52 54 57 51 42 Education 19 17 21 28 24 24 26 26 17 17 Health 7 2 3 3 5 3 2 2 0 2 Humanities 14 16 26 20 14 19 18 26 29 17 Professional/other/unknown 6 5 5 8 10 6 8 3 5 6
Other Hispanic, all fields 262 287 310 334 275 270 249 272 325 270 Science and engineering 177 184 203 223 181 174 165 169 191 175 Science 140 142 160 169 145 144 119 123 142 144 Agricultural sciences 10 5 15 13 6 10 7 4 8 3 Biological sciences 42 35 41 37 50 44 40 28 43 33 Computer sciences 1 4 6 10 5 3 1 5 3 5 Earth, atmospheric, and ocean sciences 3 7 4 4 8 4 2 5 5 2 Mathematics 7 6 9 13 3 3 5 4 6 11 Physical sciences 31 27 23 19 17 23 19 16 22 20 Astronomy 2 0 2 0 1 1 3 2 1 3 Chemistry 14 10 14 9 11 7 13 9 8 10 Physics 15 17 7 10 5 14 3 5 13 7 Other physical sciences 0 0 0 0 0 1 0 0 0 0 Psychology 21 20 24 26 25 23 17 27 27 38 Social sciences 25 38 38 47 31 34 28 34 28 32
Engineering 37 42 43 54 36 30 46 46 49 31 Chemical engineering 6 8 1 9 2 8 2 5 5 5 Civil engineering 2 3 5 8 4 2 5 6 4 5 Electrical engineering 8 11 15 19 14 11 11 17 13 6 Mechanical engineering 5 6 3 10 5 3 16 5 9 5 Other engineering 16 14 19 8 11 6 12 13 18 10
Non-science and engineering 85 103 107 111 94 96 84 103 134 95 Education 30 32 30 38 32 29 15 27 44 25 Health 5 12 5 8 5 5 5 3 9 5 Humanities 37 48 59 50 49 52 50 56 67 48 Professional/other/unknown 13 11 13 15 8 10 14 17 14 17
White, all fields 13,516 13,224 12,996 12,884 12,678 12,308 11,686 10,793 10,820 10,764 Science and engineering 8,673 8,647 8,560 8,510 8,262 7,932 7,476 6,873 6,894 6,919 Science 6,902 6,732 6,604 6,647 6,503 6,377 6,042 5,672 5,635 5,694 Agricultural sciences 405 340 331 300 309 294 273 265 308 295 Biological sciences 1,770 1,771 1,759 1,810 1,726 1,798 1,768 1,726 1,609 1,720 Computer sciences 347 295 295 328 285 274 262 231 243 250 Earth, atmospheric, and ocean sciences 320 307 320 301 271 274 219 230 242 224 Mathematics 409 373 344 376 347 338 308 258 298 273 Physical sciences 1,476 1,456 1,472 1,467 1,444 1,272 1,254 1,129 1,128 1,089 Astronomy 92 101 110 96 86 89 76 69 80 67 Chemistry 760 754 773 785 797 665 677 665 687 635 Physics 613 594 579 577 555 506 489 389 347 384 Other physical sciences 11 7 10 9 6 12 12 6 14 3 Psychology 980 909 833 882 912 882 826 748 714 730 Social sciences 1,195 1,281 1,250 1,183 1,209 1,245 1,132 1,085 1,093 1,113
39
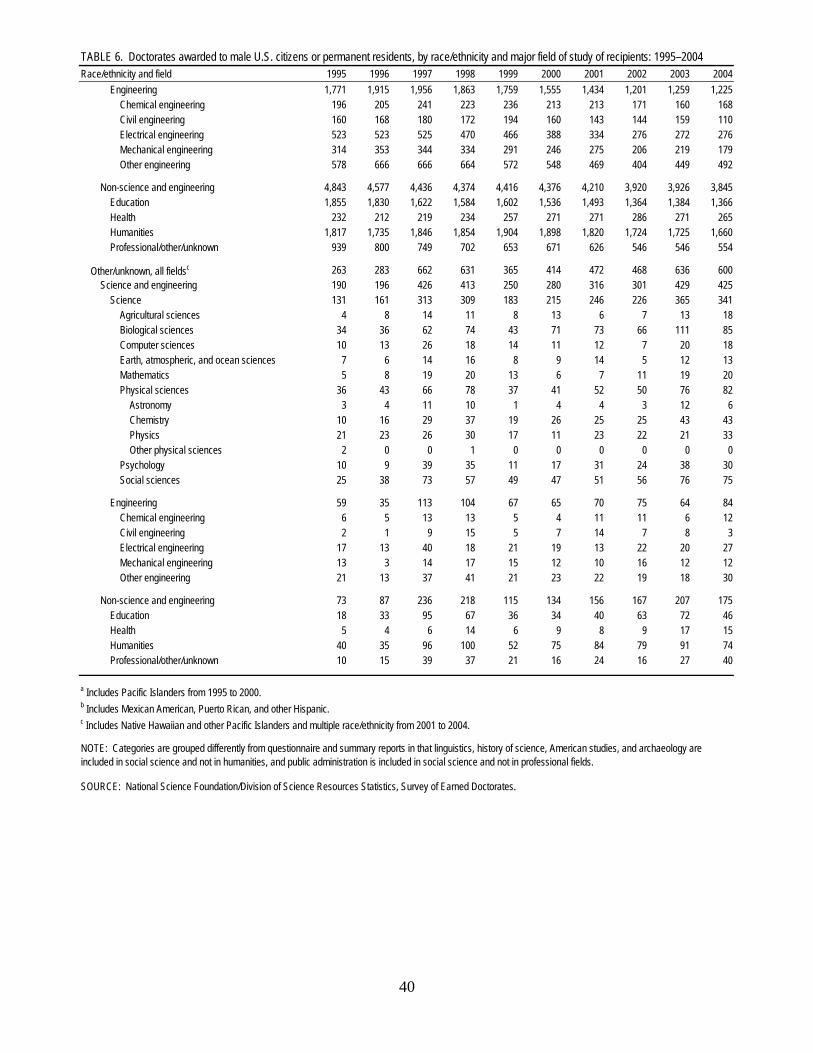
TABLE 6. Doctorates awarded to male U.S. citizens or permanent residents, by race/ethnicity and major field of study of recipients: 1995–2004Race/ethnicity and field 1995 1996 1997 1998 1999 2000 2001 2002 2003 2004 Engineering 1,771 1,915 1,956 1,863 1,759 1,555 1,434 1,201 1,259 1,225 Chemical engineering 196 205 241 223 236 213 213 171 160 168 Civil engineering 160 168 180 172 194 160 143 144 159 110 Electrical engineering 523 523 525 470 466 388 334 276 272 276 Mechanical engineering 314 353 344 334 291 246 275 206 219 179 Other engineering 578 666 666 664 572 548 469 404 449 492
Non-science and engineering 4,843 4,577 4,436 4,374 4,416 4,376 4,210 3,920 3,926 3,845 Education 1,855 1,830 1,622 1,584 1,602 1,536 1,493 1,364 1,384 1,366 Health 232 212 219 234 257 271 271 286 271 265 Humanities 1,817 1,735 1,846 1,854 1,904 1,898 1,820 1,724 1,725 1,660 Professional/other/unknown 939 800 749 702 653 671 626 546 546 554
Other/unknown, all fieldsc 263 283 662 631 365 414 472 468 636 600 Science and engineering 190 196 426 413 250 280 316 301 429 425 Science 131 161 313 309 183 215 246 226 365 341 Agricultural sciences 4 8 14 11 8 13 6 7 13 18 Biological sciences 34 36 62 74 43 71 73 66 111 85 Computer sciences 10 13 26 18 14 11 12 7 20 18 Earth, atmospheric, and ocean sciences 7 6 14 16 8 9 14 5 12 13 Mathematics 5 8 19 20 13 6 7 11 19 20 Physical sciences 36 43 66 78 37 41 52 50 76 82 Astronomy 3 4 11 10 1 4 4 3 12 6 Chemistry 10 16 29 37 19 26 25 25 43 43 Physics 21 23 26 30 17 11 23 22 21 33 Other physical sciences 2 0 0 1 0 0 0 0 0 0 Psychology 10 9 39 35 11 17 31 24 38 30 Social sciences 25 38 73 57 49 47 51 56 76 75
Engineering 59 35 113 104 67 65 70 75 64 84 Chemical engineering 6 5 13 13 5 4 11 11 6 12 Civil engineering 2 1 9 15 5 7 14 7 8 3 Electrical engineering 17 13 40 18 21 19 13 22 20 27 Mechanical engineering 13 3 14 17 15 12 10 16 12 12 Other engineering 21 13 37 41 21 23 22 19 18 30
Non-science and engineering 73 87 236 218 115 134 156 167 207 175 Education 18 33 95 67 36 34 40 63 72 46 Health 5 4 6 14 6 9 8 9 17 15 Humanities 40 35 96 100 52 75 84 79 91 74 Professional/other/unknown 10 15 39 37 21 16 24 16 27 40
a Includes Pacific Islanders from 1995 to 2000.b Includes Mexican American, Puerto Rican, and other Hispanic.c Includes Native Hawaiian and other Pacific Islanders and multiple race/ethnicity from 2001 to 2004.
SOURCE: National Science Foundation/Division of Science Resources Statistics, Survey of Earned Doctorates.
NOTE: Categories are grouped differently from questionnaire and summary reports in that linguistics, history of science, American studies, and archaeology are included in social science and not in humanities, and public administration is included in social science and not in professional fields.
40
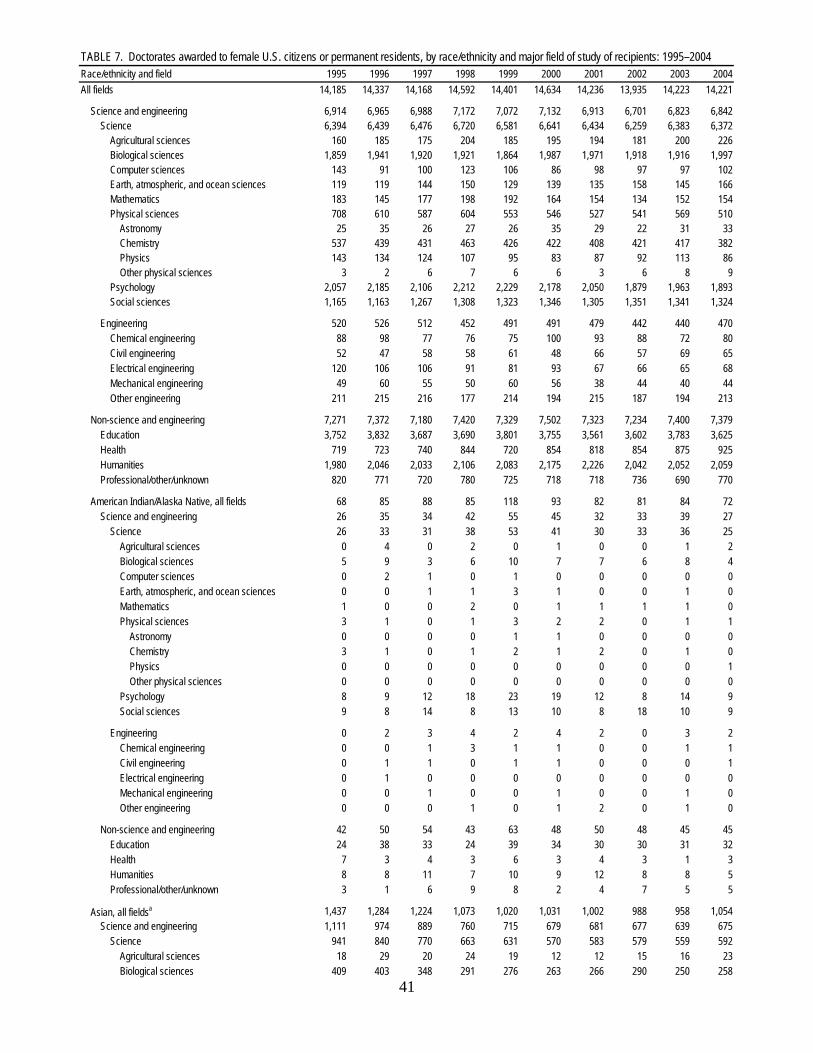
TABLE 7. Doctorates awarded to female U.S. citizens or permanent residents, by race/ethnicity and major field of study of recipients: 1995–2004Race/ethnicity and field 1995 1996 1997 1998 1999 2000 2001 2002 2003 2004All fields 14,185 14,337 14,168 14,592 14,401 14,634 14,236 13,935 14,223 14,221
Science and engineering 6,914 6,965 6,988 7,172 7,072 7,132 6,913 6,701 6,823 6,842 Science 6,394 6,439 6,476 6,720 6,581 6,641 6,434 6,259 6,383 6,372 Agricultural sciences 160 185 175 204 185 195 194 181 200 226 Biological sciences 1,859 1,941 1,920 1,921 1,864 1,987 1,971 1,918 1,916 1,997 Computer sciences 143 91 100 123 106 86 98 97 97 102 Earth, atmospheric, and ocean sciences 119 119 144 150 129 139 135 158 145 166 Mathematics 183 145 177 198 192 164 154 134 152 154 Physical sciences 708 610 587 604 553 546 527 541 569 510 Astronomy 25 35 26 27 26 35 29 22 31 33 Chemistry 537 439 431 463 426 422 408 421 417 382 Physics 143 134 124 107 95 83 87 92 113 86 Other physical sciences 3 2 6 7 6 6 3 6 8 9 Psychology 2,057 2,185 2,106 2,212 2,229 2,178 2,050 1,879 1,963 1,893 Social sciences 1,165 1,163 1,267 1,308 1,323 1,346 1,305 1,351 1,341 1,324
Engineering 520 526 512 452 491 491 479 442 440 470 Chemical engineering 88 98 77 76 75 100 93 88 72 80 Civil engineering 52 47 58 58 61 48 66 57 69 65 Electrical engineering 120 106 106 91 81 93 67 66 65 68 Mechanical engineering 49 60 55 50 60 56 38 44 40 44 Other engineering 211 215 216 177 214 194 215 187 194 213
Non-science and engineering 7,271 7,372 7,180 7,420 7,329 7,502 7,323 7,234 7,400 7,379 Education 3,752 3,832 3,687 3,690 3,801 3,755 3,561 3,602 3,783 3,625 Health 719 723 740 844 720 854 818 854 875 925 Humanities 1,980 2,046 2,033 2,106 2,083 2,175 2,226 2,042 2,052 2,059 Professional/other/unknown 820 771 720 780 725 718 718 736 690 770
American Indian/Alaska Native, all fields 68 85 88 85 118 93 82 81 84 72 Science and engineering 26 35 34 42 55 45 32 33 39 27 Science 26 33 31 38 53 41 30 33 36 25 Agricultural sciences 0 4 0 2 0 1 0 0 1 2 Biological sciences 5 9 3 6 10 7 7 6 8 4 Computer sciences 0 2 1 0 1 0 0 0 0 0 Earth, atmospheric, and ocean sciences 0 0 1 1 3 1 0 0 1 0 Mathematics 1 0 0 2 0 1 1 1 1 0 Physical sciences 3 1 0 1 3 2 2 0 1 1 Astronomy 0 0 0 0 1 1 0 0 0 0 Chemistry 3 1 0 1 2 1 2 0 1 0 Physics 0 0 0 0 0 0 0 0 0 1 Other physical sciences 0 0 0 0 0 0 0 0 0 0 Psychology 8 9 12 18 23 19 12 8 14 9 Social sciences 9 8 14 8 13 10 8 18 10 9
Engineering 0 2 3 4 2 4 2 0 3 2 Chemical engineering 0 0 1 3 1 1 0 0 1 1 Civil engineering 0 1 1 0 1 1 0 0 0 1 Electrical engineering 0 1 0 0 0 0 0 0 0 0 Mechanical engineering 0 0 1 0 0 1 0 0 1 0 Other engineering 0 0 0 1 0 1 2 0 1 0
Non-science and engineering 42 50 54 43 63 48 50 48 45 45 Education 24 38 33 24 39 34 30 30 31 32 Health 7 3 4 3 6 3 4 3 1 3 Humanities 8 8 11 7 10 9 12 8 8 5 Professional/other/unknown 3 1 6 9 8 2 4 7 5 5
Asian, all fieldsa 1,437 1,284 1,224 1,073 1,020 1,031 1,002 988 958 1,054 Science and engineering 1,111 974 889 760 715 679 681 677 639 675 Science 941 840 770 663 631 570 583 579 559 592 Agricultural sciences 18 29 20 24 19 12 12 15 16 23 Biological sciences 409 403 348 291 276 263 266 290 250 258
41
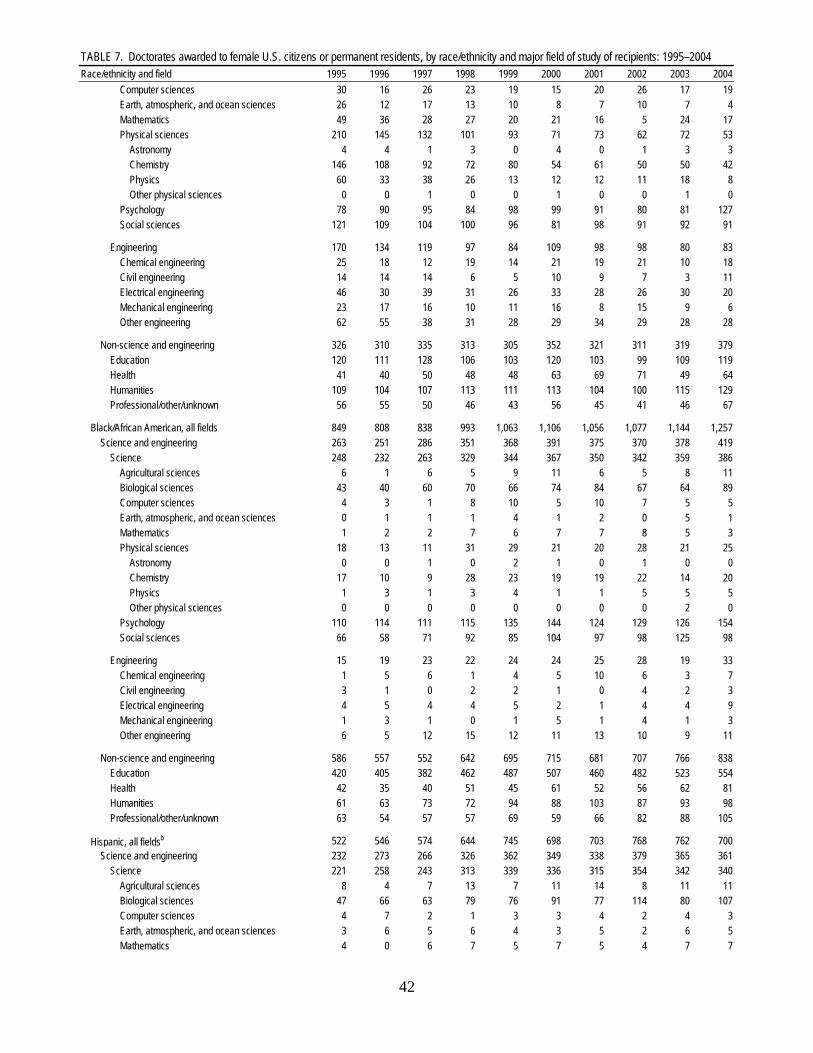
TABLE 7. Doctorates awarded to female U.S. citizens or permanent residents, by race/ethnicity and major field of study of recipients: 1995–2004Race/ethnicity and field 1995 1996 1997 1998 1999 2000 2001 2002 2003 2004 Computer sciences 30 16 26 23 19 15 20 26 17 19 Earth, atmospheric, and ocean sciences 26 12 17 13 10 8 7 10 7 4 Mathematics 49 36 28 27 20 21 16 5 24 17 Physical sciences 210 145 132 101 93 71 73 62 72 53 Astronomy 4 4 1 3 0 4 0 1 3 3 Chemistry 146 108 92 72 80 54 61 50 50 42 Physics 60 33 38 26 13 12 12 11 18 8 Other physical sciences 0 0 1 0 0 1 0 0 1 0 Psychology 78 90 95 84 98 99 91 80 81 127 Social sciences 121 109 104 100 96 81 98 91 92 91
Engineering 170 134 119 97 84 109 98 98 80 83 Chemical engineering 25 18 12 19 14 21 19 21 10 18 Civil engineering 14 14 14 6 5 10 9 7 3 11 Electrical engineering 46 30 39 31 26 33 28 26 30 20 Mechanical engineering 23 17 16 10 11 16 8 15 9 6 Other engineering 62 55 38 31 28 29 34 29 28 28
Non-science and engineering 326 310 335 313 305 352 321 311 319 379 Education 120 111 128 106 103 120 103 99 109 119 Health 41 40 50 48 48 63 69 71 49 64 Humanities 109 104 107 113 111 113 104 100 115 129 Professional/other/unknown 56 55 50 46 43 56 45 41 46 67
Black/African American, all fields 849 808 838 993 1,063 1,106 1,056 1,077 1,144 1,257 Science and engineering 263 251 286 351 368 391 375 370 378 419 Science 248 232 263 329 344 367 350 342 359 386 Agricultural sciences 6 1 6 5 9 11 6 5 8 11 Biological sciences 43 40 60 70 66 74 84 67 64 89 Computer sciences 4 3 1 8 10 5 10 7 5 5 Earth, atmospheric, and ocean sciences 0 1 1 1 4 1 2 0 5 1 Mathematics 1 2 2 7 6 7 7 8 5 3 Physical sciences 18 13 11 31 29 21 20 28 21 25 Astronomy 0 0 1 0 2 1 0 1 0 0 Chemistry 17 10 9 28 23 19 19 22 14 20 Physics 1 3 1 3 4 1 1 5 5 5 Other physical sciences 0 0 0 0 0 0 0 0 2 0 Psychology 110 114 111 115 135 144 124 129 126 154 Social sciences 66 58 71 92 85 104 97 98 125 98
Engineering 15 19 23 22 24 24 25 28 19 33 Chemical engineering 1 5 6 1 4 5 10 6 3 7 Civil engineering 3 1 0 2 2 1 0 4 2 3 Electrical engineering 4 5 4 4 5 2 1 4 4 9 Mechanical engineering 1 3 1 0 1 5 1 4 1 3 Other engineering 6 5 12 15 12 11 13 10 9 11
Non-science and engineering 586 557 552 642 695 715 681 707 766 838 Education 420 405 382 462 487 507 460 482 523 554 Health 42 35 40 51 45 61 52 56 62 81 Humanities 61 63 73 72 94 88 103 87 93 98 Professional/other/unknown 63 54 57 57 69 59 66 82 88 105
Hispanic, all fieldsb 522 546 574 644 745 698 703 768 762 700 Science and engineering 232 273 266 326 362 349 338 379 365 361 Science 221 258 243 313 339 336 315 354 342 340 Agricultural sciences 8 4 7 13 7 11 14 8 11 11 Biological sciences 47 66 63 79 76 91 77 114 80 107 Computer sciences 4 7 2 1 3 3 4 2 4 3 Earth, atmospheric, and ocean sciences 3 6 5 6 4 3 5 2 6 5 Mathematics 4 0 6 7 5 7 5 4 7 7
42
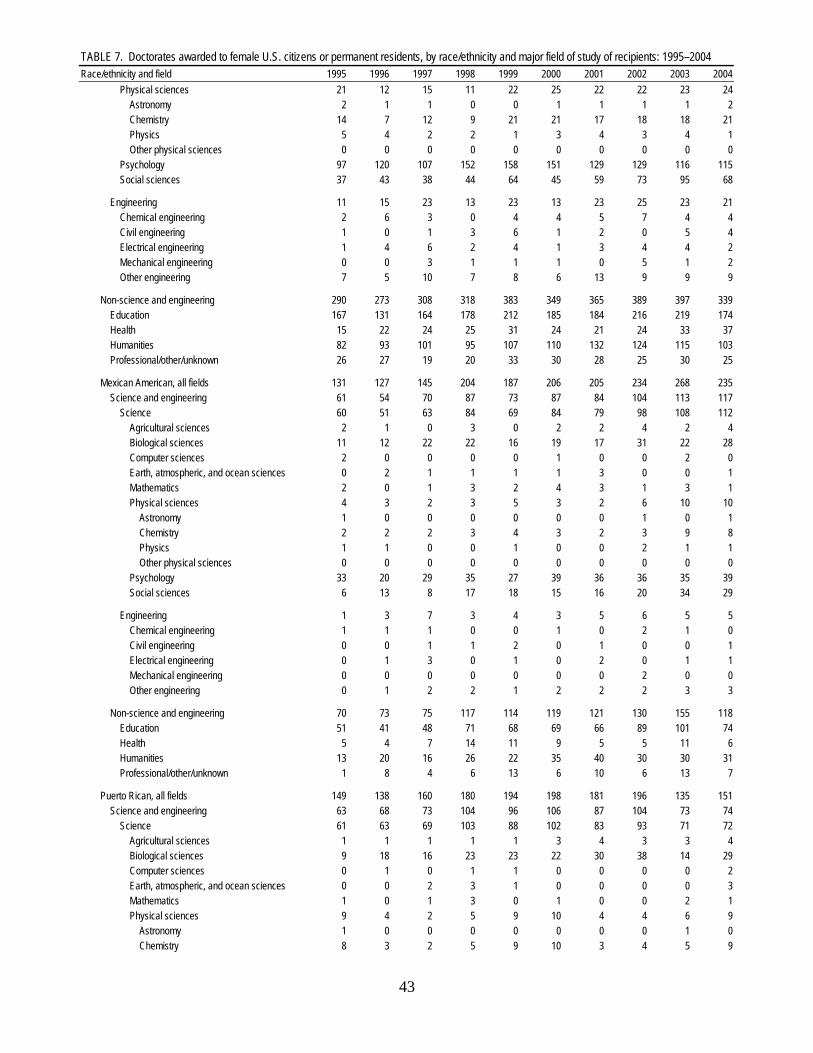
TABLE 7. Doctorates awarded to female U.S. citizens or permanent residents, by race/ethnicity and major field of study of recipients: 1995–2004Race/ethnicity and field 1995 1996 1997 1998 1999 2000 2001 2002 2003 2004 Physical sciences 21 12 15 11 22 25 22 22 23 24 Astronomy 2 1 1 0 0 1 1 1 1 2 Chemistry 14 7 12 9 21 21 17 18 18 21 Physics 5 4 2 2 1 3 4 3 4 1 Other physical sciences 0 0 0 0 0 0 0 0 0 0 Psychology 97 120 107 152 158 151 129 129 116 115 Social sciences 37 43 38 44 64 45 59 73 95 68
Engineering 11 15 23 13 23 13 23 25 23 21 Chemical engineering 2 6 3 0 4 4 5 7 4 4 Civil engineering 1 0 1 3 6 1 2 0 5 4 Electrical engineering 1 4 6 2 4 1 3 4 4 2 Mechanical engineering 0 0 3 1 1 1 0 5 1 2 Other engineering 7 5 10 7 8 6 13 9 9 9
Non-science and engineering 290 273 308 318 383 349 365 389 397 339 Education 167 131 164 178 212 185 184 216 219 174 Health 15 22 24 25 31 24 21 24 33 37 Humanities 82 93 101 95 107 110 132 124 115 103 Professional/other/unknown 26 27 19 20 33 30 28 25 30 25
Mexican American, all fields 131 127 145 204 187 206 205 234 268 235 Science and engineering 61 54 70 87 73 87 84 104 113 117 Science 60 51 63 84 69 84 79 98 108 112 Agricultural sciences 2 1 0 3 0 2 2 4 2 4 Biological sciences 11 12 22 22 16 19 17 31 22 28 Computer sciences 2 0 0 0 0 1 0 0 2 0 Earth, atmospheric, and ocean sciences 0 2 1 1 1 1 3 0 0 1 Mathematics 2 0 1 3 2 4 3 1 3 1 Physical sciences 4 3 2 3 5 3 2 6 10 10 Astronomy 1 0 0 0 0 0 0 1 0 1 Chemistry 2 2 2 3 4 3 2 3 9 8 Physics 1 1 0 0 1 0 0 2 1 1 Other physical sciences 0 0 0 0 0 0 0 0 0 0 Psychology 33 20 29 35 27 39 36 36 35 39 Social sciences 6 13 8 17 18 15 16 20 34 29
Engineering 1 3 7 3 4 3 5 6 5 5 Chemical engineering 1 1 1 0 0 1 0 2 1 0 Civil engineering 0 0 1 1 2 0 1 0 0 1 Electrical engineering 0 1 3 0 1 0 2 0 1 1 Mechanical engineering 0 0 0 0 0 0 0 2 0 0 Other engineering 0 1 2 2 1 2 2 2 3 3
Non-science and engineering 70 73 75 117 114 119 121 130 155 118 Education 51 41 48 71 68 69 66 89 101 74 Health 5 4 7 14 11 9 5 5 11 6 Humanities 13 20 16 26 22 35 40 30 30 31 Professional/other/unknown 1 8 4 6 13 6 10 6 13 7
Puerto Rican, all fields 149 138 160 180 194 198 181 196 135 151 Science and engineering 63 68 73 104 96 106 87 104 73 74 Science 61 63 69 103 88 102 83 93 71 72 Agricultural sciences 1 1 1 1 1 3 4 3 3 4 Biological sciences 9 18 16 23 23 22 30 38 14 29 Computer sciences 0 1 0 1 1 0 0 0 0 2 Earth, atmospheric, and ocean sciences 0 0 2 3 1 0 0 0 0 3 Mathematics 1 0 1 3 0 1 0 0 2 1 Physical sciences 9 4 2 5 9 10 4 4 6 9 Astronomy 1 0 0 0 0 0 0 0 1 0 Chemistry 8 3 2 5 9 10 3 4 5 9
43
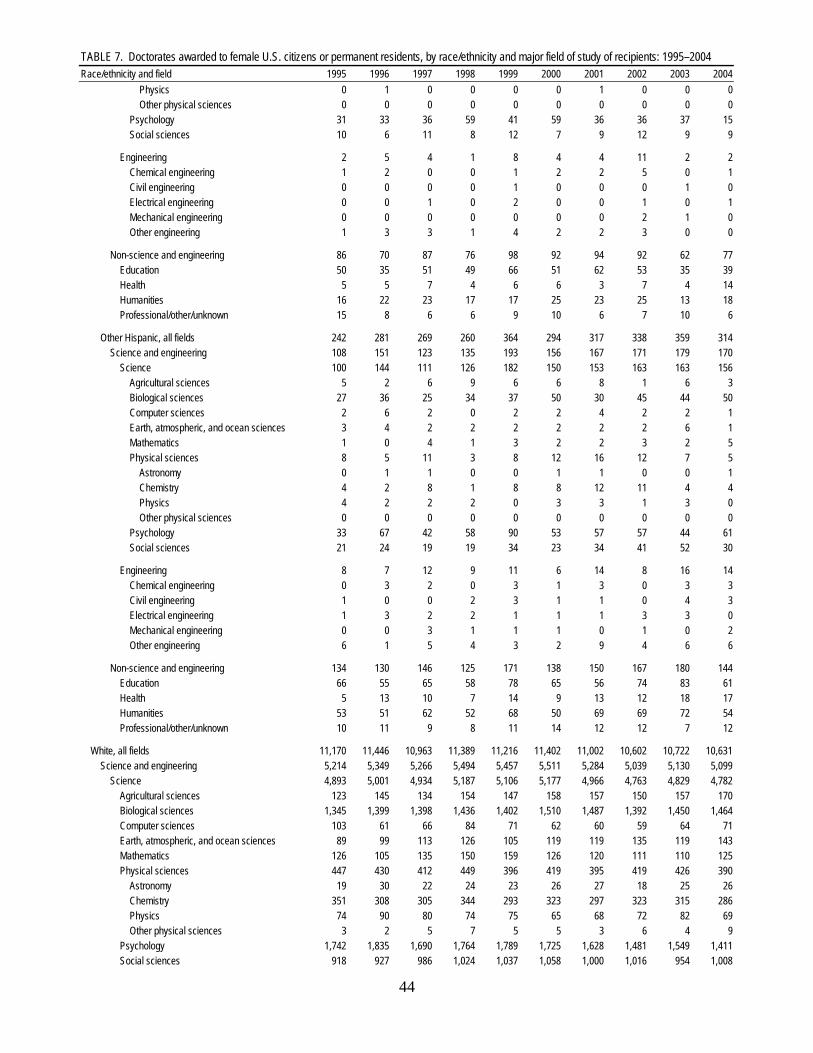
TABLE 7. Doctorates awarded to female U.S. citizens or permanent residents, by race/ethnicity and major field of study of recipients: 1995–2004Race/ethnicity and field 1995 1996 1997 1998 1999 2000 2001 2002 2003 2004 Physics 0 1 0 0 0 0 1 0 0 0 Other physical sciences 0 0 0 0 0 0 0 0 0 0 Psychology 31 33 36 59 41 59 36 36 37 15 Social sciences 10 6 11 8 12 7 9 12 9 9
Engineering 2 5 4 1 8 4 4 11 2 2 Chemical engineering 1 2 0 0 1 2 2 5 0 1 Civil engineering 0 0 0 0 1 0 0 0 1 0 Electrical engineering 0 0 1 0 2 0 0 1 0 1 Mechanical engineering 0 0 0 0 0 0 0 2 1 0 Other engineering 1 3 3 1 4 2 2 3 0 0
Non-science and engineering 86 70 87 76 98 92 94 92 62 77 Education 50 35 51 49 66 51 62 53 35 39 Health 5 5 7 4 6 6 3 7 4 14 Humanities 16 22 23 17 17 25 23 25 13 18 Professional/other/unknown 15 8 6 6 9 10 6 7 10 6
Other Hispanic, all fields 242 281 269 260 364 294 317 338 359 314 Science and engineering 108 151 123 135 193 156 167 171 179 170 Science 100 144 111 126 182 150 153 163 163 156 Agricultural sciences 5 2 6 9 6 6 8 1 6 3 Biological sciences 27 36 25 34 37 50 30 45 44 50 Computer sciences 2 6 2 0 2 2 4 2 2 1 Earth, atmospheric, and ocean sciences 3 4 2 2 2 2 2 2 6 1 Mathematics 1 0 4 1 3 2 2 3 2 5 Physical sciences 8 5 11 3 8 12 16 12 7 5 Astronomy 0 1 1 0 0 1 1 0 0 1 Chemistry 4 2 8 1 8 8 12 11 4 4 Physics 4 2 2 2 0 3 3 1 3 0 Other physical sciences 0 0 0 0 0 0 0 0 0 0 Psychology 33 67 42 58 90 53 57 57 44 61 Social sciences 21 24 19 19 34 23 34 41 52 30
Engineering 8 7 12 9 11 6 14 8 16 14 Chemical engineering 0 3 2 0 3 1 3 0 3 3 Civil engineering 1 0 0 2 3 1 1 0 4 3 Electrical engineering 1 3 2 2 1 1 1 3 3 0 Mechanical engineering 0 0 3 1 1 1 0 1 0 2 Other engineering 6 1 5 4 3 2 9 4 6 6
Non-science and engineering 134 130 146 125 171 138 150 167 180 144 Education 66 55 65 58 78 65 56 74 83 61 Health 5 13 10 7 14 9 13 12 18 17 Humanities 53 51 62 52 68 50 69 69 72 54 Professional/other/unknown 10 11 9 8 11 14 12 12 7 12
White, all fields 11,170 11,446 10,963 11,389 11,216 11,402 11,002 10,602 10,722 10,631 Science and engineering 5,214 5,349 5,266 5,494 5,457 5,511 5,284 5,039 5,130 5,099 Science 4,893 5,001 4,934 5,187 5,106 5,177 4,966 4,763 4,829 4,782 Agricultural sciences 123 145 134 154 147 158 157 150 157 170 Biological sciences 1,345 1,399 1,398 1,436 1,402 1,510 1,487 1,392 1,450 1,464 Computer sciences 103 61 66 84 71 62 60 59 64 71 Earth, atmospheric, and ocean sciences 89 99 113 126 105 119 119 135 119 143 Mathematics 126 105 135 150 159 126 120 111 110 125 Physical sciences 447 430 412 449 396 419 395 419 426 390 Astronomy 19 30 22 24 23 26 27 18 25 26 Chemistry 351 308 305 344 293 323 297 323 315 286 Physics 74 90 80 74 75 65 68 72 82 69 Other physical sciences 3 2 5 7 5 5 3 6 4 9 Psychology 1,742 1,835 1,690 1,764 1,789 1,725 1,628 1,481 1,549 1,411 Social sciences 918 927 986 1,024 1,037 1,058 1,000 1,016 954 1,008
44
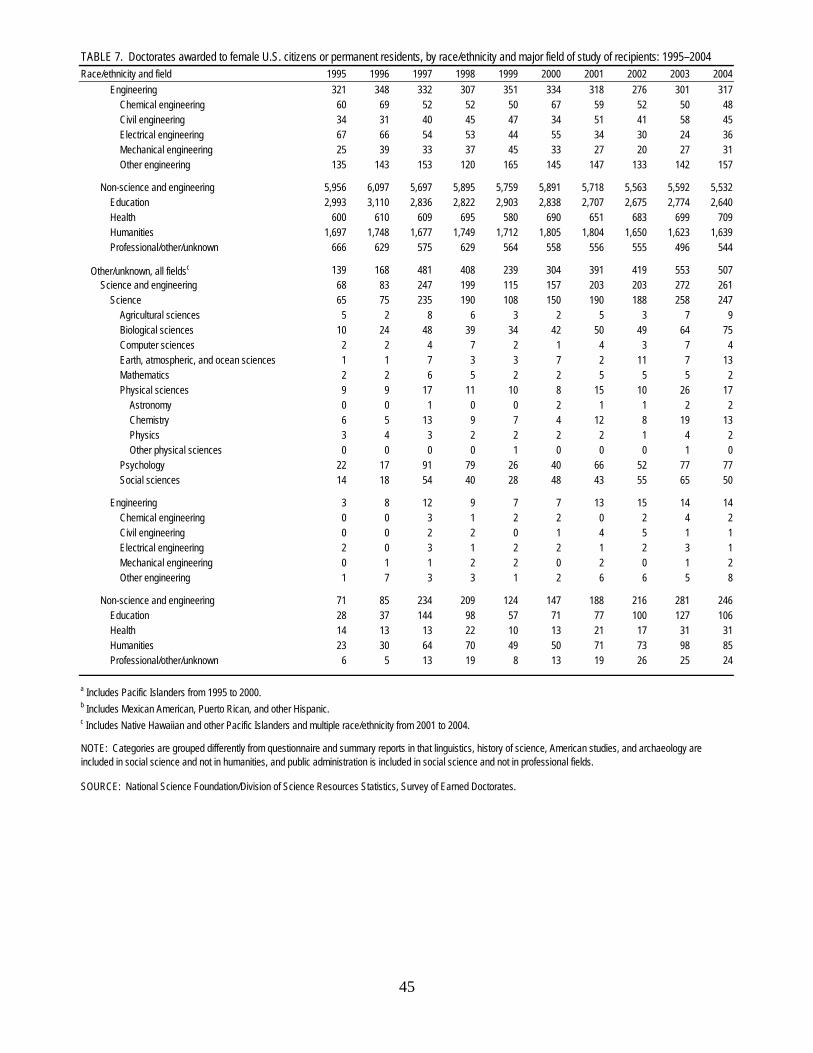
TABLE 7. Doctorates awarded to female U.S. citizens or permanent residents, by race/ethnicity and major field of study of recipients: 1995–2004Race/ethnicity and field 1995 1996 1997 1998 1999 2000 2001 2002 2003 2004 Engineering 321 348 332 307 351 334 318 276 301 317 Chemical engineering 60 69 52 52 50 67 59 52 50 48 Civil engineering 34 31 40 45 47 34 51 41 58 45 Electrical engineering 67 66 54 53 44 55 34 30 24 36 Mechanical engineering 25 39 33 37 45 33 27 20 27 31 Other engineering 135 143 153 120 165 145 147 133 142 157
Non-science and engineering 5,956 6,097 5,697 5,895 5,759 5,891 5,718 5,563 5,592 5,532 Education 2,993 3,110 2,836 2,822 2,903 2,838 2,707 2,675 2,774 2,640 Health 600 610 609 695 580 690 651 683 699 709 Humanities 1,697 1,748 1,677 1,749 1,712 1,805 1,804 1,650 1,623 1,639 Professional/other/unknown 666 629 575 629 564 558 556 555 496 544
Other/unknown, all fieldsc 139 168 481 408 239 304 391 419 553 507 Science and engineering 68 83 247 199 115 157 203 203 272 261 Science 65 75 235 190 108 150 190 188 258 247 Agricultural sciences 5 2 8 6 3 2 5 3 7 9 Biological sciences 10 24 48 39 34 42 50 49 64 75 Computer sciences 2 2 4 7 2 1 4 3 7 4 Earth, atmospheric, and ocean sciences 1 1 7 3 3 7 2 11 7 13 Mathematics 2 2 6 5 2 2 5 5 5 2 Physical sciences 9 9 17 11 10 8 15 10 26 17 Astronomy 0 0 1 0 0 2 1 1 2 2 Chemistry 6 5 13 9 7 4 12 8 19 13 Physics 3 4 3 2 2 2 2 1 4 2 Other physical sciences 0 0 0 0 1 0 0 0 1 0 Psychology 22 17 91 79 26 40 66 52 77 77 Social sciences 14 18 54 40 28 48 43 55 65 50
Engineering 3 8 12 9 7 7 13 15 14 14 Chemical engineering 0 0 3 1 2 2 0 2 4 2 Civil engineering 0 0 2 2 0 1 4 5 1 1 Electrical engineering 2 0 3 1 2 2 1 2 3 1 Mechanical engineering 0 1 1 2 2 0 2 0 1 2 Other engineering 1 7 3 3 1 2 6 6 5 8
Non-science and engineering 71 85 234 209 124 147 188 216 281 246 Education 28 37 144 98 57 71 77 100 127 106 Health 14 13 13 22 10 13 21 17 31 31 Humanities 23 30 64 70 49 50 71 73 98 85 Professional/other/unknown 6 5 13 19 8 13 19 26 25 24
a Includes Pacific Islanders from 1995 to 2000.b Includes Mexican American, Puerto Rican, and other Hispanic.c Includes Native Hawaiian and other Pacific Islanders and multiple race/ethnicity from 2001 to 2004.
SOURCE: National Science Foundation/Division of Science Resources Statistics, Survey of Earned Doctorates.
NOTE: Categories are grouped differently from questionnaire and summary reports in that linguistics, history of science, American studies, and archaeology are included in social science and not in humanities, and public administration is included in social science and not in professional fields.
45
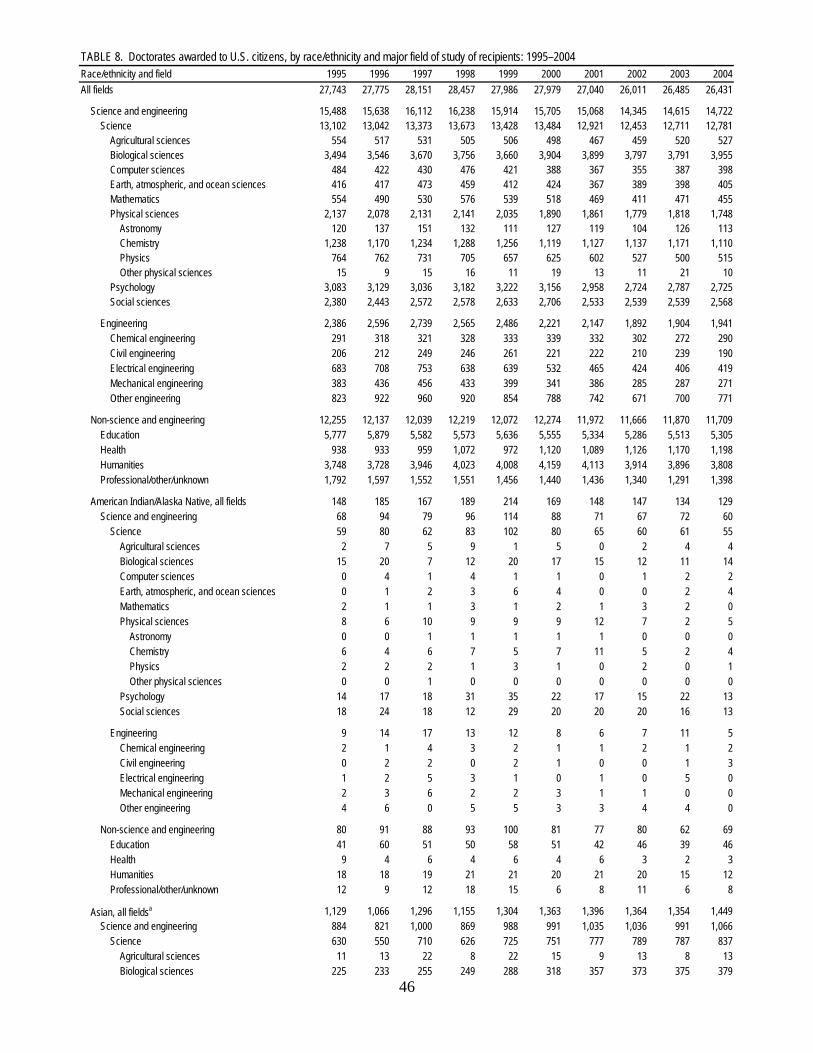
TABLE 8. Doctorates awarded to U.S. citizens, by race/ethnicity and major field of study of recipients: 1995–2004Race/ethnicity and field 1995 1996 1997 1998 1999 2000 2001 2002 2003 2004All fields 27,743 27,775 28,151 28,457 27,986 27,979 27,040 26,011 26,485 26,431
Science and engineering 15,488 15,638 16,112 16,238 15,914 15,705 15,068 14,345 14,615 14,722 Science 13,102 13,042 13,373 13,673 13,428 13,484 12,921 12,453 12,711 12,781 Agricultural sciences 554 517 531 505 506 498 467 459 520 527 Biological sciences 3,494 3,546 3,670 3,756 3,660 3,904 3,899 3,797 3,791 3,955 Computer sciences 484 422 430 476 421 388 367 355 387 398 Earth, atmospheric, and ocean sciences 416 417 473 459 412 424 367 389 398 405 Mathematics 554 490 530 576 539 518 469 411 471 455 Physical sciences 2,137 2,078 2,131 2,141 2,035 1,890 1,861 1,779 1,818 1,748 Astronomy 120 137 151 132 111 127 119 104 126 113 Chemistry 1,238 1,170 1,234 1,288 1,256 1,119 1,127 1,137 1,171 1,110 Physics 764 762 731 705 657 625 602 527 500 515 Other physical sciences 15 9 15 16 11 19 13 11 21 10 Psychology 3,083 3,129 3,036 3,182 3,222 3,156 2,958 2,724 2,787 2,725 Social sciences 2,380 2,443 2,572 2,578 2,633 2,706 2,533 2,539 2,539 2,568
Engineering 2,386 2,596 2,739 2,565 2,486 2,221 2,147 1,892 1,904 1,941 Chemical engineering 291 318 321 328 333 339 332 302 272 290 Civil engineering 206 212 249 246 261 221 222 210 239 190 Electrical engineering 683 708 753 638 639 532 465 424 406 419 Mechanical engineering 383 436 456 433 399 341 386 285 287 271 Other engineering 823 922 960 920 854 788 742 671 700 771
Non-science and engineering 12,255 12,137 12,039 12,219 12,072 12,274 11,972 11,666 11,870 11,709 Education 5,777 5,879 5,582 5,573 5,636 5,555 5,334 5,286 5,513 5,305 Health 938 933 959 1,072 972 1,120 1,089 1,126 1,170 1,198 Humanities 3,748 3,728 3,946 4,023 4,008 4,159 4,113 3,914 3,896 3,808 Professional/other/unknown 1,792 1,597 1,552 1,551 1,456 1,440 1,436 1,340 1,291 1,398
American Indian/Alaska Native, all fields 148 185 167 189 214 169 148 147 134 129 Science and engineering 68 94 79 96 114 88 71 67 72 60 Science 59 80 62 83 102 80 65 60 61 55 Agricultural sciences 2 7 5 9 1 5 0 2 4 4 Biological sciences 15 20 7 12 20 17 15 12 11 14 Computer sciences 0 4 1 4 1 1 0 1 2 2 Earth, atmospheric, and ocean sciences 0 1 2 3 6 4 0 0 2 4 Mathematics 2 1 1 3 1 2 1 3 2 0 Physical sciences 8 6 10 9 9 9 12 7 2 5 Astronomy 0 0 1 1 1 1 1 0 0 0 Chemistry 6 4 6 7 5 7 11 5 2 4 Physics 2 2 2 1 3 1 0 2 0 1 Other physical sciences 0 0 1 0 0 0 0 0 0 0 Psychology 14 17 18 31 35 22 17 15 22 13 Social sciences 18 24 18 12 29 20 20 20 16 13
Engineering 9 14 17 13 12 8 6 7 11 5 Chemical engineering 2 1 4 3 2 1 1 2 1 2 Civil engineering 0 2 2 0 2 1 0 0 1 3 Electrical engineering 1 2 5 3 1 0 1 0 5 0 Mechanical engineering 2 3 6 2 2 3 1 1 0 0 Other engineering 4 6 0 5 5 3 3 4 4 0
Non-science and engineering 80 91 88 93 100 81 77 80 62 69 Education 41 60 51 50 58 51 42 46 39 46 Health 9 4 6 4 6 4 6 3 2 3 Humanities 18 18 19 21 21 20 21 20 15 12 Professional/other/unknown 12 9 12 18 15 6 8 11 6 8
Asian, all fieldsa 1,129 1,066 1,296 1,155 1,304 1,363 1,396 1,364 1,354 1,449 Science and engineering 884 821 1,000 869 988 991 1,035 1,036 991 1,066 Science 630 550 710 626 725 751 777 789 787 837 Agricultural sciences 11 13 22 8 22 15 9 13 8 13 Biological sciences 225 233 255 249 288 318 357 373 375 379
46
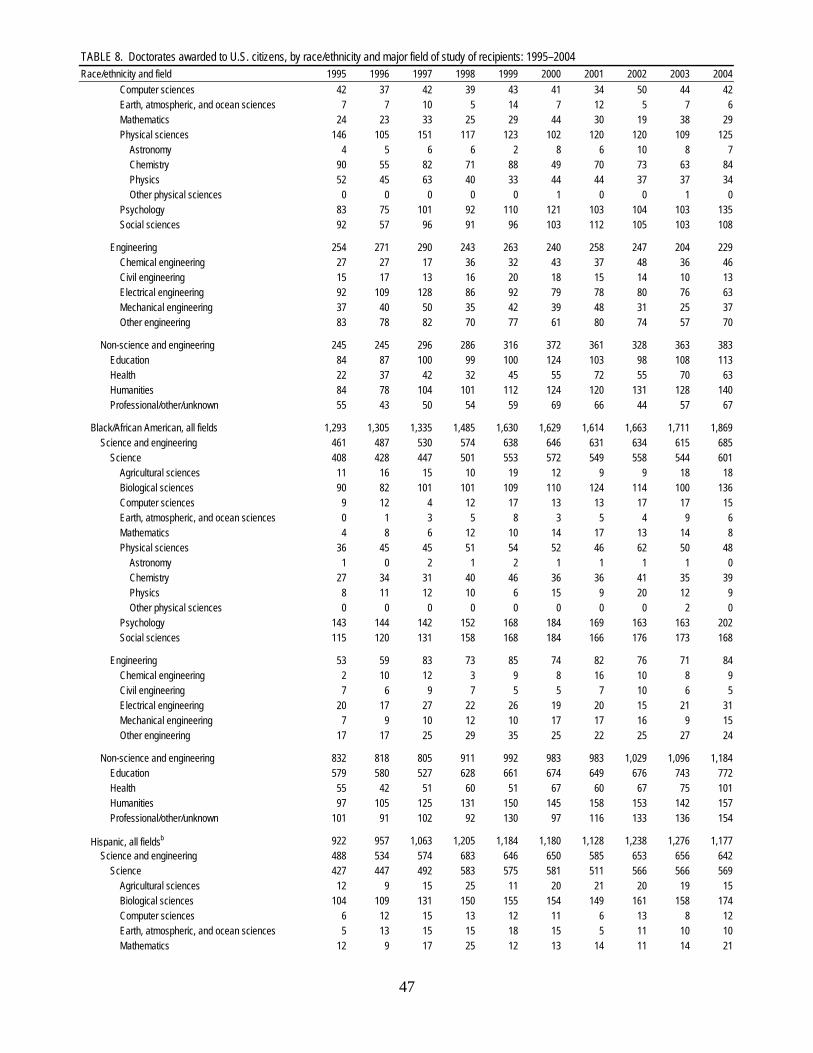
TABLE 8. Doctorates awarded to U.S. citizens, by race/ethnicity and major field of study of recipients: 1995–2004Race/ethnicity and field 1995 1996 1997 1998 1999 2000 2001 2002 2003 2004 Computer sciences 42 37 42 39 43 41 34 50 44 42 Earth, atmospheric, and ocean sciences 7 7 10 5 14 7 12 5 7 6 Mathematics 24 23 33 25 29 44 30 19 38 29 Physical sciences 146 105 151 117 123 102 120 120 109 125 Astronomy 4 5 6 6 2 8 6 10 8 7 Chemistry 90 55 82 71 88 49 70 73 63 84 Physics 52 45 63 40 33 44 44 37 37 34 Other physical sciences 0 0 0 0 0 1 0 0 1 0 Psychology 83 75 101 92 110 121 103 104 103 135 Social sciences 92 57 96 91 96 103 112 105 103 108
Engineering 254 271 290 243 263 240 258 247 204 229 Chemical engineering 27 27 17 36 32 43 37 48 36 46 Civil engineering 15 17 13 16 20 18 15 14 10 13 Electrical engineering 92 109 128 86 92 79 78 80 76 63 Mechanical engineering 37 40 50 35 42 39 48 31 25 37 Other engineering 83 78 82 70 77 61 80 74 57 70
Non-science and engineering 245 245 296 286 316 372 361 328 363 383 Education 84 87 100 99 100 124 103 98 108 113 Health 22 37 42 32 45 55 72 55 70 63 Humanities 84 78 104 101 112 124 120 131 128 140 Professional/other/unknown 55 43 50 54 59 69 66 44 57 67
Black/African American, all fields 1,293 1,305 1,335 1,485 1,630 1,629 1,614 1,663 1,711 1,869 Science and engineering 461 487 530 574 638 646 631 634 615 685 Science 408 428 447 501 553 572 549 558 544 601 Agricultural sciences 11 16 15 10 19 12 9 9 18 18 Biological sciences 90 82 101 101 109 110 124 114 100 136 Computer sciences 9 12 4 12 17 13 13 17 17 15 Earth, atmospheric, and ocean sciences 0 1 3 5 8 3 5 4 9 6 Mathematics 4 8 6 12 10 14 17 13 14 8 Physical sciences 36 45 45 51 54 52 46 62 50 48 Astronomy 1 0 2 1 2 1 1 1 1 0 Chemistry 27 34 31 40 46 36 36 41 35 39 Physics 8 11 12 10 6 15 9 20 12 9 Other physical sciences 0 0 0 0 0 0 0 0 2 0 Psychology 143 144 142 152 168 184 169 163 163 202 Social sciences 115 120 131 158 168 184 166 176 173 168
Engineering 53 59 83 73 85 74 82 76 71 84 Chemical engineering 2 10 12 3 9 8 16 10 8 9 Civil engineering 7 6 9 7 5 5 7 10 6 5 Electrical engineering 20 17 27 22 26 19 20 15 21 31 Mechanical engineering 7 9 10 12 10 17 17 16 9 15 Other engineering 17 17 25 29 35 25 22 25 27 24
Non-science and engineering 832 818 805 911 992 983 983 1,029 1,096 1,184 Education 579 580 527 628 661 674 649 676 743 772 Health 55 42 51 60 51 67 60 67 75 101 Humanities 97 105 125 131 150 145 158 153 142 157 Professional/other/unknown 101 91 102 92 130 97 116 133 136 154
Hispanic, all fieldsb 922 957 1,063 1,205 1,184 1,180 1,128 1,238 1,276 1,177 Science and engineering 488 534 574 683 646 650 585 653 656 642 Science 427 447 492 583 575 581 511 566 566 569 Agricultural sciences 12 9 15 25 11 20 21 20 19 15 Biological sciences 104 109 131 150 155 154 149 161 158 174 Computer sciences 6 12 15 13 12 11 6 13 8 12 Earth, atmospheric, and ocean sciences 5 13 15 15 18 15 5 11 10 10 Mathematics 12 9 17 25 12 13 14 11 14 21
47
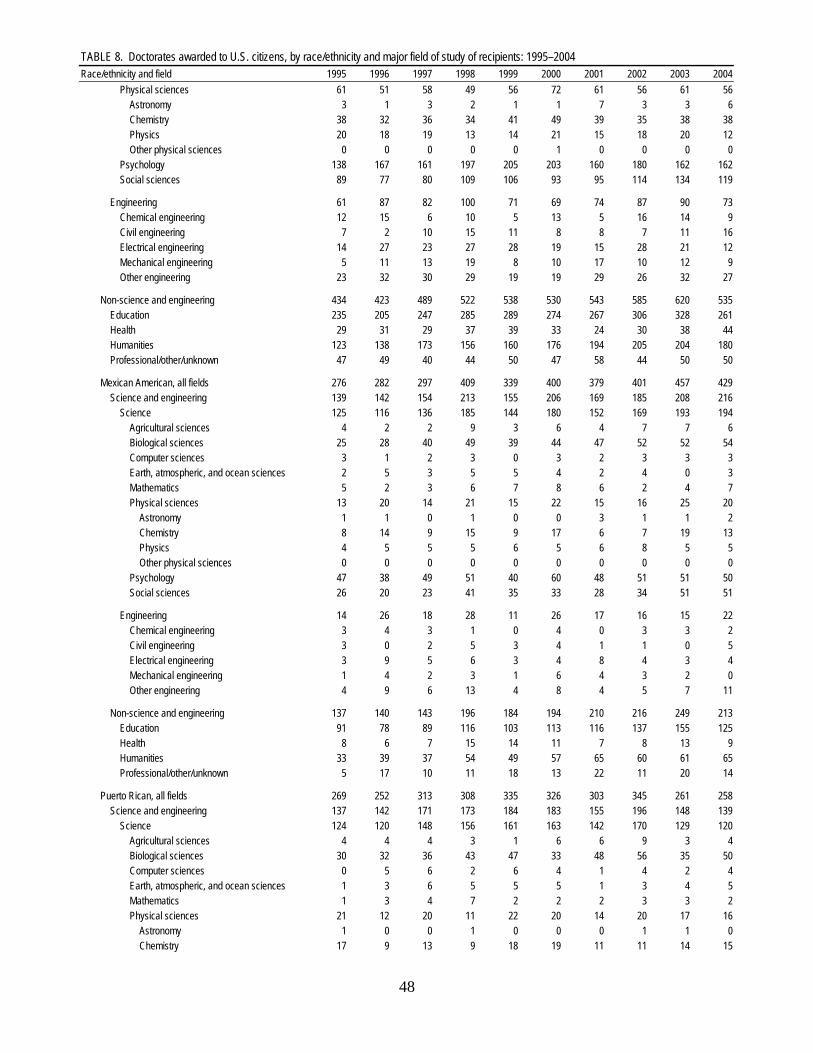
TABLE 8. Doctorates awarded to U.S. citizens, by race/ethnicity and major field of study of recipients: 1995–2004Race/ethnicity and field 1995 1996 1997 1998 1999 2000 2001 2002 2003 2004 Physical sciences 61 51 58 49 56 72 61 56 61 56 Astronomy 3 1 3 2 1 1 7 3 3 6 Chemistry 38 32 36 34 41 49 39 35 38 38 Physics 20 18 19 13 14 21 15 18 20 12 Other physical sciences 0 0 0 0 0 1 0 0 0 0 Psychology 138 167 161 197 205 203 160 180 162 162 Social sciences 89 77 80 109 106 93 95 114 134 119
Engineering 61 87 82 100 71 69 74 87 90 73 Chemical engineering 12 15 6 10 5 13 5 16 14 9 Civil engineering 7 2 10 15 11 8 8 7 11 16 Electrical engineering 14 27 23 27 28 19 15 28 21 12 Mechanical engineering 5 11 13 19 8 10 17 10 12 9 Other engineering 23 32 30 29 19 19 29 26 32 27
Non-science and engineering 434 423 489 522 538 530 543 585 620 535 Education 235 205 247 285 289 274 267 306 328 261 Health 29 31 29 37 39 33 24 30 38 44 Humanities 123 138 173 156 160 176 194 205 204 180 Professional/other/unknown 47 49 40 44 50 47 58 44 50 50
Mexican American, all fields 276 282 297 409 339 400 379 401 457 429 Science and engineering 139 142 154 213 155 206 169 185 208 216 Science 125 116 136 185 144 180 152 169 193 194 Agricultural sciences 4 2 2 9 3 6 4 7 7 6 Biological sciences 25 28 40 49 39 44 47 52 52 54 Computer sciences 3 1 2 3 0 3 2 3 3 3 Earth, atmospheric, and ocean sciences 2 5 3 5 5 4 2 4 0 3 Mathematics 5 2 3 6 7 8 6 2 4 7 Physical sciences 13 20 14 21 15 22 15 16 25 20 Astronomy 1 1 0 1 0 0 3 1 1 2 Chemistry 8 14 9 15 9 17 6 7 19 13 Physics 4 5 5 5 6 5 6 8 5 5 Other physical sciences 0 0 0 0 0 0 0 0 0 0 Psychology 47 38 49 51 40 60 48 51 51 50 Social sciences 26 20 23 41 35 33 28 34 51 51
Engineering 14 26 18 28 11 26 17 16 15 22 Chemical engineering 3 4 3 1 0 4 0 3 3 2 Civil engineering 3 0 2 5 3 4 1 1 0 5 Electrical engineering 3 9 5 6 3 4 8 4 3 4 Mechanical engineering 1 4 2 3 1 6 4 3 2 0 Other engineering 4 9 6 13 4 8 4 5 7 11
Non-science and engineering 137 140 143 196 184 194 210 216 249 213 Education 91 78 89 116 103 113 116 137 155 125 Health 8 6 7 15 14 11 7 8 13 9 Humanities 33 39 37 54 49 57 65 60 61 65 Professional/other/unknown 5 17 10 11 18 13 22 11 20 14
Puerto Rican, all fields 269 252 313 308 335 326 303 345 261 258 Science and engineering 137 142 171 173 184 183 155 196 148 139 Science 124 120 148 156 161 163 142 170 129 120 Agricultural sciences 4 4 4 3 1 6 6 9 3 4 Biological sciences 30 32 36 43 47 33 48 56 35 50 Computer sciences 0 5 6 2 6 4 1 4 2 4 Earth, atmospheric, and ocean sciences 1 3 6 5 5 5 1 3 4 5 Mathematics 1 3 4 7 2 2 2 3 3 2 Physical sciences 21 12 20 11 22 20 14 20 17 16 Astronomy 1 0 0 1 0 0 0 1 1 0 Chemistry 17 9 13 9 18 19 11 11 14 15
48
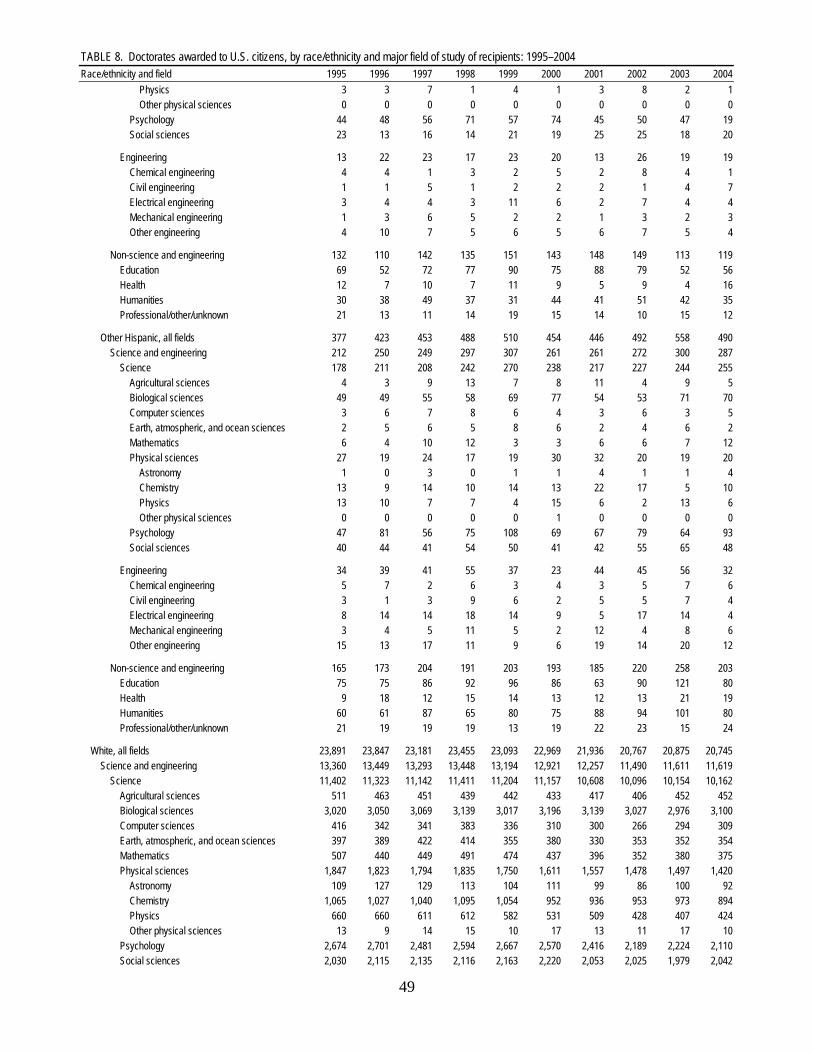
TABLE 8. Doctorates awarded to U.S. citizens, by race/ethnicity and major field of study of recipients: 1995–2004Race/ethnicity and field 1995 1996 1997 1998 1999 2000 2001 2002 2003 2004 Physics 3 3 7 1 4 1 3 8 2 1 Other physical sciences 0 0 0 0 0 0 0 0 0 0 Psychology 44 48 56 71 57 74 45 50 47 19 Social sciences 23 13 16 14 21 19 25 25 18 20
Engineering 13 22 23 17 23 20 13 26 19 19 Chemical engineering 4 4 1 3 2 5 2 8 4 1 Civil engineering 1 1 5 1 2 2 2 1 4 7 Electrical engineering 3 4 4 3 11 6 2 7 4 4 Mechanical engineering 1 3 6 5 2 2 1 3 2 3 Other engineering 4 10 7 5 6 5 6 7 5 4
Non-science and engineering 132 110 142 135 151 143 148 149 113 119 Education 69 52 72 77 90 75 88 79 52 56 Health 12 7 10 7 11 9 5 9 4 16 Humanities 30 38 49 37 31 44 41 51 42 35 Professional/other/unknown 21 13 11 14 19 15 14 10 15 12
Other Hispanic, all fields 377 423 453 488 510 454 446 492 558 490 Science and engineering 212 250 249 297 307 261 261 272 300 287 Science 178 211 208 242 270 238 217 227 244 255 Agricultural sciences 4 3 9 13 7 8 11 4 9 5 Biological sciences 49 49 55 58 69 77 54 53 71 70 Computer sciences 3 6 7 8 6 4 3 6 3 5 Earth, atmospheric, and ocean sciences 2 5 6 5 8 6 2 4 6 2 Mathematics 6 4 10 12 3 3 6 6 7 12 Physical sciences 27 19 24 17 19 30 32 20 19 20 Astronomy 1 0 3 0 1 1 4 1 1 4 Chemistry 13 9 14 10 14 13 22 17 5 10 Physics 13 10 7 7 4 15 6 2 13 6 Other physical sciences 0 0 0 0 0 1 0 0 0 0 Psychology 47 81 56 75 108 69 67 79 64 93 Social sciences 40 44 41 54 50 41 42 55 65 48
Engineering 34 39 41 55 37 23 44 45 56 32 Chemical engineering 5 7 2 6 3 4 3 5 7 6 Civil engineering 3 1 3 9 6 2 5 5 7 4 Electrical engineering 8 14 14 18 14 9 5 17 14 4 Mechanical engineering 3 4 5 11 5 2 12 4 8 6 Other engineering 15 13 17 11 9 6 19 14 20 12
Non-science and engineering 165 173 204 191 203 193 185 220 258 203 Education 75 75 86 92 96 86 63 90 121 80 Health 9 18 12 15 14 13 12 13 21 19 Humanities 60 61 87 65 80 75 88 94 101 80 Professional/other/unknown 21 19 19 19 13 19 22 23 15 24
White, all fields 23,891 23,847 23,181 23,455 23,093 22,969 21,936 20,767 20,875 20,745 Science and engineering 13,360 13,449 13,293 13,448 13,194 12,921 12,257 11,490 11,611 11,619 Science 11,402 11,323 11,142 11,411 11,204 11,157 10,608 10,096 10,154 10,162 Agricultural sciences 511 463 451 439 442 433 417 406 452 452 Biological sciences 3,020 3,050 3,069 3,139 3,017 3,196 3,139 3,027 2,976 3,100 Computer sciences 416 342 341 383 336 310 300 266 294 309 Earth, atmospheric, and ocean sciences 397 389 422 414 355 380 330 353 352 354 Mathematics 507 440 449 491 474 437 396 352 380 375 Physical sciences 1,847 1,823 1,794 1,835 1,750 1,611 1,557 1,478 1,497 1,420 Astronomy 109 127 129 113 104 111 99 86 100 92 Chemistry 1,065 1,027 1,040 1,095 1,054 952 936 953 973 894 Physics 660 660 611 612 582 531 509 428 407 424 Other physical sciences 13 9 14 15 10 17 13 11 17 10 Psychology 2,674 2,701 2,481 2,594 2,667 2,570 2,416 2,189 2,224 2,110 Social sciences 2,030 2,115 2,135 2,116 2,163 2,220 2,053 2,025 1,979 2,042
49

TABLE 8. Doctorates awarded to U.S. citizens, by race/ethnicity and major field of study of recipients: 1995–2004Race/ethnicity and field 1995 1996 1997 1998 1999 2000 2001 2002 2003 2004 Engineering 1,958 2,126 2,151 2,037 1,990 1,764 1,649 1,394 1,457 1,457 Chemical engineering 242 261 269 262 279 268 262 214 203 210 Civil engineering 175 184 206 197 219 181 176 170 203 149 Electrical engineering 540 542 529 485 472 397 337 280 264 288 Mechanical engineering 320 369 361 348 323 262 292 212 228 196 Other engineering 681 770 786 745 697 656 582 518 559 614
Non-science and engineering 10,531 10,398 9,888 10,007 9,899 10,048 9,679 9,277 9,264 9,126 Education 4,796 4,879 4,414 4,349 4,438 4,329 4,160 4,001 4,101 3,962 Health 806 805 813 906 816 941 899 946 938 943 Humanities 3,367 3,329 3,366 3,460 3,467 3,581 3,472 3,263 3,229 3,164 Professional/other/unknown 1,562 1,385 1,295 1,292 1,178 1,197 1,148 1,067 996 1,057
Other/unknown, all fieldsc 360 415 1,109 968 561 669 818 832 1,135 1,062 Science and engineering 227 253 636 568 334 409 489 465 670 650 Science 176 214 520 469 269 343 411 384 599 557 Agricultural sciences 7 9 23 14 11 13 11 9 19 25 Biological sciences 40 52 107 105 71 109 115 110 171 152 Computer sciences 11 15 27 25 12 12 14 8 22 18 Earth, atmospheric, and ocean sciences 7 6 21 17 11 15 15 16 18 25 Mathematics 5 9 24 20 13 8 11 13 23 22 Physical sciences 39 48 73 80 43 44 65 56 99 94 Astronomy 3 4 10 9 1 5 5 4 14 8 Chemistry 12 18 39 41 22 26 35 30 60 51 Physics 22 26 24 29 19 13 25 22 24 35 Other physical sciences 2 0 0 1 1 0 0 0 1 0 Psychology 31 25 133 116 37 56 93 73 113 103 Social sciences 36 50 112 92 71 86 87 99 134 118
Engineering 51 39 116 99 65 66 78 81 71 93 Chemical engineering 6 4 13 14 6 6 11 12 10 14 Civil engineering 2 1 9 11 4 8 16 9 8 4 Electrical engineering 16 11 41 15 20 18 14 21 19 25 Mechanical engineering 12 4 16 17 14 10 11 15 13 14 Other engineering 15 19 37 42 21 24 26 24 21 36
Non-science and engineering 133 162 473 400 227 260 329 367 465 412 Education 42 68 243 162 90 103 113 159 194 151 Health 17 14 18 33 15 20 28 25 47 44 Humanities 59 60 159 154 98 113 148 142 178 155 Professional/other/unknown 15 20 53 51 24 24 40 41 46 62
a Includes Pacific Islanders from 1995 to 2000.b Includes Mexican American, Puerto Rican, and other Hispanic.c Includes Native Hawaiian and other Pacific Islanders and multiple race/ethnicity from 2001 to 2004.
SOURCE: National Science Foundation/Division of Science Resources Statistics, Survey of Earned Doctorates.
NOTE: Categories are grouped differently from questionnaire and summary reports in that linguistics, history of science, American studies, and archaeology are included in social science and not in humanities, and public administration is included in social science and not in professional fields.
50
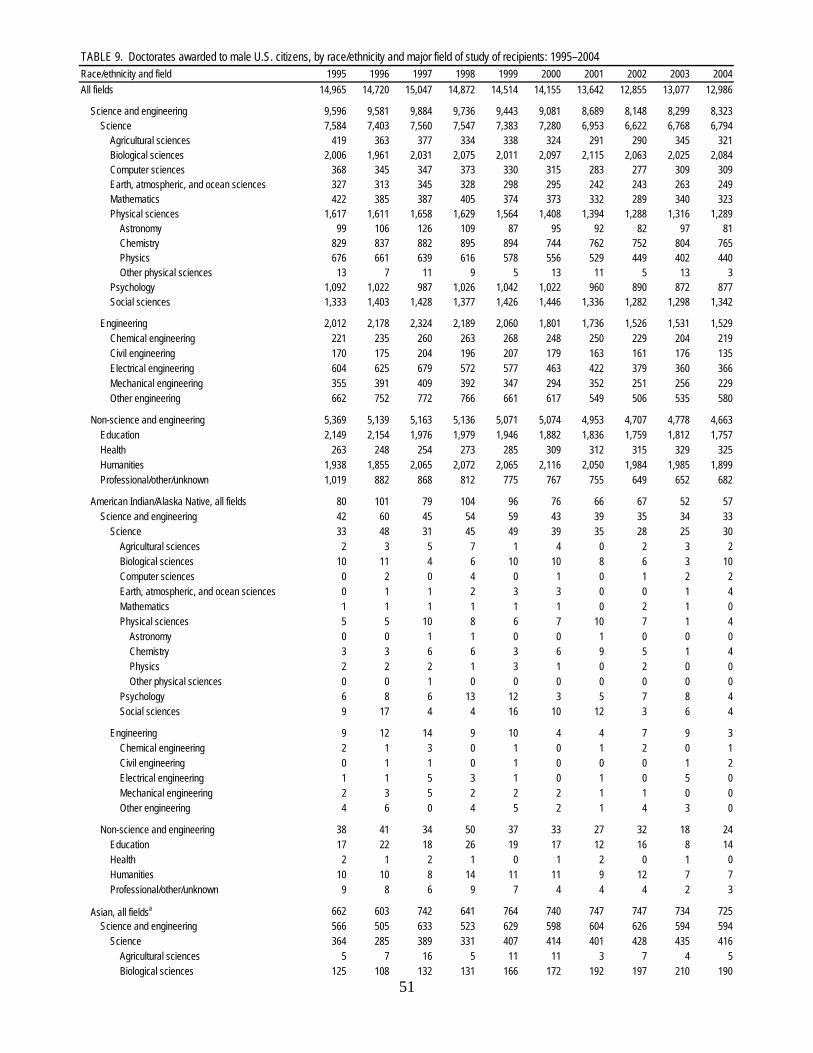
TABLE 9. Doctorates awarded to male U.S. citizens, by race/ethnicity and major field of study of recipients: 1995–2004Race/ethnicity and field 1995 1996 1997 1998 1999 2000 2001 2002 2003 2004All fields 14,965 14,720 15,047 14,872 14,514 14,155 13,642 12,855 13,077 12,986
Science and engineering 9,596 9,581 9,884 9,736 9,443 9,081 8,689 8,148 8,299 8,323 Science 7,584 7,403 7,560 7,547 7,383 7,280 6,953 6,622 6,768 6,794 Agricultural sciences 419 363 377 334 338 324 291 290 345 321 Biological sciences 2,006 1,961 2,031 2,075 2,011 2,097 2,115 2,063 2,025 2,084 Computer sciences 368 345 347 373 330 315 283 277 309 309 Earth, atmospheric, and ocean sciences 327 313 345 328 298 295 242 243 263 249 Mathematics 422 385 387 405 374 373 332 289 340 323 Physical sciences 1,617 1,611 1,658 1,629 1,564 1,408 1,394 1,288 1,316 1,289 Astronomy 99 106 126 109 87 95 92 82 97 81 Chemistry 829 837 882 895 894 744 762 752 804 765 Physics 676 661 639 616 578 556 529 449 402 440 Other physical sciences 13 7 11 9 5 13 11 5 13 3 Psychology 1,092 1,022 987 1,026 1,042 1,022 960 890 872 877 Social sciences 1,333 1,403 1,428 1,377 1,426 1,446 1,336 1,282 1,298 1,342
Engineering 2,012 2,178 2,324 2,189 2,060 1,801 1,736 1,526 1,531 1,529 Chemical engineering 221 235 260 263 268 248 250 229 204 219 Civil engineering 170 175 204 196 207 179 163 161 176 135 Electrical engineering 604 625 679 572 577 463 422 379 360 366 Mechanical engineering 355 391 409 392 347 294 352 251 256 229 Other engineering 662 752 772 766 661 617 549 506 535 580
Non-science and engineering 5,369 5,139 5,163 5,136 5,071 5,074 4,953 4,707 4,778 4,663 Education 2,149 2,154 1,976 1,979 1,946 1,882 1,836 1,759 1,812 1,757 Health 263 248 254 273 285 309 312 315 329 325 Humanities 1,938 1,855 2,065 2,072 2,065 2,116 2,050 1,984 1,985 1,899 Professional/other/unknown 1,019 882 868 812 775 767 755 649 652 682
American Indian/Alaska Native, all fields 80 101 79 104 96 76 66 67 52 57 Science and engineering 42 60 45 54 59 43 39 35 34 33 Science 33 48 31 45 49 39 35 28 25 30 Agricultural sciences 2 3 5 7 1 4 0 2 3 2 Biological sciences 10 11 4 6 10 10 8 6 3 10 Computer sciences 0 2 0 4 0 1 0 1 2 2 Earth, atmospheric, and ocean sciences 0 1 1 2 3 3 0 0 1 4 Mathematics 1 1 1 1 1 1 0 2 1 0 Physical sciences 5 5 10 8 6 7 10 7 1 4 Astronomy 0 0 1 1 0 0 1 0 0 0 Chemistry 3 3 6 6 3 6 9 5 1 4 Physics 2 2 2 1 3 1 0 2 0 0 Other physical sciences 0 0 1 0 0 0 0 0 0 0 Psychology 6 8 6 13 12 3 5 7 8 4 Social sciences 9 17 4 4 16 10 12 3 6 4
Engineering 9 12 14 9 10 4 4 7 9 3 Chemical engineering 2 1 3 0 1 0 1 2 0 1 Civil engineering 0 1 1 0 1 0 0 0 1 2 Electrical engineering 1 1 5 3 1 0 1 0 5 0 Mechanical engineering 2 3 5 2 2 2 1 1 0 0 Other engineering 4 6 0 4 5 2 1 4 3 0
Non-science and engineering 38 41 34 50 37 33 27 32 18 24 Education 17 22 18 26 19 17 12 16 8 14 Health 2 1 2 1 0 1 2 0 1 0 Humanities 10 10 8 14 11 11 9 12 7 7 Professional/other/unknown 9 8 6 9 7 4 4 4 2 3
Asian, all fieldsa 662 603 742 641 764 740 747 747 734 725 Science and engineering 566 505 633 523 629 598 604 626 594 594 Science 364 285 389 331 407 414 401 428 435 416 Agricultural sciences 5 7 16 5 11 11 3 7 4 5 Biological sciences 125 108 132 131 166 172 192 197 210 190
51

TABLE 9. Doctorates awarded to male U.S. citizens, by race/ethnicity and major field of study of recipients: 1995–2004Race/ethnicity and field 1995 1996 1997 1998 1999 2000 2001 2002 2003 2004 Computer sciences 34 28 31 29 34 33 24 37 37 33 Earth, atmospheric, and ocean sciences 7 4 7 4 10 4 9 1 5 4 Mathematics 18 15 27 12 23 34 22 15 21 20 Physical sciences 98 72 106 84 82 64 79 88 69 88 Astronomy 3 3 6 5 2 6 6 9 5 4 Chemistry 51 32 51 49 53 22 35 48 39 56 Physics 44 37 49 30 27 36 38 31 25 28 Other physical sciences 0 0 0 0 0 0 0 0 0 0 Psychology 30 20 21 23 31 39 21 36 35 24 Social sciences 47 31 49 43 50 57 51 47 54 52
Engineering 202 220 244 192 222 184 203 198 159 178 Chemical engineering 16 17 14 27 23 29 24 37 28 33 Civil engineering 13 11 10 13 19 12 10 11 8 9 Electrical engineering 80 95 112 68 80 65 69 69 60 54 Mechanical engineering 33 36 42 29 37 30 43 24 19 32 Other engineering 60 61 66 55 63 48 57 57 44 50
Non-science and engineering 96 98 109 118 135 142 143 121 140 131 Education 27 29 25 36 41 42 29 32 31 27 Health 7 16 15 14 16 18 23 10 29 21 Humanities 28 26 41 37 41 44 51 54 47 57 Professional/other/unknown 34 27 28 31 37 38 40 25 33 26
Black/African American, all fields 487 531 528 524 609 560 591 612 598 644 Science and engineering 216 251 261 238 294 270 273 279 254 284 Science 176 211 200 186 232 220 216 229 201 232 Agricultural sciences 6 15 10 8 12 4 4 4 11 7 Biological sciences 51 46 44 34 47 40 43 51 38 52 Computer sciences 5 9 3 4 8 8 3 10 12 10 Earth, atmospheric, and ocean sciences 0 0 2 4 4 2 3 4 5 5 Mathematics 3 6 4 5 4 7 10 5 10 6 Physical sciences 19 33 35 25 30 34 27 35 31 27 Astronomy 1 0 1 1 0 0 1 0 1 0 Chemistry 11 24 23 17 27 20 18 19 23 21 Physics 7 9 11 7 3 14 8 16 7 6 Other physical sciences 0 0 0 0 0 0 0 0 0 0 Psychology 37 38 37 38 36 42 48 39 39 48 Social sciences 55 64 65 68 91 83 78 81 55 77
Engineering 40 40 61 52 62 50 57 50 53 52 Chemical engineering 1 5 6 2 5 3 6 5 6 2 Civil engineering 4 5 9 5 3 4 7 6 4 2 Electrical engineering 16 12 24 18 21 17 19 11 17 22 Mechanical engineering 7 6 9 12 9 12 16 12 8 13 Other engineering 12 12 13 15 24 14 9 16 18 13
Non-science and engineering 271 280 267 286 315 290 318 333 344 360 Education 176 184 155 176 185 175 196 200 224 224 Health 14 10 12 11 8 11 9 12 15 23 Humanities 43 47 55 62 61 61 61 67 54 62 Professional/other/unknown 38 39 45 37 61 43 52 54 51 51
Hispanic, all fieldsb 463 480 543 610 510 546 498 540 592 543 Science and engineering 284 297 338 381 316 337 286 312 332 318 Science 233 224 277 294 267 278 231 248 260 262 Agricultural sciences 9 6 12 16 7 13 10 12 11 4 Biological sciences 68 58 74 79 86 73 77 62 89 77 Computer sciences 2 7 13 12 9 9 3 11 5 9 Earth, atmospheric, and ocean sciences 4 9 10 10 14 12 3 11 6 5 Mathematics 9 9 12 18 9 7 9 8 9 17
52

TABLE 9. Doctorates awarded to male U.S. citizens, by race/ethnicity and major field of study of recipients: 1995–2004Race/ethnicity and field 1995 1996 1997 1998 1999 2000 2001 2002 2003 2004 Physical sciences 42 42 46 39 35 50 41 37 42 35 Astronomy 1 1 2 2 1 1 6 2 2 4 Chemistry 24 26 26 25 21 29 24 19 23 20 Physics 17 15 18 12 13 19 11 16 17 11 Other physical sciences 0 0 0 0 0 1 0 0 0 0 Psychology 44 51 60 54 53 58 41 54 48 53 Social sciences 55 42 50 66 54 56 47 53 50 62
Engineering 51 73 61 87 49 59 55 64 72 56 Chemical engineering 10 10 4 10 2 10 1 9 11 6 Civil engineering 6 2 9 12 5 7 6 7 7 13 Electrical engineering 13 23 17 25 24 19 13 25 18 10 Mechanical engineering 5 11 10 18 7 9 17 5 11 7 Other engineering 17 27 21 22 11 14 18 18 25 20
Non-science and engineering 179 183 205 229 194 209 212 228 260 225 Education 82 83 85 109 89 97 88 98 115 95 Health 15 11 7 12 11 10 5 8 9 10 Humanities 60 65 90 83 75 82 86 101 114 92 Professional/other/unknown 22 24 23 25 19 20 33 21 22 28
Mexican American, all fields 148 159 155 211 153 196 189 172 202 211 Science and engineering 80 89 87 130 83 120 96 82 103 108 Science 67 66 76 105 76 97 83 72 92 91 Agricultural sciences 2 1 2 6 3 4 3 3 6 2 Biological sciences 16 16 20 29 23 25 30 21 32 28 Computer sciences 1 1 2 3 0 2 2 3 1 3 Earth, atmospheric, and ocean sciences 2 3 2 4 4 3 1 4 0 2 Mathematics 3 2 2 3 5 4 3 1 2 6 Physical sciences 9 17 12 18 10 19 13 10 15 11 Astronomy 0 1 0 1 0 0 3 0 1 1 Chemistry 6 12 7 12 5 14 4 4 10 6 Physics 3 4 5 5 5 5 6 6 4 4 Other physical sciences 0 0 0 0 0 0 0 0 0 0 Psychology 14 18 20 18 14 22 17 15 16 13 Social sciences 20 8 16 24 17 18 14 15 20 26
Engineering 13 23 11 25 7 23 13 10 11 17 Chemical engineering 2 3 2 1 0 3 0 1 2 2 Civil engineering 3 0 1 4 1 4 0 1 0 4 Electrical engineering 3 8 2 6 2 4 6 4 2 3 Mechanical engineering 1 4 2 3 1 6 4 1 2 0 Other engineering 4 8 4 11 3 6 3 3 5 8
Non-science and engineering 68 70 68 81 70 76 93 90 99 103 Education 40 37 41 45 35 45 50 49 56 55 Health 3 2 0 1 3 2 2 3 2 3 Humanities 21 21 21 30 27 22 28 32 34 37 Professional/other/unknown 4 10 6 5 5 7 13 6 7 8
Puerto Rican, all fields 120 114 153 128 141 128 122 149 126 107 Science and engineering 74 74 98 69 88 77 68 92 75 65 Science 63 57 79 53 73 61 59 77 58 48 Agricultural sciences 3 3 3 2 0 3 2 6 0 0 Biological sciences 21 14 20 20 24 11 18 18 21 21 Computer sciences 0 4 6 1 5 4 1 4 2 2 Earth, atmospheric, and ocean sciences 1 3 4 2 4 5 1 3 4 2 Mathematics 0 3 3 4 2 1 2 3 1 1 Physical sciences 12 8 18 6 13 10 10 16 11 7 Astronomy 0 0 0 1 0 0 0 1 0 0 Chemistry 9 6 11 4 9 9 8 7 9 6
53
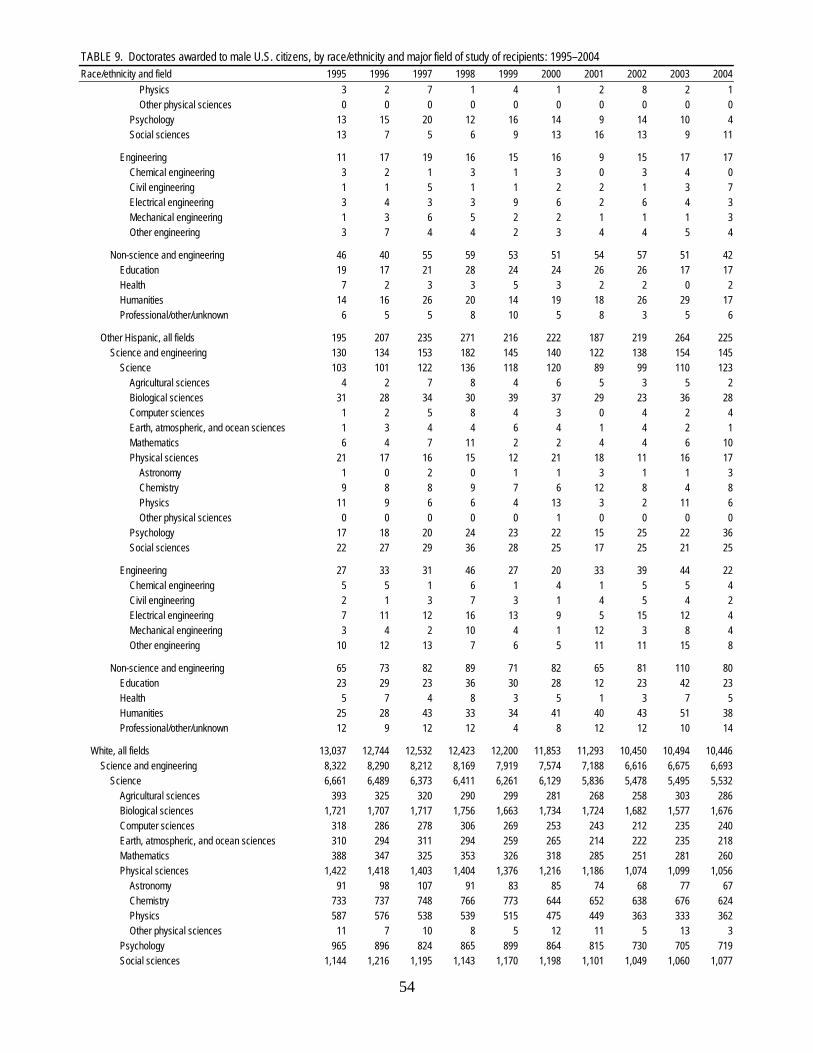
TABLE 9. Doctorates awarded to male U.S. citizens, by race/ethnicity and major field of study of recipients: 1995–2004Race/ethnicity and field 1995 1996 1997 1998 1999 2000 2001 2002 2003 2004 Physics 3 2 7 1 4 1 2 8 2 1 Other physical sciences 0 0 0 0 0 0 0 0 0 0 Psychology 13 15 20 12 16 14 9 14 10 4 Social sciences 13 7 5 6 9 13 16 13 9 11
Engineering 11 17 19 16 15 16 9 15 17 17 Chemical engineering 3 2 1 3 1 3 0 3 4 0 Civil engineering 1 1 5 1 1 2 2 1 3 7 Electrical engineering 3 4 3 3 9 6 2 6 4 3 Mechanical engineering 1 3 6 5 2 2 1 1 1 3 Other engineering 3 7 4 4 2 3 4 4 5 4
Non-science and engineering 46 40 55 59 53 51 54 57 51 42 Education 19 17 21 28 24 24 26 26 17 17 Health 7 2 3 3 5 3 2 2 0 2 Humanities 14 16 26 20 14 19 18 26 29 17 Professional/other/unknown 6 5 5 8 10 5 8 3 5 6
Other Hispanic, all fields 195 207 235 271 216 222 187 219 264 225 Science and engineering 130 134 153 182 145 140 122 138 154 145 Science 103 101 122 136 118 120 89 99 110 123 Agricultural sciences 4 2 7 8 4 6 5 3 5 2 Biological sciences 31 28 34 30 39 37 29 23 36 28 Computer sciences 1 2 5 8 4 3 0 4 2 4 Earth, atmospheric, and ocean sciences 1 3 4 4 6 4 1 4 2 1 Mathematics 6 4 7 11 2 2 4 4 6 10 Physical sciences 21 17 16 15 12 21 18 11 16 17 Astronomy 1 0 2 0 1 1 3 1 1 3 Chemistry 9 8 8 9 7 6 12 8 4 8 Physics 11 9 6 6 4 13 3 2 11 6 Other physical sciences 0 0 0 0 0 1 0 0 0 0 Psychology 17 18 20 24 23 22 15 25 22 36 Social sciences 22 27 29 36 28 25 17 25 21 25
Engineering 27 33 31 46 27 20 33 39 44 22 Chemical engineering 5 5 1 6 1 4 1 5 5 4 Civil engineering 2 1 3 7 3 1 4 5 4 2 Electrical engineering 7 11 12 16 13 9 5 15 12 4 Mechanical engineering 3 4 2 10 4 1 12 3 8 4 Other engineering 10 12 13 7 6 5 11 11 15 8
Non-science and engineering 65 73 82 89 71 82 65 81 110 80 Education 23 29 23 36 30 28 12 23 42 23 Health 5 7 4 8 3 5 1 3 7 5 Humanities 25 28 43 33 34 41 40 43 51 38 Professional/other/unknown 12 9 12 12 4 8 12 12 10 14
White, all fields 13,037 12,744 12,532 12,423 12,200 11,853 11,293 10,450 10,494 10,446 Science and engineering 8,322 8,290 8,212 8,169 7,919 7,574 7,188 6,616 6,675 6,693 Science 6,661 6,489 6,373 6,411 6,261 6,129 5,836 5,478 5,495 5,532 Agricultural sciences 393 325 320 290 299 281 268 258 303 286 Biological sciences 1,721 1,707 1,717 1,756 1,663 1,734 1,724 1,682 1,577 1,676 Computer sciences 318 286 278 306 269 253 243 212 235 240 Earth, atmospheric, and ocean sciences 310 294 311 294 259 265 214 222 235 218 Mathematics 388 347 325 353 326 318 285 251 281 260 Physical sciences 1,422 1,418 1,403 1,404 1,376 1,216 1,186 1,074 1,099 1,056 Astronomy 91 98 107 91 83 85 74 68 77 67 Chemistry 733 737 748 766 773 644 652 638 676 624 Physics 587 576 538 539 515 475 449 363 333 362 Other physical sciences 11 7 10 8 5 12 11 5 13 3 Psychology 965 896 824 865 899 864 815 730 705 719 Social sciences 1,144 1,216 1,195 1,143 1,170 1,198 1,101 1,049 1,060 1,077
54

TABLE 9. Doctorates awarded to male U.S. citizens, by race/ethnicity and major field of study of recipients: 1995–2004Race/ethnicity and field 1995 1996 1997 1998 1999 2000 2001 2002 2003 2004 Engineering 1,661 1,801 1,839 1,758 1,658 1,445 1,352 1,138 1,180 1,161 Chemical engineering 186 198 221 212 233 202 207 166 153 165 Civil engineering 145 155 168 156 175 149 128 132 148 106 Electrical engineering 480 483 483 443 433 346 307 253 244 256 Mechanical engineering 296 332 329 316 279 231 266 194 206 165 Other engineering 554 633 638 631 538 517 444 393 429 469
Non-science and engineering 4,715 4,454 4,320 4,254 4,281 4,279 4,105 3,834 3,819 3,753 Education 1,830 1,803 1,601 1,568 1,578 1,518 1,473 1,354 1,364 1,351 Health 221 207 214 223 245 262 266 276 258 256 Humanities 1,758 1,675 1,776 1,784 1,826 1,849 1,763 1,675 1,676 1,610 Professional/other/unknown 906 769 729 679 632 650 603 529 521 536
Other/unknown, all fieldsc 236 261 623 570 335 380 447 439 607 571 Science and engineering 166 178 395 371 226 259 299 280 410 401 Science 117 146 290 280 167 200 234 211 352 322 Agricultural sciences 4 7 14 8 8 11 6 7 13 17 Biological sciences 31 31 60 69 39 68 71 65 108 79 Computer sciences 9 13 22 18 10 11 10 6 18 15 Earth, atmospheric, and ocean sciences 6 5 14 14 8 9 13 5 11 13 Mathematics 3 7 18 16 11 6 6 8 18 20 Physical sciences 31 41 58 69 35 37 51 47 74 79 Astronomy 3 4 9 9 1 3 4 3 12 6 Chemistry 7 15 28 32 17 23 24 23 42 40 Physics 19 22 21 27 17 11 23 21 20 33 Other physical sciences 2 0 0 1 0 0 0 0 0 0 Psychology 10 9 39 33 11 16 30 24 37 29 Social sciences 23 33 65 53 45 42 47 49 73 70
Engineering 49 32 105 91 59 59 65 69 58 79 Chemical engineering 6 4 12 12 4 4 11 10 6 12 Civil engineering 2 1 7 10 4 7 12 5 8 3 Electrical engineering 14 11 38 15 18 16 13 21 16 24 Mechanical engineering 12 3 14 15 13 10 9 15 12 12 Other engineering 15 13 34 39 20 22 20 18 16 28
Non-science and engineering 70 83 228 199 109 121 148 159 197 170 Education 17 33 92 64 34 33 38 59 70 46 Health 4 3 4 12 5 7 7 9 17 15 Humanities 39 32 95 92 51 69 80 75 87 71 Professional/other/unknown 10 15 37 31 19 12 23 16 23 38
a Includes Pacific Islanders from 1995 to 2000.b Includes Mexican American, Puerto Rican, and other Hispanic.c Includes Native Hawaiian and other Pacific Islanders and multiple race/ethnicity from 2001 to 2004.
SOURCE: National Science Foundation/Division of Science Resources Statistics, Survey of Earned Doctorates.
NOTE: Categories are grouped differently from questionnaire and summary reports in that linguistics, history of science, American studies, and archaeology are included in social science and not in humanities, and public administration is included in social science and not in professional fields.
55
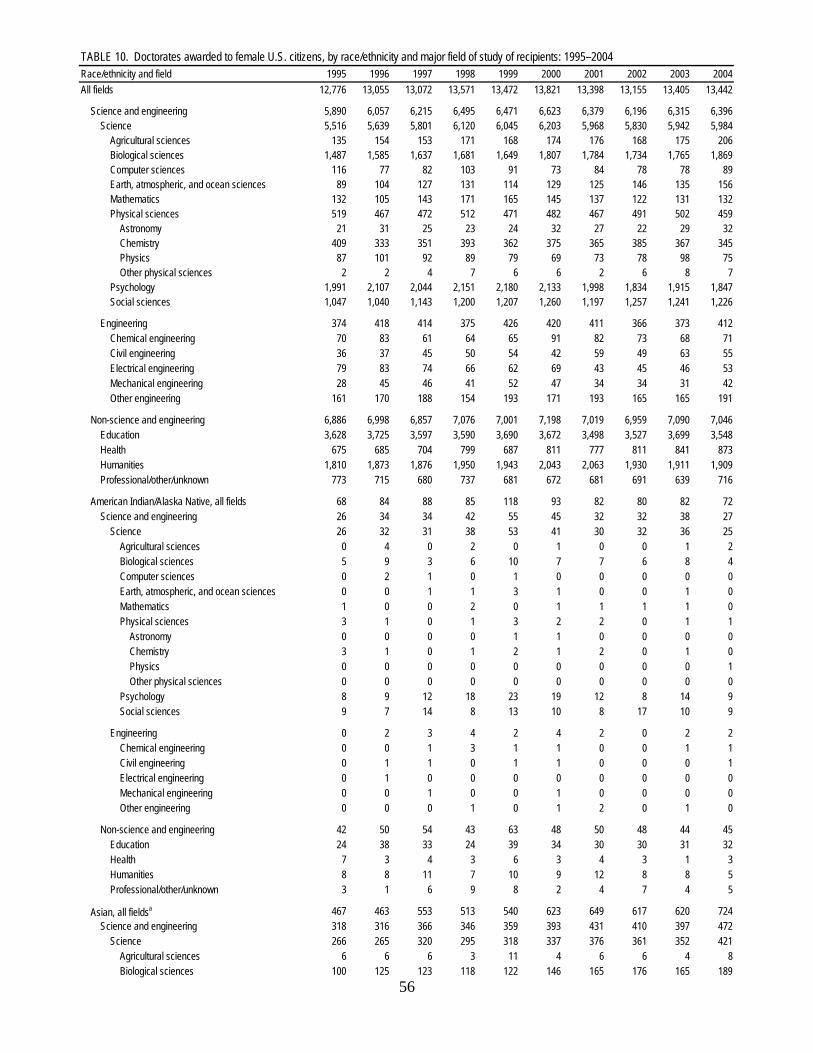
TABLE 10. Doctorates awarded to female U.S. citizens, by race/ethnicity and major field of study of recipients: 1995–2004Race/ethnicity and field 1995 1996 1997 1998 1999 2000 2001 2002 2003 2004All fields 12,776 13,055 13,072 13,571 13,472 13,821 13,398 13,155 13,405 13,442
Science and engineering 5,890 6,057 6,215 6,495 6,471 6,623 6,379 6,196 6,315 6,396 Science 5,516 5,639 5,801 6,120 6,045 6,203 5,968 5,830 5,942 5,984 Agricultural sciences 135 154 153 171 168 174 176 168 175 206 Biological sciences 1,487 1,585 1,637 1,681 1,649 1,807 1,784 1,734 1,765 1,869 Computer sciences 116 77 82 103 91 73 84 78 78 89 Earth, atmospheric, and ocean sciences 89 104 127 131 114 129 125 146 135 156 Mathematics 132 105 143 171 165 145 137 122 131 132 Physical sciences 519 467 472 512 471 482 467 491 502 459 Astronomy 21 31 25 23 24 32 27 22 29 32 Chemistry 409 333 351 393 362 375 365 385 367 345 Physics 87 101 92 89 79 69 73 78 98 75 Other physical sciences 2 2 4 7 6 6 2 6 8 7 Psychology 1,991 2,107 2,044 2,151 2,180 2,133 1,998 1,834 1,915 1,847 Social sciences 1,047 1,040 1,143 1,200 1,207 1,260 1,197 1,257 1,241 1,226
Engineering 374 418 414 375 426 420 411 366 373 412 Chemical engineering 70 83 61 64 65 91 82 73 68 71 Civil engineering 36 37 45 50 54 42 59 49 63 55 Electrical engineering 79 83 74 66 62 69 43 45 46 53 Mechanical engineering 28 45 46 41 52 47 34 34 31 42 Other engineering 161 170 188 154 193 171 193 165 165 191
Non-science and engineering 6,886 6,998 6,857 7,076 7,001 7,198 7,019 6,959 7,090 7,046 Education 3,628 3,725 3,597 3,590 3,690 3,672 3,498 3,527 3,699 3,548 Health 675 685 704 799 687 811 777 811 841 873 Humanities 1,810 1,873 1,876 1,950 1,943 2,043 2,063 1,930 1,911 1,909 Professional/other/unknown 773 715 680 737 681 672 681 691 639 716
American Indian/Alaska Native, all fields 68 84 88 85 118 93 82 80 82 72 Science and engineering 26 34 34 42 55 45 32 32 38 27 Science 26 32 31 38 53 41 30 32 36 25 Agricultural sciences 0 4 0 2 0 1 0 0 1 2 Biological sciences 5 9 3 6 10 7 7 6 8 4 Computer sciences 0 2 1 0 1 0 0 0 0 0 Earth, atmospheric, and ocean sciences 0 0 1 1 3 1 0 0 1 0 Mathematics 1 0 0 2 0 1 1 1 1 0 Physical sciences 3 1 0 1 3 2 2 0 1 1 Astronomy 0 0 0 0 1 1 0 0 0 0 Chemistry 3 1 0 1 2 1 2 0 1 0 Physics 0 0 0 0 0 0 0 0 0 1 Other physical sciences 0 0 0 0 0 0 0 0 0 0 Psychology 8 9 12 18 23 19 12 8 14 9 Social sciences 9 7 14 8 13 10 8 17 10 9
Engineering 0 2 3 4 2 4 2 0 2 2 Chemical engineering 0 0 1 3 1 1 0 0 1 1 Civil engineering 0 1 1 0 1 1 0 0 0 1 Electrical engineering 0 1 0 0 0 0 0 0 0 0 Mechanical engineering 0 0 1 0 0 1 0 0 0 0 Other engineering 0 0 0 1 0 1 2 0 1 0
Non-science and engineering 42 50 54 43 63 48 50 48 44 45 Education 24 38 33 24 39 34 30 30 31 32 Health 7 3 4 3 6 3 4 3 1 3 Humanities 8 8 11 7 10 9 12 8 8 5 Professional/other/unknown 3 1 6 9 8 2 4 7 4 5
Asian, all fieldsa 467 463 553 513 540 623 649 617 620 724 Science and engineering 318 316 366 346 359 393 431 410 397 472 Science 266 265 320 295 318 337 376 361 352 421 Agricultural sciences 6 6 6 3 11 4 6 6 4 8 Biological sciences 100 125 123 118 122 146 165 176 165 189
56
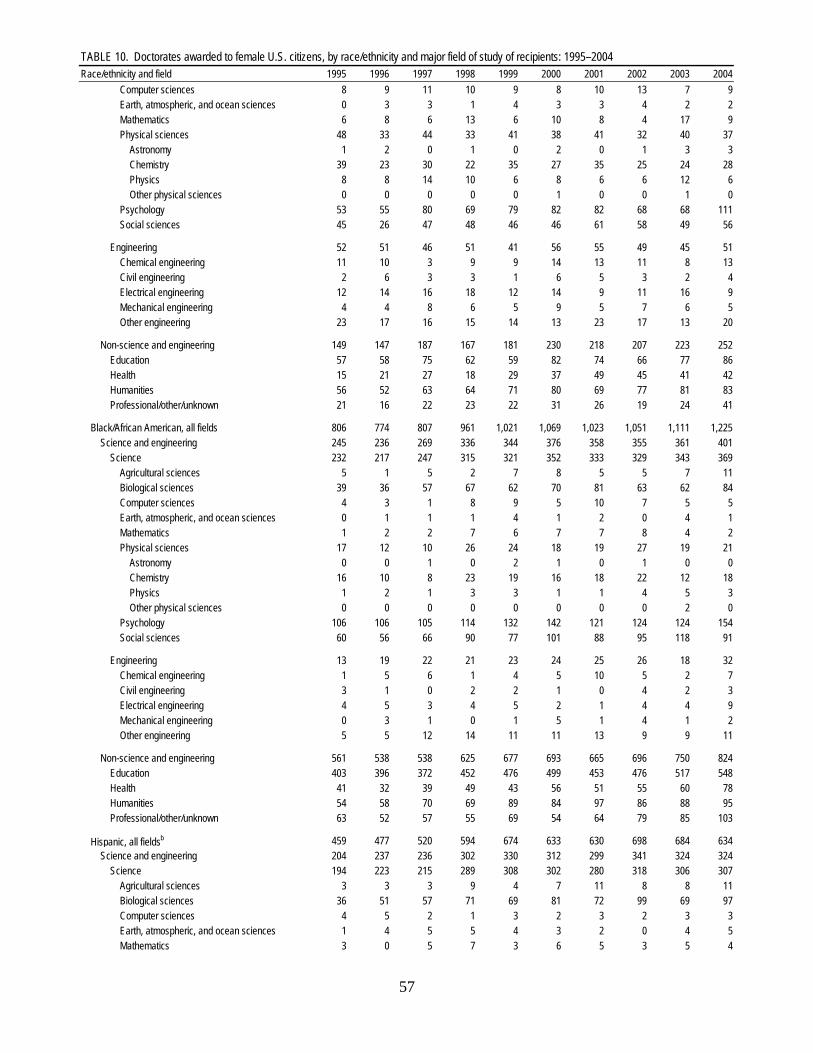
TABLE 10. Doctorates awarded to female U.S. citizens, by race/ethnicity and major field of study of recipients: 1995–2004Race/ethnicity and field 1995 1996 1997 1998 1999 2000 2001 2002 2003 2004 Computer sciences 8 9 11 10 9 8 10 13 7 9 Earth, atmospheric, and ocean sciences 0 3 3 1 4 3 3 4 2 2 Mathematics 6 8 6 13 6 10 8 4 17 9 Physical sciences 48 33 44 33 41 38 41 32 40 37 Astronomy 1 2 0 1 0 2 0 1 3 3 Chemistry 39 23 30 22 35 27 35 25 24 28 Physics 8 8 14 10 6 8 6 6 12 6 Other physical sciences 0 0 0 0 0 1 0 0 1 0 Psychology 53 55 80 69 79 82 82 68 68 111 Social sciences 45 26 47 48 46 46 61 58 49 56
Engineering 52 51 46 51 41 56 55 49 45 51 Chemical engineering 11 10 3 9 9 14 13 11 8 13 Civil engineering 2 6 3 3 1 6 5 3 2 4 Electrical engineering 12 14 16 18 12 14 9 11 16 9 Mechanical engineering 4 4 8 6 5 9 5 7 6 5 Other engineering 23 17 16 15 14 13 23 17 13 20
Non-science and engineering 149 147 187 167 181 230 218 207 223 252 Education 57 58 75 62 59 82 74 66 77 86 Health 15 21 27 18 29 37 49 45 41 42 Humanities 56 52 63 64 71 80 69 77 81 83 Professional/other/unknown 21 16 22 23 22 31 26 19 24 41
Black/African American, all fields 806 774 807 961 1,021 1,069 1,023 1,051 1,111 1,225 Science and engineering 245 236 269 336 344 376 358 355 361 401 Science 232 217 247 315 321 352 333 329 343 369 Agricultural sciences 5 1 5 2 7 8 5 5 7 11 Biological sciences 39 36 57 67 62 70 81 63 62 84 Computer sciences 4 3 1 8 9 5 10 7 5 5 Earth, atmospheric, and ocean sciences 0 1 1 1 4 1 2 0 4 1 Mathematics 1 2 2 7 6 7 7 8 4 2 Physical sciences 17 12 10 26 24 18 19 27 19 21 Astronomy 0 0 1 0 2 1 0 1 0 0 Chemistry 16 10 8 23 19 16 18 22 12 18 Physics 1 2 1 3 3 1 1 4 5 3 Other physical sciences 0 0 0 0 0 0 0 0 2 0 Psychology 106 106 105 114 132 142 121 124 124 154 Social sciences 60 56 66 90 77 101 88 95 118 91
Engineering 13 19 22 21 23 24 25 26 18 32 Chemical engineering 1 5 6 1 4 5 10 5 2 7 Civil engineering 3 1 0 2 2 1 0 4 2 3 Electrical engineering 4 5 3 4 5 2 1 4 4 9 Mechanical engineering 0 3 1 0 1 5 1 4 1 2 Other engineering 5 5 12 14 11 11 13 9 9 11
Non-science and engineering 561 538 538 625 677 693 665 696 750 824 Education 403 396 372 452 476 499 453 476 517 548 Health 41 32 39 49 43 56 51 55 60 78 Humanities 54 58 70 69 89 84 97 86 88 95 Professional/other/unknown 63 52 57 55 69 54 64 79 85 103
Hispanic, all fieldsb 459 477 520 594 674 633 630 698 684 634 Science and engineering 204 237 236 302 330 312 299 341 324 324 Science 194 223 215 289 308 302 280 318 306 307 Agricultural sciences 3 3 3 9 4 7 11 8 8 11 Biological sciences 36 51 57 71 69 81 72 99 69 97 Computer sciences 4 5 2 1 3 2 3 2 3 3 Earth, atmospheric, and ocean sciences 1 4 5 5 4 3 2 0 4 5 Mathematics 3 0 5 7 3 6 5 3 5 4
57
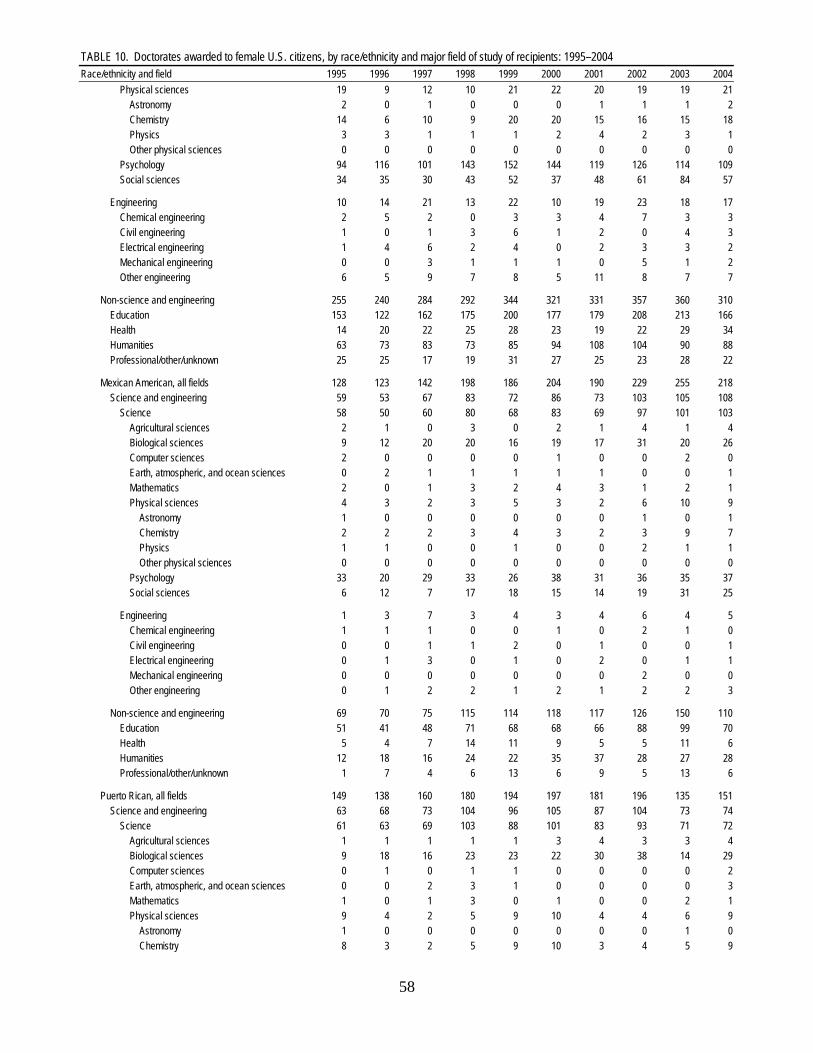
TABLE 10. Doctorates awarded to female U.S. citizens, by race/ethnicity and major field of study of recipients: 1995–2004Race/ethnicity and field 1995 1996 1997 1998 1999 2000 2001 2002 2003 2004 Physical sciences 19 9 12 10 21 22 20 19 19 21 Astronomy 2 0 1 0 0 0 1 1 1 2 Chemistry 14 6 10 9 20 20 15 16 15 18 Physics 3 3 1 1 1 2 4 2 3 1 Other physical sciences 0 0 0 0 0 0 0 0 0 0 Psychology 94 116 101 143 152 144 119 126 114 109 Social sciences 34 35 30 43 52 37 48 61 84 57
Engineering 10 14 21 13 22 10 19 23 18 17 Chemical engineering 2 5 2 0 3 3 4 7 3 3 Civil engineering 1 0 1 3 6 1 2 0 4 3 Electrical engineering 1 4 6 2 4 0 2 3 3 2 Mechanical engineering 0 0 3 1 1 1 0 5 1 2 Other engineering 6 5 9 7 8 5 11 8 7 7
Non-science and engineering 255 240 284 292 344 321 331 357 360 310 Education 153 122 162 175 200 177 179 208 213 166 Health 14 20 22 25 28 23 19 22 29 34 Humanities 63 73 83 73 85 94 108 104 90 88 Professional/other/unknown 25 25 17 19 31 27 25 23 28 22
Mexican American, all fields 128 123 142 198 186 204 190 229 255 218 Science and engineering 59 53 67 83 72 86 73 103 105 108 Science 58 50 60 80 68 83 69 97 101 103 Agricultural sciences 2 1 0 3 0 2 1 4 1 4 Biological sciences 9 12 20 20 16 19 17 31 20 26 Computer sciences 2 0 0 0 0 1 0 0 2 0 Earth, atmospheric, and ocean sciences 0 2 1 1 1 1 1 0 0 1 Mathematics 2 0 1 3 2 4 3 1 2 1 Physical sciences 4 3 2 3 5 3 2 6 10 9 Astronomy 1 0 0 0 0 0 0 1 0 1 Chemistry 2 2 2 3 4 3 2 3 9 7 Physics 1 1 0 0 1 0 0 2 1 1 Other physical sciences 0 0 0 0 0 0 0 0 0 0 Psychology 33 20 29 33 26 38 31 36 35 37 Social sciences 6 12 7 17 18 15 14 19 31 25
Engineering 1 3 7 3 4 3 4 6 4 5 Chemical engineering 1 1 1 0 0 1 0 2 1 0 Civil engineering 0 0 1 1 2 0 1 0 0 1 Electrical engineering 0 1 3 0 1 0 2 0 1 1 Mechanical engineering 0 0 0 0 0 0 0 2 0 0 Other engineering 0 1 2 2 1 2 1 2 2 3
Non-science and engineering 69 70 75 115 114 118 117 126 150 110 Education 51 41 48 71 68 68 66 88 99 70 Health 5 4 7 14 11 9 5 5 11 6 Humanities 12 18 16 24 22 35 37 28 27 28 Professional/other/unknown 1 7 4 6 13 6 9 5 13 6
Puerto Rican, all fields 149 138 160 180 194 197 181 196 135 151 Science and engineering 63 68 73 104 96 105 87 104 73 74 Science 61 63 69 103 88 101 83 93 71 72 Agricultural sciences 1 1 1 1 1 3 4 3 3 4 Biological sciences 9 18 16 23 23 22 30 38 14 29 Computer sciences 0 1 0 1 1 0 0 0 0 2 Earth, atmospheric, and ocean sciences 0 0 2 3 1 0 0 0 0 3 Mathematics 1 0 1 3 0 1 0 0 2 1 Physical sciences 9 4 2 5 9 10 4 4 6 9 Astronomy 1 0 0 0 0 0 0 0 1 0 Chemistry 8 3 2 5 9 10 3 4 5 9
58

TABLE 10. Doctorates awarded to female U.S. citizens, by race/ethnicity and major field of study of recipients: 1995–2004Race/ethnicity and field 1995 1996 1997 1998 1999 2000 2001 2002 2003 2004 Physics 0 1 0 0 0 0 1 0 0 0 Other physical sciences 0 0 0 0 0 0 0 0 0 0 Psychology 31 33 36 59 41 59 36 36 37 15 Social sciences 10 6 11 8 12 6 9 12 9 9
Engineering 2 5 4 1 8 4 4 11 2 2 Chemical engineering 1 2 0 0 1 2 2 5 0 1 Civil engineering 0 0 0 0 1 0 0 0 1 0 Electrical engineering 0 0 1 0 2 0 0 1 0 1 Mechanical engineering 0 0 0 0 0 0 0 2 1 0 Other engineering 1 3 3 1 4 2 2 3 0 0
Non-science and engineering 86 70 87 76 98 92 94 92 62 77 Education 50 35 51 49 66 51 62 53 35 39 Health 5 5 7 4 6 6 3 7 4 14 Humanities 16 22 23 17 17 25 23 25 13 18 Professional/other/unknown 15 8 6 6 9 10 6 7 10 6
Other Hispanic, all fields 182 216 218 216 294 232 259 273 294 265 Science and engineering 82 116 96 115 162 121 139 134 146 142 Science 75 110 86 106 152 118 128 128 134 132 Agricultural sciences 0 1 2 5 3 2 6 1 4 3 Biological sciences 18 21 21 28 30 40 25 30 35 42 Computer sciences 2 4 2 0 2 1 3 2 1 1 Earth, atmospheric, and ocean sciences 1 2 2 1 2 2 1 0 4 1 Mathematics 0 0 3 1 1 1 2 2 1 2 Physical sciences 6 2 8 2 7 9 14 9 3 3 Astronomy 0 0 1 0 0 0 1 0 0 1 Chemistry 4 1 6 1 7 7 10 9 1 2 Physics 2 1 1 1 0 2 3 0 2 0 Other physical sciences 0 0 0 0 0 0 0 0 0 0 Psychology 30 63 36 51 85 47 52 54 42 57 Social sciences 18 17 12 18 22 16 25 30 44 23
Engineering 7 6 10 9 10 3 11 6 12 10 Chemical engineering 0 2 1 0 2 0 2 0 2 2 Civil engineering 1 0 0 2 3 1 1 0 3 2 Electrical engineering 1 3 2 2 1 0 0 2 2 0 Mechanical engineering 0 0 3 1 1 1 0 1 0 2 Other engineering 5 1 4 4 3 1 8 3 5 4
Non-science and engineering 100 100 122 101 132 111 120 139 148 123 Education 52 46 63 55 66 58 51 67 79 57 Health 4 11 8 7 11 8 11 10 14 14 Humanities 35 33 44 32 46 34 48 51 50 42 Professional/other/unknown 9 10 7 7 9 11 10 11 5 10
White, all fields 10,854 11,103 10,647 11,031 10,893 11,116 10,643 10,316 10,381 10,299 Science and engineering 5,038 5,159 5,080 5,279 5,275 5,347 5,069 4,873 4,936 4,926 Science 4,741 4,834 4,768 5,000 4,943 5,028 4,772 4,617 4,659 4,630 Agricultural sciences 118 138 131 149 143 152 149 147 149 166 Biological sciences 1,299 1,343 1,352 1,383 1,354 1,462 1,415 1,345 1,399 1,424 Computer sciences 98 56 63 77 67 57 57 54 59 69 Earth, atmospheric, and ocean sciences 87 95 110 120 96 115 116 131 117 136 Mathematics 119 93 124 138 148 119 111 101 99 115 Physical sciences 425 405 391 431 374 395 371 404 398 364 Astronomy 18 29 22 22 21 26 25 18 23 25 Chemistry 332 290 292 329 281 308 284 315 297 270 Physics 73 84 73 73 67 56 60 65 74 62 Other physical sciences 2 2 4 7 5 5 2 6 4 7 Psychology 1,709 1,805 1,657 1,729 1,768 1,706 1,601 1,459 1,519 1,391 Social sciences 886 899 940 973 993 1,022 952 976 919 965
59

TABLE 10. Doctorates awarded to female U.S. citizens, by race/ethnicity and major field of study of recipients: 1995–2004Race/ethnicity and field 1995 1996 1997 1998 1999 2000 2001 2002 2003 2004 Engineering 297 325 312 279 332 319 297 256 277 296 Chemical engineering 56 63 48 50 46 66 55 48 50 45 Civil engineering 30 29 38 41 44 32 48 38 55 43 Electrical engineering 60 59 46 42 39 51 30 27 20 32 Mechanical engineering 24 37 32 32 44 31 26 18 22 31 Other engineering 127 137 148 114 159 139 138 125 130 145
Non-science and engineering 5,816 5,944 5,567 5,752 5,618 5,769 5,574 5,443 5,445 5,373 Education 2,966 3,076 2,813 2,781 2,860 2,811 2,687 2,647 2,737 2,611 Health 585 598 599 683 571 679 633 670 680 687 Humanities 1,609 1,654 1,590 1,675 1,641 1,732 1,709 1,588 1,553 1,554 Professional/other/unknown 656 616 565 613 546 547 545 538 475 521
Other/unknown, all fieldsc 122 154 457 387 226 287 371 393 527 488 Science and engineering 59 75 230 190 108 150 190 185 259 246 Science 57 68 220 183 102 143 177 173 246 232 Agricultural sciences 3 2 8 6 3 2 5 2 6 8 Biological sciences 8 21 45 36 32 41 44 45 62 71 Computer sciences 2 2 4 7 2 1 4 2 4 3 Earth, atmospheric, and ocean sciences 1 1 7 3 3 6 2 11 7 12 Mathematics 2 2 6 4 2 2 5 5 5 2 Physical sciences 7 7 15 11 8 7 14 9 25 15 Astronomy 0 0 1 0 0 2 1 1 2 2 Chemistry 5 3 11 9 5 3 11 7 18 11 Physics 2 4 3 2 2 2 2 1 4 2 Other physical sciences 0 0 0 0 1 0 0 0 1 0 Psychology 21 16 89 78 26 40 63 49 76 73 Social sciences 13 17 46 38 26 44 40 50 61 48
Engineering 2 7 10 7 6 7 13 12 13 14 Chemical engineering 0 0 1 1 2 2 0 2 4 2 Civil engineering 0 0 2 1 0 1 4 4 0 1 Electrical engineering 2 0 3 0 2 2 1 0 3 1 Mechanical engineering 0 1 1 2 1 0 2 0 1 2 Other engineering 0 6 3 3 1 2 6 6 5 8
Non-science and engineering 63 79 227 197 118 137 181 208 268 242 Education 25 35 142 96 56 69 75 100 124 105 Health 13 11 13 21 10 13 21 16 30 29 Humanities 20 28 59 62 47 44 68 67 91 84 Professional/other/unknown 5 5 13 18 5 11 17 25 23 24
a Includes Pacific Islanders from 1995 to 2000.b Includes Mexican American, Puerto Rican, and other Hispanic.c Includes Native Hawaiian and other Pacific Islanders and multiple race/ethnicity from 2001 to 2004.
SOURCE: National Science Foundation/Division of Science Resources Statistics, Survey of Earned Doctorates.
NOTE: Categories are grouped differently from questionnaire and summary reports in that linguistics, history of science, American studies, and archaeology are included in social science and not in humanities, and public administration is included in social science and not in professional fields.
60
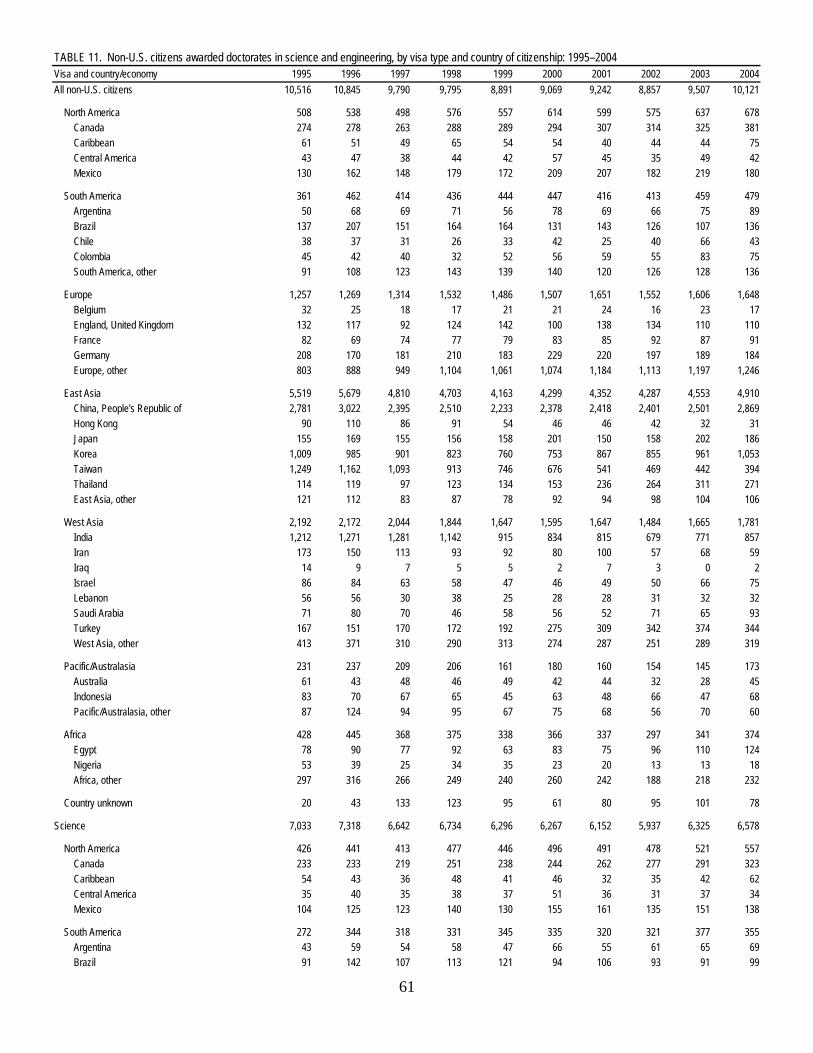
TABLE 11. Non-U.S. citizens awarded doctorates in science and engineering, by visa type and country of citizenship: 1995–2004Visa and country/economy 1995 1996 1997 1998 1999 2000 2001 2002 2003 2004All non-U.S. citizens 10,516 10,845 9,790 9,795 8,891 9,069 9,242 8,857 9,507 10,121 North America 508 538 498 576 557 614 599 575 637 678 Canada 274 278 263 288 289 294 307 314 325 381 Caribbean 61 51 49 65 54 54 40 44 44 75 Central America 43 47 38 44 42 57 45 35 49 42 Mexico 130 162 148 179 172 209 207 182 219 180 South America 361 462 414 436 444 447 416 413 459 479 Argentina 50 68 69 71 56 78 69 66 75 89 Brazil 137 207 151 164 164 131 143 126 107 136 Chile 38 37 31 26 33 42 25 40 66 43 Colombia 45 42 40 32 52 56 59 55 83 75 South America, other 91 108 123 143 139 140 120 126 128 136 Europe 1,257 1,269 1,314 1,532 1,486 1,507 1,651 1,552 1,606 1,648 Belgium 32 25 18 17 21 21 24 16 23 17 England, United Kingdom 132 117 92 124 142 100 138 134 110 110 France 82 69 74 77 79 83 85 92 87 91 Germany 208 170 181 210 183 229 220 197 189 184 Europe, other 803 888 949 1,104 1,061 1,074 1,184 1,113 1,197 1,246 East Asia 5,519 5,679 4,810 4,703 4,163 4,299 4,352 4,287 4,553 4,910 China, People's Republic of 2,781 3,022 2,395 2,510 2,233 2,378 2,418 2,401 2,501 2,869 Hong Kong 90 110 86 91 54 46 46 42 32 31 Japan 155 169 155 156 158 201 150 158 202 186 Korea 1,009 985 901 823 760 753 867 855 961 1,053 Taiwan 1,249 1,162 1,093 913 746 676 541 469 442 394 Thailand 114 119 97 123 134 153 236 264 311 271 East Asia, other 121 112 83 87 78 92 94 98 104 106 West Asia 2,192 2,172 2,044 1,844 1,647 1,595 1,647 1,484 1,665 1,781 India 1,212 1,271 1,281 1,142 915 834 815 679 771 857 Iran 173 150 113 93 92 80 100 57 68 59 Iraq 14 9 7 5 5 2 7 3 0 2 Israel 86 84 63 58 47 46 49 50 66 75 Lebanon 56 56 30 38 25 28 28 31 32 32 Saudi Arabia 71 80 70 46 58 56 52 71 65 93 Turkey 167 151 170 172 192 275 309 342 374 344 West Asia, other 413 371 310 290 313 274 287 251 289 319 Pacific/Australasia 231 237 209 206 161 180 160 154 145 173 Australia 61 43 48 46 49 42 44 32 28 45 Indonesia 83 70 67 65 45 63 48 66 47 68 Pacific/Australasia, other 87 124 94 95 67 75 68 56 70 60 Africa 428 445 368 375 338 366 337 297 341 374 Egypt 78 90 77 92 63 83 75 96 110 124 Nigeria 53 39 25 34 35 23 20 13 13 18 Africa, other 297 316 266 249 240 260 242 188 218 232 Country unknown 20 43 133 123 95 61 80 95 101 78 Science 7,033 7,318 6,642 6,734 6,296 6,267 6,152 5,937 6,325 6,578 North America 426 441 413 477 446 496 491 478 521 557 Canada 233 233 219 251 238 244 262 277 291 323 Caribbean 54 43 36 48 41 46 32 35 42 62 Central America 35 40 35 38 37 51 36 31 37 34 Mexico 104 125 123 140 130 155 161 135 151 138 South America 272 344 318 331 345 335 320 321 377 355 Argentina 43 59 54 58 47 66 55 61 65 69 Brazil 91 142 107 113 121 94 106 93 91 99
61

TABLE 11. Non-U.S. citizens awarded doctorates in science and engineering, by visa type and country of citizenship: 1995–2004Visa and country/economy 1995 1996 1997 1998 1999 2000 2001 2002 2003 2004 Chile 30 29 30 24 27 33 18 32 54 34 Colombia 35 35 36 24 41 40 47 37 65 52 South America, other 73 79 91 112 109 102 94 98 102 101 Europe 960 1,032 1,066 1,227 1,210 1,210 1,316 1,251 1,293 1,331 Belgium 20 21 13 14 20 15 16 12 16 11 England, United Kingdom 112 107 80 112 128 89 127 120 98 94 France 58 44 62 54 56 60 61 67 64 65 Germany 171 154 153 181 145 183 172 152 167 148 Europe, other 599 706 758 866 861 863 940 900 948 1,013 East Asia 3,642 3,798 3,252 3,197 2,877 2,876 2,715 2,626 2,733 2,842 China, People's Republic of 1,999 2,197 1,729 1,808 1,636 1,657 1,536 1,508 1,522 1,661 Hong Kong 70 79 73 64 43 34 31 31 17 25 Japan 125 137 118 135 127 178 127 126 167 158 Korea 664 658 586 532 484 468 530 502 562 550 Taiwan 629 582 628 526 440 385 299 255 254 243 Thailand 76 76 56 70 82 93 122 133 142 134 East Asia, other 79 69 62 62 65 61 70 71 69 71 West Asia 1,226 1,173 1,073 1,006 968 920 906 888 992 1,029 India 637 648 653 599 534 473 463 397 469 491 Iran 88 82 52 49 50 42 38 26 27 28 Iraq 6 7 2 2 0 0 5 2 0 0 Israel 67 64 49 46 39 40 38 44 54 57 Lebanon 25 34 21 20 16 16 18 18 18 21 Saudi Arabia 46 40 39 28 32 39 23 46 42 55 Turkey 93 77 73 90 92 139 165 191 206 198 West Asia, other 264 221 184 172 205 171 156 164 176 179 Pacific/Australasia 187 199 162 157 137 136 120 115 110 125 Australia 54 37 40 42 41 38 34 31 23 40 Indonesia 54 55 44 36 32 36 25 37 25 32 Pacific/Australasia, other 79 107 78 79 64 62 61 47 62 53 Africa 306 301 257 260 240 254 235 199 234 271 Egypt 30 30 28 27 14 21 29 40 48 65 Nigeria 39 28 17 27 26 19 17 8 8 14 Africa, other 237 243 212 206 200 214 189 151 178 192 Country unknown 14 30 101 79 73 40 49 59 65 68 Engineering 3,483 3,527 3,148 3,061 2,595 2,802 3,090 2,920 3,182 3,543 North America 82 97 85 99 111 118 108 97 116 121 Canada 41 45 44 37 51 50 45 37 34 58 Caribbean 7 8 13 17 13 8 8 9 2 13 Central America 8 7 3 6 5 6 9 4 12 8 Mexico 26 37 25 39 42 54 46 47 68 42 South America 89 118 96 105 99 112 96 92 82 124 Argentina 7 9 15 13 9 12 14 5 10 20 Brazil 46 65 44 51 43 37 37 33 16 37 Chile 8 8 1 2 6 9 7 8 12 9 Colombia 10 7 4 8 11 16 12 18 18 23 South America, other 18 29 32 31 30 38 26 28 26 35 Europe 297 237 248 305 276 297 335 301 313 317 Belgium 12 4 5 3 1 6 8 4 7 6 England, United Kingdom 20 10 12 12 14 11 11 14 12 16 France 24 25 12 23 23 23 24 25 23 26 Germany 37 16 28 29 38 46 48 45 22 36 Europe, other 204 182 191 238 200 211 244 213 249 233
62

TABLE 11. Non-U.S. citizens awarded doctorates in science and engineering, by visa type and country of citizenship: 1995–2004Visa and country/economy 1995 1996 1997 1998 1999 2000 2001 2002 2003 2004 East Asia 1,877 1,881 1,558 1,506 1,286 1,423 1,637 1,661 1,820 2,068 China, People's Republic of 782 825 666 702 597 721 882 893 979 1,208 Hong Kong 20 31 13 27 11 12 15 11 15 6 Japan 30 32 37 21 31 23 23 32 35 28 Korea 345 327 315 291 276 285 337 353 399 503 Taiwan 620 580 465 387 306 291 242 214 188 151 Thailand 38 43 41 53 52 60 114 131 169 137 East Asia, other 42 43 21 25 13 31 24 27 35 35 West Asia 966 999 971 838 679 675 741 596 673 752 India 575 623 628 543 381 361 352 282 302 366 Iran 85 68 61 44 42 38 62 31 41 31 Iraq 8 2 5 3 5 2 2 1 0 2 Israel 19 20 14 12 8 6 11 6 12 18 Lebanon 31 22 9 18 9 12 10 13 14 11 Saudi Arabia 25 40 31 18 26 17 29 25 23 38 Turkey 74 74 97 82 100 136 144 151 168 146 West Asia, other 149 150 126 118 108 103 131 87 113 140 Pacific/Australasia 44 38 47 49 24 44 40 39 35 48 Australia 7 6 8 4 8 4 10 1 5 5 Indonesia 29 15 23 29 13 27 23 29 22 36 Pacific/Australasia, other 8 17 16 16 3 13 7 9 8 7 Africa 122 144 111 115 98 112 102 98 107 103 Egypt 48 60 49 65 49 62 46 56 62 59 Nigeria 14 11 8 7 9 4 3 5 5 4 Africa, other 60 73 54 43 40 46 53 37 40 40 Country unknown 6 13 32 44 22 21 31 36 36 10 Permanent visa 3,509 3,009 2,281 2,019 1,653 1,409 1,278 1,167 1,100 999 North America 135 121 107 113 100 92 100 93 83 86 Canada 78 71 57 66 56 51 54 64 45 42 Caribbean 26 27 20 21 20 18 15 15 14 22 Central America 8 3 7 6 12 5 10 6 4 5 Mexico 23 20 23 20 12 18 21 8 20 17 South America 52 65 73 51 50 51 44 53 55 51 Argentina 9 17 20 6 9 12 9 11 11 9 Brazil 11 11 7 12 10 10 12 13 9 12 Chile 9 5 8 7 11 6 0 4 5 7 Colombia 8 10 7 5 5 9 4 8 13 4 South America, other 15 22 31 21 15 14 19 17 17 19 Europe 286 314 342 370 341 340 357 293 297 267 Belgium 7 8 8 3 6 5 6 2 5 2 England, United Kingdom 49 50 39 43 51 36 53 49 33 37 France 15 16 23 25 15 19 23 11 19 10 Germany 53 51 43 43 33 60 39 33 37 32 Europe, other 162 189 229 256 236 220 236 198 203 186 East Asia 2,504 1,980 1,274 1,081 748 567 442 448 398 318 China, People's Republic of 2,190 1,679 985 850 534 383 304 317 260 185 Hong Kong 15 18 15 14 11 8 6 5 10 5 Japan 19 23 24 22 27 35 21 16 31 20 Korea 87 94 81 71 79 59 51 49 43 54 Taiwan 167 137 153 103 78 65 47 40 33 34 Thailand 10 14 4 8 3 4 6 6 6 9 East Asia, other 16 15 12 13 16 13 7 15 15 11 West Asia 385 394 325 261 285 233 212 194 181 160 India 168 203 195 136 135 108 100 81 85 75 Iran 84 74 37 38 46 40 29 23 23 15 Iraq 5 4 1 3 3 1 2 1 0 0
63
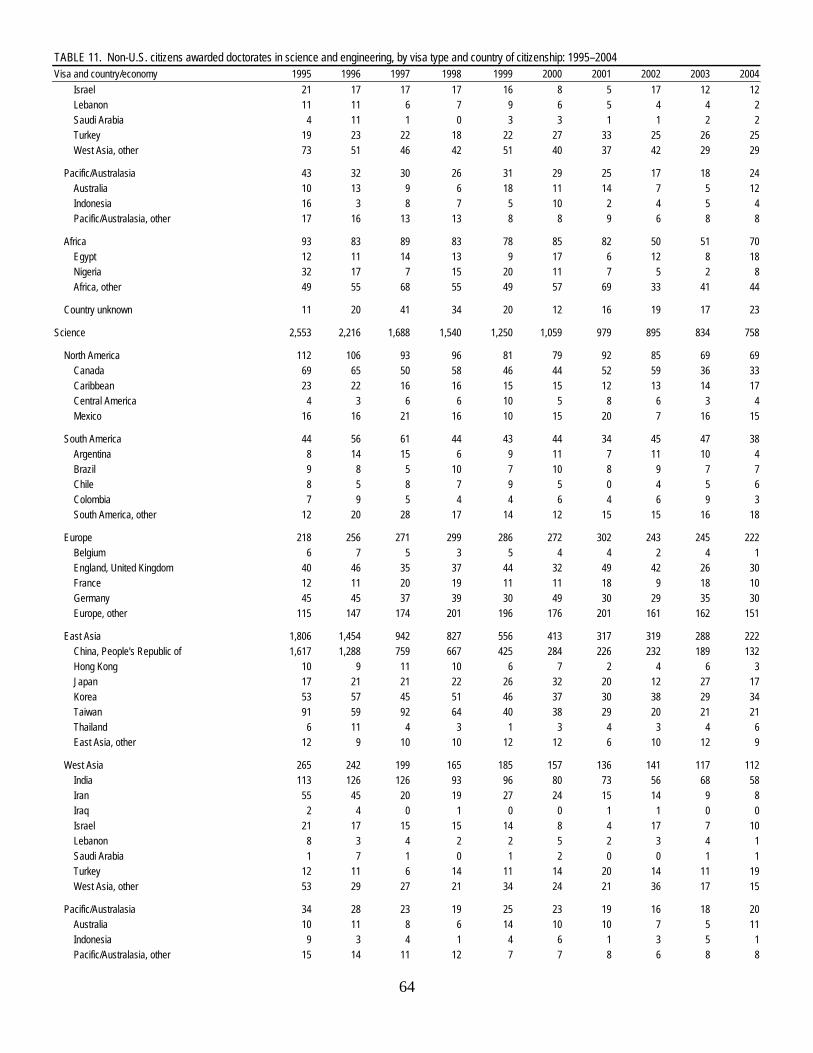
TABLE 11. Non-U.S. citizens awarded doctorates in science and engineering, by visa type and country of citizenship: 1995–2004Visa and country/economy 1995 1996 1997 1998 1999 2000 2001 2002 2003 2004 Israel 21 17 17 17 16 8 5 17 12 12 Lebanon 11 11 6 7 9 6 5 4 4 2 Saudi Arabia 4 11 1 0 3 3 1 1 2 2 Turkey 19 23 22 18 22 27 33 25 26 25 West Asia, other 73 51 46 42 51 40 37 42 29 29 Pacific/Australasia 43 32 30 26 31 29 25 17 18 24 Australia 10 13 9 6 18 11 14 7 5 12 Indonesia 16 3 8 7 5 10 2 4 5 4 Pacific/Australasia, other 17 16 13 13 8 8 9 6 8 8 Africa 93 83 89 83 78 85 82 50 51 70 Egypt 12 11 14 13 9 17 6 12 8 18 Nigeria 32 17 7 15 20 11 7 5 2 8 Africa, other 49 55 68 55 49 57 69 33 41 44 Country unknown 11 20 41 34 20 12 16 19 17 23 Science 2,553 2,216 1,688 1,540 1,250 1,059 979 895 834 758 North America 112 106 93 96 81 79 92 85 69 69 Canada 69 65 50 58 46 44 52 59 36 33 Caribbean 23 22 16 16 15 15 12 13 14 17 Central America 4 3 6 6 10 5 8 6 3 4 Mexico 16 16 21 16 10 15 20 7 16 15 South America 44 56 61 44 43 44 34 45 47 38 Argentina 8 14 15 6 9 11 7 11 10 4 Brazil 9 8 5 10 7 10 8 9 7 7 Chile 8 5 8 7 9 5 0 4 5 6 Colombia 7 9 5 4 4 6 4 6 9 3 South America, other 12 20 28 17 14 12 15 15 16 18 Europe 218 256 271 299 286 272 302 243 245 222 Belgium 6 7 5 3 5 4 4 2 4 1 England, United Kingdom 40 46 35 37 44 32 49 42 26 30 France 12 11 20 19 11 11 18 9 18 10 Germany 45 45 37 39 30 49 30 29 35 30 Europe, other 115 147 174 201 196 176 201 161 162 151 East Asia 1,806 1,454 942 827 556 413 317 319 288 222 China, People's Republic of 1,617 1,288 759 667 425 284 226 232 189 132 Hong Kong 10 9 11 10 6 7 2 4 6 3 Japan 17 21 21 22 26 32 20 12 27 17 Korea 53 57 45 51 46 37 30 38 29 34 Taiwan 91 59 92 64 40 38 29 20 21 21 Thailand 6 11 4 3 1 3 4 3 4 6 East Asia, other 12 9 10 10 12 12 6 10 12 9 West Asia 265 242 199 165 185 157 136 141 117 112 India 113 126 126 93 96 80 73 56 68 58 Iran 55 45 20 19 27 24 15 14 9 8 Iraq 2 4 0 1 0 0 1 1 0 0 Israel 21 17 15 15 14 8 4 17 7 10 Lebanon 8 3 4 2 2 5 2 3 4 1 Saudi Arabia 1 7 1 0 1 2 0 0 1 1 Turkey 12 11 6 14 11 14 20 14 11 19 West Asia, other 53 29 27 21 34 24 21 36 17 15 Pacific/Australasia 34 28 23 19 25 23 19 16 18 20 Australia 10 11 8 6 14 10 10 7 5 11 Indonesia 9 3 4 1 4 6 1 3 5 1 Pacific/Australasia, other 15 14 11 12 7 7 8 6 8 8
64
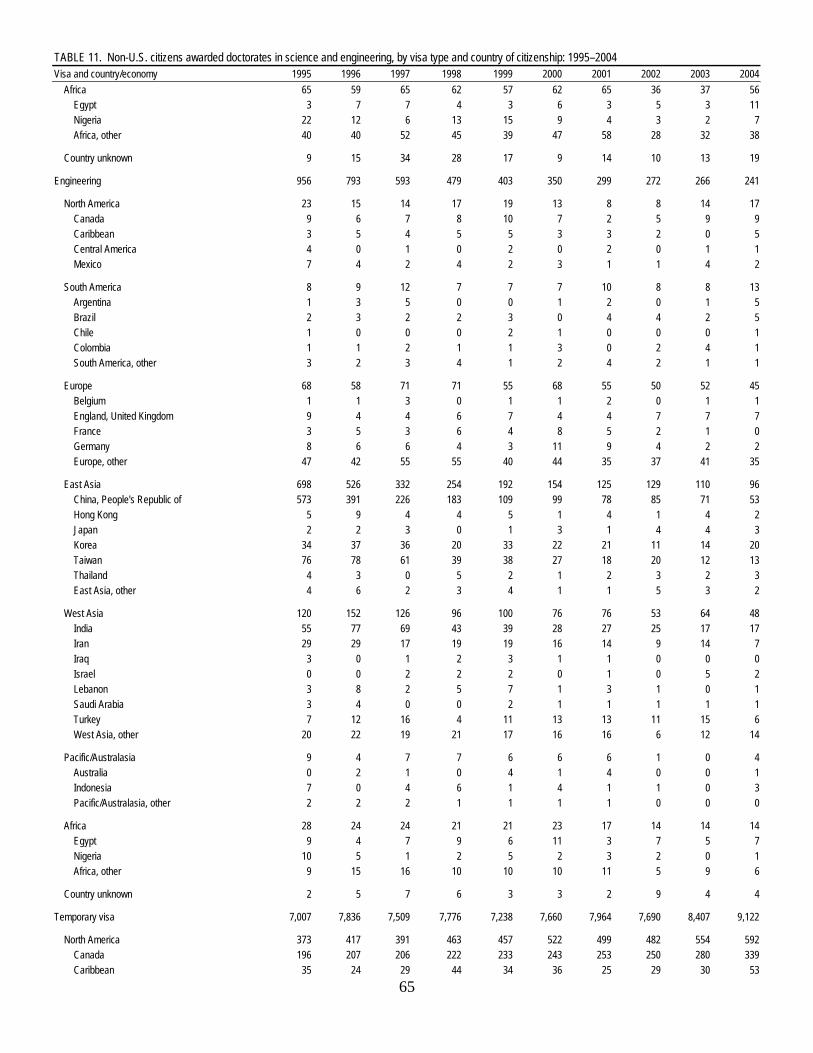
TABLE 11. Non-U.S. citizens awarded doctorates in science and engineering, by visa type and country of citizenship: 1995–2004Visa and country/economy 1995 1996 1997 1998 1999 2000 2001 2002 2003 2004 Africa 65 59 65 62 57 62 65 36 37 56 Egypt 3 7 7 4 3 6 3 5 3 11 Nigeria 22 12 6 13 15 9 4 3 2 7 Africa, other 40 40 52 45 39 47 58 28 32 38 Country unknown 9 15 34 28 17 9 14 10 13 19 Engineering 956 793 593 479 403 350 299 272 266 241 North America 23 15 14 17 19 13 8 8 14 17 Canada 9 6 7 8 10 7 2 5 9 9 Caribbean 3 5 4 5 5 3 3 2 0 5 Central America 4 0 1 0 2 0 2 0 1 1 Mexico 7 4 2 4 2 3 1 1 4 2 South America 8 9 12 7 7 7 10 8 8 13 Argentina 1 3 5 0 0 1 2 0 1 5 Brazil 2 3 2 2 3 0 4 4 2 5 Chile 1 0 0 0 2 1 0 0 0 1 Colombia 1 1 2 1 1 3 0 2 4 1 South America, other 3 2 3 4 1 2 4 2 1 1 Europe 68 58 71 71 55 68 55 50 52 45 Belgium 1 1 3 0 1 1 2 0 1 1 England, United Kingdom 9 4 4 6 7 4 4 7 7 7 France 3 5 3 6 4 8 5 2 1 0 Germany 8 6 6 4 3 11 9 4 2 2 Europe, other 47 42 55 55 40 44 35 37 41 35 East Asia 698 526 332 254 192 154 125 129 110 96 China, People's Republic of 573 391 226 183 109 99 78 85 71 53 Hong Kong 5 9 4 4 5 1 4 1 4 2 Japan 2 2 3 0 1 3 1 4 4 3 Korea 34 37 36 20 33 22 21 11 14 20 Taiwan 76 78 61 39 38 27 18 20 12 13 Thailand 4 3 0 5 2 1 2 3 2 3 East Asia, other 4 6 2 3 4 1 1 5 3 2 West Asia 120 152 126 96 100 76 76 53 64 48 India 55 77 69 43 39 28 27 25 17 17 Iran 29 29 17 19 19 16 14 9 14 7 Iraq 3 0 1 2 3 1 1 0 0 0 Israel 0 0 2 2 2 0 1 0 5 2 Lebanon 3 8 2 5 7 1 3 1 0 1 Saudi Arabia 3 4 0 0 2 1 1 1 1 1 Turkey 7 12 16 4 11 13 13 11 15 6 West Asia, other 20 22 19 21 17 16 16 6 12 14 Pacific/Australasia 9 4 7 7 6 6 6 1 0 4 Australia 0 2 1 0 4 1 4 0 0 1 Indonesia 7 0 4 6 1 4 1 1 0 3 Pacific/Australasia, other 2 2 2 1 1 1 1 0 0 0 Africa 28 24 24 21 21 23 17 14 14 14 Egypt 9 4 7 9 6 11 3 7 5 7 Nigeria 10 5 1 2 5 2 3 2 0 1 Africa, other 9 15 16 10 10 10 11 5 9 6 Country unknown 2 5 7 6 3 3 2 9 4 4 Temporary visa 7,007 7,836 7,509 7,776 7,238 7,660 7,964 7,690 8,407 9,122 North America 373 417 391 463 457 522 499 482 554 592 Canada 196 207 206 222 233 243 253 250 280 339 Caribbean 35 24 29 44 34 36 25 29 30 53
65
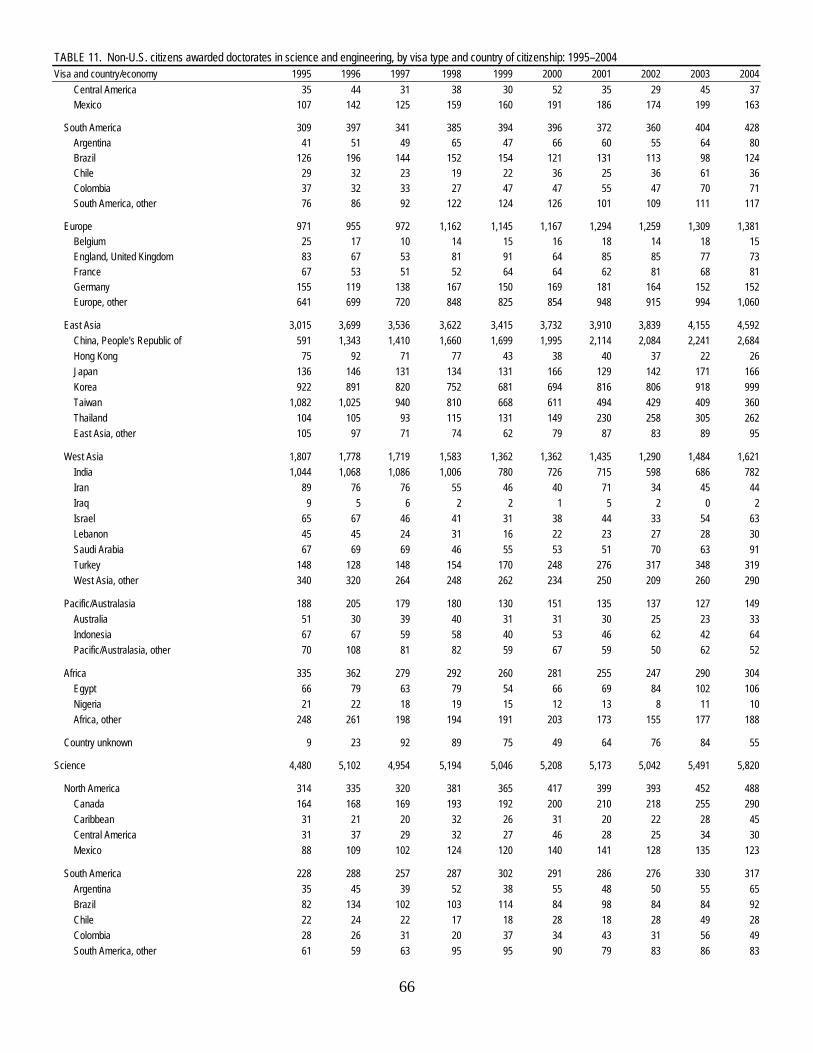
TABLE 11. Non-U.S. citizens awarded doctorates in science and engineering, by visa type and country of citizenship: 1995–2004Visa and country/economy 1995 1996 1997 1998 1999 2000 2001 2002 2003 2004 Central America 35 44 31 38 30 52 35 29 45 37 Mexico 107 142 125 159 160 191 186 174 199 163 South America 309 397 341 385 394 396 372 360 404 428 Argentina 41 51 49 65 47 66 60 55 64 80 Brazil 126 196 144 152 154 121 131 113 98 124 Chile 29 32 23 19 22 36 25 36 61 36 Colombia 37 32 33 27 47 47 55 47 70 71 South America, other 76 86 92 122 124 126 101 109 111 117 Europe 971 955 972 1,162 1,145 1,167 1,294 1,259 1,309 1,381 Belgium 25 17 10 14 15 16 18 14 18 15 England, United Kingdom 83 67 53 81 91 64 85 85 77 73 France 67 53 51 52 64 64 62 81 68 81 Germany 155 119 138 167 150 169 181 164 152 152 Europe, other 641 699 720 848 825 854 948 915 994 1,060 East Asia 3,015 3,699 3,536 3,622 3,415 3,732 3,910 3,839 4,155 4,592 China, People's Republic of 591 1,343 1,410 1,660 1,699 1,995 2,114 2,084 2,241 2,684 Hong Kong 75 92 71 77 43 38 40 37 22 26 Japan 136 146 131 134 131 166 129 142 171 166 Korea 922 891 820 752 681 694 816 806 918 999 Taiwan 1,082 1,025 940 810 668 611 494 429 409 360 Thailand 104 105 93 115 131 149 230 258 305 262 East Asia, other 105 97 71 74 62 79 87 83 89 95 West Asia 1,807 1,778 1,719 1,583 1,362 1,362 1,435 1,290 1,484 1,621 India 1,044 1,068 1,086 1,006 780 726 715 598 686 782 Iran 89 76 76 55 46 40 71 34 45 44 Iraq 9 5 6 2 2 1 5 2 0 2 Israel 65 67 46 41 31 38 44 33 54 63 Lebanon 45 45 24 31 16 22 23 27 28 30 Saudi Arabia 67 69 69 46 55 53 51 70 63 91 Turkey 148 128 148 154 170 248 276 317 348 319 West Asia, other 340 320 264 248 262 234 250 209 260 290 Pacific/Australasia 188 205 179 180 130 151 135 137 127 149 Australia 51 30 39 40 31 31 30 25 23 33 Indonesia 67 67 59 58 40 53 46 62 42 64 Pacific/Australasia, other 70 108 81 82 59 67 59 50 62 52 Africa 335 362 279 292 260 281 255 247 290 304 Egypt 66 79 63 79 54 66 69 84 102 106 Nigeria 21 22 18 19 15 12 13 8 11 10 Africa, other 248 261 198 194 191 203 173 155 177 188 Country unknown 9 23 92 89 75 49 64 76 84 55 Science 4,480 5,102 4,954 5,194 5,046 5,208 5,173 5,042 5,491 5,820 North America 314 335 320 381 365 417 399 393 452 488 Canada 164 168 169 193 192 200 210 218 255 290 Caribbean 31 21 20 32 26 31 20 22 28 45 Central America 31 37 29 32 27 46 28 25 34 30 Mexico 88 109 102 124 120 140 141 128 135 123 South America 228 288 257 287 302 291 286 276 330 317 Argentina 35 45 39 52 38 55 48 50 55 65 Brazil 82 134 102 103 114 84 98 84 84 92 Chile 22 24 22 17 18 28 18 28 49 28 Colombia 28 26 31 20 37 34 43 31 56 49 South America, other 61 59 63 95 95 90 79 83 86 83
66

TABLE 11. Non-U.S. citizens awarded doctorates in science and engineering, by visa type and country of citizenship: 1995–2004Visa and country/economy 1995 1996 1997 1998 1999 2000 2001 2002 2003 2004 Europe 742 776 795 928 924 938 1,014 1,008 1,048 1,109 Belgium 14 14 8 11 15 11 12 10 12 10 England, United Kingdom 72 61 45 75 84 57 78 78 72 64 France 46 33 42 35 45 49 43 58 46 55 Germany 126 109 116 142 115 134 142 123 132 118 Europe, other 484 559 584 665 665 687 739 739 786 862 East Asia 1,836 2,344 2,310 2,370 2,321 2,463 2,398 2,307 2,445 2,620 China, People's Republic of 382 909 970 1,141 1,211 1,373 1,310 1,276 1,333 1,529 Hong Kong 60 70 62 54 37 27 29 27 11 22 Japan 108 116 97 113 101 146 107 114 140 141 Korea 611 601 541 481 438 431 500 464 533 516 Taiwan 538 523 536 462 400 347 270 235 233 222 Thailand 70 65 52 67 81 90 118 130 138 128 East Asia, other 67 60 52 52 53 49 64 61 57 62 West Asia 961 931 874 841 783 763 770 747 875 917 India 524 522 527 506 438 393 390 341 401 433 Iran 33 37 32 30 23 18 23 12 18 20 Iraq 4 3 2 1 0 0 4 1 0 0 Israel 46 47 34 31 25 32 34 27 47 47 Lebanon 17 31 17 18 14 11 16 15 14 20 Saudi Arabia 45 33 38 28 31 37 23 46 41 54 Turkey 81 66 67 76 81 125 145 177 195 179 West Asia, other 211 192 157 151 171 147 135 128 159 164 Pacific/Australasia 153 171 139 138 112 113 101 99 92 105 Australia 44 26 32 36 27 28 24 24 18 29 Indonesia 45 52 40 35 28 30 24 34 20 31 Pacific/Australasia, other 64 93 67 67 57 55 53 41 54 45 Africa 241 242 192 198 183 192 170 163 197 215 Egypt 27 23 21 23 11 15 26 35 45 54 Nigeria 17 16 11 14 11 10 13 5 6 7 Africa, other 197 203 160 161 161 167 131 123 146 154 Country unknown 5 15 67 51 56 31 35 49 52 49 Engineering 2,527 2,734 2,555 2,582 2,192 2,452 2,791 2,648 2,916 3,302 North America 59 82 71 82 92 105 100 89 102 104 Canada 32 39 37 29 41 43 43 32 25 49 Caribbean 4 3 9 12 8 5 5 7 2 8 Central America 4 7 2 6 3 6 7 4 11 7 Mexico 19 33 23 35 40 51 45 46 64 40 South America 81 109 84 98 92 105 86 84 74 111 Argentina 6 6 10 13 9 11 12 5 9 15 Brazil 44 62 42 49 40 37 33 29 14 32 Chile 7 8 1 2 4 8 7 8 12 8 Colombia 9 6 2 7 10 13 12 16 14 22 South America, other 15 27 29 27 29 36 22 26 25 34 Europe 229 179 177 234 221 229 280 251 261 272 Belgium 11 3 2 3 0 5 6 4 6 5 England, United Kingdom 11 6 8 6 7 7 7 7 5 9 France 21 20 9 17 19 15 19 23 22 26 Germany 29 10 22 25 35 35 39 41 20 34 Europe, other 157 140 136 183 160 167 209 176 208 198 East Asia 1,179 1,355 1,226 1,252 1,094 1,269 1,512 1,532 1,710 1,972 China, People's Republic of 209 434 440 519 488 622 804 808 908 1,155 Hong Kong 15 22 9 23 6 11 11 10 11 4 Japan 28 30 34 21 30 20 22 28 31 25
67
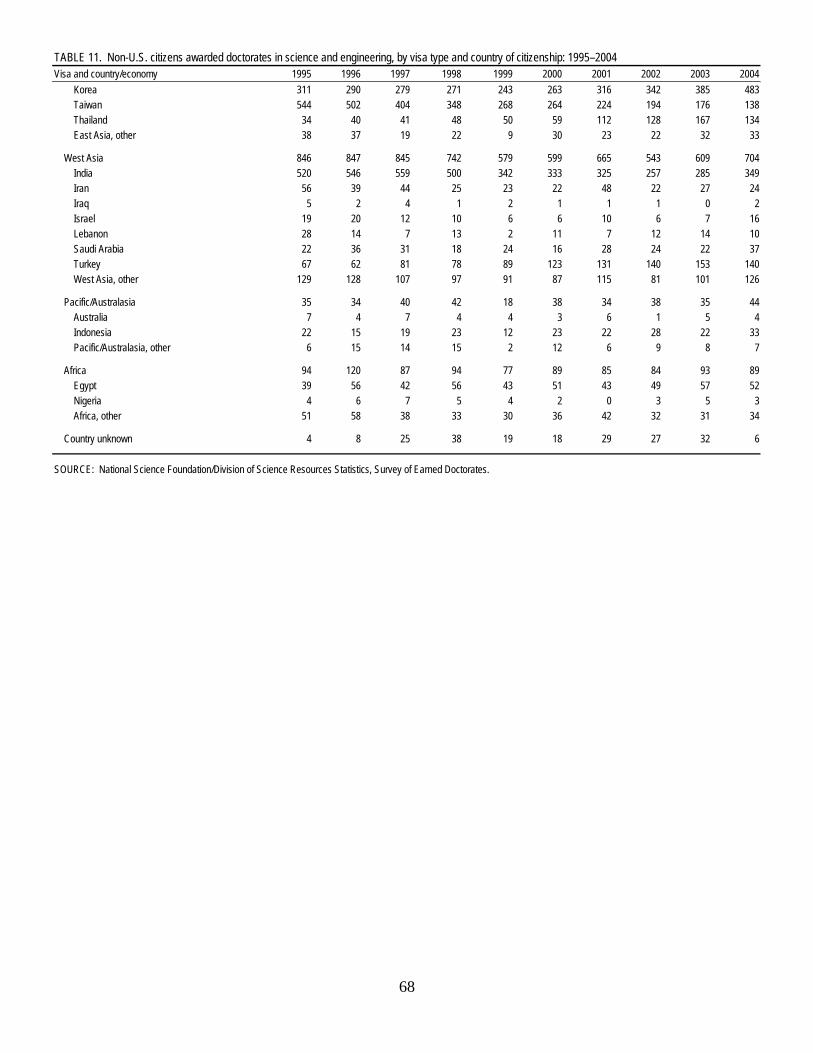
TABLE 11. Non-U.S. citizens awarded doctorates in science and engineering, by visa type and country of citizenship: 1995–2004Visa and country/economy 1995 1996 1997 1998 1999 2000 2001 2002 2003 2004 Korea 311 290 279 271 243 263 316 342 385 483 Taiwan 544 502 404 348 268 264 224 194 176 138 Thailand 34 40 41 48 50 59 112 128 167 134 East Asia, other 38 37 19 22 9 30 23 22 32 33 West Asia 846 847 845 742 579 599 665 543 609 704 India 520 546 559 500 342 333 325 257 285 349 Iran 56 39 44 25 23 22 48 22 27 24 Iraq 5 2 4 1 2 1 1 1 0 2 Israel 19 20 12 10 6 6 10 6 7 16 Lebanon 28 14 7 13 2 11 7 12 14 10 Saudi Arabia 22 36 31 18 24 16 28 24 22 37 Turkey 67 62 81 78 89 123 131 140 153 140 West Asia, other 129 128 107 97 91 87 115 81 101 126 Pacific/Australasia 35 34 40 42 18 38 34 38 35 44 Australia 7 4 7 4 4 3 6 1 5 4 Indonesia 22 15 19 23 12 23 22 28 22 33 Pacific/Australasia, other 6 15 14 15 2 12 6 9 8 7 Africa 94 120 87 94 77 89 85 84 93 89 Egypt 39 56 42 56 43 51 43 49 57 52 Nigeria 4 6 7 5 4 2 0 3 5 3 Africa, other 51 58 38 33 30 36 42 32 31 34 Country unknown 4 8 25 38 19 18 29 27 32 6
SOURCE: National Science Foundation/Division of Science Resources Statistics, Survey of Earned Doctorates.
68
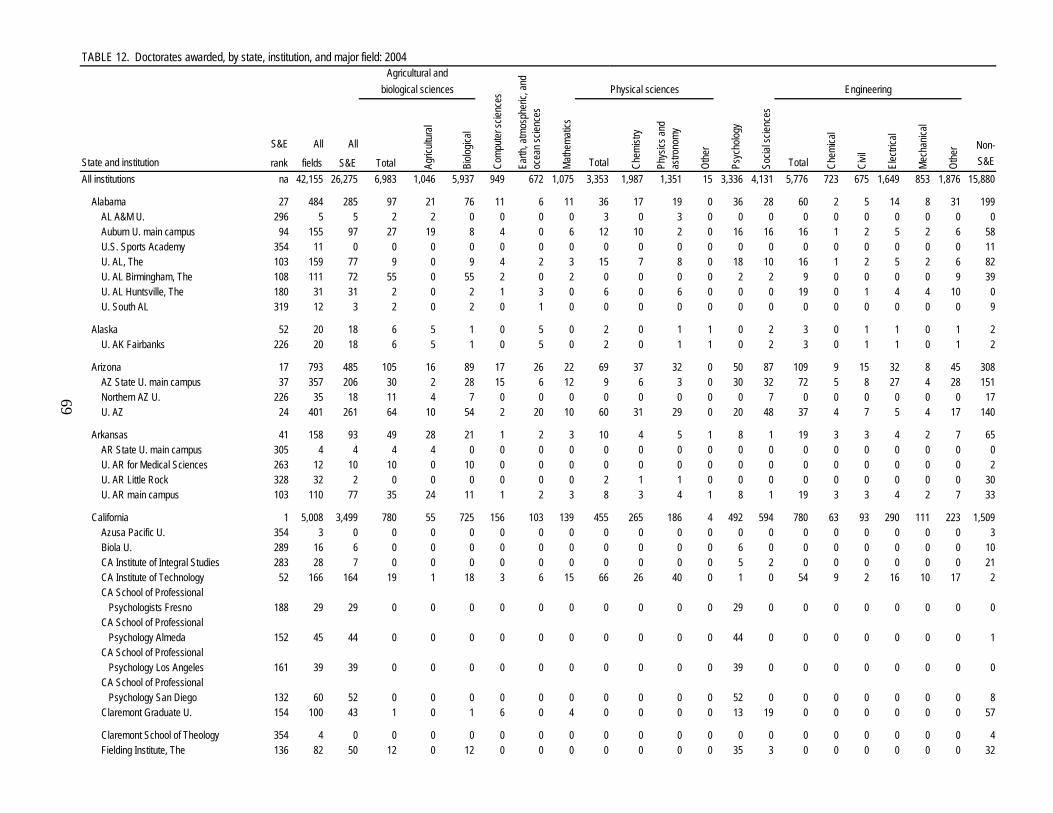
TABLE 12. Doctorates awarded, by state, institution, and major field: 2004
S&E All All
rank fields S&E S&EAll institutions na 42,155 26,275 6,983 1,046 5,937 949 672 1,075 3,353 1,987 1,351 15 3,336 4,131 5,776 723 675 1,649 853 1,876 15,880
na . . . . . . . . . . . . . . . . . . . . . Alabama 27 484 285 97 21 76 11 6 11 36 17 19 0 36 28 60 2 5 14 8 31 199 AL A&M U. 296 5 5 2 2 0 0 0 0 3 0 3 0 0 0 0 0 0 0 0 0 0 Auburn U. main campus 94 155 97 27 19 8 4 0 6 12 10 2 0 16 16 16 1 2 5 2 6 58 U.S. Sports Academy 354 11 0 0 0 0 0 0 0 0 0 0 0 0 0 0 0 0 0 0 0 11 U. AL, The 103 159 77 9 0 9 4 2 3 15 7 8 0 18 10 16 1 2 5 2 6 82 U. AL Birmingham, The 108 111 72 55 0 55 2 0 2 0 0 0 0 2 2 9 0 0 0 0 9 39 U. AL Huntsville, The 180 31 31 2 0 2 1 3 0 6 0 6 0 0 0 19 0 1 4 4 10 0 U. South AL 319 12 3 2 0 2 0 1 0 0 0 0 0 0 0 0 0 0 0 0 0 9
na . . . . . . . . . . . . . . . . . . . . . Alaska 52 20 18 6 5 1 0 5 0 2 0 1 1 0 2 3 0 1 1 0 1 2 U. AK Fairbanks 226 20 18 6 5 1 0 5 0 2 0 1 1 0 2 3 0 1 1 0 1 2
na . . . . . . . . . . . . . . . . . . . . . Arizona 17 793 485 105 16 89 17 26 22 69 37 32 0 50 87 109 9 15 32 8 45 308 AZ State U. main campus 37 357 206 30 2 28 15 6 12 9 6 3 0 30 32 72 5 8 27 4 28 151 Northern AZ U. 226 35 18 11 4 7 0 0 0 0 0 0 0 0 7 0 0 0 0 0 0 17 U. AZ 24 401 261 64 10 54 2 20 10 60 31 29 0 20 48 37 4 7 5 4 17 140
na . . . . . . . . . . . . . . . . . . . . . Arkansas 41 158 93 49 28 21 1 2 3 10 4 5 1 8 1 19 3 3 4 2 7 65 AR State U. main campus 305 4 4 4 4 0 0 0 0 0 0 0 0 0 0 0 0 0 0 0 0 0 U. AR for Medical Sciences 263 12 10 10 0 10 0 0 0 0 0 0 0 0 0 0 0 0 0 0 0 2 U. AR Little Rock 328 32 2 0 0 0 0 0 0 2 1 1 0 0 0 0 0 0 0 0 0 30 U. AR main campus 103 110 77 35 24 11 1 2 3 8 3 4 1 8 1 19 3 3 4 2 7 33
na . . . . . . . . . . . . . . . . . . . . . California 1 5,008 3,499 780 55 725 156 103 139 455 265 186 4 492 594 780 63 93 290 111 223 1,509 Azusa Pacific U. 354 3 0 0 0 0 0 0 0 0 0 0 0 0 0 0 0 0 0 0 0 3 Biola U. 289 16 6 0 0 0 0 0 0 0 0 0 0 6 0 0 0 0 0 0 0 10 CA Institute of Integral Studies 283 28 7 0 0 0 0 0 0 0 0 0 0 5 2 0 0 0 0 0 0 21 CA Institute of Technology 52 166 164 19 1 18 3 6 15 66 26 40 0 1 0 54 9 2 16 10 17 2 CA School of Professional Psychologists Fresno 188 29 29 0 0 0 0 0 0 0 0 0 0 29 0 0 0 0 0 0 0 0 CA School of Professional Psychology Almeda 152 45 44 0 0 0 0 0 0 0 0 0 0 44 0 0 0 0 0 0 0 1 CA School of Professional Psychology Los Angeles 161 39 39 0 0 0 0 0 0 0 0 0 0 39 0 0 0 0 0 0 0 0 CA School of Professional Psychology San Diego 132 60 52 0 0 0 0 0 0 0 0 0 0 52 0 0 0 0 0 0 0 8 Claremont Graduate U. 154 100 43 1 0 1 6 0 4 0 0 0 0 13 19 0 0 0 0 0 0 57
na . . . . . . . . . . . . . . . . . . . . . Claremont School of Theology 354 4 0 0 0 0 0 0 0 0 0 0 0 0 0 0 0 0 0 0 0 4 Fielding Institute, The 136 82 50 12 0 12 0 0 0 0 0 0 0 35 3 0 0 0 0 0 0 32
Total Chem
ical
Civil
Chem
istry
Phys
ics an
d as
trono
my
Non-
Physical sciences Engineering
Comp
uter s
cienc
es
Agricultural andbiological sciences
Psyc
holog
y
State and institution Total Agric
ultur
al
Biolo
gical
Othe
r
Total Mech
anica
l
Othe
r
Socia
l scie
nces
Earth
, atm
osph
eric,
and
ocea
n scie
nces
Mathe
matic
s
Elec
trical
69
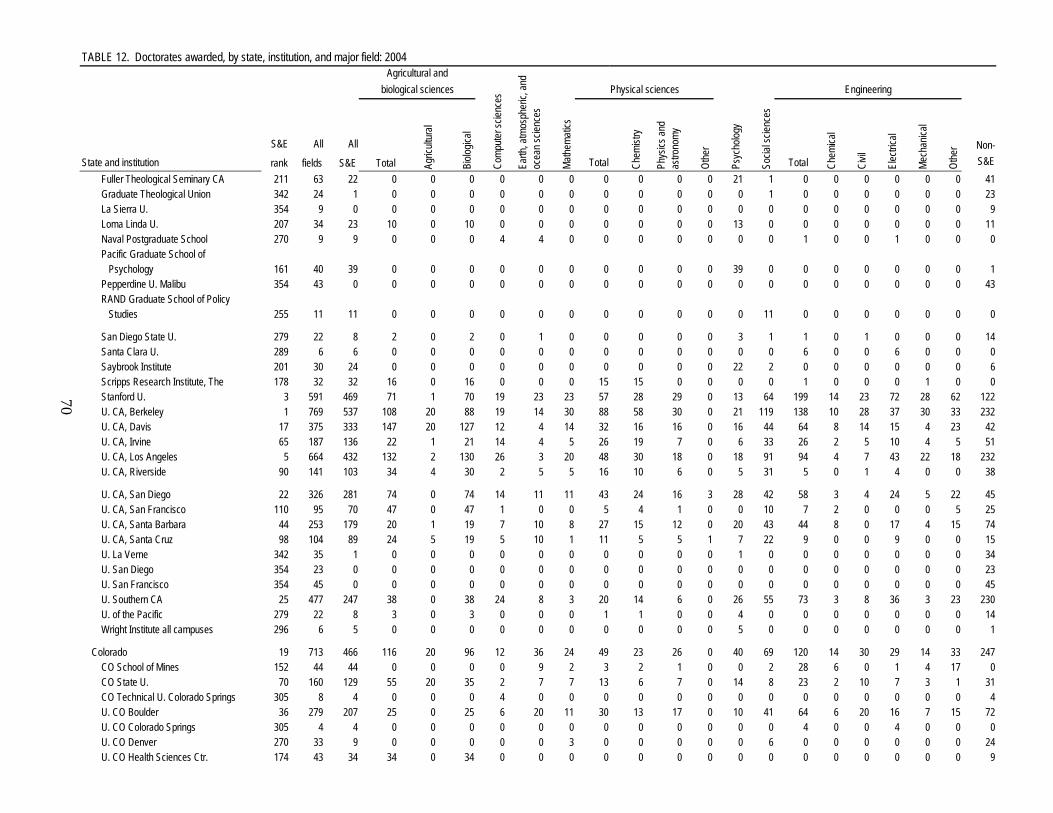
TABLE 12. Doctorates awarded, by state, institution, and major field: 2004
S&E All All
rank fields S&E S&ETotal Chem
ical
Civil
Chem
istry
Phys
ics an
d as
trono
my
Non-
Physical sciences Engineering
Comp
uter s
cienc
es
Agricultural andbiological sciences
Psyc
holog
y
State and institution Total Agric
ultur
al
Biolo
gical
Othe
r
Total Mech
anica
l
Othe
r
Socia
l scie
nces
Earth
, atm
osph
eric,
and
ocea
n scie
nces
Mathe
matic
s
Elec
trical
Fuller Theological Seminary CA 211 63 22 0 0 0 0 0 0 0 0 0 0 21 1 0 0 0 0 0 0 41 Graduate Theological Union 342 24 1 0 0 0 0 0 0 0 0 0 0 0 1 0 0 0 0 0 0 23 La Sierra U. 354 9 0 0 0 0 0 0 0 0 0 0 0 0 0 0 0 0 0 0 0 9 Loma Linda U. 207 34 23 10 0 10 0 0 0 0 0 0 0 13 0 0 0 0 0 0 0 11 Naval Postgraduate School 270 9 9 0 0 0 4 4 0 0 0 0 0 0 0 1 0 0 1 0 0 0 Pacific Graduate School of Psychology 161 40 39 0 0 0 0 0 0 0 0 0 0 39 0 0 0 0 0 0 0 1 Pepperdine U. Malibu 354 43 0 0 0 0 0 0 0 0 0 0 0 0 0 0 0 0 0 0 0 43 RAND Graduate School of Policy Studies 255 11 11 0 0 0 0 0 0 0 0 0 0 0 11 0 0 0 0 0 0 0
na . . . . . . . . . . . . . . . . . . . . . San Diego State U. 279 22 8 2 0 2 0 1 0 0 0 0 0 3 1 1 0 1 0 0 0 14 Santa Clara U. 289 6 6 0 0 0 0 0 0 0 0 0 0 0 0 6 0 0 6 0 0 0 Saybrook Institute 201 30 24 0 0 0 0 0 0 0 0 0 0 22 2 0 0 0 0 0 0 6 Scripps Research Institute, The 178 32 32 16 0 16 0 0 0 15 15 0 0 0 0 1 0 0 0 1 0 0 Stanford U. 3 591 469 71 1 70 19 23 23 57 28 29 0 13 64 199 14 23 72 28 62 122 U. CA, Berkeley 1 769 537 108 20 88 19 14 30 88 58 30 0 21 119 138 10 28 37 30 33 232 U. CA, Davis 17 375 333 147 20 127 12 4 14 32 16 16 0 16 44 64 8 14 15 4 23 42 U. CA, Irvine 65 187 136 22 1 21 14 4 5 26 19 7 0 6 33 26 2 5 10 4 5 51 U. CA, Los Angeles 5 664 432 132 2 130 26 3 20 48 30 18 0 18 91 94 4 7 43 22 18 232 U. CA, Riverside 90 141 103 34 4 30 2 5 5 16 10 6 0 5 31 5 0 1 4 0 0 38
na . . . . . . . . . . . . . . . . . . . . . U. CA, San Diego 22 326 281 74 0 74 14 11 11 43 24 16 3 28 42 58 3 4 24 5 22 45 U. CA, San Francisco 110 95 70 47 0 47 1 0 0 5 4 1 0 0 10 7 2 0 0 0 5 25 U. CA, Santa Barbara 44 253 179 20 1 19 7 10 8 27 15 12 0 20 43 44 8 0 17 4 15 74 U. CA, Santa Cruz 98 104 89 24 5 19 5 10 1 11 5 5 1 7 22 9 0 0 9 0 0 15 U. La Verne 342 35 1 0 0 0 0 0 0 0 0 0 0 1 0 0 0 0 0 0 0 34 U. San Diego 354 23 0 0 0 0 0 0 0 0 0 0 0 0 0 0 0 0 0 0 0 23 U. San Francisco 354 45 0 0 0 0 0 0 0 0 0 0 0 0 0 0 0 0 0 0 0 45 U. Southern CA 25 477 247 38 0 38 24 8 3 20 14 6 0 26 55 73 3 8 36 3 23 230 U. of the Pacific 279 22 8 3 0 3 0 0 0 1 1 0 0 4 0 0 0 0 0 0 0 14 Wright Institute all campuses 296 6 5 0 0 0 0 0 0 0 0 0 0 5 0 0 0 0 0 0 0 1
na . . . . . . . . . . . . . . . . . . . . . Colorado 19 713 466 116 20 96 12 36 24 49 23 26 0 40 69 120 14 30 29 14 33 247 CO School of Mines 152 44 44 0 0 0 0 9 2 3 2 1 0 0 2 28 6 0 1 4 17 0 CO State U. 70 160 129 55 20 35 2 7 7 13 6 7 0 14 8 23 2 10 7 3 1 31 CO Technical U. Colorado Springs 305 8 4 0 0 0 4 0 0 0 0 0 0 0 0 0 0 0 0 0 0 4 U. CO Boulder 36 279 207 25 0 25 6 20 11 30 13 17 0 10 41 64 6 20 16 7 15 72 U. CO Colorado Springs 305 4 4 0 0 0 0 0 0 0 0 0 0 0 0 4 0 0 4 0 0 0 U. CO Denver 270 33 9 0 0 0 0 0 3 0 0 0 0 0 6 0 0 0 0 0 0 24 U. CO Health Sciences Ctr. 174 43 34 34 0 34 0 0 0 0 0 0 0 0 0 0 0 0 0 0 0 9
70

TABLE 12. Doctorates awarded, by state, institution, and major field: 2004
S&E All All
rank fields S&E S&ETotal Chem
ical
Civil
Chem
istry
Phys
ics an
d as
trono
my
Non-
Physical sciences Engineering
Comp
uter s
cienc
es
Agricultural andbiological sciences
Psyc
holog
y
State and institution Total Agric
ultur
al
Biolo
gical
Othe
r
Total Mech
anica
l
Othe
r
Socia
l scie
nces
Earth
, atm
osph
eric,
and
ocea
n scie
nces
Mathe
matic
s
Elec
trical
U. Denver 196 77 25 1 0 1 0 0 0 1 0 1 0 12 10 1 0 0 1 0 0 52 U. Northern CO 263 65 10 1 0 1 0 0 1 2 2 0 0 4 2 0 0 0 0 0 0 55
na . . . . . . . . . . . . . . . . . . . . . Connecticut 22 613 388 135 7 128 11 4 18 55 39 16 0 41 75 49 10 2 16 6 15 225 U. CT 47 257 170 56 4 52 6 0 6 19 17 2 0 32 23 28 6 2 7 3 10 87 U. Hartford 354 15 0 0 0 0 0 0 0 0 0 0 0 0 0 0 0 0 0 0 0 15 U. New Haven 354 1 0 0 0 0 0 0 0 0 0 0 0 0 0 0 0 0 0 0 0 1 Wesleyan U. 263 13 10 5 0 5 0 0 0 5 3 2 0 0 0 0 0 0 0 0 0 3 Yale U. 35 327 208 74 3 71 5 4 12 31 19 12 0 9 52 21 4 0 9 3 5 119
na . . . . . . . . . . . . . . . . . . . . . Delaware 38 199 141 16 8 8 5 9 5 20 15 3 2 3 34 49 17 7 5 2 18 58 U. DE 59 178 141 16 8 8 5 9 5 20 15 3 2 3 34 49 17 7 5 2 18 37 Wilmington C. (New Castle, DE) 354 21 0 0 0 0 0 0 0 0 0 0 0 0 0 0 0 0 0 0 0 21
na . . . . . . . . . . . . . . . . . . . . . District of Columbia 26 515 298 51 0 51 10 1 6 21 16 5 0 55 107 47 0 1 11 2 33 217 American U. 139 59 49 0 0 0 0 0 1 6 5 1 0 8 34 0 0 0 0 0 0 10 Catholic U. America, The 193 75 26 1 0 1 0 0 0 4 2 2 0 10 7 4 0 0 3 0 1 49 Gallaudet U. 305 8 4 0 0 0 0 0 0 0 0 0 0 4 0 0 0 0 0 0 0 4 George Washington U. 75 214 117 16 0 16 10 1 4 5 3 2 0 13 28 40 0 1 7 1 31 97 Georgetown U. 151 71 45 21 0 21 0 0 0 2 2 0 0 1 21 0 0 0 0 0 0 26 Howard U. 122 88 57 13 0 13 0 0 1 4 4 0 0 19 17 3 0 0 1 1 1 31
na . . . . . . . . . . . . . . . . . . . . . Florida 9 2,378 991 206 47 159 75 30 21 112 66 45 1 219 105 223 13 39 55 23 93 1,387 Barry U. 283 34 7 0 0 0 1 0 0 0 0 0 0 6 0 0 0 0 0 0 0 27 FL A&M U. 296 23 5 2 0 2 0 0 0 1 1 0 0 0 0 2 0 0 0 2 0 18 FL Atlantic U. 215 51 21 4 0 4 1 0 0 3 0 3 0 1 2 10 0 1 5 2 2 30 FL Institute of Technology 196 29 25 6 1 5 5 1 2 0 0 0 0 2 0 9 0 1 5 0 3 4 FL International U. 165 78 38 9 0 9 3 1 0 3 3 0 0 4 8 10 0 7 2 1 0 40 FL State U. 77 268 112 10 0 10 6 12 7 23 10 12 1 23 22 9 0 2 1 3 3 156 Lynn U. 354 14 0 0 0 0 0 0 0 0 0 0 0 0 0 0 0 0 0 0 0 14 Nova Southeastern U. 77 645 112 0 0 0 35 0 0 0 0 0 0 67 8 2 0 0 2 0 0 533 U. Sarasota 128 269 54 0 0 0 7 0 0 0 0 0 0 46 1 0 0 0 0 0 0 215
na . . . . . . . . . . . . . . . . . . . . . U. Central FL 106 137 75 1 0 1 6 0 4 10 0 10 0 9 7 38 0 7 14 6 11 62 U. FL 10 522 380 129 46 83 7 3 5 57 38 19 0 24 41 114 7 11 18 9 69 142 U. Miami 109 113 71 29 0 29 0 11 2 5 4 1 0 8 9 7 0 2 3 0 2 42 U. South FL 97 170 90 16 0 16 4 2 1 10 10 0 0 29 6 22 6 8 5 0 3 80 U. West FL 342 25 1 0 0 0 0 0 0 0 0 0 0 0 1 0 0 0 0 0 0 24
na . . . . . . . . . . . . . . . . . . . . . Georgia 12 1,076 655 170 37 133 16 14 21 60 50 10 0 69 70 235 16 18 102 32 67 421 Clark Atlanta U. 319 30 3 1 0 1 0 0 0 2 2 0 0 0 0 0 0 0 0 0 0 27 Emory U. 95 162 92 40 0 40 0 0 6 13 13 0 0 11 22 0 0 0 0 0 0 70
71
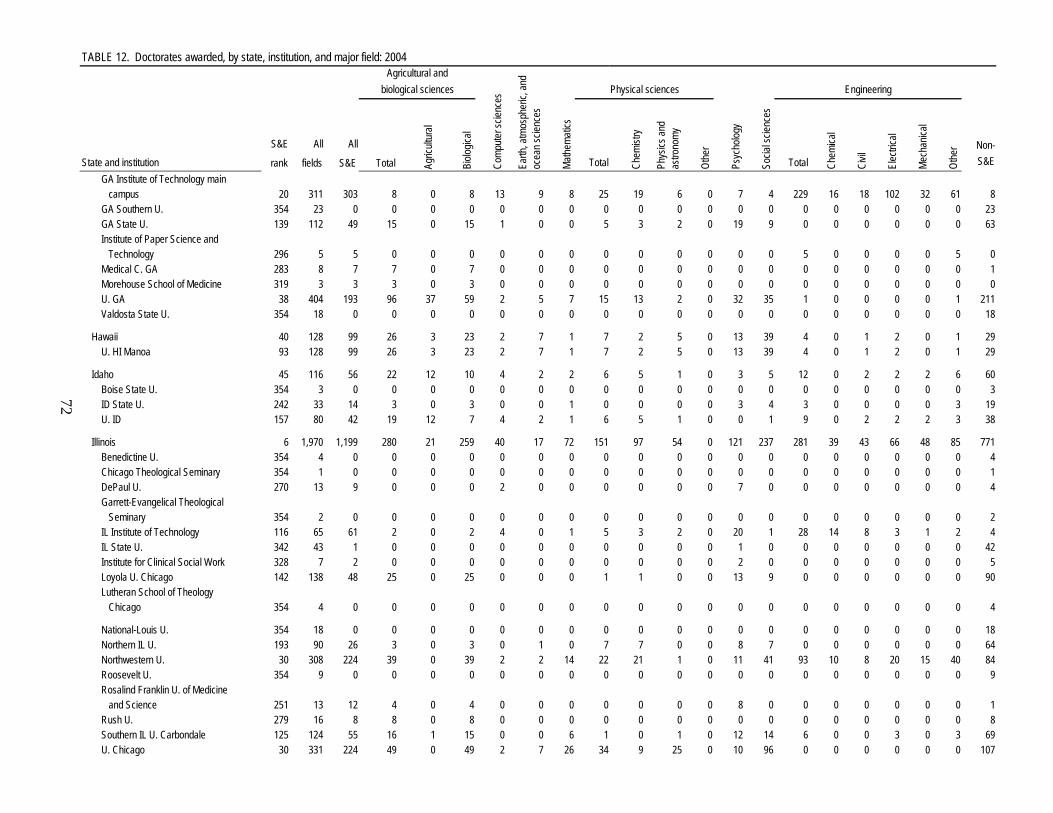
TABLE 12. Doctorates awarded, by state, institution, and major field: 2004
S&E All All
rank fields S&E S&ETotal Chem
ical
Civil
Chem
istry
Phys
ics an
d as
trono
my
Non-
Physical sciences Engineering
Comp
uter s
cienc
es
Agricultural andbiological sciences
Psyc
holog
y
State and institution Total Agric
ultur
al
Biolo
gical
Othe
r
Total Mech
anica
l
Othe
r
Socia
l scie
nces
Earth
, atm
osph
eric,
and
ocea
n scie
nces
Mathe
matic
s
Elec
trical
GA Institute of Technology main campus 20 311 303 8 0 8 13 9 8 25 19 6 0 7 4 229 16 18 102 32 61 8 GA Southern U. 354 23 0 0 0 0 0 0 0 0 0 0 0 0 0 0 0 0 0 0 0 23 GA State U. 139 112 49 15 0 15 1 0 0 5 3 2 0 19 9 0 0 0 0 0 0 63 Institute of Paper Science and Technology 296 5 5 0 0 0 0 0 0 0 0 0 0 0 0 5 0 0 0 0 5 0 Medical C. GA 283 8 7 7 0 7 0 0 0 0 0 0 0 0 0 0 0 0 0 0 0 1 Morehouse School of Medicine 319 3 3 3 0 3 0 0 0 0 0 0 0 0 0 0 0 0 0 0 0 0 U. GA 38 404 193 96 37 59 2 5 7 15 13 2 0 32 35 1 0 0 0 0 1 211 Valdosta State U. 354 18 0 0 0 0 0 0 0 0 0 0 0 0 0 0 0 0 0 0 0 18
na . . . . . . . . . . . . . . . . . . . . . Hawaii 40 128 99 26 3 23 2 7 1 7 2 5 0 13 39 4 0 1 2 0 1 29 U. HI Manoa 93 128 99 26 3 23 2 7 1 7 2 5 0 13 39 4 0 1 2 0 1 29
na . . . . . . . . . . . . . . . . . . . . . Idaho 45 116 56 22 12 10 4 2 2 6 5 1 0 3 5 12 0 2 2 2 6 60 Boise State U. 354 3 0 0 0 0 0 0 0 0 0 0 0 0 0 0 0 0 0 0 0 3 ID State U. 242 33 14 3 0 3 0 0 1 0 0 0 0 3 4 3 0 0 0 0 3 19 U. ID 157 80 42 19 12 7 4 2 1 6 5 1 0 0 1 9 0 2 2 2 3 38
na . . . . . . . . . . . . . . . . . . . . . Illinois 6 1,970 1,199 280 21 259 40 17 72 151 97 54 0 121 237 281 39 43 66 48 85 771 Benedictine U. 354 4 0 0 0 0 0 0 0 0 0 0 0 0 0 0 0 0 0 0 0 4 Chicago Theological Seminary 354 1 0 0 0 0 0 0 0 0 0 0 0 0 0 0 0 0 0 0 0 1 DePaul U. 270 13 9 0 0 0 2 0 0 0 0 0 0 7 0 0 0 0 0 0 0 4 Garrett-Evangelical Theological Seminary 354 2 0 0 0 0 0 0 0 0 0 0 0 0 0 0 0 0 0 0 0 2 IL Institute of Technology 116 65 61 2 0 2 4 0 1 5 3 2 0 20 1 28 14 8 3 1 2 4 IL State U. 342 43 1 0 0 0 0 0 0 0 0 0 0 1 0 0 0 0 0 0 0 42 Institute for Clinical Social Work 328 7 2 0 0 0 0 0 0 0 0 0 0 2 0 0 0 0 0 0 0 5 Loyola U. Chicago 142 138 48 25 0 25 0 0 0 1 1 0 0 13 9 0 0 0 0 0 0 90 Lutheran School of Theology Chicago 354 4 0 0 0 0 0 0 0 0 0 0 0 0 0 0 0 0 0 0 0 4
na . . . . . . . . . . . . . . . . . . . . . National-Louis U. 354 18 0 0 0 0 0 0 0 0 0 0 0 0 0 0 0 0 0 0 0 18 Northern IL U. 193 90 26 3 0 3 0 1 0 7 7 0 0 8 7 0 0 0 0 0 0 64 Northwestern U. 30 308 224 39 0 39 2 2 14 22 21 1 0 11 41 93 10 8 20 15 40 84 Roosevelt U. 354 9 0 0 0 0 0 0 0 0 0 0 0 0 0 0 0 0 0 0 0 9 Rosalind Franklin U. of Medicine and Science 251 13 12 4 0 4 0 0 0 0 0 0 0 8 0 0 0 0 0 0 0 1 Rush U. 279 16 8 8 0 8 0 0 0 0 0 0 0 0 0 0 0 0 0 0 0 8 Southern IL U. Carbondale 125 124 55 16 1 15 0 0 6 1 0 1 0 12 14 6 0 0 3 0 3 69 U. Chicago 30 331 224 49 0 49 2 7 26 34 9 25 0 10 96 0 0 0 0 0 0 107
72
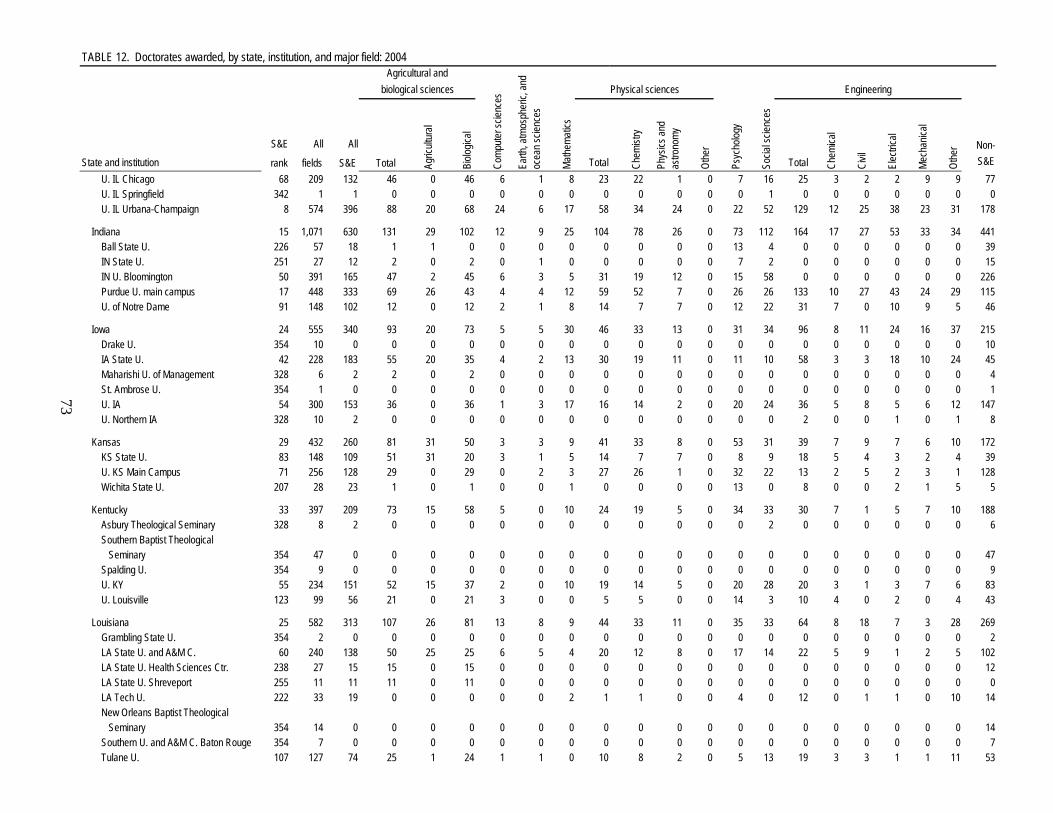
TABLE 12. Doctorates awarded, by state, institution, and major field: 2004
S&E All All
rank fields S&E S&ETotal Chem
ical
Civil
Chem
istry
Phys
ics an
d as
trono
my
Non-
Physical sciences Engineering
Comp
uter s
cienc
es
Agricultural andbiological sciences
Psyc
holog
y
State and institution Total Agric
ultur
al
Biolo
gical
Othe
r
Total Mech
anica
l
Othe
r
Socia
l scie
nces
Earth
, atm
osph
eric,
and
ocea
n scie
nces
Mathe
matic
s
Elec
trical
U. IL Chicago 68 209 132 46 0 46 6 1 8 23 22 1 0 7 16 25 3 2 2 9 9 77 U. IL Springfield 342 1 1 0 0 0 0 0 0 0 0 0 0 0 1 0 0 0 0 0 0 0 U. IL Urbana-Champaign 8 574 396 88 20 68 24 6 17 58 34 24 0 22 52 129 12 25 38 23 31 178
na . . . . . . . . . . . . . . . . . . . . . Indiana 15 1,071 630 131 29 102 12 9 25 104 78 26 0 73 112 164 17 27 53 33 34 441 Ball State U. 226 57 18 1 1 0 0 0 0 0 0 0 0 13 4 0 0 0 0 0 0 39 IN State U. 251 27 12 2 0 2 0 1 0 0 0 0 0 7 2 0 0 0 0 0 0 15 IN U. Bloomington 50 391 165 47 2 45 6 3 5 31 19 12 0 15 58 0 0 0 0 0 0 226 Purdue U. main campus 17 448 333 69 26 43 4 4 12 59 52 7 0 26 26 133 10 27 43 24 29 115 U. of Notre Dame 91 148 102 12 0 12 2 1 8 14 7 7 0 12 22 31 7 0 10 9 5 46
na . . . . . . . . . . . . . . . . . . . . . Iowa 24 555 340 93 20 73 5 5 30 46 33 13 0 31 34 96 8 11 24 16 37 215 Drake U. 354 10 0 0 0 0 0 0 0 0 0 0 0 0 0 0 0 0 0 0 0 10 IA State U. 42 228 183 55 20 35 4 2 13 30 19 11 0 11 10 58 3 3 18 10 24 45 Maharishi U. of Management 328 6 2 2 0 2 0 0 0 0 0 0 0 0 0 0 0 0 0 0 0 4 St. Ambrose U. 354 1 0 0 0 0 0 0 0 0 0 0 0 0 0 0 0 0 0 0 0 1 U. IA 54 300 153 36 0 36 1 3 17 16 14 2 0 20 24 36 5 8 5 6 12 147 U. Northern IA 328 10 2 0 0 0 0 0 0 0 0 0 0 0 0 2 0 0 1 0 1 8
na . . . . . . . . . . . . . . . . . . . . . Kansas 29 432 260 81 31 50 3 3 9 41 33 8 0 53 31 39 7 9 7 6 10 172 KS State U. 83 148 109 51 31 20 3 1 5 14 7 7 0 8 9 18 5 4 3 2 4 39 U. KS Main Campus 71 256 128 29 0 29 0 2 3 27 26 1 0 32 22 13 2 5 2 3 1 128 Wichita State U. 207 28 23 1 0 1 0 0 1 0 0 0 0 13 0 8 0 0 2 1 5 5
na . . . . . . . . . . . . . . . . . . . . . Kentucky 33 397 209 73 15 58 5 0 10 24 19 5 0 34 33 30 7 1 5 7 10 188 Asbury Theological Seminary 328 8 2 0 0 0 0 0 0 0 0 0 0 0 2 0 0 0 0 0 0 6 Southern Baptist Theological Seminary 354 47 0 0 0 0 0 0 0 0 0 0 0 0 0 0 0 0 0 0 0 47 Spalding U. 354 9 0 0 0 0 0 0 0 0 0 0 0 0 0 0 0 0 0 0 0 9 U. KY 55 234 151 52 15 37 2 0 10 19 14 5 0 20 28 20 3 1 3 7 6 83 U. Louisville 123 99 56 21 0 21 3 0 0 5 5 0 0 14 3 10 4 0 2 0 4 43
na . . . . . . . . . . . . . . . . . . . . . Louisiana 25 582 313 107 26 81 13 8 9 44 33 11 0 35 33 64 8 18 7 3 28 269 Grambling State U. 354 2 0 0 0 0 0 0 0 0 0 0 0 0 0 0 0 0 0 0 0 2 LA State U. and A&M C. 60 240 138 50 25 25 6 5 4 20 12 8 0 17 14 22 5 9 1 2 5 102 LA State U. Health Sciences Ctr. 238 27 15 15 0 15 0 0 0 0 0 0 0 0 0 0 0 0 0 0 0 12 LA State U. Shreveport 255 11 11 11 0 11 0 0 0 0 0 0 0 0 0 0 0 0 0 0 0 0 LA Tech U. 222 33 19 0 0 0 0 0 2 1 1 0 0 4 0 12 0 1 1 0 10 14 New Orleans Baptist Theological Seminary 354 14 0 0 0 0 0 0 0 0 0 0 0 0 0 0 0 0 0 0 0 14 Southern U. and A&M C. Baton Rouge 354 7 0 0 0 0 0 0 0 0 0 0 0 0 0 0 0 0 0 0 0 7 Tulane U. 107 127 74 25 1 24 1 1 0 10 8 2 0 5 13 19 3 3 1 1 11 53
73
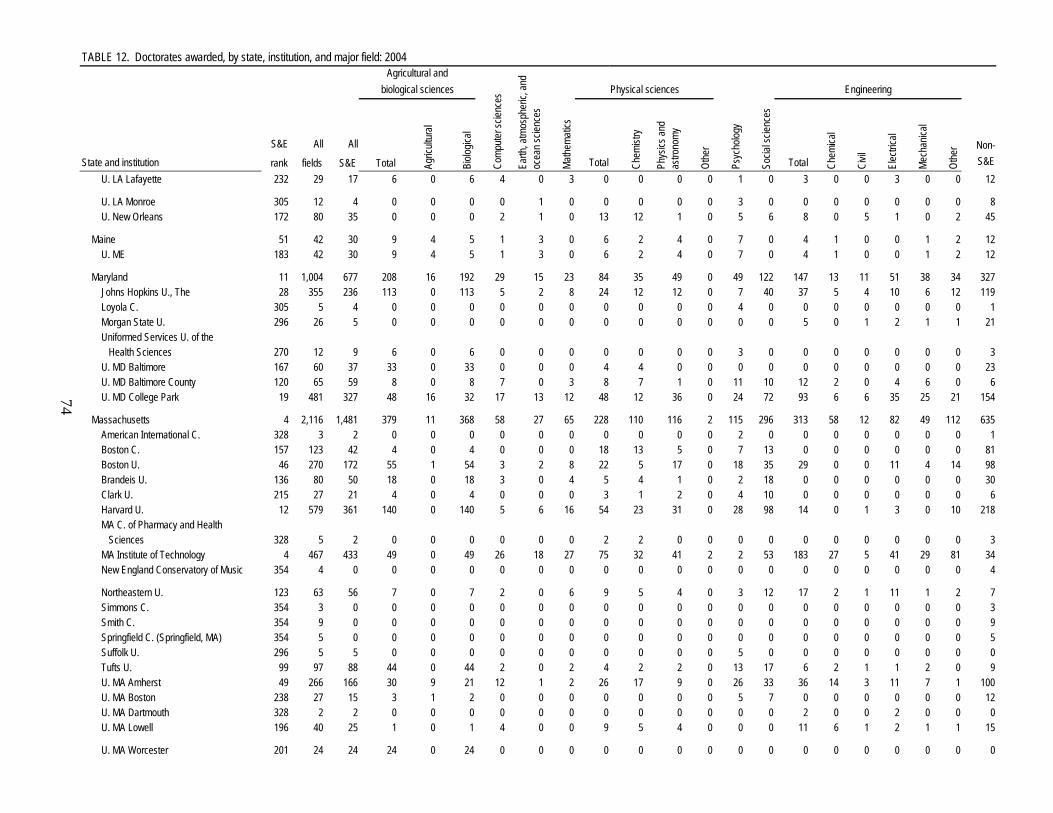
TABLE 12. Doctorates awarded, by state, institution, and major field: 2004
S&E All All
rank fields S&E S&ETotal Chem
ical
Civil
Chem
istry
Phys
ics an
d as
trono
my
Non-
Physical sciences Engineering
Comp
uter s
cienc
es
Agricultural andbiological sciences
Psyc
holog
y
State and institution Total Agric
ultur
al
Biolo
gical
Othe
r
Total Mech
anica
l
Othe
r
Socia
l scie
nces
Earth
, atm
osph
eric,
and
ocea
n scie
nces
Mathe
matic
s
Elec
trical
U. LA Lafayette 232 29 17 6 0 6 4 0 3 0 0 0 0 1 0 3 0 0 3 0 0 12na . . . . . . . . . . . . . . . . . . . . .
U. LA Monroe 305 12 4 0 0 0 0 1 0 0 0 0 0 3 0 0 0 0 0 0 0 8 U. New Orleans 172 80 35 0 0 0 2 1 0 13 12 1 0 5 6 8 0 5 1 0 2 45
na . . . . . . . . . . . . . . . . . . . . . Maine 51 42 30 9 4 5 1 3 0 6 2 4 0 7 0 4 1 0 0 1 2 12 U. ME 183 42 30 9 4 5 1 3 0 6 2 4 0 7 0 4 1 0 0 1 2 12
na . . . . . . . . . . . . . . . . . . . . . Maryland 11 1,004 677 208 16 192 29 15 23 84 35 49 0 49 122 147 13 11 51 38 34 327 Johns Hopkins U., The 28 355 236 113 0 113 5 2 8 24 12 12 0 7 40 37 5 4 10 6 12 119 Loyola C. 305 5 4 0 0 0 0 0 0 0 0 0 0 4 0 0 0 0 0 0 0 1 Morgan State U. 296 26 5 0 0 0 0 0 0 0 0 0 0 0 0 5 0 1 2 1 1 21 Uniformed Services U. of the Health Sciences 270 12 9 6 0 6 0 0 0 0 0 0 0 3 0 0 0 0 0 0 0 3 U. MD Baltimore 167 60 37 33 0 33 0 0 0 4 4 0 0 0 0 0 0 0 0 0 0 23 U. MD Baltimore County 120 65 59 8 0 8 7 0 3 8 7 1 0 11 10 12 2 0 4 6 0 6 U. MD College Park 19 481 327 48 16 32 17 13 12 48 12 36 0 24 72 93 6 6 35 25 21 154
na . . . . . . . . . . . . . . . . . . . . . Massachusetts 4 2,116 1,481 379 11 368 58 27 65 228 110 116 2 115 296 313 58 12 82 49 112 635 American International C. 328 3 2 0 0 0 0 0 0 0 0 0 0 2 0 0 0 0 0 0 0 1 Boston C. 157 123 42 4 0 4 0 0 0 18 13 5 0 7 13 0 0 0 0 0 0 81 Boston U. 46 270 172 55 1 54 3 2 8 22 5 17 0 18 35 29 0 0 11 4 14 98 Brandeis U. 136 80 50 18 0 18 3 0 4 5 4 1 0 2 18 0 0 0 0 0 0 30 Clark U. 215 27 21 4 0 4 0 0 0 3 1 2 0 4 10 0 0 0 0 0 0 6 Harvard U. 12 579 361 140 0 140 5 6 16 54 23 31 0 28 98 14 0 1 3 0 10 218 MA C. of Pharmacy and Health Sciences 328 5 2 0 0 0 0 0 0 2 2 0 0 0 0 0 0 0 0 0 0 3 MA Institute of Technology 4 467 433 49 0 49 26 18 27 75 32 41 2 2 53 183 27 5 41 29 81 34 New England Conservatory of Music 354 4 0 0 0 0 0 0 0 0 0 0 0 0 0 0 0 0 0 0 0 4
na . . . . . . . . . . . . . . . . . . . . . Northeastern U. 123 63 56 7 0 7 2 0 6 9 5 4 0 3 12 17 2 1 11 1 2 7 Simmons C. 354 3 0 0 0 0 0 0 0 0 0 0 0 0 0 0 0 0 0 0 0 3 Smith C. 354 9 0 0 0 0 0 0 0 0 0 0 0 0 0 0 0 0 0 0 0 9 Springfield C. (Springfield, MA) 354 5 0 0 0 0 0 0 0 0 0 0 0 0 0 0 0 0 0 0 0 5 Suffolk U. 296 5 5 0 0 0 0 0 0 0 0 0 0 5 0 0 0 0 0 0 0 0 Tufts U. 99 97 88 44 0 44 2 0 2 4 2 2 0 13 17 6 2 1 1 2 0 9 U. MA Amherst 49 266 166 30 9 21 12 1 2 26 17 9 0 26 33 36 14 3 11 7 1 100 U. MA Boston 238 27 15 3 1 2 0 0 0 0 0 0 0 5 7 0 0 0 0 0 0 12 U. MA Dartmouth 328 2 2 0 0 0 0 0 0 0 0 0 0 0 0 2 0 0 2 0 0 0 U. MA Lowell 196 40 25 1 0 1 4 0 0 9 5 4 0 0 0 11 6 1 2 1 1 15
na . . . . . . . . . . . . . . . . . . . . . U. MA Worcester 201 24 24 24 0 24 0 0 0 0 0 0 0 0 0 0 0 0 0 0 0 0
74

TABLE 12. Doctorates awarded, by state, institution, and major field: 2004
S&E All All
rank fields S&E S&ETotal Chem
ical
Civil
Chem
istry
Phys
ics an
d as
trono
my
Non-
Physical sciences Engineering
Comp
uter s
cienc
es
Agricultural andbiological sciences
Psyc
holog
y
State and institution Total Agric
ultur
al
Biolo
gical
Othe
r
Total Mech
anica
l
Othe
r
Socia
l scie
nces
Earth
, atm
osph
eric,
and
ocea
n scie
nces
Mathe
matic
s
Elec
trical
Worcester Polytechnic Institute 232 17 17 0 0 0 1 0 0 1 1 0 0 0 0 15 7 0 0 5 3 0na . . . . . . . . . . . . . . . . . . . . .
Michigan 7 1,494 1,012 248 52 196 23 11 42 123 71 52 0 117 175 273 29 20 73 59 92 482 Andrews U. 279 33 8 0 0 0 0 0 0 0 0 0 0 6 1 1 0 0 0 0 1 25 Calvin C. 354 3 0 0 0 0 0 0 0 0 0 0 0 0 0 0 0 0 0 0 0 3 Central MI U. 263 14 10 0 0 0 0 0 2 0 0 0 0 8 0 0 0 0 0 0 0 4 Eastern MI U. 354 12 0 0 0 0 0 0 0 0 0 0 0 0 0 0 0 0 0 0 0 12 MI State U. 21 422 286 93 40 53 6 2 9 33 19 14 0 31 68 44 6 8 11 8 11 136 MI Technological U. 172 42 35 9 3 6 1 1 2 5 1 4 0 0 0 17 3 4 1 7 2 7 Oakland U. 226 28 18 4 0 4 1 0 1 1 1 0 0 0 0 11 0 0 1 0 10 10 U. Detroit Mercy 255 11 11 0 0 0 0 0 0 0 0 0 0 10 0 1 0 0 0 1 0 0 U. MI Ann Arbor 2 658 474 103 8 95 11 5 19 64 38 26 0 33 69 170 14 7 56 36 57 184
na . . . . . . . . . . . . . . . . . . . . . Wayne State U. 72 196 121 36 0 36 3 0 4 16 12 4 0 21 14 27 6 1 4 6 10 75 Western MI U. 139 75 49 3 1 2 1 3 5 4 0 4 0 8 23 2 0 0 0 1 1 26
na . . . . . . . . . . . . . . . . . . . . . Minnesota 21 755 419 106 23 83 18 11 10 48 31 17 0 75 69 82 12 7 20 17 26 336 Hamline U. 342 4 1 0 0 0 0 0 0 0 0 0 0 0 1 0 0 0 0 0 0 3 Luther Northwestern Theological Seminary 342 8 1 0 0 0 0 0 0 0 0 0 0 1 0 0 0 0 0 0 0 7 Mayo School of Health-Related Sciences 201 24 24 22 0 22 0 0 1 0 0 0 0 0 0 1 0 0 0 0 1 0 St. Mary's U. MN 354 19 0 0 0 0 0 0 0 0 0 0 0 0 0 0 0 0 0 0 0 19 U. MN Twin Cities 15 565 345 83 23 60 18 11 9 48 31 17 0 35 60 81 12 7 20 17 25 220 U. of St. Thomas (St. Paul, MN) 342 27 1 0 0 0 0 0 0 0 0 0 0 0 1 0 0 0 0 0 0 26 Walden U. 146 108 47 1 0 1 0 0 0 0 0 0 0 39 7 0 0 0 0 0 0 61
na . . . . . . . . . . . . . . . . . . . . . Mississippi 35 357 165 53 24 29 4 4 3 27 22 5 0 31 23 20 3 3 8 2 4 192 Delta State U. 354 6 0 0 0 0 0 0 0 0 0 0 0 0 0 0 0 0 0 0 0 6 Jackson State U. 222 41 19 4 4 0 0 0 0 0 0 0 0 9 6 0 0 0 0 0 0 22 MS State U. 149 85 46 24 18 6 2 0 1 1 1 0 0 1 7 10 0 0 5 2 3 39 U. MS main campus 183 72 30 2 0 2 1 1 1 11 8 3 0 5 3 6 0 3 3 0 0 42 U. Southern MS 121 139 58 12 2 10 1 3 1 14 12 2 0 16 7 4 3 0 0 0 1 81 U. MS Medical Ctr. 251 14 12 11 0 11 0 0 0 1 1 0 0 0 0 0 0 0 0 0 0 2
na . . . . . . . . . . . . . . . . . . . . . Missouri 20 726 438 139 16 123 12 11 13 62 43 19 0 69 58 74 2 14 12 11 35 288 Concordia Seminary 354 1 0 0 0 0 0 0 0 0 0 0 0 0 0 0 0 0 0 0 0 1 St. Louis U. main campus 132 123 52 19 0 19 0 3 0 0 0 0 0 21 8 1 0 1 0 0 0 71 U. MO-Columbia 66 258 135 42 16 26 5 3 7 16 9 7 0 25 23 14 1 2 1 2 8 123 U. MO-Kansas City 183 62 30 6 0 6 4 0 0 4 4 0 0 10 5 1 0 1 0 0 0 32 U. MO-Rolla 116 61 61 0 0 0 0 4 1 16 11 5 0 0 0 40 0 8 8 7 17 0 U. MO-St. Louis 207 39 23 8 0 8 0 0 0 5 5 0 0 6 4 0 0 0 0 0 0 16
75

TABLE 12. Doctorates awarded, by state, institution, and major field: 2004
S&E All All
rank fields S&E S&ETotal Chem
ical
Civil
Chem
istry
Phys
ics an
d as
trono
my
Non-
Physical sciences Engineering
Comp
uter s
cienc
es
Agricultural andbiological sciences
Psyc
holog
y
State and institution Total Agric
ultur
al
Biolo
gical
Othe
r
Total Mech
anica
l
Othe
r
Socia
l scie
nces
Earth
, atm
osph
eric,
and
ocea
n scie
nces
Mathe
matic
s
Elec
trical
Washington U. St. Louis 63 182 137 64 0 64 3 1 5 21 14 7 0 7 18 18 1 2 3 2 10 45na . . . . . . . . . . . . . . . . . . . . .
Montana 44 79 59 33 13 20 0 2 2 14 9 5 0 6 0 2 0 1 0 0 1 20 MT State U. Bozeman 178 41 32 17 5 12 0 1 1 12 7 5 0 0 0 1 0 1 0 0 0 9 U. MT, The 191 38 27 16 8 8 0 1 1 2 2 0 0 6 0 1 0 0 0 0 1 11
na . . . . . . . . . . . . . . . . . . . . . Nebraska 37 287 150 66 26 40 2 3 2 20 10 10 0 20 17 20 2 4 2 4 8 137 Creighton U. 270 9 9 7 0 7 0 0 0 1 1 0 0 0 0 1 0 0 0 0 1 0 U. NE Lincoln 74 236 118 42 26 16 2 3 2 19 9 10 0 20 11 19 2 4 2 4 7 118 U. NE Omaha 289 15 6 0 0 0 0 0 0 0 0 0 0 0 6 0 0 0 0 0 0 9 U. NE Medical Ctr. 232 27 17 17 0 17 0 0 0 0 0 0 0 0 0 0 0 0 0 0 0 10
na . . . . . . . . . . . . . . . . . . . . . Nevada 43 125 76 16 0 16 1 10 0 6 4 2 0 21 9 13 0 4 2 5 2 49 U. NV, Las Vegas 242 48 14 3 0 3 0 2 0 0 0 0 0 0 2 7 0 1 1 5 0 34 U. NV, Reno 115 77 62 13 0 13 1 8 0 6 4 2 0 21 7 6 0 3 1 0 2 15
na . . . . . . . . . . . . . . . . . . . . . New Hampshire 42 102 91 44 2 42 8 3 4 10 5 5 0 9 2 11 2 1 2 2 4 11 Dartmouth C. 125 56 55 33 0 33 7 0 3 4 2 2 0 4 0 4 1 0 0 0 3 1 U. NH 170 46 36 11 2 9 1 3 1 6 3 3 0 5 2 7 1 1 2 2 1 10
na . . . . . . . . . . . . . . . . . . . . . New Jersey 14 943 641 143 22 121 39 15 40 98 42 56 0 62 89 155 23 12 63 15 42 302 Drew U. 342 31 1 0 0 0 0 0 0 0 0 0 0 1 0 0 0 0 0 0 0 30 Fairleigh Dickinson U. all campuses 215 21 21 0 0 0 0 0 0 0 0 0 0 21 0 0 0 0 0 0 0 0 Montclair State U. 354 4 0 0 0 0 0 0 0 0 0 0 0 0 0 0 0 0 0 0 0 4 NJ Institute of Technology 113 68 68 4 3 1 13 0 4 6 1 5 0 0 0 41 3 3 21 5 9 0 Princeton Theological Seminary 354 23 0 0 0 0 0 0 0 0 0 0 0 0 0 0 0 0 0 0 0 23 Princeton U. 34 281 211 29 0 29 13 11 16 36 12 24 0 6 50 50 13 2 26 4 5 70 Rutgers, The State U. NJ New Brunswick Campus 30 347 224 61 19 42 12 3 19 40 22 18 0 16 21 52 7 6 11 4 24 123 Rutgers, The State U. NJ Newark Campus 170 56 36 11 0 11 0 0 1 3 2 1 0 3 18 0 0 0 0 0 0 20 Seton Hall U. 222 50 19 0 0 0 0 0 0 4 4 0 0 15 0 0 0 0 0 0 0 31
na . . . . . . . . . . . . . . . . . . . . . Stevens Institute of Technology 211 23 22 0 0 0 1 1 0 8 0 8 0 0 0 12 0 1 5 2 4 1 U. of Medicine and Dentistry NJ 161 39 39 38 0 38 0 0 0 1 1 0 0 0 0 0 0 0 0 0 0 0
na . . . . . . . . . . . . . . . . . . . . . New Mexico 34 288 191 40 7 33 5 4 7 28 11 17 0 28 35 44 11 3 11 6 13 97 NM Institute of Mining and Technology 263 10 10 1 1 0 0 2 0 2 1 1 0 0 0 5 4 0 0 0 1 0 NM State U. Main Campus 149 76 46 15 6 9 1 0 2 8 3 5 0 11 0 9 3 0 1 0 5 30 U. NM all campuses 66 202 135 24 0 24 4 2 5 18 7 11 0 17 35 30 4 3 10 6 7 67
na . . . . . . . . . . . . . . . . . . . . .
76
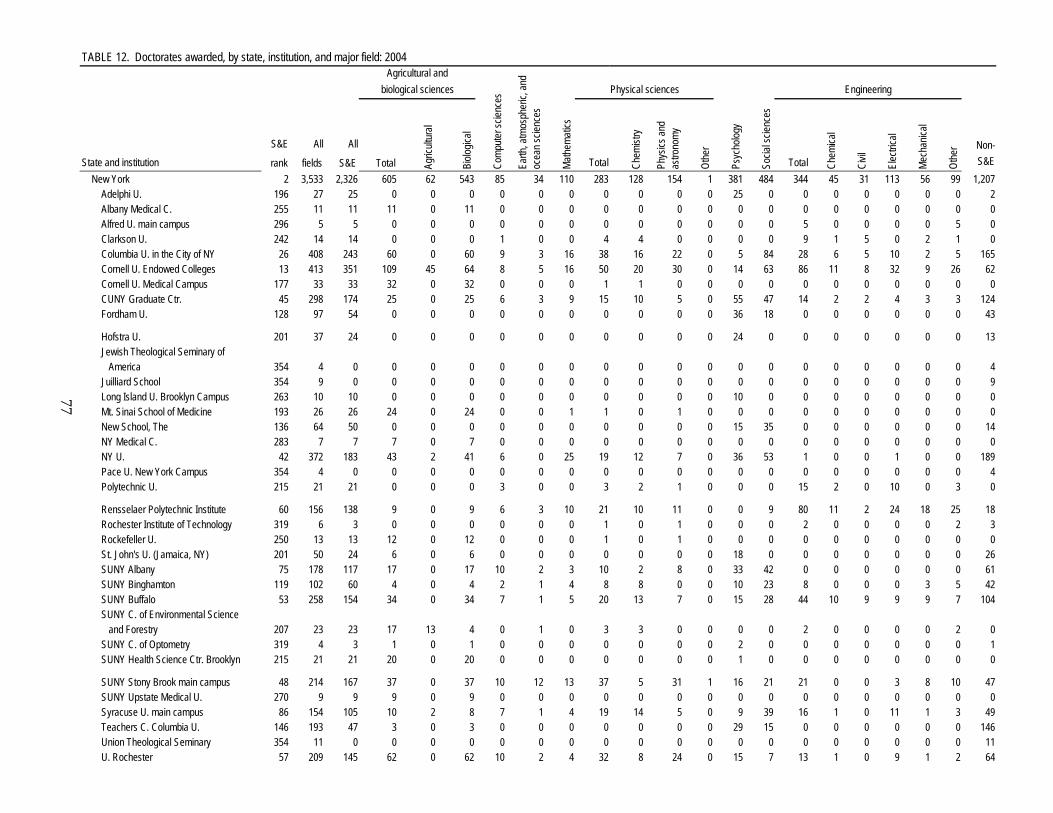
TABLE 12. Doctorates awarded, by state, institution, and major field: 2004
S&E All All
rank fields S&E S&ETotal Chem
ical
Civil
Chem
istry
Phys
ics an
d as
trono
my
Non-
Physical sciences Engineering
Comp
uter s
cienc
es
Agricultural andbiological sciences
Psyc
holog
y
State and institution Total Agric
ultur
al
Biolo
gical
Othe
r
Total Mech
anica
l
Othe
r
Socia
l scie
nces
Earth
, atm
osph
eric,
and
ocea
n scie
nces
Mathe
matic
s
Elec
trical
New York 2 3,533 2,326 605 62 543 85 34 110 283 128 154 1 381 484 344 45 31 113 56 99 1,207 Adelphi U. 196 27 25 0 0 0 0 0 0 0 0 0 0 25 0 0 0 0 0 0 0 2 Albany Medical C. 255 11 11 11 0 11 0 0 0 0 0 0 0 0 0 0 0 0 0 0 0 0 Alfred U. main campus 296 5 5 0 0 0 0 0 0 0 0 0 0 0 0 5 0 0 0 0 5 0 Clarkson U. 242 14 14 0 0 0 1 0 0 4 4 0 0 0 0 9 1 5 0 2 1 0 Columbia U. in the City of NY 26 408 243 60 0 60 9 3 16 38 16 22 0 5 84 28 6 5 10 2 5 165 Cornell U. Endowed Colleges 13 413 351 109 45 64 8 5 16 50 20 30 0 14 63 86 11 8 32 9 26 62 Cornell U. Medical Campus 177 33 33 32 0 32 0 0 0 1 1 0 0 0 0 0 0 0 0 0 0 0 CUNY Graduate Ctr. 45 298 174 25 0 25 6 3 9 15 10 5 0 55 47 14 2 2 4 3 3 124 Fordham U. 128 97 54 0 0 0 0 0 0 0 0 0 0 36 18 0 0 0 0 0 0 43
na . . . . . . . . . . . . . . . . . . . . . Hofstra U. 201 37 24 0 0 0 0 0 0 0 0 0 0 24 0 0 0 0 0 0 0 13 Jewish Theological Seminary of America 354 4 0 0 0 0 0 0 0 0 0 0 0 0 0 0 0 0 0 0 0 4 Juilliard School 354 9 0 0 0 0 0 0 0 0 0 0 0 0 0 0 0 0 0 0 0 9 Long Island U. Brooklyn Campus 263 10 10 0 0 0 0 0 0 0 0 0 0 10 0 0 0 0 0 0 0 0 Mt. Sinai School of Medicine 193 26 26 24 0 24 0 0 1 1 0 1 0 0 0 0 0 0 0 0 0 0 New School, The 136 64 50 0 0 0 0 0 0 0 0 0 0 15 35 0 0 0 0 0 0 14 NY Medical C. 283 7 7 7 0 7 0 0 0 0 0 0 0 0 0 0 0 0 0 0 0 0 NY U. 42 372 183 43 2 41 6 0 25 19 12 7 0 36 53 1 0 0 1 0 0 189 Pace U. New York Campus 354 4 0 0 0 0 0 0 0 0 0 0 0 0 0 0 0 0 0 0 0 4 Polytechnic U. 215 21 21 0 0 0 3 0 0 3 2 1 0 0 0 15 2 0 10 0 3 0
na . . . . . . . . . . . . . . . . . . . . . Rensselaer Polytechnic Institute 60 156 138 9 0 9 6 3 10 21 10 11 0 0 9 80 11 2 24 18 25 18 Rochester Institute of Technology 319 6 3 0 0 0 0 0 0 1 0 1 0 0 0 2 0 0 0 0 2 3 Rockefeller U. 250 13 13 12 0 12 0 0 0 1 0 1 0 0 0 0 0 0 0 0 0 0 St. John's U. (Jamaica, NY) 201 50 24 6 0 6 0 0 0 0 0 0 0 18 0 0 0 0 0 0 0 26 SUNY Albany 75 178 117 17 0 17 10 2 3 10 2 8 0 33 42 0 0 0 0 0 0 61 SUNY Binghamton 119 102 60 4 0 4 2 1 4 8 8 0 0 10 23 8 0 0 0 3 5 42 SUNY Buffalo 53 258 154 34 0 34 7 1 5 20 13 7 0 15 28 44 10 9 9 9 7 104 SUNY C. of Environmental Science and Forestry 207 23 23 17 13 4 0 1 0 3 3 0 0 0 0 2 0 0 0 0 2 0 SUNY C. of Optometry 319 4 3 1 0 1 0 0 0 0 0 0 0 2 0 0 0 0 0 0 0 1 SUNY Health Science Ctr. Brooklyn 215 21 21 20 0 20 0 0 0 0 0 0 0 1 0 0 0 0 0 0 0 0
na . . . . . . . . . . . . . . . . . . . . . SUNY Stony Brook main campus 48 214 167 37 0 37 10 12 13 37 5 31 1 16 21 21 0 0 3 8 10 47 SUNY Upstate Medical U. 270 9 9 9 0 9 0 0 0 0 0 0 0 0 0 0 0 0 0 0 0 0 Syracuse U. main campus 86 154 105 10 2 8 7 1 4 19 14 5 0 9 39 16 1 0 11 1 3 49 Teachers C. Columbia U. 146 193 47 3 0 3 0 0 0 0 0 0 0 29 15 0 0 0 0 0 0 146 Union Theological Seminary 354 11 0 0 0 0 0 0 0 0 0 0 0 0 0 0 0 0 0 0 0 11 U. Rochester 57 209 145 62 0 62 10 2 4 32 8 24 0 15 7 13 1 0 9 1 2 64
77
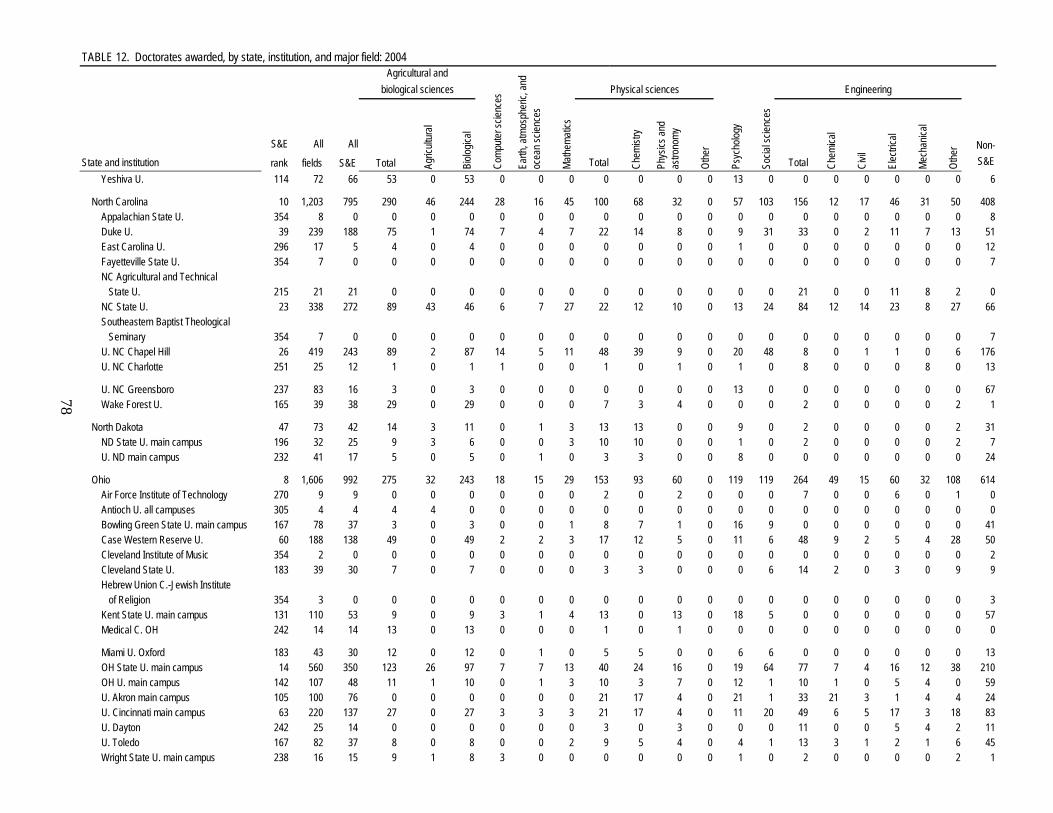
TABLE 12. Doctorates awarded, by state, institution, and major field: 2004
S&E All All
rank fields S&E S&ETotal Chem
ical
Civil
Chem
istry
Phys
ics an
d as
trono
my
Non-
Physical sciences Engineering
Comp
uter s
cienc
es
Agricultural andbiological sciences
Psyc
holog
y
State and institution Total Agric
ultur
al
Biolo
gical
Othe
r
Total Mech
anica
l
Othe
r
Socia
l scie
nces
Earth
, atm
osph
eric,
and
ocea
n scie
nces
Mathe
matic
s
Elec
trical
Yeshiva U. 114 72 66 53 0 53 0 0 0 0 0 0 0 13 0 0 0 0 0 0 0 6na . . . . . . . . . . . . . . . . . . . . .
North Carolina 10 1,203 795 290 46 244 28 16 45 100 68 32 0 57 103 156 12 17 46 31 50 408 Appalachian State U. 354 8 0 0 0 0 0 0 0 0 0 0 0 0 0 0 0 0 0 0 0 8 Duke U. 39 239 188 75 1 74 7 4 7 22 14 8 0 9 31 33 0 2 11 7 13 51 East Carolina U. 296 17 5 4 0 4 0 0 0 0 0 0 0 1 0 0 0 0 0 0 0 12 Fayetteville State U. 354 7 0 0 0 0 0 0 0 0 0 0 0 0 0 0 0 0 0 0 0 7 NC Agricultural and Technical State U. 215 21 21 0 0 0 0 0 0 0 0 0 0 0 0 21 0 0 11 8 2 0 NC State U. 23 338 272 89 43 46 6 7 27 22 12 10 0 13 24 84 12 14 23 8 27 66 Southeastern Baptist Theological Seminary 354 7 0 0 0 0 0 0 0 0 0 0 0 0 0 0 0 0 0 0 0 7 U. NC Chapel Hill 26 419 243 89 2 87 14 5 11 48 39 9 0 20 48 8 0 1 1 0 6 176 U. NC Charlotte 251 25 12 1 0 1 1 0 0 1 0 1 0 1 0 8 0 0 0 8 0 13
na . . . . . . . . . . . . . . . . . . . . . U. NC Greensboro 237 83 16 3 0 3 0 0 0 0 0 0 0 13 0 0 0 0 0 0 0 67 Wake Forest U. 165 39 38 29 0 29 0 0 0 7 3 4 0 0 0 2 0 0 0 0 2 1
na . . . . . . . . . . . . . . . . . . . . . North Dakota 47 73 42 14 3 11 0 1 3 13 13 0 0 9 0 2 0 0 0 0 2 31 ND State U. main campus 196 32 25 9 3 6 0 0 3 10 10 0 0 1 0 2 0 0 0 0 2 7 U. ND main campus 232 41 17 5 0 5 0 1 0 3 3 0 0 8 0 0 0 0 0 0 0 24
na . . . . . . . . . . . . . . . . . . . . . Ohio 8 1,606 992 275 32 243 18 15 29 153 93 60 0 119 119 264 49 15 60 32 108 614 Air Force Institute of Technology 270 9 9 0 0 0 0 0 0 2 0 2 0 0 0 7 0 0 6 0 1 0 Antioch U. all campuses 305 4 4 4 4 0 0 0 0 0 0 0 0 0 0 0 0 0 0 0 0 0 Bowling Green State U. main campus 167 78 37 3 0 3 0 0 1 8 7 1 0 16 9 0 0 0 0 0 0 41 Case Western Reserve U. 60 188 138 49 0 49 2 2 3 17 12 5 0 11 6 48 9 2 5 4 28 50 Cleveland Institute of Music 354 2 0 0 0 0 0 0 0 0 0 0 0 0 0 0 0 0 0 0 0 2 Cleveland State U. 183 39 30 7 0 7 0 0 0 3 3 0 0 0 6 14 2 0 3 0 9 9 Hebrew Union C.-Jewish Institute of Religion 354 3 0 0 0 0 0 0 0 0 0 0 0 0 0 0 0 0 0 0 0 3 Kent State U. main campus 131 110 53 9 0 9 3 1 4 13 0 13 0 18 5 0 0 0 0 0 0 57 Medical C. OH 242 14 14 13 0 13 0 0 0 1 0 1 0 0 0 0 0 0 0 0 0 0
na . . . . . . . . . . . . . . . . . . . . . Miami U. Oxford 183 43 30 12 0 12 0 1 0 5 5 0 0 6 6 0 0 0 0 0 0 13 OH State U. main campus 14 560 350 123 26 97 7 7 13 40 24 16 0 19 64 77 7 4 16 12 38 210 OH U. main campus 142 107 48 11 1 10 0 1 3 10 3 7 0 12 1 10 1 0 5 4 0 59 U. Akron main campus 105 100 76 0 0 0 0 0 0 21 17 4 0 21 1 33 21 3 1 4 4 24 U. Cincinnati main campus 63 220 137 27 0 27 3 3 3 21 17 4 0 11 20 49 6 5 17 3 18 83 U. Dayton 242 25 14 0 0 0 0 0 0 3 0 3 0 0 0 11 0 0 5 4 2 11 U. Toledo 167 82 37 8 0 8 0 0 2 9 5 4 0 4 1 13 3 1 2 1 6 45 Wright State U. main campus 238 16 15 9 1 8 3 0 0 0 0 0 0 1 0 2 0 0 0 0 2 1
78
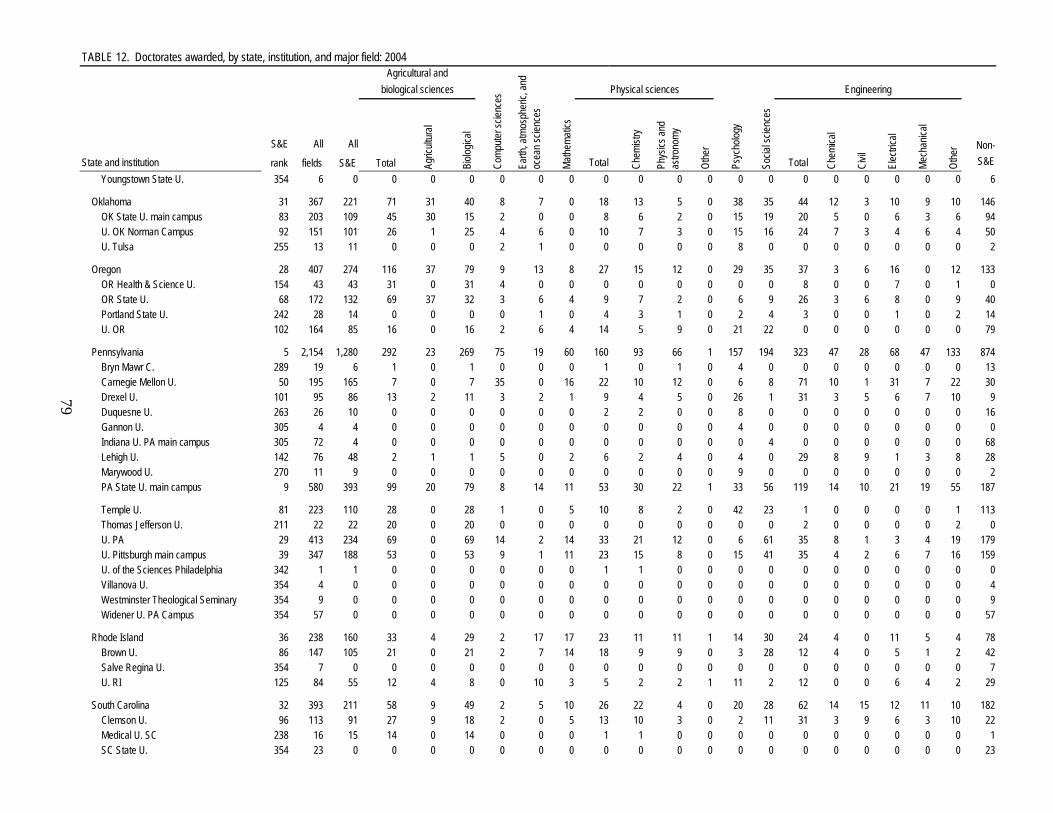
TABLE 12. Doctorates awarded, by state, institution, and major field: 2004
S&E All All
rank fields S&E S&ETotal Chem
ical
Civil
Chem
istry
Phys
ics an
d as
trono
my
Non-
Physical sciences Engineering
Comp
uter s
cienc
es
Agricultural andbiological sciences
Psyc
holog
y
State and institution Total Agric
ultur
al
Biolo
gical
Othe
r
Total Mech
anica
l
Othe
r
Socia
l scie
nces
Earth
, atm
osph
eric,
and
ocea
n scie
nces
Mathe
matic
s
Elec
trical
Youngstown State U. 354 6 0 0 0 0 0 0 0 0 0 0 0 0 0 0 0 0 0 0 0 6na . . . . . . . . . . . . . . . . . . . . .
Oklahoma 31 367 221 71 31 40 8 7 0 18 13 5 0 38 35 44 12 3 10 9 10 146 OK State U. main campus 83 203 109 45 30 15 2 0 0 8 6 2 0 15 19 20 5 0 6 3 6 94 U. OK Norman Campus 92 151 101 26 1 25 4 6 0 10 7 3 0 15 16 24 7 3 4 6 4 50 U. Tulsa 255 13 11 0 0 0 2 1 0 0 0 0 0 8 0 0 0 0 0 0 0 2
na . . . . . . . . . . . . . . . . . . . . . Oregon 28 407 274 116 37 79 9 13 8 27 15 12 0 29 35 37 3 6 16 0 12 133 OR Health & Science U. 154 43 43 31 0 31 4 0 0 0 0 0 0 0 0 8 0 0 7 0 1 0 OR State U. 68 172 132 69 37 32 3 6 4 9 7 2 0 6 9 26 3 6 8 0 9 40 Portland State U. 242 28 14 0 0 0 0 1 0 4 3 1 0 2 4 3 0 0 1 0 2 14 U. OR 102 164 85 16 0 16 2 6 4 14 5 9 0 21 22 0 0 0 0 0 0 79
na . . . . . . . . . . . . . . . . . . . . . Pennsylvania 5 2,154 1,280 292 23 269 75 19 60 160 93 66 1 157 194 323 47 28 68 47 133 874 Bryn Mawr C. 289 19 6 1 0 1 0 0 0 1 0 1 0 4 0 0 0 0 0 0 0 13 Carnegie Mellon U. 50 195 165 7 0 7 35 0 16 22 10 12 0 6 8 71 10 1 31 7 22 30 Drexel U. 101 95 86 13 2 11 3 2 1 9 4 5 0 26 1 31 3 5 6 7 10 9 Duquesne U. 263 26 10 0 0 0 0 0 0 2 2 0 0 8 0 0 0 0 0 0 0 16 Gannon U. 305 4 4 0 0 0 0 0 0 0 0 0 0 4 0 0 0 0 0 0 0 0 Indiana U. PA main campus 305 72 4 0 0 0 0 0 0 0 0 0 0 0 4 0 0 0 0 0 0 68 Lehigh U. 142 76 48 2 1 1 5 0 2 6 2 4 0 4 0 29 8 9 1 3 8 28 Marywood U. 270 11 9 0 0 0 0 0 0 0 0 0 0 9 0 0 0 0 0 0 0 2 PA State U. main campus 9 580 393 99 20 79 8 14 11 53 30 22 1 33 56 119 14 10 21 19 55 187
na . . . . . . . . . . . . . . . . . . . . . Temple U. 81 223 110 28 0 28 1 0 5 10 8 2 0 42 23 1 0 0 0 0 1 113 Thomas Jefferson U. 211 22 22 20 0 20 0 0 0 0 0 0 0 0 0 2 0 0 0 0 2 0 U. PA 29 413 234 69 0 69 14 2 14 33 21 12 0 6 61 35 8 1 3 4 19 179 U. Pittsburgh main campus 39 347 188 53 0 53 9 1 11 23 15 8 0 15 41 35 4 2 6 7 16 159 U. of the Sciences Philadelphia 342 1 1 0 0 0 0 0 0 1 1 0 0 0 0 0 0 0 0 0 0 0 Villanova U. 354 4 0 0 0 0 0 0 0 0 0 0 0 0 0 0 0 0 0 0 0 4 Westminster Theological Seminary 354 9 0 0 0 0 0 0 0 0 0 0 0 0 0 0 0 0 0 0 0 9 Widener U. PA Campus 354 57 0 0 0 0 0 0 0 0 0 0 0 0 0 0 0 0 0 0 0 57
na . . . . . . . . . . . . . . . . . . . . . Rhode Island 36 238 160 33 4 29 2 17 17 23 11 11 1 14 30 24 4 0 11 5 4 78 Brown U. 86 147 105 21 0 21 2 7 14 18 9 9 0 3 28 12 4 0 5 1 2 42 Salve Regina U. 354 7 0 0 0 0 0 0 0 0 0 0 0 0 0 0 0 0 0 0 0 7 U. RI 125 84 55 12 4 8 0 10 3 5 2 2 1 11 2 12 0 0 6 4 2 29
na . . . . . . . . . . . . . . . . . . . . . South Carolina 32 393 211 58 9 49 2 5 10 26 22 4 0 20 28 62 14 15 12 11 10 182 Clemson U. 96 113 91 27 9 18 2 0 5 13 10 3 0 2 11 31 3 9 6 3 10 22 Medical U. SC 238 16 15 14 0 14 0 0 0 1 1 0 0 0 0 0 0 0 0 0 0 1 SC State U. 354 23 0 0 0 0 0 0 0 0 0 0 0 0 0 0 0 0 0 0 0 23
79
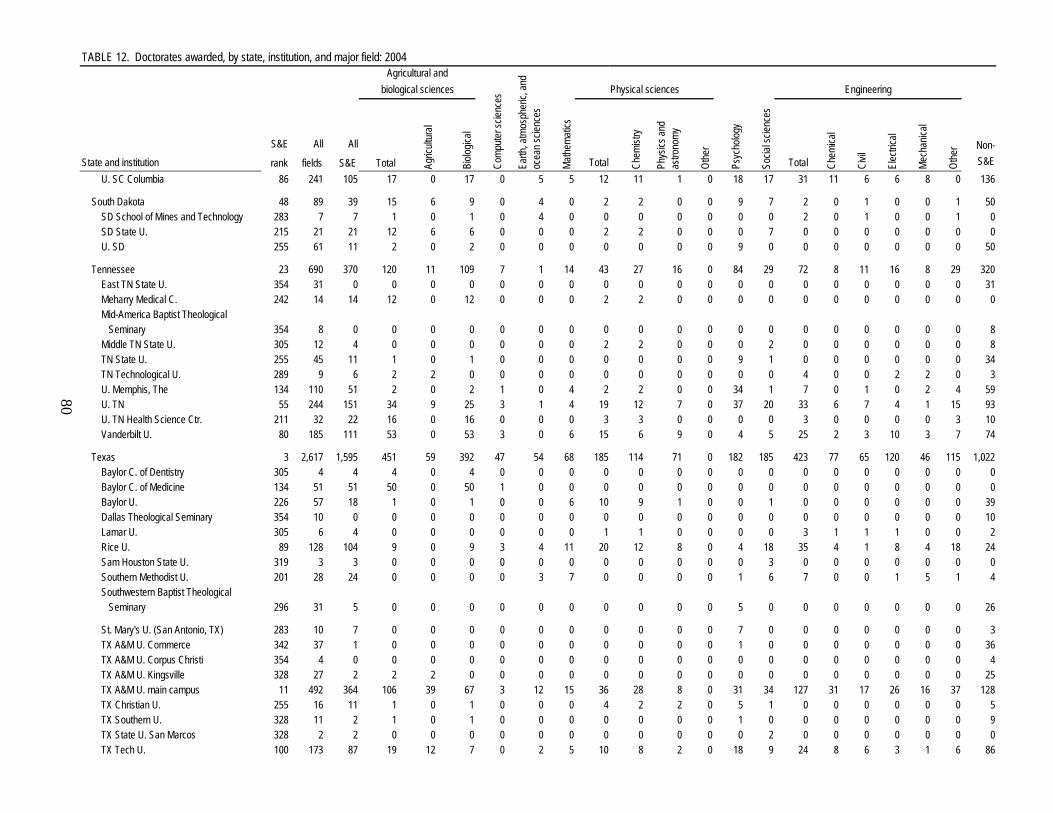
TABLE 12. Doctorates awarded, by state, institution, and major field: 2004
S&E All All
rank fields S&E S&ETotal Chem
ical
Civil
Chem
istry
Phys
ics an
d as
trono
my
Non-
Physical sciences Engineering
Comp
uter s
cienc
es
Agricultural andbiological sciences
Psyc
holog
y
State and institution Total Agric
ultur
al
Biolo
gical
Othe
r
Total Mech
anica
l
Othe
r
Socia
l scie
nces
Earth
, atm
osph
eric,
and
ocea
n scie
nces
Mathe
matic
s
Elec
trical
U. SC Columbia 86 241 105 17 0 17 0 5 5 12 11 1 0 18 17 31 11 6 6 8 0 136na . . . . . . . . . . . . . . . . . . . . .
South Dakota 48 89 39 15 6 9 0 4 0 2 2 0 0 9 7 2 0 1 0 0 1 50 SD School of Mines and Technology 283 7 7 1 0 1 0 4 0 0 0 0 0 0 0 2 0 1 0 0 1 0 SD State U. 215 21 21 12 6 6 0 0 0 2 2 0 0 0 7 0 0 0 0 0 0 0 U. SD 255 61 11 2 0 2 0 0 0 0 0 0 0 9 0 0 0 0 0 0 0 50
na . . . . . . . . . . . . . . . . . . . . . Tennessee 23 690 370 120 11 109 7 1 14 43 27 16 0 84 29 72 8 11 16 8 29 320 East TN State U. 354 31 0 0 0 0 0 0 0 0 0 0 0 0 0 0 0 0 0 0 0 31 Meharry Medical C. 242 14 14 12 0 12 0 0 0 2 2 0 0 0 0 0 0 0 0 0 0 0 Mid-America Baptist Theological Seminary 354 8 0 0 0 0 0 0 0 0 0 0 0 0 0 0 0 0 0 0 0 8 Middle TN State U. 305 12 4 0 0 0 0 0 0 2 2 0 0 0 2 0 0 0 0 0 0 8 TN State U. 255 45 11 1 0 1 0 0 0 0 0 0 0 9 1 0 0 0 0 0 0 34 TN Technological U. 289 9 6 2 2 0 0 0 0 0 0 0 0 0 0 4 0 0 2 2 0 3 U. Memphis, The 134 110 51 2 0 2 1 0 4 2 2 0 0 34 1 7 0 1 0 2 4 59 U. TN 55 244 151 34 9 25 3 1 4 19 12 7 0 37 20 33 6 7 4 1 15 93 U. TN Health Science Ctr. 211 32 22 16 0 16 0 0 0 3 3 0 0 0 0 3 0 0 0 0 3 10 Vanderbilt U. 80 185 111 53 0 53 3 0 6 15 6 9 0 4 5 25 2 3 10 3 7 74
na . . . . . . . . . . . . . . . . . . . . . Texas 3 2,617 1,595 451 59 392 47 54 68 185 114 71 0 182 185 423 77 65 120 46 115 1,022 Baylor C. of Dentistry 305 4 4 4 0 4 0 0 0 0 0 0 0 0 0 0 0 0 0 0 0 0 Baylor C. of Medicine 134 51 51 50 0 50 1 0 0 0 0 0 0 0 0 0 0 0 0 0 0 0 Baylor U. 226 57 18 1 0 1 0 0 6 10 9 1 0 0 1 0 0 0 0 0 0 39 Dallas Theological Seminary 354 10 0 0 0 0 0 0 0 0 0 0 0 0 0 0 0 0 0 0 0 10 Lamar U. 305 6 4 0 0 0 0 0 0 1 1 0 0 0 0 3 1 1 1 0 0 2 Rice U. 89 128 104 9 0 9 3 4 11 20 12 8 0 4 18 35 4 1 8 4 18 24 Sam Houston State U. 319 3 3 0 0 0 0 0 0 0 0 0 0 0 3 0 0 0 0 0 0 0 Southern Methodist U. 201 28 24 0 0 0 0 3 7 0 0 0 0 1 6 7 0 0 1 5 1 4 Southwestern Baptist Theological Seminary 296 31 5 0 0 0 0 0 0 0 0 0 0 5 0 0 0 0 0 0 0 26
na . . . . . . . . . . . . . . . . . . . . . St. Mary's U. (San Antonio, TX) 283 10 7 0 0 0 0 0 0 0 0 0 0 7 0 0 0 0 0 0 0 3 TX A&M U. Commerce 342 37 1 0 0 0 0 0 0 0 0 0 0 1 0 0 0 0 0 0 0 36 TX A&M U. Corpus Christi 354 4 0 0 0 0 0 0 0 0 0 0 0 0 0 0 0 0 0 0 0 4 TX A&M U. Kingsville 328 27 2 2 2 0 0 0 0 0 0 0 0 0 0 0 0 0 0 0 0 25 TX A&M U. main campus 11 492 364 106 39 67 3 12 15 36 28 8 0 31 34 127 31 17 26 16 37 128 TX Christian U. 255 16 11 1 0 1 0 0 0 4 2 2 0 5 1 0 0 0 0 0 0 5 TX Southern U. 328 11 2 1 0 1 0 0 0 0 0 0 0 1 0 0 0 0 0 0 0 9 TX State U. San Marcos 328 2 2 0 0 0 0 0 0 0 0 0 0 0 2 0 0 0 0 0 0 0 TX Tech U. 100 173 87 19 12 7 0 2 5 10 8 2 0 18 9 24 8 6 3 1 6 86
80
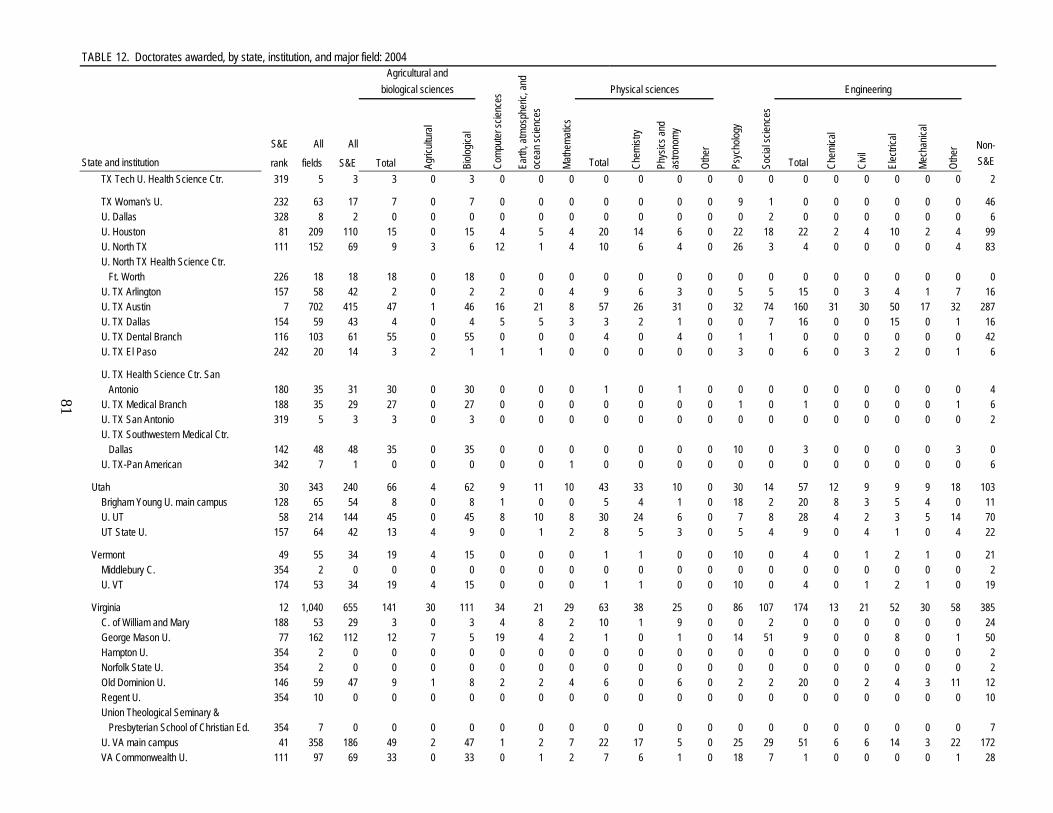
TABLE 12. Doctorates awarded, by state, institution, and major field: 2004
S&E All All
rank fields S&E S&ETotal Chem
ical
Civil
Chem
istry
Phys
ics an
d as
trono
my
Non-
Physical sciences Engineering
Comp
uter s
cienc
es
Agricultural andbiological sciences
Psyc
holog
y
State and institution Total Agric
ultur
al
Biolo
gical
Othe
r
Total Mech
anica
l
Othe
r
Socia
l scie
nces
Earth
, atm
osph
eric,
and
ocea
n scie
nces
Mathe
matic
s
Elec
trical
TX Tech U. Health Science Ctr. 319 5 3 3 0 3 0 0 0 0 0 0 0 0 0 0 0 0 0 0 0 2na . . . . . . . . . . . . . . . . . . . . .
TX Woman's U. 232 63 17 7 0 7 0 0 0 0 0 0 0 9 1 0 0 0 0 0 0 46 U. Dallas 328 8 2 0 0 0 0 0 0 0 0 0 0 0 2 0 0 0 0 0 0 6 U. Houston 81 209 110 15 0 15 4 5 4 20 14 6 0 22 18 22 2 4 10 2 4 99 U. North TX 111 152 69 9 3 6 12 1 4 10 6 4 0 26 3 4 0 0 0 0 4 83 U. North TX Health Science Ctr. Ft. Worth 226 18 18 18 0 18 0 0 0 0 0 0 0 0 0 0 0 0 0 0 0 0 U. TX Arlington 157 58 42 2 0 2 2 0 4 9 6 3 0 5 5 15 0 3 4 1 7 16 U. TX Austin 7 702 415 47 1 46 16 21 8 57 26 31 0 32 74 160 31 30 50 17 32 287 U. TX Dallas 154 59 43 4 0 4 5 5 3 3 2 1 0 0 7 16 0 0 15 0 1 16 U. TX Dental Branch 116 103 61 55 0 55 0 0 0 4 0 4 0 1 1 0 0 0 0 0 0 42 U. TX El Paso 242 20 14 3 2 1 1 1 0 0 0 0 0 3 0 6 0 3 2 0 1 6
na . . . . . . . . . . . . . . . . . . . . . U. TX Health Science Ctr. San Antonio 180 35 31 30 0 30 0 0 0 1 0 1 0 0 0 0 0 0 0 0 0 4 U. TX Medical Branch 188 35 29 27 0 27 0 0 0 0 0 0 0 1 0 1 0 0 0 0 1 6 U. TX San Antonio 319 5 3 3 0 3 0 0 0 0 0 0 0 0 0 0 0 0 0 0 0 2 U. TX Southwestern Medical Ctr. Dallas 142 48 48 35 0 35 0 0 0 0 0 0 0 10 0 3 0 0 0 0 3 0 U. TX-Pan American 342 7 1 0 0 0 0 0 1 0 0 0 0 0 0 0 0 0 0 0 0 6
na . . . . . . . . . . . . . . . . . . . . . Utah 30 343 240 66 4 62 9 11 10 43 33 10 0 30 14 57 12 9 9 9 18 103 Brigham Young U. main campus 128 65 54 8 0 8 1 0 0 5 4 1 0 18 2 20 8 3 5 4 0 11 U. UT 58 214 144 45 0 45 8 10 8 30 24 6 0 7 8 28 4 2 3 5 14 70 UT State U. 157 64 42 13 4 9 0 1 2 8 5 3 0 5 4 9 0 4 1 0 4 22
na . . . . . . . . . . . . . . . . . . . . . Vermont 49 55 34 19 4 15 0 0 0 1 1 0 0 10 0 4 0 1 2 1 0 21 Middlebury C. 354 2 0 0 0 0 0 0 0 0 0 0 0 0 0 0 0 0 0 0 0 2 U. VT 174 53 34 19 4 15 0 0 0 1 1 0 0 10 0 4 0 1 2 1 0 19
na . . . . . . . . . . . . . . . . . . . . . Virginia 12 1,040 655 141 30 111 34 21 29 63 38 25 0 86 107 174 13 21 52 30 58 385 C. of William and Mary 188 53 29 3 0 3 4 8 2 10 1 9 0 0 2 0 0 0 0 0 0 24 George Mason U. 77 162 112 12 7 5 19 4 2 1 0 1 0 14 51 9 0 0 8 0 1 50 Hampton U. 354 2 0 0 0 0 0 0 0 0 0 0 0 0 0 0 0 0 0 0 0 2 Norfolk State U. 354 2 0 0 0 0 0 0 0 0 0 0 0 0 0 0 0 0 0 0 0 2 Old Dominion U. 146 59 47 9 1 8 2 2 4 6 0 6 0 2 2 20 0 2 4 3 11 12 Regent U. 354 10 0 0 0 0 0 0 0 0 0 0 0 0 0 0 0 0 0 0 0 10 Union Theological Seminary & Presbyterian School of Christian Ed. 354 7 0 0 0 0 0 0 0 0 0 0 0 0 0 0 0 0 0 0 0 7 U. VA main campus 41 358 186 49 2 47 1 2 7 22 17 5 0 25 29 51 6 6 14 3 22 172 VA Commonwealth U. 111 97 69 33 0 33 0 1 2 7 6 1 0 18 7 1 0 0 0 0 1 28
81
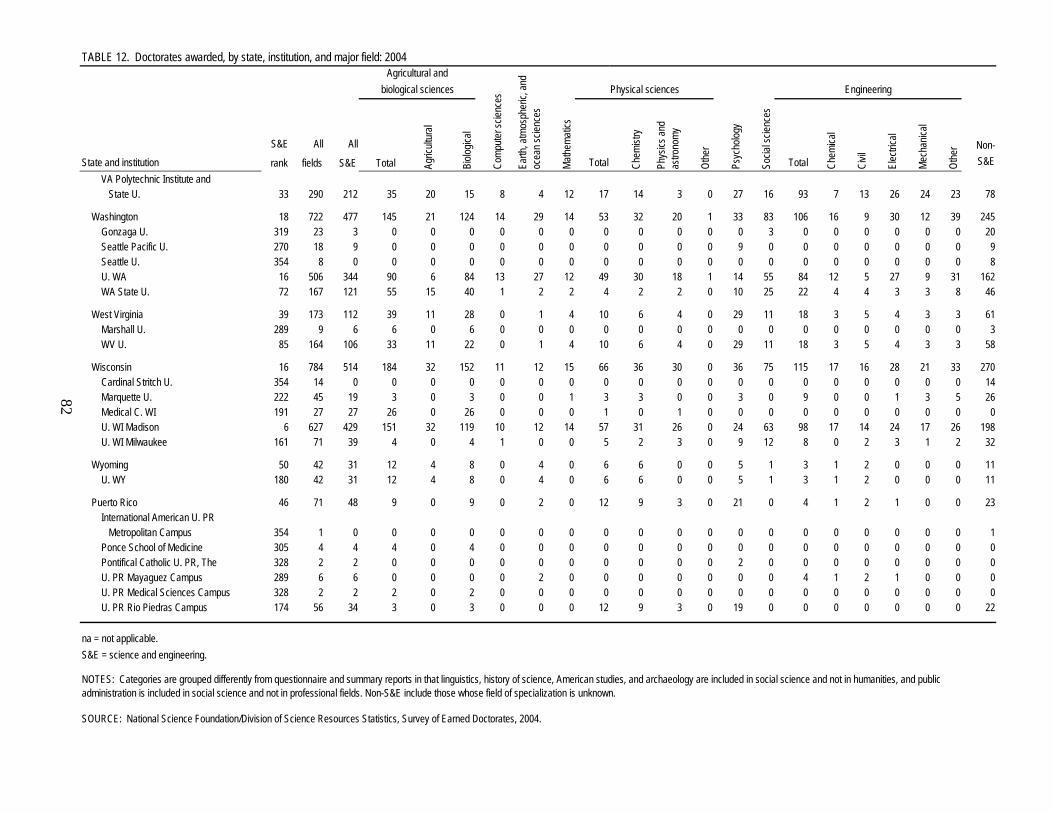
TABLE 12. Doctorates awarded, by state, institution, and major field: 2004
S&E All All
rank fields S&E S&ETotal Chem
ical
Civil
Chem
istry
Phys
ics an
d as
trono
my
Non-
Physical sciences Engineering
Comp
uter s
cienc
es
Agricultural andbiological sciences
Psyc
holog
y
State and institution Total Agric
ultur
al
Biolo
gical
Othe
r
Total Mech
anica
l
Othe
r
Socia
l scie
nces
Earth
, atm
osph
eric,
and
ocea
n scie
nces
Mathe
matic
s
Elec
trical
VA Polytechnic Institute and State U. 33 290 212 35 20 15 8 4 12 17 14 3 0 27 16 93 7 13 26 24 23 78
na . . . . . . . . . . . . . . . . . . . . . Washington 18 722 477 145 21 124 14 29 14 53 32 20 1 33 83 106 16 9 30 12 39 245 Gonzaga U. 319 23 3 0 0 0 0 0 0 0 0 0 0 0 3 0 0 0 0 0 0 20 Seattle Pacific U. 270 18 9 0 0 0 0 0 0 0 0 0 0 9 0 0 0 0 0 0 0 9 Seattle U. 354 8 0 0 0 0 0 0 0 0 0 0 0 0 0 0 0 0 0 0 0 8 U. WA 16 506 344 90 6 84 13 27 12 49 30 18 1 14 55 84 12 5 27 9 31 162 WA State U. 72 167 121 55 15 40 1 2 2 4 2 2 0 10 25 22 4 4 3 3 8 46
na . . . . . . . . . . . . . . . . . . . . . West Virginia 39 173 112 39 11 28 0 1 4 10 6 4 0 29 11 18 3 5 4 3 3 61 Marshall U. 289 9 6 6 0 6 0 0 0 0 0 0 0 0 0 0 0 0 0 0 0 3 WV U. 85 164 106 33 11 22 0 1 4 10 6 4 0 29 11 18 3 5 4 3 3 58
na . . . . . . . . . . . . . . . . . . . . . Wisconsin 16 784 514 184 32 152 11 12 15 66 36 30 0 36 75 115 17 16 28 21 33 270 Cardinal Stritch U. 354 14 0 0 0 0 0 0 0 0 0 0 0 0 0 0 0 0 0 0 0 14 Marquette U. 222 45 19 3 0 3 0 0 1 3 3 0 0 3 0 9 0 0 1 3 5 26 Medical C. WI 191 27 27 26 0 26 0 0 0 1 0 1 0 0 0 0 0 0 0 0 0 0 U. WI Madison 6 627 429 151 32 119 10 12 14 57 31 26 0 24 63 98 17 14 24 17 26 198 U. WI Milwaukee 161 71 39 4 0 4 1 0 0 5 2 3 0 9 12 8 0 2 3 1 2 32
na . . . . . . . . . . . . . . . . . . . . . Wyoming 50 42 31 12 4 8 0 4 0 6 6 0 0 5 1 3 1 2 0 0 0 11 U. WY 180 42 31 12 4 8 0 4 0 6 6 0 0 5 1 3 1 2 0 0 0 11
na . . . . . . . . . . . . . . . . . . . . . Puerto Rico 46 71 48 9 0 9 0 2 0 12 9 3 0 21 0 4 1 2 1 0 0 23 International American U. PR Metropolitan Campus 354 1 0 0 0 0 0 0 0 0 0 0 0 0 0 0 0 0 0 0 0 1 Ponce School of Medicine 305 4 4 4 0 4 0 0 0 0 0 0 0 0 0 0 0 0 0 0 0 0 Pontifical Catholic U. PR, The 328 2 2 0 0 0 0 0 0 0 0 0 0 2 0 0 0 0 0 0 0 0 U. PR Mayaguez Campus 289 6 6 0 0 0 0 2 0 0 0 0 0 0 0 4 1 2 1 0 0 0 U. PR Medical Sciences Campus 328 2 2 2 0 2 0 0 0 0 0 0 0 0 0 0 0 0 0 0 0 0 U. PR Rio Piedras Campus 174 56 34 3 0 3 0 0 0 12 9 3 0 19 0 0 0 0 0 0 0 22
na . . . . . . . . . . . . . . . . . . . . .
na = not applicable.S&E = science and engineering.
SOURCE: National Science Foundation/Division of Science Resources Statistics, Survey of Earned Doctorates, 2004.
NOTES: Categories are grouped differently from questionnaire and summary reports in that linguistics, history of science, American studies, and archaeology are included in social science and not in humanities, and public administration is included in social science and not in professional fields. Non-S&E include those whose field of specialization is unknown.
82
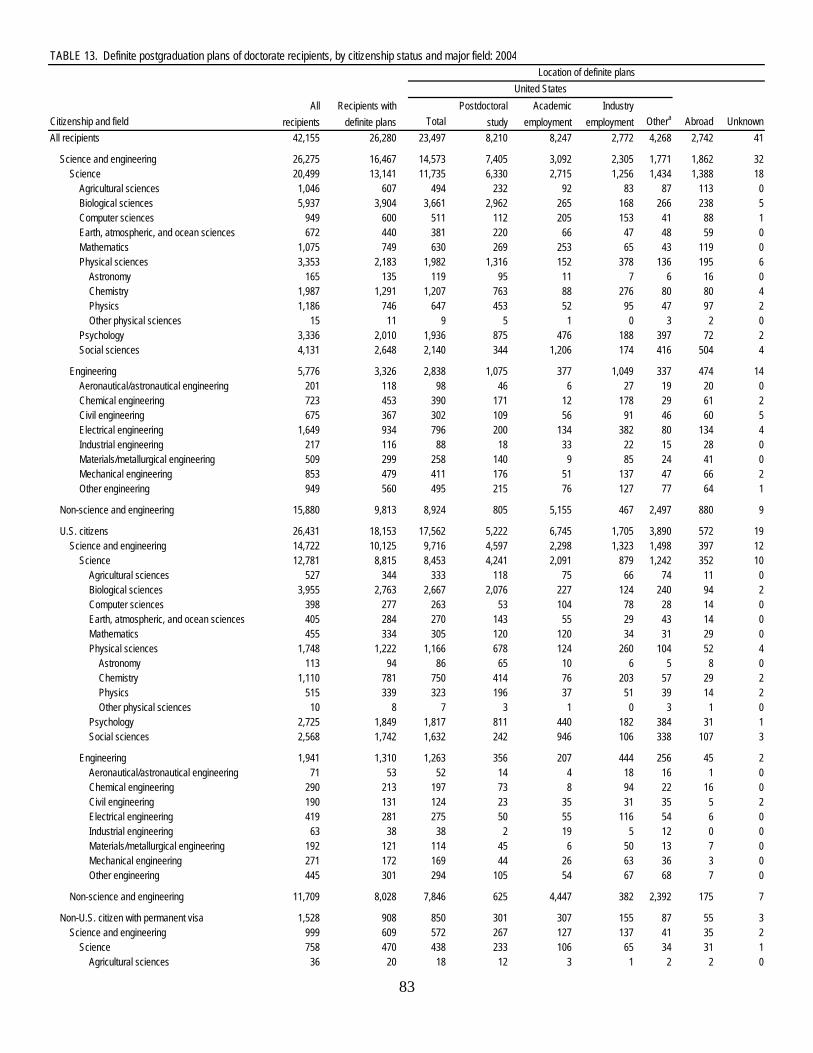
TABLE 13. Definite postgraduation plans of doctorate recipients, by citizenship status and major field: 2004
All Recipients with Postdoctoral Academic Industryrecipients definite plans study employment employment
All recipients 42,155 26,280 23,497 8,210 8,247 2,772 4,268 2,742 41
Science and engineering 26,275 16,467 14,573 7,405 3,092 2,305 1,771 1,862 32 Science 20,499 13,141 11,735 6,330 2,715 1,256 1,434 1,388 18 Agricultural sciences 1,046 607 494 232 92 83 87 113 0 Biological sciences 5,937 3,904 3,661 2,962 265 168 266 238 5 Computer sciences 949 600 511 112 205 153 41 88 1 Earth, atmospheric, and ocean sciences 672 440 381 220 66 47 48 59 0 Mathematics 1,075 749 630 269 253 65 43 119 0 Physical sciences 3,353 2,183 1,982 1,316 152 378 136 195 6 Astronomy 165 135 119 95 11 7 6 16 0 Chemistry 1,987 1,291 1,207 763 88 276 80 80 4 Physics 1,186 746 647 453 52 95 47 97 2 Other physical sciences 15 11 9 5 1 0 3 2 0 Psychology 3,336 2,010 1,936 875 476 188 397 72 2 Social sciences 4,131 2,648 2,140 344 1,206 174 416 504 4
Engineering 5,776 3,326 2,838 1,075 377 1,049 337 474 14 Aeronautical/astronautical engineering 201 118 98 46 6 27 19 20 0 Chemical engineering 723 453 390 171 12 178 29 61 2 Civil engineering 675 367 302 109 56 91 46 60 5 Electrical engineering 1,649 934 796 200 134 382 80 134 4 Industrial engineering 217 116 88 18 33 22 15 28 0 Materials/metallurgical engineering 509 299 258 140 9 85 24 41 0 Mechanical engineering 853 479 411 176 51 137 47 66 2 Other engineering 949 560 495 215 76 127 77 64 1
Non-science and engineering 15,880 9,813 8,924 805 5,155 467 2,497 880 9
U.S. citizens 26,431 18,153 17,562 5,222 6,745 1,705 3,890 572 19 Science and engineering 14,722 10,125 9,716 4,597 2,298 1,323 1,498 397 12 Science 12,781 8,815 8,453 4,241 2,091 879 1,242 352 10 Agricultural sciences 527 344 333 118 75 66 74 11 0 Biological sciences 3,955 2,763 2,667 2,076 227 124 240 94 2 Computer sciences 398 277 263 53 104 78 28 14 0 Earth, atmospheric, and ocean sciences 405 284 270 143 55 29 43 14 0 Mathematics 455 334 305 120 120 34 31 29 0 Physical sciences 1,748 1,222 1,166 678 124 260 104 52 4 Astronomy 113 94 86 65 10 6 5 8 0 Chemistry 1,110 781 750 414 76 203 57 29 2 Physics 515 339 323 196 37 51 39 14 2 Other physical sciences 10 8 7 3 1 0 3 1 0 Psychology 2,725 1,849 1,817 811 440 182 384 31 1 Social sciences 2,568 1,742 1,632 242 946 106 338 107 3
Engineering 1,941 1,310 1,263 356 207 444 256 45 2 Aeronautical/astronautical engineering 71 53 52 14 4 18 16 1 0 Chemical engineering 290 213 197 73 8 94 22 16 0 Civil engineering 190 131 124 23 35 31 35 5 2 Electrical engineering 419 281 275 50 55 116 54 6 0 Industrial engineering 63 38 38 2 19 5 12 0 0 Materials/metallurgical engineering 192 121 114 45 6 50 13 7 0 Mechanical engineering 271 172 169 44 26 63 36 3 0 Other engineering 445 301 294 105 54 67 68 7 0
Non-science and engineering 11,709 8,028 7,846 625 4,447 382 2,392 175 7
Non-U.S. citizen with permanent visa 1,528 908 850 301 307 155 87 55 3 Science and engineering 999 609 572 267 127 137 41 35 2 Science 758 470 438 233 106 65 34 31 1 Agricultural sciences 36 20 18 12 3 1 2 2 0
Location of definite plansUnited States
Abroad UnknownCitizenship and field Total Othera
83

TABLE 13. Definite postgraduation plans of doctorate recipients, by citizenship status and major field: 2004
All Recipients with Postdoctoral Academic Industryrecipients definite plans study employment employment
Location of definite plansUnited States
Abroad UnknownCitizenship and field Total Othera
Biological sciences 232 153 147 123 8 8 8 5 1 Computer sciences 50 31 31 7 12 9 3 0 0 Earth, atmospheric, and ocean sciences 21 13 12 7 0 4 1 1 0 Mathematics 55 29 28 14 10 3 1 1 0 Physical sciences 118 70 63 36 5 19 3 7 0 Astronomy 2 1 1 0 1 0 0 0 0 Chemistry 70 42 39 20 2 14 3 3 0 Physics 44 26 22 15 2 5 0 4 0 Other physical sciences 2 1 1 1 0 0 0 0 0 Psychology 64 43 41 18 13 4 6 2 0 Social sciences 182 111 98 16 55 17 10 13 0
Engineering 241 139 134 34 21 72 7 4 1 Aeronautical/astronautical engineering 6 3 3 1 0 2 0 0 0 Chemical engineering 22 13 12 1 0 11 0 1 0 Civil engineering 34 20 19 5 8 5 1 0 1 Electrical engineering 79 47 46 9 4 31 2 1 0 Industrial engineering 14 9 9 2 2 5 0 0 0 Materials/metallurgical engineering 18 9 7 4 0 1 2 2 0 Mechanical engineering 28 16 16 5 4 5 2 0 0 Other engineering 40 22 22 7 3 12 0 0 0
Non-science and engineering 529 299 278 34 180 18 46 20 1
Non-U.S. citizen with temporary visa 11,585 7,174 5,047 2,674 1,184 906 283 2,113 14 Science and engineering 9,122 5,700 4,258 2,529 660 841 228 1,428 14 Science 5,820 3,834 2,826 1,849 511 311 155 1,003 5 Agricultural sciences 413 243 143 102 14 16 11 100 0 Biological sciences 1,462 984 844 761 30 36 17 139 1 Computer sciences 459 292 217 52 89 66 10 74 1 Earth, atmospheric, and ocean sciences 221 140 96 69 10 14 3 44 0 Mathematics 526 386 297 135 123 28 11 89 0 Physical sciences 1,347 887 750 600 23 98 29 135 2 Astronomy 47 40 32 30 0 1 1 8 0 Chemistry 720 467 417 328 10 59 20 48 2 Physics 577 378 300 241 13 38 8 78 0 Other physical sciences 3 2 1 1 0 0 0 1 0 Psychology 188 114 74 45 20 2 7 39 1 Social sciences 1,204 788 405 85 202 51 67 383 0
Engineering 3,302 1,866 1,432 680 149 530 73 425 9 Aeronautical/astronautical engineering 116 62 43 31 2 7 3 19 0 Chemical engineering 365 226 181 97 4 73 7 44 1 Civil engineering 421 214 157 79 13 55 10 55 2 Electrical engineering 1,054 602 472 140 75 233 24 127 3 Industrial engineering 134 68 40 14 12 12 2 28 0 Materials/metallurgical engineering 279 168 136 90 3 34 9 32 0 Mechanical engineering 524 289 224 126 21 68 9 63 2 Other engineering 409 237 179 103 19 48 9 57 1
Non-science and engineering 2,463 1,474 789 145 524 65 55 685 0
a Includes government, nonprofit, elementary/secondary school, other and unknown employer and unknown plans.
SOURCE: National Science Foundation/Division of Science Resources Statistics, Survey of Earned Doctorates, 2004.
NOTES: Persons of unknown citizenship are included in total but are not shown separately. Categories are grouped differently from questionnaire and summary reports in that linguistics, history of science, American studies, and archaeology are included in social science and not in humanities, and public administration is included in social science and not in professional fields. Non-science and engineering includes those whose field of specialization is unknown.
84
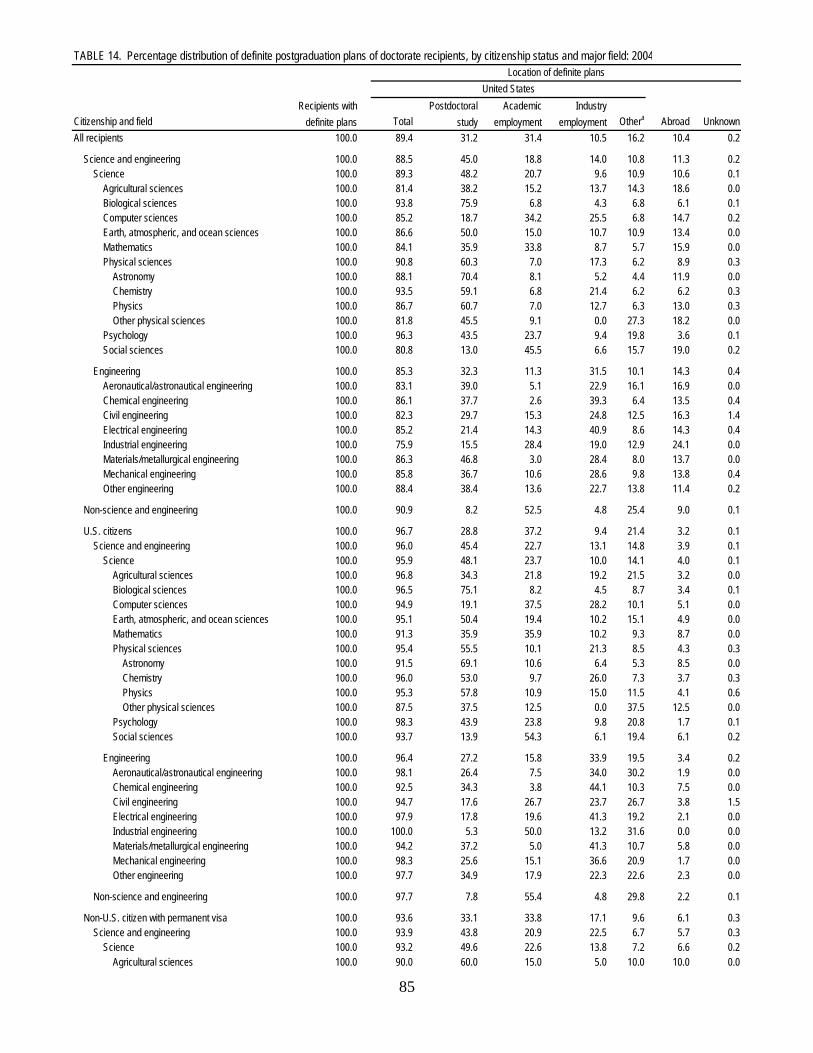
TABLE 14. Percentage distribution of definite postgraduation plans of doctorate recipients, by citizenship status and major field: 2004
Recipients with Postdoctoral Academic Industrydefinite plans study employment employment
All recipients 100.0 89.4 31.2 31.4 10.5 16.2 10.4 0.2
Science and engineering 100.0 88.5 45.0 18.8 14.0 10.8 11.3 0.2 Science 100.0 89.3 48.2 20.7 9.6 10.9 10.6 0.1 Agricultural sciences 100.0 81.4 38.2 15.2 13.7 14.3 18.6 0.0 Biological sciences 100.0 93.8 75.9 6.8 4.3 6.8 6.1 0.1 Computer sciences 100.0 85.2 18.7 34.2 25.5 6.8 14.7 0.2 Earth, atmospheric, and ocean sciences 100.0 86.6 50.0 15.0 10.7 10.9 13.4 0.0 Mathematics 100.0 84.1 35.9 33.8 8.7 5.7 15.9 0.0 Physical sciences 100.0 90.8 60.3 7.0 17.3 6.2 8.9 0.3 Astronomy 100.0 88.1 70.4 8.1 5.2 4.4 11.9 0.0 Chemistry 100.0 93.5 59.1 6.8 21.4 6.2 6.2 0.3 Physics 100.0 86.7 60.7 7.0 12.7 6.3 13.0 0.3 Other physical sciences 100.0 81.8 45.5 9.1 0.0 27.3 18.2 0.0 Psychology 100.0 96.3 43.5 23.7 9.4 19.8 3.6 0.1 Social sciences 100.0 80.8 13.0 45.5 6.6 15.7 19.0 0.2
Engineering 100.0 85.3 32.3 11.3 31.5 10.1 14.3 0.4 Aeronautical/astronautical engineering 100.0 83.1 39.0 5.1 22.9 16.1 16.9 0.0 Chemical engineering 100.0 86.1 37.7 2.6 39.3 6.4 13.5 0.4 Civil engineering 100.0 82.3 29.7 15.3 24.8 12.5 16.3 1.4 Electrical engineering 100.0 85.2 21.4 14.3 40.9 8.6 14.3 0.4 Industrial engineering 100.0 75.9 15.5 28.4 19.0 12.9 24.1 0.0 Materials/metallurgical engineering 100.0 86.3 46.8 3.0 28.4 8.0 13.7 0.0 Mechanical engineering 100.0 85.8 36.7 10.6 28.6 9.8 13.8 0.4 Other engineering 100.0 88.4 38.4 13.6 22.7 13.8 11.4 0.2
Non-science and engineering 100.0 90.9 8.2 52.5 4.8 25.4 9.0 0.1
U.S. citizens 100.0 96.7 28.8 37.2 9.4 21.4 3.2 0.1 Science and engineering 100.0 96.0 45.4 22.7 13.1 14.8 3.9 0.1 Science 100.0 95.9 48.1 23.7 10.0 14.1 4.0 0.1 Agricultural sciences 100.0 96.8 34.3 21.8 19.2 21.5 3.2 0.0 Biological sciences 100.0 96.5 75.1 8.2 4.5 8.7 3.4 0.1 Computer sciences 100.0 94.9 19.1 37.5 28.2 10.1 5.1 0.0 Earth, atmospheric, and ocean sciences 100.0 95.1 50.4 19.4 10.2 15.1 4.9 0.0 Mathematics 100.0 91.3 35.9 35.9 10.2 9.3 8.7 0.0 Physical sciences 100.0 95.4 55.5 10.1 21.3 8.5 4.3 0.3 Astronomy 100.0 91.5 69.1 10.6 6.4 5.3 8.5 0.0 Chemistry 100.0 96.0 53.0 9.7 26.0 7.3 3.7 0.3 Physics 100.0 95.3 57.8 10.9 15.0 11.5 4.1 0.6 Other physical sciences 100.0 87.5 37.5 12.5 0.0 37.5 12.5 0.0 Psychology 100.0 98.3 43.9 23.8 9.8 20.8 1.7 0.1 Social sciences 100.0 93.7 13.9 54.3 6.1 19.4 6.1 0.2
Engineering 100.0 96.4 27.2 15.8 33.9 19.5 3.4 0.2 Aeronautical/astronautical engineering 100.0 98.1 26.4 7.5 34.0 30.2 1.9 0.0 Chemical engineering 100.0 92.5 34.3 3.8 44.1 10.3 7.5 0.0 Civil engineering 100.0 94.7 17.6 26.7 23.7 26.7 3.8 1.5 Electrical engineering 100.0 97.9 17.8 19.6 41.3 19.2 2.1 0.0 Industrial engineering 100.0 100.0 5.3 50.0 13.2 31.6 0.0 0.0 Materials/metallurgical engineering 100.0 94.2 37.2 5.0 41.3 10.7 5.8 0.0 Mechanical engineering 100.0 98.3 25.6 15.1 36.6 20.9 1.7 0.0 Other engineering 100.0 97.7 34.9 17.9 22.3 22.6 2.3 0.0
Non-science and engineering 100.0 97.7 7.8 55.4 4.8 29.8 2.2 0.1
Non-U.S. citizen with permanent visa 100.0 93.6 33.1 33.8 17.1 9.6 6.1 0.3 Science and engineering 100.0 93.9 43.8 20.9 22.5 6.7 5.7 0.3 Science 100.0 93.2 49.6 22.6 13.8 7.2 6.6 0.2 Agricultural sciences 100.0 90.0 60.0 15.0 5.0 10.0 10.0 0.0
Total Othera
Location of definite plansUnited States
Abroad UnknownCitizenship and field
85

TABLE 14. Percentage distribution of definite postgraduation plans of doctorate recipients, by citizenship status and major field: 2004
Recipients with Postdoctoral Academic Industrydefinite plans study employment employmentTotal Othera
Location of definite plansUnited States
Abroad UnknownCitizenship and field Biological sciences 100.0 96.1 80.4 5.2 5.2 5.2 3.3 0.7 Computer sciences 100.0 100.0 22.6 38.7 29.0 9.7 0.0 0.0 Earth, atmospheric, and ocean sciences 100.0 92.3 53.8 0.0 30.8 7.7 7.7 0.0 Mathematics 100.0 96.6 48.3 34.5 10.3 3.4 3.4 0.0 Physical sciences 100.0 90.0 51.4 7.1 27.1 4.3 10.0 0.0 Astronomy 100.0 100.0 0.0 100.0 0.0 0.0 0.0 0.0 Chemistry 100.0 92.9 47.6 4.8 33.3 7.1 7.1 0.0 Physics 100.0 84.6 57.7 7.7 19.2 0.0 15.4 0.0 Other physical sciences 100.0 100.0 100.0 0.0 0.0 0.0 0.0 0.0 Psychology 100.0 95.3 41.9 30.2 9.3 14.0 4.7 0.0 Social sciences 100.0 88.3 14.4 49.5 15.3 9.0 11.7 0.0
Engineering 100.0 96.4 24.5 15.1 51.8 5.0 2.9 0.7 Aeronautical/astronautical engineering 100.0 100.0 33.3 0.0 66.7 0.0 0.0 0.0 Chemical engineering 100.0 92.3 7.7 0.0 84.6 0.0 7.7 0.0 Civil engineering 100.0 95.0 25.0 40.0 25.0 5.0 0.0 5.0 Electrical engineering 100.0 97.9 19.1 8.5 66.0 4.3 2.1 0.0 Industrial engineering 100.0 100.0 22.2 22.2 55.6 0.0 0.0 0.0 Materials/metallurgical engineering 100.0 77.8 44.4 0.0 11.1 22.2 22.2 0.0 Mechanical engineering 100.0 100.0 31.3 25.0 31.3 12.5 0.0 0.0 Other engineering 100.0 100.0 31.8 13.6 54.5 0.0 0.0 0.0
Non-science and engineering 100.0 93.0 11.4 60.2 6.0 15.4 6.7 0.3
Non-U.S. citizen with temporary visa 100.0 70.4 37.3 16.5 12.6 3.9 29.5 0.2 Science and engineering 100.0 74.7 44.4 11.6 14.8 4.0 25.1 0.2 Science 100.0 73.7 48.2 13.3 8.1 4.0 26.2 0.1 Agricultural sciences 100.0 58.8 42.0 5.8 6.6 4.5 41.2 0.0 Biological sciences 100.0 85.8 77.3 3.0 3.7 1.7 14.1 0.1 Computer sciences 100.0 74.3 17.8 30.5 22.6 3.4 25.3 0.3 Earth, atmospheric, and ocean sciences 100.0 68.6 49.3 7.1 10.0 2.1 31.4 0.0 Mathematics 100.0 76.9 35.0 31.9 7.3 2.8 23.1 0.0 Physical sciences 100.0 84.6 67.6 2.6 11.0 3.3 15.2 0.2 Astronomy 100.0 80.0 75.0 0.0 2.5 2.5 20.0 0.0 Chemistry 100.0 89.3 70.2 2.1 12.6 4.3 10.3 0.4 Physics 100.0 79.4 63.8 3.4 10.1 2.1 20.6 0.0 Other physical sciences 100.0 50.0 50.0 0.0 0.0 0.0 50.0 0.0 Psychology 100.0 64.9 39.5 17.5 1.8 6.1 34.2 0.9 Social sciences 100.0 51.4 10.8 25.6 6.5 8.5 48.6 0.0
Engineering 100.0 76.7 36.4 8.0 28.4 3.9 22.8 0.5 Aeronautical/astronautical engineering 100.0 69.4 50.0 3.2 11.3 4.8 30.6 0.0 Chemical engineering 100.0 80.1 42.9 1.8 32.3 3.1 19.5 0.4 Civil engineering 100.0 73.4 36.9 6.1 25.7 4.7 25.7 0.9 Electrical engineering 100.0 78.4 23.3 12.5 38.7 4.0 21.1 0.5 Industrial engineering 100.0 58.8 20.6 17.6 17.6 2.9 41.2 0.0 Materials/metallurgical engineering 100.0 81.0 53.6 1.8 20.2 5.4 19.0 0.0 Mechanical engineering 100.0 77.5 43.6 7.3 23.5 3.1 21.8 0.7 Other engineering 100.0 75.5 43.5 8.0 20.3 3.8 24.1 0.4
Non-science and engineering 100.0 53.5 9.8 35.5 4.4 3.7 46.5 0.0
a Includes government, nonprofit, elementary/secondary school, other and unknown employer, and unknown plans.
SOURCE: National Science Foundation/Division of Science Resources Statistics, Survey of Earned Doctorates, 2004.
NOTES: Persons of unknown citizenship are included in total but are not shown separately. Categories are grouped differently from questionnaire and summary reports in that linguistics, history of science, American studies, and archaeology are included in social science and not in humanities, and public administration is included in social science and not in professional fields. Non-science and engineering includes those whose field of specialization is unknown.
86

TABLE 15. Definite postgraduation plans of U.S. citizen and permanent resident doctorate recipients, by sex and major field: 2004
All Recipients with Postdoctoral Academic Industryrecipients definite plans study employment employment
All recipients 27,959 19,061 18,412 5,523 7,052 1,860 3,977 627 22
Science and engineering 15,721 10,734 10,288 4,864 2,425 1,460 1,539 432 14 Science 13,539 9,285 8,891 4,474 2,197 944 1,276 383 11 Agricultural sciences 563 364 351 130 78 67 76 13 0 Biological sciences 4,187 2,916 2,814 2,199 235 132 248 99 3 Computer sciences 448 308 294 60 116 87 31 14 0 Earth, atmospheric, and ocean sciences 426 297 282 150 55 33 44 15 0 Mathematics 510 363 333 134 130 37 32 30 0 Physical sciences 1,866 1,292 1,229 714 129 279 107 59 4 Astronomy 115 95 87 65 11 6 5 8 0 Chemistry 1,180 823 789 434 78 217 60 32 2 Physics 559 365 345 211 39 56 39 18 2 Other physical sciences 12 9 8 4 1 0 3 1 0 Psychology 2,789 1,892 1,858 829 453 186 390 33 1 Social sciences 2,750 1,853 1,730 258 1,001 123 348 120 3
Engineering 2,182 1,449 1,397 390 228 516 263 49 3 Aeronautical/astronautical engineering 77 56 55 15 4 20 16 1 0 Chemical engineering 312 226 209 74 8 105 22 17 0 Civil engineering 224 151 143 28 43 36 36 5 3 Electrical engineering 498 328 321 59 59 147 56 7 0 Industrial engineering 77 47 47 4 21 10 12 0 0 Materials/metallurgical engineering 210 130 121 49 6 51 15 9 0 Mechanical engineering 299 188 185 49 30 68 38 3 0 Other engineering 485 323 316 112 57 79 68 7 0
Non-science and engineering 12,238 8,327 8,124 659 4,627 400 2,438 195 8
Male 13,734 9,568 9,188 2,948 3,189 1,238 1,813 366 14 Science and engineering 8,875 6,217 5,939 2,727 1,298 1,035 879 266 12 Science 7,163 5,067 4,830 2,431 1,137 593 669 228 9 Agricultural sciences 337 218 208 72 46 48 42 10 0 Biological sciences 2,188 1,593 1,540 1,206 108 74 152 50 3 Computer sciences 345 247 236 47 86 77 26 11 0 Earth, atmospheric, and ocean sciences 260 189 181 92 36 22 31 8 0 Mathematics 356 254 230 93 81 33 23 24 0 Physical sciences 1,356 951 902 531 85 208 78 45 4 Astronomy 82 68 62 46 6 6 4 6 0 Chemistry 798 567 539 307 42 152 38 26 2 Physics 473 313 298 177 37 50 34 13 2 Other physical sciences 3 3 3 1 0 0 2 0 0 Psychology 895 630 619 272 154 66 127 11 0 Social sciences 1,426 985 914 118 541 65 190 69 2
Engineering 1,712 1,150 1,109 296 161 442 210 38 3 Aeronautical/astronautical engineering 67 51 50 12 4 20 14 1 0 Chemical engineering 232 167 154 51 4 80 19 13 0 Civil engineering 159 108 102 21 28 26 27 3 3 Electrical engineering 430 287 281 48 49 137 47 6 0 Industrial engineering 57 33 33 3 13 9 8 0 0 Materials/metallurgical engineering 173 107 100 42 4 42 12 7 0 Mechanical engineering 255 163 160 43 25 58 34 3 0 Other engineering 339 234 229 76 34 70 49 5 0
Non-science and engineering 4,859 3,351 3,249 221 1,891 203 934 100 2
Female 14,221 9,493 9,224 2,575 3,863 622 2,164 261 8 Science and engineering 6,842 4,517 4,349 2,137 1,127 425 660 166 2
Abroad UnknownSex and field
Total Othera
Location of definite plansUnited States
87
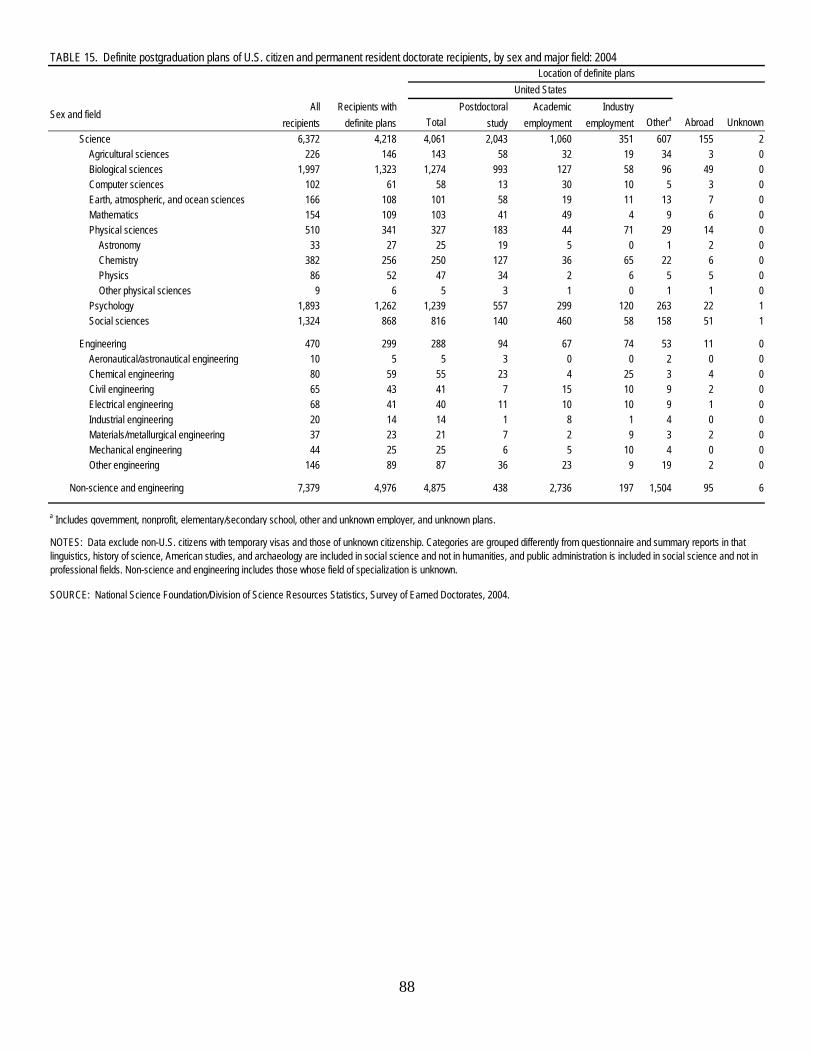
TABLE 15. Definite postgraduation plans of U.S. citizen and permanent resident doctorate recipients, by sex and major field: 2004
All Recipients with Postdoctoral Academic Industryrecipients definite plans study employment employment Abroad Unknown
Sex and fieldTotal Othera
Location of definite plansUnited States
Science 6,372 4,218 4,061 2,043 1,060 351 607 155 2 Agricultural sciences 226 146 143 58 32 19 34 3 0 Biological sciences 1,997 1,323 1,274 993 127 58 96 49 0 Computer sciences 102 61 58 13 30 10 5 3 0 Earth, atmospheric, and ocean sciences 166 108 101 58 19 11 13 7 0 Mathematics 154 109 103 41 49 4 9 6 0 Physical sciences 510 341 327 183 44 71 29 14 0 Astronomy 33 27 25 19 5 0 1 2 0 Chemistry 382 256 250 127 36 65 22 6 0 Physics 86 52 47 34 2 6 5 5 0 Other physical sciences 9 6 5 3 1 0 1 1 0 Psychology 1,893 1,262 1,239 557 299 120 263 22 1 Social sciences 1,324 868 816 140 460 58 158 51 1
Engineering 470 299 288 94 67 74 53 11 0 Aeronautical/astronautical engineering 10 5 5 3 0 0 2 0 0 Chemical engineering 80 59 55 23 4 25 3 4 0 Civil engineering 65 43 41 7 15 10 9 2 0 Electrical engineering 68 41 40 11 10 10 9 1 0 Industrial engineering 20 14 14 1 8 1 4 0 0 Materials/metallurgical engineering 37 23 21 7 2 9 3 2 0 Mechanical engineering 44 25 25 6 5 10 4 0 0 Other engineering 146 89 87 36 23 9 19 2 0
Non-science and engineering 7,379 4,976 4,875 438 2,736 197 1,504 95 6
a Includes government, nonprofit, elementary/secondary school, other and unknown employer, and unknown plans.
SOURCE: National Science Foundation/Division of Science Resources Statistics, Survey of Earned Doctorates, 2004.
NOTES: Data exclude non-U.S. citizens with temporary visas and those of unknown citizenship. Categories are grouped differently from questionnaire and summary reports in that linguistics, history of science, American studies, and archaeology are included in social science and not in humanities, and public administration is included in social science and not in professional fields. Non-science and engineering includes those whose field of specialization is unknown.
88
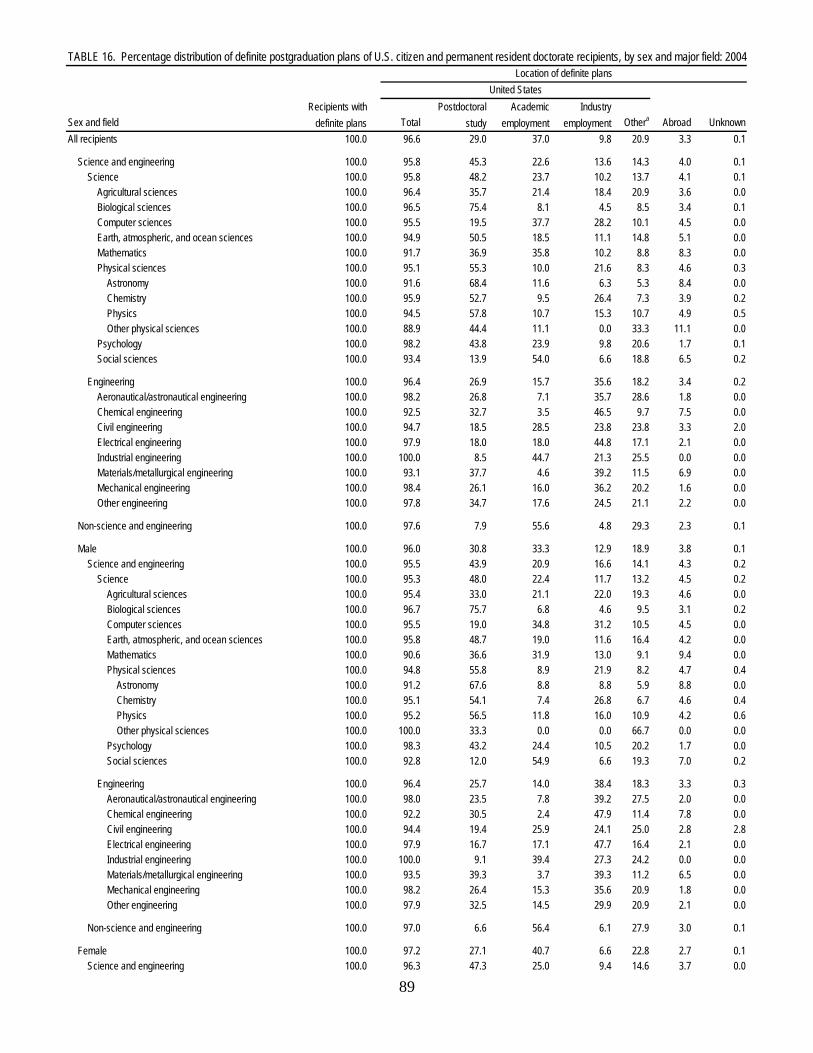
TABLE 16. Percentage distribution of definite postgraduation plans of U.S. citizen and permanent resident doctorate recipients, by sex and major field: 2004
Recipients with Postdoctoral Academic Industrydefinite plans study employment employment
All recipients 100.0 96.6 29.0 37.0 9.8 20.9 3.3 0.1
Science and engineering 100.0 95.8 45.3 22.6 13.6 14.3 4.0 0.1 Science 100.0 95.8 48.2 23.7 10.2 13.7 4.1 0.1 Agricultural sciences 100.0 96.4 35.7 21.4 18.4 20.9 3.6 0.0 Biological sciences 100.0 96.5 75.4 8.1 4.5 8.5 3.4 0.1 Computer sciences 100.0 95.5 19.5 37.7 28.2 10.1 4.5 0.0 Earth, atmospheric, and ocean sciences 100.0 94.9 50.5 18.5 11.1 14.8 5.1 0.0 Mathematics 100.0 91.7 36.9 35.8 10.2 8.8 8.3 0.0 Physical sciences 100.0 95.1 55.3 10.0 21.6 8.3 4.6 0.3 Astronomy 100.0 91.6 68.4 11.6 6.3 5.3 8.4 0.0 Chemistry 100.0 95.9 52.7 9.5 26.4 7.3 3.9 0.2 Physics 100.0 94.5 57.8 10.7 15.3 10.7 4.9 0.5 Other physical sciences 100.0 88.9 44.4 11.1 0.0 33.3 11.1 0.0 Psychology 100.0 98.2 43.8 23.9 9.8 20.6 1.7 0.1 Social sciences 100.0 93.4 13.9 54.0 6.6 18.8 6.5 0.2
Engineering 100.0 96.4 26.9 15.7 35.6 18.2 3.4 0.2 Aeronautical/astronautical engineering 100.0 98.2 26.8 7.1 35.7 28.6 1.8 0.0 Chemical engineering 100.0 92.5 32.7 3.5 46.5 9.7 7.5 0.0 Civil engineering 100.0 94.7 18.5 28.5 23.8 23.8 3.3 2.0 Electrical engineering 100.0 97.9 18.0 18.0 44.8 17.1 2.1 0.0 Industrial engineering 100.0 100.0 8.5 44.7 21.3 25.5 0.0 0.0 Materials/metallurgical engineering 100.0 93.1 37.7 4.6 39.2 11.5 6.9 0.0 Mechanical engineering 100.0 98.4 26.1 16.0 36.2 20.2 1.6 0.0 Other engineering 100.0 97.8 34.7 17.6 24.5 21.1 2.2 0.0
Non-science and engineering 100.0 97.6 7.9 55.6 4.8 29.3 2.3 0.1
Male 100.0 96.0 30.8 33.3 12.9 18.9 3.8 0.1 Science and engineering 100.0 95.5 43.9 20.9 16.6 14.1 4.3 0.2 Science 100.0 95.3 48.0 22.4 11.7 13.2 4.5 0.2 Agricultural sciences 100.0 95.4 33.0 21.1 22.0 19.3 4.6 0.0 Biological sciences 100.0 96.7 75.7 6.8 4.6 9.5 3.1 0.2 Computer sciences 100.0 95.5 19.0 34.8 31.2 10.5 4.5 0.0 Earth, atmospheric, and ocean sciences 100.0 95.8 48.7 19.0 11.6 16.4 4.2 0.0 Mathematics 100.0 90.6 36.6 31.9 13.0 9.1 9.4 0.0 Physical sciences 100.0 94.8 55.8 8.9 21.9 8.2 4.7 0.4 Astronomy 100.0 91.2 67.6 8.8 8.8 5.9 8.8 0.0 Chemistry 100.0 95.1 54.1 7.4 26.8 6.7 4.6 0.4 Physics 100.0 95.2 56.5 11.8 16.0 10.9 4.2 0.6 Other physical sciences 100.0 100.0 33.3 0.0 0.0 66.7 0.0 0.0 Psychology 100.0 98.3 43.2 24.4 10.5 20.2 1.7 0.0 Social sciences 100.0 92.8 12.0 54.9 6.6 19.3 7.0 0.2
Engineering 100.0 96.4 25.7 14.0 38.4 18.3 3.3 0.3 Aeronautical/astronautical engineering 100.0 98.0 23.5 7.8 39.2 27.5 2.0 0.0 Chemical engineering 100.0 92.2 30.5 2.4 47.9 11.4 7.8 0.0 Civil engineering 100.0 94.4 19.4 25.9 24.1 25.0 2.8 2.8 Electrical engineering 100.0 97.9 16.7 17.1 47.7 16.4 2.1 0.0 Industrial engineering 100.0 100.0 9.1 39.4 27.3 24.2 0.0 0.0 Materials/metallurgical engineering 100.0 93.5 39.3 3.7 39.3 11.2 6.5 0.0 Mechanical engineering 100.0 98.2 26.4 15.3 35.6 20.9 1.8 0.0 Other engineering 100.0 97.9 32.5 14.5 29.9 20.9 2.1 0.0
Non-science and engineering 100.0 97.0 6.6 56.4 6.1 27.9 3.0 0.1
Female 100.0 97.2 27.1 40.7 6.6 22.8 2.7 0.1 Science and engineering 100.0 96.3 47.3 25.0 9.4 14.6 3.7 0.0
Sex and field Total Othera
Location of definite plansUnited States
Abroad Unknown
89
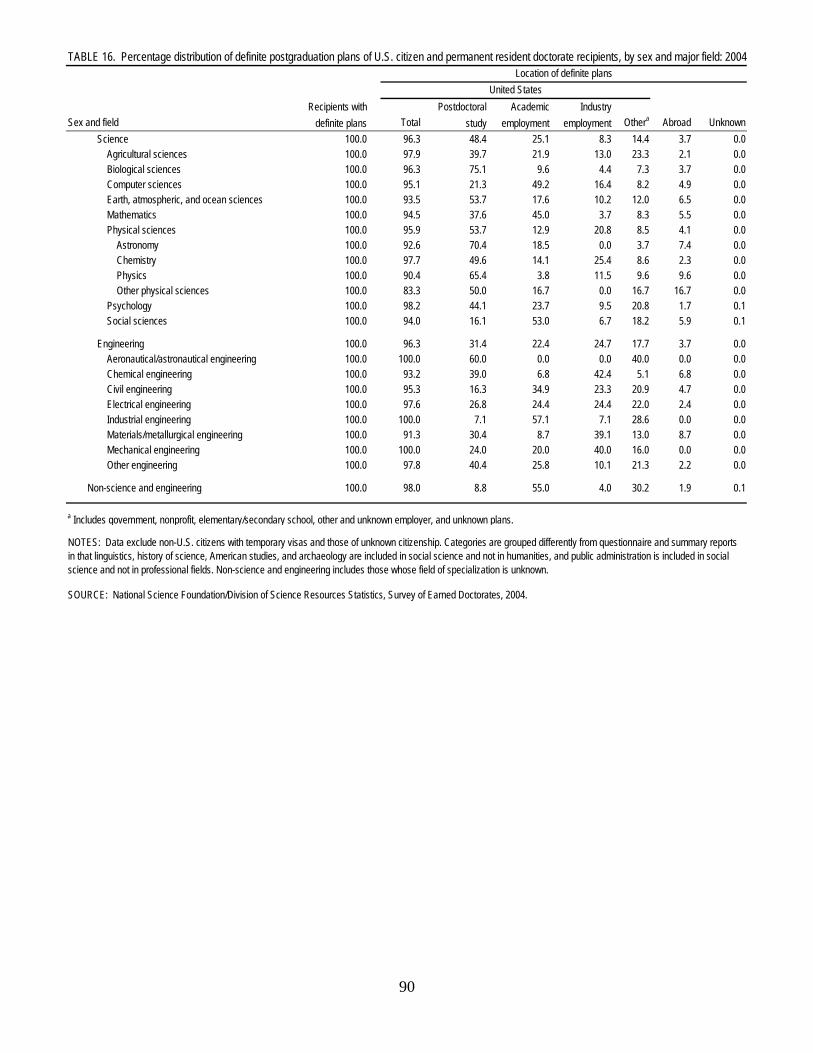
TABLE 16. Percentage distribution of definite postgraduation plans of U.S. citizen and permanent resident doctorate recipients, by sex and major field: 2004
Recipients with Postdoctoral Academic Industrydefinite plans study employment employmentSex and field Total Othera
Location of definite plansUnited States
Abroad Unknown Science 100.0 96.3 48.4 25.1 8.3 14.4 3.7 0.0 Agricultural sciences 100.0 97.9 39.7 21.9 13.0 23.3 2.1 0.0 Biological sciences 100.0 96.3 75.1 9.6 4.4 7.3 3.7 0.0 Computer sciences 100.0 95.1 21.3 49.2 16.4 8.2 4.9 0.0 Earth, atmospheric, and ocean sciences 100.0 93.5 53.7 17.6 10.2 12.0 6.5 0.0 Mathematics 100.0 94.5 37.6 45.0 3.7 8.3 5.5 0.0 Physical sciences 100.0 95.9 53.7 12.9 20.8 8.5 4.1 0.0 Astronomy 100.0 92.6 70.4 18.5 0.0 3.7 7.4 0.0 Chemistry 100.0 97.7 49.6 14.1 25.4 8.6 2.3 0.0 Physics 100.0 90.4 65.4 3.8 11.5 9.6 9.6 0.0 Other physical sciences 100.0 83.3 50.0 16.7 0.0 16.7 16.7 0.0 Psychology 100.0 98.2 44.1 23.7 9.5 20.8 1.7 0.1 Social sciences 100.0 94.0 16.1 53.0 6.7 18.2 5.9 0.1
Engineering 100.0 96.3 31.4 22.4 24.7 17.7 3.7 0.0 Aeronautical/astronautical engineering 100.0 100.0 60.0 0.0 0.0 40.0 0.0 0.0 Chemical engineering 100.0 93.2 39.0 6.8 42.4 5.1 6.8 0.0 Civil engineering 100.0 95.3 16.3 34.9 23.3 20.9 4.7 0.0 Electrical engineering 100.0 97.6 26.8 24.4 24.4 22.0 2.4 0.0 Industrial engineering 100.0 100.0 7.1 57.1 7.1 28.6 0.0 0.0 Materials/metallurgical engineering 100.0 91.3 30.4 8.7 39.1 13.0 8.7 0.0 Mechanical engineering 100.0 100.0 24.0 20.0 40.0 16.0 0.0 0.0 Other engineering 100.0 97.8 40.4 25.8 10.1 21.3 2.2 0.0
Non-science and engineering 100.0 98.0 8.8 55.0 4.0 30.2 1.9 0.1
a Includes government, nonprofit, elementary/secondary school, other and unknown employer, and unknown plans.
SOURCE: National Science Foundation/Division of Science Resources Statistics, Survey of Earned Doctorates, 2004.
NOTES: Data exclude non-U.S. citizens with temporary visas and those of unknown citizenship. Categories are grouped differently from questionnaire and summary reports in that linguistics, history of science, American studies, and archaeology are included in social science and not in humanities, and public administration is included in social science and not in professional fields. Non-science and engineering includes those whose field of specialization is unknown.
90
91
SURVEY OVERVIEWThe Survey of Earned Doctorates (SED) is designed
to obtain data on the number and characteristics of indi-viduals receiving research doctoral degrees from U.S.institutions. The results of the survey are used to assesstrends in doctorate production. This information is vitalfor educational and labor-force planners within the fed-eral government and in academia. The survey has beencompleted by individuals receiving research doctoratessince 1958. Graduate schools are responsible for sub-mitting completed forms and for sending them to be com-piled in the Doctorate Records File.
Key variables of the survey include:
Academic institution attendedCitizenship status at graduationCountry of birthCountry of citizenshipBirth yearDisability statusEducational attainment of parentsEducational history after high schoolField of degree specialty (N = 287)Field of employmentFinancial support (e.g., fellowship, research assis- tantship)Kind of academic institution that conferred degree (e.g., Carnegie classification, size, public or private)Kind of employment planned (e.g., postdoctoral ap- pointment, employment sector)Marital statusNumber of dependentsPlace of birthPostgraduation plansRace and Hispanic ethnicity (by subgroup)SexWork activity planned after doctoral degree
The race and ethnicity questions on the survey formwere revised in 2001. For the years 2001 and later, thedata in the “Asian” category excludes the “Native Ha-waiian/Pacific Islander” category; Native Hawaiians/Pacific Islanders are included in the “other/unknown”category; and multiple race/ethnicity response data wereincluded in the other/unknown race/ethnicity responsedata. Data in the “Cuban” category were combined withthose in the “other Hispanic” category.
DATA COLLECTIONThe population for the 2004 survey consisted of all
individuals who received research doctorates (only firstdoctorates are included) from U.S. academic institutionsin the 12-month period ending on 30 June 2004. The totaluniverse consisted of 42,155 persons in over 400 institu-tions that conferred research doctorate awards in 2004.
Survey instruments were mailed to institutional co-ordinators in eligible graduate schools who then distrib-uted the survey forms to individuals receiving a researchdoctorate. The institutional coordinators collected theforms and returned them to the contractor for editing andprocessing. The contractor also performed a follow-upif critical items or forms were missing.
Because the survey collects a complete college edu-cation history, and one-third of doctorate recipients fromU.S. universities are from foreign countries, coding ofinstitutions is very important. Institutional coding for theSED is done using a coding manual for foreign institutionsof higher education developed by the U.S. Departmentof Education entitled Mapping the World of Education:The Comparative Database System.1
The National Research Council of the National Acad-emy of Sciences conducted the survey under contract tothe National Science Foundation (NSF) until 1997; theNational Opinion Research Center (Chicago, IL) cur-rently conducts the survey under contract to NSF.
NONRESPONSEOf the 42,155 new research doctorates granted in
academic year 2004, 90.8 percent of degree recipientsreturned their completed survey instruments. Limitedrecords (containing field of study, doctoral institution,and sex) for nonrespondents are constructed based oninformation collected from administrative lists of theuniversity—commencement programs, graduation lists,and other similar public records. Nonresponse was con-centrated in certain institutions; graduates from 10 insti-tutions accounted for 29 percent of the totalnonrespondents.
APPENDIX A: TECHNICAL NOTES
1 Hunt, E.S. 1994. Washington, DC: U.S. Department of Edu-cation; National Science Foundation. ISBN 0161452414.
92
Item nonresponse rates in 2004 for the most frequentlyused variables ranged from 0.2 percent for sex to 8.7percent for postgraduation location. No imputation wasperformed for missing data items.
Information from the survey is also included in thereport series Science and Engineering Degrees; Scienceand Engineering Indicators; and Women, Minorities,and Persons With Disabilities in Science and Engineer-ing; and in special occasional publications, such as Un-dergraduate Origins of Recent (1991–95) Science andEngineering Doctorate Recipients (NSF 96-334), all ofwhich are available at http://www.nsf.gov/statistics/.
Results are also included in a publication series onall fields of study—Doctorate Recipients from UnitedStates Universities: Summary Report. This interagencyreport is sponsored by the federal agencies that supportthe Survey of Earned Doctorates (six agencies in 2004).The report is available on the Web at www.norc.uchicago.edu/issues/docdata.htm. Also new in 2006 isthe publication of the interagency report entitled U.S.Doctorates in the 20th Century, which provides an over-view of the development of the American system of doc-toral education from 1900 to 1999.
Selected summary data from this survey are avail-able by institution from the NSF WebCASPAR databaseat http://webcaspar.nsf.gov. Access to restricted data forresearchers interested in analyzing microdata can be ar-ranged through a licensing agreement. For more infor-mation about this survey, contact
Susan T. HillHuman Resources Statistics ProgramDivision of Science Resources StatisticsNational Science Foundation4201 Wilson Boulevard, Suite 965Arlington, VA 22230(703) [email protected]
A complete quality profile for the 2004 SED is avail-able upon request. A complete list of methodological re-search concerning the Survey of Earned Doctorates is alsoavailable upon request.
AVAILABILITY OF DATA
The survey has collected information on doctoral re-cipients annually since 1957. More limited informationis contained in the SED data file (Doctorate Records File)for research doctorate recipients from 1920 to 1956.
The data from this survey are published annually indetailed statistical tables in the series Science and Engi-neering Doctorate Awards, available on the NSF websiteat http://www.nsf.gov/statistics/doctorates/. These reportsfocus on science and engineering fields of study. (A listshowing how fields of study are grouped for this reportis in appendix B.) Companion data from this survey forearlier years (1960–91) were published in detailed sta-tistical tables in the report Science and Engineering Doc-torates: 1960–91 (NSF 93-301). This report is out ofprint, but tables from it are available on request.
Key variable Item response rate (%)
Sex 99.8
Citizenship 93.8
Country of non-U.S. citizens 93.5
Race/ethnicity 93.5
Postgraduation location (U.S. or foreign) 91.3

93
SCIENCE
Biological/agricultural sciencesAgricultural sciences
Agronomy/crop scienceAnimal breeding/geneticsAnimal nutritionAnimal sciences, otherConservation/renewable natural resourcesDairy sciencea
Environmental science Fisheries science/management
Food engineeringFood sciences, otherForest biologyForest engineeringa
Forest managementForestry and related sciences, otherHorticulture sciencePlant breeding/geneticsPlant pathology
Plant sciences, otherPoultry scienceSoil chemistry/microbiologySoil sciences, otherWildlife/range managementWood science and pulp/paper technologyAgricultural sciences, generalAgricultural sciences, other
Biological sciencesAnatomyBacteriologyBiochemistryBiological immunologyBiomedical sciencesBiometrics/biostatisticsBiophysicsBiotechnology researchBotany, otherCell biology
Developmental biology/embryologyEcologyEndocrinologyEntomologyHuman/animal geneticsHuman/animal pathologyHuman/animal pharmacologyHuman/animal physiologyMicrobiology
APPENDIX B: FIELDS OF STUDY
94
Molecular biology Neuroscience
Nutritional sciencesParasitologyPlant geneticsPlant pathologyPlant physiologyToxicologyZoology, otherBiological sciences, generalBiological sciences, other
Earth/atmospheric/ocean sciences
Atmospheric sciencesAtmospheric dynamicsAtmospheric physics/chemistryMeteorologyAtmospheric sciences/meteorology, generalAtmospheric sciences/meteorology, other
Earth sciences
GeochemistryGeologyGeomorphology/glacial geologyGeophysics/seismologyHydrology/water resourcesMineralogy/petrologyPaleontologyStratigraphy/sedimentationGeological and related sciences, generalGeological and related sciences, other
Ocean sciences
Marine sciencesOceanography
Mathematics/computer sciences
Computer sciencesComputer scienceInformation science/systemsComputer and information science, otherb
MathematicsAlgebraAnalysis/functional analysisApplied mathematicsComputing theoryGeometryLogicMathematical statisticsNumber theory

95
Operations researchTopology Mathematics, generalMathematics, other
Physical sciences
AstronomyAstronomyAstrophysics
Chemistry
Analytical chemistryInorganic chemistryMedicinal/pharmaceutical chemistryNuclear chemistrya
Organic chemistryPhysical chemistryPolymer chemistryTheoretical chemistryChemistry, generalChemistry, other
Physics
AcousticsChemical and atomic/molecular physicsElementary particle physicsFluids physicsa
Nuclear physicsOpticsPlasma/high-temperature physicsPolymer physicsSolid state/low-temperature physicsPhysics, generalPhysics, other
Other physical sciences
Psychology
Clinical psychologyCognitive psychology/psycholinguisticsComparative psychologyCounselingDevelopmental/child psychologyEducational psychologyExperimental psychologyFamily/marriage counselingHuman/individual family developmentIndustrial/organizational psychologyPersonalityPhysiological/psychobiologyPsychometricsa
96
Quantitative psychologySchool psychologySocial psychologyPsychology, generalPsychology, other
Social sciences Economics
Agricultural economicsEconometricsEconomics
Political science
International relations/affairsPolitical science/governmentPublic administrationPublic policy analysis
Sociology
Demography/population studiesSociology
Other social sciences
American studiesAnthropologyArchaeologyArea studiesCriminologyGeographyHistory/philosophy of science and technologyLinguisticsStatisticsUrban affairs and studiesSocial sciences, generalSocial sciences, other
ENGINEERING
Aeronautical/astronautical engineeringChemical engineering
Chemical engineeringPetroleum engineeringPolymer/plastics engineering
Civil engineeringCivil engineeringEnvironmental health
Electrical engineeringCommunicationsComputer engineeringElectrical/electronics engineering

97
Industrial/manufacturing engineering
Materials/metallurgical engineeringCeramic sciencesMaterials scienceMetallurgical engineering
Mechanical engineeringEngineering mechanicsMechanical engineering
Other engineeringAgricultural engineeringBioengineering/biomedical engineeringEngineering physicsEngineering scienceMining/mineral engineeringNuclear engineeringOcean engineeringOperations researchSystems engineeringEngineering, generalEngineering, other
NON-SCIENCE AND ENGINEERING
EducationCounseling education/counseling and guidance servicesCurriculum/instructionEducational administration/supervisionEducational assessment/test measurementEducational evaluation/researchEducational leadershipEducational psychologyEducational statistics/research methodsEducational/instructional media designSchool psychologySocial/philosophical foundations of educationSpecial education
Teacher educationAdult/continuingElementaryPre-elementary/early childhoodSecondary
Teaching fieldsAgricultural educationArt educationBusiness educationEnglish education

98
Foreign languages educationHealth educationHome economics educationMathematics educationMusic educationPhysical education/coachingReading educationScience educationSocial science educationTeacher education, specific academic and vocational programs, otherTechnical educationTechnical/industrial arts educationTrade/industrial education
Other educationEducation, generalEducation, other
HealthEnvironmental healthEpidemiologyExercise physiology/science, kinesiologyHealth systems/service administrationNursingPharmacyPublic healthRehabilitation/therapeutic servicesSpeech/language pathology, audiologyVeterinary scienceHealth sciences, generalHealth sciences, other
HumanitiesForeign languages/literature
ArabicChineseFrenchGermanHebrewItalianJapaneseRussianSlavic (other than Russian)SpanishOther languages and literature
HistoryHistory, AmericanHistory, AsianHistory, EuropeanHistory, generalHistory, other

99
LettersClassicsComparative literatureEnglish languageLiterature, AmericanLiterature, EnglishSpeech/rhetorical studiesLetters, generalLetters, other
Other humanitiesArt history/criticism/conservationDrama/theater artsMusicPhilosophyReligionHumanities, generalHumanities, other
Professional/otherBusiness management/administrative services
AccountingBanking/financial support servicesBusiness administration/managementBusiness/managerial economicsManagement information systems/business data processing
Data processingMarketing management/researchOperations researchOrganizational behaviorBusiness management/administrative services, generalBusiness management/administrative services, other
Information fieldsCommunication theoryCommunications researchMass communicationsCommunications, generalCommunications, other
Other professional fieldsArchitectural/environmental designHome economicsLawLibrary scienceParks/recreation/leisure/fitnessSocial workTheology/religious educationProfessional fields, generalProfessional fields, other
a This subfield dropped in 2004.b This subfield introduced in 2001.

APPENDIX C: SURVEY QUESTIONNAIRE
Survey of Earned Doctorates
July 1, 2003, to June 30, 2004
Conducted byThe National Opinion Research Center at the University of ChicagoforThe National Science FoundationThe National Institutes of HealthThe U.S. Department of EducationThe National Endowment for the HumanitiesThe U.S. Department of AgricultureThe National Aeronautics and Space Administration
Please print your name in full:
First Name Middle Name Last Name Suffix (e.g., Jr.)
Cross reference: Birth name or former name legally changed
Name of Doctoral Institution City or Branch
Type of Doctoral Degree (e.g., Ph.D., Ed.D., D.B.A.) Date Degree Granted (mm/yyyy)
This information is solicited under the authority of the National Science Foundation Act of 1950, as amended. ALLINFORMATION YOU PROVIDE WILL BE TREATED AS CONFIDENTIAL and used only for research or statisticalpurposes by your doctoral institution, the survey sponsors, their contractors, and collaborating researchers for thepurpose of analyzing data, preparing scientific reports and articles, and selecting samples for a limited number ofcarefully defined follow-up studies. Your Social Security Number is also solicited under the NSF Act of 1950, asamended; provision of it is voluntary. It will be kept confidential. It is used for quality control, to assure that we identifythe correct persons, especially when data are used for statistical purposes in Federal program evaluation. Anyinformation publicly released (such as statistical summaries) will be in a form that does not personally identify you.Your response is voluntary and failure to provide some or all of the requested information will not in any way adverselyaffect you.
The time needed to complete this form varies according to individual circumstances, but the average time is estimatedto be 19 minutes. If you have comments regarding this time estimate, you may write to the National ScienceFoundation, 4201 Wilson Blvd., Arlington, VA 22230, Attention: NSF Reports Clearance Officer. A Federal agencymay not conduct or sponsor a collection of information unless it displays a currently valid OMB control number.
OMB No.: 3145-0019Approval Expires 04/30/2006
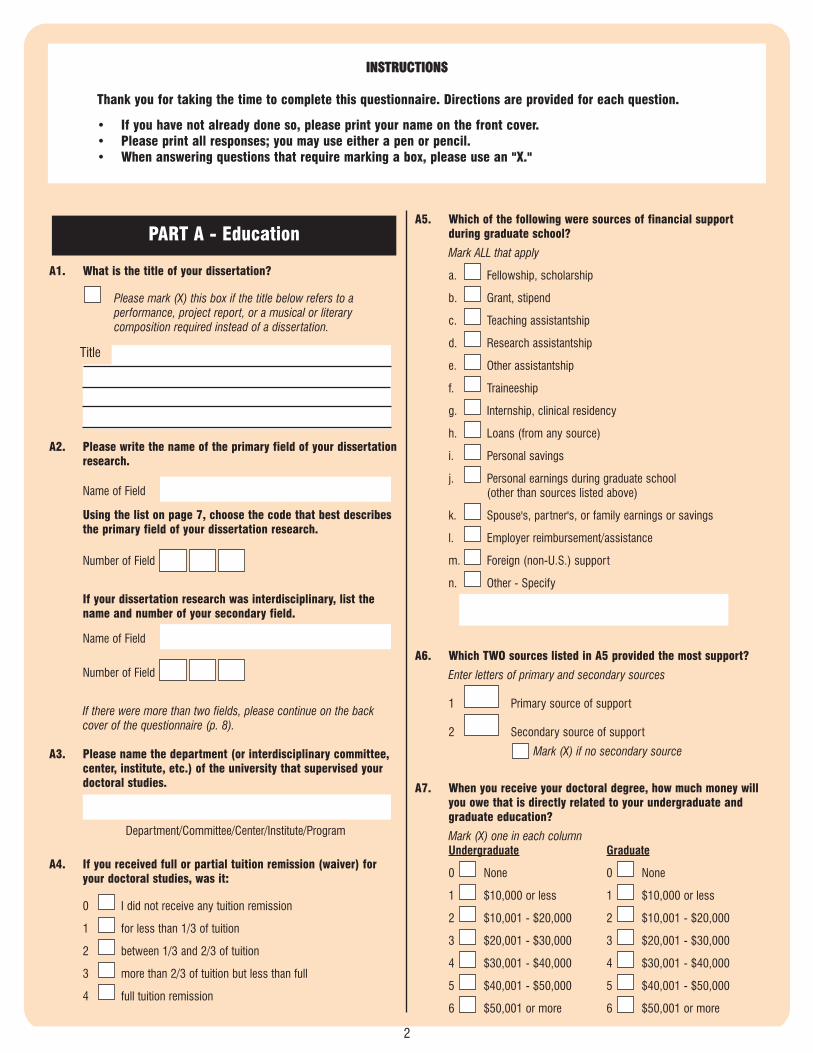
2
INSTRUCTIONS
Thank you for taking the time to complete this questionnaire. Directions are provided for each question.
• If you have not already done so, please print your name on the front cover.• Please print all responses; you may use either a pen or pencil.• When answering questions that require marking a box, please use an "X."
A1. What is the title of your dissertation?
Please mark (X) this box if the title below refers to a performance, project report, or a musical or literary composition required instead of a dissertation.
A2. Please write the name of the primary field of your dissertationresearch.
Name of Field
Using the list on page 7, choose the code that best describesthe primary field of your dissertation research.
Number of Field
If your dissertation research was interdisciplinary, list thename and number of your secondary field.
Name of Field
Number of Field
If there were more than two fields, please continue on the backcover of the questionnaire (p. 8).
A3. Please name the department (or interdisciplinary committee, center, institute, etc.) of the university that supervised your doctoral studies.
Department/Committee/Center/Institute/Program
A4. If you received full or partial tuition remission (waiver) foryour doctoral studies, was it:
0 I did not receive any tuition remission
1 for less than 1/3 of tuition
2 between 1/3 and 2/3 of tuition
3 more than 2/3 of tuition but less than full
4 full tuition remission
A5. Which of the following were sources of financial support during graduate school?
Mark ALL that apply
a. Fellowship, scholarship
b. Grant, stipend
c. Teaching assistantship
d. Research assistantship
e. Other assistantship
f. Traineeship
g. Internship, clinical residency
h. Loans (from any source)
i. Personal savings
j. Personal earnings during graduate school(other than sources listed above)
k. Spouse's, partner's, or family earnings or savings
l. Employer reimbursement/assistance
m. Foreign (non-U.S.) support
n. Other - Specify
A6. Which TWO sources listed in A5 provided the most support?
Enter letters of primary and secondary sources
1 Primary source of support
2 Secondary source of support
Mark (X) if no secondary source
A7. When you receive your doctoral degree, how much money will you owe that is directly related to your undergraduate and graduate education?
Mark (X) one in each columnUndergraduate Graduate
0 None 0 None
1 $10,000 or less 1 $10,000 or less
2 $10,001 - $20,000 2 $10,001 - $20,000
3 $20,001 - $30,000 3 $20,001 - $30,000
4 $30,001 - $40,000 4 $30,001 - $40,000
5 $40,001 - $50,000 5 $40,001 - $50,000
6 $50,001 or more 6 $50,001 or more
PART A - Education
Title
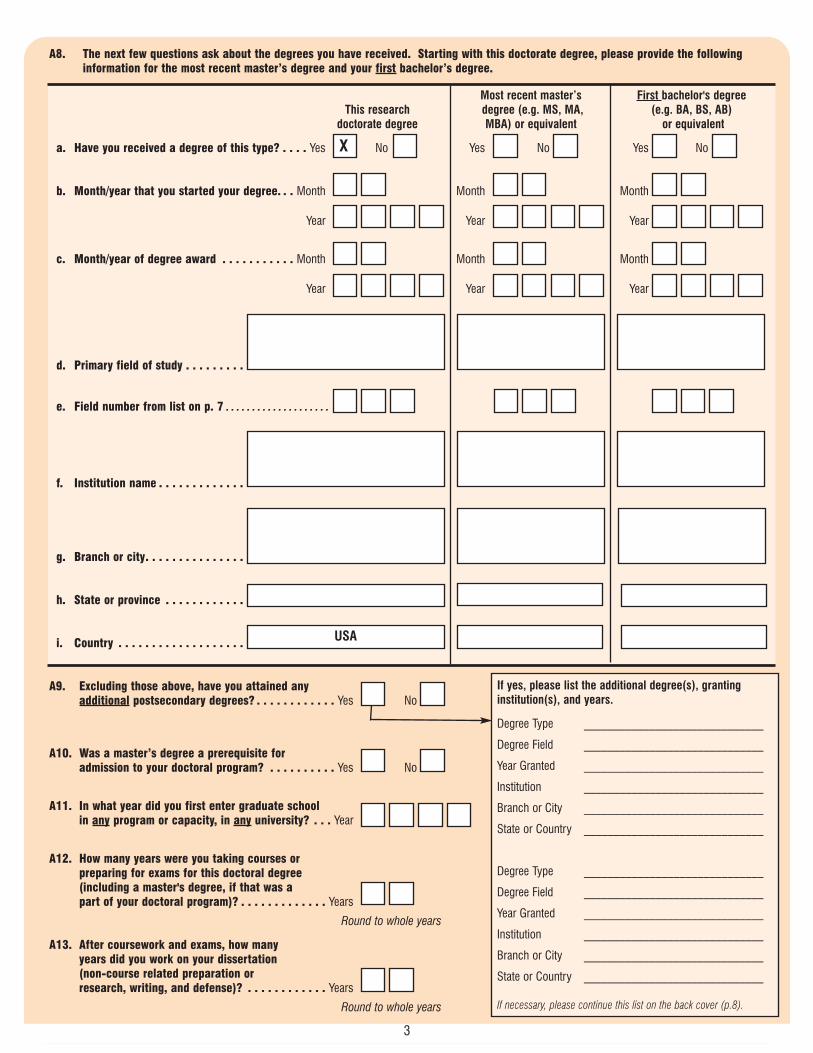
3
A8. The next few questions ask about the degrees you have received. Starting with this doctorate degree, please provide the following information for the most recent master’s degree and your first bachelor’s degree.
Most recent master’s First bachelor's degree This research degree (e.g. MS, MA, (e.g. BA, BS, AB)
doctorate degree MBA) or equivalent or equivalent
a. Have you received a degree of this type? . . . . Yes No Yes No Yes No
b. Month/year that you started your degree. . . Month Month Month
Year Year Year
c. Month/year of degree award . . . . . . . . . . . Month Month Month
Year Year Year
d. Primary field of study . . . . . . . . .
e. Field number from list on p. 7 . . . . . . . . . . . . . . . . . . . .
f. Institution name . . . . . . . . . . . . .
g. Branch or city. . . . . . . . . . . . . . .
h. State or province . . . . . . . . . . . .
i. Country . . . . . . . . . . . . . . . . . . .
A9. Excluding those above, have you attained any additional postsecondary degrees? . . . . . . . . . . . . Yes No
A10. Was a master’s degree a prerequisite for admission to your doctoral program? . . . . . . . . . . Yes No
A11. In what year did you first enter graduate schoolin any program or capacity, in any university? . . . Year
A12. How many years were you taking courses or preparing for exams for this doctoral degree (including a master's degree, if that was a part of your doctoral program)? . . . . . . . . . . . . . Years
Round to whole years
A13. After coursework and exams, how many years did you work on your dissertation (non-course related preparation or research, writing, and defense)? . . . . . . . . . . . . Years
Round to whole years
If yes, please list the additional degree(s), grantinginstitution(s), and years.
Degree Type ______________________________
Degree Field ______________________________
Year Granted ______________________________
Institution ______________________________
Branch or City ______________________________
State or Country ______________________________
Degree Type ______________________________
Degree Field ______________________________
Year Granted ______________________________
Institution ______________________________
Branch or City ______________________________
State or Country ______________________________
If necessary, please continue this list on the back cover (p.8).
USA
X
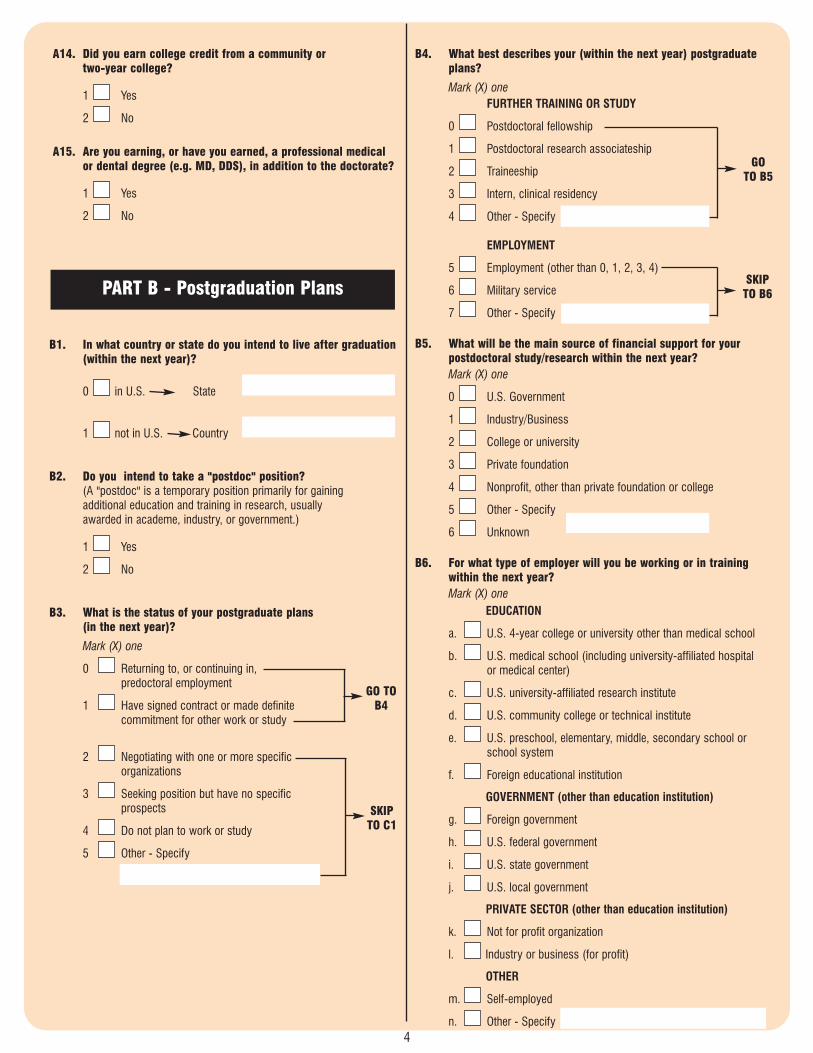
A14. Did you earn college credit from a community ortwo-year college?
1 Yes
2 No
A15. Are you earning, or have you earned, a professional medical or dental degree (e.g. MD, DDS), in addition to the doctorate?
1 Yes
2 No
B1. In what country or state do you intend to live after graduation(within the next year)?
0 in U.S. State
1 not in U.S. Country
B2. Do you intend to take a "postdoc" position? (A "postdoc" is a temporary position primarily for gaining additional education and training in research, usually awarded in academe, industry, or government.)
1 Yes
2 No
B3. What is the status of your postgraduate plans (in the next year)?
Mark (X) one
0 Returning to, or continuing in,predoctoral employment
1 Have signed contract or made definite commitment for other work or study
2 Negotiating with one or more specificorganizations
3 Seeking position but have no specificprospects
4 Do not plan to work or study
5 Other - Specify
B4. What best describes your (within the next year) postgraduate plans?
Mark (X) oneFURTHER TRAINING OR STUDY
0 Postdoctoral fellowship
1 Postdoctoral research associateship
2 Traineeship
3 Intern, clinical residency
4 Other - Specify
EMPLOYMENT
5 Employment (other than 0, 1, 2, 3, 4)
6 Military service
7 Other - Specify
B5. What will be the main source of financial support for your postdoctoral study/research within the next year?Mark (X) one
0 U.S. Government
1 Industry/Business
2 College or university
3 Private foundation
4 Nonprofit, other than private foundation or college
5 Other - Specify
6 Unknown
B6. For what type of employer will you be working or in training within the next year?Mark (X) one
EDUCATION
a. U.S. 4-year college or university other than medical school
b. U.S. medical school (including university-affiliated hospital or medical center)
c. U.S. university-affiliated research institute
d. U.S. community college or technical institute
e. U.S. preschool, elementary, middle, secondary school or school system
f. Foreign educational institution
GOVERNMENT (other than education institution)
g. Foreign government
h. U.S. federal government
i. U.S. state government
j. U.S. local government
PRIVATE SECTOR (other than education institution)
k. Not for profit organization
l. Industry or business (for profit)
OTHER
m. Self-employed
n. Other - Specify
PART B - Postgraduation Plans
SKIPTO C1
GO TOB4
GOTO B5
SKIPTO B6
4
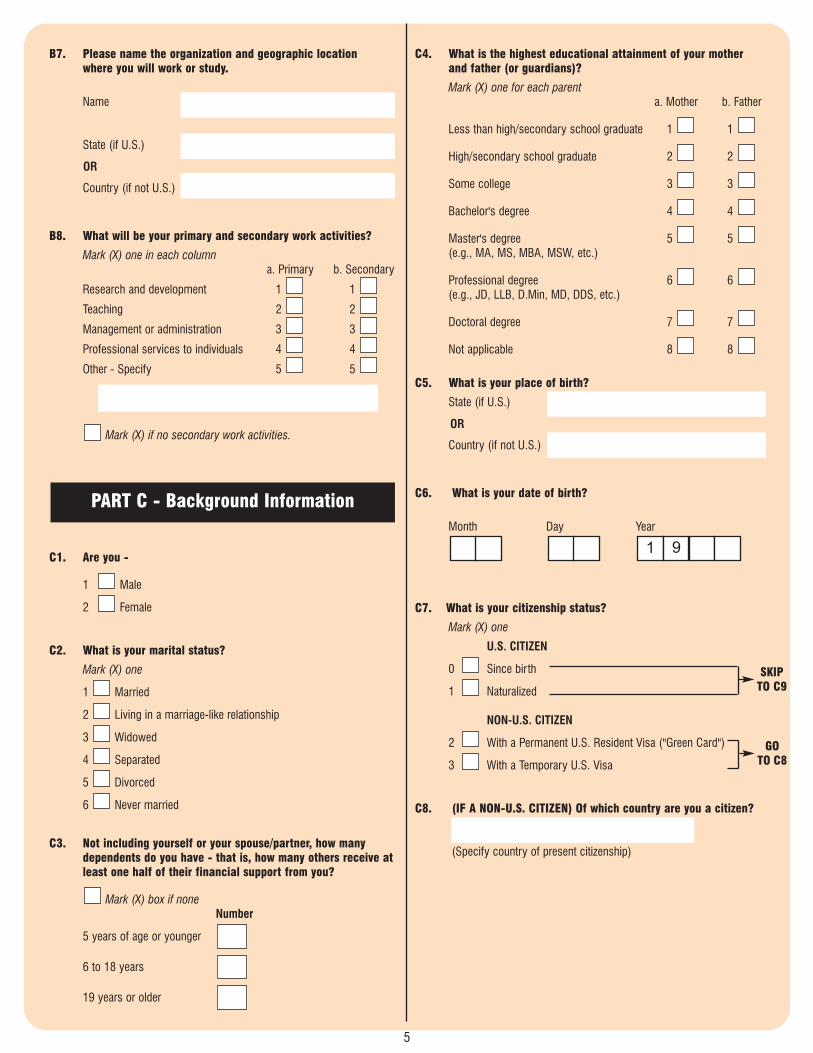
5
GOTO C8
SKIP TO C9
1 9
OR
B7. Please name the organization and geographic location where you will work or study.
Name
State (if U.S.)
Country (if not U.S.)
B8. What will be your primary and secondary work activities?
Mark (X) one in each columna. Primary b. Secondary
Research and development 1 1
Teaching 2 2
Management or administration 3 3
Professional services to individuals 4 4
Other - Specify 5 5
Mark (X) if no secondary work activities.
C1. Are you -
1 Male
2 Female
C2. What is your marital status?
Mark (X) one
1 Married
2 Living in a marriage-like relationship
3 Widowed
4 Separated
5 Divorced
6 Never married
C3. Not including yourself or your spouse/partner, how many dependents do you have - that is, how many others receive at least one half of their financial support from you?
Mark (X) box if noneNumber
5 years of age or younger
6 to 18 years
19 years or older
C4. What is the highest educational attainment of your motherand father (or guardians)?
Mark (X) one for each parenta. Mother b. Father
Less than high/secondary school graduate 1 1
High/secondary school graduate 2 2
Some college 3 3
Bachelor's degree 4 4
Master's degree 5 5 (e.g., MA, MS, MBA, MSW, etc.)
Professional degree 6 6 (e.g., JD, LLB, D.Min, MD, DDS, etc.)
Doctoral degree 7 7
Not applicable 8 8
C5. What is your place of birth?
State (if U.S.)
Country (if not U.S.)
C6. What is your date of birth?
Month Day Year
C7. What is your citizenship status?
Mark (X) one
U.S. CITIZEN
0 Since birth
1 Naturalized
NON-U.S. CITIZEN
2 With a Permanent U.S. Resident Visa ("Green Card")
3 With a Temporary U.S. Visa
C8. (IF A NON-U.S. CITIZEN) Of which country are you a citizen?
(Specify country of present citizenship)
PART C - Background Information
OR

6
C9. In what state or country was the high school/secondary schoolthat you last attended?
State (if U.S.)
Country (if not U.S.)
C10. Are you a person with a disability?
1 Yes GO TO C11
2 No SKIP TO C12
C11. Which of the following categories describes your disability(ies)?
Mark (X) one or more
a. Blind/Visually Impaired
b. Deaf/Hard of Hearing
c. Physical/Orthopedic Disability
d. Learning/Cognitive Disability
e. Vocal/Speech Disability
f. Other - Specify
C12. Are you Hispanic (or Latino)?
1 Yes GO TO C13
2 No SKIP TO C14
C13. Which of the following best describes your Hispanic origin or descent?
Mark (X) one
1 Mexican or Chicano
2 Puerto Rican
3 Cuban
4 Other Hispanic - Specify
C14. What is your racial background? Mark (X) one or more
a. American Indian or Alaska Native
Specify tribal affiliation(s)
b. Native Hawaiian or other Pacific Islander
c. Asian
d. Black or African-American
e. White
C15. Please fill in your U.S. Social Security Number.
- -
C16. In case we need to clarify some of the information you have provided, please list an E-mail address (if applicable), and telephone number where you can be reached.
E-mail address
Daytime telephone
C17. Please provide your address and the name and address of aperson who is likely to know where you can be reached.
Current Address
Street Address
City State Country Zip or Postal Code
Contact Person
First Name Last Name
Street Address
City State Country Zip or Postal Code
Phone Number (including area or country code)
E-mail Address
C18. Please sign and date.
Signature Date
OR
The results of this survey will be published in a Summary Report;The Summary Reports on earlier surveys are available athttp://www.norc.uchicago.edu/issues/docdata.htm
Please use the back cover to make any additional comments youmay have about this survey.
Thank you for completing the questionnaire. Please return thisquestionnaire to your GRADUATE SCHOOL for forwarding to Survey of Earned Doctorates, NORC at the University of Chicago, 1 N. State Street, Floor 16, Chicago, IL 60602. If you have questions or concerns about the survey, you may contact us by e-mail at [email protected] or phone at 1-800-248-8649.
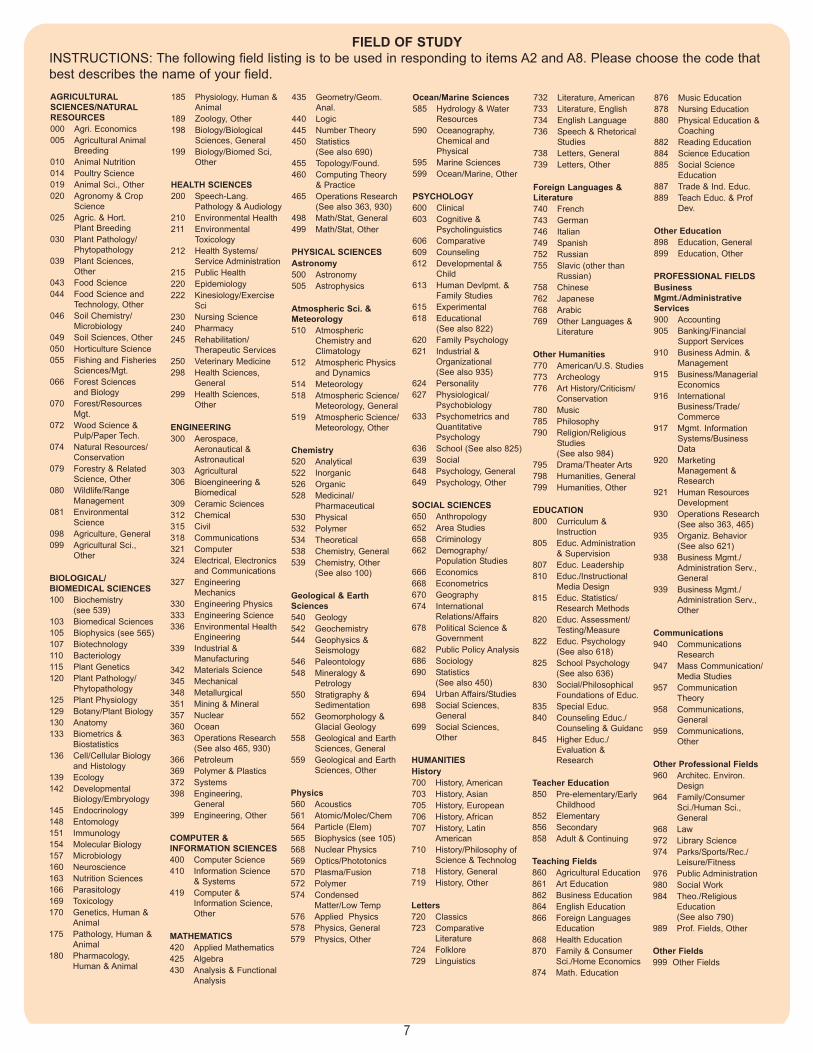
7
AGRICULTURALSCIENCES/NATURALRESOURCES000 Agri. Economics005 Agricultural Animal
Breeding010 Animal Nutrition014 Poultry Science019 Animal Sci., Other020 Agronomy & Crop
Science025 Agric. & Hort.
Plant Breeding030 Plant Pathology/
Phytopathology039 Plant Sciences,
Other043 Food Science044 Food Science and
Technology, Other046 Soil Chemistry/
Microbiology049 Soil Sciences, Other050 Horticulture Science055 Fishing and Fisheries
Sciences/Mgt.066 Forest Sciences
and Biology070 Forest/Resources
Mgt.072 Wood Science &
Pulp/Paper Tech.074 Natural Resources/
Conservation079 Forestry & Related
Science, Other080 Wildlife/Range
Management081 Environmental
Science098 Agriculture, General099 Agricultural Sci.,
Other
BIOLOGICAL/BIOMEDICAL SCIENCES100 Biochemistry
(see 539)103 Biomedical Sciences105 Biophysics (see 565)107 Biotechnology110 Bacteriology115 Plant Genetics120 Plant Pathology/
Phytopathology125 Plant Physiology129 Botany/Plant Biology130 Anatomy133 Biometrics &
Biostatistics136 Cell/Cellular Biology
and Histology139 Ecology142 Developmental
Biology/Embryology145 Endocrinology148 Entomology151 Immunology154 Molecular Biology157 Microbiology160 Neuroscience163 Nutrition Sciences166 Parasitology169 Toxicology170 Genetics, Human &
Animal175 Pathology, Human &
Animal180 Pharmacology,
Human & Animal
185 Physiology, Human & Animal
189 Zoology, Other198 Biology/Biological
Sciences, General199 Biology/Biomed Sci,
Other
HEALTH SCIENCES200 Speech-Lang.
Pathology & Audiology210 Environmental Health211 Environmental
Toxicology212 Health Systems/
Service Administration215 Public Health220 Epidemiology222 Kinesiology/Exercise
Sci230 Nursing Science240 Pharmacy245 Rehabilitation/
Therapeutic Services250 Veterinary Medicine298 Health Sciences,
General299 Health Sciences,
Other
ENGINEERING300 Aerospace,
Aeronautical & Astronautical
303 Agricultural306 Bioengineering &
Biomedical309 Ceramic Sciences312 Chemical315 Civil318 Communications321 Computer324 Electrical, Electronics
and Communications327 Engineering
Mechanics330 Engineering Physics333 Engineering Science336 Environmental Health
Engineering339 Industrial &
Manufacturing342 Materials Science345 Mechanical348 Metallurgical351 Mining & Mineral357 Nuclear360 Ocean363 Operations Research
(See also 465, 930)366 Petroleum369 Polymer & Plastics372 Systems398 Engineering,
General399 Engineering, Other
COMPUTER &INFORMATION SCIENCES400 Computer Science410 Information Science
& Systems419 Computer &
Information Science, Other
MATHEMATICS420 Applied Mathematics425 Algebra430 Analysis & Functional
Analysis
435 Geometry/Geom. Anal.
440 Logic 445 Number Theory450 Statistics
(See also 690)455 Topology/Found.460 Computing Theory
& Practice 465 Operations Research
(See also 363, 930)498 Math/Stat, General499 Math/Stat, Other
PHYSICAL SCIENCESAstronomy500 Astronomy505 Astrophysics
Atmospheric Sci. &Meteorology510 Atmospheric
Chemistry and Climatology
512 Atmospheric Physicsand Dynamics
514 Meteorology518 Atmospheric Science/
Meteorology, General519 Atmospheric Science/
Meteorology, Other
Chemistry520 Analytical522 Inorganic526 Organic528 Medicinal/
Pharmaceutical530 Physical532 Polymer534 Theoretical538 Chemistry, General539 Chemistry, Other
(See also 100)
Geological & EarthSciences540 Geology542 Geochemistry544 Geophysics &
Seismology546 Paleontology548 Mineralogy &
Petrology550 Stratigraphy &
Sedimentation552 Geomorphology &
Glacial Geology558 Geological and Earth
Sciences, General559 Geological and Earth
Sciences, Other
Physics560 Acoustics561 Atomic/Molec/Chem 564 Particle (Elem) 565 Biophysics (see 105)568 Nuclear Physics569 Optics/Phototonics570 Plasma/Fusion572 Polymer574 Condensed
Matter/Low Temp576 Applied Physics578 Physics, General579 Physics, Other
Ocean/Marine Sciences585 Hydrology & Water
Resources590 Oceanography,
Chemical and Physical
595 Marine Sciences599 Ocean/Marine, Other
PSYCHOLOGY600 Clinical603 Cognitive &
Psycholinguistics606 Comparative609 Counseling612 Developmental &
Child613 Human Devlpmt. &
Family Studies615 Experimental618 Educational
(See also 822)620 Family Psychology 621 Industrial &
Organizational(See also 935)
624 Personality627 Physiological/
Psychobiology633 Psychometrics and
Quantitative Psychology
636 School (See also 825)639 Social648 Psychology, General649 Psychology, Other
SOCIAL SCIENCES650 Anthropology652 Area Studies658 Criminology662 Demography/
Population Studies666 Economics668 Econometrics670 Geography674 International
Relations/Affairs678 Political Science &
Government682 Public Policy Analysis686 Sociology690 Statistics
(See also 450)694 Urban Affairs/Studies698 Social Sciences,
General699 Social Sciences,
Other
HUMANITIESHistory700 History, American703 History, Asian705 History, European706 History, African707 History, Latin
American710 History/Philosophy of
Science & Technolog718 History, General719 History, Other
Letters720 Classics723 Comparative
Literature724 Folklore729 Linguistics
732 Literature, American733 Literature, English734 English Language736 Speech & Rhetorical
Studies738 Letters, General739 Letters, Other
Foreign Languages &Literature740 French743 German746 Italian749 Spanish752 Russian755 Slavic (other than
Russian)758 Chinese762 Japanese768 Arabic769 Other Languages &
Literature
Other Humanities770 American/U.S. Studies773 Archeology776 Art History/Criticism/
Conservation780 Music785 Philosophy790 Religion/Religious
Studies (See also 984)
795 Drama/Theater Arts798 Humanities, General799 Humanities, Other
EDUCATION800 Curriculum &
Instruction805 Educ. Administration
& Supervision807 Educ. Leadership810 Educ./Instructional
Media Design815 Educ. Statistics/
Research Methods820 Educ. Assessment/
Testing/Measure822 Educ. Psychology
(See also 618)825 School Psychology
(See also 636)830 Social/Philosophical
Foundations of Educ.835 Special Educ.840 Counseling Educ./
Counseling & Guidanc845 Higher Educ./
Evaluation & Research
Teacher Education850 Pre-elementary/Early
Childhood852 Elementary856 Secondary858 Adult & Continuing
Teaching Fields860 Agricultural Education861 Art Education862 Business Education864 English Education866 Foreign Languages
Education868 Health Education870 Family & Consumer
Sci./Home Economics874 Math. Education
876 Music Education878 Nursing Education880 Physical Education &
Coaching882 Reading Education884 Science Education885 Social Science
Education887 Trade & Ind. Educ.889 Teach Educ. & Prof
Dev.
Other Education898 Education, General899 Education, Other
PROFESSIONAL FIELDSBusinessMgmt./AdministrativeServices900 Accounting905 Banking/Financial
Support Services910 Business Admin. &
Management915 Business/Managerial
Economics916 International
Business/Trade/ Commerce
917 Mgmt. Information Systems/Business Data
920 Marketing Management & Research
921 Human Resources Development
930 Operations Research(See also 363, 465)
935 Organiz. Behavior (See also 621)
938 Business Mgmt./ Administration Serv., General
939 Business Mgmt./ Administration Serv., Other
Communications940 Communications
Research947 Mass Communication/
Media Studies957 Communication
Theory958 Communications,
General959 Communications,
Other
Other Professional Fields960 Architec. Environ.
Design964 Family/Consumer
Sci./Human Sci., General
968 Law972 Library Science974 Parks/Sports/Rec./
Leisure/Fitness976 Public Administration980 Social Work984 Theo./Religious
Education (See also 790)
989 Prof. Fields, Other
Other Fields999 Other Fields
FIELD OF STUDYINSTRUCTIONS: The following field listing is to be used in responding to items A2 and A8. Please choose the code thatbest describes the name of your field.
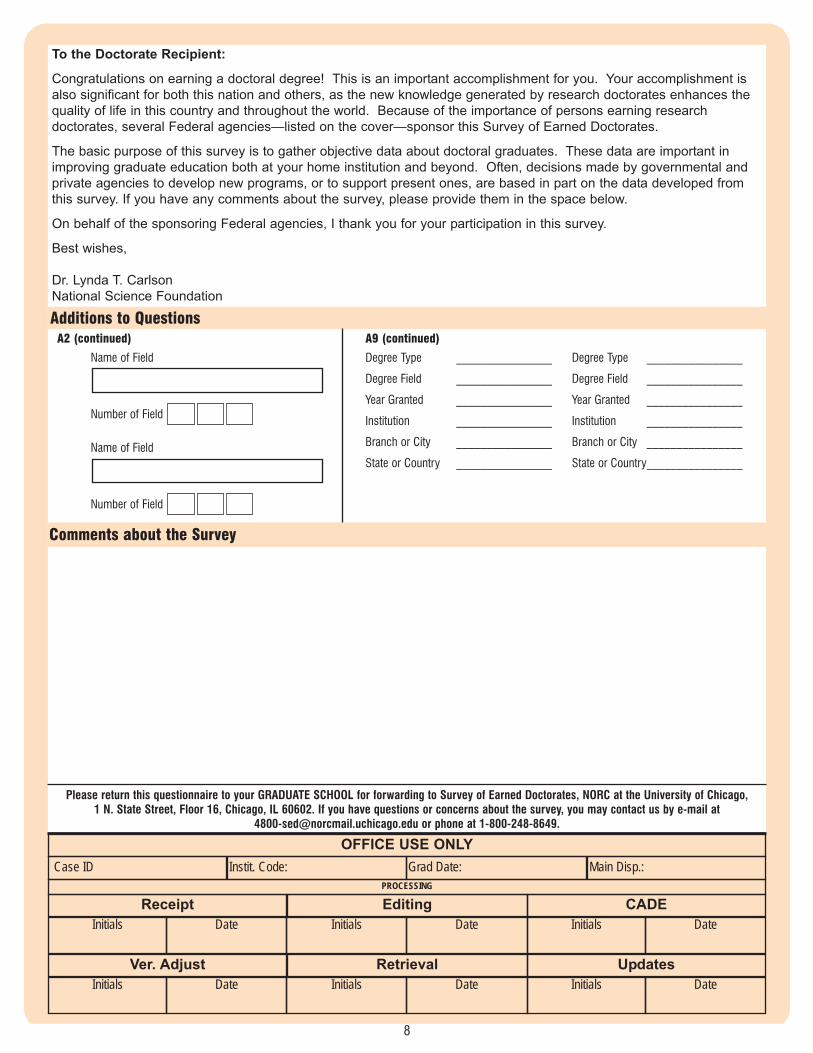
To the Doctorate Recipient:
Congratulations on earning a doctoral degree! This is an important accomplishment for you. Your accomplishment isalso significant for both this nation and others, as the new knowledge generated by research doctorates enhances thequality of life in this country and throughout the world. Because of the importance of persons earning researchdoctorates, several Federal agencies—listed on the cover—sponsor this Survey of Earned Doctorates.
The basic purpose of this survey is to gather objective data about doctoral graduates. These data are important inimproving graduate education both at your home institution and beyond. Often, decisions made by governmental andprivate agencies to develop new programs, or to support present ones, are based in part on the data developed fromthis survey. If you have any comments about the survey, please provide them in the space below.
On behalf of the sponsoring Federal agencies, I thank you for your participation in this survey.
Best wishes,
Dr. Lynda T. CarlsonNational Science Foundation
8
OFFICE USE ONLYCase ID Instit. Code: Grad Date: Main Disp.:
PROCESSING
Ver. Adjust Retrieval UpdatesInitials Date Initials Date Initials Date
Receipt Editing CADEInitials Date Initials Date Initials Date
A2 (continued)
Name of Field
Number of Field
Name of Field
Number of Field
A9 (continued)
Degree Type ________________ Degree Type ________________
Degree Field ________________ Degree Field ________________
Year Granted ________________ Year Granted ________________
Institution ________________ Institution ________________
Branch or City ________________ Branch or City ________________
State or Country ________________ State or Country________________
Additions to Questions
Comments about the Survey
Please return this questionnaire to your GRADUATE SCHOOL for forwarding to Survey of Earned Doctorates, NORC at the University of Chicago, 1 N. State Street, Floor 16, Chicago, IL 60602. If you have questions or concerns about the survey, you may contact us by e-mail at
[email protected] or phone at 1-800-248-8649.