School integration and the open Door Philosophy · School integration and the open Door ... School...
28
109 School Integration and the Open Door Philosophy: Rethinking the Economic and Racial Composition of Community Colleges SARA GOLDRICK-RAB and PETER KINSLEY T here is longstanding and widespread interest in the relationship between the student composition of American schools and the out- comes they achieve, traceable to the famous finding of the Coleman Report that “the social composition of the student body is more highly related to achievement, independent of the student’s own social back- ground, than is any school factor.” 1 African American and low-income students in particular appear to benefit academically from attending more-integrated schools. 2 While reasons for the seemingly positive influ- ence of integration continue to be debated, segregation is nevertheless generally considered unacceptable in primary and secondary schooling, even as social class and race continues to segregate schools’ surrounding neighborhoods. 3 Opportunities for learning, peer cultures, teacher qual- ity and attitudes are all demonstrably constrained when students are confined to different spaces according to their family and cultural back- grounds. Thus, while the politics of desegregation are entrenched, efforts to decouple the composition of neighborhoods from the composition of schools continue, many decades after Brown v. Board of Education. 4 We thank the Aspen Institute for providing data, and Derria Byrd and Sara Lazenby for providing research assistance.
Transcript of School integration and the open Door Philosophy · School integration and the open Door ... School...

109
School integration and the open Door Philosophy:
Rethinking the Economic and Racial Composition of Community Colleges
SARA GoLDRiCK-RAB and PETER KiNSLEy
There is longstanding and widespread interest in the relationship between the student composition of American schools and the out-
comes they achieve, traceable to the famous finding of the Coleman Report that “the social composition of the student body is more highly related to achievement, independent of the student’s own social back-ground, than is any school factor.”1 African American and low-income students in particular appear to benefit academically from attending more-integrated schools.2 While reasons for the seemingly positive influ-ence of integration continue to be debated, segregation is nevertheless generally considered unacceptable in primary and secondary schooling, even as social class and race continues to segregate schools’ surrounding neighborhoods.3 Opportunities for learning, peer cultures, teacher qual-ity and attitudes are all demonstrably constrained when students are confined to different spaces according to their family and cultural back-grounds. Thus, while the politics of desegregation are entrenched, efforts to decouple the composition of neighborhoods from the composition of schools continue, many decades after Brown v. Board of Education.4
We thank the Aspen Institute for providing data, and Derria Byrd and Sara Lazenby for providing research assistance.
110 Bridging the Higher Education Divide
The situation in postsecondary education is quite different. When it comes to the composition of colleges and universities, far less atten-tion is paid to whether school-level integration by social class or race is achieved; rather the common focus is on opportunity for participation. In other words, the emphasis is typically placed on whether students from different backgrounds face similar chances of admission to institutions of higher education, rather than whether they experience and benefit from integrated learning environments once enrolled. This is likely partly attributable to societal norms treating K–12 schooling as a right and col-lege as a privilege. It is also due to the widely accepted process of selective admissions shaping the college prospects of about one-fourth of Ameri-can undergraduates.5 But even at community colleges led with an “open door” philosophy, accessible by everyone in the neighborhood or district (irrespective, even, of high school graduation status), assessments of inte-gration are rarely conducted.6 Instead, the friendlier term “diversity” is used as a term of assessment, drawing attention to how many minority and/or low-income students are represented, rather than to the relative representation of groups strongly denoted by the term integration.7
If we accept the lessons from K–12 education that an integrated stu-dent body is preferable to a segregated student body when it comes to opportunities for learning, then we must confront the fact that most of the nation’s colleges and universities are highly segregated.8 Many states have perpetuated what expert Clifton Conrad calls “dual and unequal systems” of public higher education, in which historically black colleges and universities (HBCUs) remain under-resourced and threatened when compared with historically white colleges and universities.9 Academic analyses of this problem tend to focus on the four-year sector, perhaps because access to the baccalaureate is a critical point for upward social mobility.10 But the fact remains that in many parts of the United States, community colleges often enroll more Pell-eligible students and racial/ethnic minorities than many elite universities put together. For this, com-munity colleges are typically praised for their diversity while elite uni-versities are derided for a lack of diversity. Yet, in both cases, while the causes differ, segregation defines their student composition and corre-sponding opportunities for learning. The contribution of selective admis-sions policies and the use of test scores in creating this segregation is the subject of many other papers; in this one, we consider the dynamics of segregation among community colleges, where doors are wide open.
We focus on community colleges since they are the most affordable and accessible starting point in higher education, and thus the most

School Integration and the Open Door Philosophy 111
common place for first-generation and racial/ethnic minority students to enter the postsecondary arena.11 The research evidence pointing to the benefits of integration suggests that these are precisely the kinds of stu-dents who most benefit from participation in inclusive environments.12 Growing up in segregated neighborhoods, children from disadvantaged backgrounds seem to excel when placed into K–12 schooling with chil-dren from more-advantaged backgrounds, and given that community college education is often essentially a continuation of K–12 schooling there is little reason to expect the effects would be differ in that set-ting. The problem is that the challenges facing K–12 schools in achiev-ing integration are also faced by community colleges, but policymakers do far less to ensure that integration occurs. As inherently neighborhood institutions, community colleges are mission-driven to serve and repre-sent their geographic regions. They fulfill this task: we find that more than three-quarters of the variation in racial composition among com-munity colleges is directly attributable to the racial composition of their surrounding geographic locales. Given this tight relationship between housing and school integration, until neighborhoods are integrated, most community colleges will not be, absent affirmative steps.13
In this paper we document the extent of segregation in the nation’s community colleges, and consider its relationship to neighborhood seg-regation. We further compare the organizational and institutional char-acteristics of community colleges enrolling segregated versus integrated student bodies, documenting many of the same sorts of resource dis-parities in the postsecondary setting that are well-documented in K–12. Then, we turn to lessons from analyses of documents written by com-munity colleges (for the Aspen Prize for Community College Excellence) and interviews we conducted with community colleges that are more integrated than their surrounding counties would anticipate. Our results suggest that some communities are taking actions to diversify four-year institutions, steps that have the side effect of also better integrating com-munity colleges. While recruiting more low-income and racial/ethnic minority high school graduates for four-year institutions rather than community colleges might reduce overall community college enrollment (desirable in some states due to crowding), it also effectively balances out the representation of students in both two-year and four-year set-tings, driving down the representation of poor and minority students at community colleges and increasing their representation at four-year public institutions. While such a strategy is not without substantial cost (for example, more financial aid is needed to finance a four-year

112 Bridging the Higher Education Divide
education) and difficulty (for example, students must gain admission to four-year institutions), as well as other challenges (such as the geo-graphic availability of four-year opportunities), it may result in more integrated and thus seemingly preferable learning environments in both spaces. Reforms in high schools, such as those aimed at improving the academic match between students and colleges, would seem likely to propel further moves in this direction.14
RESEARCh quESTioNS
In order to consider the relationship between integration and the open-door policies of American community colleges, we ask the following questions: (1) What proportion of community colleges is economically and/or racially diverse? (2) How do the organizational characteristics of integrated community colleges compare to those that are segregated? (3) How well does geographic racial/ethnic and social class composition predict student body composition on those dimensions in community colleges? (4) How do the actual and expected student body composi-tion (based on geography) at community colleges compare? How many community colleges appear out of sync with their geographic regions in a direction leaning toward more integration rather than segregation? (5) What factors seem to contribute to the ability of community colleges to achieve more integrated student bodies than expected?
METhoDoLoGy
We examine these questions with national community college institu-tional data from the National Center for Education Statistics’ 2010 Integrated Postsecondary Education Data System (IPEDS), merged with county-level data from the U.S. Census Bureau’s 2010 American Com-munity Survey. In addition, we supplement the analysis for the fifth question with data on a subset of community colleges from around the nation assembled by the Aspen Institute for its annual Prize for Com-munity College Excellence competition, and a set of informal interviews conducted with institutions identified as outliers in the analysis for question four.15 IPEDS data are limited for community colleges because IPEDS misses many students, but we use these data in the absence of anything better.
Addressing the first two research questions requires enumerating the number and characteristics of community colleges at various levels of

School Integration and the Open Door Philosophy 113
economic and racial integration nationally, and then comparing college characteristics across these levels. Next, we address research question three by using OLS regression models to consider whether it is possible to explain levels of compositional diversity solely utilizing observable geographic characteristics of the communities in which the institutions are located.16 These analyses provide some insight into the potential for community colleges to alter existing levels of segregation as a matter of institutional policy.
We then use the geographic models to predict the level of expected integration for each college, which we compare to the actual level of integration at the college. We subsequently sort community colleges into categories based on whether they are more or less integrated than expected. Setting aside any normative or value judgments, we consider whether greater integration seems to be achieved through an overrepre-sentation of advantaged (that is, middle income and/or white) students, an overrepresentation of disadvantaged students, or an underrepresenta-tion of disadvantaged students. In each case, representation is a relative term, and comparisons are made to communities. Finally, we leverage qualitative data from the Aspen Prize applications along with data from informal interviews conducted with specific “outlier” colleges to exam-ine how these colleges seem to differ from the others in terms of how they define student success, use data, construct policies and practices, and create diversity.17
DEFiNiNG iNTEGRATioN
For many decades, policymakers, lawyers, practitioners, educators, and parents have fought over what constitutes an “integrated” school. While many can agree that integration implies a “balance” of some kind, the inherent relativity of the term and its political connotations make it hard to arrive at a clear and uncontroversial definition. Yet definitions are critical for the creation of comparisons, and thus we undertake them here in the spirit of knowingly quantifying the possibly unquantifiable— for pragmatic reasons, if nothing else.
A college’s level of economic integration is based on the proportion of first-time, full-time, degree-seeking students receiving a Pell Grant. This is the best available measure and yet is a highly flawed proxy for low-income representation at an institution because it is affected by Free Application for Federal Student Aid (FAFSA) completion rates, incon-sistent methods used by community colleges to determine first-time and
114 Bridging the Higher Education Divide
degree-seeking students, and the fact that only a fraction of community college students enroll full-time.18 More straightforward is a college’s level of racial integration which we base on the proportion of racial or ethnic minority students in the entire student body.19
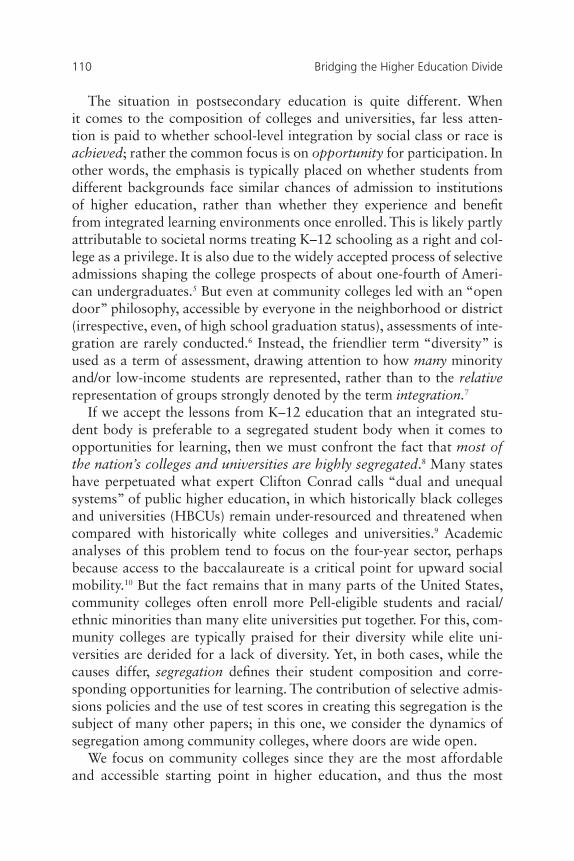
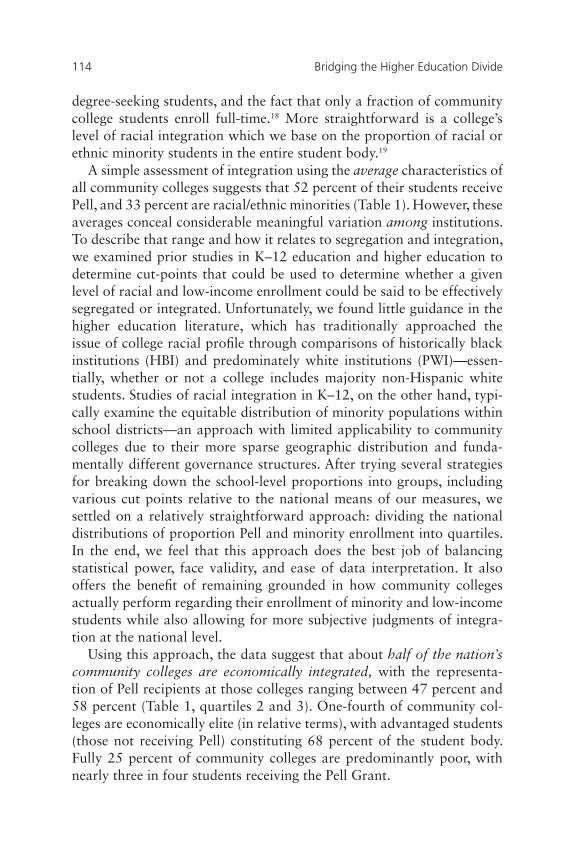
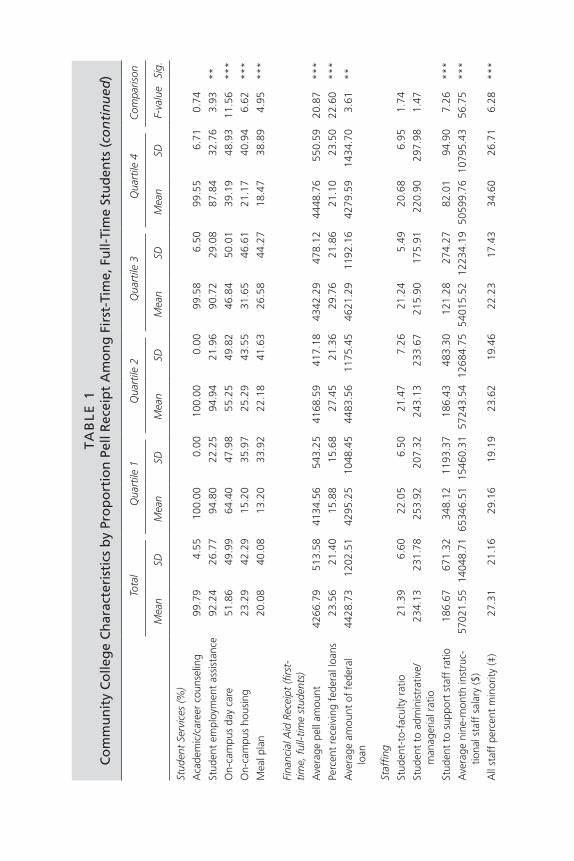
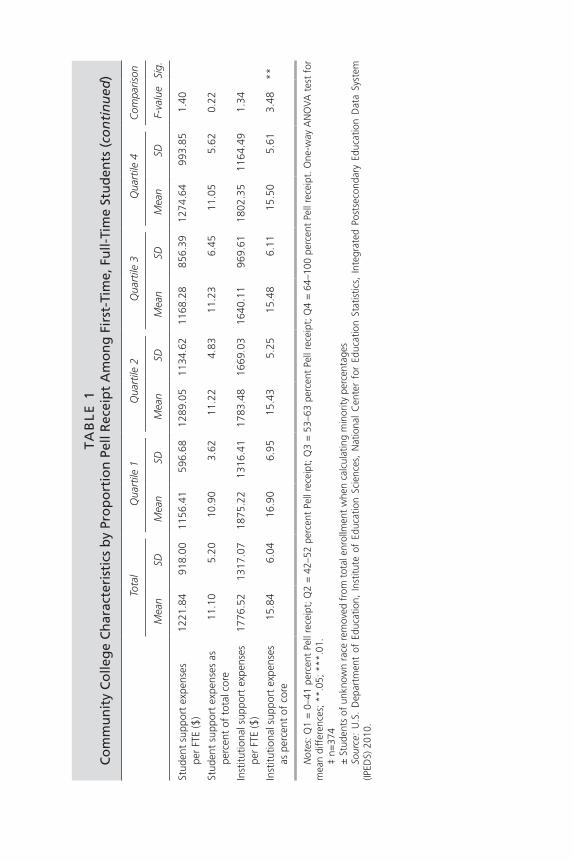
A simple assessment of integration using the average characteristics of all community colleges suggests that 52 percent of their students receive Pell, and 33 percent are racial/ethnic minorities (Table 1). However, these averages conceal considerable meaningful variation among institutions. To describe that range and how it relates to segregation and integration, we examined prior studies in K–12 education and higher education to determine cut-points that could be used to determine whether a given level of racial and low-income enrollment could be said to be effectively segregated or integrated. Unfortunately, we found little guidance in the higher education literature, which has traditionally approached the issue of college racial profile through comparisons of historically black institutions (HBI) and predominately white institutions (PWI)—essen-tially, whether or not a college includes majority non-Hispanic white students. Studies of racial integration in K–12, on the other hand, typi-cally examine the equitable distribution of minority populations within school districts—an approach with limited applicability to community colleges due to their more sparse geographic distribution and funda-mentally different governance structures. After trying several strategies for breaking down the school-level proportions into groups, including various cut points relative to the national means of our measures, we settled on a relatively straightforward approach: dividing the national distributions of proportion Pell and minority enrollment into quartiles. In the end, we feel that this approach does the best job of balancing statistical power, face validity, and ease of data interpretation. It also offers the benefit of remaining grounded in how community colleges actually perform regarding their enrollment of minority and low-income students while also allowing for more subjective judgments of integra-tion at the national level.
Using this approach, the data suggest that about half of the nation’s community colleges are economically integrated, with the representa-tion of Pell recipients at those colleges ranging between 47 percent and 58 percent (Table 1, quartiles 2 and 3). One-fourth of community col-leges are economically elite (in relative terms), with advantaged students (those not receiving Pell) constituting 68 percent of the student body. Fully 25 percent of community colleges are predominantly poor, with nearly three in four students receiving the Pell Grant.

TA
BL
E 1
Co
mm
un
ity
Co
lleg
e C
har
acte
rist
ics
by
Pro
po
rtio
n P
ell R
ecei
pt
Am
on
g F
irst
-Tim
e, F
ull-
Tim
e St
ud
ents
Tota
l
Q
uart
ile 1
Q
uart
ile 2
Qua
rtile
3Q
uart
ile 4
Com
paris
on
Mea
nSD
Mea
nSD
Mea
nSD
Mea
nSD
Mea
nSD
F-va
lue
Sig.
N(9
66)
(250
)(2
57)
(237
)(2
22)
Enro
llmen
t C
ompo
sitio
n (%
)
Tota
l enr
ollm
ent
7461
.96
7401
.38
1058
4.37
8650
.14
7973
.22
7887
.03
6180
.47
5801
.61
4721
.92
5124
.35
30.2
8**
*
Pell
(firs
t-tim
e, f
ull-t
ime)
51.8
915
.85
32.0
67.
3947
.36
3.09
57.9
33.
2273
.02
7.57
2176
.00
***
Min
ority
(±)
32.5
322
.67
30.1
715
.91
28.8
019
.46
28.4
121
.63
43.9
329
.13
26.5
2**
*
Fem
ale
58.0
87.
4755
.79
6.34
56.6
38.
3258
.68
6.26
61.6
97.
3831
.57
***
Full-
time
45.3
114
.02
40.2
712
.65
43.8
413
.49
47.0
913
.48
50.7
714
.43
26.1
0**
*
Full-
time,
firs
t-tim
e de
gree
se
ekin
g12
.77
7.17
10.9
57.
1712
.58
7.49
13.4
96.
2314
.28
7.33
9.73
***
Cos
t of
Att
enda
nce
($)
Tota
l cos
t of
att
enda
nce
1
5116
.15
3178
.21
1590
6.98
3183
.11
1507
6.48
3261
.27
1501
6.52
2669
.81
1438
7.42
3395
.46
9.12
***
Inst
ruct
iona
l Off
erin
gs (%
)
Occ
upat
iona
l97
.31
16.1
998
.00
14.0
398
.05
13.8
497
.05
16.9
795
.95
19.7
70.
88
Aca
dem
ic96
.58
18.1
799
.20
8.93
97.2
816
.31
98.3
112
.91
90.9
928
.70
9.84
***
Dis
tanc
e le
arni
ng98
.03
13.8
997
.60
15.3
498
.44
12.4
010
0.00
0.00
95.9
519
.77
3.44
**
Wee
kend
/eve
ning
pro
gram
s61
.80
48.6
166
.80
47.1
959
.92
49.1
059
.92
49.1
160
.36
49.0
31.
19
Rem
edia
l ser
vice
s99
.48
7.18
99.2
08.
9399
.61
6.24
100.
000.
0099
.10
9.47
0.78
(con
tinue
d)
Stud
ent
Serv
ices
(%)
Aca
dem
ic/c
aree
r co
unse
ling
99.7
94.
5510
0.00
0.00
100.
000.
0099
.58
6.50
99.5
56.
710.
74
Stud
ent
empl
oym
ent
assi
stan
ce92
.24
26.7
794
.80
22.2
594
.94
21.9
690
.72
29.0
887
.84
32.7
63.
93**
On-
cam
pus
day
care
51.8
649
.99
64.4
047
.98
55.2
549
.82
46.8
450
.01
39.1
948
.93
11.5
6**
*
On-
cam
pus
hous
ing
23.2
942
.29
15.2
035
.97
25.2
943
.55
31.6
546
.61
21.1
740
.94
6.62
***
Mea
l pla
n20
.08
40.0
813
.20
33.9
222
.18
41.6
326
.58
44.2
718
.47
38.8
94.
95**
*
Fina
ncia
l Aid
Rec
eipt
(firs
t-
time,
ful
l-tim
e st
uden
ts)
Ave
rage
pel
l am
ount
42
66.7
951
3.58
4134
.56
543.
2541
68.5
941
7.18
4342
.29
478.
1244
48.7
655
0.59
20.8
7**
*
Perc
ent
rece
ivin
g fe
dera
l loa
ns23
.56
21.4
015
.88
15.6
827
.45
21.3
629
.76
21.8
621
.10
23.5
022
.60
***
Ave
rage
am
ount
of
fede
ral
loan
44
28.7
312
02.5
142
95.2
510
48.4
544
83.5
611
75.4
546
21.2
911
92.1
642
79.5
914
34.7
03.
61**
Staf
fing
Stud
ent-
to-f
acul
ty r
atio
21.3
96.
6022
.05
6.50
21.4
77.
2621
.24
5.49
20.6
86.
951.
74
Stud
ent
to a
dmin
istr
ativ
e/m
anag
eria
l rat
io23
4.13
231.
7825
3.92
207.
3224
3.13
233.
6721
5.90
175.
9122
0.90
297.
981.
47
Stud
ent
to s
uppo
rt s
taff
rat
io18
6.67
671.
3234
8.12
1193
.37
186.
4348
3.30
121.
2827
4.27
82.0
194
.90
7.26
***
Ave
rage
nin
e-m
onth
inst
ruc-
tiona
l sta
ff s
alar
y ($
)57
021.
5514
048.
7165
346.
5115
460.
3157
243.
5412
684.
7554
015.
5212
234.
1950
599.
7610
795.
4356
.75
***
All
staf
f pe
rcen
t m
inor
ity (‡
)27
.31
21.1
629
.16
19.1
923
.62
19.4
622
.23
17.4
334
.60
26.7
16.
28**
*
TA
BL
E 1
Co
mm
un
ity
Co
lleg
e C
har
acte
rist
ics
by
Pro
po
rtio
n P
ell R
ecei
pt
Am
on
g F
irst
-Tim
e, F
ull-
Tim
e St
ud
ents
(co
nti
nu
ed)
Tota
l
Q
uart
ile 1
Q
uart
ile 2
Qua
rtile
3Q
uart
ile 4
Com
paris
on
Mea
nSD
Mea
nSD
Mea
nSD
Mea
nSD
Mea
nSD
F-va
lue
Sig.

Inst
ruct
iona
l sta
ff p
erce
nt
min
ority
(‡)
23.7
420
.33
25.9
820
.13
20.1
917
.03
19.3
116
.83
29.5
925
.52
5.12
***
Reve
nues
Cor
e re
venu
es ($
mill
ion)
53.7
050
.25
72.7
158
.89
56.4
350
.89
45.1
839
.02
38.2
441
.95
22.9
0**
*
Reve
nues
fro
m t
uitio
n an
d
fees
per
FTE
($)
1939
.45
1191
.31
2146
.09
1331
.70
2130
.18
1169
.92
1876
.68
1007
.82
1552
.69
1132
.21
13.2
0**
*
Tuiti
on a
nd f
ees
as p
erce
nt
of c
ore
reve
nues
16.9
210
.13
19.0
711
.74
18.1
89.
2216
.92
8.97
13.0
59.
3016
.67
***
Reve
nues
fro
m s
tate
app
ro-
pria
tions
per
FTE
($)
32
17.8
019
49.6
130
93.6
322
05.1
232
34.9
818
15.4
331
27.0
316
65.9
934
34.6
320
65.3
21.
43
Stat
e ap
prop
riatio
ns a
s pe
rcen
t of
cor
e re
venu
es
27.5
713
.10
26.6
514
.33
27.8
212
.92
27.1
911
.88
28.7
413
.09
1.10
Reve
nues
fro
m lo
cal a
ppro
- pr
iatio
ns p
er F
TE ($
)
16
49.1
232
64.9
123
05.8
625
26.9
720
39.0
451
74.9
812
92.1
421
57.0
383
6.96
1347
.50
10.3
7**
*
Loca
l app
ropr
iatio
ns a
s pe
rcen
t of
cor
e re
venu
es
12.9
515
.65
19.9
618
.54
13.9
015
.61
10.1
113
.17
6.97
10.6
433
.42
***
Expe
nditu
res
Cor
e ex
pens
es ($
mill
ion)
48.7
746
.01
66.3
754
.44
51.3
145
.74
40.3
134
.52
35.0
339
.79
23.2
3**
*
Inst
ruct
ion
expe
nses
per
FTE
($)
4763
.31
2020
.16
4891
.47
2010
.06
5020
.94
2631
.74
4465
.30
1528
.80
4637
.55
1592
.00
3.76
**
Inst
ruct
ion
expe
nses
as
a
perc
ent
of t
otal
cor
e 44
.56
8.80
46.7
28.
7745
.63
9.22
43.4
67.
4342
.08
8.95
13.9
3**
*
Aca
dem
ic s
uppo
rt e
xpen
ses
pe
r FT
E ($
)
955.
4783
9.29
1002
.10
652.
5810
10.3
211
98.8
885
1.66
518.
0894
9.83
790.
541.
83
Aca
dem
ic s
uppo
rt e
xpen
ses
as
perc
ent
of t
otal
8.74
4.55
9.58
5.06
8.81
4.37
8.22
3.96
8.27
4.64
4.74
***
(con
tinue
d)
TA
BL
E 1
Co
mm
un
ity
Co
lleg
e C
har
acte
rist
ics
by
Pro
po
rtio
n P
ell R
ecei
pt
Am
on
g F
irst
-Tim
e, F
ull-
Tim
e St
ud
ents
(co
nti
nu
ed)
Tota
l
Q
uart
ile 1
Q
uart
ile 2
Qua
rtile
3Q
uart
ile 4
Com
paris
on
Mea
nSD
Mea
nSD
Mea
nSD
Mea
nSD
Mea
nSD
F-va
lue
Sig.
Stud
ent
supp
ort
expe
nses
pe
r FT
E ($
)
1221
.84
918.
0011
56.4
159
6.68
1289
.05
1134
.62
1168
.28
856.
3912
74.6
499
3.85
1.40
Stud
ent
supp
ort
expe
nses
as
perc
ent
of t
otal
cor
e
11.1
05.
2010
.90
3.62
11.2
24.
8311
.23
6.45
11.0
55.
620.
22
Inst
itutio
nal s
uppo
rt e
xpen
ses
per
FTE
($)
1776
.52
1317
.07
1875
.22
1316
.41
1783
.48
1669
.03
1640
.11
969.
6118
02.3
511
64.4
91.
34
Inst
itutio
nal s
uppo
rt e
xpen
ses
as p
erce
nt o
f co
re
15.8
46.
0416
.90
6.95
15.4
35.
2515
.48
6.11
15.5
05.
613.
48**
Not
es: Q
1 =
0–4
1 pe
rcen
t Pe
ll re
ceip
t; Q
2 =
42–
52 p
erce
nt P
ell r
ecei
pt; Q
3 =
53–
63 p
erce
nt P
ell r
ecei
pt; Q
4 =
64–
100
perc
ent
Pell
rece
ipt.
One
-way
AN
OVA
tes
t fo
r m
ean
diff
eren
ces;
**.
05; *
**.0
1.‡
n=37
4±
Stu
dent
s of
unk
now
n ra
ce r
emov
ed f
rom
tot
al e
nrol
lmen
t w
hen
calc
ulat
ing
min
ority
per
cent
ages
Sour
ce:
U.S
. D
epar
tmen
t of
Edu
catio
n, I
nstit
ute
of E
duca
tion
Scie
nces
, N
atio
nal
Cen
ter
for
Educ
atio
n St
atis
tics,
Int
egra
ted
Post
seco
ndar
y Ed
ucat
ion
Dat
a Sy
stem
(IP
EDS)
201
0.

School Integration and the Open Door Philosophy 119
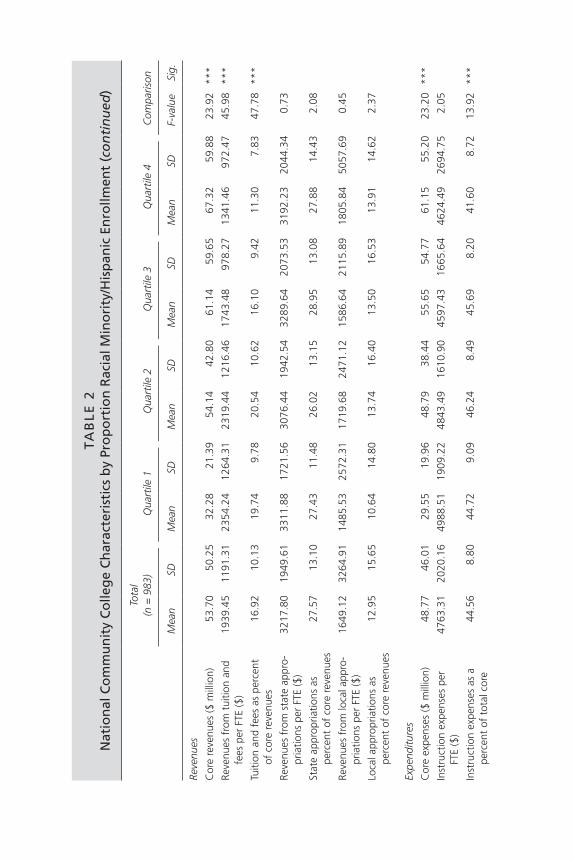
The story with regard to race/ethnicity is even more troubling. Just 25 percent of community colleges approach racial integration, with the representation of racial/ethnic minorities averaging 36.5 percent (Table 2, quartile 3). Another quarter of all community colleges are comprised of predominantly white students, with minorities constituting just 8 percent of the student body. Another 25 percent are predominantly minority, where 65 percent of students at the colleges are racial/ethnic minorities.20 The remaining quarter is in-between—not integrated, yet not strongly segregated either.
ChARACTERiSTiCS oF iNTEGRATED CoMMuNiTy CoLLEGES
How do integrated and segregated community colleges differ from one another? Tables 1 and 2 present the relevant comparisons, and we first focus primarily on the differences between quartiles 2 and 3 versus 1 and 4 with regard to economic integration (Table 1), and then quartile 3 versus all others with regard to racial integration (Table 2).21
More economically and racially integrated institutions tend to be of moderate size—between 6,000 and 9,000 students—while predomi-nantly poor institutions are smaller, and predominantly minority institu-tions are notably larger (and urban).
It is fairly uncommon for community colleges to be composition-ally integrated on multiple dimensions. Apart from those with the most affluent student bodies, community colleges exhibit racial integration at levels close to the national average (about one-third minority enroll-ment). Similarly, only community colleges with the highest proportions of minority students (quartile 4) have rates of Pell receipt notably higher than the national average (about one-half Pell enrollment). Economi-cally and/or racially integrated institutions are also somewhat more integrated in terms of gender when compared to institutions with the highest proportions of minority or low-income students (this means they have a smaller fraction of women, who tend to dominate colleges and universities).
Economically integrated community colleges tend to have more full-time students compared to institutions enrolling more economically advantaged students. They are also more likely to have academic offer-ings, offer student employment assistance, on-campus childcare, and/or on-campus housing and meals plans, compared to institutions that are segregated because of an overrepresentation of Pell recipients.

TA
BL
E 2
Nat
ion
al C
om
mu
nit
y C
olle
ge
Ch
arac
teri
stic
s b
y Pr
op
ort
ion
Rac
ial M
ino
rity
/his
pan
ic E
nro
llmen
t
Tota
lQ
uart
ile 1
Qua
rtile
2Q
uart
ile 3
Qua
rtile
4C
ompa
rison
Mea
nSD
Mea
nSD
Mea
nSD
Mea
nSD
Mea
nSD
F-va
lue
Sig.
N(9
66)
(242
)(2
41)
(242
)(2
41)
Enro
llmen
t C
ompo
sitio
n (%
)
Tota
l enr
ollm
ent
7461
.96
7401
.38
4144
.74
2983
.30
7345
.12
5997
.95
8743
.52
8805
.39
9622
.88
8946
.40
27.6
0**
*
Pell
(firs
t-tim
e, f
ull-t
ime)
51.8
915
.85
54.1
312
.20
45.7
513
.60
48.4
716
.53
59.2
117
.12
38.6
2**
*
Min
ority
32.5
322
.67
8.38
3.45
20.7
14.
2136
.52
5.19
64.6
215
.20
1982
.44
***
Fem
ale
58.0
87.
4757
.43
7.56
57.4
46.
9757
.97
7.26
59.4
87.
914.
09**
*
Full-
time
45.3
114
.02
49.5
212
.71
45.7
712
.68
44.0
013
.52
41.9
315
.88
13.2
3**
*
Full-
time,
firs
t-tim
e de
gree
se
ekin
g12
.77
7.17
14.6
46.
8613
.18
7.33
12.2
77.
2010
.99
6.82
11.4
7**
*
Cos
t of
Att
enda
nce
($)
Tota
l cos
t of
att
enda
nce
1511
6.15
3178
.21
1477
3.29
3339
.25
1505
0.09
3275
.21
1534
6.85
3136
.74
1528
8.19
2940
.88
1.60
Inst
ruct
iona
l Off
erin
gs (%
)
Occ
upat
iona
l97
.31
16.1
997
.93
14.2
599
.17
9.09
96.2
818
.96
95.8
519
.98
2.17
Aca
dem
ic96
.58
18.1
799
.59
6.43
97.5
115
.61
94.6
322
.59
94.6
122
.64
4.34
***
Dis
tanc
e le
arni
ng98
.03
13.8
999
.17
9.07
97.9
314
.28
98.3
512
.78
96.6
817
.95
1.35
Wee
kend
/eve
ning
pro
gram
s61
.80
48.6
159
.09
49.2
760
.58
48.9
757
.02
49.6
170
.54
45.6
83.
71**
Rem
edia
l ser
vice
s99
.48
7.18
99.5
96.
4399
.59
6.44
99.5
96.
4399
.17
9.09
0.20

Stud
ent
Serv
ices
(%)
Aca
dem
ic/c
aree
r co
unse
ling
99.7
94.
5510
0.00
0.00
99.5
96.
4499
.59
6.43
100.
000.
000.
67
Stud
ent
empl
oym
ent
assi
stan
ce92
.24
26.7
792
.15
26.9
594
.61
22.6
491
.32
28.2
190
.87
28.8
60.
93
On-
cam
pus
day
care
51.8
649
.99
43.8
049
.72
56.4
349
.69
46.6
949
.99
60.5
848
.97
6.17
***
On-
cam
pus
hous
ing
23.2
942
.29
29.3
445
.63
27.8
044
.89
21.4
941
.16
14.5
235
.31
6.26
***
Mea
l pla
n20
.08
40.0
824
.79
43.2
724
.07
42.8
418
.60
38.9
912
.86
33.5
54.
68**
*
Fina
ncia
l Aid
Rec
eipt
(firs
t-tim
e, f
ull-t
ime
stud
ents
)
Ave
rage
pel
l am
ount
42
66.7
951
3.58
4196
.60
468.
4141
78.4
053
0.39
4329
.50
525.
7543
62.6
750
5.33
8.06
***
Perc
ent
rece
ivin
g fe
dera
l lo
ans
23.5
621
.40
37.9
621
.45
27.4
320
.77
18.3
318
.21
10.4
913
.82
95.8
0**
*
Ave
rage
am
ount
of
fe
dera
l loa
n 44
28.7
312
02.5
144
73.2
611
94.4
244
91.7
911
00.5
244
00.8
612
28.6
643
24.0
513
02.3
20.
77
Staf
fing
Stud
ent-
to-f
acul
ty r
atio
21.3
96.
6019
.25
5.35
20.7
34.
9021
.84
5.71
23.7
38.
8921
.00
***
Stud
ent
to a
dmin
istr
ativ
e/m
anag
eria
l rat
io23
4.13
231.
7820
6.87
219.
4520
8.96
180.
6724
4.30
196.
5627
6.49
304.
724.
96**
*
Stud
ent
to s
uppo
rt s
taff
rat
io18
6.67
671.
3284
.63
112.
6112
3.28
282.
0424
5.72
1033
.96
294.
0078
6.15
5.22
***
Ave
rage
nin
e-m
onth
inst
ruc-
tiona
l sta
ff s
alar
y ($
)57
021.
5514
048.
7152
843.
0486
60.7
357
382.
0412
415.
7657
333.
1215
674.
5460
526.
7116
934.
6412
.64
***
All
staf
f pe
rcen
t m
inor
ity (‡
)27
.31
21.1
610
.14
14.4
316
.43
15.7
725
.30
12.3
249
.06
16.8
812
4.12
***
Inst
ruct
iona
l sta
ff p
erce
nt
min
ority
(‡)
23.7
420
.33
11.0
118
.47
14.8
316
.25
21.2
513
.28
41.4
917
.94
66.1
4**
*
(con
tinue
d)
Reve
nues
Cor
e re
venu
es ($
mill
ion)
53.7
050
.25
32.2
821
.39
54.1
442
.80
61.1
459
.65
67.3
259
.88
23.9
2**
*
Reve
nues
fro
m t
uitio
n an
d fe
es p
er F
TE ($
)19
39.4
511
91.3
123
54.2
412
64.3
123
19.4
412
16.4
617
43.4
897
8.27
1341
.46
972.
4745
.98
***
Tuiti
on a
nd f
ees
as p
erce
nt
of c
ore
reve
nues
16.9
210
.13
19.7
49.
7820
.54
10.6
216
.10
9.42
11.3
07.
8347
.78
***
Reve
nues
fro
m s
tate
app
ro-
pria
tions
per
FTE
($)
32
17.8
019
49.6
133
11.8
817
21.5
630
76.4
419
42.5
432
89.6
420
73.5
331
92.2
320
44.3
40.
73
Stat
e ap
prop
riatio
ns a
s
perc
ent
of c
ore
reve
nues
27
.57
13.1
027
.43
11.4
826
.02
13.1
528
.95
13.0
827
.88
14.4
32.
08
Reve
nues
fro
m lo
cal a
ppro
-pr
iatio
ns p
er F
TE ($
)
1649
.12
3264
.91
1485
.53
2572
.31
1719
.68
2471
.12
1586
.64
2115
.89
1805
.84
5057
.69
0.45
Loca
l app
ropr
iatio
ns a
s
perc
ent
of c
ore
reve
nues
12
.95
15.6
510
.64
14.8
013
.74
16.4
013
.50
16.5
313
.91
14.6
22.
37
Expe
nditu
res
Cor
e ex
pens
es ($
mill
ion)
48.7
746
.01
29.5
519
.96
48.7
938
.44
55.6
554
.77
61.1
555
.20
23.2
0**
*
Inst
ruct
ion
expe
nses
per
FT
E ($
)47
63.3
120
20.1
649
88.5
119
09.2
248
43.4
916
10.9
045
97.4
316
65.6
446
24.4
926
94.7
52.
05
Inst
ruct
ion
expe
nses
as
a pe
rcen
t of
tot
al c
ore
44.5
68.
8044
.72
9.09
46.2
48.
4945
.69
8.20
41.6
08.
7213
.92
***
TA
BL
E 2
Nat
ion
al C
om
mu
nit
y C
olle
ge
Ch
arac
teri
stic
s b
y Pr
op
ort
ion
Rac
ial M
ino
rity
/his
pan
ic E
nro
llmen
t (c
on
tin
ued
)
Tota
l (n
= 9
83)
Qua
rtile
1Q
uart
ile 2
Qua
rtile
3Q
uart
ile 4
Com
paris
on
Mea
nSD
Mea
nSD
Mea
nSD
Mea
nSD
Mea
nSD
F-va
lue
Sig.

Aca
dem
ic s
uppo
rt e
xpen
ses
per
FTE
($)
955.
4783
9.29
928.
5059
5.07
955.
7958
2.01
862.
9748
4.15
1075
.00
1370
.19
2.71
**
Aca
dem
ic s
uppo
rt e
xpen
ses
as p
erce
nt o
f to
tal
8.74
4.55
8.40
4.69
9.10
4.68
8.60
3.97
8.86
4.83
1.10
Stud
ent
supp
ort
expe
nses
pe
r FT
E ($
)
1221
.84
918.
0011
82.7
773
0.92
1232
.72
722.
5711
09.2
571
9.66
1363
.07
1331
.93
3.29
***
Stud
ent
supp
ort
expe
nses
as
perc
ent
of t
otal
cor
e
11
.10
5.20
10.6
75.
9211
.40
4.57
10.7
24.
3511
.63
5.72
2.10
Inst
itutio
nal s
uppo
rt
expe
nses
per
FTE
($)
1776
.52
1317
.07
1911
.29
1140
.29
1707
.06
868.
5916
21.1
494
7.21
1867
.24
1989
.04
2.58
Inst
itutio
nal s
uppo
rt
expe
nses
as
perc
ent
of
cor
e
15.8
46.
0416
.77
7.34
15.9
05.
0415
.66
5.58
15.0
25.
873.
49**
Not
es:
Min
ority
inc
lude
s: A
fric
an A
mer
ican
, H
ispa
nic,
Nat
ive
Am
eric
an,
Paci
fic I
slan
der,
Mix
ed R
ace/
Ethn
icity
. St
uden
ts o
f un
know
n ra
ce r
emov
ed f
rom
tot
al w
hen
calc
ulat
ing
min
ority
qua
rtile
s. Q
1 =
2–1
4 pe
rcen
t m
inor
ity;
Q2
= 1
4–28
per
cent
min
ority
; Q
3 =
28–
46 p
erce
nt m
inor
ity;
Q4:
46–
100
perc
ent
min
ority
. O
ne-w
ay A
NO
VA
test
for
mea
n di
ffer
ence
s; *
*.05
; ***
.01.
‡ n=
374
Sour
ce:
U.S
. D
epar
tmen
t of
Edu
catio
n, I
nstit
ute
of E
duca
tion
Scie
nces
, N
atio
nal
Cen
ter
for
Educ
atio
n St
atis
tics,
Int
egra
ted
Post
seco
ndar
y Ed
ucat
ion
Dat
a Sy
stem
(IP
EDS)
201
0.

124 Bridging the Higher Education Divide
However, in other regards, economically integrated community col-leges appear to have fewer resources than predominantly poor institu-tions—for example, their student-to-support staff ratios are notably higher. On the other hand, they tend to have higher staff salaries and more core revenue, especially from local appropriations (though much lower than at institutions with fewer Pell recipients).
Compared to predominantly minority serving community colleges, racially integrated community colleges (Table 2, quartiles 4 versus 3) have higher percentages of full-time, first-time degree-seeking students, are more likely to offer on-campus housing and meal plans, and are less likely to offer on-campus daycare. Far more of their students have federal loans. There are far fewer students per faculty member, admin-istrative, and support staff, but the average staff salary is lower. They have fewer external sources of revenue and rely more on tuition. They have fewer expenses and devote a larger fraction of the core budget to instruction.
Compared to predominantly white institutions (quartiles 1 versus 3), racially integrated colleges have fewer full-time students, are less likely to have academic offerings, are more likely to offer daycare but less likely to offer on-campus housing and meal plans, and have far fewer resources per student. In other words, the more minority students a col-lege enrolls, the fewer organizational advantages it enjoys.
Turning next to comparisons among segregated institutions, we find sharp differences between those that are heavily affluent and/or non-Hispanic white, compared to those that enroll predominantly poor and/or racial-ethnic minority students. Community colleges serving over-whelmingly minority populations are much larger than those serving largely non-Hispanic white students (average total enrollment of 9,623 versus 4,145). Compared to staff at predominantly white institutions, staff members at predominately minority institutions—particularly instructional staff—are far more likely to be from minority backgrounds themselves.22 Community colleges with a high proportion of minority students also have much higher ratios of students to faculty, staff, and administrators. For example, there are on average 85 students per sup-port staff member at predominantly white community colleges, com-pared with 294 students per support staff member at predominantly minority community colleges. However, the opposite is true when it comes to economic segregation: institutions that are wealthier, with fewer Pell recipients, have much larger student-to-staff ratios, compared to those with very high percentages of Pell recipients.

School Integration and the Open Door Philosophy 125
Even though predominately minority institutions are larger and thus generate more revenue, the amount of per-FTE revenue from tuition and fees generated at predominately white institutions is nearly double that of the revenue generated per FTE at minority-serving community col-leges. Moreover, institutions serving wealthier students gain far more money from local appropriations than those serving large proportions of Pell recipients, which is unsurprising given the relative wealth of their communities. That said, the data available suggest that both types of institutions allocate their revenue in similar ways.
GEoGRAPhiC iNTEGRATioN AND CoMMuNiTy CoLLEGE iNTEGRATioN: TiGhTLy LiNKED
To what degree does the level of integration or segregation at community colleges reflect geographic constraints? In other words, given that theory and research suggests advantages to educating students in more inte-grated settings, it is useful to consider what generates such integration.
To examine this, we model the relationships between county-level measures of population composition and measures of community col-lege student composition. The analytic strategy utilizes multivariate regression models with ordinary least squares as the estimator. To adjust for unobserved factors at the state level such as policies that may influ-ence the practices of all community colleges in the state regarding enroll-ment of minority and/or low-income students, we run all of our models using state fixed effects. To aid in interpretation of our results we report the standardized coefficient for each of our predictors—interpreted as the expected standard deviation change in the outcome resulting from a standard deviation increase in the predictor—which allows for a direct comparison of effect sizes across all variables in the model.
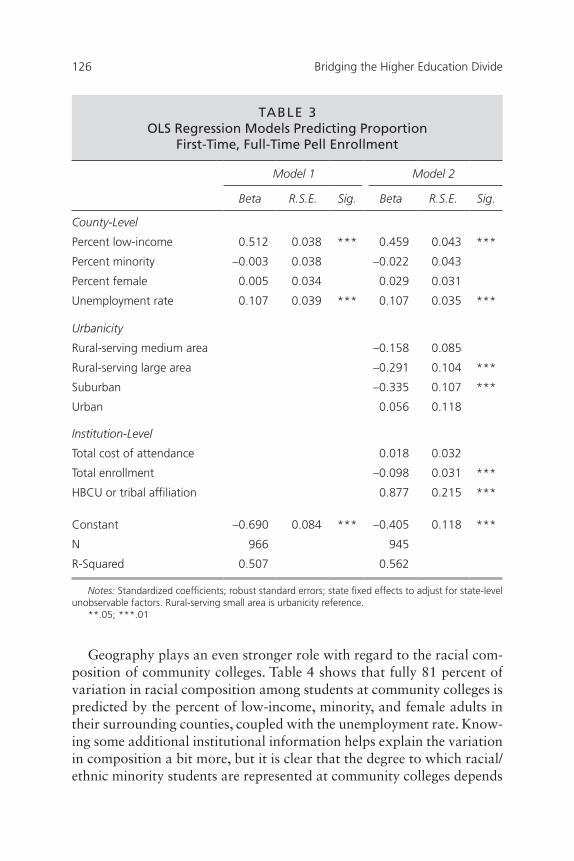
Table 3 presents the results of two models in which we estimate the proportion of first-time, full-time Pell enrollment at community colleges, first using county-level measures of integration, and then controlling for urbanicity and a select group of institutional characteristics—cost, size, and HBCU or Native American tribal affiliation. The results indicate that more than half (56 percent) of the variation in the representation of Pell recipients among community colleges is attributable to this limited set of factors. In fact, most of the variation in community colleges’ eco-nomic composition can be predicted based solely on knowing the per-cent of low-income, minority, and female adults in their counties, along with the unemployment rate.
126 Bridging the Higher Education Divide
Geography plays an even stronger role with regard to the racial com-position of community colleges. Table 4 shows that fully 81 percent of variation in racial composition among students at community colleges is predicted by the percent of low-income, minority, and female adults in their surrounding counties, coupled with the unemployment rate. Know-ing some additional institutional information helps explain the variation in composition a bit more, but it is clear that the degree to which racial/ethnic minority students are represented at community colleges depends
TABLE 3oLS Regression Models Predicting Proportion
First-Time, Full-Time Pell Enrollment
Model 1 Model 2
Beta R.S.E. Sig. Beta R.S.E. Sig.
County-Level
Percent low-income 0.512 0.038 *** 0.459 0.043 ***
Percent minority –0.003 0.038 –0.022 0.043
Percent female 0.005 0.034 0.029 0.031
Unemployment rate 0.107 0.039 *** 0.107 0.035 ***
Urbanicity
Rural-serving medium area –0.158 0.085
Rural-serving large area –0.291 0.104 ***
Suburban –0.335 0.107 ***
Urban 0.056 0.118
Institution-Level
Total cost of attendance 0.018 0.032
Total enrollment –0.098 0.031 ***
HBCU or tribal affiliation 0.877 0.215 ***
Constant –0.690 0.084 *** –0.405 0.118 ***
N 966 945
R-Squared 0.507 0.562
Notes: Standardized coefficients; robust standard errors; state fixed effects to adjust for state-level unobservable factors. Rural-serving small area is urbanicity reference.
**.05; ***.01

School Integration and the Open Door Philosophy 127
quite substantially on whether they live in the surrounding county. In other words, county-level segregation is a very strong predictor of com-munity college segregation.
Given the demonstrably strong relationship between county and com-munity college demographics, few community colleges are unexpectedly integrated. To capture the degree to which unexpected integration does occur, we conduct a residual value analysis. Using the full regression models in Tables 5 and 6 we calculate the predicted enrollment of Pell and minority students at each college and then subtracted those values
TABLE 4oLS Regression Models Predicting Proportion Minority Enrollment
Model 1 Model 2
Beta R.S.E. Sig. Beta R.S.E. Sig.
County-Level
Percent low-income –0.088 0.026 *** –0.089 0.027 ***
Percent minority 0.903 0.027 *** 0.830 0.028 ***
Percent female –0.020 0.022 0.005 0.018
Unemployment rate 0.019 0.025 0.010 0.024
Urbanicity
Rural-serving medium area –0.087 0.044 **
Rural-serving large area –0.108 0.055
Suburban –0.056 0.061
Urban 0.121 0.069
Institution-Level
Total cost of attendance –0.009 0.018
Total enrollment –0.006 0.019
HBCU or tribal affiliation 1.051 0.164 ***
Constant –0.021 0.050 0.072 0.064
N 966 945
R-Squared 0.810 0.849
Notes: Standardized coefficients; robust standard errors; state fixed effects to adjust for state-level unobservable factors. Rural-serving small area is urbanicity reference.
**.05; ***.01

128 Bridging the Higher Education Divide
from the achieved enrollment proportions to arrive at a residual value. A negative residual indicates that a college is enrolling fewer poor or minority students than geography would predict, while a positive value indicates the opposite. Greater integration could be achieved from either positive or negative residuals; there is no inherently preferred value from a normative perspective, but rather would depend on where a college falls in terms of its predicted level of segregation. We distinguish between four groups based on their degree of deviance from the expected level of integration: (1) substantial deviance (>1 standard deviation below the mean) tilting toward the integration of more advantaged students, (2) slight deviance (<1 SD below the mean) tilting toward the integration of more advantaged students, (3) slight deviance tilting toward integra-tion of more disadvantaged students, and (4) substantial deviance tilting toward integration of more disadvantaged students.
As noted earlier, about half of the nation’s community college enroll balanced student bodies with approximately equal numbers of Pell recipients and non-recipients (Table 1). These analyses suggest that
TABLE 5Residual Analysis of Pell Grant Enrollment
N Mean SD Min Max
A. Pell Residual Summary Statistics by Group
Group 1 132 –16.92 5.99 –39.72 –10.59
Group 2 341 –4.53 2.99 –10.44 0.00
Group 3 345 4.80 2.89 0.04 10.44
Group 4 127 16.70 6.06 10.49 48.16
Total 945
B. Percent Pell Distribution Across Residual Groups
Group 1 132 36.20 13.81 5.00 74.00
Group 2 341 46.35 12.33 19.00 98.00
Group 3 345 57.11 11.92 26.00 86.00
Group 4 127 69.56 12.06 44.00 100.00
Total 945
Notes: Group 1: Residual value more than 1 SD below the mean; Group 2: Residual value within 1 SD below the mean; Group 3: Residual value within 1 SD above the mean; Group 4: Residual value more than 1 SD above the mean.

School Integration and the Open Door Philosophy 129
some of this is due to about 27 percent of community colleges enroll-ing far more or less Pell recipients than geography would dictate (Table 5, Panel A). Approximately half of those colleges enroll more (13 per-cent), and half enroll less (14 percent). But there is less deviation at community colleges with regard to enrollment of race/ethnic minority students, and correspondingly a lower degree of racial integration. Just 23 percent of community colleges have a racial/ethnic composition out of step with their geography. Thirteen percent have an over-segregation of minority students in their schools, while 10 percent of institutions enroll a less-segregated student body than geography alone would pre-dict. (Table 6, Panel B).
iNTEGRATioN: hAPPENSTANCE oR AChiEVED?
Are greater-than-expected levels of integration in community college the result of a happy coincidence or intentional action? This is a critical question that is clearly difficult to answer. However, next we leverage
TABLE 6Residual Analysis of Racial/Ethnic Minority Enrollment
Obs Mean SD Min Max
A. Pell Residual Summary Statistics by Group
Group 1 91 –16.17 6.12 –34.79 –9.06
Group 2 456 –2.85 2.51 –9.02 0.67
Group 3 276 4.35 2.75 0.71 10.37
Group 4 122 18.16 8.50 10.48 50.97
Total 945
B. Percent Minority Across Residual Groups
Group 1 91 33.17 16.25 4.45 85.73
Group 2 456 23.20 17.78 1.71 100.00
Group 3 276 35.32 20.28 3.79 94.90
Group 4 122 62.79 21.31 17.91 98.28
Total 945
Notes: Group 1: residual value more than 1 SD below the mean; Group 2: residual value within 1 SD below the mean; Group 3: residual value within 1 SD above the mean; Group 4: residual value more than 1 SD above the mean.

130 Bridging the Higher Education Divide
the limited amount of qualitative data we have available to try and pro-vide some insights.
In writing applications for the national Aspen Prize for community colleges, institutions attempt to put their best foot forward and describe their approaches to serving students. A close textual analysis of their applications, focused on the “outlier” institutions whose college com-position deviates from the geographic norm, suggests that community college administrators are conscious of the composition of their stu-dent bodies, and in particular are conscious when their composition is unusual. Institutions with disproportionate numbers of minority and/or low-income students are more likely to explicitly report using quan-titative measures to assess institutional diversity, perhaps because they are more conscious of that attribute and may be getting attention for it, or perhaps are concerned about it. For example, one college notes that “directors, chairs, and other staff use special Institutional Research studies to plan and improve programs: such as high school draw by race/ethnicity; placement test results by entry status, race/ethnicity, and high school; and retention rates by campus, gender, and race/ethnicity.” These schools are also more likely than non-outlier institutions to men-tion having external partnerships specifically aimed at underrepresented populations. The discourse used by community colleges in their applica-tions to Aspen also varies in relation to the actual versus expected level of integration among students at their schools. Community colleges that enrolled somewhat more Pell recipients than their surrounding area would predict tend to emphasize the greater representation of economi-cally disadvantaged and first-generation students, highlighting that attri-bute for readers. For example, one such college administrator notes that his institution “prizes” the “diversity” of its students.
By contrast, colleges disproportionately enrolling advantaged stu-dents say far less in their applications about the composition of their institutions and do not describe any particular programs addressing composition. But in many cases these institutions are nonetheless more integrated than other community colleges, even when not explicitly emphasizing that fact.
While such observations are useful for thinking about the potential role of specific practices and attitudes in creating integrated student bod-ies, we went a step further and undertook informal phone interviews with fourteen community colleges where the enrollment of Pell recipients and racial/ethnic minority students in our data was more integrated or balanced than predicted by geography. Bringing this observation to the

School Integration and the Open Door Philosophy 131
attention of college staff, we posed the question: “What might contrib-ute to this integration?” After frequently having to define the term inte-gration, about three-quarters of the administrators provided a common answer: the answer lay in the actions of the K–12 school district, particu-larly with regard to where students were being sent to college. Some com-munity colleges, it seems, achieve racial or economic integration because a disproportionate number of minority or low-income high school gradu-ates are encouraged to attend four-year institutions rather than commu-nity colleges. This is consistent with efforts in some districts to ensure that students suited for four-year colleges attend them; particularly those who will most benefit from four-year college attendance. This re-sorting engenders greater balance, and seems to be more common in communities with more resources and strong college preparatory planning in the high schools. Such scenarios can lead to the patterns described earlier, where for example more integrated community colleges have more full-time stu-dents on academic tracks (a higher proportion of high school graduates are prepared for full-time work; those at the community college are the place-bound rather than strictly sorted by race or social class). A side effect is that the federal services targeted to economically disadvantaged students are less likely to be found, reducing the number of available staff at the institution (consistent with findings presented earlier).
CoNCLuDiNG ThouGhTS
The primary contribution of this paper is to draw attention to the stu-dent composition of community colleges in ways that are cognizant of the important discussions occurring in K–12 education over the past fifty years. It makes little sense to assess the quality of learning environments in such very different ways up and down the educational pipeline. If an economically and racially integrated learning environment is helpful for promoting student achievement, it needs to become a stronger focus and concern in postsecondary education. Of course it is central to discussion of affirmative action policies as they relate to selective, elite institutions, and there have been court cases in several states regarding the support of historically black colleges and universities—but these are conversa-tions affecting a small subset of college students. The vast majority of students attend non-selective institutions, such as community colleges, where the level of “diversity” equates with segregation—not integration.
Admittedly, we raise more challenges and problems than solutions in this paper, partly because of the lack of information with which to
132 Bridging the Higher Education Divide
do more. This is an area in need of significantly more theorizing and conceptual work, as well as empirical analysis. We need to consider the multiple ways to assess and define isolation in postsecondary education and operationalize the tipping points at which the benefits of integrated environments are achieved. And, while we have provided some start-ing hypotheses derived from qualitative research, more ideas about how integration could be effectively achieved are needed.
For example, we hypothesize that while the institutions we inter-viewed did not mention this, integration could be achieved by reducing the difference in costs of attendance between community colleges and four-year institutions. This should reduce the degree to which economi-cally disadvantaged students and those who are loan averse (dispropor-tionately Latinos) are constrained to community colleges and feel freer to choose four-year institutions.
The open door philosophy embraced by community colleges serves a crucial function—ensuring that the colleges reflect their communities. But it also brings challenges; the key one being that the problems of those communities resulting from neighborhood segregation and the concentration of poverty are simply transferred up the educational pipe-line. Segregated community colleges not only receive fewer monetary resources, but they likely produce less student learning. That is a prob-lem in need of a worthy solution.
NoTES
1. James S. Coleman et al., Equality of Educational Opportunity (Washington, D.C.: U.S. Government Printing Office, 1966), 325.
2. Eric A. Hanushek, John F. Kain, and Steven G. Rivkin, “New Evidence of Brown v. Board of Education: The Complex Effects of School Racial Composi-tion on Achievement,” NBER Working Paper #8741, National Bureau of Economic Research, 2002. Amy Stuart Wells, Jennifer Jellison Holme, Anita Tijerina Revilla, and Awo Korantemaa Atanda, Both Sides Now: The Story of School Desegrega-tion’s Graduates (Berkeley: University of California Press, 2008).
3. For a flavor of the debate over the mechanisms undergirding the positive impacts of integration on student outcomes across the K–16 spectrum, see the following examples of recent work in the area: Sara Baker, Adalbert Mayer, and Steven L. Puller, “Do More Diverse Environments Increase the Diversity of Sub-sequent Interaction? Evidence from Random Dorm Assignment,” Economics Let-ters 110, no. 2 (2011): 110–12. Johanne Boisjoly, Greg J. Duncan, Michael Kremer, Dan M. Levy, and Jacque Eccles, “Empathy or Antipathy? The Impact of Diver-sity,” American Economic Review 96, no. 5 (2006): 1890–1905. Braz Camargo,
School Integration and the Open Door Philosophy 133
Ralph Stinebrickner, and Todd Stinebrickner, “Interracial Friendships in College,” Journal of Labor Economics 28, no. 4 (2010): 861–92. Peter Hinrichs, “The Effects of Attending a Diverse College,” Economics of Education Review 30, no. 2 (2010): 332–41.
4. Amy Stuart Wells, Jacquelyn Duran, and Terrenda White, “Refusing to Leave Desegregation Behind: From Graduates of Racially Diverse Schools to the Supreme Court,” Teachers College Record, 2008. Amy Stuart Wells and Erica Frankenberg, “The Public Schools and the Challenge of the Supreme Court’s Integration Deci-sion,” Phi Delta Kappan 89, no. 3 (2007): 178–88).
5. Paul Attewell and David E. Lavin, “The Other 75%: College Education Beyond the Elite,” Weinberg Seminar Remarks, April 15, 2008. Data are from the Beginning Postsecondary Students Longitudinal Study.
6. We acknowledge that the open door applies only to the very initial point of enrollment. Placement testing means that students are sorted and denied access to a variety of programs almost immediately after that point, and fiscal constraints lead-ing to full classes often diminish the value of the open door entirely.
7. There are exceptions. For example, the NAACP is currently pursuing a law-suit in Georgia charging that the state has a “dual system of higher education” and has failed to desegregate its historically black and white colleges and universi-ties. Georgia State Conference of NAACP Branches et al. v. State of Georgia et al., Georgia Middle District Court, Case 1:2010cv00041, http://www.courthousenews.com/2010/04/07/NAACP.pdf
8. We acknowledge that this is a big “if.” The literature on the effects of integra-tion on schooling outcomes has not grappled sufficiently with selection bias and also has not accounted for the seemingly positive results of fully or nearly segre-gated schooling, such as that occurring in historically black colleges and universities (HCBUs). By drawing attention to the levels of segregation in community colleges we do not intend in this paper to suggest a new normative focus that would cast HBCU or Hispanic serving institutions or tribal colleges as problematic. First, we note that many of these institutions are in fact substantially integrated by race/ethnicity, but also more importantly that they are segregated by virtue of explicit mission and origins—not defacto by neighborhood composition. The effects are therefore likely different as well.
9. “News from Educational Leadership and Policy Analysis: Clif Conrad’s Truth-Telling and Testifying,” Learning Connections, Spring-Summer 2012, http://news.education.wisc.edu/news-publications/newsletter/archive/2012-spring-summer/clif-conrad-testifying.
10. Economists, for example, have written some of the very small number of empirical studies of segregation in higher education and focus exclusively on four-year institutions. See Charles T. Clotfelter, After Brown: The Rise and Retreat of School Desegregation (Princeton N.J.: Princeton University Press, 2004). Also Peter Hinrichs, “An Empirical Analysis of Racial Segregation in Higher Education,” paper presented at the Association for Public Policy Analysis and Management Fall

134 Bridging the Higher Education Divide
Conference November 8-10, 2012, Baltimore, Maryland, http://www9.georgetown.edu/faculty/plh24/Hinrichs_segregation_092012.pdf.
11. Sara Goldrick-Rab,”Challenges and Opportunities for Improving Commu-nity College Student Outcomes,” Review of Educational Research 80, no. 3 (2010): 437–69.
12. See endnote 2.13. The same issue exists in K–12 education. See Roslyn Arlin Mickelson, “The
Reciprocal Relationship between Housing and School Integration,” National Coali-tion on School Diversity, September 2011, http://www.school-diversity.org/pdf/DiversityResearchBriefNo7.pdf.
14. For example, see “Projects: The College Match Program: Overview,” MDRC, http://www.mdrc.org/project/college-match-program#featured_content.
15. More information on IPEDS is available at the National Center for Education Statistics website, http://nces.ed.gov/ipeds & www.aspenccprize.org. All geographic measures come from the 2010 American Community Survey five-year estimates. More information is available at the U.S. Census FactFinder website, http://fact finder2.census.gov. With regard to the Aspen Prize, during 2010–11, Aspen solicited an array of information from community colleges applying for its $1 million prize. Specifically, 120 institutions were selected to compete and provide information through a lengthy questionnaire in which they described a “specific range of student success data as well as [provided] narratives from college leaders describing concrete examples of practices that have led to excellent student outcomes.” Since all of the institutions involved consented to the use of that information for research purposes, data for this study included both IPEDS institutional measures for nearly all com-munity colleges nationally, coupled with detailed questionnaire data from the Aspen sample. Institutions invited to compete for the Aspen Prize were explicitly selected based on IPEDS information regarding “institutional performance, improvement, and equity on student retention and completion measures” (round 2 application instructions). Thus, the competition targeted institutions displaying recent improve-ments in the success of racial minority and low-income students, though a range remains among these in terms of their overall levels of diversity.
16. We primarily used geographic predictors and not organizational predictors because these are arguably endogenous to the outcome of interest—the degree of diversity. For example, colleges may choose to offer more transfer or degree pro-grams in response to their student population, rather than attracting specific stu-dents because of those programs.
17. Participation in the Aspen competition is nonrandom and the ninety-nine institutions in the subsample differ from the national sample in several ways. We nonetheless use the data as best we can to gain insights into college activities. We code the qualitative survey data using the software package Dedoose utiliz-ing responses to the following questions posted by Aspen to participating colleges: (1) Institutional Mission: In approximately 100 words, describe your mission, the

School Integration and the Open Door Philosophy 135
populations you serve, and the programs you offer. Here, we are primarily inter-ested in how the college characterized the racial or ethnic composition of the popu-lation served, and whether the mission included an explicit mention of diversity. (2) External Partners: On no more than one page total, please list external enti-ties (including individual and consortia from K–12, business, non-profit, research, four-year colleges or other sectors) with which your community college is engaged in partnerships that are important to the student outcomes your institution has achieved. Provide a brief explanation (no more than 50 words for each) of the role these partnerships have played at your institution. We code responses for any indication that partnerships are explicitly undertaken to either in response to diversity or to create diversity. (3) In 500 or fewer words, summarize the specific programs or factors that you believe have contributed to success in student comple-tion, improvements over time in student completion, or specific achievements dem-onstrated in your completion data. We code responses for how success is defined (including any mentions of diversity), as well as programs explicitly undertaken to either in response to diversity or to create diversity. (5) In one page or less, please provide a statement explaining why your community college has achieved excel-lent student outcomes, is positioned to continue improving such outcomes in the future, and should win the Aspen Prize for Community College Excellence. We code responses for how success is defined and any discussion of specific diversity policies and practices in these closing statements.
18. The IPEDS includes two very different institutional measures of Pell receipt. The first represents percent Pell receipt among all students at the institution, while the second is limited to full-time, first-time, degree-seeking students. Although the latter measure only includes a fraction of students who attend community colleges, the proportion of Pell recipients among this group is significantly larger than among all undergraduates. We know that each year part-time students, older students and independent students are far less likely to complete the FAFSA than more “tradi-tional” students even though many would be eligible to receive the grant (Mark Kantrowitz, “Analysis of Why Some Students Do Not Apply for Financial Aid,” April 27, 2009, http://wwww.finaid.org/educators/20090427CharacteristicsOfNonApplicants.pdf). We therefore decided to use the full-time, first-time, degree-seeking measure as the more conservative and realistic representation of low-income enroll-ment at an institution.
19. We defined minority students as those who are neither non-Hispanic white nor Asian. When calculating institutional percentages of racial/ethnic minority enrollment we removed all students categorized as “race/ethnicity unknown” from the total enrollment number before using it as our denominator. This “unknown” category ranged from 0 to 9,833 students per institution, but had a median value of 167. We made the decision to remove these students from our race/ethnicity calcula-tions rather than make assumptions regarding their race/ethnicity which would have been little more than guesswork on our part.

136 Bridging the Higher Education Divide
20. We use the term racial/ethnic minority in the sense that African American, Latino, Asian, and Native American students still comprise a numerical minority of the total school population, and white students are still numerically a majority of the student enrollment.
21. We were initially suspicious that findings showing large differences across groups may have been heavily influenced by the 112 California colleges in our sam-ple—fully 12 percent of the total. We therefore ran a second round of comparisons excluding these colleges but found no differences in the pattern of comparisons, only in the individual point estimates.
22. In the 2010 IPEDS, reporting of staff race was voluntary and only 39 percent of the colleges in our sample actually did so. Because reporting was likely non-random within the sample, caution should be exercised in the generalizability of the observed group comparisons.