SCHOOL FACTORS INFLUENCING CURRICULUM IMPLEMENTATION IN...
101
i SCHOOL FACTORS INFLUENCING CURRICULUM IMPLEMENTATION IN NON-FORMAL PRIMARY SCHOOLS IN WESTLANDS SUB-COUNTY, NAIROBI Iraki Joyce Wambui A Research Project Submitted in Partial Fulfillment of the Requirement for the Degree of Master of Education in Curriculum Studies University of Nairobi 2014
Transcript of SCHOOL FACTORS INFLUENCING CURRICULUM IMPLEMENTATION IN...

i
SCHOOL FACTORS INFLUENCING CURRICULUM
IMPLEMENTATION IN NON-FORMAL PRIMARY
SCHOOLS IN WESTLANDS SUB-COUNTY, NAIROBI
Iraki Joyce Wambui
A Research Project Submitted in Partial Fulfillment of the Requirement
for the Degree of Master of Education in Curriculum Studies
University of Nairobi
2014

ii
DECLARATION
This research project is my original work and has not been presented for a
degree in any other university.
………………………………………………………
Iraki Joyce Wambui
E55/75322/2012
This research project has been submitted for examination with our approval as
University supervisors.
………………………………………………….
Mrs. Lucy Njagi
Lecturer
Department of Educational Administration and Planning
University of Nairobi
……………………………………………………………
Prof. Winston Akala
Associate Professor
Department of Educational Administration and Planning
University of Nairobi

iii
DEDICATION
This work is dedicated to those who have been a pillar in my academic
journey; my husband, W.N Iraki and our children Maina, Naserian and Lalin
who have always been there when I needed them.

iv
ACKNOWLEDGEMENTS
I am indebted to Mrs. Lucy Njagi and Prof. Winston Akala for their guidance,
patience and dedication as my university supervisors. They have made my
research and project writing easier through their advice and commitment. I
highly appreciate the entire curriculum studies teaching team whose advice
assisted me in selection of the research topic. I sincerely thank my nephew
George Kinyua who edited and formatted my work. Special thanks also go to
my entire family members who encouraged me to pursue my academic dream.
And finally my thanks go to my professional colleagues who have assisted me
in one way or another in order to complete this work. Thank you all.

v
ABSTRACT
The purpose of this study was to investigate school-based factors influencing
curriculum implementation in non-formal primary schools in Westlands sub-
county. Non-formal primary schools are institutions of learning that caters for
out of school children of primary school age. The research objectives of the
study were to: examine the extent to which human resource influence
curriculum implementation; establish how instructional materials influence
curriculum implementation; determine how pupil characteristics influence
curriculum implementation; examine the extent to which teaching methods
influence curriculum implementation; and to establish how physical facilities
influence curriculum implementation. The study adopted a descriptive survey
design and targeted six non-formal primary schools which were registered
under the Ministry of Education. The population of the study was 306 people
and a sample size was 42 participants. A census of administrators was used
while random sampling was used to select teachers. The researcher used
purposive sampling to pick 24 pupils: that is, only classes 7 and 8 pupils were
selected as respondents. This is because they were assumed to be literate
enough to understand and respond to the research instrument. A boy and a girl
were selected from each class in every school for the purpose of gender
balancing in the study. Data were collected by use of questionnaires and
observation check list and analyzed using both quantitative and qualitative
techniques. The findings revealed that human resource and instructional
materials in NFPSs were inadequate. Pupil characteristics were not fully
considered in NFPSs while teaching methods were not well varied. The
findings also revealed that physical facilities were inadequate. As a result of
the findings, it was concluded that the extent of adequacy of human resource
was low and therefore affected curriculum implementation in NFPSs. It was
also concluded that lack of adequate of instructional materials and physical
facilities affected curriculum implementation in NFPSs. It was further
concluded that failure to put pupil characteristics in to consideration affected
curriculum implementation in NFPSs. It was also concluded failure to vary
teaching methods properly affected curriculum implementation in NFPSs. It
was also concluded that physical facilities were inadequate and this affected
curriculum implementation in NFPSs in Westlands sub-county. Based on the
findings, the study recommended that the MOE should provide opportunities
for in-service training and institute policies to ensure all teachers participate in
the training. The government should provide enough funds to procure
adequate instructional materials in NFPSs. The study recommended that
NGOs should cooperate with GOK in provision of human resource,
instructional materials and physical facilities which are necessary for effective
curriculum implementation in NFPSs. The study also recommended that the
GOK should set aside land for public utility where sports fields which are
accessible to pupils from NFPSs should be provided. The study recommended
that the MOE should train and deploy more special education teachers to
NFPSs.

vi
TABLE OF CONTENTS
Title page ................................................................................................................. i
Declaration ............................................................................................................... ii
Dedication .............................................................................................................. iii
Acknowledgements ................................................................................................ iv
Table of contents .................................................................................................... vi
List of figures .......................................................................................................... x
List of tables ........................................................................................................... xi
List of abbreviations and acronyms ...................................................................... xii
CHAPTER ONE
INTRODUCTION
1.1 Background to the study ........................................................................................... 1
1.2 Statement of the problem .......................................................................................... 5
1.3 Purpose of the study .................................................................................................. 6
1.4 Research objectives ........................................................................................... 6
1.5 Research questions ............................................................................................ 7
1.6 Significance of the study .......................................................................................... 7
1.7 Limitation of the study .............................................................................................. 8
1.9 Basic assumptions of the study ......................................................................... 9
1.10 Definition of significant terms ............................................................................... 9
1.11 Organization of the study ..................................................................................... 10
CHAPTER TWO
LITERATURE REVIEW
2.1 Introduction .............................................................................................................. 12
2.2 The concept of non-formal education ................................................................... 12

vii
2.3 Curriculum implementation in non-formal schools: an overview of
selected countries ........................................................................................................... 13
2.4 Human resource and its influence on curriculum implementation in NFPSs .. 16
2.5 Instructional materials and their influence on curriculum implementation
in NFPSs .......................................................................................................................... 19
2.6 Pupil characteristics and their influence on curriculum implementation in
NFPSs .............................................................................................................................. 20
2.7 Teaching methods and their influence on curriculum implementation in
NFPSs .............................................................................................................................. 21
2.8 Physical facilities and their influence on curriculum implementation in
NFPSs. ............................................................................................................................. 23
2.9 Theoretical Framework ........................................................................................... 24
2.10 Conceptual framework .......................................................................................... 25
2.11 Summary of literature review .............................................................................. 26
CHAPTER THREE
RESEARCH METHODOLOGY
3.1 Introduction .............................................................................................................. 28
3.2 Research design ....................................................................................................... 28
3.3 Target population ..................................................................................................... 28
3.4 Sampling size and sampling procedure ................................................................ 29
3.5 Data collection instrument ...................................................................................... 29
3.6 Piloting of the research instruments ...................................................................... 30
3.6.2 Reliability of research instruments ..................................................................... 31
3.7 Data collection procedure ....................................................................................... 32

viii
CHAPTER FOUR
DATA ANALYSIS, PRESENTATION AND DISCUSSION
4.1 Introduction .............................................................................................................. 34
4.2 Questionnaire return rate ........................................................................................ 34
4.3 Demographic data of the respondents ................................................................... 35
4.4 Curriculum implementation in NFPSs .................................................................. 40
4.5 Influence of human resource on curriculum implementation in NFPSs ......... 43
4.6 Influence of instructional materials on curriculum implementation in
NFPSs………….. ........................................................................................................... 46
4.7 Influence of pupil characteristics on curriculum implementation in NFPSs ... 52
4.8 Influence of teaching methods on curriculum implementation in NFPSs ....... 53
4.9 Influence of physical facilities on curriculum implementation in NFPSs ....... 56
4.10 Summary of the findings ...................................................................................... 61
CHAPTER FIVE
SUMMARY, CONCLUSIONS AND RECOMMENDATIONS
5.1 Introduction .............................................................................................................. 63
5.2 Summary of the study ............................................................................................. 63
5.3 Conclusions .............................................................................................................. 64
5.4 Recommendations ................................................................................................... 65
5.5 Suggestions for further research ............................................................................ 66
REFERENCES .................................................................................................... 67
APPENDICES
Appendix i: Letter of introduction ........................................................................ 75
Appendix ii: Administrators’ Questionnaire ......................................................... 76
Appendix iii: Teachers' Questionnaire .................................................................. 79
Appendix iv: Pupils’ Questionnaire ...................................................................... 83

ix
Appendix v: Observation Checklist ...................................................................... 85
Appendix vi: Research permit .............................................................................. 86
Appendix vii: Authorization letter ........................................................................ 89

x
LIST OF FIGURES
Figure Page
Figure 2.1 Relationship between school factors, curriculum implementation
and performance in NFPS………...…………….…………………………...25
Figure 4.1 Distribution of administrators by gender…..……………...……36
Figure 4.2 Distribution of teachers by gender…………..……………...…….37
Figure 4.3Teachers professional qualification……...………………..………38
Figure 4.4 Distribution of pupils by gender……...………..…....……………40
Figure 4.5 Administrators response on pupils’ dropout rate in NFPSs…..….41
Figure 4.6 Response of teachers on syllabus coverage in NFPSs…..……......42
Figure 4.7 Teachers’ professional experience………..………………………45
Figure 4.8 Response of administrators and pupils on provision of stationeries
by schools……………………………………………………….…………….49
Figure 4.9 Response of teachers and pupils on distribution of teaching aids in
NFPSs……………………………………………….……………….……...50
Figure 4.10 Response of pupils on provision of class readers by schools….51
Figure 4.11 Administrators response on the number of special needs pupil
against the number of special needs education teachers………....53
Figure 4.12 Researcher’s observation on availability or unavailability of
sports fields NFPS………………………………………………....60

xi
LIST OF TABLES
Table Page
Table 3.1 Sampling size….…………………………………………….…..29
Table 4.1 Questionnaire return rate…………………….……………….….35
Table 4.2 Administrators professional qualification……………………….37
Table 4.3 Ages of pupil in class 7 and class 8..……………………….........39
Table 4.4 General academic performance of pupils in examinations in
NFPSs…………………………………………………….........41
Table 4.5 Response of administrators on pupils’ transition rate to secondary
schools……………………………………………………………….…...43
Table 4.6 Administrators working experience………...….…………….......45
Table 4.7 Response of administrator and teachers on teacher to pupil
ratio……........................................................................................................46
Table4.8 Distribution of administrators’ response on textbook to pupil
ratio…………………………………………………………………………47
Table 4.9 Pupils’ response on textbook to pupil ratio………………….......48
Table4.10 Teachers response on teaching methods used in NFPS................54
Table 4.11 Teachers reasons for using the teaching methods……………...55
Table 4.12 Pupils’ response on teaching methods frequently used by
teachers in NFPSs………………...……………………………………....56
Table 4.13 Average number of pupils per classroom in NFPSs…………...58
Table 4.14 Pupils’ response on how desks are shared in NFPSs……..……59
xii
LIST OF ABBREVIATIONS AND ACRONYMS
Bed Bachelor of Education
Ed Edition
COBET Complementary Basic Education in Tanzania
GOK Government of Kenya
HIV and AIDS Human Immunodeficiency Virus and Acquired
Immune Deficiency Syndrome
KCPE Kenya Certificate of Primary Examination
KIE Kenya Institute of Education
Med Master of Education
MOE Ministry of Education
MOE Ministry of Education and Vocational Training
NCT National Council on Teacher Education
NFE Non-Formal Education
NFPSs Non-Formal Primary Schools
NFS Non-Formal School
NPE National Policy on Education
RBV Resource Based View
SADC South African Development Committee
SPSS Statistical Package for Social Sciences
STD Standard
TPR Teacher Pupil Ratio
TSC Teachers Service Commission
UNESCO United Nations Educational Scientific and Cultural
Organization
UNICEF United Nations International Children’s Emergency
Fund

1
CHAPTER ONE
INTRODUCTION
1.1 Background to the study
Education is a precondition for development of any kind, for reduction of
unemployment and poverty and for the establishment of lasting peace
(Matsuura, 2001). At individual level, education occupies a pivotal position in
relation to other rights and in playing a “facilitative” role in the enjoyment of
other human rights (Rutere, 2007). The Jomtien Conference (1990), the Dakar
Conference (2000) and the Millennium Development Goals (2000) committed
governments to honour the set out goals which include provision of education
for all citizens. Specifically, the Dakar Framework of Action which was
adopted at the Dakar Conference (2000) required that all member
governments, international institutions and Non-Governmental Organizations
(NGOs) commit the necessary resources and effort to achieve a
comprehensive and inclusive system of quality Education For All (EFA) by
2015 (UNESCO, 2007).
Basic education is the first step in attempting to overcome the enormous
disparities affecting many groups including the urban poor, marginalized
ethnic minorities and children not attending school and working (Delores &
Draeke, 1996). The UNESCO Institute of Statistics (UIS) and UNICEF (2005)
estimated that in 2001/02 there were 115 million children of primary school
age who were out of school. The estimation further reported that the greatest
absolute numbers of out of children were found in sub-Saharan Africa (45
million) and South Asia (42 million).

2
Among the millions of out of school children referred by the statistics were
children with disabilities, refugees and displaced populations, ethnic and
linguistic minorities, street children, homeless and working children affected
by HIV and AIDS, children in remote and isolated communities and girls
forced out of school to get married (UNICEF,2005). The study pointed to the
need by governments especially in Africa and Asia to provide alternative basic
education approaches which would meet the needs of out of school children
who had been ignored by the formal education (Kiura, 2008). Non-formal
education (NFE) fits this role as it is “relevant to the needs of the learner,
focus on clearly defined purposes and concerned is with out of school children
and it is flexible in organization and methods” (Fordham, 1993:2). For Non-
formal education to solve the problem of out of school children and to realize
any tangible gains, school factors including human, material and physical
facilities must be appropriately allocated and utilized. At the same time pupil
characteristics must be put in perspective and appropriate teaching methods
applied in order to meet the learning needs of pupils.
Non-formal education has been adopted in many countries as an
alternative form of education to cater for children who are out of school due to
various socio-economic and political challenges. In India, a significant
proportion of her young population remained uneducated by the 1970s. To
address this problem, the centrally sponsored Scheme of NFE was set up to
educate school drop outs, working children and children from areas without
schools (Lall, 2005). In Tanzania, NFE is implemented through
Complimentary Basic Education in Tanzania (COBET), a community based

3
programme evolving from District Micro-planning of Primary Education
(Bhalalusesa, 2003).Among the challenges facing implementation of the
curriculum in non-formal primary schools in Tanzania is failure to provide
capitation grants to COBET learners, inadequate supply of teaching and
learning materials in classrooms, and overdependence on untrained and
voluntary teachers (MOEVT, 2012).
In Kenya, various policy documents have been put in place to ensure all
pupils have access to quality education. Of great importance to this study is
the Report of the National Committee on Educational Objectives and Policies
of 1978 which recognized the contribution that NFE makes to lifelong
education, to an individual’s wellbeing as well as the relationship between the
training functions of the formal education system and other forms of training
(Kiura, 2008). Sessional Paper No.1 of 2005 focused on expanding access to
education to recover the gains lost in the 1990s when many children dropped
out of school due to Structural Adjustment Programs (SAPs). In response to
the sessional paper, Kenya Education Sector Support Program (KESSP) was
developed which included non-formal education as one of its investment
programs.
NFPSs in Kenya use the national primary school curriculum with the
distinctive feature of school flexible practices such as school timing or flexible
organization (MOE, 2009). The curriculums leads to national examinations
and involve bridging education, comprising compensatory or catch up classes
to raise the learners’ proficiency and ease the transition of school age children

4
back to formal school. In the NFPSs, the national curriculum is adapted for
children with special needs (MOE, 2009).
Non-formal primary schools will only justify their worth if they help the
government realize the dream of achieving EFA goals which demand quality
basic education for all by 2015. This will be possible if the curriculum in the
NFPSs is fully and properly implemented. According to Chhem (2001) the
ultimate goal is not to design the best and ideal curriculum, but to put it in to
practice successfully. According to her, successful implementation of a
curriculum involves thoughtful planning and quality hard work at all levels.
This includes putting in place factors influencing curriculum implementation
in schools including NFPSs. Among core factors involved in curriculum
implementation in NFPSs, school factors like human resource, instructional
materials, pupil characteristics, teaching methods and physical facilities are
crucial. This is because they have direct contact with the pupil for whom the
curriculum is being implemented. They also operate within NFPSs
environment where curriculum implementation normally takes place (Odom &
Barley, 2001).
The adequacy of human resource has a direct bearing on curriculum
implementation in NFPSs. Trained and experienced human resource is more
updated on curriculum matters, teaching styles and in handling pupil
characteristics (Firestone & Corbett, 1988; Hanushek, 2003; Moseti, 2007).
Availability and quality of instructional materials like textbooks,
stationeries and teaching aids determines the extent to which the curriculum
will be implemented (Yara & Otieno, 2010). Pupils’ characteristics in terms of

5
age and special needs are some of the main determinants of curriculum
implementation as pointed out by the University of Zimbabwe (1985). It is
therefore crucial that pupils’ needs are considered by curriculum
implementers. According Davidoff (1990), learners will respond positively
when their preferred learning styles are used in curriculum implementation
process. Availability and condition of physical facilities influence curriculum
implementation. UNESCO (1990) identifies overcrowding in primary schools
as a major cause of poor achievement.
Kenya has over 2000 non-formal schools (NFSs). Out of these schools,
335 NFSs were registered by the MOE by 2012 (MOE, 2012). The registration
provided the schools with an opportunity to get capitation grants to procure
instructional materials and basic physical facilities from the governments in an
attempt to improve curriculum implementation. The government was also to
provide trained teachers to the registered NFSs. Since majority of registered
NFSs are found in Nairobi County (MOE 2012), this study was prompted by
need to establish the role played by the school factors in influencing
curriculum implementation in registered NFPSs in Westlands, one of the sub-
counties of Nairobi County.
1.2 Statement of the problem
The Dakar Framework of Action (2000) acknowledged and advocated for use
of 3rd
channel approaches including non-formal education to ensure that by
2015 all children have access to complete, free and compulsory education of
good quality (MOEST, 2005). In Kenya achieving EFA goals is hinged on the
ability to universalize primary education for school age children as well as

6
augment alternative basic education provisions for the youth and older
populations (MOE, 2009). Given that formal education delivery channels are
unable to reach all school age children, educationists and policy makers have
since the 1970s argued for alternative delivery channels to complement
mainstream efforts (MOE, 2009).
National curriculum has to be fully and properly implemented in NFPSs if
basic education is to be universalized in Kenya. This in turn demands that all
underlying factors be put in place. Most of the studies done on NFE in Kenyan
schools have focused on other studies rather than school factors influencing
curriculum implementation in NFPSs. It is for this research gap that this study
wished to investigate how school factors influence curriculum implementation
in NFPSs in Kenya and specifically in Westlands sub-county.
1.3 Purpose of the study
The purpose of this study was to establish how school factors influence
curriculum implementation in NFPSs in Westlands Sub-County, Nairobi
County.
1.4 Research objectives
This study was expected to achieve the following objectives;
1. To examine the extent to which adequacy of human resource influence
implementation of the curriculum in non-formal primary schools in Westlands.
2. To establish how instructional materials influence curriculum
implementation in non-formal primary schools.
3. To determine how pupils’ characteristics influence implementation of
curriculum in non-formal primary schools.

7
4. To examine how teaching methods influence implementation of curriculum
in non-formal primary schools.
5. To establish how physical facilities influence curriculum implementation in
non-formal primary schools.
1.5 Research questions
This study was expected to answer the following questions;
1. To what extent does adequacy of human resources influence in curriculum
implementation in NFPSs?
2. How does adequacy of instructional materials influence curriculum
implementation in NFPSs?
3. How do pupils’ characteristics influence the implementation of curriculum
in NFPSs?
4. What teaching methods do teachers use while implementing the curriculum
in NFPSs?
5. How do physical facilities influence implementation of curriculum in
NFPSs?
1.6 Significance of the study
The study may help the Non-Governmental Organizations (NGO) and Faith
Based Organizations (FBO) which are the main providers of NFE, to
understand the school factors influencing curriculum implementation in
NFPSs and may help in generalizing the results to other areas in the country.
The insights may be crucial in guiding the stakeholders to improve the
standards of NFPSs which are low according to the study. The study may
provide a source of information for policy formulators and decision makers

8
while re-evaluating or updating policy guidelines pertaining to provision of
human, material and physical resources in public primary schools including
NFPSs. The study may provide information that may assist the Quality
Assurance and Standard Officers in their supervisory and advisory duties. The
study may serve as foundation for further and deep investigation in the area of
curriculum implementation in NFPSs.
1.7 Limitation of the study
According to Komb and Tromp (2006), limitations are challenges anticipated
or faced the researcher. This study used descriptive survey design where
information was self-reported and therefore, it was difficult for the researcher
to control the attitudes of the respondents as they could have given socially
biased answers on school factors influencing curriculum implementation in
NFPSs. This limitation was mitigated through use of observation checklist
which helped to verify some of the responses given by the respondents.
1.8 Delimitations of the study
Although NFPSs are found in many other districts in the county, this study
limited itself to one district. Studying NFPSs in all the districts was not
possible because of various logistical constraints like inaccessibility especially
those that are deep in the slum areas. Despite the fact that non-formal
education is available at other levels like secondary and adult sector, this study
limited itself only to non-formal education in primary level of education. This
is because each level has its specific curriculum that needs to be studied
differently. Although there are many factors that influence curriculum
implementation in the non-formal primary education, this study limited itself

9
to the school factors since they are the ones that have closest connection to the
curriculum. Although the target population of the study was 306, this study
limited itself to 14 percent of the population due to time and financial
constraints.
1.9 Basic assumptions of the study
According to Simon (2011), basic assumptions in the study are things that are
somewhat out of researcher’s control but if they disappear, the study would
become irrelevant. The study worked on the following basic assumptions;
1.) The information obtained from the respondents was true to the best of their
knowledge.
2.) The respondents were well informed of the school factors influencing
curriculum implementation.
1.10 Definition of significant terms
This sub-section defines all the terms as they are used in the context of this
study.
Basic education refers to type of education offered in NFPSs catering for
pupils ranging between 6-14 years of age.
Curriculum refers to all the knowledge, skills and attitudes which are planned
and implemented in non-formal primary schools.
Human resource refers to the administrators and teachers within the NFPSs
who take part in the implementation of the curriculum.
Implementation refers to putting the Kenya primary education curriculum in
operation in non-formal primary schools.

10
Non-formal education refers to the systematic and organized form of
education but which follows unconventional approaches in curriculum
implementation.
Non-formal primary schools refer to institutions of learning that caters for
out of schoolchildren of primary school age in accordance with the Basic
Education Act (2013). That is out of schoolchildren of between 6-14 years of
age.
Out of school children refers to children who either have never been to a
formal school or have dropped out due socio-economic and/or cultural
reasons.
Physical facilities refer to tangible resources that influence curriculum
implementation in NFPSs like classrooms, desks, sports fields.
Pupil characteristics refer to aspects of the learners that influence curriculum
implementation in NFPSs like age and special needs.
School Factors refers to the aspects within the NFPSs environment that
influence implementation of the curriculum such as human resource,
instructional materials, pupil characteristics, instructional methods and
physical facilities.
Teaching methods refers to the various styles of teaching used by the teachers
in NFPSs.
1.11 Organization of the study
This study comprises of five chapters and it is organized as follows; Chapter
one contains the introduction which contains the following sub-topics;
background of the study, statement of the problem, purpose of the study,

11
research objectives, research questions, significance of the study, limitations
of the study, delimitations of the study, basic assumptions, definition of terms
and organization of the study. Chapter two contains literature review which
has the following sub-topics; introduction, concept of NFE, development of
NFE; a global perspective, NFE in Kenya, human resource, instructional
materials, pupil characteristics, physical facilities, summary, theoretical
framework and conceptual framework. Chapter three contains the research
methodology and includes the following sub-topics; introduction, research
design, target population, sample size and sampling procedure, data collection
instrument, piloting and data analysis. Chapter four contains data analysis,
interpretation and discussion of the findings. Chapter five contains summary,
conclusions and recommendations of the study.

12
CHAPTER TWO
LITERATURE REVIEW
2.1 Introduction
This chapter focuses on what other studies have unearthed about curriculum
implementation in NFPSs and the influence of school based factors in the
implementation process. It does so under a number of sub-topics including the
concept of NFE and curriculum implementation in non-formal schools; an
overview of selected countries. It also focuses on school factors including,
human resource and its influence on curriculum implementation in NFPSs,
instructional materials and their influence on curriculum implementation in
NFPSs, pupil characteristics and how they influence on curriculum
implementation in NFPSs, teaching methods and their influence on curriculum
implementation in NFPSs, physical facilities and how they influence
curriculum implementation in NFPSs. The final part of the chapter comprises
of theoretical frame work, conceptual framework and the summary.
2.2 The concept of non-formal education
According to Coombs, Prosser and Ahmed (1973), non-formal education is
any organized educational activity outside the established formal system-
whether operating separately or as an important feature of some broader
activity-that is intended to serve identifiable learning clienteles and learning
objectives. The Kenya Institute of Education (KIE) (now Kenya Institute of
Curriculum Development), defines non-formal education as any organized,
systematic and quality education and training programs outside the formal

13
school system that are consciously aimed at meeting specific learning needs of
children, youth and adults (KIE, 2003).
The definitions brings out the concept of NFE as a form of education that is
systematic and organized just like the formal education but whose emphasis is
on non-conventional delivery or facilitation methods, approaches and
techniques. These methods are more flexible and diverse, being adapted to the
particular needs of its clients or learners and their unique circumstances
(Sifuna, 1994).
2.3 Curriculum implementation in non-formal schools: an overview of
selected countries
Implementation is carrying out of something or the practical application of
methods, procedure or desired purpose (Fullan & Pomfret, 1977). Loucks and
Lieberman (1983) define curriculum implementation as rolling out of a new
practice to establish how it looks like when it is actually used in a school
system. This study looks at curriculum implementation as the process by
which knowledge, skills, attitudes and abilities are put in practice in NFPSs.
According to Fullan and Pomfret (1977), effective implementation of
curriculum requires time, personal interaction and contacts, in-service training
and other forms of support. Indicators of curriculum implementation have
been defined as measures that convey a general impression of the state or
nature of the curriculum being implemented (Raizen and Jones, 1985). In
NFPSs the measures that indicate the extent of curriculum implementation
include among others performance in examinations, rate of transition to
secondary level, syllabus coverage and school dropout rate.
14
Curriculum implementation in Non-formal education varies from one
country to another depending on the curriculum in place. In India, NFE
consists of an organized, systematic and planned educational activity,
essentially characterized by inbuilt flexibility and carried on outside the
framework of the formal system (National Council for Teacher Education,
1993). The scheme started on pilot basis in 1979 and expanded over the next
few years to cover ten educationally backward states. In 1986, National Policy
on Education (NPE) built upon this scheme and recognized that a large and
systematic program of NFE was required to ensure access to elementally
education. NPE also revised the system and offered training to local men and
women to become instructors (Rahman, 2010).
According to the Council, the education provides learning experiences to
children in the age group of 6-14 years who are not able to avail of the
facilities of formal schooling. Children from the non-formal system are
eligible to appear in the examination leading to certification to join the formal
system. In some cases formal and non-formal education are similar as both are
organized to promote and facilitate learning. However, they differ in their
institutional management and the organization of the course content (NCTE,
1993).
According to National Policy on Education (NPE, 1986) the national
government was to take effective steps to provide a framework for the
curriculum on the lines of the national core curriculum, but based on the needs
of the learners and related to the local environment. Learning materials of high
quality would be developed and provided free of charge to all pupils. Non-
15
formal programs would provide participatory learning environment, and
activities such as games, and sports, cultural programs, excursions, etc
(Rahman, 2010).
In Tanzania, basic education for out of schoolchildren and youth is
implemented through COBET which was initiated in 1999 by the Ministry of
Education with the support of UNICEF (Bhalalusesa, 2003). COBET learners
range between 8-18 years of age. The curriculum is flexible and relevant to
educational needs and interests of out of school children, linking classroom
and home functions and including economic and income generating activities
(Mushi, 2002). Classes run for three and a half hours to allow learners to do
their chores or income generating projects. While pedagogy is based on child-
friendly principles, it follows the formal primary school curriculum (MOEVT,
2012).
In Kenya, NFE is a complimentary strategy to provide education and
training to children and youth who may have dropped out of school or have
never enrolled. It caters for children and youth of between 6-18 years. It is
aimed at assisting Kenya in the attainment of education for all (MOE, 2004).
Most non-formal primary schools are managed by Non-Governmental
Organizations, local communities, faith based organizations and private
individuals. Recently, the MOE has been engaging on registration drive of
NFSs that are then provided with capitation grants for teaching and learning
materials. They are also provided with trained teachers who are crucial in
curriculum implementation MOE, 2009).

16
NFPSs follow the national primary education curriculum and enroll school
age children (MOE, 2009). Among the principles guiding provision of NFE in
NFPSs includes; flexible and responsive education provisions; provision of
basic needs like food, clothing and shelter by the government and
stakeholders; provision of safe, friendly and protective learning environment;
and provision of relevant and quality education (MOE, 2009).
2.4 Human resource and its influence on curriculum implementation in NFPSs
According to SADC (2000), the quality and quantity of the human resource
determines the quality of teaching and learning. The MOE therefore should
ensure that there is some equity in the distribution of qualified personnel in all
schools. This because the allocation of human resources to schools is as
important as the allocation of financial resources (SADC, 2000). According to
Firestone and Corbett (1988), the functions of the administrators in the school
includes obtaining resources, shielding curriculum implementation from
outside interferences and encouraging staff members. They also provide the
necessary leadership in evaluating teaching personnel and school program. It
is the responsibility of the school administrators to keep records of curriculum
implementation and reporting outcomes (Aguilando, 2012).
The school administrators are the final decision makers on matters
concerning curriculum implementation. They ensure that the school has in
place resources, tools, and processes that guide and support instructional
improvements that enable the school to implement the planned curriculum
without unnecessary delays. They also implement the government policies
appertaining to curriculum-based establishment, in servicing of teachers and

17
standard of physical facilities. Bearing this in mind, an administrator who is
adequately trained, experienced, frequently in-serviced and motivated will
contribute a lot in as far as curriculum implementation in NFPSs is concerned.
Wambowa (2011) recommended that headteachers in NFSs should be
provided with workshops which would equip them with relevant knowledge
and skills.
Aguilando (2012) argues that the teacher is the developer and implementer
of the curriculum. He or she writes curriculum daily through a lesson plan,
lesson notes and schemes of work. He then addresses the goals, needs and
interests of the pupils by creating experiences from where they can learn. In
the process, the teacher designs, enriches and modifies the curriculum to suit
the needs of the pupils (Aguilando, 2012). Teacher use their knowledge,
experiences and competencies to interpret and execute the curriculum on day-
to-day basis (Zeiger, 2014). According to her, the key to getting teachers
committed to curriculum implementation is to enhance their knowledge in the
program through training and workshops. The Kenya Vision 2030 commits
the government to improve teacher to student ratio from 1:47 to 1:40 (GOK,
2007). Salamuddin, Harun & Abdullah (2011) noted that teachers being the
main executors of the curriculum should possess sufficient knowledge and
skills in order to ensure success of the education. Basic Education Act (2013),
demands that the government should provide human resource, including
adequate teaching staff according to the prescribed staffing norms.
In their research work, Penuel, Fishman, Yamaguchi &Gallagher (2007)
found out that educational attainment of teachers affect their class
18
performance. They argue that for the teacher to be qualified enough to be
involved in the implementation process, he/she must be equipped with the
right knowledge, skills and attitudes. As such, the focus on learning
achievement implies increasing teacher capacity and performance through pre-
service and in-service training and improved school and classroom
management (UNESCO, 1990). Moseti (2007) argues that the effectiveness on
any curriculum depends on the quality of teachers that are there to translate the
syllabus in to practical instructional materials in class. In addition, Orstein and
Hunkins (1988) assert that effective implementation of any curriculum can
only happen if the teachers’ pre-service and in-service training are adequate
and regular.
Wambowa (2011) investigated the factors influencing implementation of
non formal education in NFPSs in Mukuru-Kwa Njenga, Nairobi, Kenya. The
study found out that among the challenges faced in the schools include
inadequate academic and professional qualifications of teachers. The same
study recommended that, for implementation of NFE to be successful, there
should be workshops for teachers to equip them with the relevant knowledge
to improve on teaching methods, guidance and counseling in schools.
According to Hanushek (2003), investigations of teacher experience have
been conducted in a wide range of developed and developing countries. In his
own research of the same, Hanushek found out that experience effects are
concentrated in the first few years of teaching. Hussein (1978) argues that
when all factors are held constant, it is generally agreed that a teacher gains
skills through experience and that the more the experience a teacher has the

19
more successful he will be in his work. According to Mutoro (2001), a
teachers’ experience determines competence and efficiency.
2.5 Instructional materials and their influence on curriculum
implementation in NFPSs
Eshiwani (1988) observed that lack of textbooks and teaching materials makes
teaching difficult as pupils are unable to do their oral or written work during
class lessons. The availability of quality resource material has a great
influence on curriculum implementation (University of Zimbabwe, 1995).
Students’ achievement at any point is a cumulative function of inputs such as
laboratories, textbooks, school buildings and libraries among others (Dahir
and Faize, (2011). Provision of stationeries and teaching aids is also critical to
curriculum implementation. According Yara and Otieno (2010), the more the
provision of stationeries and teaching aids the better the academic
performance of students. The findings of Yadar (2001) and the Report by
UNESCO (2008) have shown that classrooms, teaching aids and stationeries
affect the academic performance of learners. Further, they argue that learning
is strengthened when there are enough reference materials such as textbooks,
and classrooms. According to the KIE survey of 1994, there was a general
lack of adequate and appropriate facilities and resources for teaching and
learning in the NFSs. The survey revealed that learning materials were
inadequate and of low quality. Shortage or lack of learning and teaching
hampers curriculum implementation in NFSs (MOE, 2007).
While formulating the Kenya Vision 2030 (2007) the government
acknowledged the need to raise the quality of education in order to improve

20
productivity and competitiveness of Kenya’s human resource pool. The
second education goal for 2012 for the vision is raising the quality of
education in which the government pledges that, all students will be provided
with more textbooks this will provide learners with opportunities to exploit
their potentials to the fullest. The target under this goal will be to reduce the
textbook to the pupil ratio from 1:3 to 1:1 (GOK, 2007). This goes a long way
to improve curriculum implementation in non-formal primary schools since it
makes it possible for the learners to think for themselves, ask questions in
class and to complete assignments (Udo, 1989).
2.6 Pupil characteristics and their influence on curriculum implementation in
NFPSs
Learners hold the key to what is actually transmitted and adopted from official
curriculum. Since learner factors influence teachers in their selection of
learning experiences, there is need to consider their diverse characteristics in
curriculum implementation (University of Zimbabwe, 1995). According to
Biesta (2009), there is an emerging trend in the curriculum implementation,
which is placing the learner at the heart of education; a trend he refers to as
‘learnification’ of education. This idea concurs with the position of Ross
(2000) and Schiro (2008) who argue that the purpose of education is to train
students’ skills and procedures they will need in the workplace.
Findings of a study done by Sharp, George, Sargent, O’Donnell & Heron
(2009) revealed that pupils who are younger in the year group do less well in
attainment tests. The findings also indicated that children who are younger in
year group are more frequently retained, that is, they have to repeat a year of

21
schooling. The finding further revealed that relatively younger children are
more frequently identified as having special needs. According to this study,
though there is a smaller relative age difference among older primary children
the difference remains educationally significant in primary school (P:1)
The vision of the National Special Needs Education Framework (2009) is
to have a society in which all persons regardless of their disabilities and
special needs achieve education to realize full potential (MOE,2009). It also
advocates an inclusive education where pupils with special needs are
integrated in normal education system. As a result of the government
commitment towards Universal Primary Education, the demand for services
for children with special needs has increased (UNESCO, 2005). According to
MOE (2005), the government trains primary school teachers in special
education in order to improve the necessary national capacity to handle special
needs education. Government’s efforts help to improve curriculum
implementation in primary schools including NFPSs.
2.7 Teaching methods and their influence on curriculum implementation
in NFPSs
In order for the teacher to effectively implement the planned curriculum,
he/she must use diverse styles to teach the pupils and not just the subject
(Chittom, 2012). According to her, this is because different pupils require
different styles of teaching in order to grasp curriculum content that will in
turn lead to effective curriculum implementation. According to Felder and
Silverman (1988), when mismatches exist between learning styles and the
teaching style of the teacher, the student may get bored and inattentive in

22
class, do poorly in class and get discouraged about the subject. They argue that
teachers should strive for a balance of instructional methods. Davidoff (1990)
argues that students learn better and more quickly if the teaching methods used
match their preferred learning styles. He argues that appropriate teaching
methods motivate pupils to learn and lead to improved student-teacher
relationship that makes them more successful and is more interested in
learning.
Auditory learners learn best through hearing the message and therefore
such pupils will respond well to lecture teaching method and verbal
instructions. According to NDT Education Centre (2014) auditory learners do
well with lecture and classroom discussion. As such, teachers should use
memory aids such as acronyms, short songs or rhymes. At the same time,
since auditory pupils learn best when they read loudly, flip cards that can be
read aloud can be used during class instructions (Chittom, 2012). Visual
learners on the other hand process information according to what they see and
the images they create in their minds. This group benefits from learn by
observation, following written and drawn instructions and they like to read
(NDT Education Centre, 2014). While teaching such pupils, illustrations,
diagrams and charts are very helpful as this aid helps them understand the
curriculum content better. Kinesthetic or tactile learners learn best through
touching, feeling and doing. These pupils learn through experience and
physical activity, benefit from demonstration and learn from teaching others
what they know. In teaching these pupils, teachers should incorporate role
plying, drama, playing games etc (NDT Education Centre, 2014).

23
2.8 Physical facilities and their influence on curriculum implementation in
NFPSs
Physical facilities are the tangible resources in the school that support
implementation of the planned curriculum. Though their relationship with
learning may not be very direct, there is evidence that physical conditions of
the schools can influence student achievement (Mcgowen, 2007). In a
Virginia study, Cash (1993) developed research that examined the impact of
various factors of building condition on student achievement in a manner that
controlled socio-economic status of the students. He found out that when
socio-economic factors were constant, facility condition had significant
correlation with student achievement. Cash (1993) found that air conditioning,
absence of graffiti, condition of science laboratories, locker accommodations,
and condition of the classroom furniture correlated with students’ achievement
at a significant level.
According to the Jomtien conference (1990), overcrowding in primary
schools especially in early grades is a major source of poor achievement.
Member states argued that there is evidence that there is correlation between
special facilities like computer laboratories and achievement of specific
domains of learning (UNESCO, 1990). According to the KIE survey of 1994,
physical facilities in NFSs were generally inadequate and inappropriate.
Inadequate facilities like classrooms, desks etc hamper curriculum
implementation in NFSs (MOE, 2007). Unfortunately, most of the NFPSs are
located in high poverty areas such as urban slums and they are financially
unable to construct learning facilities (Mwania, 2013). The Basic Education

24
Act (2013), demands that the government provide infrastructure including
schools, learning equipment and appropriate finances. According to the study
of Mukuru Kwa Njenga on NFE by Wambowa (2011), the government should
provide adequate facilities and finances for NFSs to build more classrooms
and other social amenities to ease congestion in the existing facilities.
2.9 Theoretical Framework
The study is based on the Resource Based View (RBV) or Resource Based
Theory, which according to Business Dictionary is founded on the idea that
effective and efficient application of useful resources that a company can
muster helps to determine its competitive advantage. The main proponents of
this theory are Bain (1968) and Porter (1979, 1980, and 1985) who argues that
firms possesses resources, tangible and in tangible, which when well utilized
lead to creation of competitive advantage. Resource Based View focuses on
internal resources of the firm and aims to explain why firms in the same
industry differ in performance (Kraaijenbrink, 2009).
Resource Based View is applicable to this study because NFPSs are
organizations or firms whose aim is to use various factors at its disposal to
instill knowledge, skills, abilities and values that will enable the pupils to pass
KCPE examinations, transit to secondary schools, complete primary school
and avoid stagnation in one level productive in the society. In line with RBV,
for NFPSs to produce a product of high quality, the curriculum must be fully
implemented. Internal resources (school factors) both tangible and in tangible
are the main inputs in the implementation process. Tangible resources in the
context of this study are classrooms, desks, text books and teaching aids while

25
in-tangible resources include teachers’ qualification, teachers experience and
pupils characteristics.
2.10 Conceptual framework
Miles and Huberman (1994) define conceptual frame work as a visual or
written product that explain graphically or in narrative the main things to be
studied - key factors, concepts or variables - and the presumed relationships
among them.
Figure2.1
Relationship between school factors, curriculum implementation and
performance in NFPSs
Figure 2.1 shows the interrelationship between school factors, curriculum
implementation and performance of pupils in NFPSs. When school factors are
Human Resources
Administrators
Teachers
Instructional Materials:
Text Books
Teaching aids
stationeries
Pupil Characteristics:
Age
Special needs
Teaching Methods
Lecture
Discussion
Role play
Demonstration
Physical Facilities:
Classrooms
Desks
Sports fields
-Computer labs
Curricu
lum
Implem
entatio
n
Performance
in K.C.P.E,
Transition to
secondary
education,
Syllabus
coverage,
Level of
school
dropouts.
26
adequate, curriculum is properly and fully implemented which translates to
high KCPE performance, high transition to secondary education, adequate
syllabus coverage and low school dropout rate. On the other hand, if school
factors are not available in adequate measures, curriculum is not properly
implemented which leads to low performance in KCPE, low transition to
secondary education, adequate syllabus coverage and high school dropout rate.
Since this study does not concern itself with performance of pupils, the
connection between curriculum implementation and the performance is shown
in broken line.
2.11 Summary of literature review
For NFE to effectively contribute to the attainment of the EFA goals by 2015,
the curriculum in operation must be effectively implemented (Chhem, 2001).
Proper curriculum implementation demands that school factors among others
must be put in place (Fullan and Pomfret, 1977). Sessional Paper No. 1 of
2005 on Policy Framework on Education, Training and Research
acknowledged that quality and relevance of NFE are affected by unqualified
teachers who often employ inappropriate methods, lack of teaching and
learning materials and inadequate physical resources (MOEST, 2005).
The above challenges jeopardize curriculum implementation in NFSs
including NFPSs. Poor curriculum implementation in turn negatively affects
the individuals and the government in their attempt to meet their respective
commitments (Mwania, 2013). Even with the widespread recognition of the
influence of factors in curriculum implementation in NFPSs, no studies have

27
addressed school factors influencing curriculum implementation in Westlands
sub-county hence this study fills in that knowledge gap.

28
CHAPTER THREE
RESEARCH METHODOLOGY
3.1 Introduction
This chapter discusses how the research was conducted. It presents the
procedures that were used in conducting the study. The procedures are
presented under a number of topics, that is, research design, target population,
sampling procedure, data collection instruments, piloting, validity of
instruments, reliability of instruments, data collection procedure and data
analysis.
3.2 Research design
The study used descriptive survey design, which is the systematic collection of
data in standardized form from an identifiable population or representative
(Oso and Onen, 2009). Through this method, the study sought to establish how
the situation is on the ground in as far as school factors that influence
curriculum implementation in NFPSs is concerned.
3.3 Target population
According to Mugenda and Mugenda (2003), target population are the
members of a real or hypothetical set of people, events or objects the
researcher wishes to generalize the results of the research. The study used six
registered NFPSs in Westlands sub-county, Nairobi. The population of this
study was approximately 306 respondents who constituted the administrators,
teachers and pupils of the six NFPSs. This information was obtained from
administrators of the specific schools under study.

29
3.4 Sampling size and sampling procedure
A sample is a proportion of the population. Mugenda and Mugenda (2003)
suggest that 10 percent or more of the population is ideal for a survey study.
The studies relied on the suggestions of Mugenda and Mugenda and choose 14
percent of 306 respondents to get a sample size of 42 participants. A census of
head teachers was used while random sampling was used to choose the
teachers and the pupils. Two teachers were selected from each school and four
pupils (two boys and two girls) were chosen from each school. Table 3.1
illustrates the sample size.
Table 3.1
Sample size
3.5 Data collection instrument
Data were collected by use of questionnaires and observation checklist. Three
sets of questionnaires were prepared. One questionnaire was for the
administrators of NFPSs and it contained two sections; the first section sought
general information of the administrators and the second section dealt with the
objectives of the study. The second questionnaire was for the teachers of
NFPSs and it had two sections; the first section dealt with general information
of the teachers and the second section sought information on the objectives of
Category Population Sample Percentage
PpppPPPPercentage
%%Percentage (%)
Administrators 6 6 100
Teachers 72
12 17
Pupils (class 7) 120 12 10
Pupils (Class 8) 108 12 11
Total 306 42 14

30
the study. The third questionnaire was for class 7 and class 8 pupils in NFPSs
and it had two sections; the first section dealt with general information of the
pupils and the second section dealt with information on research objectives. In
developing the questionnaire items, fixed choice and open-ended format items
were used. Open-ended format was adopted to allow more spontaneity of
response and provide more opportunities for self expression (Mutai, 2000). An
observation checklist is the systematic and accurate collection of visual
evidence leading to informed judgments (Tilstone 1998). The observation
checklist was used to establish the available instructional materials and
physical facilities and their adequacy in the curriculum implementation
process.
3.6 Piloting of the research instruments
The researcher selected two registered NFPSs for the purpose of piloting. The
pilot schools were selected from neighbouring sub-county. The study settled
on two NFPSs because according to Baker (1994), a pilot size of at least 10%-
20% of the sample size for the actual study is appropriate in any research. Two
pilot schools represented a pilot size of 33.3% of the sample size and were
considered sufficient for the study. Piloting helped to identify any ambiguity
of the data collection instrument and unclear questions to the respondents. The
pilot study also assisted the researcher to test for validity and reliability of the
data collection instrument.
3.6.1 Validity of research instruments
Validity is the extent to which the instrument of research measures what it is
supposed to measure (Babbie 1990). To test for validity, the researcher

31
discussed the items in the instruments with the supervisors who were expected
to tick or cross every item in the questionnaire and verify whether it measures
what it was supposed to measure or not. The response of the experts was
checked against the research objectives to establish whether content validity
had been achieved.
3.6.2 Reliability of research instruments
Reliability points at the degree to which an assessment tool produces stable
and consistent results (Babbie, 1990). The researcher tested reliability of the
instrument during piloting. To ensure reliability of the questionnaires, the
researcher used split half method where the items in the instrument are divided
in two halves and then correlated using Spearman-Brown Prophecy formula
(Babbie 1990). According to Mugenda and Mugenda (2003) a high coefficient
of reliability from split half indicates high reliability of the instruments. After
computing the Spearman-Brown Prophecy formula, the level of reliability of
o.77 was considered by the researcher to be adequate in judging the
instruments to be highly reliable.
=
Where 2r = correlated reliability
r = Uncorrelated reliability
n = No. of parts

32
To ensure reliability of the observation checklist, the researcher used
triangulation method which according to O’Donoghue and Punch (2003) is a
method of cross-checking data from multiple sources to search for regularities
in the research data. In the study, the researcher cross-checked data of the
observation checklist with similar data sourced through the administrators’,
teachers’, and pupils’ questionnaires which enhanced accuracy and credibility
of the instrument.
3.7 Data collection procedure
The researcher obtained a research permit from National Council of Science,
Technology and Innovation, then an authorization letter from the Sub-County
Education Office, Westlands. The researcher then booked an appointment with
NFPSs administrators to visit their schools. On the day of conducting research,
the researcher reported to the head teacher’s office and created rapport with
the administrator. The administrator introduced the researcher to the teachers
and pupils and then gives authority for commencing of the research process.
The questionnaire was administered directly by the researcher to the
administrators’ and teachers. The teachers then assisted the researcher to
administer the questionnaire to the pupils. However, in some of the schools the
administrators were absent on the appointment day and the researcher dropped
the instrument and picked them after two days.
3.8 Data analysis
The collected data were cleaned to remove questionnaires that were
incomplete and/ or responses that did not make sense. Then the raw data was
coded according to the source. The coded data was first summarized using

33
cross tabulation, then analyzed through descriptive statistics that provided an
overview of the respondents’ perspective of the school factors under study. To
analyze qualitative data, the coded data was grouped in to themes that would
help to answer the research questions. The data was then organized and
compressed in to a display that facilitated the drawing of conclusions. The
display was in form of figures, tables and text. Adequacy of school factors
was addressed by getting the gap between the status of the factors and the
expected status as stipulated in the MOE guidelines where possible. Statistical
Package for Social Sciences (SPSS) software was used in the analysis.

34
CHAPTER FOUR
DATA ANALYSIS, PRESENTATION AND DISCUSSION
4.1 Introduction
This chapter presents the analyses and discussion of the data collected from
the survey of the six registered NFPSs in Westlands sub-county. Responses
from the three sets of questionnaires and the observation checklist were
examined, compiled and evaluated to answer the research questions. The data
was then organized and displayed in tables and figures in order to come up
with patterns that provided the best interpretation of the results of the study.
The chapter is organized in to a number of topics; questionnaire return rate,
demographic information of the respondents, respondents’ view on curriculum
implementation in NFPSs and respondents’ view on factors influencing
curriculum implementation in NFPSs.
4.2 Questionnaire return rate
The research targeted three sets of respondents comprising of administrators,
teachers and pupils of selected NFPSs. An observation checklist was used by
the researcher to establish the availability the physical facilities in the NFPSs.
The response was as shown in table 4.1

35
Table 4.1
Questionnaire return rate
Respondents Sample Returned Percentage
Administrators 6 6 100
Teachers 12 12 100
Pupils 24 22 91.7
Observation checklist 6 6 100
Total 48 46 98.6
Table 4.1 shows that only less than 2 percent of the respondents failed to
return the questionnaires. This means the rate of response to the research
instrument was quite high at 98.6 percent. The high response rate may be
attributed to the fact that the researcher personally administered the
instrument.
4.3 Demographic data of the respondents
Demographic data is information regarding characteristics of human
population (Dierckx, 2013). This section presents the demographic data of the
administrators, teachers and pupils sampled for the study. The data presented
includes gender and professional qualification of administrators and teachers
on one hand and gender and age of pupils on the other. This data collected was
used to answer research questions related to characteristics of the respondents.
4.3.1 Gender and professional qualifications of administrators in NFPSs
To establish the gender of the administrators, they were requested to indicate
the same as represented in figure 4.1.

36
Figure 4.1
Distribution of administrators by gender
Although figure 4.1 revealed that majority (66.7%) of the administrators were
males, the data shows that gender distribution among the administrators was in
line with the government policy of at least a third of either gender in public
offices (GOK, 2010).
The administrators were further requested to indicate their level of
professional qualification.
Table 4.2
Administrators’ professional qualifications
Qualification F Percentage
Diploma 3 50
Certificate (P1) 3 50
Total 6 100
Male, 66.70%
Female, 33.30%
37
According to table 4.2, half of the administrators had a diploma level of
professional qualification while the other half had a certificate level of
qualification which was considered as the minimum qualification for primary
school teaching and management. This showed that NFPSs many (50%) of the
administrators had in inadequate qualification to manage curriculum
implementation in the schools.
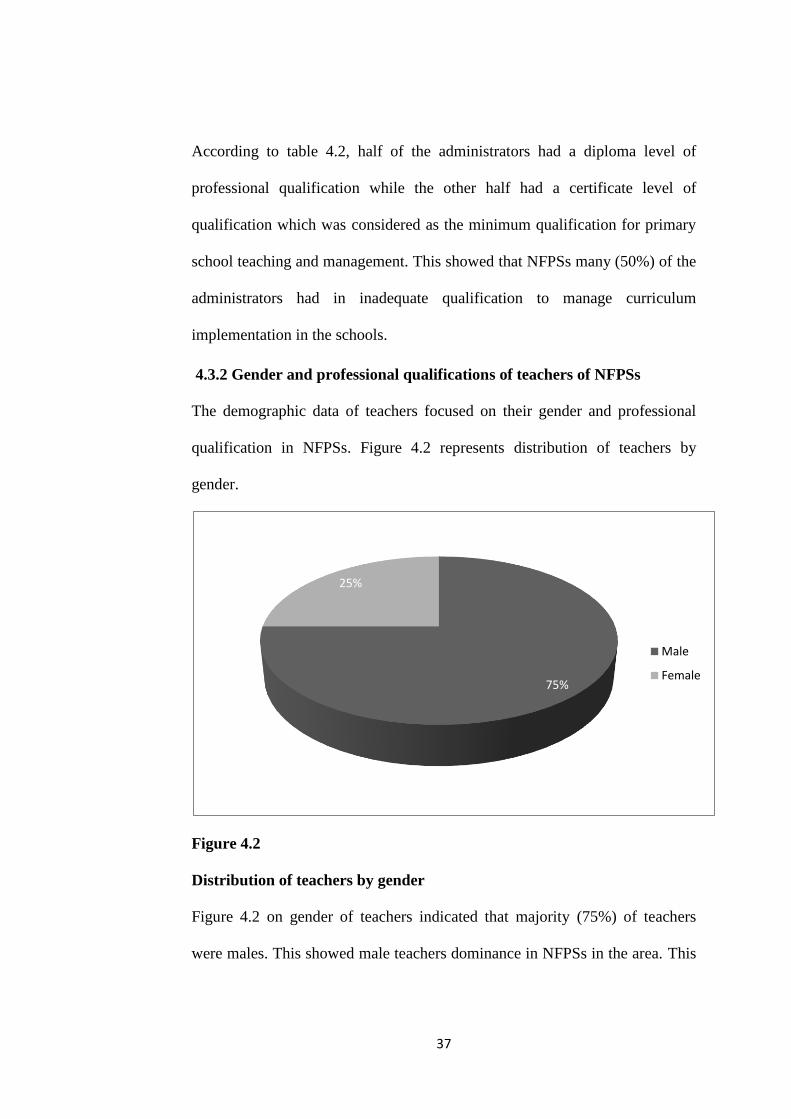
4.3.2 Gender and professional qualifications of teachers of NFPSs
The demographic data of teachers focused on their gender and professional
qualification in NFPSs. Figure 4.2 represents distribution of teachers by
gender.
Figure 4.2
Distribution of teachers by gender
Figure 4.2 on gender of teachers indicated that majority (75%) of teachers
were males. This showed male teachers dominance in NFPSs in the area. This
75%
25%
Male
Female

38
implied inadequate gender balance among the teachers which may negatively
affect curriculum implementation process.
Teachers were asked to indicate their professional qualification and figure 4.3
illustrates their response.
Figure 4.3
Teachers’ professional qualifications
Figure 4.3 shows that majority (75%) of teachers had minimum requirement
for primary school teaching which is a certificate. There was also a
considerably high percentage of untrained teachers teaching in NFPSs in
Westlands sub-county. This is in contrast with the research findings by
Moseti (2007) who argues that the effective implementation of any curriculum
depends on the quality of teachers in the school. The study shows that teachers
in NFPSs were not properly qualified to handle curriculum implementation in
the schools.
4.3.3 Age and gender of pupils in NFPSs
The study sought to establish the age of the pupils by requesting them to state
their age as illustrated by table 4.3.
8.30%
75%
16.70%
0.00%
20.00%
40.00%
60.00%
80.00%
Diploma Certificate Untrained

39
Table 4.3
Ages of pupils in classes 7 and 8
Class 7 Class 8
Age
(Years)
F Percentage F Percentage
12 5 45.5 1 9.1
13 4 36.4 3 27.3
14 1 9.1 6 54.5
15 1 9.1 1 9.1
Total 11 100 11 100
According to table 4.3, in class 7 many (45.45%) of the pupils were below the
MOE recommended age of thirteen years (MOE, 2013). Pupils below the
recommended age may impede proper curriculum implementation because
their cognitive maturity level is still low (Sharp, George, O’Donnell &Heron,
2009). In class eight, majority of the pupils are within the recommended age
of fourteen years (MOE, 2013).
The study also sought to establish the gender of the pupils. Figure 4.4 show
gender representation of the pupils
40
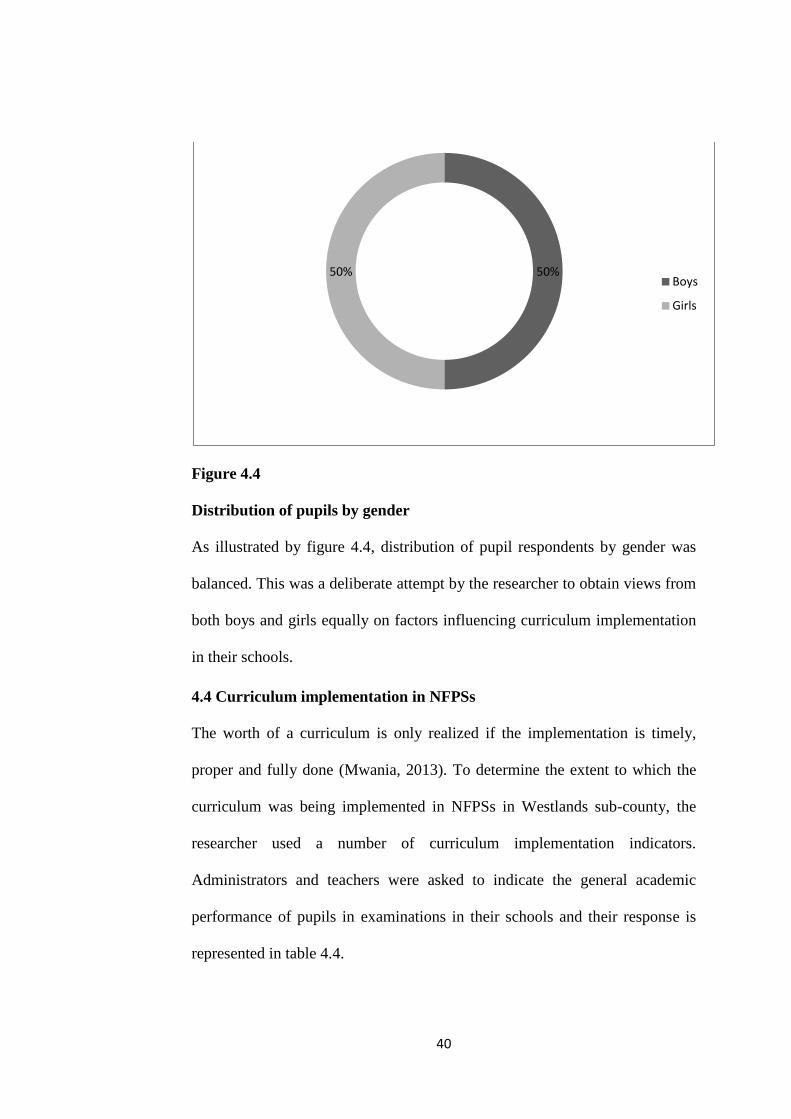
Figure 4.4
Distribution of pupils by gender
As illustrated by figure 4.4, distribution of pupil respondents by gender was
balanced. This was a deliberate attempt by the researcher to obtain views from
both boys and girls equally on factors influencing curriculum implementation
in their schools.
4.4 Curriculum implementation in NFPSs
The worth of a curriculum is only realized if the implementation is timely,
proper and fully done (Mwania, 2013). To determine the extent to which the
curriculum was being implemented in NFPSs in Westlands sub-county, the
researcher used a number of curriculum implementation indicators.
Administrators and teachers were asked to indicate the general academic
performance of pupils in examinations in their schools and their response is
represented in table 4.4.
50% 50% Boys
Girls
41
Table 4.4
General academic performance of pupils in examinations in NFPSs
Administrators
F Percentage
Teachers
F Percentage
Average 3 50 8 66.7
Below
average
3 50 4 33.3
Total 6 100 12 100
Table 4.4 reveals that half (50%) of the pupils in NFPSs in Westlands sub-
county were below average academically while the other half (50%) of the
pupils were average achievers in examinations. This situation could be
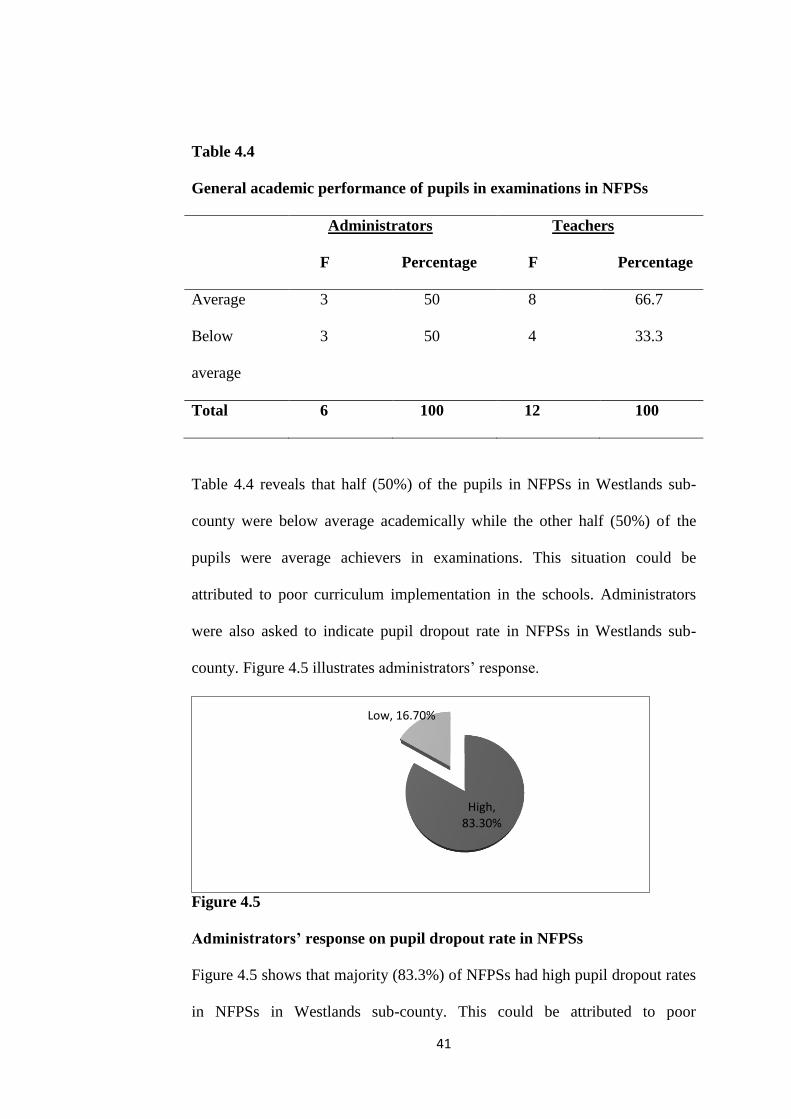
attributed to poor curriculum implementation in the schools. Administrators
were also asked to indicate pupil dropout rate in NFPSs in Westlands sub-
county. Figure 4.5 illustrates administrators’ response.
Figure 4.5
Administrators’ response on pupil dropout rate in NFPSs
Figure 4.5 shows that majority (83.3%) of NFPSs had high pupil dropout rates
in NFPSs in Westlands sub-county. This could be attributed to poor
High, 83.30%
Low, 16.70%
42
curriculum implementation in the schools therefore not meeting the pupils’
needs.
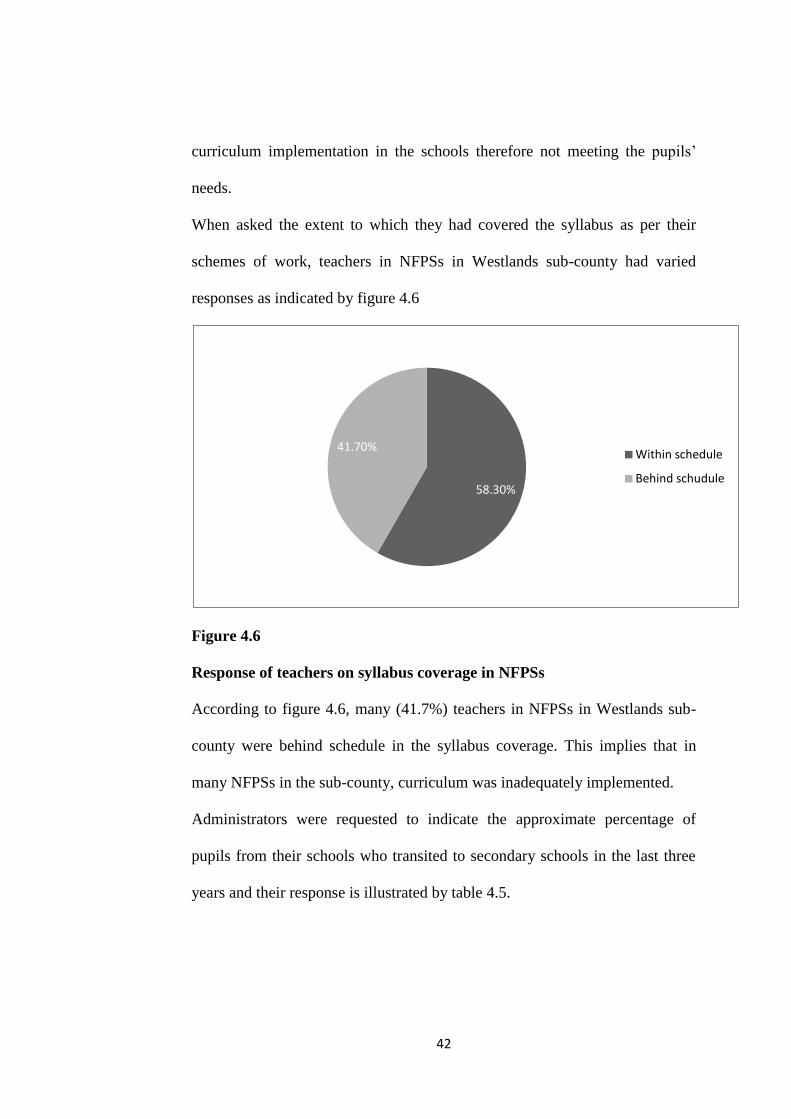
When asked the extent to which they had covered the syllabus as per their
schemes of work, teachers in NFPSs in Westlands sub-county had varied
responses as indicated by figure 4.6
Figure 4.6
Response of teachers on syllabus coverage in NFPSs
According to figure 4.6, many (41.7%) teachers in NFPSs in Westlands sub-
county were behind schedule in the syllabus coverage. This implies that in
many NFPSs in the sub-county, curriculum was inadequately implemented.
Administrators were requested to indicate the approximate percentage of
pupils from their schools who transited to secondary schools in the last three
years and their response is illustrated by table 4.5.
58.30%
41.70% Within schedule
Behind schudule

43
Table 4.5
Response of administrators on pupils’ transition rate to secondary schools
Transition rate
(Approximate %)
Frequency Percentage
55 3 50
65 2 33.3
Over 70 1 16.7
Total 6 100
According to table 4.5, in majority (83.3%) of NFPSs in Westlands sub-
county, less than 70 percent of pupils transited to secondary schools. This is
below the national transition percentage of 70 percent (MOE, 2012). Low
transition rate in NFPSs could be attributed to poor performance in KCPE
which could have been contributed by poor implementation of the curriculum.
4.5 Influence of human resource on curriculum implementation in NFPSs
The first objective of the study was to examine the role of human resource in
curriculum implementation in NFPSs. To determine the extent to which
adequacy of human resource influenced curriculum implementation,
administrators and teachers respectively were asked to indicate whether they
felt they were important in curriculum implementation in NFPSs. They were
also required to indicate whether their qualifications, experience and in-service
training was essential for curriculum implementation in NFPSs. Majority
(83.3%) of administrators and all (100%) the teachers indicated that they felt
they were essential in as far as curriculum implementation is concerned. All of

44
the human resource also indicated that their qualification, experience and in-
service training contributed positively to curriculum implementation. To
establish the level of preparedness of administrators and teachers in handling
curriculum implementation in NFPSs, the respondents were requested to
respond to the items that sought to establish the same. This is supported by
SADC (2000) who argues that the quality and quantity of the human resource
determines the quality of teaching and learning.
Many of the administrators and teachers reported that some teachers
(33.3%) had never attended any in-service course while 25 percent had not
attended any in-service training in the last three years. When asked how they
learned of new innovations in education system and how they implemented
them, majority (66.7%) of the teachers said they relied on other teachers to
learn the innovations and used the same methods they had been using to
implement the innovations. This was found to negatively affect curriculum
implementation in NFPSs since teachers are not formally updated on new
innovations teaching methods of curriculum implementation.
Administrators and teachers were asked to indicate reasons why they
thought working experience is important in curriculum implementation in
NFPSs. Majority (66.7%) of the administrators and teachers indicated that it
helps in masterly of content which translates to effective curriculum
implementation. On their working experience, administrators’ response is
reported in table 4.6.

45
Table 4.6
Administrators working experience
Experience in years Frequency Percentage
0-9 1 16.7
10-20 3 49.9
Over 20 1 16.7
Total 5 83.3
As illustrated in table 4.6, 66.7 percent of the administrators had 10 years and
above of administrative experience. This indicated that administrators in
NFPSs have a relatively high level of experience to provide direction in the
implementation of curriculum in the schools. On the question of the working
experience of the teachers, their response is represented in figure 4.7.
Figure 4.7
Teachers’ professional experience
0.00%
10.00%
20.00%
30.00%
40.00%
50.00%
60.00%
0-5 years 6-10 years over 10 years
50.10%
25%
8.30%

46
According to figure 4.7, majority (50.1%) of teachers in NFPSs had five years
and below of teaching experience. Hussein (1978) argues that the more the
experience a teacher has the more successful the he will be in his work.
Research findings on teacher experience in NFPSs in Westlands sub-county
revealed that curriculum was not properly implemented as most of the teachers
lacked adequate teaching experience. According to the administrators and
teachers the ratio of teacher to pupils is below the recommended ratio by the
MOE as illustrated in table 4.7.
Table 4.7
Response of administrators and teachers on teacher pupil ratio
Administrators response Teachers response
TPR F Percentage F Percentage
Below 1:40 6 100 8 66.7
Above 1:40 - - 4 33.3
Table 4.7 illustrates that, 33.3 percent of the NFPSs in Westlands sub-county
had teacher pupil ratio above the recommended ratio of 1:40 by the MOE.
This situation led to poor curriculum implementation in the schools because
with the high number of pupils per teacher, the latter may not be in a position
to handle academic individual differences of the pupils.
4.6 Influence of instructional materials on curriculum implementation in
NFPSs
To effectively implement curriculum in NFPSs, adequate instructional
materials are required in order to allow learners to complete assignments and

47
do individual studies (Eshiwani, 1988). With provision of capitation grants to
registered NFPSs, it is expected that the ratio of textbook to pupil improve to
1:1 by 2012 (GOK, 2007). The same grants were to cater for stationeries and
teaching aids to the pupils. It is on this basis that the researcher sought to
examine the adequacy of instructional materials influenced curriculum
implementation in NFPSs in Westlands sub-county.
Teachers were requested to indicate reasons why the felt text books were
important in implementation of curriculum in NFPSs and all (100%) of the
teachers responded that text books contain the curriculum content that needed
to be implemented. Administrators and pupils were asked to indicate the ratio
of textbook to pupils in the five subjects taught in NFPSs. The respondents
gave different information and this prompted the researcher to analyze and
interpret the data according to the source. The response of the administrators
on textbook to pupil ratio is represented in table 4.8.
Table 4.8
Distribution of administrators’ response on textbook to pupil ratio
Ratio Frequency Percentage
1:1 1 16.7
1:3 4 66.7
1:4 1 16.6
Total 6 100
According to table 4.8 majority (83.3%) of NFPSs in Westlands sub-county
had not met the MOE recommendation of textbook to pupil ratio of 1:1 (GOK,

48
2007). This scenario led to poor curriculum implementation in the schools.
The pupils were asked to respond to a question about the number of other
pupils they shared textbooks with in all subjects in the school and their
response is shown in table 4.9.
Table 4.9
Pupils’ response on textbooks to pupil ratio
Ratio Frequency Percentage
1:2 7 29.2
1:3 6 25
1:4 6 25
1:5 3 12.5
1:6 2 16.7
Total 24 100
Table 4.9 shows that all NFPSs in Westlands sub-county had not achieved the
recommended government textbook to pupil ratio of 1:1. These findings
implied that curriculum implementation in these schools is poor as pupils lack
textbooks to make references and do extra work.
Pupils were asked to indicate whether provision of stationeries in the
school helped them to do their class work better and majority (83.3%) of the
pupils answered in the affirmative. Administrators and pupils were asked to
indicate whether pupils are provided with stationeries in the school as
provided by the MOE. The response of both the administrators and pupils are
represented in figure 4.8.
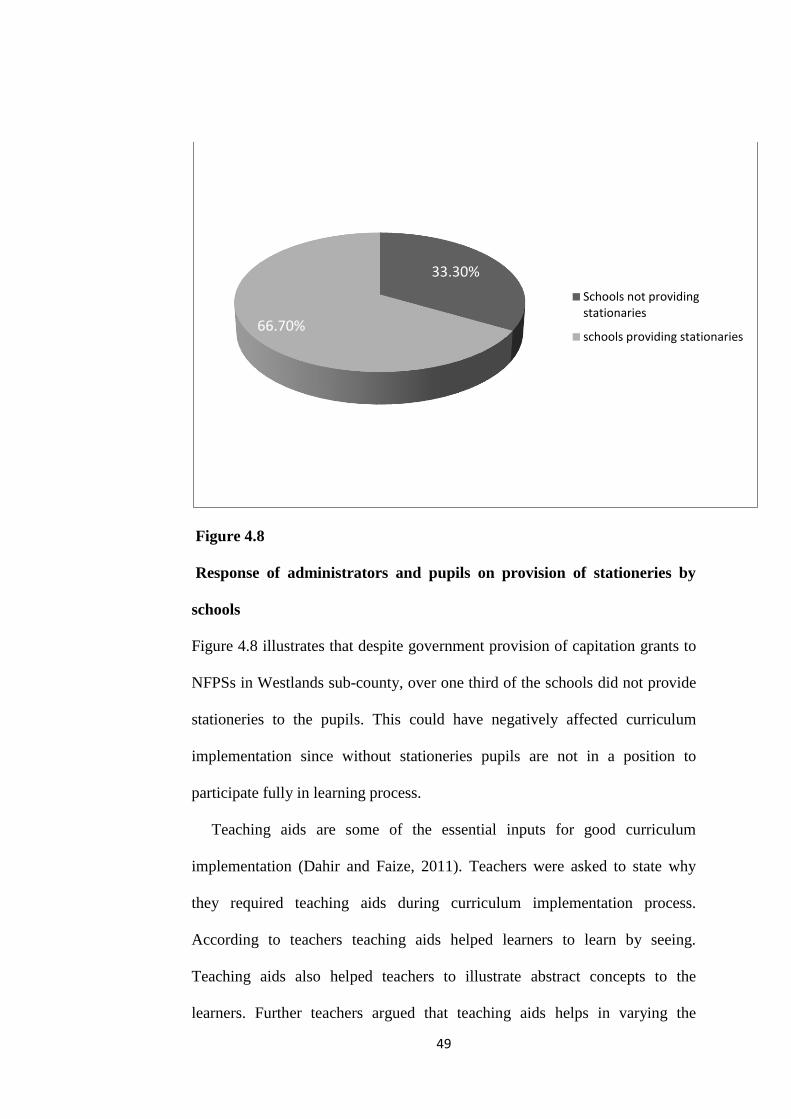
49
Figure 4.8
Response of administrators and pupils on provision of stationeries by
schools
Figure 4.8 illustrates that despite government provision of capitation grants to
NFPSs in Westlands sub-county, over one third of the schools did not provide
stationeries to the pupils. This could have negatively affected curriculum
implementation since without stationeries pupils are not in a position to
participate fully in learning process.
Teaching aids are some of the essential inputs for good curriculum
implementation (Dahir and Faize, 2011). Teachers were asked to state why
they required teaching aids during curriculum implementation process.
According to teachers teaching aids helped learners to learn by seeing.
Teaching aids also helped teachers to illustrate abstract concepts to the
learners. Further teachers argued that teaching aids helps in varying the
33.30%
66.70%
Schools not providing stationaries
schools providing stationaries
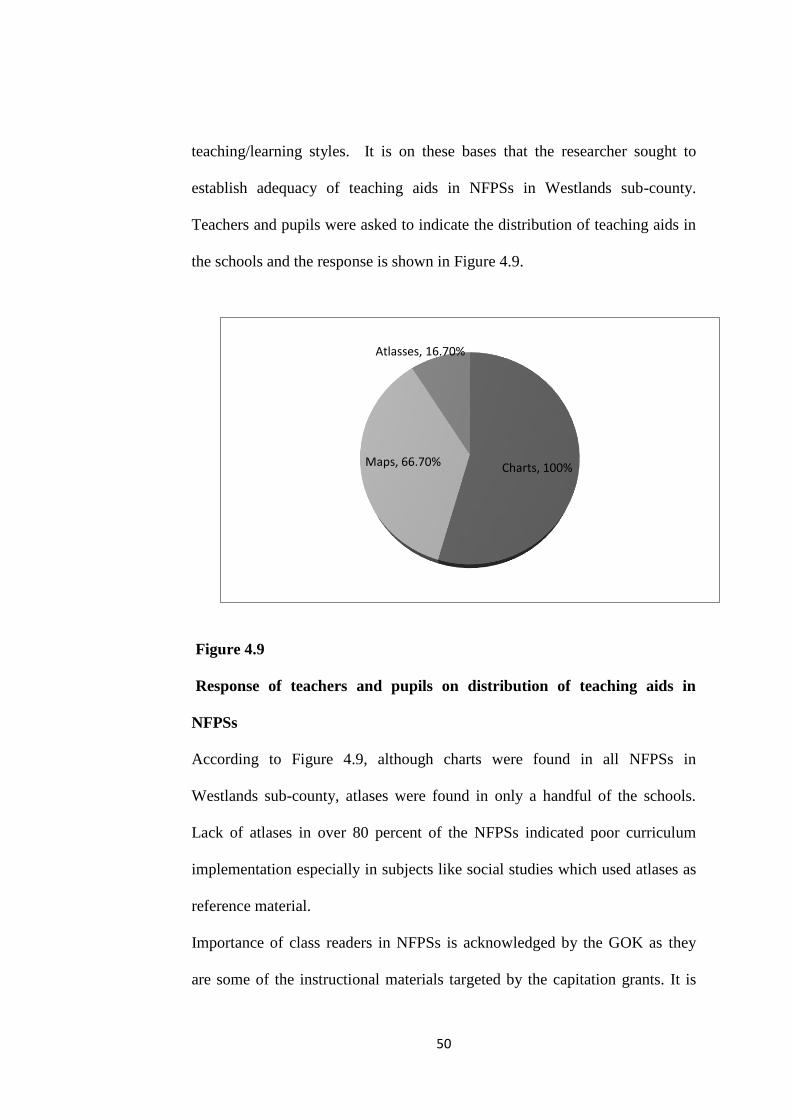
50
teaching/learning styles. It is on these bases that the researcher sought to
establish adequacy of teaching aids in NFPSs in Westlands sub-county.
Teachers and pupils were asked to indicate the distribution of teaching aids in
the schools and the response is shown in Figure 4.9.
Figure 4.9
Response of teachers and pupils on distribution of teaching aids in
NFPSs
According to Figure 4.9, although charts were found in all NFPSs in
Westlands sub-county, atlases were found in only a handful of the schools.
Lack of atlases in over 80 percent of the NFPSs indicated poor curriculum
implementation especially in subjects like social studies which used atlases as
reference material.
Importance of class readers in NFPSs is acknowledged by the GOK as they
are some of the instructional materials targeted by the capitation grants. It is
Charts, 100% Maps, 66.70%
Atlasses, 16.70%

51
on this basis that the researcher sought to establish the adequacy of class
readers in NFPSs in Westlands sub-county. The pupils were asked to indicate
whether they were provided with class readers in schools and their response is
presented in figure 4.10.
Figure 4.10
Response of pupils on provision of class readers by schools
Figure 4.10 shows that majority (66.7%) of the schools did not provide pupils
with class readers in NFPSs in Westlands sub-county. This disadvantaged
curriculum implementation process in the schools since lack of class readers
means that pupils do not have a chance to sharpen their reading skills which is
crucial in curriculum implementation in all subjects.
Lack of adequate instructional materials in NFPSs in Westlands sub-county
as shown by the study is supported by the KIE survey of 1994 which pointed
out that there was lack of adequate and appropriate facilities and resources for
teaching and learning materials.
33.30%
66.70%
Schools that provide
class readers
Schools which do not
provide class readers

52
4.7 Influence of pupil characteristics on curriculum implementation in
NFPSs
Pupils are the focal point of any curriculum implementation. Consideration of
the pupils’ characteristics is therefore crucial for any effective curriculum
implementation to take place. Special needs pupils in NFPSs require special
consideration if curriculum implementation will be effective in these schools
(MOE, 2005). The researcher sought administrators’ response on whether they
felt that special education teachers were essential in curriculum
implementation process in NFPSs. they were also to indicate why they felt that
special education teachers are important in NFPSs. Majority (83.3%) of the
teachers indicated that special education teachers were important in NFPSs as
they cater for the special needs of the pupils which lead to effective
curriculum implementation.
On whether there were special needs pupils in NFPSs and whether there were
trained teachers who would take care of the special needs of pupils in the
schools, administrators response is represented by figure 4.11

53
Figure 4.11
Administrators’ response on the number of special needs pupils against
the number of special needs education teachers in NFPSs
According to figure 4.11, half (50%) of NFPSs had special needs pupils
against 16.7 percent of special needs education teachers. This implied that
most special needs pupils in NFPSs did not have access to special needs
education teachers who are trained to handle their special needs. This
negatively affected curriculum implementation especially among special needs
pupils since their special needs may not be attended to fully.
4.8 Influence of teaching methods on curriculum implementation in
NFPSs
Teaching methods used by teachers determine the quality of education
implemented. Therefore teachers should be aware the teaching methods for the
purposes of making a suitable choice when it comes to instruction (Twoli,
Number of special needs pupils, 50%
Special needs education
teachers, 16.70%

54
2007). To determine how teaching methods influence curriculum
implementing in NFPSs Westlands sub-county, teachers were requested to
indicate if they felt that teaching methods were important in curriculum
implementation in NFPSs. According to the findings, all (100%) the teachers
indicated that teaching methods were important in curriculum implementation.
On why they felt that teaching methods were important in curriculum
implementation, majority (66.7%) of the teachers indicated that teaching
methods were the means through which they delivered the curriculum content.
To establish the teaching methods used in NFPSs in Westlands sub-county,
the researcher sought the response of teachers and pupils. Table 4.8 illustrates
teachers’ response on the teaching methods they used to implement curriculum
in the order in which they used them
Table 4.10
Teachers response on teaching methods used in NFPSs
Teaching
method
method
1st choice
F %
2nd
choice
3rd
choice
4th
choice
5th
choice
F
%
F %
%%%%PPerce%%
Percenta Percent
Percentage
F %
%Percentage
F % F % F %
Lecture 3 25 1 8.3 -
- 1 8.3 7 58.3
Discussion 8 66.7 2 16.7 2 16.7 - - - -
Role play 6 50 - - 5 41.7 - - 1 8.3
Demonstration 4 33.3 4 33.3 2 16.7 2 16.7 - -
Others - - - - - - 2 16.7 2 16.7

55
The data showed that majority (66.7%) of the teachers used discussion method
of teaching in NFPSs as a first choice. There is very little use (33.3%) of other
teaching methods apart from the four that had been suggested by the
researcher in the questionnaire. The data implies that teachers in NFPSs in
Westlands sub-county did not properly balance and vary the use of various
teaching methods while implementing curriculum. This negatively affected
curriculum implementation in NFPSs in Westlands sub-county.
When asked why they used the various teaching methods the teachers gave
varied reasons. The most frequently indicated response in each of the teaching
methods by the teachers is represented in table 4.9.
Table 4.11
Teachers’ reasons for using the teaching methods
Teaching
method
Reason for using the
method
Frequency Percentage
Lecture Quick syllabus coverage 10 83.3
Discussion Strengthens team work 6 50
Role play Active participation by
learners
7 58.3
Demonstration Learning by observation 9 75
Others Breaks monotony 4 33.3
Although majority (58.3%) of the teachers used lecture method only as a fifth
choice as illustrated 4.10, majority (83.3%) of the teachers who used the
method regardless of whether it was a first, second, third, fourth or fifth choice

56
were more interested in quick coverage of the syllabus without putting in to
consideration whether effective teaching and learning had taken place. This
jeopardized curriculum implementation process in NFPSs in Westlands sub-
county.
Pupils were requested to indicate the teaching methods that teachers frequently
used in their classes. Table 4.12 illustrates pupils’ responses.
Table 4.12
Pupils’ response on teaching methods frequently used by teachers in NFPSs
Method Frequency Percentage
Lecture 2 4.3
Discussion 18 39.1
Role play 8 17.4
Demonstration 18 39.1
Table 4.12 shows that discussion and demonstration teaching methods were
highly emphasized in NFPSs in Westlands sub-county compared to other
methods. Neglect of other teaching methods like lecture disadvantaged
auditory learners who understand better by listening (Chittom, 2012). This
data implied that curriculum implementation in the schools may not have been
effectively implemented.
4.9 Influence of physical facilities on curriculum implementation in
NFPSs
Cash (1993) argues that physical facilities including classrooms and furniture
have a significant relationship with students’ achievement. Pupils in

57
undesirable physical environment will not concentrate during the teaching/
learning process which leads to poor curriculum implementation. This
scenario prompted the researcher to seek to establish the role of physical
facilities on curriculum implementation in NFPSs in Westlands sub-county.
The facilities included classrooms, desks, chairs and sports fields. To obtain
the required data, administrators, teachers and pupils were requested to
respond to relevant questions. The researcher also prepared an observation
checklist which was used to establish availability and condition of various
physical facilities in the NFPSs. When asked whether they felt there was a
positive relationship between physical facilities and curriculum
implementation in NFPSs, majority (66.7%) of the administrators indicated
there was positive relationship between the two. Pupils were asked to indicate
whether physical activities were important in their academic achievement and
many (54.2%) indicated that physical activities were essential to their
academic achievement.
When asked the number of classrooms in the schools and the school
population in the NFPSs, the administrators gave the figures shown in table
4.9. The administrators’ response was used to calculate the average number of
pupils per class which are represented in the same table.

58
Table 4.13
Average number of pupils per classroom in NFPSs
No. of classrooms per
NFPS
Population per NFPS Average number of pupils
per classroom
12 231 20
10 361 37
11 65 6
11 192 18
13 234 18
According to table 4.13, only five schools were analyzed because one of the
schools did not provide information on the populations of pupils to enable the
researcher calculate the average number of pupils per class. Average number
of pupils in classrooms was as high as thirty seven. According to the
observation made by the researcher majority of the classrooms in NFPSs were
quite small and the pupils were overcrowded. This jeopardizes curriculum
implementation because the small classes give no room for effective private
study or practice of teaching methods like group discussion, role-play and
demonstration (UNESCO, 1990).
Pupils require comfortable and spacious sitting and working facilities to
enable them efficiently and effectively engage in the learning process which
will then lead to high academic achievement (UNESCO, 1990). The
researcher observed that some desks were designed to comfortably
accommodate one pupil while the others were designed to comfortably
accommodate two pupils. The researcher also observed that some of the desks
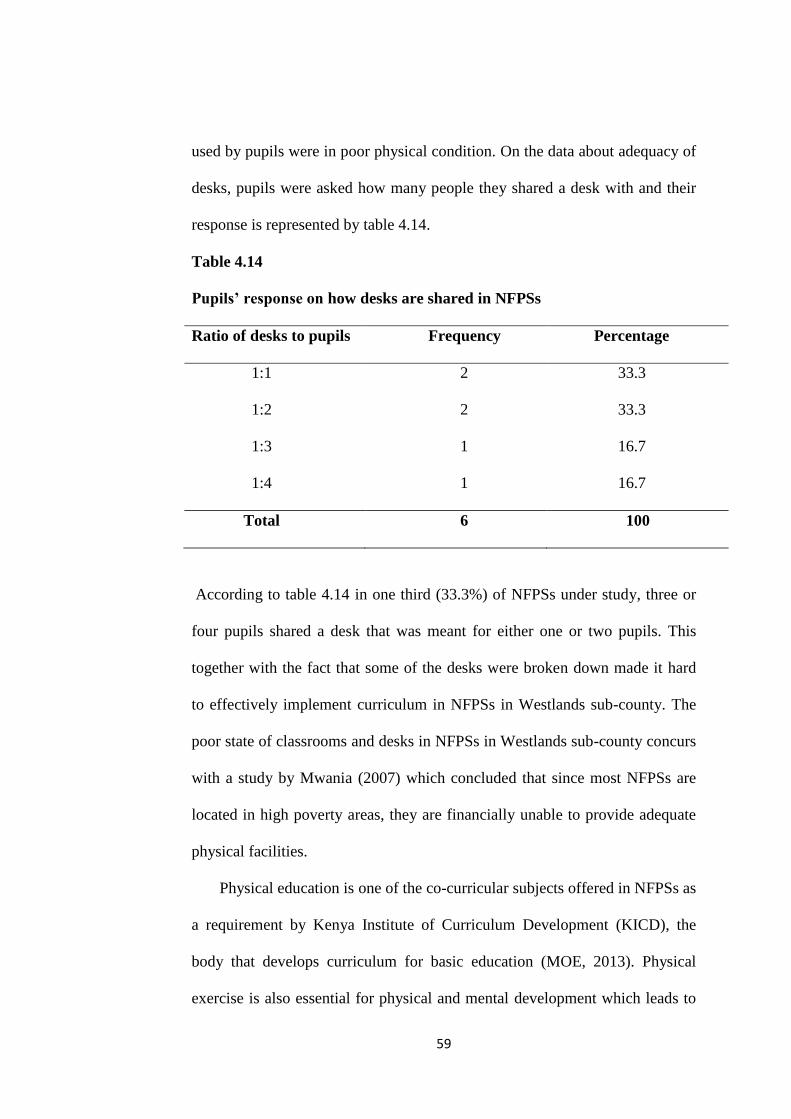
59
used by pupils were in poor physical condition. On the data about adequacy of
desks, pupils were asked how many people they shared a desk with and their
response is represented by table 4.14.
Table 4.14
Pupils’ response on how desks are shared in NFPSs
Ratio of desks to pupils Frequency Percentage
1:1 2 33.3
1:2 2 33.3
1:3 1 16.7
1:4 1 16.7
Total 6 100
According to table 4.14 in one third (33.3%) of NFPSs under study, three or
four pupils shared a desk that was meant for either one or two pupils. This
together with the fact that some of the desks were broken down made it hard
to effectively implement curriculum in NFPSs in Westlands sub-county. The
poor state of classrooms and desks in NFPSs in Westlands sub-county concurs
with a study by Mwania (2007) which concluded that since most NFPSs are
located in high poverty areas, they are financially unable to provide adequate
physical facilities.
Physical education is one of the co-curricular subjects offered in NFPSs as
a requirement by Kenya Institute of Curriculum Development (KICD), the
body that develops curriculum for basic education (MOE, 2013). Physical
exercise is also essential for physical and mental development which leads to

60
better understanding of academic work. Physical education can only take place
where sports field is available and in good condition. It is in this light that the
researcher sought to establish the availability and condition of sports fields in
NFPSs in Westlands sub-county. The condition of the sports fields available
was observed to be poor as there were no marked pitches and there was lack of
cover vegetation. This implied that curriculum for physical education was not
effectively implemented. On availability or unavailability of sports fields in
NFPSs in Westlands sub-county, figure 4.12 represents the researcher’s
observation.
Figure 4.12
Researcher’s observation on availability or unavailability of sports fields
in NFPSs
Figure 4.12 shows that majority (66.7%) of NFPSs in Westlands sub-county
do not have sports fields. This implies that curriculum in these schools is not
wholly implemented as recommended by the MOE. Curriculum
implementation in academic subjects is also negatively affected as pupils lack
33.30%
66.70%
Sports field available
Sports field unavailable
61
space to do physical exercise which relaxes their mind and enable them to
concentrate in class work.
4.10 Summary of the findings
This chapter focuses on the research findings of the school factors influencing
curriculum implementation in registered NFPSs in Westlands sub-county.
Findings of the first research objective revealed that human resource in NFPSs
was inadequate in terms of qualification, experience and in-service training.
For example majority (75%) of the teachers had only a minimum qualification
while 16.7 percent were untrained hence hindering effective implementation
of the curriculum. Majority (50.1%) of the teachers had inadequate teaching
experience which negatively affected curriculum implementation.
Findings of research objective two on instructional materials and their
influence on curriculum implementation revealed that the ratio of textbook to
pupils in majority (83.3%) of the NFPSs was far below the government
recommendation of 1:1. Majority (66.7%) of the NFPSs did not provide
learners with stationeries. Class readers which are essential in curriculum
implementation were not offered in majority (66.7%) of the NFPSs. Findings
further revealed that some essential teaching aids like atlases were not
available in Majority (83.3%) of the schools. Lack of adequate instructional
materials in NFPSs was likely to negatively affect curriculum implementation.
Analysis of data of the influence of pupil characteristics on curriculum
implementation in NFPSs indicated that many (50%) of the schools have
special needs pupils but only a few (16.7%) of the schools have special needs
education teachers. The findings also revealed that many (45.5%) in class 7

62
and (36.4%) in class 8 pupils are below the MOE recommended ages. Failure
to consider pupil characteristics in NFPSs negatively affects curriculum
implementation in the schools.
Findings of objective number four on influence of teaching methods on
curriculum implementation in NFPSs revealed that teachers did not
appropriately vary teaching methods. This meant that different learning styles
of pupils were not fully met which led to poor curriculum implementation.
The findings also revealed that majority (83.3%) of teachers’ main reason for
using certain teaching methods was to complete the syllabus quickly which
did not necessarily translate to proper curriculum implementation.
Data analysis of objective five on influence of physical facilities on
curriculum implementation in NFPSs indicated that physical facilities were
not adequate in the schools. For example in many (33.3%) of the NFPSs, 3 or
4 pupils shared a desk that was meant to for 1 or 2 pupils. This made pupils
uncomfortable and unable to concentrate during curriculum implementation
process. The findings also revealed that classrooms in non-formal were small
in comparison with the large population leading to overcrowding. In majority
(66.7%) of the schools did not have sports fields therefore hindering them
from implementing the full national curriculum.
63
CHAPTER FIVE
SUMMARY, CONCLUSIONS AND RECOMMENDATIONS
5.1 Introduction
This is the final chapter of the research project. The chapter focuses on
summary of the research findings, conclusion and recommendations. In this
chapter, the researcher also gives suggestions for further research in related
fields.
5.2 Summary of the study
The purpose of this study was to investigate school factors influencing
curriculum implementation in non-formal primary schools in Westlands sub-
county. The study was guided by five research objectives. The research
objectives sought to: examine the extent to which adequacy of human resource
influence implementation of the curriculum in non-formal primary schools in
Westlands sub-county; establish how instructional materials influence
curriculum implementation in non-formal primary schools in Westlands sub-
county; determine how pupils’ characteristics influence implementation of
curriculum in non-formal primary schools in Westlands sub-county; examine
how teaching methods influence implementation of curriculum in non-formal
primary schools in Westlands sub-county; establish the extent to which
physical facilities influence curriculum implementation in non-formal primary
schools in Westlands sub-county.
The study adopted descriptive survey design employing both qualitative
and quantative approaches in investigating the school factors that influence
curriculum implementation in registered NFPSs in Westlands sub-county. The
64
sample comprised of 6 administrators, 12 teachers and 24 pupils. Data were
collected using questionnaires and observation checklist. Data was then
analyzed by use of qualitative and quantative techniques.
According to the findings of the study, human resource in NFPSs in
Westlands sub-county was inadequate to effectively implement the
curriculum. The instructional materials were also found to be insufficient to
help carry out proper curriculum implementation. According to the findings of
the study, pupil characteristics were not fully considered in NFPSs in
Westlands sub-county, a situation which jeopardized curriculum
implementation in the schools. Teaching methods used in NFPSs in Westlands
sub-county were not well varied in order to cater for the learning needs of all
the pupils in the classrooms. According to the research findings, physical
facilities are either unavailable or inadequate to cater for effective curriculum
implementation in NFPSs in Westlands sub-county.
5.3 Conclusions
The researcher concluded that the extent of adequacy of human resource
affected curriculum implementation in NFPSs. The extent of adequacy of
human resource in NFPSs in Westlands sub-county is low as indicated by their
minimal qualification and short teaching experience. The researcher concluded
that lack of adequate instructional materials affected curriculum
implementation in NFPSs. Instructional materials like textbooks, teaching aids
and class readers inadequate which was likely to affect curriculum
implementation in NFPSs in Westlands sub-county. The researcher further
concluded that failure to fully consider pupils characteristics affected

65
curriculum implementation in NFPSs. Inadequate special education personnel
and failure to put pupils’ age in to perspective may negatively affect
curriculum implementation process. The researcher concluded that failure to
vary and balance the use of teaching methods affected curriculum
implementation in NFPSs. Overemphasis on a few teaching methods at the
expense of other methods was likely to affect curriculum implementation. The
researcher also concluded that inadequate physical facilities affected
curriculum implementation in NFPSs. Poor condition and unavailability of
physical facilities such as classrooms, desks and sports fields would easily
affect curriculum implementation
5.4 Recommendations
Based on the findings, the following were the recommendations for the study,
i.)The MOE should provide more opportunities for continuous professional
development and institute policies that ensure all practicing teachers
participate in the in-service courses. This is because many teachers in NFPSs
have never attended an in-service course and this negatively affects curriculum
implementation in these schools as teachers may use outdated instructional
materials and teaching methods. The MOE can do this through provision of
free or subsidized in-service courses over the school holidays to give many
teachers in these institutions a chance to be retrained.
ii.) The GOK should provide adequate and regular capitation grants to the
NFPSs so that the schools are able to meet the recommended ratio of 1:1 on
textbooks. The funds will also enable the schools to provide stationeries,
enough teaching and class readers to the pupils. This should be done by

66
increasing the existing capitation grants per pupil and releasing in good time
so that it can be efficiently planned for.
iii.) The NGOs who are the main sponsors of NFPSs should cooperate with the
GOK in provision of teachers, instructional materials and physical facilities
that are some of the core factors in curriculum implementation yet they are
lacking in many of the schools. Cooperation can be implemented through
formation of committees and commissions involving members from the MOE
and NGOs, which should deliberate on issues affecting curriculum
implementation in NFPSs.
iv.) The GOK should provide land for public utility in all informal settlements
where land for sports fields should be set aside. This will help learners to be
able to engage in physical education, which is part of primary school
curriculum. The government should do this by ensuring that public utility land
is not encroached through informal settlement.
v.) The MOE should train and deploy more special education teachers to
NFPSs. This is because the schools have shortage of these teachers yet there
are children who require their essential services. This should be done through
provision of free or subsidized special education training to primary school
teachers so that they can effectively handle special needs of the pupils in
NFPSs.
5.5 Suggestions for further research
i.) The following were suggestions for further research,
67
This research focused on NFPSs that are registered by the MOE. Further
research should be done on unregistered NFPSs to establish how school
factors influence curriculum implementation in the schools.
ii.) Further research should be done on other factors besides school factors that
influence curriculum implementation. These factors include community
factors and government policy.
iii.) There is need to do research in other levels of NFE like non-formal
secondary schools and adult education institutions in order to establish how
school factors influence curriculum implementation in the institutions.
iv.) There is need to do research on NFPSs in others districts to establish
whether the challenges revealed by the study of the said schools in Westlands
District, are widespread or unique to the district.
v.) Research needs to be conducted on formal primary schools to establish
whether the challenges facing NFPSs are found in the formal institutions.

68
REFERENCES
Aguilando, H. B. et al, (2012). The Role of Stakeholders in Curriculum
Implementation.Fromhttp://www.slideshare.net/PHILLMURP/implem
enting-the-curriculum- the-roles-of-stakeholders-hazel-and-jeric
Babbie, E. (1990). Survey Research Methods, Belmont, CA: Wordsworth.
Baker, T. L. (1994) Doing Social Research (2nd
Ed.). New York: McGraw-Hill
Inc.
Bhalalusesa, E. (2003). Education for All: Is Tanzania on the Track? Norrag
www.norrag.org/...education.../education
Biesta, G.J. (2009). Good Education in an Age of Measurement: Ethics-
politics- democracy. Boulder, Co: Paradigm Publishers.
Cash, C. S. (1993). Building Condition and Student Achievement and
Behavior. Unpublished doctoral dissertation, Virginia Polytechnic
Institute and State University, Blacksburg, VA.
Chhem, R.K (2001). Curriculum Design and Implementation: The Basics.
/’=CDTL Publications. Singapore.
Chittom, L. (2012). Integrating Multicultural Education in the Classroom.
Fromhttp://www.brighthubeducation.comteaching-methonds-
tips/79979-importance-of-multicultural-education-and-teaching-ideas
Coombs, P., Prosser, R., Ahmed, M. (1973). New Paths to Learning for Rural
Children and Youth. ICED, New York
Dahir, M. A. & Faize, F. A. (2011), Misallocation of Student Teacher Ratio,
Class Size and Per Student Expenditure Leads to the Wastage of
Resources and Lower Academic Achievement: An issue of Resource

69
Management. International Research Journal of France and
Economics, Euro-Journal Publishing, Inc.
Dierckx, D. (2013). The Importance of Social Demographics in Online
Surveys. CheckMarket.
Ekundayo, J.D. (2001). Successful Experiences in Non-formal Education and
Alternative Approaches to Basic Education in Africa. Paper Presented
at 2001 Biennial Conference of ADEA. Arusha united Republic of
Tanzania.
Eshiwani, G. S. (1983). Factors Affecting Performance. Nairobi. Bureau of
Educational Research.
Felder, R. M. & Silverman, L. K. (1988) Learning and Teaching Styles in
Engineering Education. Engr. Education, 78(7), 675-681(1988).
Firestone, W. A. et al (1988). Planned organizational change. In N.J Boyan
(Ed.), Handbook for research on educational administration. New
York. Biesta (2009)
Fordham, P.E. (1993). ‘Informal, Non-formal and Formal Education
Programs’ in YMCA George Williams College ICE301 lifelong unit 2,
London: YMCA George William College.
Fullan, M. & Pomfret, A. (1977). Research on Curriculum Implementation.
Review of Educational Research, 47 (1).
GOK, (2007). Kenya Vision 2030: A Globally Competitive and Prosperous
Kenya. Government Press. Nairobi. Kenya.
GOK, (2013). The Basic Education Act, 2013. No.14 of 2013. Government
Press. Kenya.

70
Hanushek, E.A. (2003). The Failure of Input-Based Schooling Policies.
Economic Journal, 133(485), 64-98
Hoppers, W. (2006). Non-Formal Education and Basic Education Reform: a
Conceptual Review. IIEP Print Shop, UNESCO.
K.I.E, (2003). Accelerated Learning: New Opportunities for Children at Risk
Seminar. Addis Ababa. Ethiopia.
Kraaijenbrink, J. et al. (2009). The Resource Based View: A review and
Assessment of its Critiques. University of Twente, Nikos. Netherlands.
Lall, M. (2005). The Challenges for India Education System. Chathan House.
Loucks, S. & Lieberman, A. (1983). ‘Curriculum Implementation,’ in
Fundamental Curriculum Decisions 1983 Yearbook, Alexandria
Virginia.
Matsuura, K. (2001). Interactive Thematic Session on Education for all and
Sustainable Development in Less Developed Countries. Brussels.
Mcgowen, R. S. (2007). The Impact of School Facilities on Students’
Achievement, Attendance, Behavior, Completion Rate and Teacher
Turnover Rate in Selected Texas High School. PHD Thesis. Texas
A&M University.
Miles, M.B. and Huberman, A.M. (1994). Qualitative Data Analysis (2nd
Ed).
SAGE, Thousand Oaks. CA: U.S.A.
MOE, (2009). Policy for Alternative Provision of Basic Education and
Training. GOK.
MOEST. (2005). Kenya Education Sector Support. Government Printer.

71
MOEVT. (2012). Adult and Non-Formal Education Development Plan
2012/13-2016/17 Education Sector Committee. Tanzania.
Mugenda, O. M. and Mugenda, A. G. (2003). Research Methods: Quantitative
and Quantative Approaches. African Centre for Technology Studies.
Nairobi
Mushi, A. K. (2000). Moving Beyond the Classroom: Expanding Learning
Opportunities for Marginalized populations in Tanzania. FAWE.
Nairobi.
Museti, P. (2007). Teaching/Learning Strategies in Integrated English Course
and their Effect on Performance in Manga Division, Nyamira District.
Unpublished M.ED Thesis, Kenyatta University.
Mutai, K. M. (2002). How to Write Quality Research Proposal: A Complete
and Simplified Recipe, New Delhi: The Ailey Publishers
Mutoro, J.M. (2001). Factors Affecting Implementation of Curriculum for
Learning Impaired. A Case study of Webuye Schools for the Deaf,
Bungoma District. Unpublished M.ED Thesis. UON.
NCTE. (1993). Framework for Quality Teacher Education. India.
Oso, W. Y. & Onen, D. (2009) Writing Research Proposal and Report.
Nairobi. Sitima.
O’Donoghue, T. and Punch, K. Qualitative Educational Research in Action:
Doing and Reflecting, London Routledge Falmer
Penuel, W.et al (2007). What Makes Professional Development Effective?
Strategies that Foster Curriculum Implementation, “American
Educational Research Journal, 44(4), 921-58

72
Rahman, M.S. et al. (2010). Literacy Programs and Non-Formal Education of
Bangladesh and India. Educational Research and Review Vol.5 (10)
PP. 569-583.
Rutere, M. (Ed), (2007). Falling Short: The Right to Free Primary Education.
A Discussion Paper on the Status of Education in the Slums of Nairobi.
Daraja Civic Initiative Forum.
SADC. (2010). Curriculum Theory, Design and Assessment. The
Commonwealth of Learning. West Broadway. Vancouver, Canada.
Salamuddin, N. Harun, M. T & Abdullah, N. A (2011). Teachers Competency
in School Extra-Curricular Management World Applied Sciences
Journal 15 (Innovation and Pedagogy for Lifelong Learning): 49-55,
2011
Schagen, S. (2011). Implementation of the New Zealand Curriculum Synthesis
of Research and Evaluation. Education Counts Publications.
Sharma, S. (2008). Qualitative Methods in Statistics Education Research:
Methodological Problems and Solutions. University of Waikato, New
Zealand.
Sharp, C., George, N. Sargent, C., O’Donnell, S. & Heron, M. (2009). The
Influence of Relative Age on Learner Attainment and Development.
Nfer.
Sekaran, U. (2003) Research Methods for Business: A Skill Building
Approach.4th
Ed. N.Y: John & Willey
Simon, M. K. (2011). Assumptions, Limitations and Delimitations.
Dissertation Research. Unpublished.
73
Sifuna, D. N. et al (1994). An Introductory History of Education, Revised
edition: Sifuna D.N et al; 1994; University of Nairobi Press. Nairobi,
Kenya.
Tanner, D. et al, (1995). Curriculum development: Theory into Practice (3rd
Ed.).Englewood Cliffs, N.J: Merill
Tilstone, C. (1998). ‘The value of observation’. In Tilstone, C. (ed.),
Observing Teaching and Learning: Principles and Practice, London
Fulton Publishers.
Udo, B. (Ed). (1989). The Challenge of Quality in Primary Education in
Africa (From Reforms to Census). Education Science and
Documentation Centre. Bonn. Germany.
UNESCO. (2005). Challenges of Implementing Free Primary Education in
Kenya: Assessment Report. Nairobi. UNESCO.
UNESCO. (2008). Challenges of Implementing Free Day Secondary
Education in Kenya: Experiences from Districts. Nairobi. UNESCO.
University of Zimbabwe (1995). Curriculum Implementation, Change and
Innovation. (Module EA3AD). Center for Distance Education,
University of Zimbabwe. Harare.
Uwezo Kenya. (2011) Are our Children Learning? Annual Learning
Assessment Report. Uweza.com
Yadar, K. (2001). Teaching of Life Science. New Delhi: Anmol publication
Ltd, India.
74
Yara, P. O. and Otieno, K. O. (2010). Teaching/ Learning Resources and
Academic Performance in Mathematics in Secondary Schools in
Bondo District of Kenya. Canadian Center of Science and Education
Zeiger, S. (2014). Role of Teachers in Curriculum Process. Demand Media.
Chron.co

75
Appendix i: Letter of introduction
P.O Box 62532-00600,
Nairobi.
Mobile: 0725045690
The Head teacher,
_______Primary School,
P.o Box __________, Nairobi.
Dear sir/madam,
Ref. Permission to conduct research in your school
I am student at the University of Nairobi doing a research on School
Factors influencing curriculum implementation in Non-formal primary
Schools in Westland District, Nairobi County. The research will mainly
focus on; human resource, instructional material, pupil characteristics,
teaching methods and physical facilities. The target population of the study is
the Head teachers, teachers and class 7 and 8 pupils from your school. I wish
to request your permission to conduct the research in your institution in the
month of March, 2014. I will highly appreciate if you offer me an opportunity
to research in your institution.
Thank you.
Yours faithfully,
Joyce Iraki

76
Appendix ii: Administrators’ Questionnaire
I am carrying out a study on school factors influencing curriculum
implementation in non-formal primary schools in Westlands District. Your
school has been chosen as one of the centers where the study will be carried
out. You are welcome to give your contributions that will go a long way in
improving the status of non-formal primary schools in Kenya. Thank you.
Section 1: General information
1. Name of the Non-formal Primary school___________________________
2. Gender____________________________
3.Professional qualification; P2__P1__S1__Diploma__B.Ed__Med__ (Tick
the appropriate)
4.Terms of employment: permanent___ Temporary___ (Tick the appropriate)
5. Working experience_______________ (Years/Months)
Section 2 School based factors influencing curriculum implementation in
the school
1. Do you feel that being an administrator you are helping in curriculum
implementation in your school? Yes__, No___ (Tick the appropriate)
2. Do you feel your qualifications, working experience and in-service training
in curriculum implementation? Yes___, No___(tick the appropriate).
3. How many teachers are in school? _______________Number of trained
teachers______
4. How many pupils are there in the school? ____ Boys ___Girls___

77
5. Do you feel that special education teachers are important in NFPSs?
Yes___, No___ (Tick the appropriate) If yes,
why_______________________________
6. Are there special needs pupils in the school? Yes ___ No ___ How
many____ (Tick the appropriate)
7. Are there special needs education teachers in the school? Yes__ No__ how
many____ (Tick the appropriate)
8. Why is working experience important in curriculum implementation in the
school?
_______________________________________________________________
_____________________________________________________________
9. How often do teachers attend in-service courses? Every 6 months__every 1
year__ every 2 years___ other (specify) ______________ (Tick the
appropriate)
10. What is the ratio of teacher to pupils in the school? ________________
11. What is general academic performance of pupils in your school? Above
average____, Average___, below average___ (Tick the appropriate)
12. What is the pupil dropout rate in your school? Very high__, High___,
Low___, Very low___ (Tick the appropriate)
13. Approximately what percentage of your pupils has proceeded to secondary
schools over the last 3 years? _____________________
14. What is the ratio of textbook to pupils in all subjects the curriculum?
____________________________
78
15. Are pupils provided with stationary in school? Yes__ No___ (Tick the
appropriate)
16. How many classrooms does the school have?
________________________
17. What materials are the classrooms walls build of? Wood___Iron sheets __
stones___ Other (Specify) ____ (Tick the appropriate)
18. Do you feel there is a positive relationship between adequacy of physical
facilities and curriculum implementation in NFPSs? Yes___, No___ (Tick the
appropriate)
19. Is there a sports field in the school? Yes___No___ (Tick the appropriate)
20. Please share other issues concerning curriculum implementation in the
school you wish to
______________________________________________________

79
Appendix iii: Teachers' Questionnaire
I am carrying out a study on school factors influencing curriculum
implementation in non-formal primary schools in Westlands District. Your
school has been chosen as one of the schools where the study will be carried
out. You are welcome to give your contributions that will go a long way in
improving the status of non-formal primary schools in Kenya. Thank you.
Section 1: General information
1. Name of the Non-formal school _____________________________
2. Gender__________________________
3. Classes taught: STD 1…STD 2…STD 3…STD 4…STD 5…STD 6…STD
7…STD 8… (Tick the appropriate classes; you can tick more than one)
4. Professional qualification; P2__P1__S1__Diploma__B.Ed__M. Ed__ (Tick
the appropriate)
5.Terms of employment: permanent___ Temporary___ (Tick the appropriate)
6. Working experience_______________ (Years/Months)
7. Teaching subjects_______________________________________
_______________________________________________________________
__
Section 2: School based factors influencing curriculum implementation in
the school
1. Do you feel that as a teacher you are helping in curriculum implementation
in your school? Yes__, No___ (Tick the appropriate)
2. Do you feel your qualifications, working experience and in-service training
in curriculum implementation? Yes___, No___ (tick the appropriate).

80
3. Why is working experience important in curriculum implementation in
school?
_______________________________________________________________
_____________________________________________________________
4. Do you feel that teaching methods have positive effects on curriculum
implementation? Yes___ No___ (tick the appropriate) if yes, gives
reasons_________________________________________________________
_______________________________________________________________
____
5. Have you attended any in-service course? Yes__ No__ If yes when? 0-6
months ago__1 year ago__2years ago___ 3 years and above years ago____
(Tick the appropriate)
6. What is the general academic performance of pupils in your school? Above
average____, average___, below average
7. Do you prepare professional records (schemes of work, records of work,
lesson plans)? Yes___, No___ (Tick the appropriate)
8. To what extent have you covered the syllabus in your subject area in line
with the schemes of work? Ahead of schedule___, within schedule___, behind
schedule___ (Tick the appropriate)
9. Rate the following teaching methods with No.1 as the most frequently used
and No. 5 as the least used.

81
10. Why are textbooks important in curriculum implementation in NFPSs?
11. What teaching aids are available in your subject area?
_______________________________________________________________
_______________________________________________________________
____
12. Why do you require teaching aids in the classrooms while teaching?
_______________________________________________________________
_______________________________________________________________
____
13. What is the general academic ability of the pupils in the school? Above
average ___Average ___Below average___, (Tick the appropriate)
14. How do you learn of changes and innovations in the curriculum?
- Through administration_____________, - Through MOE_________,
- Through other teachers _________ (Tick the appropriate)
15. What methods do you use to implement changes and innovation in the
curriculum?
Teaching Method Frequency Reason for using the
method
Lecture
Discussion
Role play
Demonstration
Others(Specify)

82
16. What is the average number of pupils in your classes? _________
Boys___ Girls___
17. How many other teachers teach your subjects apart from you?
_______________________________________________________________
_______________________________________________________________
____
18. What is the ratio of textbook to pupils in your subject area?
_______________________________________________________________
_______________________________________________________________
___
19. What materials are the classrooms walls build of? Wood __iron sheets __
stones__ others (specify) ___________________________________ (Tick
the appropriate)
20. Please share with us any issues on schooling/curriculum that you feel are
unique to your school_____________________________________________
_______________________________________________________________
_______________________________________________________________
____

83
Appendix iv: Pupils’ Questionnaire
I am carrying out a study on school factors influencing curriculum
implementation in non-formal primary schools in Westlands District. Your
school has been chosen as one of the schools where the study will be carried
out. You are welcome to give your contributions that will go a long way in
improving the status of non-formal primary schools in Kenya. Thank you.
Section 1: General questions
1. Name of your school________________
2. What is your gender? Boy____ Girl___ (Tick the appropriate)
3. What is your age? ________
4. Which class are you in______________
Section 2: School based factors influencing curriculum implementation in
the school
1. Do you share a textbook with other pupils in all subjects? Yes ___No___ If
yes how many____ (Tick the appropriate)
2. What teaching methods do teachers frequently use?
Lecture___Discussion___Role-play___Demonstration___ (Tick the
appropriate)
3. Are there wall charts and maps in your class? Yes___ No___ (Tick the
appropriate) If yes, how many wall charts____ how many maps___
4. How many pupils sit on one desk in the classroom? _____
5. Are exercise books and pens given by the school? Yes___ No___ (Tick the
appropriate)

84
6. Does provision of stationeries by the school help you to do your class work?
Yes____, No____ (Tick the appropriate)
7. Are you given storybooks in school? Yes___ No___ (Tick the appropriate)
8. Do you feel that physical activities positively contribute to your academic
achievement? Yes__, No___ (Tick the appropriate)
9. What else do you wish to share?
_______________________________________________________________
_______________________________________________________________
__

85
Appendix v: Observation Checklist
Name of school_________________________________________
Instructional/physical
Resources
Observed Not Seen Comments
Text books
Teaching/learning
aids
Sports field
Classrooms
Desks
Working space in
classrooms
Others

86
Appendix vi: Research permit

87

88

89
Appendix vii: Authorization letter