SCHEMATIC PITCH CODING: A NEW, MORE …jeffcohn/biblio/Katz et al 2000.pdf · SCHEMATIC PITCH...
13
SCHEMATIC PITCH CODING: A NEW, MORE EFFICIENT METHOD FOR MEASUREMENT OF INFANT-DIRECTED SPEECH Gary S. Katz California State University–Northridge Jeffrey F. Cohn University of Pittsburgh Christopher A. Moore University of Washington Infant-directed speech is an important but difficult-to-measure aspect of caregiver-infant interaction. Specialized training in speech science is required and processing is computationally intensive and time consuming. We developed a computer-assisted method of measuring infant-directed speech that requires little specialized training, has high concurrent validity with alternative approaches, and has improved efficiency in estimating frequency and temporal parameters. In Schematic Pitch Coding, an operator uses a computer interface to play digitized speech samples, view the corresponding narrow-band spectro- grams, and mark points of inflection in fundamental frequency (f 0 ) using a computer mouse. Custom software generates graphic representations of f 0 contours and quantitative estimates of the mean and standard deviation of f 0 , utterance duration, and turn-taking pauses. Our current system, which is not optimized for speed, can process a 30-second sample of infant-directed speech in approximately a half-hour, which makes feasible its application in large-scale studies of infant-directed speech. prosody infant-directed speech quantitative measurement spectrogram schematic pitch coding fundamental frequency pitch vocal acoustics ● Gary S. Katz, California State University–Northridge, Department of Psychology, 18111 Nordhoff Street, Northridge, CA 91330; Tel: (818) 677-2827; e-mail: [email protected]. INFANT BEHAVIOR & DEVELOPMENT 22 (3), 1999, 283–295 ISSN 0163-6383 Copyright © 2000 Elsevier Science Inc. All rights of reproduction in any form reserved.
Transcript of SCHEMATIC PITCH CODING: A NEW, MORE …jeffcohn/biblio/Katz et al 2000.pdf · SCHEMATIC PITCH...

SCHEMATIC PITCH CODING:A NEW, MORE EFFICIENT METHODFOR MEASUREMENT OFINFANT-DIRECTED SPEECH
Gary S. KatzCalifornia State University–Northridge
Jeffrey F. CohnUniversity of Pittsburgh
Christopher A. MooreUniversity of Washington
Infant-directed speech is an important but difficult-to-measure aspect of caregiver-infant interaction.Specialized training in speech science is required and processing is computationally intensive and timeconsuming. We developed a computer-assisted method of measuring infant-directed speech that requireslittle specialized training, has high concurrent validity with alternative approaches, and has improvedefficiency in estimating frequency and temporal parameters. In Schematic Pitch Coding, an operator usesa computer interface to play digitized speech samples, view the corresponding narrow-band spectro-grams, and mark points of inflection in fundamental frequency (f0) using a computer mouse. Customsoftware generates graphic representations of f0 contours and quantitative estimates of the mean andstandard deviation of f0, utterance duration, and turn-taking pauses. Our current system, which is notoptimized for speed, can process a 30-second sample of infant-directed speech in approximately ahalf-hour, which makes feasible its application in large-scale studies of infant-directed speech.
prosody infant-directed speech quantitative measurement spectrogram schematic pitch codingfundamental frequency pitch vocal acoustics
● Gary S. Katz, California State University–Northridge, Department of Psychology, 18111 Nordhoff Street,Northridge, CA 91330; Tel: (818) 677-2827; e-mail: [email protected].
INFANT BEHAVIOR & DEVELOPMENT 22 (3), 1999, 283–295 ISSN 0163-6383Copyright © 2000 Elsevier Science Inc. All rights of reproduction in any form reserved.

The sound of infant-directed speech isunique. Relative to adult-directed speech, thevariability and complexity of infant-directedspeech provide infants and their caregiverswith a highly salient communications mediumwith which to convey pragmatic and affectiveinformation (Ferguson, 1964; Fernald & Si-mon, 1984; Stern, Spieker, Barnett, & Mac-Kain, 1983; Fernald, 1989; Katz, Cohn, &Moore, 1996). Newborns prefer infant-di-rected speech to adult-directed speech (Cooper& Aslin, 1990; Moon, Cooper, & Fifer, 1993;although cf. Cooper, Abraham, Berman, &Staska, 1997), with this preference appearingto be consistent throughout the first year of life(Fernald, 1984; Fernald, 1985; Fernald &Kuhl, 1987). Acoustically, researchers haveexamined the pitch, intensity, rhythmicity, andformant structure of infant-directed speech forspecific components that may mediate infantpreferences for this mode of interaction (Fer-nald & Kuhl, 1987; Fernald, 1989; Katz et al.,1996; Kuhl et al., 1997). Of these four fea-tures, pitch, as measured by vocal fundamentalfrequency (f0), appears to be especially salient(Fernald, 1984; Fernald & Kuhl, 1987; Katz etal., 1996).
Fernald (1984; Fernald & Kuhl, 1987) andothers (Katz et al., 1996; Stern et al., 1983)have speculated that changes in f0 over time(f0 contours) are the primary medium for com-munication between infants and their care-givers. Empirical findings support theirspeculations. Infants will reliably orient tospeech that varies in f0 (Fernald & Kuhl,1987). Rapidly rising f0 contours orient in-fant attention (Fernald, 1989; Katz et al.,1996). Gently falling f0 contours soothe dis-tressed infants (Fernald, 1989; Katz, 1998;Papousek, Papousek, & Symmes, 1991).Given the importance of f0 contours in mod-erating infant behavior, reliable, valid, andefficient methods of measuring f0 are essen-tial.
Two approaches have been used to describefeatures of f0 contours. One approach is visualclassification of f0 shape. Fernald (1985), for
instance, identified four regularly occurringshapes, including “rising,” “falling,” “bell-shaped,” and “complex.” A second approachis the measurement of quantitative f0 features.Typically, this measurement requires digitiza-tion of speech samples, preliminary extractionof f0 values over the length of the speechsample, error-correction of the extracted f0
values, and smoothing of the resulting error-corrected values (Moore, Cohn, & Katz,1994). Summary statistics, such as mean f0 orf0 variability, are then calculated from theresultant f0 contours (Fernald & Simon, 1984;Stern et al., 1983).
There are strengths and limitations to thesetwo approaches to describing f0 contours. Vi-sual inspection provides rapid identification off0 contour shape but no quantitative measure-ments. Quantitative features require accuratepitch extractions, which are difficult to obtain,labor intensive, and prone to error (Moore etal., 1994; Reed, Buder, & Kent, 1992). Wepresent a computer-assisted method of acquir-ing infant-directed pitch contours that allowsfor rapid identification of contour shape andquantitative measurement. Although Sche-matic Pitch Coding is a subjective method ofmeasuring pitch changes over time, it hashigh concurrent validity with objectivequantitative algorithms for pitch extraction.Because of its increased efficiency relativeto quantitative pitch extraction, SchematicPitch Coding is especially well suited forprocessing large databases of infant-directedutterances.
This manuscript describes the SchematicPitch Coding System and evaluates its reliabil-ity, validity, and efficiency. The researcherinterested in large-sample studies of infant-directed speech should consider SchematicPitch Coding as a strong alternative to con-ventional pitch measurement techniques.Schematic Pitch Coding produces nearlyidentical results when compared with con-ventional pitch extraction techniques at afraction of the cost in human labor and post-processing time.
284 INFANT BEHAVIOR & DEVELOPMENT Vol. 22, No. 3, 1999

Method
Spectrographic Analysis
Schematic Pitch Coding captures the struc-ture of f0 contours based on the representationof f0 changes depicted in a spectrogram. Thespectrogram (shown in Figure 1) is one of themost common methods of illustrating the threemost salient components of any speech act:frequency (corresponding to the percept ofpitch), intensity (corresponding to the perceptof loudness), and timing characteristics (cor-responding to the percept of rhythmicity).Taken together, these three components aremajor elements of prosody—paralanguage de-scribing thesoundof language, as opposed to
the lexical components themselves. In Figure1, time is represented by the values on thex-axis. On the y-axis, frequency increasesfrom bottom to top. The relative darkness andlightness of the spectrogram at any pair of x(time) and y (frequency) values represents theintensity of the speech at that time and fre-quency. Darker shades indicate regions ofgreater intensity, and lighter shades indicateregions of lesser intensity. These graphic por-trayals of the dynamic nature of speech soundsare relatively easy to compute and are avail-able in a variety of commercially availablespeech and signal processing packages (e.g.,MATLAB, CSRE, and the line of Kay Elem-etrics CSL hardware and software).1 To opti-mize the spectrogram for Schematic Pitch
FIGURE 1Sample Spectrogram
285Measurement of ID Speech

Coding, we generated narrow-band spectro-grams (typically 10–30 Hz) and displayedonly the first 1000 Hz regions of energy fortwo-second samples of speech. Narrow-bandspectrograms provide better frequency resolu-tion than wide-band spectrograms, at the ex-pense of some temporal resolution. At conven-tional sampling rates of 20 kHz or less, theloss of temporal fidelity is negligible for anal-yses of fundamental frequency. Displaying therange of 0 Hz to 1000 Hz ensures that weoptimize the representation of the f0 contour.With the physical size of the window and thedisplay range constrained by the SPC code, wemaintain a common reference frame for cod-ing relative changes in pitch.
Coding
After generating the spectrogram, changepoints are manually delimited using a comput-er-marking device. Change points are used toidentify onset points, offset points, and pointsof inflection in the vocalized speech sample.Each critical point is logged using a mouseand cursor. Coders are permitted to listen tothe 2-second sample of speech to supplementtheir decision-making in marking criticalpoints. For each point logged, a descriptivecode, time of occurrence, and frequency valueis recorded. This information is used to createa schematic representation of the pitch contourand to compute summary measures of pitchand time values.
As shown in Table 1, Schematic Pitch Cod-ing identifies both intra-utterance and inter-utterance changes in spectral energy as well asnegative and positive points of inflection.Coders are asked to identify as few points asnecessary to capture the salient changes inpitch in the utterance. Complete utterances, asdefined by Papousek, Papousek, and Haekel(1987), are those “embedded in one globalcontinuous prosodic pattern and separatedfrom adjoining utterances by pauses that ap-peared as natural breaks” (pp. 496–497).Thus, all utterances begin with a major onset
(N). Following the N-code, salient pitch max-ima are marked with a peak code (p) andsalient pitch minima are marked with a troughcode (t). Any intra-utterance pauses and re-sumptions of vocalization are marked by mi-nor offset and onset codes (f- and n-codes,respectively). Finally, all utterances terminatewith a major offset code (F).
Training
For the results presented below, three un-dergraduates were trained in the use of Sche-matic Pitch Coding. Two were speech sciencemajors and a third was majoring in psychol-ogy. They received one hour of didactic in-struction and one hour of applied instruction inSchematic Pitch Coding. Following training,they achieved reliability with the first authorafter one to three hours of additional practice.In one other study and in a current study, wehave trained diverse liberal arts majors withsimilar efficiency (Zlochower & Cohn, 1996).
Reliability and Validity
With any new speech analysis tool, it iscritical to ensure that measurements madewith the tool are reproducible within this cod-
TABLE 1Schematic Pitch Codes
Code ExplanationN Major Onset. Identifies the beginning of a
complete utterance.F Major Offset. Identifies the ending of a
complete utterance.n Minor Onset. Identifies the beginning of an
intra-utterance speech act.f Minor Offset. Identifies the ending of an intra-
utterance speech act.p Peak. Identifies local pitch maxima—point of
inflection from positive slope to negativeslope.
t Trough. Identifies local pitch minima—pointof inflection from negative slope to positiveslope.
286 INFANT BEHAVIOR & DEVELOPMENT Vol. 22, No. 3, 1999

ing system (reliable) and comparable to thosemade using conventional approaches to speechanalysis (construct-valid). To assess the reli-ability of Schematic Pitch Coding, we ran-domly selected 16 2-minute mother-infant vo-cal interactions from a larger sample of 50mother-infant dyadic interactions and had thecoders described above independently codeinfant-directed speech samples. Two of theseoperators, as noted above, were undergraduatestudents in speech science, and one was anundergraduate psychology student. We exam-ined both the qualitative (i.e., the sequences ofdescriptive codes) and the quantitative (i.e.,the f0 values selected by the coders) aspects ofSchematic Pitch Coding.
To validate schematic coding, precise f0
contours were extracted from 90 utterancesrandomly selected from an earlier study ofmother-infant vocal interactions (Katz et al.,1996). The 90 schematically coded contourswere compared with the conventionally ex-tracted pitch contours of Katz et al. (1996).
Inter-rater Reliability
There are two areas of inter-rater reliabilityrelated to Schematic Pitch Coding. First, arecoders identifying similar descriptive codes(e.g., onsets, offsets, and points of inflection)at the same points on the spectrogram? Sec-ond, are the descriptive codes reliably cen-tered within the frequency bands? If f0 con-tours are to be estimated from Schematic PitchCoding descriptive codes, both the temporallocation and the frequency estimates must bereliably recorded.
To determine whether coders identifiedsimilar features within the f0 contours, weexamined agreements and disagreements inthe descriptive codes within a 100-ms win-dow. Descriptive codes that differed in loca-tion by more than 100 ms were coded as a“disagreement” while codes differing in loca-tion by less than 100 ms were coded as an“agreement.” Both X2 analyses andk-coeffi-cients indicated strong concordance among
coder pairs (average X2 5 2882.1; averagek 5 .77, all p , .0001), representing highreliability. No systematic errors were foundwithin or across pairs of coders.
To determine whether coders were identi-fying similar points on the f0 contour, we cor-related f0 estimates made by coder pairs withina 100-ms window. Coder pairs showed near-perfect correlations in identifying specific f0
estimates from the spectrographic images (av-erager 5 0.93, allp’s , .0001). When indi-vidual coder’s means and standard deviationsof estimated f0 contours over the nearly 2000points logged were compared, means and stan-dard deviations of estimated f0 contours acrosscoders were found to differ by less than 5 Hz.
CONSTRUCT VALIDITY I
Schematic Pitch Contour SummaryMeasures
Summary measures of pitch mean tradi-tionally require the complete extraction of f0
values over the length of the entire utterance.Schematic Pitch Coding produces mean pitchestimates by weighted averaging of pitch val-ues obtained from measurements of relativelyfew intra-utterance speech acts. Figure 2 illus-trates how mean pitch estimates are calculatedfrom Schematic Pitch Coding and through er-ror-corrected methods of pitch extraction al-gorithms.
As shown in Figure 2, Schematic PitchCoding estimates of mean pitch correspondclosely with traditional spectrographic esti-mates of mean pitch used in traditional pitchextraction methods (Katz et al., 1996). Wecomputed mean pitch from Schematic Pitchcodes using weighted averages (Figure 2) andcomputed pitch contour duration from Sche-matic Pitch codes by computing differencescores from the times of a major onset (N-code) to a major offset (F-code). Mean pitchestimates between the two methods werenearly identical (r 5 .95; p , .0001), as were
287Measurement of ID Speech

FIGURE 2Calculation of Mean f0 from Schematic Pitch Codes
288 INFANT BEHAVIOR & DEVELOPMENT Vol. 22, No. 3, 1999
pitch contour duration estimates (r 5 .98;p ,.0001).
CONSTRUCT VALIDITY II
Schematic Pitch Contour Shapes
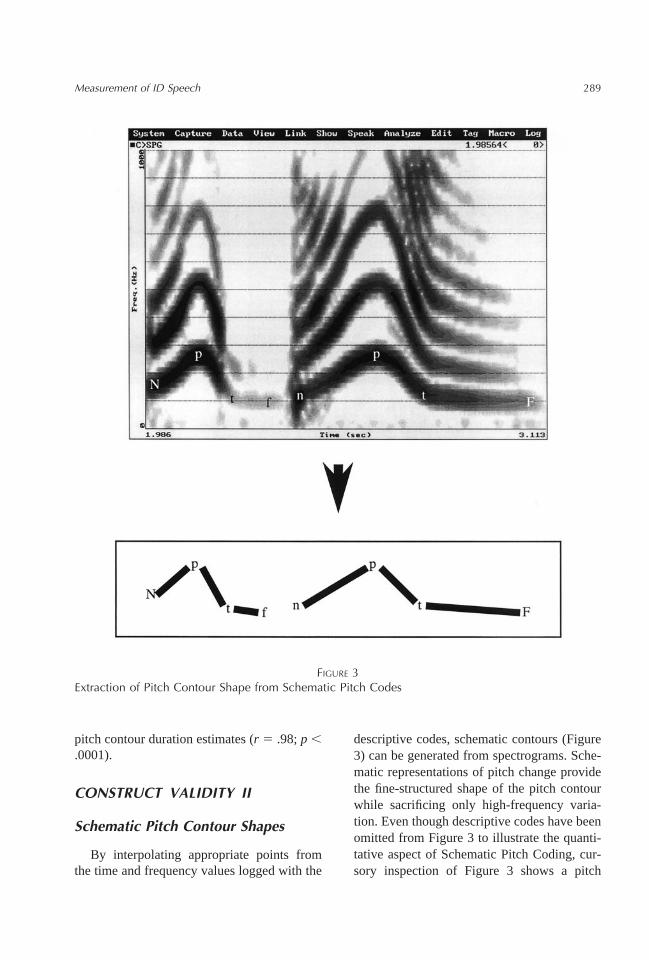
By interpolating appropriate points fromthe time and frequency values logged with the
descriptive codes, schematic contours (Figure3) can be generated from spectrograms. Sche-matic representations of pitch change providethe fine-structured shape of the pitch contourwhile sacrificing only high-frequency varia-tion. Even though descriptive codes have beenomitted from Figure 3 to illustrate the quanti-tative aspect of Schematic Pitch Coding, cur-sory inspection of Figure 3 shows a pitch
FIGURE 3Extraction of Pitch Contour Shape from Schematic Pitch Codes
289Measurement of ID Speech

contour with two distinct peaks, two distincttroughs, and a definite intra-utterance pause ofabout 5 ms. The strength of Schematic PitchCoding lies in its ability to faithfully representthe overall shape of the pitch contour (with thedescriptive codes) without sacrificing quanti-tative measurement.
To ensure that pitch contours generatedfrom Schematic Pitch Coding would be com-parable with pitch contours extracted usingconventional means, we re-examined the 90utterances with Schematic Pitch Coding andconventional pitch extraction methods. Ninetyconventional pitch contours were computedusing precise pitch measurement and error-correction algorithms (Katz et al., 1996;Moore et al., 1994).
To obtain comparable time and frequencymeasures, we used linear interpolation be-tween successive Schematic Pitch Codes on a10-ms time base. Pitch estimates for each ut-terance from interpolated Schematic PitchCoding measures and conventional extractionand schematic pitch coding were correlated.The overall correlation of pitch estimatesmade from the same speech samples usingboth methods averaged .93 (p , .0001).
Application of Quantitative SummaryMeasures From Schematic Contours
In an earlier study of the pragmatic use ofinfant-directed pitch contours (Katz et al.,1996), we found that a combination of shapeand summary measures of infant-directed f0
contours discriminated between three different
pragmatic categories (approval, attention, andcomfort) in a large sample of infant-directedspeech. These infant-directed f0 contours wereamong those in the 90-utterance sample usedto establish the validity of Schematic PitchCoding generated contours.
To further evaluate the comparability ofconventional and schematic pitch coding, werecoded a subset of utterances from the Katz etal. (1996) study and calculated analogoussummary measures (estimated mean pitch,pitch variability, and pitch contour duration)from the schematic pitch contours. These sum-mary measures were substituted for their re-spective pitch-contour measures (mean pitch,pitch variability, and pitch contour duration).Discriminative function analyses designed toclassify infant-directed pitch contours intotheir respective pragmatic categories werethen conducted using the analogous summarymeasures. As Table 2 shows, univariate mea-sures of group differences based upon dura-tion, mean pitch, and pitch variability (opera-tionalized as the SD of the set of f0 values)were nearly identical when compared withconventional pitch measures. Multivariategroup differences were also strongly concor-dant. When these measures were used to clas-sify tokens into their respective pragmaticgroup, the error rates of classification differedby only 2% overall.
Exploratory Findings and Replications
Two-minute speech segments from 50 mother-infant dyads during a free play interaction
TABLE 2Analytical Comparisons: Conventional Pitch Measures and Schematic Pitch Measures
Conventional PitchExtraction Measures
Schematic PitchCoding Measures
Univariate DifferencesDuration F 5 18.65 F 5 12.78Pitch Variability F 5 13.33 F 5 14.09
Multivariate Differences Wilks’ L 5 .451 Wilks’ L 5 .512Classification Rates 69% Correct 67% Correct
290 INFANT BEHAVIOR & DEVELOPMENT Vol. 22, No. 3, 1999

were coded schematically to explore both thequalitative and quantitative aspects of Sche-matic Pitch Coding. The sequencing and fre-quencies of descriptor codes motivated quali-tative analyses, whereas the time andfrequency information logged as data pointscalled for more quantitative analyses. Resultsin both of these areas were consistent withprevious research using conventional mea-surements of pitch and vocal timing.
Qualitative Analyses of TokenDescriptor Strings
Fernald and Simon (1984) and Stern,Spieker, and MacKain (1982) described themajority of infant-directed pitch contours as“complex” in shape. These complex shapesoften took the form of “bell-shaped” or “sinu-soidal” f0 contours. In schematic coding, thesecontour shapes may be identified by examin-ing token descriptor strings for presence orabsence of peak or trough codes. Tokens withat least one peak or trough code may be eitherbell-shaped or sinusoidal because they have atleast one geometric point of inflection (a pointin the contour where the first derivative equals0). Tokens with both peak and trough codesmust be at least sinusoidal because they haveat least two geometric points of inflection. Weexamined the proportion of tokens that had atleast one peak and/or at least one trough code.Out of 3467 total utterances, 54.8% had atleast one peak and 48.6% had at least onetrough. Nearly 38% of the utterances had botha peak and a trough code. These proportionsare comparable with those of Fernald and Si-mon (1984), who report proportions of allexaggerated contour shapes at 77%.
Analyses of Intra- and Inter-utterancePause Duration
Jaffe and Feldstein (1970) and Feldstein,Jaffe, Beebe, and Crown (1993) noted that 300ms of silence is the critical point that differ-entiates inter-utterance and intra-utterance
pauses. Schematic Pitch Coding identifies in-tra-utterance pauses as the time spent betweensubsequent f and n codes. Inter-utterancepauses are identified by the time spent be-tween subsequent F and N codes. To explorethe duration of inter-utterance and intra-utter-ance pauses, we examined time differencesbetween f3n and F3N transitions.
As is seen in Table 3, the vast majority ofour inter-utterance pauses exceeded 300 ms,whereas nearly all of our intra-utterancepauses fell below 300 ms. These results pro-vide empirical support for the choice of 300ms to delimit the upper end of intra-utterancepauses and the lower end of inter-utterancepauses.
Coding Efficiency
In any study of infant-directed speech, ex-traction of accurate and reliable estimates ofpitch is extremely difficult (Reed et al., 1992).Iterative techniques and substantial post-pro-cessing may assist the researcher in examiningthe structure of pitch contours (Katz, Moore,& Cohn 1992). For highly trained operators,we have found that optimal rates of pitch-contour extraction approach 2.7 minutes per 2seconds of sampled speech using conventionalpitch-extraction algorithms and techniques(e.g., Kay Elemetrics CSL4300 PITCH rou-tines). This estimate does not include the ad-ditional time necessary for post-processingand error-correction of extracted contours. Wehave found that approximately 1 to 5 minutes
TABLE 3Percentile Rankings of Intra- and Inter-
Utterance Pause Durations
Percentile
Intra-UtterancePause
Duration (ms)
Inter-UtterancePause
Duration (ms)5th 18 21210th 27 30090th 214 248995th 280 3651
291Measurement of ID Speech

of post-processing and error-correction percontour is typical, depending upon the degreeof computer automation. Consequently, the to-tal amount of time required to process 2 sec-onds of sampled speech ranges from 3.7 to 8.7minutes.
Overall, schematic coding is more efficientthan conventional pitch-extraction techniques,with obtained rates of 1.5 to 2.0 minutes per 2seconds of sampled speech. An additional ad-vantage of schematic coding is that no exten-sive post-processing or error-correcting algo-rithms need be applied to the extracted data,which are typically required for convention-ally extracted pitch contours (Katz et al.,1992). Without the need for post-processing,schematic coding has a clear advantage ingenerating large samples of infant-directedpitch contours. Additionally, at present, com-mercially available speech processing pack-ages have upper limits on the size of thespeech sample that can be analyzed with pitchextraction techniques. By circumventing thepitch extraction algorithms in favor of morestable spectrographic analyses, there is no the-oretical upper limit as to the length of thespeech segment being analyzed in schematiccoding. We have coded segments of digitalspeech as short as 2 seconds and as long as 4minutes. Much of the processing time requiredto implement Schematic Pitch Coding is re-lated to the idiosyncrasies of the Kay Elemet-rics computer interface, which is not opti-mized for on-the-fly data logging. Thedevelopment of custom-programmed spectro-graphic interfaces may further reduce the timerequired to acquire Schematic Pitch Coding f0
contours.Another area in which Schematic Pitch
Coding demonstrates increased efficiency overexisting pitch-extraction techniques is in train-ing demands. With traditional speech-process-ing measures, it is essential that staff haveeither a background in speech science or train-ing in fundamentals of speech science and thecomputational issues surrounding pitch extrac-tion techniques. Although formal measureshave not yet been compiled, anecdotal evi-
dence supports the assertion that individualscan be trained in Schematic Pitch Coding tech-niques in two 90-minute training sessions thatcover the basic theory of spectrography andprovide hands-on experience with the comput-erized speech lab used for spectrographic anal-yses.
FUTURE DIRECTIONS
The superior efficiency of schematic codingmakes it a promising approach for investiga-tion of topics such as description of prosodiccontours. Schematic coding provides a syntaxfor the complete specification of contours aswell as quantitative measurement. Conven-tional methods are limited to a small set ofgeometric shapes (i.e., rise, fall, bell, wave,and flat) that arbitrarily restrict the study ofinfant-directed pitch contours across a numberof domains. Enhanced description of infant-directed pitch contours with complementaryquantitative measures will assist researchersstudying mother-child vocal synchrony. Inlanguage acquisition studies, pitch marking ofsalient points in the infant-directed f0 contourwill be more efficient and more reliable usingSchematic Pitch Coding.
The study of mother-infant-interactionsacross many modalities (e.g., facial, gestural,and vocal expression) is another area of re-search that would benefit from a more efficientand precise method of describing infant-di-rected speech. The analysis of facial expres-sion in mother-infant dyads has benefited fromadvances in technology used to record andclassify facial expressions (Cohn, Zlochower,Lien, & Kanade, 1999; Lien, Kanade, Cohn, &Li, 1998); however, difficulty in quantifyingvocal expression has hampered the integrationof face and voice in research of infant-care-giver interactions.
The vocal expression of emotion is anotherarea of speech analysis research that wouldbenefit from an accurate and reliable methodof f0 contour description and measurement.Shape and summary features communicate a
292 INFANT BEHAVIOR & DEVELOPMENT Vol. 22, No. 3, 1999

major portion of the emotional meaning of anutterance (Frick, 1985; Scherer, 1986). Sad-ness tends to be expressed with downwardsloping f0 contours, whereas anger and happi-ness tend to be expressed with highly variableand frequently rising f0 contours (Katz, 1998).Still, the manner in which f0 contours are an-alyzed in this literature demands a more rig-orous method of measurement to capture boththe consistency of contour shapes in specificemotional contexts and also the considerablevariability within and across these emotionalcontexts. We expect that the flexibility ofSchematic Pitch Coding in capturing the es-sential or salient modulation in the f0 of emo-tional utterances will enhance empirical studyin this area. Indeed, the adoption of SchematicPitch Coding may enhance progress in a broadrange of vocal behavior studies.
Acknowledgments: This research was sup-ported by NSF Grant #BNS-8919711 to theUniversity of Pittsburgh. The authors wouldlike to thank three anonymous reviewers fortheir editorial comments and Adena Zlo-chower and Joan West for their assistance indata coding.
NOTE
1. Actual macro and keyboard commands for theKay Elemetrics CSL4300 are available by con-tacting the first author (see appendix forpseudocode).
REFERENCES
Cohn, J. F., Zlochower, A., Lien, J., & Kanade, T.(1999). Automated face analysis by featurepoint tracking has high concurrent validity withmanual FACS coding.Psychophysiology, 36,35–43.
Cooper, R. P., & Aslin, R. N. (1990). Preference forinfant-directed speech in the first month afterbirth. Child Development, 66, 1584–1595.
Cooper, R. P., Abraham, J., Berman, S., & Staska,M. (1997). The development of infants’ prefer-
ence for motherese.Infant Behavior and Devel-opment, 20, 477–488.
Feldstein, S., Jaffe, J., Beebe, B., & Crown, C.(1993). Coordinated interpersonal timing inadult-infant vocal interactions: A cross-site rep-lication. Infant Behavior and Development, 16,455–470.
Ferguson, C. A. (1964). Baby talk in six languages.American Anthropologist, 66, 103–114.
Fernald, A. (1984). The perceptual and affectivesalience of mothers’ speech to infants. In L.Feagans, C. Garvey, R. Golinkoff, M. T. Green-berg, C. Harding, & J. Bohannon (Eds.),Theorigins and growth of communication(pp.5–29). Norwood, NJ: Ablex.
Fernald, A. (1985). Four-month-old infants preferto listen to motherese.Infant Behavior and De-velopment, 8, 181–195.
Fernald, A. (1989). Intonation and communicativeintent in mother’s speech to infants: Is the mel-ody the message?Child Development, 60,1497–1510.
Fernald, A., & Kuhl, P. (1987). Acoustic determi-nants of infant preference for motherese speech.Infant Behavior and Development, 10, 279–293.
Fernald, A., & Simon, T. (1984). Expanded intona-tion contours in mothers’ speech to newborns.Developmental Psychology, 20, 104–113.
Frick, R. W. (1985). Communicating emotion: Therole of prosodic features.Psychological Bulle-tin, 97, 412–429.
Jaffe, J., & Feldstein, S. (1970).Rhythms of dia-logue. NY: Academic.
Katz, G. S. (1998). Emotional speech: A quantita-tive study of the psychoacoustics and psycho-physiology of emotional expression (DoctoralDissertation: University of Pittsburgh, 1998).Dissertation Abstracts International, 59(06B),3062.
Katz, G. S., Cohn, J. F., & Moore, C. A. (1996). Acombination of vocal f0 dynamic and summaryfeatures discriminates between three pragmaticcategories of infant-directed speech.Child De-velopment, 67, 205–217.
Katz, G. S., Moore, C. M., & Cohn, J. F. (1992,November).Semi-automated processing of verylarge natural f0 samples. Poster session pre-sented at the conference of the American Speechand Hearing Association, San Antonio, TX.
Kuhl, P. J., Andruski, J. E., Chistovich, I. A., Chis-tovich, L. A., Kozhevnikova, E. V., Ryskina,V. L., Stolyarova, E. I., Sundberg, U., & Lac-
293Measurement of ID Speech

erda, F. (1997). Cross-language analysis of pho-netic units in language addressed to infants.Science, 277, 684–686.
Lien, J. J., Kanade, T. K., Cohn, J. F., & Li, C. C.(1998). A multi-method approach for discrimi-nating between similar facial expressions, in-cluding expression intensity estimation.Pro-ceedings of the IEEE Conference on ComputerVision and Pattern Recognition, 98, 853–859.
Moon, C., Cooper, R., & Fifer, W. P. (1993). Two-day-olds prefer their native language.Infant Be-havior and Development, 16, 495–500.
Moore, C. A., Cohn, J. F., & Katz, G. S. (1994).Quantitative description and differentiation offundamental frequency contours.ComputerSpeech and Language, 8, 385–404.
Papousek, M., Papousek, H., & Haekel, M. (1987).Didactic adjustments in fathers’ and mothers’speech to their 3-month-old infants.Journal ofPsycholinguistic Research, 16, 491–516.
Papousek, M., Papousek, H., & Symmes, D.(1991). The meaning of melodies in motheresetone and stress languages.Infant Behavior andDevelopment, 14, 415–440.
Reed, C., Buder, E. H., & Kent, R. D. (1992).
Speech analysis systems: An evaluation.Jour-nal of Speech and Hearing Research, 35, 314–332.
Scherer, K. R. (1986). Vocal affect expression: Areview and model for further research.Psycho-logical Bulletin, 98, 143–165.
Stern, D. N., Spieker, S., Barnett, R. K., & Mac-Kain, K. (1983). The prosody of maternalspeech: Infant age and context related changes.Journal of Child Language, 10, 1–15.
Stern, D. N., Spieker, S., & MacKain, K. (1982).Intonation contours as signals in maternalspeech to prelinguistic infants.DevelopmentalPsychology, 18, 727–735.
Zlochower, A., & Cohn, J. F. (1996). Vocal timingin face-to-face interactions of clinically de-pressed and nondepressed mothers and their4-month-old infants.Infant Behavior and Devel-opment, 19, 373–376.
01 December 1999; Accepted 09 September 1999n
294 INFANT BEHAVIOR & DEVELOPMENT Vol. 22, No. 3, 1999

295Measurement of ID Speech